Embed Size (px)
Citation preview
abc Global Research
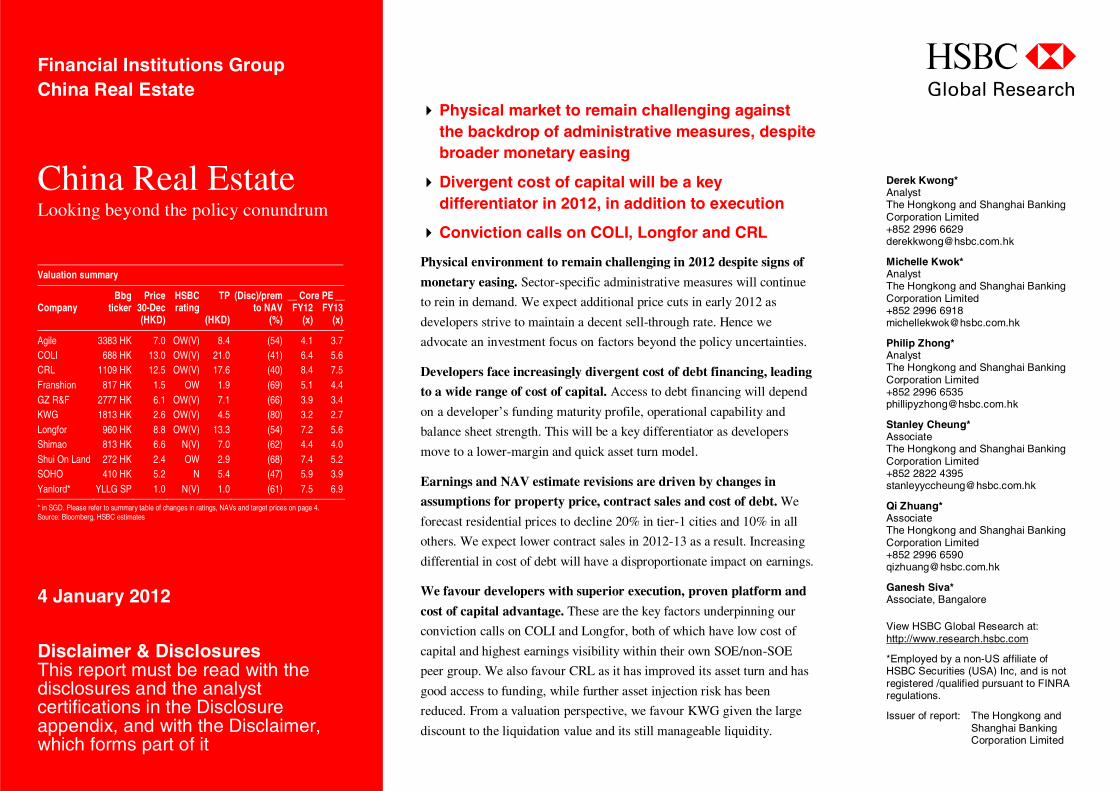
Physical market to remain challenging against the backdrop of administrative measures, despite broader monetary easing
Divergent cost of capital will be a key differentiator in 2012, in addition to execution
Conviction calls on COLI, Longfor and CRL
Physical environment to remain challenging in 2012 despite signs of
monetary easing. Sector-specific administrative measures will continue
to rein in demand. We expect additional price cuts in early 2012 as
developers strive to maintain a decent sell-through rate. Hence we
advocate an investment focus on factors beyond the policy uncertainties.
Developers face increasingly divergent cost of debt financing, leading
to a wide range of cost of capital. Access to debt financing will depend
on a developer’s funding maturity profile, operational capability and
balance sheet strength. This will be a key differentiator as developers
move to a lower-margin and quick asset turn model.
Earnings and NAV estimate revisions are driven by changes in
assumptions for property price, contract sales and cost of debt. We
forecast residential prices to decline 20% in tier-1 cities and 10% in all
others. We expect lower contract sales in 2012-13 as a result. Increasing
differential in cost of debt will have a disproportionate impact on earnings.
We favour developers with superior execution, proven platform and
cost of capital advantage. These are the key factors underpinning our
conviction calls on COLI and Longfor, both of which have low cost of
capital and highest earnings visibility within their own SOE/non-SOE
peer group. We also favour CRL as it has improved its asset turn and has
good access to funding, while further asset injection risk has been
reduced. From a valuation perspective, we favour KWG given the large
discount to the liquidation value and its still manageable liquidity.
Financial Institutions Group China Real Estate
China Real Estate Looking beyond the policy conundrum
Valuation summary
Bbg Price HSBC TP (Disc)/prem __ Core PE __Company ticker 30-Dec rating to NAV FY12 FY13 (HKD) (HKD) (%) (x) (x)
Agile 3383 HK 7.0 OW(V) 8.4 (54) 4.1 3.7COLI 688 HK 13.0 OW(V) 21.0 (41) 6.4 5.6CRL 1109 HK 12.5 OW(V) 17.6 (40) 8.4 7.5Franshion 817 HK 1.5 OW 1.9 (69) 5.1 4.4GZ R&F 2777 HK 6.1 OW(V) 7.1 (66) 3.9 3.4KWG 1813 HK 2.6 OW(V) 4.5 (80) 3.2 2.7Longfor 960 HK 8.8 OW(V) 13.3 (54) 7.2 5.6Shimao 813 HK 6.6 N(V) 7.0 (62) 4.4 4.0Shui On Land 272 HK 2.4 OW 2.9 (68) 7.4 5.2SOHO 410 HK 5.2 N 5.4 (47) 5.9 3.9Yanlord* YLLG SP 1.0 N(V) 1.0 (61) 7.5 6.9
* in SGD. Please refer to summary table of changes in ratings, NAVs and target prices on page 4. Source: Bloomberg, HSBC estimates
4 January 2012
Disclaimer & Disclosures This report must be read with the disclosures and the analyst certifications in the Disclosure appendix, and with the Disclaimer, which forms part of it
Derek Kwong* Analyst The Hongkong and Shanghai Banking Corporation Limited +852 2996 6629 [email protected]
Michelle Kwok* Analyst The Hongkong and Shanghai Banking Corporation Limited +852 2996 6918 [email protected]
Philip Zhong* Analyst The Hongkong and Shanghai Banking Corporation Limited +852 2996 6535 [email protected]
Stanley Cheung* Associate The Hongkong and Shanghai Banking Corporation Limited +852 2822 4395 [email protected]
Qi Zhuang* Associate The Hongkong and Shanghai Banking Corporation Limited +852 2996 6590 [email protected]
Ganesh Siva* Associate, Bangalore View HSBC Global Research at: http://www.research.hsbc.com
*Employed by a non-US affiliate of HSBC Securities (USA) Inc, and is not registered /qualified pursuant to FINRA regulations.
Issuer of report: The Hongkong and Shanghai Banking Corporation Limited
渐飞研究报告 - http://bg.panlv.net
abc
2
Financial Institutions Group China Real Estate 4 January 2012
Looking beyond the policy conundrum 6
Cost of capital under the limelight 12
Earnings and NAV estimate revisions 16
Downside protection – theoretical liquidation value 23
Assessing the cash flow buffer 26
Be realistic on policy expectations 32
Key property market data 39
Company write-ups 51 Agile (3383 HK) 52
China Overseas Land (688 HK) 54
China Resources Land (1109 HK) 56
Franshion (817 HK) 58
Guangzhou R&F (2777 HK) 60
KWG Property (1813 HK) 62
Longfor (960 HK) 64
Shimao (813 HK) 66
Shui On Land (272 HK) 68
SOHO China (410 HK) 70
Yanlord Land (YLLG SP) 72
Disclosure appendix 74
Disclaimer 77
Contents
渐飞研究报告 - http://bg.panlv.net
abc
3
Financial Institutions Group China Real Estate 4 January 2012
Key charts
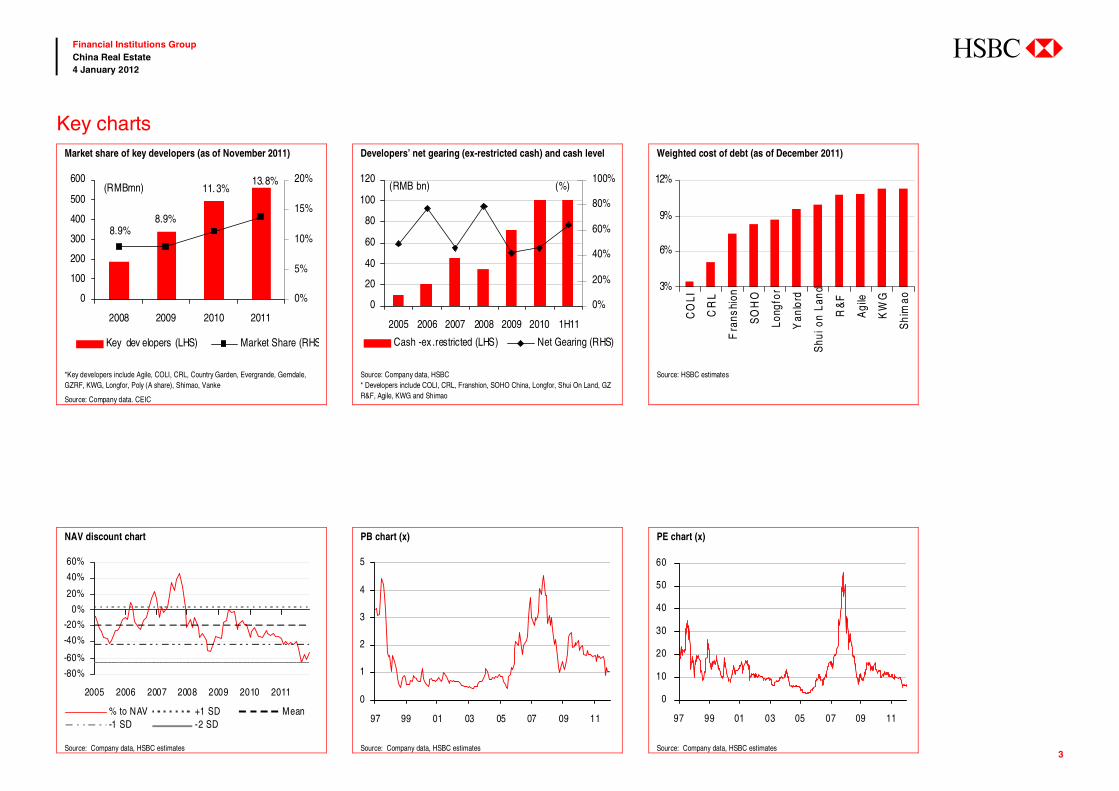
Market share of key developers (as of November 2011) Developers’ net gearing (ex-restricted cash) and cash level Weighted cost of debt (as of December 2011)
13.8%
11. 3%
8.9%8.9%
0
100
200
300
400
500
600
2008 2009 2010 2011
0%
5%
10%
15%
20%
Key dev elopers (LHS) Market Share (RHS
(RMBmn)
0
20
40
60
80
100
120
2005 2006 2007 2008 2009 2010 1H11
0%
20%
40%
60%
80%
100%
Cash -ex .restricted (LHS) Net Gearing (RHS)
(RMB bn) (%)
3%
6%
9%
12%
CO
LI
CR
L
Fra
nshi
on
SO
HO
Long
for
Yan
lord
Shu
i on
Land
R&
F
Agi
le
KW
G
Shi
mao
*Key developers include Agile, COLI, CRL, Country Garden, Evergrande, Gemdale, GZRF, KWG, Longfor, Poly (A share), Shimao, Vanke
Source: Company data. CEIC
Source: Company data, HSBC * Developers include COLI, CRL, Franshion, SOHO China, Longfor, Shui On Land, GZ R&F, Agile, KWG and Shimao
Source: HSBC estimates
NAV discount chart PB chart (x) PE chart (x)
-80%
-60%
-40%
-20%
0%
20%
40%
60%
2005 2006 2007 2008 2009 2010 2011
% to NAV +1 SD Mean-1 SD -2 SD
0
1
2
3
4
5
97 99 01 03 05 07 09 11
0
10
20
30
40
50
60
97 99 01 03 05 07 09 11
Source: Company data, HSBC estimates Source: Company data, HSBC estimates Source: Company data, HSBC estimates
渐飞研究报告 - http://bg.panlv.net
abc
4
Financial Institutions Group China Real Estate 4 January 2012
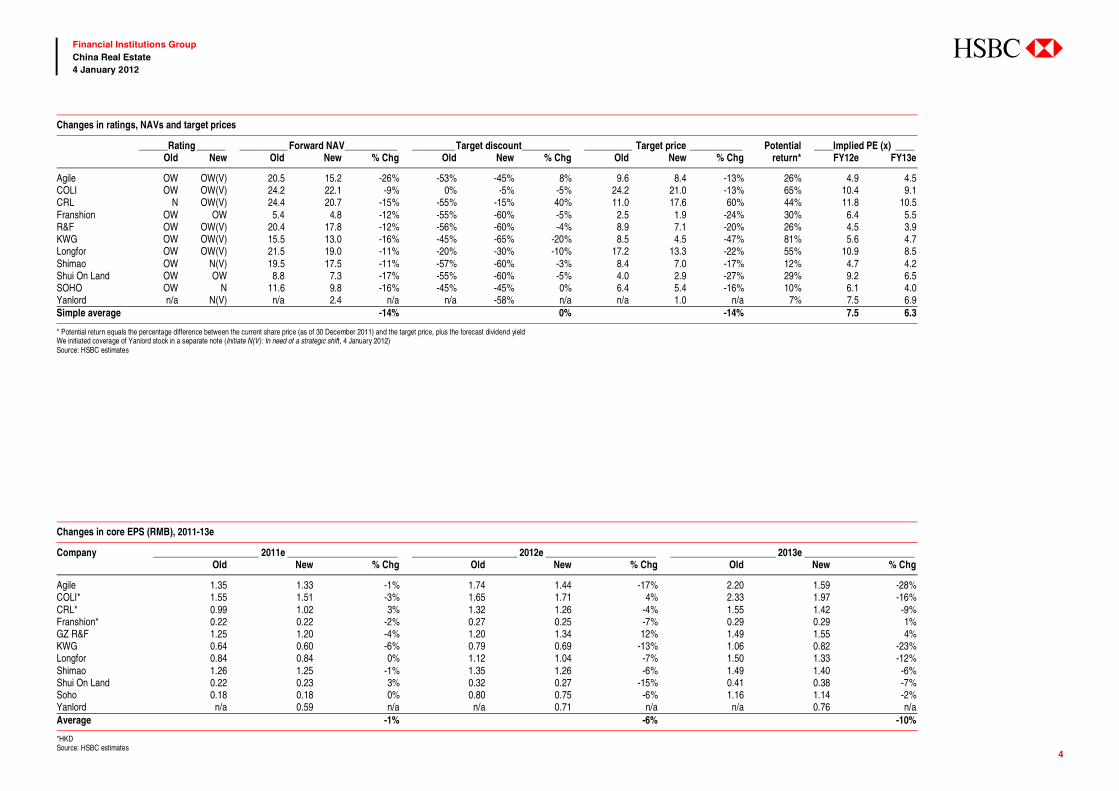
Changes in ratings, NAVs and target prices
______Rating______ __________ Forward NAV___________ _________Target discount__________ __________ Target price ___________ Potential ____Implied PE (x) ____ Old New Old New % Chg Old New % Chg Old New % Chg return* FY12e FY13e
Agile OW OW(V) 20.5 15.2 -26% -53% -45% 8% 9.6 8.4 -13% 26% 4.9 4.5 COLI OW OW(V) 24.2 22.1 -9% 0% -5% -5% 24.2 21.0 -13% 65% 10.4 9.1 CRL N OW(V) 24.4 20.7 -15% -55% -15% 40% 11.0 17.6 60% 44% 11.8 10.5 Franshion OW OW 5.4 4.8 -12% -55% -60% -5% 2.5 1.9 -24% 30% 6.4 5.5 R&F OW OW(V) 20.4 17.8 -12% -56% -60% -4% 8.9 7.1 -20% 26% 4.5 3.9 KWG OW OW(V) 15.5 13.0 -16% -45% -65% -20% 8.5 4.5 -47% 81% 5.6 4.7 Longfor OW OW(V) 21.5 19.0 -11% -20% -30% -10% 17.2 13.3 -22% 55% 10.9 8.5 Shimao OW N(V) 19.5 17.5 -11% -57% -60% -3% 8.4 7.0 -17% 12% 4.7 4.2 Shui On Land OW OW 8.8 7.3 -17% -55% -60% -5% 4.0 2.9 -27% 29% 9.2 6.5 SOHO OW N 11.6 9.8 -16% -45% -45% 0% 6.4 5.4 -16% 10% 6.1 4.0 Yanlord n/a N(V) n/a 2.4 n/a n/a -58% n/a n/a 1.0 n/a 7% 7.5 6.9Simple average -14% 0% -14% 7.5 6.3
* Potential return equals the percentage difference between the current share price (as of 30 December 2011) and the target price, plus the forecast dividend yield We initiated coverage of Yanlord stock in a separate note (Initiate N(V): In need of a strategic shift, 4 January 2012) Source: HSBC estimates
Changes in core EPS (RMB), 2011-13e
Company ______________________ 2011e _______________________ ______________________ 2012e _______________________ ______________________ 2013e _______________________ Old New % Chg Old New % Chg Old New % Chg
Agile 1.35 1.33 -1% 1.74 1.44 -17% 2.20 1.59 -28%COLI* 1.55 1.51 -3% 1.65 1.71 4% 2.33 1.97 -16%CRL* 0.99 1.02 3% 1.32 1.26 -4% 1.55 1.42 -9%Franshion* 0.22 0.22 -2% 0.27 0.25 -7% 0.29 0.29 1%GZ R&F 1.25 1.20 -4% 1.20 1.34 12% 1.49 1.55 4%KWG 0.64 0.60 -6% 0.79 0.69 -13% 1.06 0.82 -23%Longfor 0.84 0.84 0% 1.12 1.04 -7% 1.50 1.33 -12%Shimao 1.26 1.25 -1% 1.35 1.26 -6% 1.49 1.40 -6%Shui On Land 0.22 0.23 3% 0.32 0.27 -15% 0.41 0.38 -7%Soho 0.18 0.18 0% 0.80 0.75 -6% 1.16 1.14 -2%Yanlord n/a 0.59 n/a n/a 0.71 n/a n/a 0.76 n/aAverage -1% -6% -10%
*HKD Source: HSBC estimates
渐飞研究报告 - http://bg.panlv.net
abc
5
Financial Institutions Group China Real Estate 4 January 2012
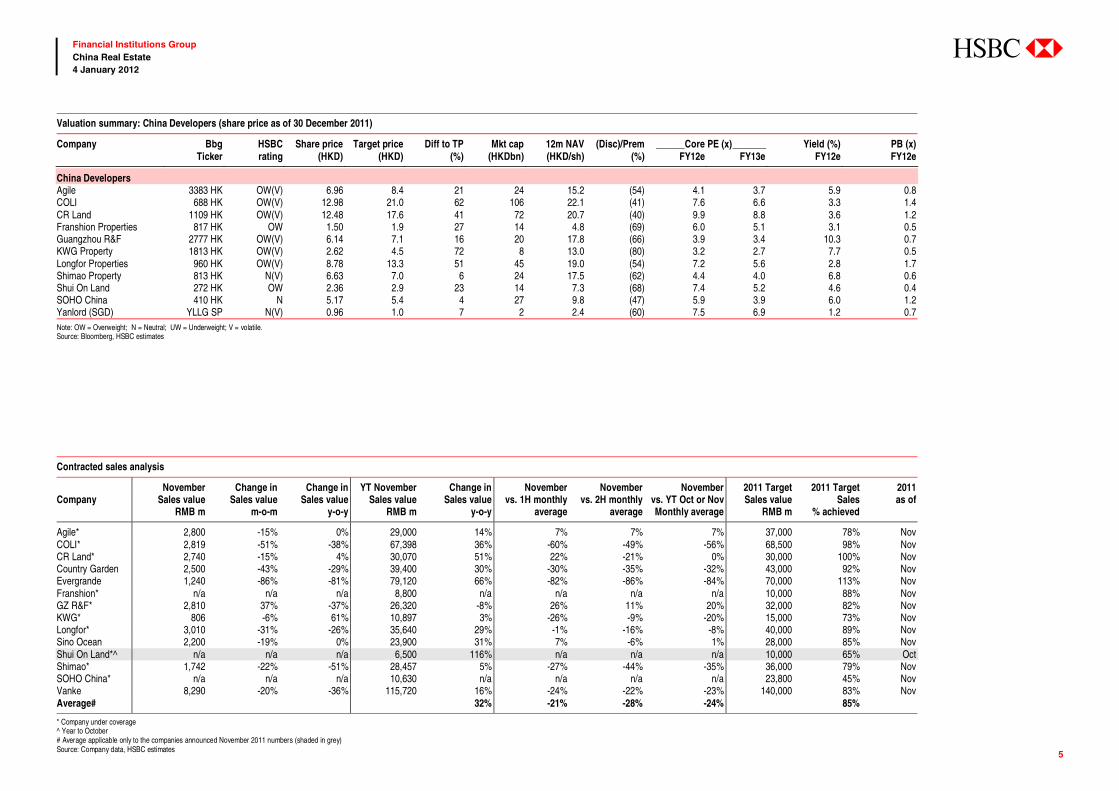
Valuation summary: China Developers (share price as of 30 December 2011)
Company Bbg HSBC Share price Target price Diff to TP Mkt cap 12m NAV (Disc)/Prem ______Core PE (x)_______ Yield (%) PB (x) Ticker rating (HKD) (HKD) (%) (HKDbn) (HKD/sh) (%) FY12e FY13e FY12e FY12e China Developers Agile 3383 HK OW(V) 6.96 8.4 21 24 15.2 (54) 4.1 3.7 5.9 0.8 COLI 688 HK OW(V) 12.98 21.0 62 106 22.1 (41) 7.6 6.6 3.3 1.4 CR Land 1109 HK OW(V) 12.48 17.6 41 72 20.7 (40) 9.9 8.8 3.6 1.2 Franshion Properties 817 HK OW 1.50 1.9 27 14 4.8 (69) 6.0 5.1 3.1 0.5Guangzhou R&F 2777 HK OW(V) 6.14 7.1 16 20 17.8 (66) 3.9 3.4 10.3 0.7 KWG Property 1813 HK OW(V) 2.62 4.5 72 8 13.0 (80) 3.2 2.7 7.7 0.5 Longfor Properties 960 HK OW(V) 8.78 13.3 51 45 19.0 (54) 7.2 5.6 2.8 1.7 Shimao Property 813 HK N(V) 6.63 7.0 6 24 17.5 (62) 4.4 4.0 6.8 0.6 Shui On Land 272 HK OW 2.36 2.9 23 14 7.3 (68) 7.4 5.2 4.6 0.4 SOHO China 410 HK N 5.17 5.4 4 27 9.8 (47) 5.9 3.9 6.0 1.2 Yanlord (SGD) YLLG SP N(V) 0.96 1.0 7 2 2.4 (60) 7.5 6.9 1.2 0.7 Note: OW = Overweight; N = Neutral; UW = Underweight; V = volatile. Source: Bloomberg, HSBC estimates
Contracted sales analysis
November Change in Change in YT November Change in November November November 2011 Target 2011 Target 2011Company Sales value
RMB mSales value
m-o-m Sales value
y-o-ySales value
RMB mSales value
y-o-y vs. 1H monthly
average vs. 2H monthly
average vs. YT Oct or NovMonthly average
Sales value RMB m
Sales % achieved
as of
Agile* 2,800 -15% 0% 29,000 14% 7% 7% 7% 37,000 78% NovCOLI* 2,819 -51% -38% 67,398 36% -60% -49% -56% 68,500 98% NovCR Land* 2,740 -15% 4% 30,070 51% 22% -21% 0% 30,000 100% NovCountry Garden 2,500 -43% -29% 39,400 30% -30% -35% -32% 43,000 92% NovEvergrande 1,240 -86% -81% 79,120 66% -82% -86% -84% 70,000 113% NovFranshion* n/a n/a n/a 8,800 n/a n/a n/a n/a 10,000 88% NovGZ R&F* 2,810 37% -37% 26,320 -8% 26% 11% 20% 32,000 82% NovKWG* 806 -6% 61% 10,897 3% -26% -9% -20% 15,000 73% NovLongfor* 3,010 -31% -26% 35,640 29% -1% -16% -8% 40,000 89% NovSino Ocean 2,200 -19% 0% 23,900 31% 7% -6% 1% 28,000 85% NovShui On Land*^ n/a n/a n/a 6,500 116% n/a n/a n/a 10,000 65% OctShimao* 1,742 -22% -51% 28,457 5% -27% -44% -35% 36,000 79% NovSOHO China* n/a n/a n/a 10,630 n/a n/a n/a n/a 23,800 45% NovVanke 8,290 -20% -36% 115,720 16% -24% -22% -23% 140,000 83% NovAverage# 32% -21% -28% -24% 85%
* Company under coverage ^ Year to October # Average applicable only to the companies announced November 2011 numbers (shaded in grey) Source: Company data, HSBC estimates
渐飞研究报告 - http://bg.panlv.net
abc
6
Financial Institutions Group China Real Estate 4 January 2012
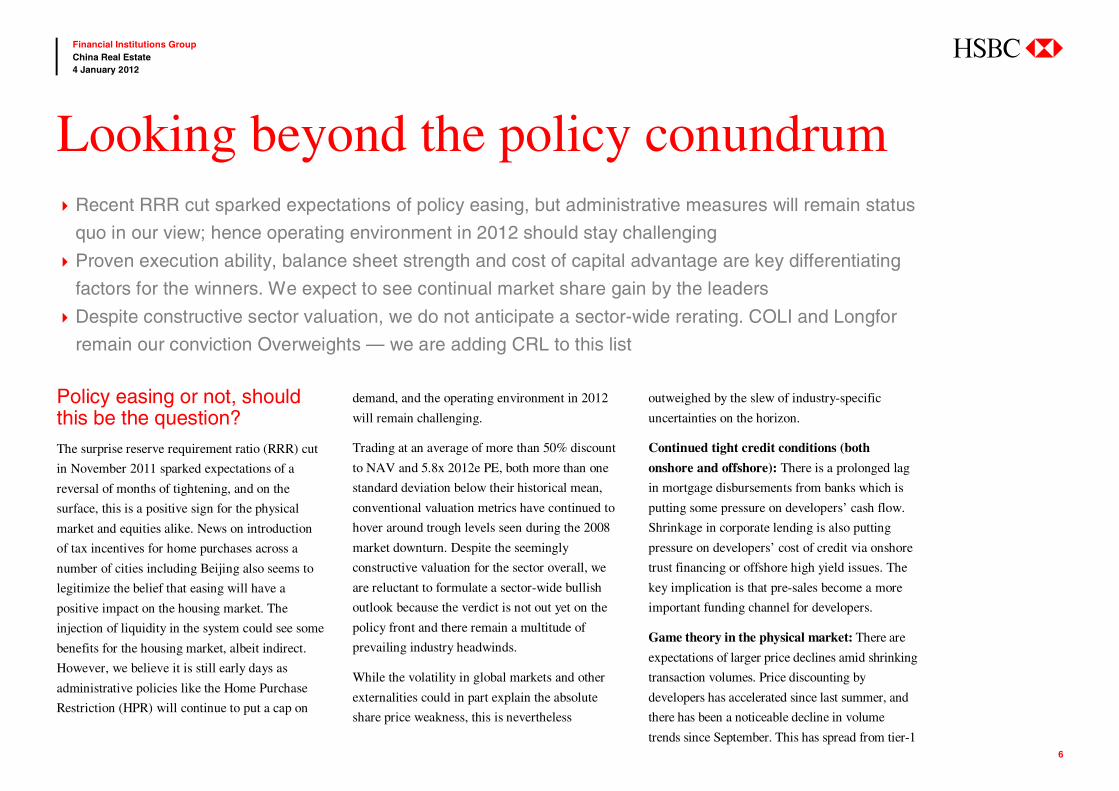
Policy easing or not, should this be the question? The surprise reserve requirement ratio (RRR) cut
in November 2011 sparked expectations of a
reversal of months of tightening, and on the
surface, this is a positive sign for the physical
market and equities alike. News on introduction
of tax incentives for home purchases across a
number of cities including Beijing also seems to
legitimize the belief that easing will have a
positive impact on the housing market. The
injection of liquidity in the system could see some
benefits for the housing market, albeit indirect.
However, we believe it is still early days as
administrative policies like the Home Purchase
Restriction (HPR) will continue to put a cap on
demand, and the operating environment in 2012
will remain challenging.
Trading at an average of more than 50% discount
to NAV and 5.8x 2012e PE, both more than one
standard deviation below their historical mean,
conventional valuation metrics have continued to
hover around trough levels seen during the 2008
market downturn. Despite the seemingly
constructive valuation for the sector overall, we
are reluctant to formulate a sector-wide bullish
outlook because the verdict is not out yet on the
policy front and there remain a multitude of
prevailing industry headwinds.
While the volatility in global markets and other
externalities could in part explain the absolute
share price weakness, this is nevertheless
outweighed by the slew of industry-specific
uncertainties on the horizon.
Continued tight credit conditions (both
onshore and offshore): There is a prolonged lag
in mortgage disbursements from banks which is
putting some pressure on developers’ cash flow.
Shrinkage in corporate lending is also putting
pressure on developers’ cost of credit via onshore
trust financing or offshore high yield issues. The
key implication is that pre-sales become a more
important funding channel for developers.
Game theory in the physical market: There are
expectations of larger price declines amid shrinking
transaction volumes. Price discounting by
developers has accelerated since last summer, and
there has been a noticeable decline in volume
trends since September. This has spread from tier-1
Looking beyond the policy conundrum Recent RRR cut sparked expectations of policy easing, but administrative measures will remain status
quo in our view; hence operating environment in 2012 should stay challenging
Proven execution ability, balance sheet strength and cost of capital advantage are key differentiating
factors for the winners. We expect to see continual market share gain by the leaders
Despite constructive sector valuation, we do not anticipate a sector-wide rerating. COLI and Longfor
remain our conviction Overweights — we are adding CRL to this list
渐飞研究报告 - http://bg.panlv.net
abc
7
Financial Institutions Group China Real Estate 4 January 2012
cities like Shanghai and Beijing into major tier-2
cities. We believe this will put more pressure on
home prices (see new assumptions), particularly
from now to end 1Q12.
The policy conundrum: The investment case for
the sector cannot be based on a policy reversal, as
in our opinion, its effect on the housing market
will be limited. While on the monetary side the
RRR cut could mean the beginning of multiple
cuts, that’s broad macro implication without
considering more sector-specific issues. We
believe the central government’s stance toward
the housing sector is likely to remain hawkish in
the foreseeable future. We see the broader
monetary easing and other lateral relief like tax
incentives as evidence that the core administrative
measure HPR will remain firmly in place.
From an equity perspective, we believe
investment strategy should be based on a base
case of policy status quo for the housing sector.
As such, we believe companies with proven
execution track records particularly under difficult
market conditions, strong balance sheets and
better access to capital at a lower cost will be in a
more advantageous position in 2012.
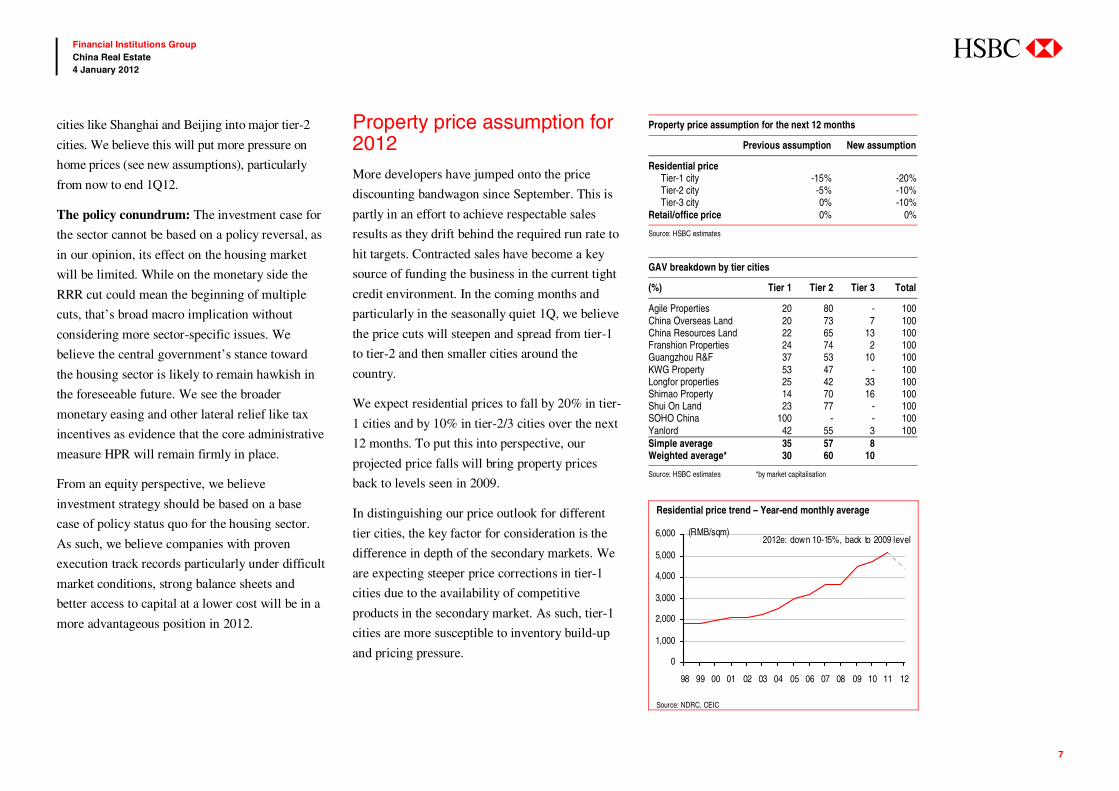
Property price assumption for 2012 More developers have jumped onto the price
discounting bandwagon since September. This is
partly in an effort to achieve respectable sales
results as they drift behind the required run rate to
hit targets. Contracted sales have become a key
source of funding the business in the current tight
credit environment. In the coming months and
particularly in the seasonally quiet 1Q, we believe
the price cuts will steepen and spread from tier-1
to tier-2 and then smaller cities around the
country.
We expect residential prices to fall by 20% in tier-
1 cities and by 10% in tier-2/3 cities over the next
12 months. To put this into perspective, our
projected price falls will bring property prices
back to levels seen in 2009.
In distinguishing our price outlook for different
tier cities, the key factor for consideration is the
difference in depth of the secondary markets. We
are expecting steeper price corrections in tier-1
cities due to the availability of competitive
products in the secondary market. As such, tier-1
cities are more susceptible to inventory build-up
and pricing pressure.
Property price assumption for the next 12 months
Previous assumption New assumption
Residential price Tier-1 city -15% -20% Tier-2 city -5% -10% Tier-3 city 0% -10%Retail/office price 0% 0%
Source: HSBC estimates
GAV breakdown by tier cities
(%) Tier 1 Tier 2 Tier 3 Total
Agile Properties 20 80 - 100China Overseas Land 20 73 7 100China Resources Land 22 65 13 100Franshion Properties 24 74 2 100Guangzhou R&F 37 53 10 100KWG Property 53 47 - 100Longfor properties 25 42 33 100Shimao Property 14 70 16 100Shui On Land 23 77 - 100SOHO China 100 - - 100Yanlord 42 55 3 100Simple average 35 57 8Weighted average* 30 60 10
Source: HSBC estimates *by market capitalisation
Residential price trend – Year-end monthly average
0
1,000
2,000
3,000
4,000
5,000
6,000
98 99 00 01 02 03 04 05 06 07 08 09 10 11 12
(RMB/sqm)2012e: down 10-15%, back to 2009 level
Source: NDRC, CEIC
渐飞研究报告 - http://bg.panlv.net
abc
8
Financial Institutions Group China Real Estate 4 January 2012
Cost of capital will be in the limelight While the key priority for developers will still be
market share gain amid continued industry
consolidation, we believe the market will be
placing increasing emphasis on developers’
capital structure and access/cost of capital. On the
one hand, the capital intensive nature of the real
estate business highlights the importance of
prudent balance sheet management, specifically
developers’ ability to withstand unforeseen
contracted sales shortfall, given the cyclical and
policy sensitive nature of the business. On the
other hand, the need to achieve quick asset
turnover also implies a strong competitive edge
for developers with ready access to funding at a
competitive cost. In our view, the ability to secure
low cost debt will prove to be an increasingly
important investment attribute worth appreciation
in the China property sector, particularly as both
onshore and offshore credit markets remain tight.
Against this backdrop, we argue that we need to
account for and reflect a greater range of cost
capital in our financial models. For our coverage
universe, we have derived cost of capital of
between 9% and 15% based on a detailed
appraisal of the capital structure and cost. The
differing cost of capital will have a minor impact
on NAV calculation. Cost of debt will impact the
forward margin prospect.
The valuation considerations Current sector valuation has priced in a rather grim outlook
While risk aversion on a high beta sector persists,
we argue that current valuation is pricing in an
overly grim outlook of the physical market, with
NAV discounts and PE both trading on a par to
the “darkest months” of 2008. Our analysis
indicates that current share prices are implying an
unrealistic one-off ASP decline of 28-50% across
all asset classes and all cities, which we find
unrealistic. Further, we also find that current share
prices are implying a massive devaluation in land
banks, as stocks are trading at a 4-39% discount to
historical land cost, except developers with state-
owned enterprise (SOE) status. Last but not least,
the bond market is providing some basis for our
argument that the sell-off in equities is overdone.
While bond prices are down, the magnitude of
solvency risk implied is significantly lower than
that reflected in the equity pricing.
Theoretical floor value analysis
We have devised an alternate valuation analysis
which we believe is a sound “pessimistic”
scenario analysis, where we employed a step-up
discounting approach on capital employed. Note
our derived floor values are calculated on a cost-
basis by taking the summation of all sunk costs
that developers have incurred and then netting off
their respective net debt to arrive at the floor
value. In our view, this metric serves to provide a
better gauge to developers’ tangible net worth, as
we strip out all subjective assumptions embedded
in traditional NAV estimates such as ASP, timing
difference of cash flow and WACC.
While there isn’t a barrier in the way of continued
or further weakness in share prices given the
current state of global equity markets, our
assessment of stocks’ theoretical floor values does
indicate that shares are well protected on the
downside. Of the nine stocks in our analysis, five
are trading at or below their respective floor
value; thus, current share prices are well protected
on the downside from a fundamental standpoint.
Not revisiting 2009, no V-shape rebound
We do not believe signs of a policy reversal for
the housing sector are conclusive, although easing
for the broader monetary environment has started.
The cooling of housing prices and transactions is
the result of administrative measures and
monetary conditions, the magnitude of which are
unlikely to have put the central government in
enough of a comfort zone to unwind.
Out of the 121 cities that have publicly announced
administrative measures such as HPR and price
restrictions, over 40 cities still recorded gains in
2011, and these are mostly tier-2/3 cities. At the
same time, over 30 cities are likely to miss their
target housing price level. It is therefore not
渐飞研究报告 - http://bg.panlv.net
abc
9
Financial Institutions Group China Real Estate 4 January 2012
surprising that cities like Zhuhai and Zhongshan
placed temporary price restrictions on pre-sales in
order to dilute ASP for 2011. Recent media
reports suggest that the Ministry of Housing and
Construction had asked the cities with HPR
expiring at year-end 2011 to extend the measure
indefinitely, and many cities have complied so far.
As such, we believe investment in the sector in
2012 should be based on the assumption that
administrative measures will remain status quo. In
our view, there will be no “rising tide lifts all
boats” situation like in 2009. We favour
companies with strong balance sheets, superior
access to debt funding at competitive costs and
proven execution track records, in this order of
priority. Hence our conviction OW stocks for
the sector are COLI, CRL and Longfor.
Changes to stock valuation Stocks for which we have widened the target discounts:
KWG from -45% (+0.5 SD) to -65% (-0.5 SD) to
account for the company’s slow sales momentum
given the continuous delay in new launches.
KWG only achieved 73% of its full-year
contracted sales target as at November 2011. In
our view, the company is likely to miss its 2011
full-year target by about 20%.
Longfor from -20% (+1 SD) to -30% (+0.5 SD)
as we believe the company’s sales momentum
will be partially capped while the central
government’s stance toward the housing sector
remains hawkish. We have applied a +0.5 SD
target discount for all of our conviction stocks
(i.e. Longfor, COLI and CRL) which have proven
sales records. Longfor remains the leader of the
pack among the non-SOEs.
We have fine-tuned the target discount of the
following companies, due simply to the increase
in market volatility that has led to a wider
measure of standard deviation from mean.
COLI from 0% to -5% (maintain +0.5 SD)
Franshion from -55% to -60% (maintain -1 SD)
GZ R&F from -56% to -60% (maintain -1 SD)
Shimao from -57% to -60% (maintain -1 SD)
Shui On Land from -55% to -60% (maintain -1 SD)
Stock for which we have narrowed the target discount:
CRL from -55% to -15% to reflect the stronger-
than-expected pick-up in contracted sales
momentum in 2H11. Thanks to its SOE
background, we expect the absolute advantage in
cost of capital to remain intact despite the tight
credit environment. In terms of balance sheet
management, CRL has deleveraged following the
latest round of share issuances to fund the asset
injection from the parent company. Given the
sheer size of the remaining assets pending for
injection, we expect CRL to break the annual
asset injection mode in 2012, which should be
welcomed by investors.
渐飞研究报告 - http://bg.panlv.net
abc
10
Financial Institutions Group China Real Estate 4 January 2012
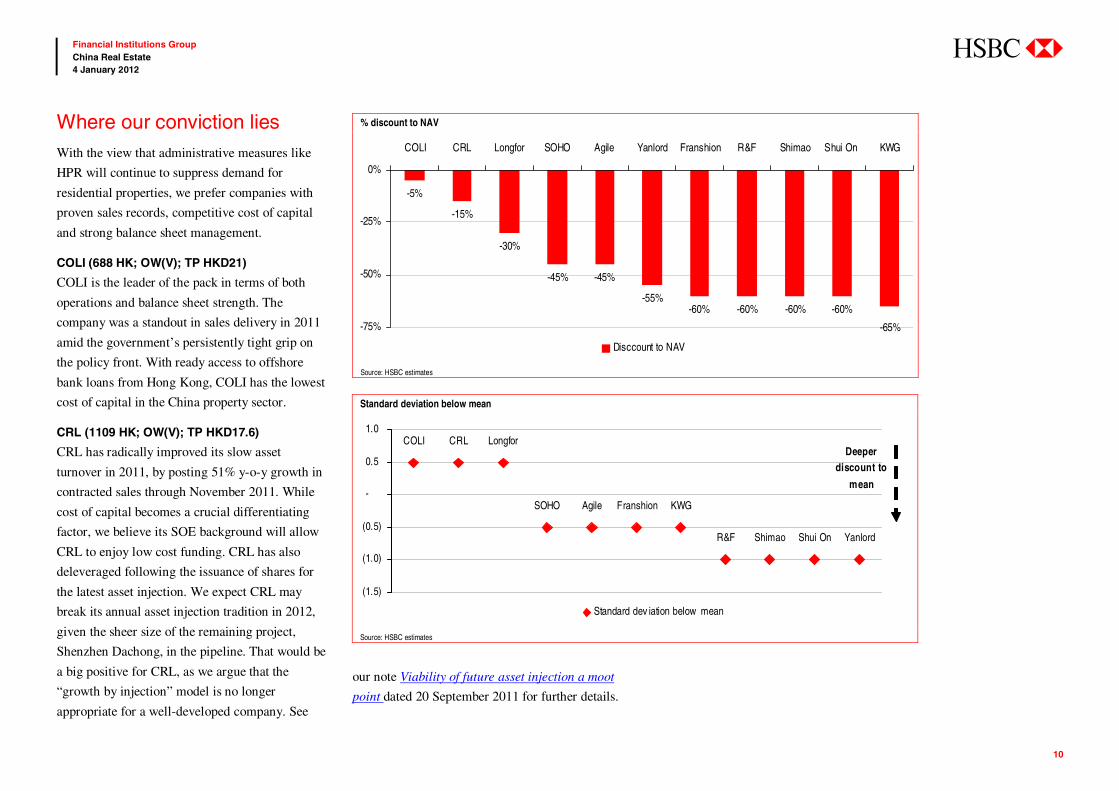
Where our conviction lies
With the view that administrative measures like
HPR will continue to suppress demand for
residential properties, we prefer companies with
proven sales records, competitive cost of capital
and strong balance sheet management.
COLI (688 HK; OW(V); TP HKD21)
COLI is the leader of the pack in terms of both
operations and balance sheet strength. The
company was a standout in sales delivery in 2011
amid the government’s persistently tight grip on
the policy front. With ready access to offshore
bank loans from Hong Kong, COLI has the lowest
cost of capital in the China property sector.
CRL (1109 HK; OW(V); TP HKD17.6)
CRL has radically improved its slow asset
turnover in 2011, by posting 51% y-o-y growth in
contracted sales through November 2011. While
cost of capital becomes a crucial differentiating
factor, we believe its SOE background will allow
CRL to enjoy low cost funding. CRL has also
deleveraged following the issuance of shares for
the latest asset injection. We expect CRL may
break its annual asset injection tradition in 2012,
given the sheer size of the remaining project,
Shenzhen Dachong, in the pipeline. That would be
a big positive for CRL, as we argue that the
“growth by injection” model is no longer
appropriate for a well-developed company. See
our note Viability of future asset injection a moot
point dated 20 September 2011 for further details.
% discount to NAV
-5%
-15%
-30%
-45% -45%
-55%-60% -60% -60% -60%
-65%-75%
-50%
-25%
0%
COLI CRL Longfor SOHO Agile Yanlord Franshion R&F Shimao Shui On KWG
Disccount to NAV
Source: HSBC estimates
Standard deviation below mean
Agile Franshion KWG
R&F Shimao Shui On Yanlord
SOHO
LongforCRLCOLI
(1.5)
(1.0)
(0.5)
-
0.5
1.0
Standard dev iation below mean
Deeper discount to
mean
Source: HSBC estimates
渐飞研究报告 - http://bg.panlv.net

abc
11
Financial Institutions Group China Real Estate 4 January 2012
Longfor (960 HK; OW(V); TP HKD13.3)
Longfor’s contracted sales momentum has
outpaced the sector’s, particularly during the
summer months that defied the market slowdown.
Longfor leads the pack among the non-SOEs in
terms of borrowing cost advantage and contracted
sales momentum. These are the key reasons
behind our conviction.
渐飞研究报告 - http://bg.panlv.net
abc
12
Financial Institutions Group China Real Estate 4 January 2012
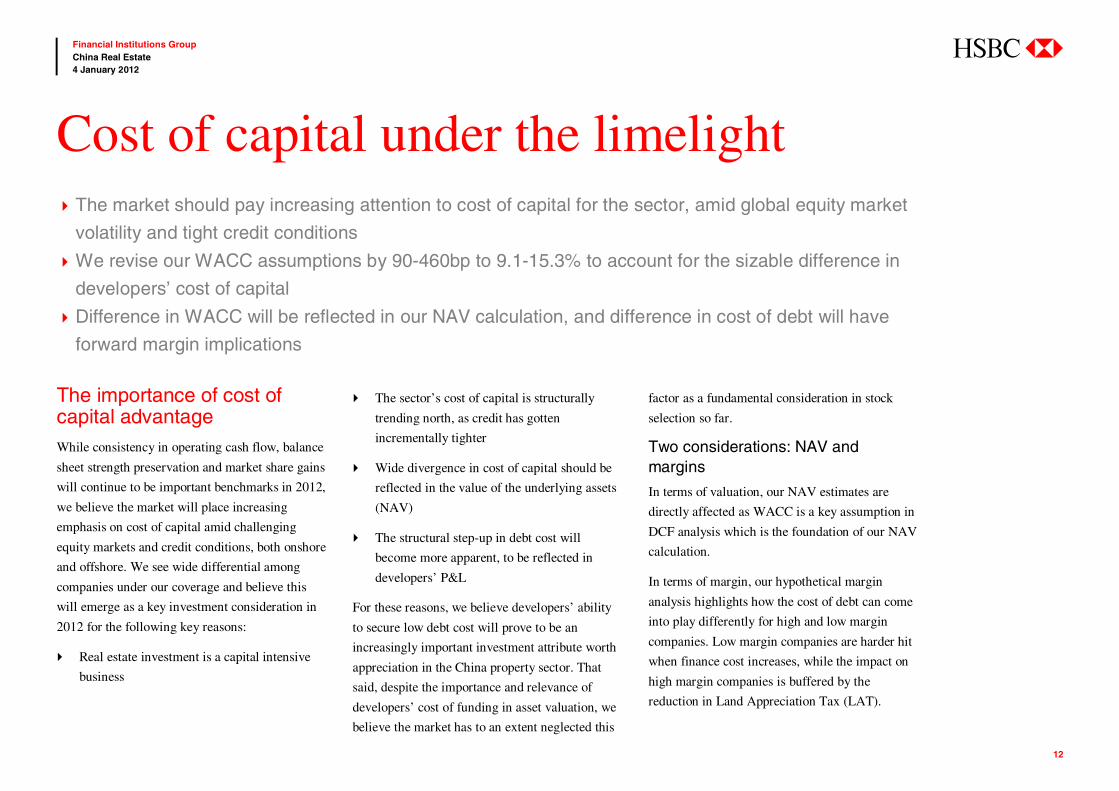
The importance of cost of capital advantage While consistency in operating cash flow, balance
sheet strength preservation and market share gains
will continue to be important benchmarks in 2012,
we believe the market will place increasing
emphasis on cost of capital amid challenging
equity markets and credit conditions, both onshore
and offshore. We see wide differential among
companies under our coverage and believe this
will emerge as a key investment consideration in
2012 for the following key reasons:
Real estate investment is a capital intensive
business
The sector’s cost of capital is structurally
trending north, as credit has gotten
incrementally tighter
Wide divergence in cost of capital should be
reflected in the value of the underlying assets
(NAV)
The structural step-up in debt cost will
become more apparent, to be reflected in
developers’ P&L
For these reasons, we believe developers’ ability
to secure low debt cost will prove to be an
increasingly important investment attribute worth
appreciation in the China property sector. That
said, despite the importance and relevance of
developers’ cost of funding in asset valuation, we
believe the market has to an extent neglected this
factor as a fundamental consideration in stock
selection so far.
Two considerations: NAV and margins
In terms of valuation, our NAV estimates are
directly affected as WACC is a key assumption in
DCF analysis which is the foundation of our NAV
calculation.
In terms of margin, our hypothetical margin
analysis highlights how the cost of debt can come
into play differently for high and low margin
companies. Low margin companies are harder hit
when finance cost increases, while the impact on
high margin companies is buffered by the
reduction in Land Appreciation Tax (LAT).
Cost of capital under the limelight The market should pay increasing attention to cost of capital for the sector, amid global equity market
volatility and tight credit conditions
We revise our WACC assumptions by 90-460bp to 9.1-15.3% to account for the sizable difference in
developers’ cost of capital
Difference in WACC will be reflected in our NAV calculation, and difference in cost of debt will have
forward margin implications
渐飞研究报告 - http://bg.panlv.net
abc
13
Financial Institutions Group China Real Estate 4 January 2012
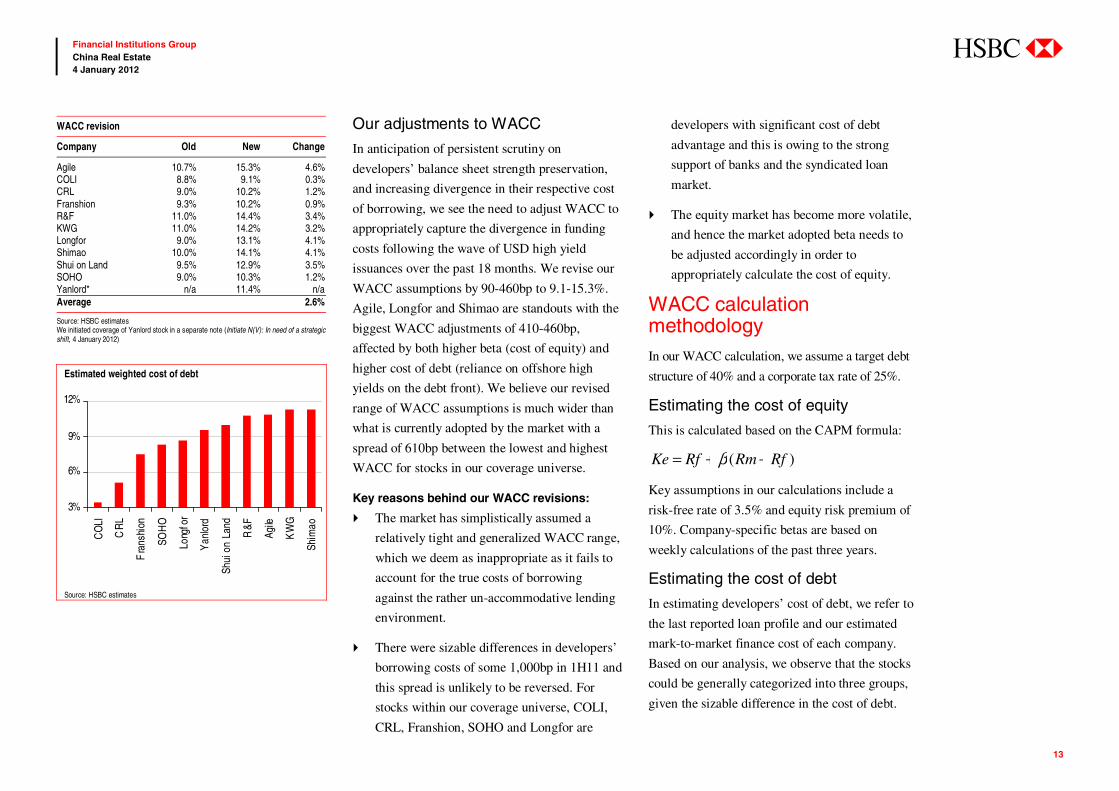
WACC revision
Company Old New Change
Agile 10.7% 15.3% 4.6% COLI 8.8% 9.1% 0.3% CRL 9.0% 10.2% 1.2% Franshion 9.3% 10.2% 0.9% R&F 11.0% 14.4% 3.4% KWG 11.0% 14.2% 3.2% Longfor 9.0% 13.1% 4.1% Shimao 10.0% 14.1% 4.1% Shui on Land 9.5% 12.9% 3.5% SOHO 9.0% 10.3% 1.2% Yanlord* n/a 11.4% n/a Average 2.6%
Source: HSBC estimates We initiated coverage of Yanlord stock in a separate note (Initiate N(V): In need of a strategic shift, 4 January 2012)
Estimated weighted cost of debt
3%
6%
9%
12%
CO
LI
CR
L
Fra
nshi
on
SOH
O
Long
for
Yan
lord
Shui
on
Land
R&F
Agile
KW
G
Shim
ao
Source: HSBC estimates
Our adjustments to WACC
In anticipation of persistent scrutiny on
developers’ balance sheet strength preservation,
and increasing divergence in their respective cost
of borrowing, we see the need to adjust WACC to
appropriately capture the divergence in funding
costs following the wave of USD high yield
issuances over the past 18 months. We revise our
WACC assumptions by 90-460bp to 9.1-15.3%.
Agile, Longfor and Shimao are standouts with the
biggest WACC adjustments of 410-460bp,
affected by both higher beta (cost of equity) and
higher cost of debt (reliance on offshore high
yields on the debt front). We believe our revised
range of WACC assumptions is much wider than
what is currently adopted by the market with a
spread of 610bp between the lowest and highest
WACC for stocks in our coverage universe.
Key reasons behind our WACC revisions:
The market has simplistically assumed a
relatively tight and generalized WACC range,
which we deem as inappropriate as it fails to
account for the true costs of borrowing
against the rather un-accommodative lending
environment.
There were sizable differences in developers’
borrowing costs of some 1,000bp in 1H11 and
this spread is unlikely to be reversed. For
stocks within our coverage universe, COLI,
CRL, Franshion, SOHO and Longfor are
developers with significant cost of debt
advantage and this is owing to the strong
support of banks and the syndicated loan
market.
The equity market has become more volatile,
and hence the market adopted beta needs to
be adjusted accordingly in order to
appropriately calculate the cost of equity. WACC calculation methodology In our WACC calculation, we assume a target debt
structure of 40% and a corporate tax rate of 25%.
Estimating the cost of equity
This is calculated based on the CAPM formula:
)( RfRmRfKe −+= β
Key assumptions in our calculations include a
risk-free rate of 3.5% and equity risk premium of
10%. Company-specific betas are based on
weekly calculations of the past three years.
Estimating the cost of debt
In estimating developers’ cost of debt, we refer to
the last reported loan profile and our estimated
mark-to-market finance cost of each company.
Based on our analysis, we observe that the stocks
could be generally categorized into three groups,
given the sizable difference in the cost of debt.
渐飞研究报告 - http://bg.panlv.net
abc
14
Financial Institutions Group China Real Estate 4 January 2012
Category 1 stocks – (below 7.5%) key sources
of borrowing: Offshore HKD bank loans +
onshore bank loans at a small premium above the
benchmark rate
Stocks: COLI, CRL, Franshion
This group of developers has ready access to the
offshore syndicated loan market, as well as
onshore bank loans at a small premium above the
benchmark People’s Bank of China (PBOC) rate.
We observe that offshore low-cost borrowing
contributes more than 50% of COLI’s and CRL’s
debt profile as of the latest reporting date. Not
surprisingly, developers in this group are mainly
SOEs, whose parent backings have enhanced
credit accessibility with more flexible funding
channels. These developers enjoy the lowest cost
of borrowing among the three groups of stocks.
Category 2 stocks – (7.5% to 10%) key sources
of borrowing: Onshore construction loans at a
reasonable premium above the benchmark rate +
offshore syndicated loan + USD high yield bond
Stocks: Longfor, Soho China, Shui On Land,
Yanlord
This group of developers possesses healthy
balance sheets, or in the case of Shui On Land is
the subsidiary of a HK-based listed company.
Developers in this group are able to secure
onshore construction loans at reasonable rates, fair
access to offshore syndicated loans and sensible
issue cost in the offshore high yield bond market.
Category 3 stocks – (above 10%) key sources of
borrowing: Onshore construction loans at a
premium above the benchmark rate + offshore
syndicated loan + USD high yield bond
Stocks: Agile, GZ R&F, KWG, Shimao
Developers who have stretched balance sheets and
limited source of low-cost funding fall into this
category. We observe that these developers
generally relied more heavily on offshore high
yield bond as of their latest report date. We
believe their key sources of borrowing are
onshore construction loans, but at higher
premiums over the PBOC benchmark lending
rate.
Putting it together: WACC range of 9.1-15.3%
Our revised WACC range of 9.1-15.3% represents
a sizable spread of 610bp between the high end
and low end, based on the determined cost of
equity and debt. Note that we have assumed a
40% debt-to-asset ratio across the board. In this
exercise, we find that COLI has the lowest
WACC, while Agile is penalized for its
dependence on USD HY issuances and high beta.
渐飞研究报告 - http://bg.panlv.net
abc
15
Financial Institutions Group China Real Estate 4 January 2012
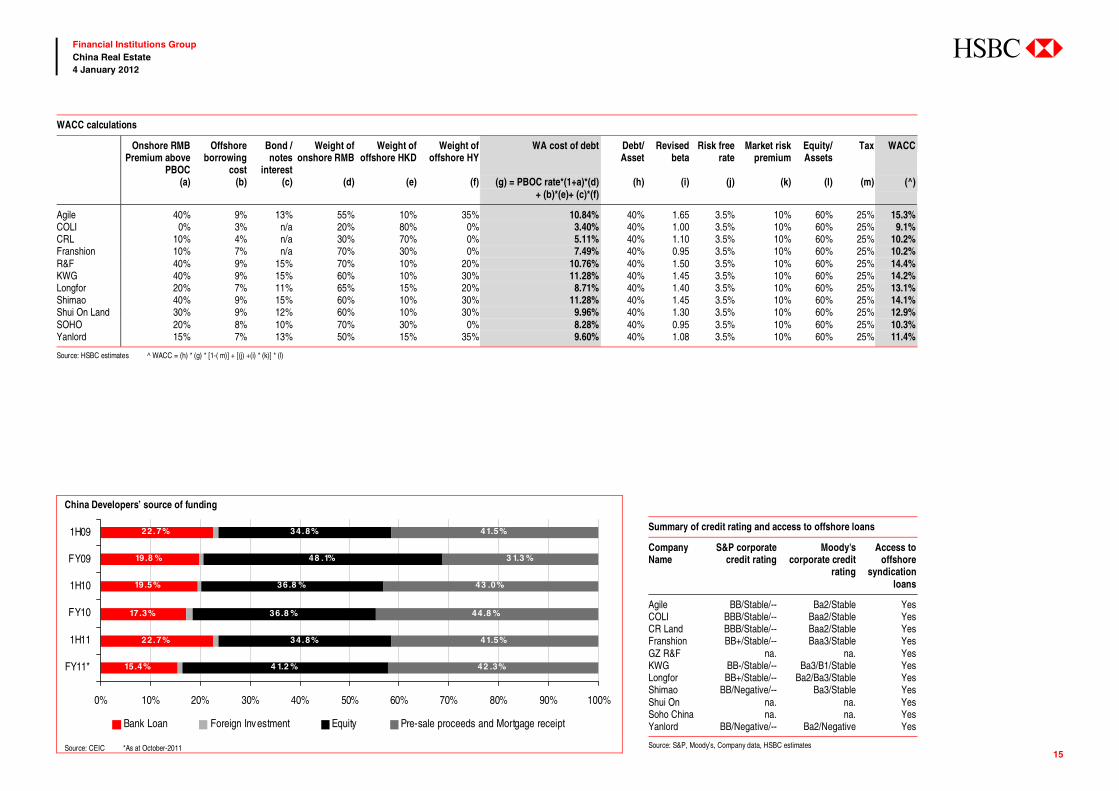
WACC calculations
Onshore RMB Premium above
PBOC
Offshore borrowing
cost
Bond / notes
interest
Weight of onshore RMB
Weight of offshore HKD
Weight of offshore HY
WA cost of debt Debt/ Asset
Revised beta
Risk free rate
Market risk premium
Equity/ Assets
Tax WACC
(a) (b) (c) (d) (e) (f) (g) = PBOC rate*(1+a)*(d) + (b)*(e)+ (c)*(f)
(h) (i) (j) (k) (l) (m) (^)
Agile 40% 9% 13% 55% 10% 35% 10.84% 40% 1.65 3.5% 10% 60% 25% 15.3%COLI 0% 3% n/a 20% 80% 0% 3.40% 40% 1.00 3.5% 10% 60% 25% 9.1%CRL 10% 4% n/a 30% 70% 0% 5.11% 40% 1.10 3.5% 10% 60% 25% 10.2%Franshion 10% 7% n/a 70% 30% 0% 7.49% 40% 0.95 3.5% 10% 60% 25% 10.2%R&F 40% 9% 15% 70% 10% 20% 10.76% 40% 1.50 3.5% 10% 60% 25% 14.4%KWG 40% 9% 15% 60% 10% 30% 11.28% 40% 1.45 3.5% 10% 60% 25% 14.2%Longfor 20% 7% 11% 65% 15% 20% 8.71% 40% 1.40 3.5% 10% 60% 25% 13.1%Shimao 40% 9% 15% 60% 10% 30% 11.28% 40% 1.45 3.5% 10% 60% 25% 14.1%Shui On Land 30% 9% 12% 60% 10% 30% 9.96% 40% 1.30 3.5% 10% 60% 25% 12.9%SOHO 20% 8% 10% 70% 30% 0% 8.28% 40% 0.95 3.5% 10% 60% 25% 10.3%Yanlord 15% 7% 13% 50% 15% 35% 9.60% 40% 1.08 3.5% 10% 60% 25% 11.4%
Source: HSBC estimates ^ WACC = (h) * (g) * [1-( m)] + [(j) +(i) * (k)] * (l)
Summary of credit rating and access to offshore loans
Company Name
S&P corporate credit rating
Moody's corporate credit
rating
Access to offshore
syndication loans
Agile BB/Stable/-- Ba2/Stable YesCOLI BBB/Stable/-- Baa2/Stable YesCR Land BBB/Stable/-- Baa2/Stable YesFranshion BB+/Stable/-- Baa3/Stable YesGZ R&F na. na. YesKWG BB-/Stable/-- Ba3/B1/Stable YesLongfor BB+/Stable/-- Ba2/Ba3/Stable YesShimao BB/Negative/-- Ba3/Stable YesShui On na. na. YesSoho China na. na. YesYanlord BB/Negative/-- Ba2/Negative Yes
Source: S&P, Moody’s, Company data, HSBC estimates
China Developers’ source of funding
15.4%
22.7%
17.3%
19.5%
19.8 %
22.7%
4 1.2 %
34.8%
36.8 %
36.8 %
48 .1%
34.8%
42 .3%
41.5%
44.8 %
43 .0%
3 1.3 %
41.5%
0% 10% 20% 30% 40% 50% 60% 70% 80% 90% 100%
FY11*
1H11
FY10
1H10
FY09
1H09
Bank Loan Foreign Investment Equity Pre-sale proceeds and Mortgage receipt
Source: CEIC *As at October-2011
渐飞研究报告 - http://bg.panlv.net
abc
16
Financial Institutions Group China Real Estate 4 January 2012
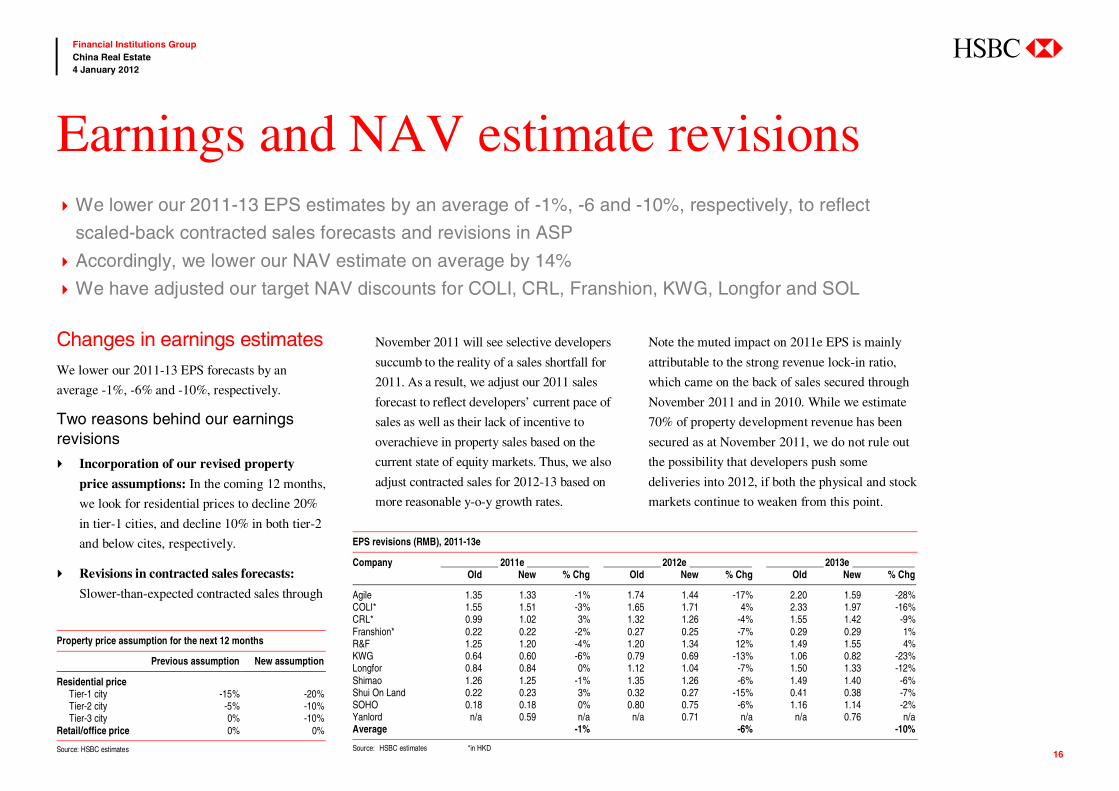
Changes in earnings estimates We lower our 2011-13 EPS forecasts by an
average -1%, -6% and -10%, respectively.
Two reasons behind our earnings revisions
Incorporation of our revised property
price assumptions: In the coming 12 months,
we look for residential prices to decline 20%
in tier-1 cities, and decline 10% in both tier-2
and below cites, respectively.
Revisions in contracted sales forecasts:
Slower-than-expected contracted sales through
November 2011 will see selective developers
succumb to the reality of a sales shortfall for
2011. As a result, we adjust our 2011 sales
forecast to reflect developers’ current pace of
sales as well as their lack of incentive to
overachieve in property sales based on the
current state of equity markets. Thus, we also
adjust contracted sales for 2012-13 based on
more reasonable y-o-y growth rates.
Note the muted impact on 2011e EPS is mainly
attributable to the strong revenue lock-in ratio,
which came on the back of sales secured through
November 2011 and in 2010. While we estimate
70% of property development revenue has been
secured as at November 2011, we do not rule out
the possibility that developers push some
deliveries into 2012, if both the physical and stock
markets continue to weaken from this point.
Earnings and NAV estimate revisions We lower our 2011-13 EPS estimates by an average of -1%, -6 and -10%, respectively, to reflect
scaled-back contracted sales forecasts and revisions in ASP
Accordingly, we lower our NAV estimate on average by 14%
We have adjusted our target NAV discounts for COLI, CRL, Franshion, KWG, Longfor and SOL
EPS revisions (RMB), 2011-13e
Company ____________ 2011e _____________ ____________ 2012e _____________ ____________ 2013e _____________ Old New % Chg Old New % Chg Old New % Chg
Agile 1.35 1.33 -1% 1.74 1.44 -17% 2.20 1.59 -28%COLI* 1.55 1.51 -3% 1.65 1.71 4% 2.33 1.97 -16%CRL* 0.99 1.02 3% 1.32 1.26 -4% 1.55 1.42 -9%Franshion* 0.22 0.22 -2% 0.27 0.25 -7% 0.29 0.29 1%R&F 1.25 1.20 -4% 1.20 1.34 12% 1.49 1.55 4%KWG 0.64 0.60 -6% 0.79 0.69 -13% 1.06 0.82 -23%Longfor 0.84 0.84 0% 1.12 1.04 -7% 1.50 1.33 -12%Shimao 1.26 1.25 -1% 1.35 1.26 -6% 1.49 1.40 -6%Shui On Land 0.22 0.23 3% 0.32 0.27 -15% 0.41 0.38 -7%SOHO 0.18 0.18 0% 0.80 0.75 -6% 1.16 1.14 -2%Yanlord n/a 0.59 n/a n/a 0.71 n/a n/a 0.76 n/aAverage -1% -6% -10%
Source: HSBC estimates *in HKD
Property price assumption for the next 12 months
Previous assumption New assumption
Residential price Tier-1 city -15% -20% Tier-2 city -5% -10% Tier-3 city 0% -10% Retail/office price 0% 0%
Source: HSBC estimates
渐飞研究报告 - http://bg.panlv.net
abc
17
Financial Institutions Group China Real Estate 4 January 2012
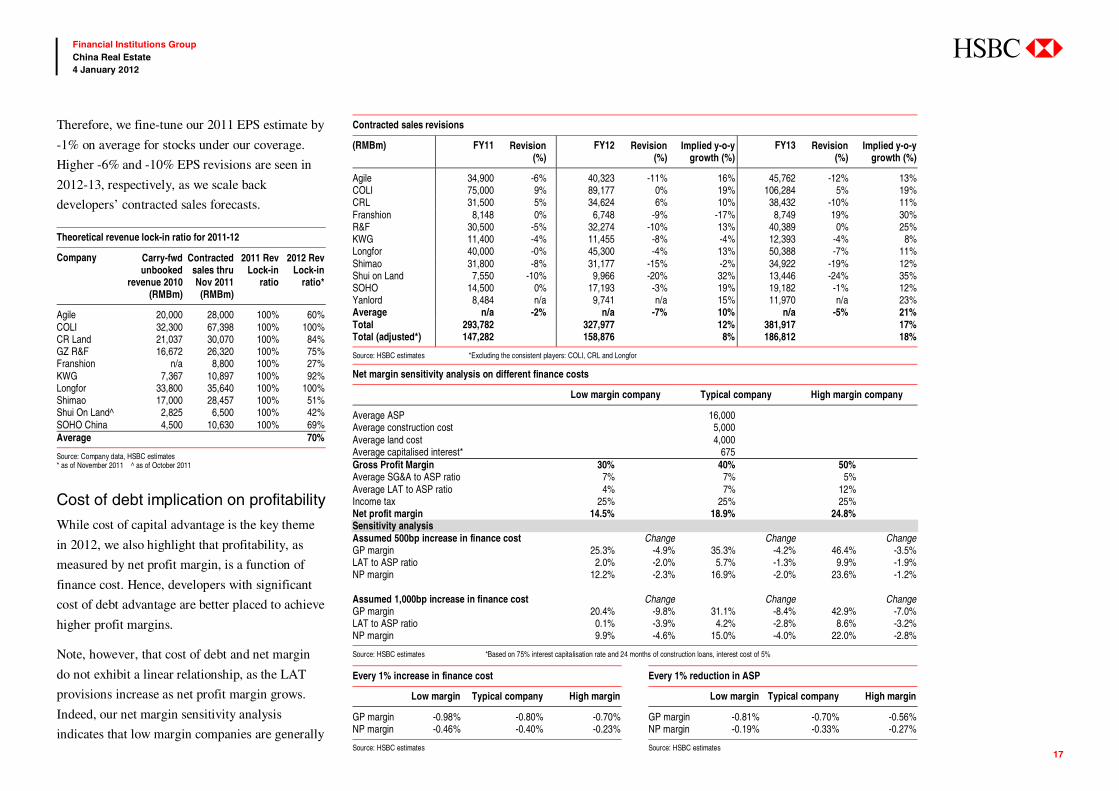
Therefore, we fine-tune our 2011 EPS estimate by
-1% on average for stocks under our coverage.
Higher -6% and -10% EPS revisions are seen in
2012-13, respectively, as we scale back
developers’ contracted sales forecasts. Theoretical revenue lock-in ratio for 2011-12
Company Carry-fwd unbooked
revenue 2010 (RMBm)
Contracted sales thru Nov 2011 (RMBm)
2011 Rev Lock-in
ratio
2012 Rev Lock-in
ratio*
Agile 20,000 28,000 100% 60% COLI 32,300 67,398 100% 100% CR Land 21,037 30,070 100% 84% GZ R&F 16,672 26,320 100% 75% Franshion n/a 8,800 100% 27% KWG 7,367 10,897 100% 92% Longfor 33,800 35,640 100% 100% Shimao 17,000 28,457 100% 51% Shui On Land^ 2,825 6,500 100% 42% SOHO China 4,500 10,630 100% 69% Average 70%
Source: Company data, HSBC estimates * as of November 2011 ^ as of October 2011
Cost of debt implication on profitability
While cost of capital advantage is the key theme
in 2012, we also highlight that profitability, as
measured by net profit margin, is a function of
finance cost. Hence, developers with significant
cost of debt advantage are better placed to achieve
higher profit margins.
Note, however, that cost of debt and net margin
do not exhibit a linear relationship, as the LAT
provisions increase as net profit margin grows.
Indeed, our net margin sensitivity analysis
indicates that low margin companies are generally
Contracted sales revisions
(RMBm) FY11 Revision(%)
FY12 Revision(%)
Implied y-o-y growth (%)
FY13 Revision(%)
Implied y-o-y growth (%)
Agile 34,900 -6% 40,323 -11% 16% 45,762 -12% 13%COLI 75,000 9% 89,177 0% 19% 106,284 5% 19%CRL 31,500 5% 34,624 6% 10% 38,432 -10% 11%Franshion 8,148 0% 6,748 -9% -17% 8,749 19% 30%R&F 30,500 -5% 32,274 -10% 13% 40,389 0% 25%KWG 11,400 -4% 11,455 -8% -4% 12,393 -4% 8%Longfor 40,000 -0% 45,300 -4% 13% 50,388 -7% 11%Shimao 31,800 -8% 31,177 -15% -2% 34,922 -19% 12%Shui on Land 7,550 -10% 9,966 -20% 32% 13,446 -24% 35%SOHO 14,500 0% 17,193 -3% 19% 19,182 -1% 12%Yanlord 8,484 n/a 9,741 n/a 15% 11,970 n/a 23%Average n/a -2% n/a -7% 10% n/a -5% 21%Total 293,782 327,977 12% 381,917 17%Total (adjusted*) 147,282 158,876 8% 186,812 18%
Source: HSBC estimates *Excluding the consistent players: COLI, CRL and Longfor
Net margin sensitivity analysis on different finance costs
Low margin company Typical company High margin company
Average ASP 16,000 Average construction cost 5,000 Average land cost 4,000 Average capitalised interest* 675Gross Profit Margin 30% 40% 50%Average SG&A to ASP ratio 7% 7% 5%Average LAT to ASP ratio 4% 7% 12%Income tax 25% 25% 25%Net profit margin 14.5% 18.9% 24.8%Sensitivity analysis Assumed 500bp increase in finance cost Change Change ChangeGP margin 25.3% -4.9% 35.3% -4.2% 46.4% -3.5%LAT to ASP ratio 2.0% -2.0% 5.7% -1.3% 9.9% -1.9%NP margin 12.2% -2.3% 16.9% -2.0% 23.6% -1.2% Assumed 1,000bp increase in finance cost Change Change ChangeGP margin 20.4% -9.8% 31.1% -8.4% 42.9% -7.0%LAT to ASP ratio 0.1% -3.9% 4.2% -2.8% 8.6% -3.2%NP margin 9.9% -4.6% 15.0% -4.0% 22.0% -2.8%
Source: HSBC estimates *Based on 75% interest capitalisation rate and 24 months of construction loans, interest cost of 5%
Every 1% increase in finance cost
Low margin Typical company High margin
GP margin -0.98% -0.80% -0.70% NP margin -0.46% -0.40% -0.23%
Source: HSBC estimates
Every 1% reduction in ASP
Low margin Typical company High margin
GP margin -0.81% -0.70% -0.56%NP margin -0.19% -0.33% -0.27%
Source: HSBC estimates
渐飞研究报告 - http://bg.panlv.net
abc
18
Financial Institutions Group China Real Estate 4 January 2012
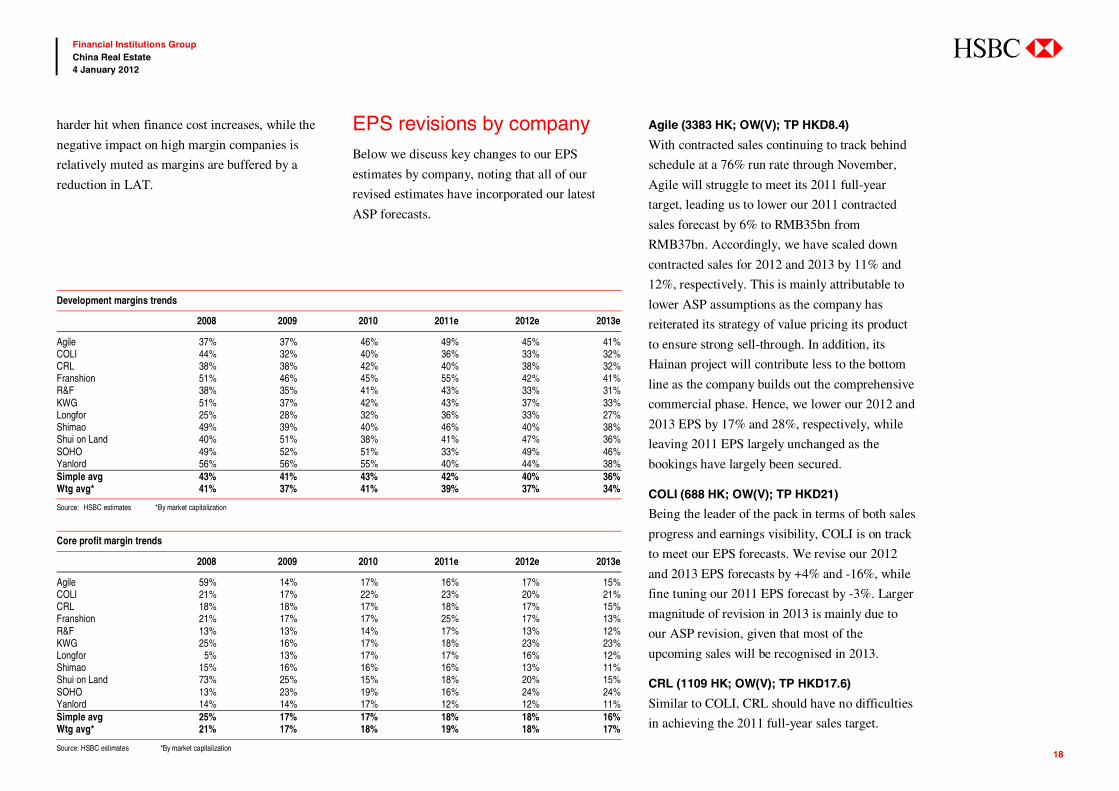
harder hit when finance cost increases, while the
negative impact on high margin companies is
relatively muted as margins are buffered by a
reduction in LAT.
EPS revisions by company Below we discuss key changes to our EPS
estimates by company, noting that all of our
revised estimates have incorporated our latest
ASP forecasts.
Agile (3383 HK; OW(V); TP HKD8.4)
With contracted sales continuing to track behind
schedule at a 76% run rate through November,
Agile will struggle to meet its 2011 full-year
target, leading us to lower our 2011 contracted
sales forecast by 6% to RMB35bn from
RMB37bn. Accordingly, we have scaled down
contracted sales for 2012 and 2013 by 11% and
12%, respectively. This is mainly attributable to
lower ASP assumptions as the company has
reiterated its strategy of value pricing its product
to ensure strong sell-through. In addition, its
Hainan project will contribute less to the bottom
line as the company builds out the comprehensive
commercial phase. Hence, we lower our 2012 and
2013 EPS by 17% and 28%, respectively, while
leaving 2011 EPS largely unchanged as the
bookings have largely been secured.
COLI (688 HK; OW(V); TP HKD21)
Being the leader of the pack in terms of both sales
progress and earnings visibility, COLI is on track
to meet our EPS forecasts. We revise our 2012
and 2013 EPS forecasts by +4% and -16%, while
fine tuning our 2011 EPS forecast by -3%. Larger
magnitude of revision in 2013 is mainly due to
our ASP revision, given that most of the
upcoming sales will be recognised in 2013.
CRL (1109 HK; OW(V); TP HKD17.6)
Similar to COLI, CRL should have no difficulties
in achieving the 2011 full-year sales target.
Core profit margin trends
2008 2009 2010 2011e 2012e 2013e
Agile 59% 14% 17% 16% 17% 15% COLI 21% 17% 22% 23% 20% 21% CRL 18% 18% 17% 18% 17% 15% Franshion 21% 17% 17% 25% 17% 13% R&F 13% 13% 14% 17% 13% 12% KWG 25% 16% 17% 18% 23% 23% Longfor 5% 13% 17% 17% 16% 12% Shimao 15% 16% 16% 16% 13% 11% Shui on Land 73% 25% 15% 18% 20% 15% SOHO 13% 23% 19% 16% 24% 24% Yanlord 14% 14% 17% 12% 12% 11% Simple avg 25% 17% 17% 18% 18% 16% Wtg avg* 21% 17% 18% 19% 18% 17%
Source: HSBC estimates *By market capitalization
Development margins trends
2008 2009 2010 2011e 2012e 2013e
Agile 37% 37% 46% 49% 45% 41% COLI 44% 32% 40% 36% 33% 32% CRL 38% 38% 42% 40% 38% 32% Franshion 51% 46% 45% 55% 42% 41% R&F 38% 35% 41% 43% 33% 31% KWG 51% 37% 42% 43% 37% 33% Longfor 25% 28% 32% 36% 33% 27% Shimao 49% 39% 40% 46% 40% 38% Shui on Land 40% 51% 38% 41% 47% 36% SOHO 49% 52% 51% 33% 49% 46% Yanlord 56% 56% 55% 40% 44% 38% Simple avg 43% 41% 43% 42% 40% 36% Wtg avg* 41% 37% 41% 39% 37% 34%
Source: HSBC estimates *By market capitalization
渐飞研究报告 - http://bg.panlv.net
abc
19
Financial Institutions Group China Real Estate 4 January 2012
Hence, our EPS revisions are mainly reflective of
push-back in completion schedule and changes in
ASP. The company also has a growing investment
property (IP) portfolio expected to contribute
about 7% of total revenue in 2011, the highest
proportion among large developers. As IP
generally carry a higher margin than development
properties, they can have a disproportionate
impact on the bottom line. Our analysis shows
each dollar of the company’s property
development revenue contributes RMB0.17 to net
income, while a dollar of rental revenue can
contribute RMB0.43 to the bottom line. Hence we
expect the company’s IP portfolio to provide
some degree of earning resilience. We cut our
2012 and 2013 EPS by 4% and 9% on the back of
lower GFA delivery by 5-10% during these
periods, respectively.
Franshion (817 HK; OW; TP HKD1.9)
Our 2011 EPS is largely unchanged as our forecast
captures the latest sales progress following our
revision in Patience beginning to bear fruit (20
October 2011). In 2012, we lower our EPS
modestly by 7%, as the majority of the 2012
revenue has already been secured, implying
minimal impact from our ASP revisions. Our 2013
EPS is largely unchanged, as the effect of the ASP
decline is offset by higher contracted sales, mainly
from the Qingdao Lanhai Xingang City project.
GZ R&F (2777 HK; OW(V); TP HKD7.1)
Although the company remains confident of
achieving its 2011 full-year contracted sales target
of RMB32bn (revised down from RMB40bn in
September), we expect the company to achieve
95% by year-end 2011, i.e. RMB30.5bn, down
5% from our previous estimate. Accordingly, we
revise our 2011 EPS down by 4%. We also lower
2012 contracted sales by 10% due to the current
sales momentum. As we believe that our 2012e
EPS reduction was too conservative (see 28
September note OW: Reality bites, but guidance
cut manageable), we raise 2012 EPS by 12% to
RMB1.34 from RMB1.20. Coming from a low
base of contracted sales, we believe GZ R&F
could see a rebound in sales in 2013 (w estimate
25% growth). As a result, we raise our 2013 EPS
by 4%, despite a reduction in contracted sales in
the previous two years.
KWG (1813 HK; OW(V); TP HKD4.5)
We lower our 2011 EPS by 6%, the most of
stocks in our coverage universe, given that sales
through November 2011 are significantly behind
schedule. Continuous delays in project launches
should see 2011 full-year sales fall short of target
by about 20%. Coupled with the company’s large
exposure in higher tier cities (53% in tier-1, the
highest among all developers excluding SOHO),
we expect contracted sales to remain flat in 2012
and to log only moderate growth of 8% y-o-y in
2013. We lower our 2012-13 EPS by 13% and
23%, respectively.
Longfor (960 HK; OW(V); TP HKD13.3)
Longfor is firmly on track to meet its 2011
contracted sales target based on the company’s
sales progress through November. Our 2011 EPS
is largely unchanged as Longfor offers the highest
theoretical revenue lock-in ratio through 2012.
Despite this, we scale down Longfor’s contracted
sales forecasts in both 2012 and 2013 along with
other developers in the sector. The revised y-o-y
sales growth forecasts of 11-13% are only
marginally lower than previous forecasts of 15%.
We believe this is justified given the company’s
demonstrated practice of aggressive price cutting
and the resultant 90%+ sell-through rate. Hence,
we cut our 2012-13 EPS by 7% and 12%,
accordingly.
Shimao (813 HK; N(V); TP HKD7)
Following our latest round of estimate revisions
(see Upgrade to OW: But deleveraging will drain
growth, 11 October 2011) we leave our 2011 EPS
unchanged, but further lower our 2012-13 EPS by
6% and 6%, respectively. These changes are
mainly attributable to our 15-20% reduction in
contracted sales estimates for 2012-13, as well as
changes in ASP.
渐飞研究报告 - http://bg.panlv.net
abc
20
Financial Institutions Group China Real Estate 4 January 2012
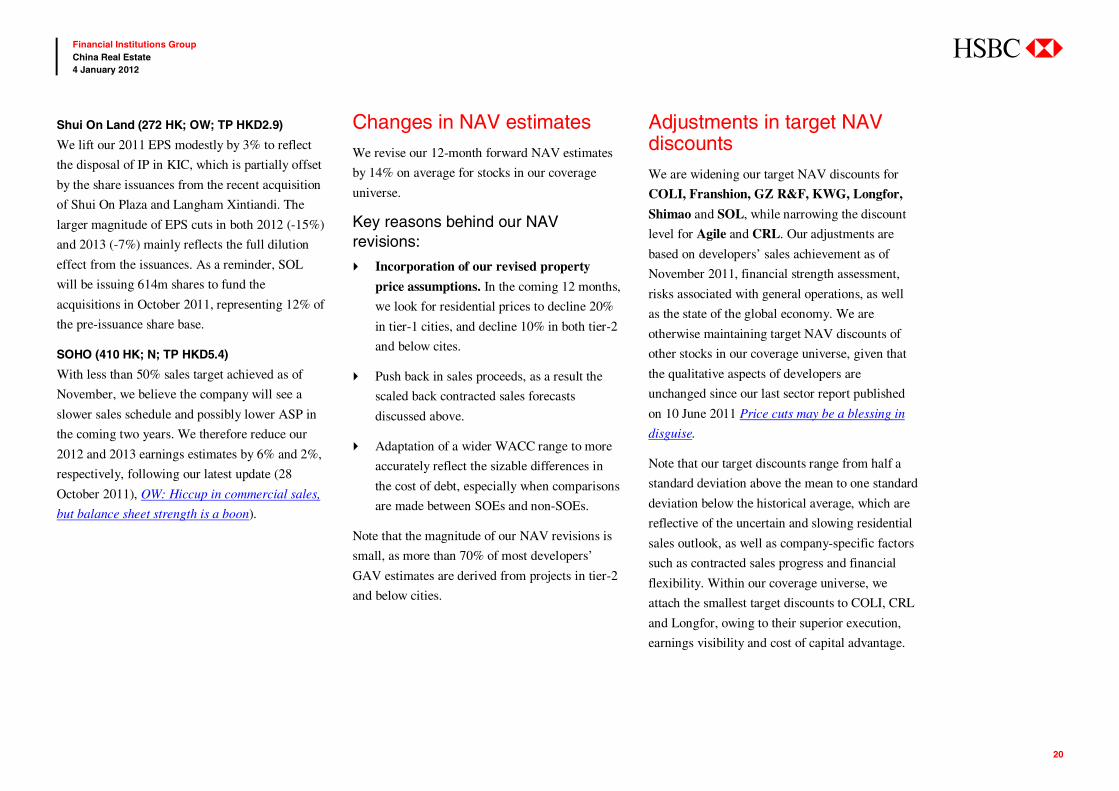
Shui On Land (272 HK; OW; TP HKD2.9)
We lift our 2011 EPS modestly by 3% to reflect
the disposal of IP in KIC, which is partially offset
by the share issuances from the recent acquisition
of Shui On Plaza and Langham Xintiandi. The
larger magnitude of EPS cuts in both 2012 (-15%)
and 2013 (-7%) mainly reflects the full dilution
effect from the issuances. As a reminder, SOL
will be issuing 614m shares to fund the
acquisitions in October 2011, representing 12% of
the pre-issuance share base.
SOHO (410 HK; N; TP HKD5.4)
With less than 50% sales target achieved as of
November, we believe the company will see a
slower sales schedule and possibly lower ASP in
the coming two years. We therefore reduce our
2012 and 2013 earnings estimates by 6% and 2%,
respectively, following our latest update (28
October 2011), OW: Hiccup in commercial sales,
but balance sheet strength is a boon).
Changes in NAV estimates We revise our 12-month forward NAV estimates
by 14% on average for stocks in our coverage
universe.
Key reasons behind our NAV revisions:
Incorporation of our revised property
price assumptions. In the coming 12 months,
we look for residential prices to decline 20%
in tier-1 cities, and decline 10% in both tier-2
and below cites.
Push back in sales proceeds, as a result the
scaled back contracted sales forecasts
discussed above.
Adaptation of a wider WACC range to more
accurately reflect the sizable differences in
the cost of debt, especially when comparisons
are made between SOEs and non-SOEs.
Note that the magnitude of our NAV revisions is
small, as more than 70% of most developers’
GAV estimates are derived from projects in tier-2
and below cities.
Adjustments in target NAV discounts We are widening our target NAV discounts for
COLI, Franshion, GZ R&F, KWG, Longfor,
Shimao and SOL, while narrowing the discount
level for Agile and CRL. Our adjustments are
based on developers’ sales achievement as of
November 2011, financial strength assessment,
risks associated with general operations, as well
as the state of the global economy. We are
otherwise maintaining target NAV discounts of
other stocks in our coverage universe, given that
the qualitative aspects of developers are
unchanged since our last sector report published
on 10 June 2011 Price cuts may be a blessing in
disguise.
Note that our target discounts range from half a
standard deviation above the mean to one standard
deviation below the historical average, which are
reflective of the uncertain and slowing residential
sales outlook, as well as company-specific factors
such as contracted sales progress and financial
flexibility. Within our coverage universe, we
attach the smallest target discounts to COLI, CRL
and Longfor, owing to their superior execution,
earnings visibility and cost of capital advantage.
渐飞研究报告 - http://bg.panlv.net
abc
21
Financial Institutions Group China Real Estate 4 January 2012
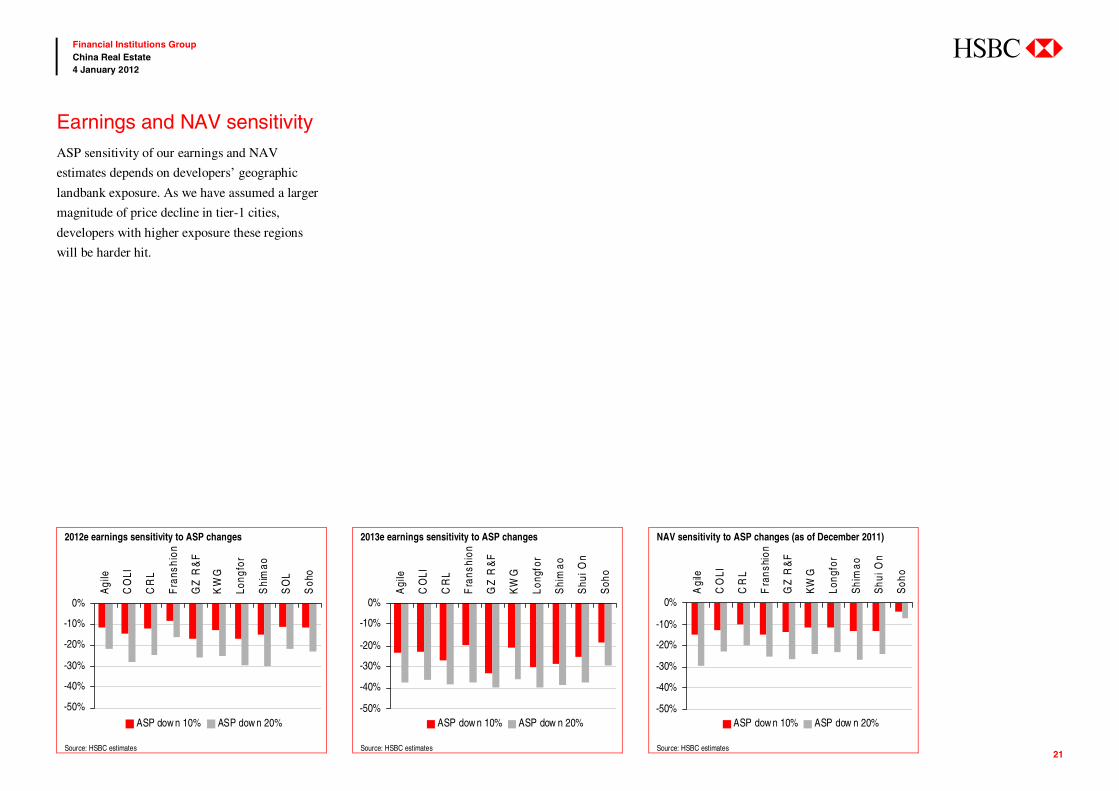
Earnings and NAV sensitivity ASP sensitivity of our earnings and NAV
estimates depends on developers’ geographic
landbank exposure. As we have assumed a larger
magnitude of price decline in tier-1 cities,
developers with higher exposure these regions
will be harder hit.
2012e earnings sensitivity to ASP changes 2013e earnings sensitivity to ASP changes NAV sensitivity to ASP changes (as of December 2011)
-50%
-40%
-30%
-20%
-10%
0%
Agi
le
CO
LI
CR
L
Fra
nshi
on
GZ
R&
F
KW
G
Long
for
Shi
mao
SO
L
Soh
o
ASP dow n 10% ASP dow n 20%
-50%
-40%
-30%
-20%
-10%
0%
Agi
le
CO
LI
CR
L
Fra
nshi
on
GZ
R&
F
KW
G
Long
for
Shi
mao
Shu
i On
Soh
o
ASP dow n 10% ASP dow n 20%
-50%
-40%
-30%
-20%
-10%
0%
Agi
le
CO
LI
CR
L
Fra
nshi
on
GZ
R&
F
KW
G
Long
for
Shi
mao
Shu
i On
Soh
o
ASP dow n 10% ASP dow n 20%
Source: HSBC estimates Source: HSBC estimates Source: HSBC estimates
渐飞研究报告 - http://bg.panlv.net
abc
22
Financial Institutions Group China Real Estate 4 January 2012
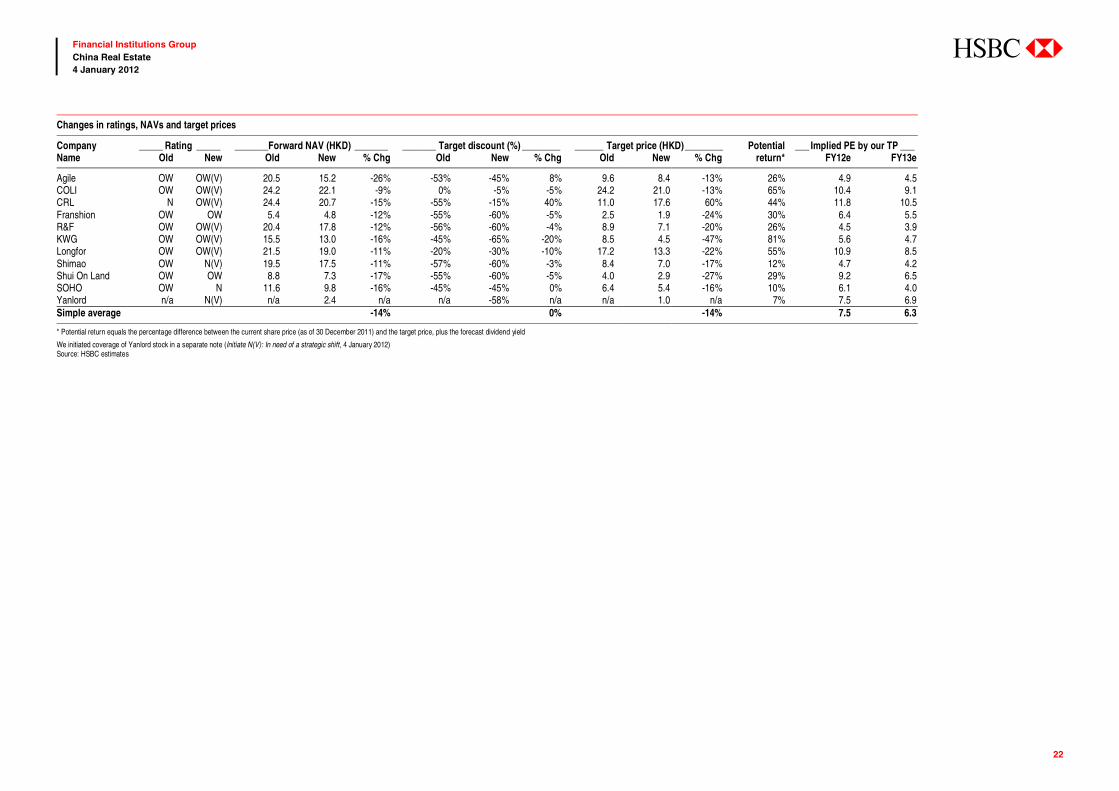
Changes in ratings, NAVs and target prices
Company _____ Rating _____ _______Forward NAV (HKD) _______ _______ Target discount (%) ________ ______ Target price (HKD)________ Potential ___ Implied PE by our TP ___Name Old New Old New % Chg Old New % Chg Old New % Chg return* FY12e FY13e
Agile OW OW(V) 20.5 15.2 -26% -53% -45% 8% 9.6 8.4 -13% 26% 4.9 4.5 COLI OW OW(V) 24.2 22.1 -9% 0% -5% -5% 24.2 21.0 -13% 65% 10.4 9.1 CRL N OW(V) 24.4 20.7 -15% -55% -15% 40% 11.0 17.6 60% 44% 11.8 10.5 Franshion OW OW 5.4 4.8 -12% -55% -60% -5% 2.5 1.9 -24% 30% 6.4 5.5 R&F OW OW(V) 20.4 17.8 -12% -56% -60% -4% 8.9 7.1 -20% 26% 4.5 3.9 KWG OW OW(V) 15.5 13.0 -16% -45% -65% -20% 8.5 4.5 -47% 81% 5.6 4.7 Longfor OW OW(V) 21.5 19.0 -11% -20% -30% -10% 17.2 13.3 -22% 55% 10.9 8.5 Shimao OW N(V) 19.5 17.5 -11% -57% -60% -3% 8.4 7.0 -17% 12% 4.7 4.2 Shui On Land OW OW 8.8 7.3 -17% -55% -60% -5% 4.0 2.9 -27% 29% 9.2 6.5 SOHO OW N 11.6 9.8 -16% -45% -45% 0% 6.4 5.4 -16% 10% 6.1 4.0 Yanlord n/a N(V) n/a 2.4 n/a n/a -58% n/a n/a 1.0 n/a 7% 7.5 6.9Simple average -14% 0% -14% 7.5 6.3
* Potential return equals the percentage difference between the current share price (as of 30 December 2011) and the target price, plus the forecast dividend yield
We initiated coverage of Yanlord stock in a separate note (Initiate N(V): In need of a strategic shift, 4 January 2012) Source: HSBC estimates
渐飞研究报告 - http://bg.panlv.net
abc
23
Financial Institutions Group China Real Estate 4 January 2012
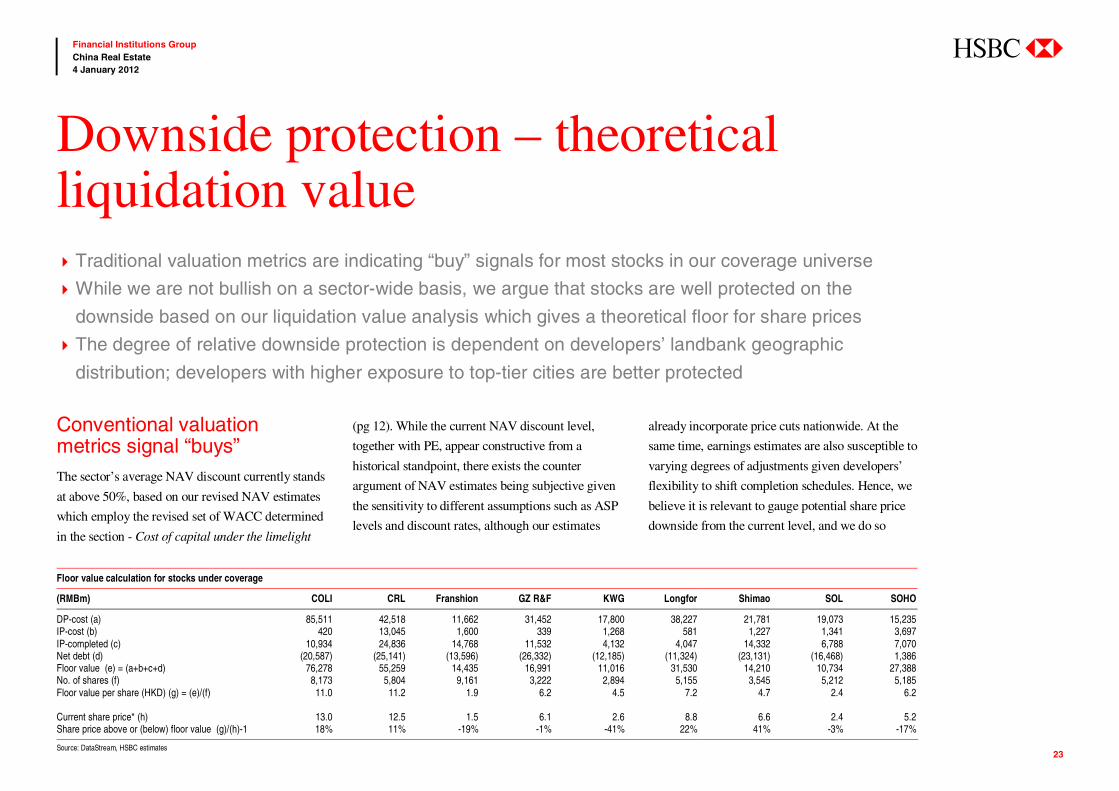
Conventional valuation metrics signal “buys” The sector’s average NAV discount currently stands
at above 50%, based on our revised NAV estimates
which employ the revised set of WACC determined
in the section - Cost of capital under the limelight
(pg 12). While the current NAV discount level,
together with PE, appear constructive from a
historical standpoint, there exists the counter
argument of NAV estimates being subjective given
the sensitivity to different assumptions such as ASP
levels and discount rates, although our estimates
already incorporate price cuts nationwide. At the
same time, earnings estimates are also susceptible to
varying degrees of adjustments given developers’
flexibility to shift completion schedules. Hence, we
believe it is relevant to gauge potential share price
downside from the current level, and we do so
Downside protection – theoretical liquidation value
Traditional valuation metrics are indicating “buy” signals for most stocks in our coverage universe
While we are not bullish on a sector-wide basis, we argue that stocks are well protected on the
downside based on our liquidation value analysis which gives a theoretical floor for share prices
The degree of relative downside protection is dependent on developers’ landbank geographic
distribution; developers with higher exposure to top-tier cities are better protected
Floor value calculation for stocks under coverage
(RMBm) COLI CRL Franshion GZ R&F KWG Longfor Shimao SOL SOHO
DP-cost (a) 85,511 42,518 11,662 31,452 17,800 38,227 21,781 19,073 15,235 IP-cost (b) 420 13,045 1,600 339 1,268 581 1,227 1,341 3,697 IP-completed (c) 10,934 24,836 14,768 11,532 4,132 4,047 14,332 6,788 7,070 Net debt (d) (20,587) (25,141) (13,596) (26,332) (12,185) (11,324) (23,131) (16,468) 1,386 Floor value (e) = (a+b+c+d) 76,278 55,259 14,435 16,991 11,016 31,530 14,210 10,734 27,388 No. of shares (f) 8,173 5,804 9,161 3,222 2,894 5,155 3,545 5,212 5,185 Floor value per share (HKD) (g) = (e)/(f) 11.0 11.2 1.9 6.2 4.5 7.2 4.7 2.4 6.2 Current share price* (h) 13.0 12.5 1.5 6.1 2.6 8.8 6.6 2.4 5.2Share price above or (below) floor value (g)/(h)-1 18% 11% -19% -1% -41% 22% 41% -3% -17%
Source: DataStream, HSBC estimates
渐飞研究报告 - http://bg.panlv.net
abc
24
Financial Institutions Group China Real Estate 4 January 2012
through a cost-based valuation method akin to a
liquidation analysis.
Deriving theoretical liquidation value Our liquidation analysis uses a cost-based
valuation metric to minimize assumptions used in
typical NAV estimates. This can also be
interpreted as the bear-case NAV, or floor value
for the stocks.
Our calculated floor values are largely reflective of
the sunk costs that developers have incurred, which
provides a tangible way of measuring a company’s
net worth. After summation of sunk cost
components, we subtract net debt from the
aggregate sunk cost to arrive at the final floor value.
Key assumptions and remarks:
Sunk costs include both land and construction
costs.
The sunk costs that we incorporate in the
calculation of a developers’ net worth is
dependent on the completion timeline on a
project-by-project basis, adjusted by an
accountability factor.
The accountability factor adjusts for the
difference in pre-sales timeline, as value
should not be attributed to projects that have
commenced pre-sale whereby the proceeds
have been captured on the balance sheet.
For development properties, the rule of thumb
is to account for costs that have been incurred
for projects which are currently on sale or
pending for pre-sale, as the sales proceeds
have yet to be recognized.
For IP under construction, sunk costs are
accounted for in a similar manner, based on
the projects’ all-in costs.
For completed IP, we value the assets based
on an income capitalization approach using
gross cap rates of 5-12%.
Having identified the cost-based valuation for
each of the property components discussed,
we apply a “haircut” to account for the
perception that the incremental costs of
acquiring new sites have fallen, and that
capital values of the completed IP have
declined, as market sentiment has
deteriorated.
The haircuts we apply are 30% and 50% for
values attributed to tier-1 and tier-2 cities,
respectively, while prospective values for
lower-tier cities have been omitted. This is
based on the premise that market clearance
prices for top-tier cities are more visible and
justifiable based on actual market
transactions, while price discovery in lower-
tier cities will become more difficult as
transaction volume drops
After summation of all sunk cost components,
we deduct the net debt (as at end-2011) to
arrive at the floor value, which should be
interpreted as the bear-case NAV.
As a side note, we use attributable values for our
floor value calculation as we do not believe
balance sheet items, presented on a consolidated
basis, are appropriate for this exercise.
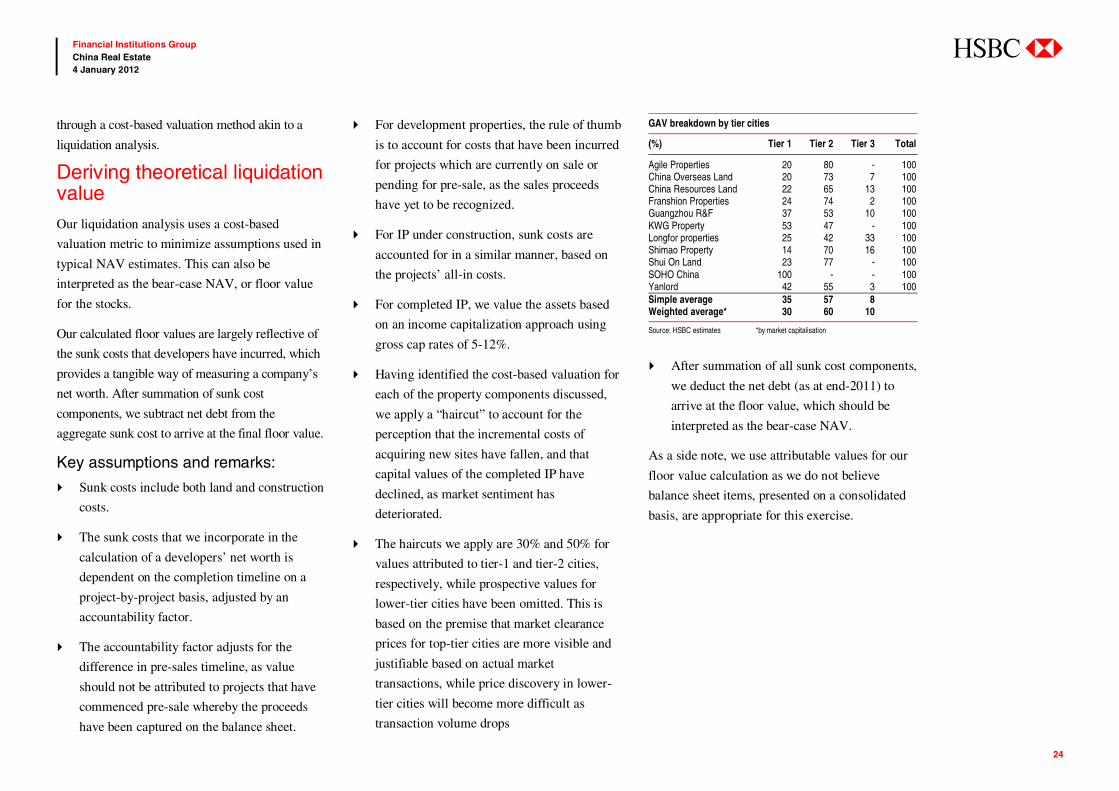
GAV breakdown by tier cities
(%) Tier 1 Tier 2 Tier 3 Total
Agile Properties 20 80 - 100China Overseas Land 20 73 7 100China Resources Land 22 65 13 100Franshion Properties 24 74 2 100Guangzhou R&F 37 53 10 100KWG Property 53 47 - 100Longfor properties 25 42 33 100Shimao Property 14 70 16 100Shui On Land 23 77 - 100SOHO China 100 - - 100Yanlord 42 55 3 100Simple average 35 57 8Weighted average* 30 60 10
Source: HSBC estimates *by market capitalisation
渐飞研究报告 - http://bg.panlv.net
abc
25
Financial Institutions Group China Real Estate 4 January 2012
Differentiation among developers Our methodology favours developers with higher
exposure to top-tier cities, due to higher visibility
on market clearing prices (of both properties and
raw sites), given the availability of more frequent
and transparent comparable transactions.
Visibility deteriorates in the lower-tier cities,
which makes it more difficult to grasp the
underlying true value.
Hence, we expect developers with mostly
exposure in higher-tier cities to offer a higher
degree of downside protection. Not surprisingly,
within our coverage universe, we find four stocks
are better placed: namely Franshion, KWG, Shui
On Land and Soho China, with current share
prices at or below our estimated floor values.
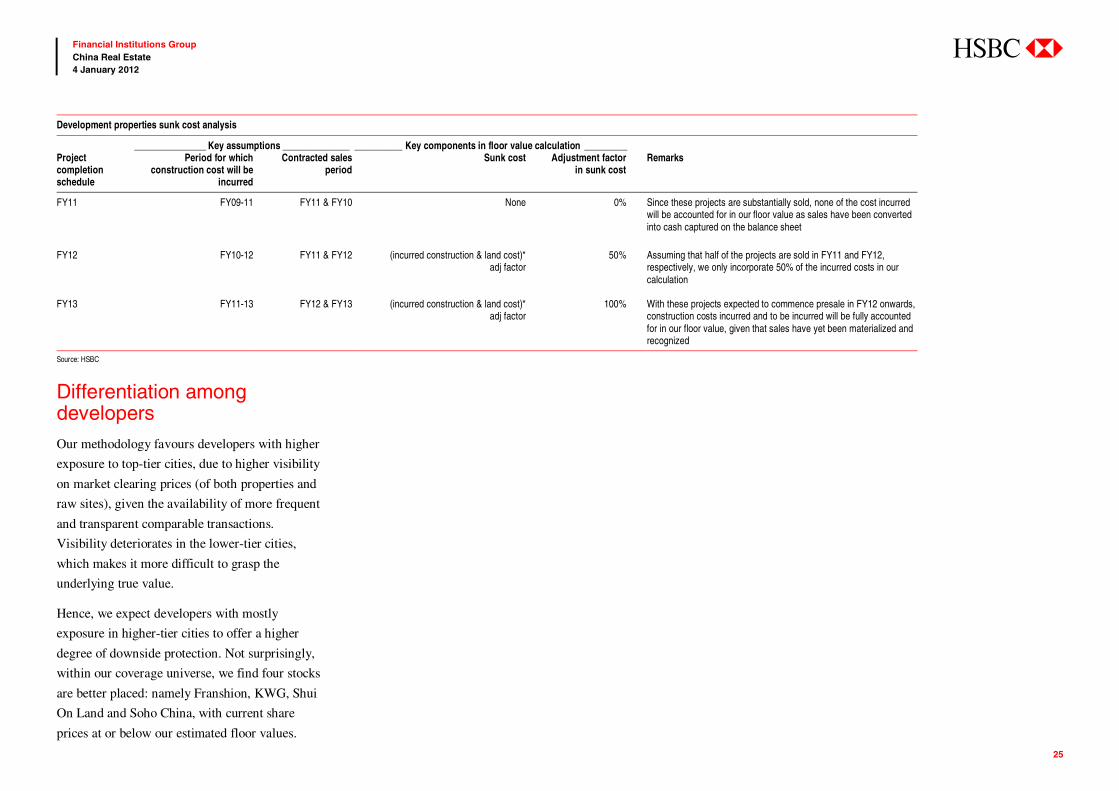
Development properties sunk cost analysis
_______________ Key assumptions ______________ __________ Key components in floor value calculation _________Project completion schedule
Period for which construction cost will be
incurred
Contracted sales period
Sunk cost Adjustment factor in sunk cost
Remarks
FY11 FY09-11 FY11 & FY10 None 0% Since these projects are substantially sold, none of the cost incurred will be accounted for in our floor value as sales have been converted into cash captured on the balance sheet
FY12 FY10-12 FY11 & FY12 (incurred construction & land cost)*
adj factor 50% Assuming that half of the projects are sold in FY11 and FY12,
respectively, we only incorporate 50% of the incurred costs in our calculation
FY13 FY11-13 FY12 & FY13 (incurred construction & land cost)*adj factor
100% With these projects expected to commence presale in FY12 onwards, construction costs incurred and to be incurred will be fully accounted for in our floor value, given that sales have yet been materialized and recognized
Source: HSBC
渐飞研究报告 - http://bg.panlv.net
abc
26
Financial Institutions Group China Real Estate 4 January 2012
Cash is king In the early evolution of the sector (2004-07)
much of the market’s focus was on a developer’s
ability to expand its landbank based on the
premise of “the bigger the better”. Hence, the
market attached a premium to developers with the
strongest purchasing power, resulting in the land
acquisition frenzy seen in 2007. During the credit
crisis of 2008, developers struggled to recapitalize
their balance sheets amid a backdrop of domestic
property tightening measures.
Investors have since placed increasing emphasis
on contracted sales and cash collection, as they
are key determinants of developers’ cash flow
management ability and will be of paramount
importance to “weather the storm”.
Balance sheets constrained, but no liquidity issue Against the backdrop of shrinking transaction
volumes, delayed cash receipts upon contracted
sales and a generally difficult financing
environment, balance sheet management will be
of rising importance for developers in 2012.
However, we deduce that the overall liquidity
position for the sector will remain manageable.
Our core cash flow analysis reveals that COLI,
Longfor and Agile are financially well equipped
to withstand unforeseen contracted sales shortfall,
while Shui On Land and Yanlord are under more
balance sheet strain. In this exercise, we have
assumed no cash outlay on new site acquisitions
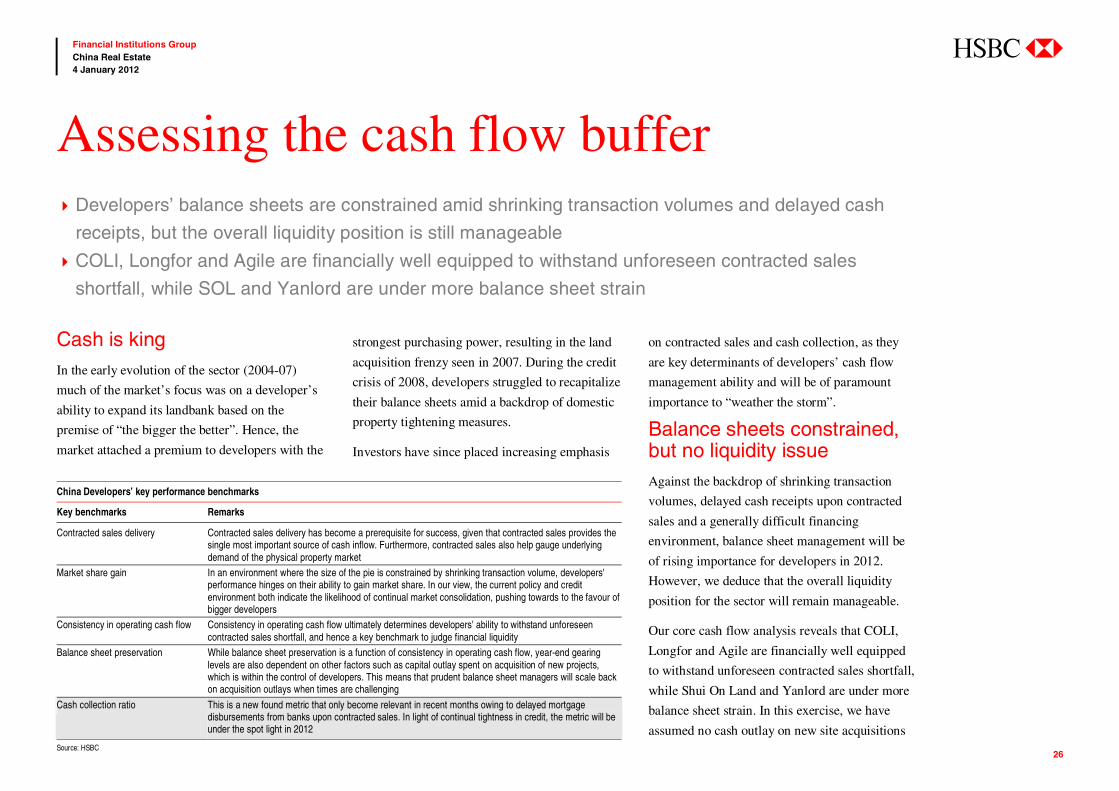
Assessing the cash flow buffer Developers’ balance sheets are constrained amid shrinking transaction volumes and delayed cash
receipts, but the overall liquidity position is still manageable
COLI, Longfor and Agile are financially well equipped to withstand unforeseen contracted sales
shortfall, while SOL and Yanlord are under more balance sheet strain
China Developers’ key performance benchmarks
Key benchmarks Remarks
Contracted sales delivery Contracted sales delivery has become a prerequisite for success, given that contracted sales provides the single most important source of cash inflow. Furthermore, contracted sales also help gauge underlying demand of the physical property market
Market share gain In an environment where the size of the pie is constrained by shrinking transaction volume, developers' performance hinges on their ability to gain market share. In our view, the current policy and credit environment both indicate the likelihood of continual market consolidation, pushing towards to the favour of bigger developers
Consistency in operating cash flow Consistency in operating cash flow ultimately determines developers' ability to withstand unforeseen contracted sales shortfall, and hence a key benchmark to judge financial liquidity
Balance sheet preservation While balance sheet preservation is a function of consistency in operating cash flow, year-end gearing levels are also dependent on other factors such as capital outlay spent on acquisition of new projects, which is within the control of developers. This means that prudent balance sheet managers will scale back on acquisition outlays when times are challenging
Cash collection ratio This is a new found metric that only become relevant in recent months owing to delayed mortgage disbursements from banks upon contracted sales. In light of continual tightness in credit, the metric will be under the spot light in 2012
Source: HSBC
渐飞研究报告 - http://bg.panlv.net
abc
27
Financial Institutions Group China Real Estate 4 January 2012
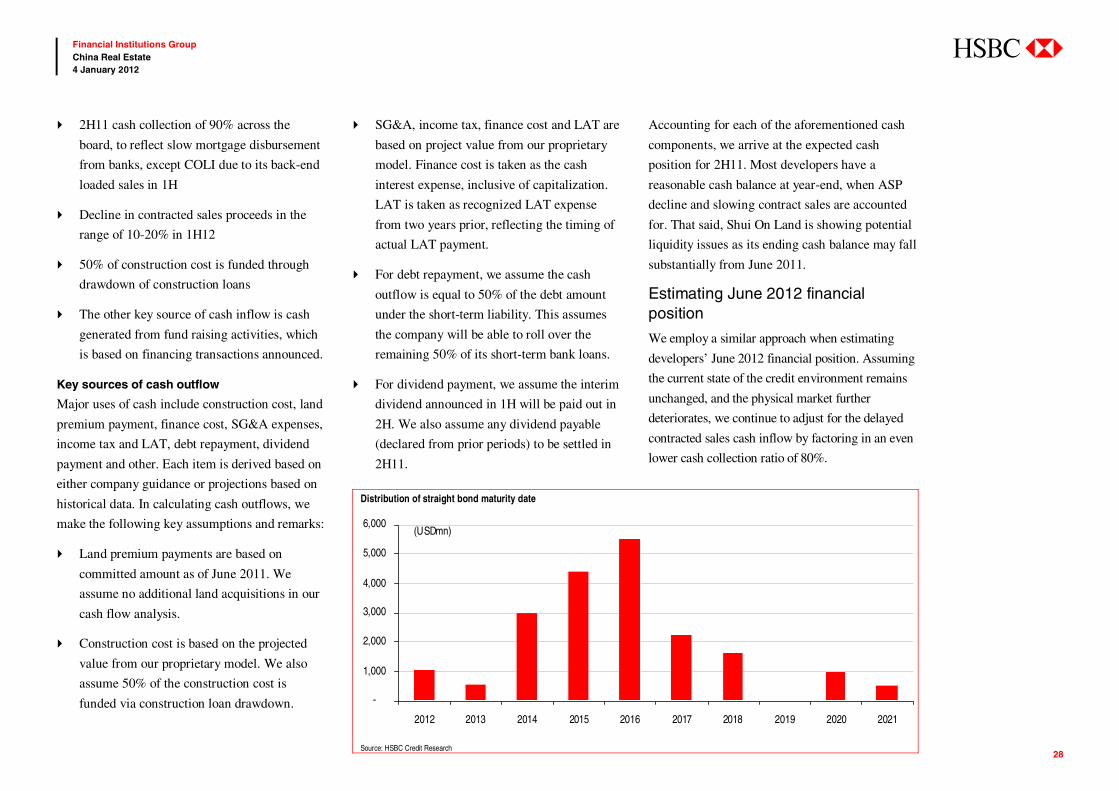
beyond that already committed. In addition, we
assume no significant long-term debt repayment
as the sector’s bond maturity profile is heavily
concentrated in 2014 and beyond.
Cash flow analysis methodology New factors imperative for consideration
Given the tight credit environment, we incorporate
two additional factors in our cash flow analysis:
cash collection rate and short-term debt repayment.
Cash collection ratio
Cash generated from contracted sales is not
equivalent to headline contracted sales due to
delayed mortgage disbursements from banks.
Assuming a disbursement delay of one month,
cash collection in 2H11 consists of contracted
sales realized from June to November 2011.
As banks are generally close to exhausting their
loan quota towards the end of the year,
disbursement delalys are gradaully lengething to
two months. Consequently, we expect cash
collection in 1H12 to comprise contracted sales
realized in the last two months of 2011 as well as
those generated from January to April 2012.
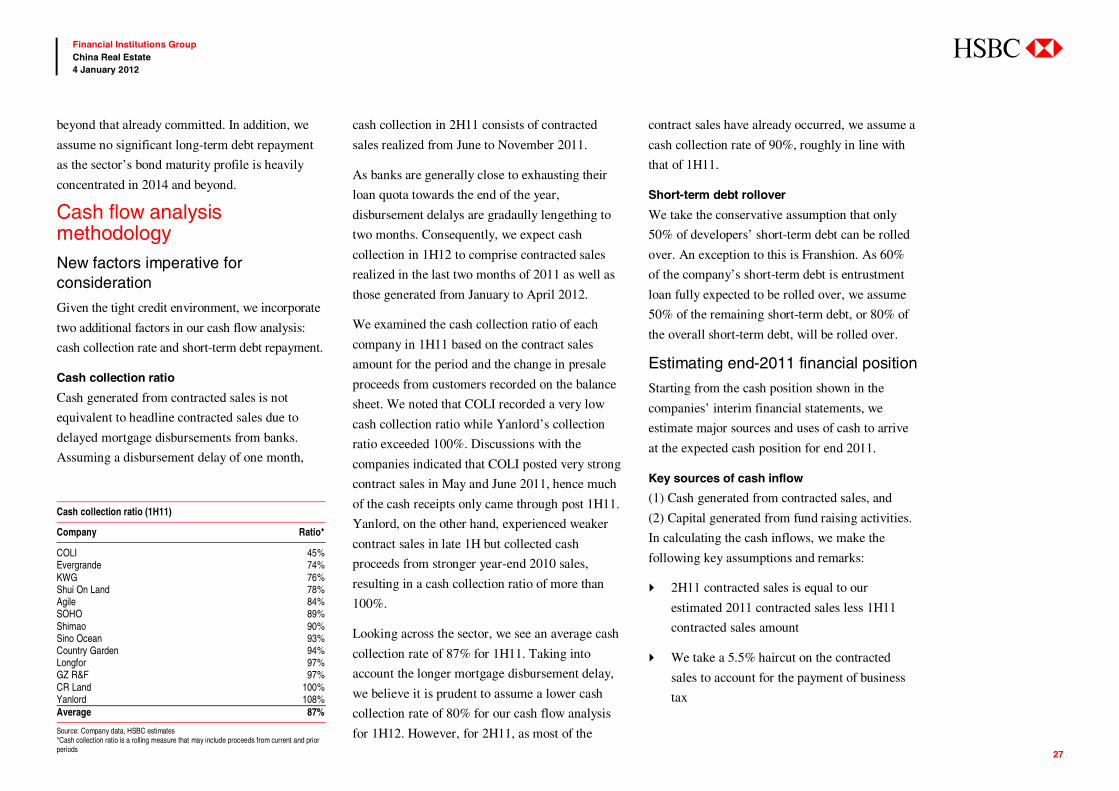
We examined the cash collection ratio of each
company in 1H11 based on the contract sales
amount for the period and the change in presale
proceeds from customers recorded on the balance
sheet. We noted that COLI recorded a very low
cash collection ratio while Yanlord’s collection
ratio exceeded 100%. Discussions with the
companies indicated that COLI posted very strong
contract sales in May and June 2011, hence much
of the cash receipts only came through post 1H11.
Yanlord, on the other hand, experienced weaker
contract sales in late 1H but collected cash
proceeds from stronger year-end 2010 sales,
resulting in a cash collection ratio of more than
100%.
Looking across the sector, we see an average cash
collection rate of 87% for 1H11. Taking into
account the longer mortgage disbursement delay,
we believe it is prudent to assume a lower cash
collection rate of 80% for our cash flow analysis
for 1H12. However, for 2H11, as most of the
contract sales have already occurred, we assume a
cash collection rate of 90%, roughly in line with
that of 1H11.
Short-term debt rollover
We take the conservative assumption that only
50% of developers’ short-term debt can be rolled
over. An exception to this is Franshion. As 60%
of the company’s short-term debt is entrustment
loan fully expected to be rolled over, we assume
50% of the remaining short-term debt, or 80% of
the overall short-term debt, will be rolled over.
Estimating end-2011 financial position
Starting from the cash position shown in the
companies’ interim financial statements, we
estimate major sources and uses of cash to arrive
at the expected cash position for end 2011.
Key sources of cash inflow
(1) Cash generated from contracted sales, and
(2) Capital generated from fund raising activities.
In calculating the cash inflows, we make the
following key assumptions and remarks:
2H11 contracted sales is equal to our
estimated 2011 contracted sales less 1H11
contracted sales amount
We take a 5.5% haircut on the contracted
sales to account for the payment of business
tax
Cash collection ratio (1H11)
Company Ratio*
COLI 45% Evergrande 74% KWG 76% Shui On Land 78% Agile 84% SOHO 89% Shimao 90% Sino Ocean 93% Country Garden 94% Longfor 97% GZ R&F 97% CR Land 100% Yanlord 108% Average 87%
Source: Company data, HSBC estimates *Cash collection ratio is a rolling measure that may include proceeds from current and prior periods
渐飞研究报告 - http://bg.panlv.net
abc
28
Financial Institutions Group China Real Estate 4 January 2012
2H11 cash collection of 90% across the
board, to reflect slow mortgage disbursement
from banks, except COLI due to its back-end
loaded sales in 1H
Decline in contracted sales proceeds in the
range of 10-20% in 1H12
50% of construction cost is funded through
drawdown of construction loans
The other key source of cash inflow is cash
generated from fund raising activities, which
is based on financing transactions announced.
Key sources of cash outflow
Major uses of cash include construction cost, land
premium payment, finance cost, SG&A expenses,
income tax and LAT, debt repayment, dividend
payment and other. Each item is derived based on
either company guidance or projections based on
historical data. In calculating cash outflows, we
make the following key assumptions and remarks:
Land premium payments are based on
committed amount as of June 2011. We
assume no additional land acquisitions in our
cash flow analysis.
Construction cost is based on the projected
value from our proprietary model. We also
assume 50% of the construction cost is
funded via construction loan drawdown.
SG&A, income tax, finance cost and LAT are
based on project value from our proprietary
model. Finance cost is taken as the cash
interest expense, inclusive of capitalization.
LAT is taken as recognized LAT expense
from two years prior, reflecting the timing of
actual LAT payment.
For debt repayment, we assume the cash
outflow is equal to 50% of the debt amount
under the short-term liability. This assumes
the company will be able to roll over the
remaining 50% of its short-term bank loans.
For dividend payment, we assume the interim
dividend announced in 1H will be paid out in
2H. We also assume any dividend payable
(declared from prior periods) to be settled in
2H11.
Accounting for each of the aforementioned cash
components, we arrive at the expected cash
position for 2H11. Most developers have a
reasonable cash balance at year-end, when ASP
decline and slowing contract sales are accounted
for. That said, Shui On Land is showing potential
liquidity issues as its ending cash balance may fall
substantially from June 2011.
Estimating June 2012 financial position
We employ a similar approach when estimating
developers’ June 2012 financial position. Assuming
the current state of the credit environment remains
unchanged, and the physical market further
deteriorates, we continue to adjust for the delayed
contracted sales cash inflow by factoring in an even
lower cash collection ratio of 80%.
Distribution of straight bond maturity date
-
1,000
2,000
3,000
4,000
5,000
6,000
2012 2013 2014 2015 2016 2017 2018 2019 2020 2021
(USDmn)
Source: HSBC Credit Research
渐飞研究报告 - http://bg.panlv.net
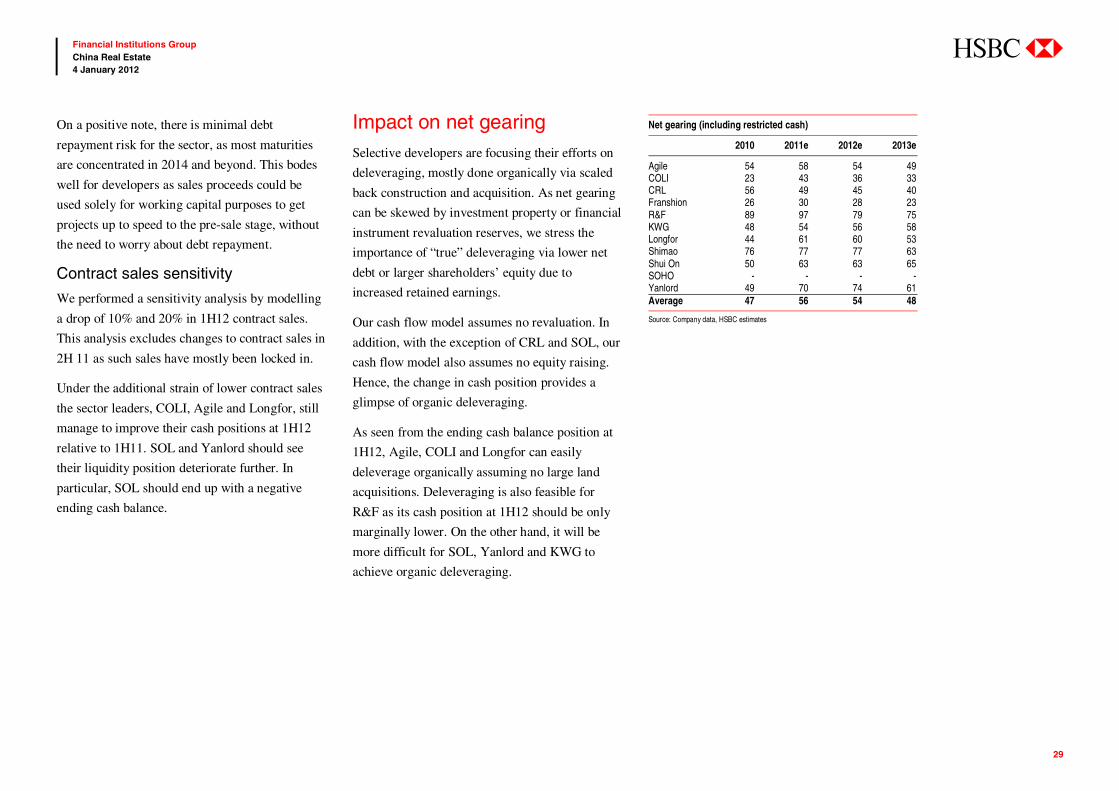
abc
29
Financial Institutions Group China Real Estate 4 January 2012
On a positive note, there is minimal debt
repayment risk for the sector, as most maturities
are concentrated in 2014 and beyond. This bodes
well for developers as sales proceeds could be
used solely for working capital purposes to get
projects up to speed to the pre-sale stage, without
the need to worry about debt repayment.
Contract sales sensitivity
We performed a sensitivity analysis by modelling
a drop of 10% and 20% in 1H12 contract sales.
This analysis excludes changes to contract sales in
2H 11 as such sales have mostly been locked in.
Under the additional strain of lower contract sales
the sector leaders, COLI, Agile and Longfor, still
manage to improve their cash positions at 1H12
relative to 1H11. SOL and Yanlord should see
their liquidity position deteriorate further. In
particular, SOL should end up with a negative
ending cash balance.
Impact on net gearing Selective developers are focusing their efforts on
deleveraging, mostly done organically via scaled
back construction and acquisition. As net gearing
can be skewed by investment property or financial
instrument revaluation reserves, we stress the
importance of “true” deleveraging via lower net
debt or larger shareholders’ equity due to
increased retained earnings.
Our cash flow model assumes no revaluation. In
addition, with the exception of CRL and SOL, our
cash flow model also assumes no equity raising.
Hence, the change in cash position provides a
glimpse of organic deleveraging.
As seen from the ending cash balance position at
1H12, Agile, COLI and Longfor can easily
deleverage organically assuming no large land
acquisitions. Deleveraging is also feasible for
R&F as its cash position at 1H12 should be only
marginally lower. On the other hand, it will be
more difficult for SOL, Yanlord and KWG to
achieve organic deleveraging.
Net gearing (including restricted cash)
2010 2011e 2012e 2013e
Agile 54 58 54 49 COLI 23 43 36 33 CRL 56 49 45 40 Franshion 26 30 28 23 R&F 89 97 79 75 KWG 48 54 56 58 Longfor 44 61 60 53 Shimao 76 77 77 63 Shui On 50 63 63 65 SOHO - - - -Yanlord 49 70 74 61 Average 47 56 54 48
Source: Company data, HSBC estimates
渐飞研究报告 - http://bg.panlv.net
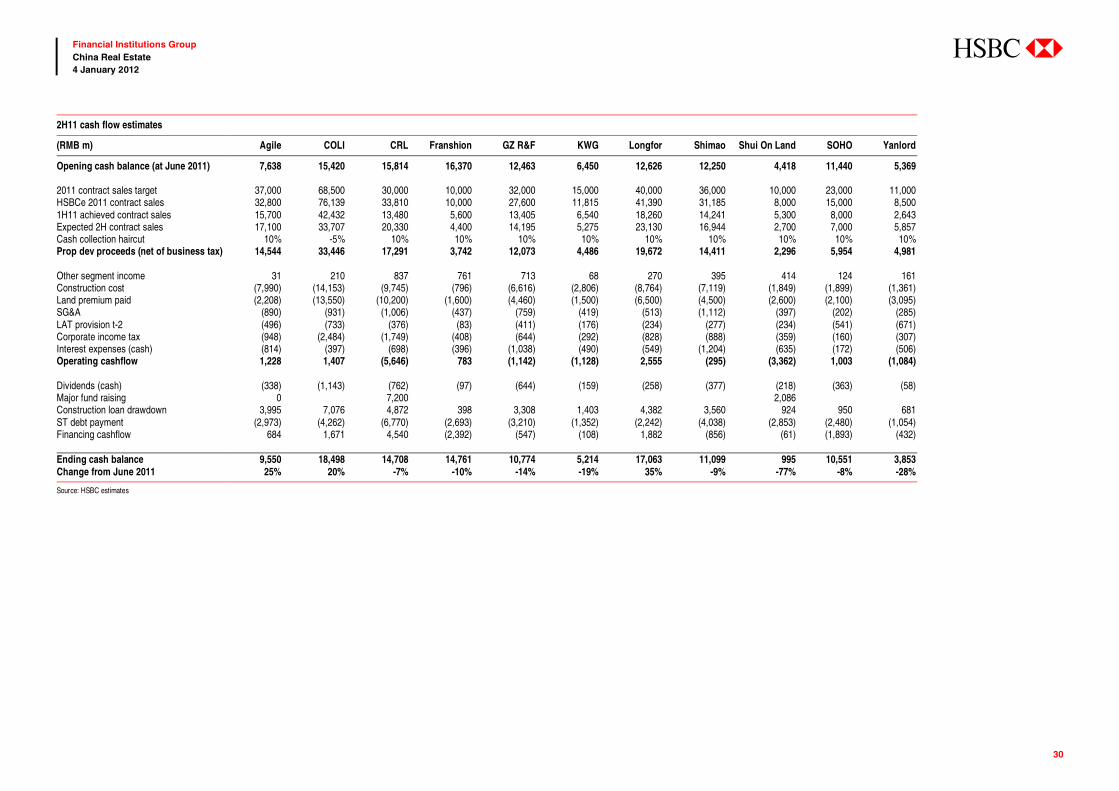
abc
30
Financial Institutions Group China Real Estate 4 January 2012
2H11 cash flow estimates
(RMB m) Agile COLI CRL Franshion GZ R&F KWG Longfor Shimao Shui On Land SOHO Yanlord
Opening cash balance (at June 2011) 7,638 15,420 15,814 16,370 12,463 6,450 12,626 12,250 4,418 11,440 5,369 2011 contract sales target 37,000 68,500 30,000 10,000 32,000 15,000 40,000 36,000 10,000 23,000 11,000 HSBCe 2011 contract sales 32,800 76,139 33,810 10,000 27,600 11,815 41,390 31,185 8,000 15,000 8,500 1H11 achieved contract sales 15,700 42,432 13,480 5,600 13,405 6,540 18,260 14,241 5,300 8,000 2,643 Expected 2H contract sales 17,100 33,707 20,330 4,400 14,195 5,275 23,130 16,944 2,700 7,000 5,857 Cash collection haircut 10% -5% 10% 10% 10% 10% 10% 10% 10% 10% 10%Prop dev proceeds (net of business tax) 14,544 33,446 17,291 3,742 12,073 4,486 19,672 14,411 2,296 5,954 4,981 Other segment income 31 210 837 761 713 68 270 395 414 124 161 Construction cost (7,990) (14,153) (9,745) (796) (6,616) (2,806) (8,764) (7,119) (1,849) (1,899) (1,361)Land premium paid (2,208) (13,550) (10,200) (1,600) (4,460) (1,500) (6,500) (4,500) (2,600) (2,100) (3,095)SG&A (890) (931) (1,006) (437) (759) (419) (513) (1,112) (397) (202) (285)LAT provision t-2 (496) (733) (376) (83) (411) (176) (234) (277) (234) (541) (671)Corporate income tax (948) (2,484) (1,749) (408) (644) (292) (828) (888) (359) (160) (307)Interest expenses (cash) (814) (397) (698) (396) (1,038) (490) (549) (1,204) (635) (172) (506)Operating cashflow 1,228 1,407 (5,646) 783 (1,142) (1,128) 2,555 (295) (3,362) 1,003 (1,084) Dividends (cash) (338) (1,143) (762) (97) (644) (159) (258) (377) (218) (363) (58)Major fund raising 0 7,200 2,086 Construction loan drawdown 3,995 7,076 4,872 398 3,308 1,403 4,382 3,560 924 950 681 ST debt payment (2,973) (4,262) (6,770) (2,693) (3,210) (1,352) (2,242) (4,038) (2,853) (2,480) (1,054)Financing cashflow 684 1,671 4,540 (2,392) (547) (108) 1,882 (856) (61) (1,893) (432) Ending cash balance 9,550 18,498 14,708 14,761 10,774 5,214 17,063 11,099 995 10,551 3,853 Change from June 2011 25% 20% -7% -10% -14% -19% 35% -9% -77% -8% -28%
Source: HSBC estimates
渐飞研究报告 - http://bg.panlv.net
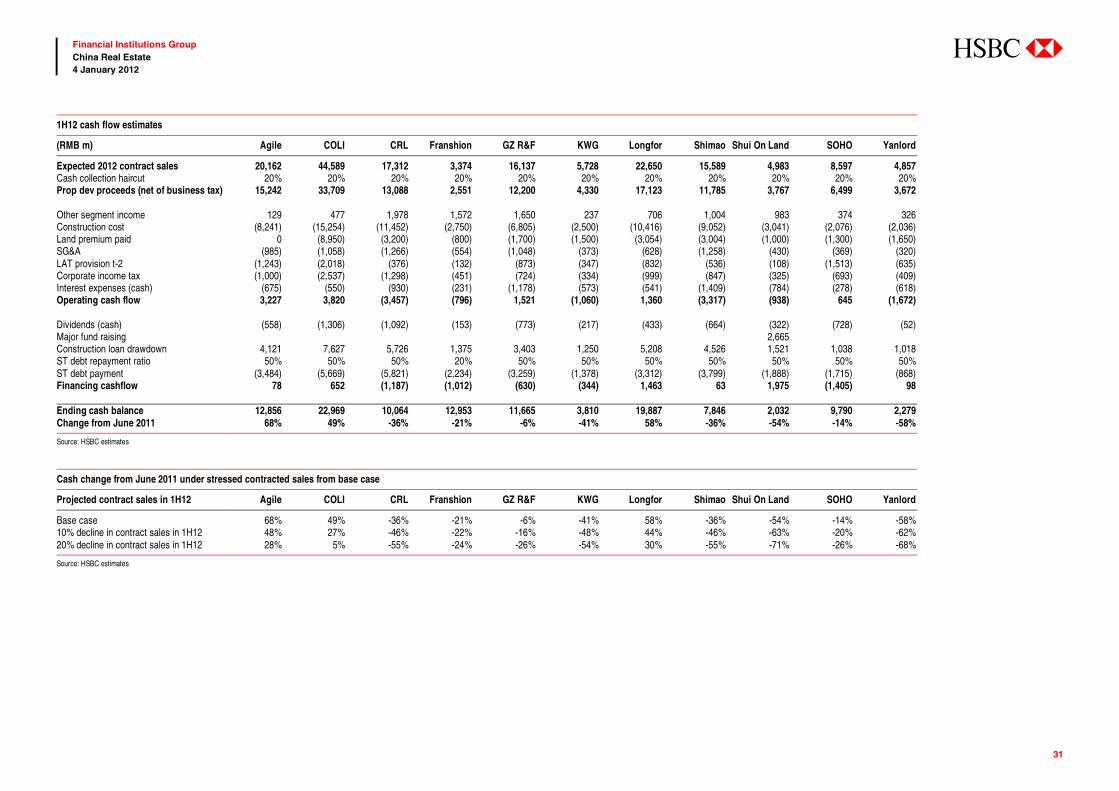
abc
31
Financial Institutions Group China Real Estate 4 January 2012
Cash change from June 2011 under stressed contracted sales from base case
Projected contract sales in 1H12 Agile COLI CRL Franshion GZ R&F KWG Longfor Shimao Shui On Land SOHO Yanlord
Base case 68% 49% -36% -21% -6% -41% 58% -36% -54% -14% -58%10% decline in contract sales in 1H12 48% 27% -46% -22% -16% -48% 44% -46% -63% -20% -62%20% decline in contract sales in 1H12 28% 5% -55% -24% -26% -54% 30% -55% -71% -26% -68%
Source: HSBC estimates
1H12 cash flow estimates
(RMB m) Agile COLI CRL Franshion GZ R&F KWG Longfor Shimao Shui On Land SOHO Yanlord
Expected 2012 contract sales 20,162 44,589 17,312 3,374 16,137 5,728 22,650 15,589 4,983 8,597 4,857 Cash collection haircut 20% 20% 20% 20% 20% 20% 20% 20% 20% 20% 20%Prop dev proceeds (net of business tax) 15,242 33,709 13,088 2,551 12,200 4,330 17,123 11,785 3,767 6,499 3,672 Other segment income 129 477 1,978 1,572 1,650 237 706 1,004 983 374 326 Construction cost (8,241) (15,254) (11,452) (2,750) (6,805) (2,500) (10,416) (9,052) (3,041) (2,076) (2,036)Land premium paid 0 (8,950) (3,200) (800) (1,700) (1,500) (3,054) (3,004) (1,000) (1,300) (1,650)SG&A (985) (1,058) (1,266) (554) (1,048) (373) (628) (1,258) (430) (369) (320)LAT provision t-2 (1,243) (2,018) (376) (132) (873) (347) (832) (536) (108) (1,513) (635)Corporate income tax (1,000) (2,537) (1,298) (451) (724) (334) (999) (847) (325) (693) (409)Interest expenses (cash) (675) (550) (930) (231) (1,178) (573) (541) (1,409) (784) (278) (618)Operating cash flow 3,227 3,820 (3,457) (796) 1,521 (1,060) 1,360 (3,317) (938) 645 (1,672) Dividends (cash) (558) (1,306) (1,092) (153) (773) (217) (433) (664) (322) (728) (52)Major fund raising 2,665Construction loan drawdown 4,121 7,627 5,726 1,375 3,403 1,250 5,208 4,526 1,521 1,038 1,018 ST debt repayment ratio 50% 50% 50% 20% 50% 50% 50% 50% 50% 50% 50%ST debt payment (3,484) (5,669) (5,821) (2,234) (3,259) (1,378) (3,312) (3,799) (1,888) (1,715) (868)Financing cashflow 78 652 (1,187) (1,012) (630) (344) 1,463 63 1,975 (1,405) 98 Ending cash balance 12,856 22,969 10,064 12,953 11,665 3,810 19,887 7,846 2,032 9,790 2,279 Change from June 2011 68% 49% -36% -21% -6% -41% 58% -36% -54% -14% -58%
Source: HSBC estimates
渐飞研究报告 - http://bg.panlv.net
abc
32
Financial Institutions Group China Real Estate 4 January 2012
The government wants strong growth and housing affordability
The central government’s goal of continued
tightening of the real estate sector is to ensure
affordable housing for its growing urban
population. Along with strong economic growth,
reasonable housing prices are a key piece of the
government’s effort to promote social stability.
We expect the government to be more cautious
and selective this time given its experience with
broad expansionary policies in the aftermath of the
global financial crisis when housing prices rose at
an unprecedented rate, leading to widespread
speculation and discontent across Chinese cities.
To the extent that the recent monetary easing may
have a contradictory effect on housing affordability,
we expect the government to fully utilize other tools
to counter this and to protect its success in cooling
down a stubbornly strong housing market.
Many tools in the tool box
The government wields many tools to manage the
economy. Not surprisingly, the market focuses its
attention on the most broad-based tools such as
monetary policy.
The government will continue to restrict credit
access to the developers through bank lending
quota as well as measures to deter the flow of
entrusted loans and trust loans.
The government will continue to shape the banks’
underwriting policies to promote lower loan-to-
value ratio, a higher proportion of loans to first-
time home buyers, and mortgages for small and
medium home purchases.
On the structural side, the government will
gradually roll out property tax across more cities as
the pilot program in Chongqing and Shanghai has
proven to be successful. A broad implementation of
a properly designed property tax program would
increase holding cost and deter speculation. We
believe it is a step in the right direction to diversify
local governments’ funding sources, especially
away from traditional land sale revenue.
Lastly, while not a market-based measure, HPR
remains a potent tool. While many cities face the
expiration of HPR at the end of 2011, the central
government has stated unequivocally that HPR
shall be extended until further notice.
Policy burden here to stay; operation and cost of capital matter more
While macro policies may change, the policy
burden on the sector should remain. We believe
housing affordability is a long-term goal of the
government which is not easily swayed by the
undulation of an economic cycle. As such, we
argue that while the overall sector may continue
to be subdued, the more dynamic players are
looking beyond the policy unknown. Instead they
Be realistic on policy expectations Housing sector-specific administrative policies are unlikely to be reversed any time soon, despite
signs of monetary easing
Policy environment is conducive to accelerating industry consolidation
Assuming administrative policy status quo in our industry assumptions and stock picking criteria
渐飞研究报告 - http://bg.panlv.net
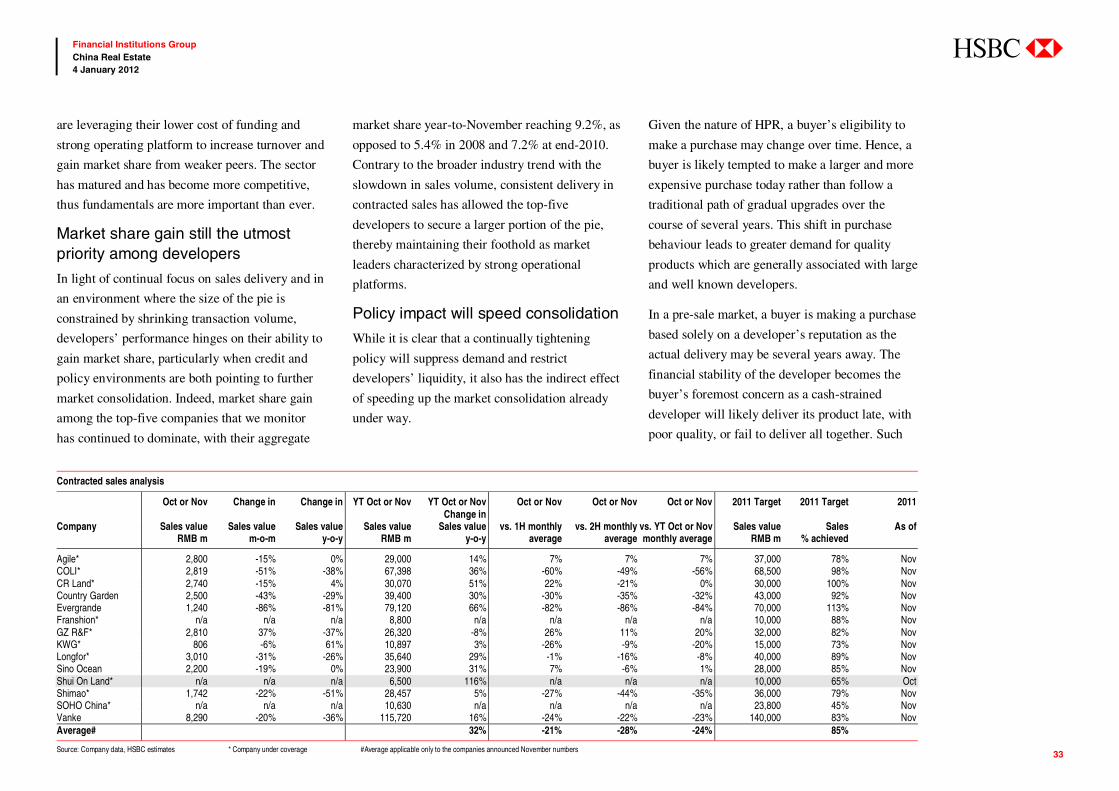
abc
33
Financial Institutions Group China Real Estate 4 January 2012
are leveraging their lower cost of funding and
strong operating platform to increase turnover and
gain market share from weaker peers. The sector
has matured and has become more competitive,
thus fundamentals are more important than ever.
Market share gain still the utmost priority among developers
In light of continual focus on sales delivery and in
an environment where the size of the pie is
constrained by shrinking transaction volume,
developers’ performance hinges on their ability to
gain market share, particularly when credit and
policy environments are both pointing to further
market consolidation. Indeed, market share gain
among the top-five companies that we monitor
has continued to dominate, with their aggregate
market share year-to-November reaching 9.2%, as
opposed to 5.4% in 2008 and 7.2% at end-2010.
Contrary to the broader industry trend with the
slowdown in sales volume, consistent delivery in
contracted sales has allowed the top-five
developers to secure a larger portion of the pie,
thereby maintaining their foothold as market
leaders characterized by strong operational
platforms.
Policy impact will speed consolidation
While it is clear that a continually tightening
policy will suppress demand and restrict
developers’ liquidity, it also has the indirect effect
of speeding up the market consolidation already
under way.
Given the nature of HPR, a buyer’s eligibility to
make a purchase may change over time. Hence, a
buyer is likely tempted to make a larger and more
expensive purchase today rather than follow a
traditional path of gradual upgrades over the
course of several years. This shift in purchase
behaviour leads to greater demand for quality
products which are generally associated with large
and well known developers.
In a pre-sale market, a buyer is making a purchase
based solely on a developer’s reputation as the
actual delivery may be several years away. The
financial stability of the developer becomes the
buyer’s foremost concern as a cash-strained
developer will likely deliver its product late, with
poor quality, or fail to deliver all together. Such
Contracted sales analysis
Oct or Nov Change in Change in YT Oct or Nov YT Oct or Nov Change in
Oct or Nov Oct or Nov Oct or Nov 2011 Target 2011 Target 2011
Company Sales value RMB m
Sales value m-o-m
Sales value y-o-y
Sales value RMB m
Sales value y-o-y
vs. 1H monthly average
vs. 2H monthly average
vs. YT Oct or Novmonthly average
Sales value RMB m
Sales % achieved
As of
Agile* 2,800 -15% 0% 29,000 14% 7% 7% 7% 37,000 78% NovCOLI* 2,819 -51% -38% 67,398 36% -60% -49% -56% 68,500 98% NovCR Land* 2,740 -15% 4% 30,070 51% 22% -21% 0% 30,000 100% NovCountry Garden 2,500 -43% -29% 39,400 30% -30% -35% -32% 43,000 92% NovEvergrande 1,240 -86% -81% 79,120 66% -82% -86% -84% 70,000 113% NovFranshion* n/a n/a n/a 8,800 n/a n/a n/a n/a 10,000 88% NovGZ R&F* 2,810 37% -37% 26,320 -8% 26% 11% 20% 32,000 82% NovKWG* 806 -6% 61% 10,897 3% -26% -9% -20% 15,000 73% NovLongfor* 3,010 -31% -26% 35,640 29% -1% -16% -8% 40,000 89% NovSino Ocean 2,200 -19% 0% 23,900 31% 7% -6% 1% 28,000 85% NovShui On Land* n/a n/a n/a 6,500 116% n/a n/a n/a 10,000 65% OctShimao* 1,742 -22% -51% 28,457 5% -27% -44% -35% 36,000 79% NovSOHO China* n/a n/a n/a 10,630 n/a n/a n/a n/a 23,800 45% NovVanke 8,290 -20% -36% 115,720 16% -24% -22% -23% 140,000 83% NovAverage# 32% -21% -28% -24% 85%
Source: Company data, HSBC estimates * Company under coverage #Average applicable only to the companies announced November numbers
渐飞研究报告 - http://bg.panlv.net
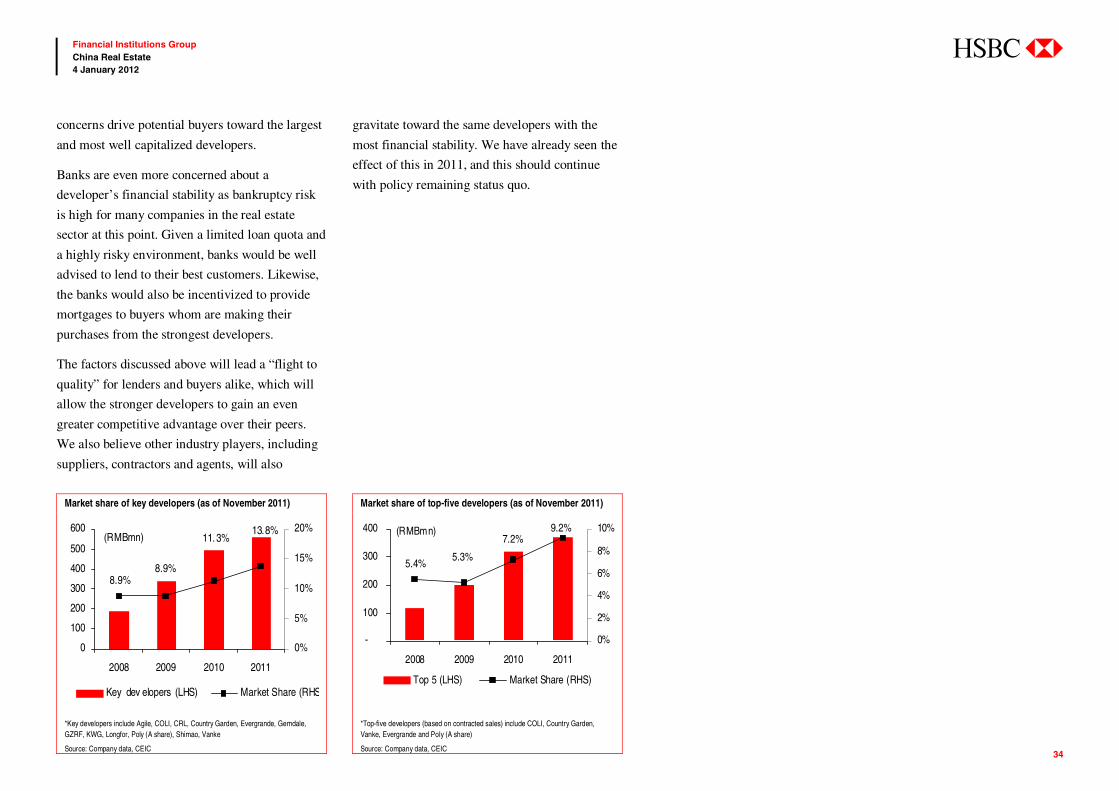
abc
34
Financial Institutions Group China Real Estate 4 January 2012
concerns drive potential buyers toward the largest
and most well capitalized developers.
Banks are even more concerned about a
developer’s financial stability as bankruptcy risk
is high for many companies in the real estate
sector at this point. Given a limited loan quota and
a highly risky environment, banks would be well
advised to lend to their best customers. Likewise,
the banks would also be incentivized to provide
mortgages to buyers whom are making their
purchases from the strongest developers.
The factors discussed above will lead a “flight to
quality” for lenders and buyers alike, which will
allow the stronger developers to gain an even
greater competitive advantage over their peers.
We also believe other industry players, including
suppliers, contractors and agents, will also
gravitate toward the same developers with the
most financial stability. We have already seen the
effect of this in 2011, and this should continue
with policy remaining status quo.
Market share of key developers (as of November 2011) Market share of top-five developers (as of November 2011)
13.8%
11.3%
8.9%8.9%
0
100
200
300
400
500
600
2008 2009 2010 2011
0%
5%
10%
15%
20%
Key dev elopers (LHS) Market Share (RHS
(RMBmn)
5.4%5.3%
7.2%9.2%
-
100
200
300
400
2008 2009 2010 2011
0%
2%
4%
6%
8%
10%
Top 5 (LHS) Market Share (RHS)
(RMBmn)
*Key developers include Agile, COLI, CRL, Country Garden, Evergrande, Gemdale, GZRF, KWG, Longfor, Poly (A share), Shimao, Vanke
Source: Company data, CEIC
*Top-five developers (based on contracted sales) include COLI, Country Garden, Vanke, Evergrande and Poly (A share)
Source: Company data, CEIC
渐飞研究报告 - http://bg.panlv.net
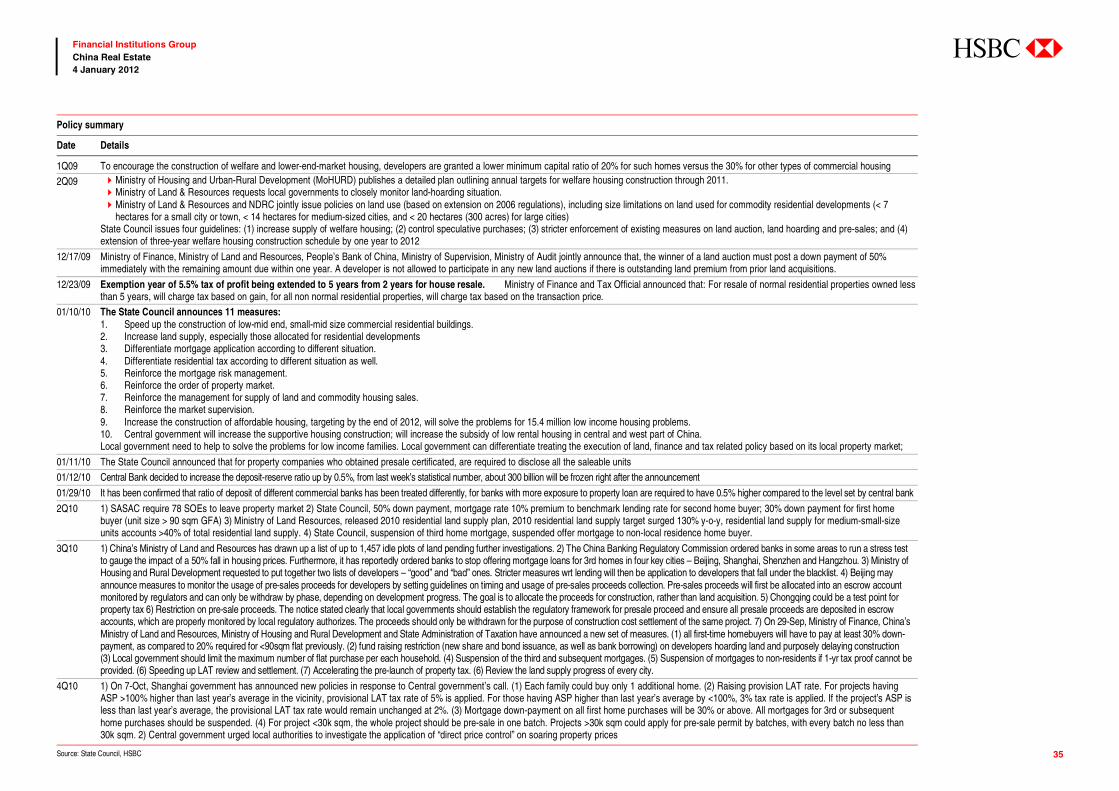
abc
35
Financial Institutions Group China Real Estate 4 January 2012
Policy summary
Date Details
1Q09 To encourage the construction of welfare and lower-end-market housing, developers are granted a lower minimum capital ratio of 20% for such homes versus the 30% for other types of commercial housing
2Q09 Ministry of Housing and Urban-Rural Development (MoHURD) publishes a detailed plan outlining annual targets for welfare housing construction through 2011. Ministry of Land & Resources requests local governments to closely monitor land-hoarding situation. Ministry of Land & Resources and NDRC jointly issue policies on land use (based on extension on 2006 regulations), including size limitations on land used for commodity residential developments (< 7 hectares for a small city or town, < 14 hectares for medium-sized cities, and < 20 hectares (300 acres) for large cities)
State Council issues four guidelines: (1) increase supply of welfare housing; (2) control speculative purchases; (3) stricter enforcement of existing measures on land auction, land hoarding and pre-sales; and (4) extension of three-year welfare housing construction schedule by one year to 2012
12/17/09 Ministry of Finance, Ministry of Land and Resources, People’s Bank of China, Ministry of Supervision, Ministry of Audit jointly announce that, the winner of a land auction must post a down payment of 50% immediately with the remaining amount due within one year. A developer is not allowed to participate in any new land auctions if there is outstanding land premium from prior land acquisitions.
12/23/09 Exemption year of 5.5% tax of profit being extended to 5 years from 2 years for house resale. Ministry of Finance and Tax Official announced that: For resale of normal residential properties owned less than 5 years, will charge tax based on gain, for all non normal residential properties, will charge tax based on the transaction price.
01/10/10 The State Council announces 11 measures: 1. Speed up the construction of low-mid end, small-mid size commercial residential buildings. 2. Increase land supply, especially those allocated for residential developments 3. Differentiate mortgage application according to different situation. 4. Differentiate residential tax according to different situation as well. 5. Reinforce the mortgage risk management. 6. Reinforce the order of property market. 7. Reinforce the management for supply of land and commodity housing sales. 8. Reinforce the market supervision. 9. Increase the construction of affordable housing, targeting by the end of 2012, will solve the problems for 15.4 million low income housing problems. 10. Central government will increase the supportive housing construction; will increase the subsidy of low rental housing in central and west part of China. Local government need to help to solve the problems for low income families. Local government can differentiate treating the execution of land, finance and tax related policy based on its local property market;
01/11/10 The State Council announced that for property companies who obtained presale certificated, are required to disclose all the saleable units
01/12/10 Central Bank decided to increase the deposit-reserve ratio up by 0.5%, from last week’s statistical number, about 300 billion will be frozen right after the announcement
01/29/10 It has been confirmed that ratio of deposit of different commercial banks has been treated differently, for banks with more exposure to property loan are required to have 0.5% higher compared to the level set by central bank
2Q10 1) SASAC require 78 SOEs to leave property market 2) State Council, 50% down payment, mortgage rate 10% premium to benchmark lending rate for second home buyer; 30% down payment for first home buyer (unit size > 90 sqm GFA) 3) Ministry of Land Resources, released 2010 residential land supply plan, 2010 residential land supply target surged 130% y-o-y, residential land supply for medium-small-size units accounts >40% of total residential land supply. 4) State Council, suspension of third home mortgage, suspended offer mortgage to non-local residence home buyer.
3Q10 1) China’s Ministry of Land and Resources has drawn up a list of up to 1,457 idle plots of land pending further investigations. 2) The China Banking Regulatory Commission ordered banks in some areas to run a stress test to gauge the impact of a 50% fall in housing prices. Furthermore, it has reportedly ordered banks to stop offering mortgage loans for 3rd homes in four key cities – Beijing, Shanghai, Shenzhen and Hangzhou. 3) Ministry of Housing and Rural Development requested to put together two lists of developers – “good” and “bad” ones. Stricter measures wrt lending will then be application to developers that fall under the blacklist. 4) Beijing may announce measures to monitor the usage of pre-sales proceeds for developers by setting guidelines on timing and usage of pre-sales proceeds collection. Pre-sales proceeds will first be allocated into an escrow account monitored by regulators and can only be withdraw by phase, depending on development progress. The goal is to allocate the proceeds for construction, rather than land acquisition. 5) Chongqing could be a test point for property tax 6) Restriction on pre-sale proceeds. The notice stated clearly that local governments should establish the regulatory framework for presale proceed and ensure all presale proceeds are deposited in escrow accounts, which are properly monitored by local regulatory authorizes. The proceeds should only be withdrawn for the purpose of construction cost settlement of the same project. 7) On 29-Sep, Ministry of Finance, China’s Ministry of Land and Resources, Ministry of Housing and Rural Development and State Administration of Taxation have announced a new set of measures. (1) all first-time homebuyers will have to pay at least 30% down-payment, as compared to 20% required for <90sqm flat previously. (2) fund raising restriction (new share and bond issuance, as well as bank borrowing) on developers hoarding land and purposely delaying construction (3) Local government should limit the maximum number of flat purchase per each household. (4) Suspension of the third and subsequent mortgages. (5) Suspension of mortgages to non-residents if 1-yr tax proof cannot be provided. (6) Speeding up LAT review and settlement. (7) Accelerating the pre-launch of property tax. (6) Review the land supply progress of every city.
4Q10 1) On 7-Oct, Shanghai government has announced new policies in response to Central government’s call. (1) Each family could buy only 1 additional home. (2) Raising provision LAT rate. For projects having ASP >100% higher than last year’s average in the vicinity, provisional LAT tax rate of 5% is applied. For those having ASP higher than last year’s average by <100%, 3% tax rate is applied. If the project’s ASP is less than last year’s average, the provisional LAT tax rate would remain unchanged at 2%. (3) Mortgage down-payment on all first home purchases will be 30% or above. All mortgages for 3rd or subsequent home purchases should be suspended. (4) For project <30k sqm, the whole project should be pre-sale in one batch. Projects >30k sqm could apply for pre-sale permit by batches, with every batch no less than 30k sqm. 2) Central government urged local authorities to investigate the application of “direct price control” on soaring property prices
Source: State Council, HSBC
渐飞研究报告 - http://bg.panlv.net
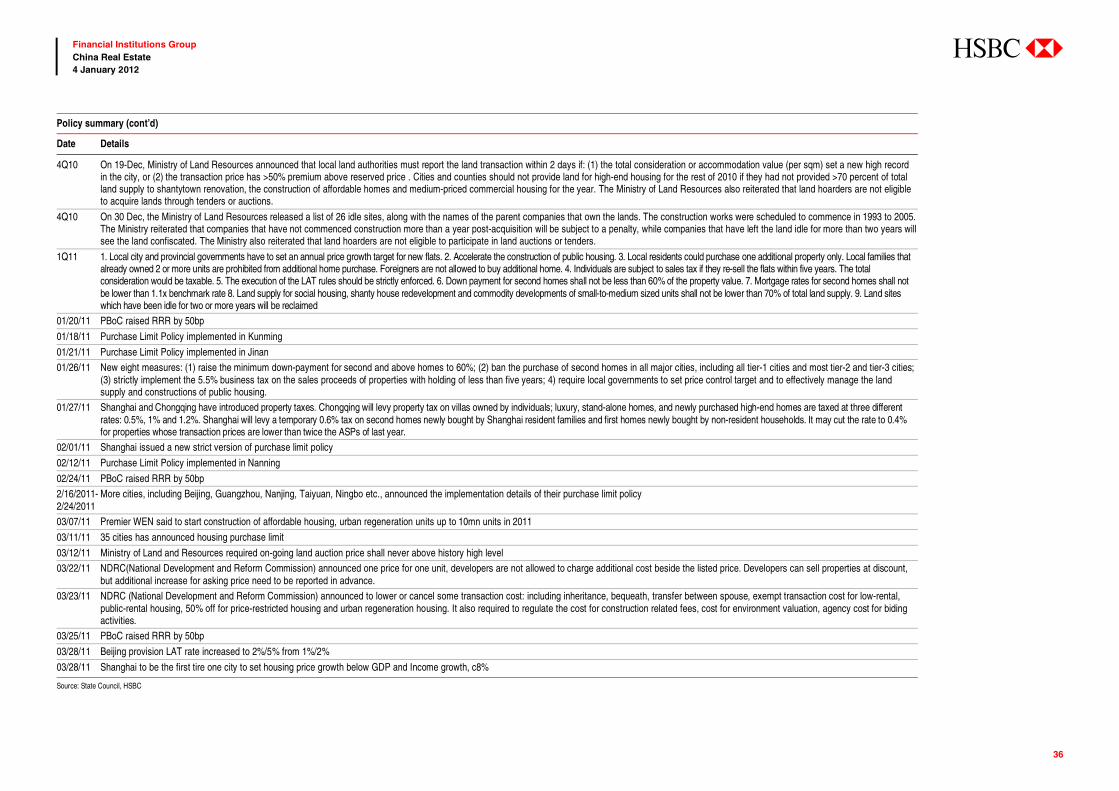
abc
36
Financial Institutions Group China Real Estate 4 January 2012
Policy summary (cont’d)
Date Details
4Q10 On 19-Dec, Ministry of Land Resources announced that local land authorities must report the land transaction within 2 days if: (1) the total consideration or accommodation value (per sqm) set a new high record in the city, or (2) the transaction price has >50% premium above reserved price . Cities and counties should not provide land for high-end housing for the rest of 2010 if they had not provided >70 percent of total land supply to shantytown renovation, the construction of affordable homes and medium-priced commercial housing for the year. The Ministry of Land Resources also reiterated that land hoarders are not eligible to acquire lands through tenders or auctions.
4Q10 On 30 Dec, the Ministry of Land Resources released a list of 26 idle sites, along with the names of the parent companies that own the lands. The construction works were scheduled to commence in 1993 to 2005. The Ministry reiterated that companies that have not commenced construction more than a year post-acquisition will be subject to a penalty, while companies that have left the land idle for more than two years willsee the land confiscated. The Ministry also reiterated that land hoarders are not eligible to participate in land auctions or tenders.
1Q11 1. Local city and provincial governments have to set an annual price growth target for new flats. 2. Accelerate the construction of public housing. 3. Local residents could purchase one additional property only. Local families that already owned 2 or more units are prohibited from additional home purchase. Foreigners are not allowed to buy additional home. 4. Individuals are subject to sales tax if they re-sell the flats within five years. The total consideration would be taxable. 5. The execution of the LAT rules should be strictly enforced. 6. Down payment for second homes shall not be less than 60% of the property value. 7. Mortgage rates for second homes shall not be lower than 1.1x benchmark rate 8. Land supply for social housing, shanty house redevelopment and commodity developments of small-to-medium sized units shall not be lower than 70% of total land supply. 9. Land sites which have been idle for two or more years will be reclaimed
01/20/11 PBoC raised RRR by 50bp
01/18/11 Purchase Limit Policy implemented in Kunming
01/21/11 Purchase Limit Policy implemented in Jinan
01/26/11 New eight measures: (1) raise the minimum down-payment for second and above homes to 60%; (2) ban the purchase of second homes in all major cities, including all tier-1 cities and most tier-2 and tier-3 cities; (3) strictly implement the 5.5% business tax on the sales proceeds of properties with holding of less than five years; 4) require local governments to set price control target and to effectively manage the land supply and constructions of public housing.
01/27/11 Shanghai and Chongqing have introduced property taxes. Chongqing will levy property tax on villas owned by individuals; luxury, stand-alone homes, and newly purchased high-end homes are taxed at three different rates: 0.5%, 1% and 1.2%. Shanghai will levy a temporary 0.6% tax on second homes newly bought by Shanghai resident families and first homes newly bought by non-resident households. It may cut the rate to 0.4% for properties whose transaction prices are lower than twice the ASPs of last year.
02/01/11 Shanghai issued a new strict version of purchase limit policy
02/12/11 Purchase Limit Policy implemented in Nanning
02/24/11 PBoC raised RRR by 50bp
2/16/2011-2/24/2011
More cities, including Beijing, Guangzhou, Nanjing, Taiyuan, Ningbo etc., announced the implementation details of their purchase limit policy
03/07/11 Premier WEN said to start construction of affordable housing, urban regeneration units up to 10mn units in 2011
03/11/11 35 cities has announced housing purchase limit
03/12/11 Ministry of Land and Resources required on-going land auction price shall never above history high level
03/22/11 NDRC(National Development and Reform Commission) announced one price for one unit, developers are not allowed to charge additional cost beside the listed price. Developers can sell properties at discount, but additional increase for asking price need to be reported in advance.
03/23/11 NDRC (National Development and Reform Commission) announced to lower or cancel some transaction cost: including inheritance, bequeath, transfer between spouse, exempt transaction cost for low-rental, public-rental housing, 50% off for price-restricted housing and urban regeneration housing. It also required to regulate the cost for construction related fees, cost for environment valuation, agency cost for biding activities.
03/25/11 PBoC raised RRR by 50bp
03/28/11 Beijing provision LAT rate increased to 2%/5% from 1%/2%
03/28/11 Shanghai to be the first tire one city to set housing price growth below GDP and Income growth, c8%
Source: State Council, HSBC
渐飞研究报告 - http://bg.panlv.net
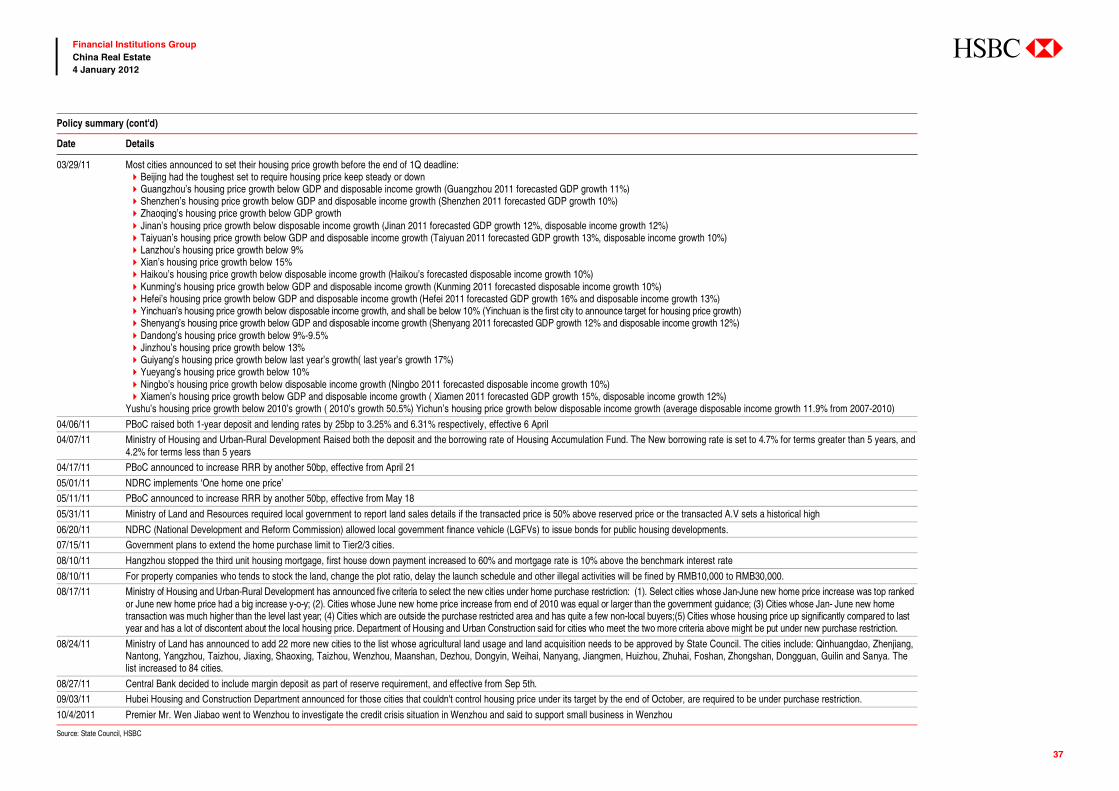
abc
37
Financial Institutions Group China Real Estate 4 January 2012
Policy summary (cont'd)
Date Details
03/29/11 Most cities announced to set their housing price growth before the end of 1Q deadline: Beijing had the toughest set to require housing price keep steady or down Guangzhou’s housing price growth below GDP and disposable income growth (Guangzhou 2011 forecasted GDP growth 11%) Shenzhen’s housing price growth below GDP and disposable income growth (Shenzhen 2011 forecasted GDP growth 10%) Zhaoqing’s housing price growth below GDP growth Jinan’s housing price growth below disposable income growth (Jinan 2011 forecasted GDP growth 12%, disposable income growth 12%) Taiyuan’s housing price growth below GDP and disposable income growth (Taiyuan 2011 forecasted GDP growth 13%, disposable income growth 10%) Lanzhou’s housing price growth below 9% Xian’s housing price growth below 15% Haikou’s housing price growth below disposable income growth (Haikou’s forecasted disposable income growth 10%) Kunming’s housing price growth below GDP and disposable income growth (Kunming 2011 forecasted disposable income growth 10%) Hefei’s housing price growth below GDP and disposable income growth (Hefei 2011 forecasted GDP growth 16% and disposable income growth 13%) Yinchuan’s housing price growth below disposable income growth, and shall be below 10% (Yinchuan is the first city to announce target for housing price growth) Shenyang’s housing price growth below GDP and disposable income growth (Shenyang 2011 forecasted GDP growth 12% and disposable income growth 12%) Dandong’s housing price growth below 9%-9.5% Jinzhou’s housing price growth below 13% Guiyang’s housing price growth below last year’s growth( last year’s growth 17%) Yueyang’s housing price growth below 10% Ningbo’s housing price growth below disposable income growth (Ningbo 2011 forecasted disposable income growth 10%) Xiamen’s housing price growth below GDP and disposable income growth ( Xiamen 2011 forecasted GDP growth 15%, disposable income growth 12%)
Yushu’s housing price growth below 2010’s growth ( 2010’s growth 50.5%) Yichun’s housing price growth below disposable income growth (average disposable income growth 11.9% from 2007-2010)
04/06/11 PBoC raised both 1-year deposit and lending rates by 25bp to 3.25% and 6.31% respectively, effective 6 April
04/07/11 Ministry of Housing and Urban-Rural Development Raised both the deposit and the borrowing rate of Housing Accumulation Fund. The New borrowing rate is set to 4.7% for terms greater than 5 years, and 4.2% for terms less than 5 years
04/17/11 PBoC announced to increase RRR by another 50bp, effective from April 21
05/01/11 NDRC implements ‘One home one price’
05/11/11 PBoC announced to increase RRR by another 50bp, effective from May 18
05/31/11 Ministry of Land and Resources required local government to report land sales details if the transacted price is 50% above reserved price or the transacted A.V sets a historical high
06/20/11 NDRC (National Development and Reform Commission) allowed local government finance vehicle (LGFVs) to issue bonds for public housing developments.
07/15/11 Government plans to extend the home purchase limit to Tier2/3 cities.
08/10/11 Hangzhou stopped the third unit housing mortgage, first house down payment increased to 60% and mortgage rate is 10% above the benchmark interest rate
08/10/11 For property companies who tends to stock the land, change the plot ratio, delay the launch schedule and other illegal activities will be fined by RMB10,000 to RMB30,000.
08/17/11 Ministry of Housing and Urban-Rural Development has announced five criteria to select the new cities under home purchase restriction: (1). Select cities whose Jan-June new home price increase was top ranked or June new home price had a big increase y-o-y; (2). Cities whose June new home price increase from end of 2010 was equal or larger than the government guidance; (3) Cities whose Jan- June new home transaction was much higher than the level last year; (4) Cities which are outside the purchase restricted area and has quite a few non-local buyers;(5) Cities whose housing price up significantly compared to last year and has a lot of discontent about the local housing price. Department of Housing and Urban Construction said for cities who meet the two more criteria above might be put under new purchase restriction.
08/24/11 Ministry of Land has announced to add 22 more new cities to the list whose agricultural land usage and land acquisition needs to be approved by State Council. The cities include: Qinhuangdao, Zhenjiang, Nantong, Yangzhou, Taizhou, Jiaxing, Shaoxing, Taizhou, Wenzhou, Maanshan, Dezhou, Dongyin, Weihai, Nanyang, Jiangmen, Huizhou, Zhuhai, Foshan, Zhongshan, Dongguan, Guilin and Sanya. The list increased to 84 cities.
08/27/11 Central Bank decided to include margin deposit as part of reserve requirement, and effective from Sep 5th.
09/03/11 Hubei Housing and Construction Department announced for those cities that couldn't control housing price under its target by the end of October, are required to be under purchase restriction.
10/4/2011 Premier Mr. Wen Jiabao went to Wenzhou to investigate the credit crisis situation in Wenzhou and said to support small business in Wenzhou
Source: State Council, HSBC
渐飞研究报告 - http://bg.panlv.net
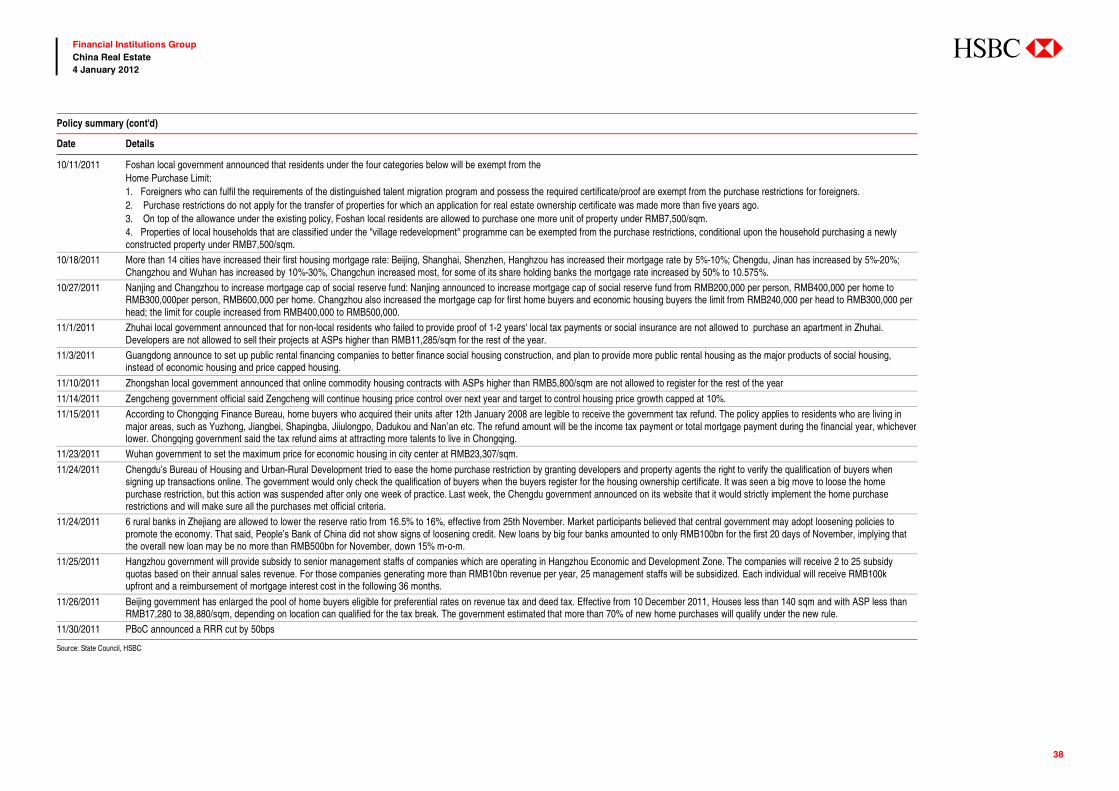
abc
38
Financial Institutions Group China Real Estate 4 January 2012
Policy summary (cont'd)
Date Details
10/11/2011 Foshan local government announced that residents under the four categories below will be exempt from the Home Purchase Limit: 1. Foreigners who can fulfil the requirements of the distinguished talent migration program and possess the required certificate/proof are exempt from the purchase restrictions for foreigners. 2. Purchase restrictions do not apply for the transfer of properties for which an application for real estate ownership certificate was made more than five years ago. 3. On top of the allowance under the existing policy, Foshan local residents are allowed to purchase one more unit of property under RMB7,500/sqm. 4. Properties of local households that are classified under the "village redevelopment" programme can be exempted from the purchase restrictions, conditional upon the household purchasing a newly constructed property under RMB7,500/sqm.
10/18/2011 More than 14 cities have increased their first housing mortgage rate: Beijing, Shanghai, Shenzhen, Hanghzou has increased their mortgage rate by 5%-10%; Chengdu, Jinan has increased by 5%-20%; Changzhou and Wuhan has increased by 10%-30%, Changchun increased most, for some of its share holding banks the mortgage rate increased by 50% to 10.575%.
10/27/2011 Nanjing and Changzhou to increase mortgage cap of social reserve fund: Nanjing announced to increase mortgage cap of social reserve fund from RMB200,000 per person, RMB400,000 per home to RMB300,000per person, RMB600,000 per home. Changzhou also increased the mortgage cap for first home buyers and economic housing buyers the limit from RMB240,000 per head to RMB300,000 per head; the limit for couple increased from RMB400,000 to RMB500,000.
11/1/2011 Zhuhai local government announced that for non-local residents who failed to provide proof of 1-2 years' local tax payments or social insurance are not allowed to purchase an apartment in Zhuhai. Developers are not allowed to sell their projects at ASPs higher than RMB11,285/sqm for the rest of the year.
11/3/2011 Guangdong announce to set up public rental financing companies to better finance social housing construction, and plan to provide more public rental housing as the major products of social housing, instead of economic housing and price capped housing.
11/10/2011 Zhongshan local government announced that online commodity housing contracts with ASPs higher than RMB5,800/sqm are not allowed to register for the rest of the year
11/14/2011 Zengcheng government official said Zengcheng will continue housing price control over next year and target to control housing price growth capped at 10%.
11/15/2011 According to Chongqing Finance Bureau, home buyers who acquired their units after 12th January 2008 are legible to receive the government tax refund. The policy applies to residents who are living in major areas, such as Yuzhong, Jiangbei, Shapingba, Jiiulongpo, Dadukou and Nan’an etc. The refund amount will be the income tax payment or total mortgage payment during the financial year, whichever lower. Chongqing government said the tax refund aims at attracting more talents to live in Chongqing.
11/23/2011 Wuhan government to set the maximum price for economic housing in city center at RMB23,307/sqm.
11/24/2011 Chengdu’s Bureau of Housing and Urban-Rural Development tried to ease the home purchase restriction by granting developers and property agents the right to verify the qualification of buyers when signing up transactions online. The government would only check the qualification of buyers when the buyers register for the housing ownership certificate. It was seen a big move to loose the home purchase restriction, but this action was suspended after only one week of practice. Last week, the Chengdu government announced on its website that it would strictly implement the home purchase restrictions and will make sure all the purchases met official criteria.
11/24/2011 6 rural banks in Zhejiang are allowed to lower the reserve ratio from 16.5% to 16%, effective from 25th November. Market participants believed that central government may adopt loosening policies to promote the economy. That said, People’s Bank of China did not show signs of loosening credit. New loans by big four banks amounted to only RMB100bn for the first 20 days of November, implying that the overall new loan may be no more than RMB500bn for November, down 15% m-o-m.
11/25/2011 Hangzhou government will provide subsidy to senior management staffs of companies which are operating in Hangzhou Economic and Development Zone. The companies will receive 2 to 25 subsidy quotas based on their annual sales revenue. For those companies generating more than RMB10bn revenue per year, 25 management staffs will be subsidized. Each individual will receive RMB100k upfront and a reimbursement of mortgage interest cost in the following 36 months.
11/26/2011 Beijing government has enlarged the pool of home buyers eligible for preferential rates on revenue tax and deed tax. Effective from 10 December 2011, Houses less than 140 sqm and with ASP less than RMB17,280 to 38,880/sqm, depending on location can qualified for the tax break. The government estimated that more than 70% of new home purchases will qualify under the new rule.
11/30/2011 PBoC announced a RRR cut by 50bps
Source: State Council, HSBC
渐飞研究报告 - http://bg.panlv.net
abc
39
Financial Institutions Group China Real Estate 4 January 2012
Key property market data
渐飞研究报告 - http://bg.panlv.net
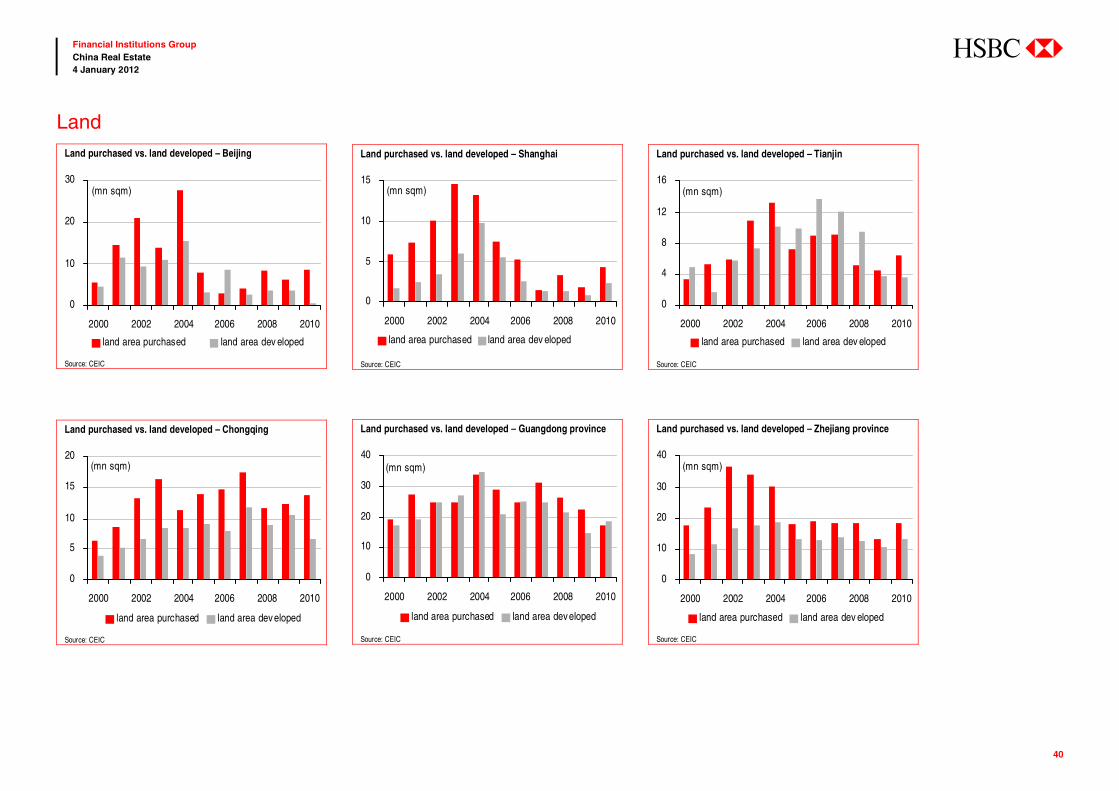
abc
40
Financial Institutions Group China Real Estate 4 January 2012
Land
Land purchased vs. land developed – Beijing
0
10
20
30
2000 2002 2004 2006 2008 2010
(mn sqm)
land area purchased land area dev eloped
Source: CEIC
Land purchased vs. land developed – Chongqing
0
5
10
15
20
2000 2002 2004 2006 2008 2010
(mn sqm)
land area purchased land area dev eloped
Source: CEIC
Land purchased vs. land developed – Shanghai
0
5
10
15
2000 2002 2004 2006 2008 2010
(mn sqm)
land area purchased land area dev eloped
Source: CEIC
Land purchased vs. land developed – Guangdong province
0
10
20
30
40
2000 2002 2004 2006 2008 2010
(mn sqm)
land area purchased land area dev eloped
Source: CEIC
Land purchased vs. land developed – Tianjin
0
4
8
12
16
2000 2002 2004 2006 2008 2010
(mn sqm)
land area purchased land area dev eloped
Source: CEIC
Land purchased vs. land developed – Zhejiang province
0
10
20
30
40
2000 2002 2004 2006 2008 2010
(mn sqm)
land area purchased land area dev eloped
Source: CEIC
渐飞研究报告 - http://bg.panlv.net
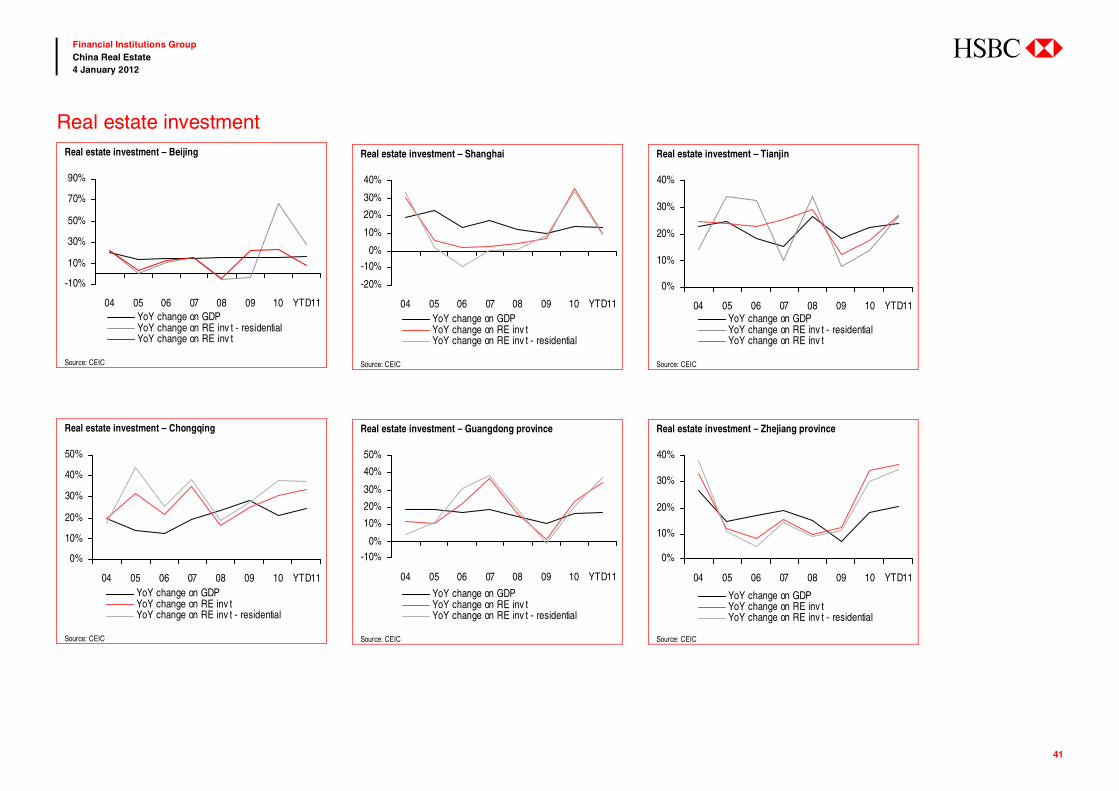
abc
41
Financial Institutions Group China Real Estate 4 January 2012
Real estate investment Real estate investment – Beijing
-10%
10%
30%
50%
70%
90%
04 05 06 07 08 09 10 YTD11YoY change on GDPYoY change on RE inv t - residentialYoY change on RE inv t
Source: CEIC
Real estate investment – Chongqing
0%
10%
20%
30%
40%
50%
04 05 06 07 08 09 10 YTD11YoY change on GDPYoY change on RE inv tYoY change on RE inv t - residential
Source: CEIC
Real estate investment – Shanghai
-20%
-10%
0%
10%
20%
30%
40%
04 05 06 07 08 09 10 YTD11YoY change on GDPYoY change on RE inv tYoY change on RE inv t - residential
Source: CEIC
Real estate investment – Guangdong province
-10%0%
10%
20%
30%
40%
50%
04 05 06 07 08 09 10 YTD11
YoY change on GDPYoY change on RE inv tYoY change on RE inv t - residential
Source: CEIC
Real estate investment – Tianjin
0%
10%
20%
30%
40%
04 05 06 07 08 09 10 YTD11YoY change on GDPYoY change on RE inv t - residentialYoY change on RE inv t
Source: CEIC
Real estate investment – Zhejiang province
0%
10%
20%
30%
40%
04 05 06 07 08 09 10 YTD11
YoY change on GDPYoY change on RE inv tYoY change on RE inv t - residential
Source: CEIC
渐飞研究报告 - http://bg.panlv.net
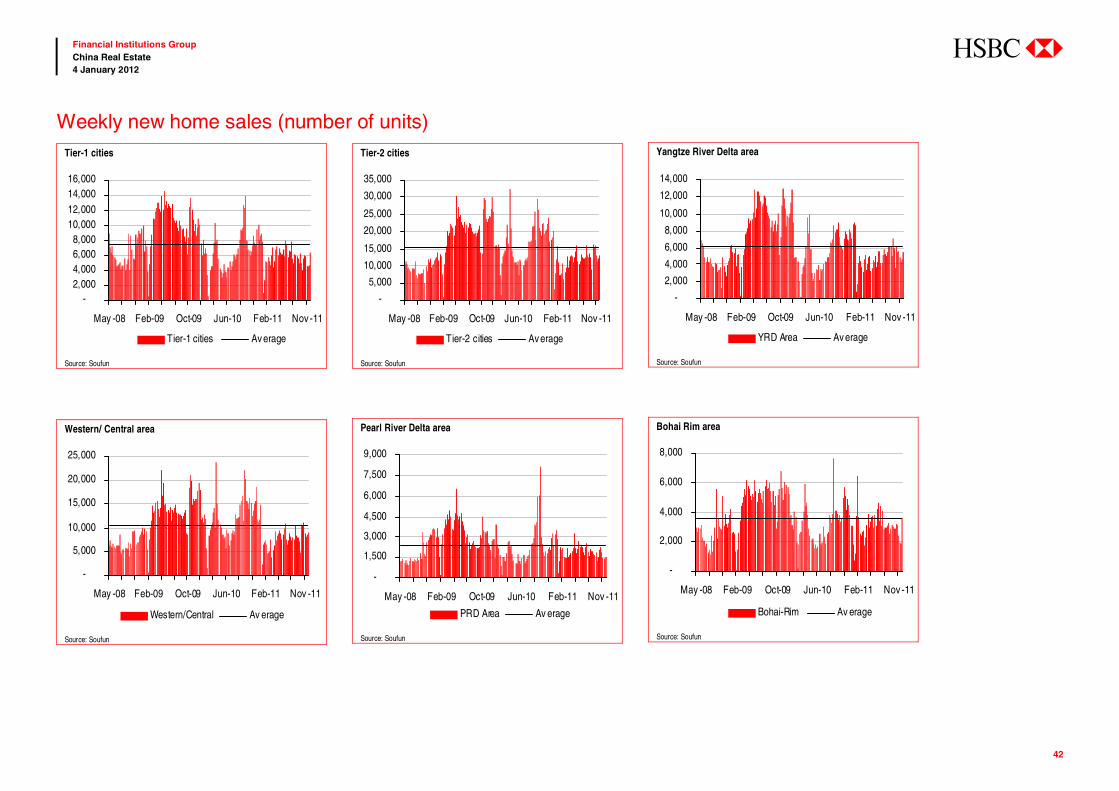
abc
42
Financial Institutions Group China Real Estate 4 January 2012
Tier-1 cities
-2,0004,0006,0008,000
10,00012,00014,00016,000
May -08 Feb-09 Oct-09 Jun-10 Feb-11 Nov -11
Tier-1 cities Av erage
Source: Soufun
Western/ Central area
-
5,000
10,000
15,000
20,000
25,000
May -08 Feb-09 Oct-09 Jun-10 Feb-11 Nov -11
Western/Central Av erage
Source: Soufun
Tier-2 cities
-
5,000
10,000
15,000
20,000
25,000
30,000
35,000
May -08 Feb-09 Oct-09 Jun-10 Feb-11 Nov -11
Tier-2 cities Av erage
Source: Soufun
Pearl River Delta area
-
1,500
3,000
4,500
6,000
7,500
9,000
May -08 Feb-09 Oct-09 Jun-10 Feb-11 Nov -11
PRD Area Av erage
Source: Soufun
Yangtze River Delta area
-
2,000
4,000
6,000
8,000
10,000
12,000
14,000
May -08 Feb-09 Oct-09 Jun-10 Feb-11 Nov -11
YRD Area Av erage
Source: Soufun
Bohai Rim area
-
2,000
4,000
6,000
8,000
May -08 Feb-09 Oct-09 Jun-10 Feb-11 Nov -11
Bohai-Rim Av erage
Source: Soufun
Weekly new home sales (number of units)
渐飞研究报告 - http://bg.panlv.net
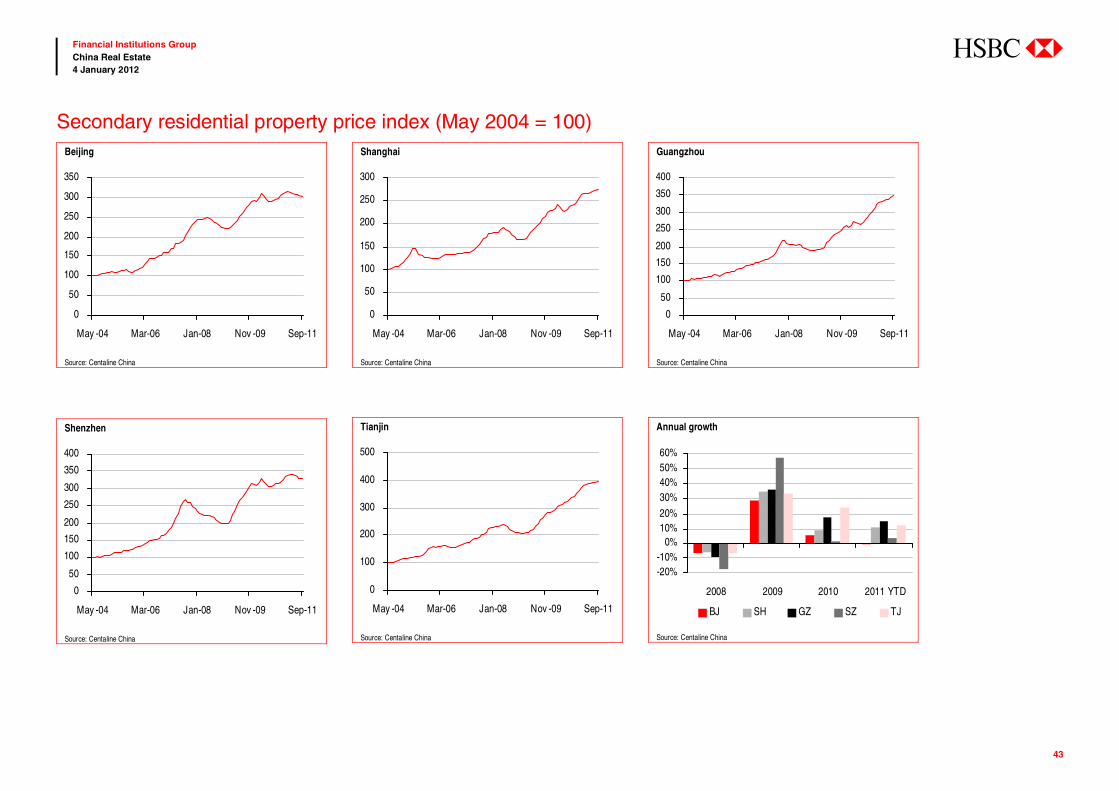
abc
43
Financial Institutions Group China Real Estate 4 January 2012
Beijing
0
50
100
150
200
250
300
350
May -04 Mar-06 Jan-08 Nov -09 Sep-11
Source: Centaline China
Shenzhen
0
50
100
150
200
250
300
350
400
May -04 Mar-06 Jan-08 Nov -09 Sep-11
Source: Centaline China
Shanghai
0
50
100
150
200
250
300
May -04 Mar-06 Jan-08 Nov -09 Sep-11
Source: Centaline China
Tianjin
0
100
200
300
400
500
May -04 Mar-06 Jan-08 Nov -09 Sep-11
Source: Centaline China
Guangzhou
0
50
100
150
200
250
300
350
400
May -04 Mar-06 Jan-08 Nov -09 Sep-11
Source: Centaline China
Annual growth
-20%-10%
0%10%20%
30%40%50%60%
2008 2009 2010 2011 YTD
BJ SH GZ SZ TJ
Source: Centaline China
Secondary residential property price index (May 2004 = 100)
渐飞研究报告 - http://bg.panlv.net
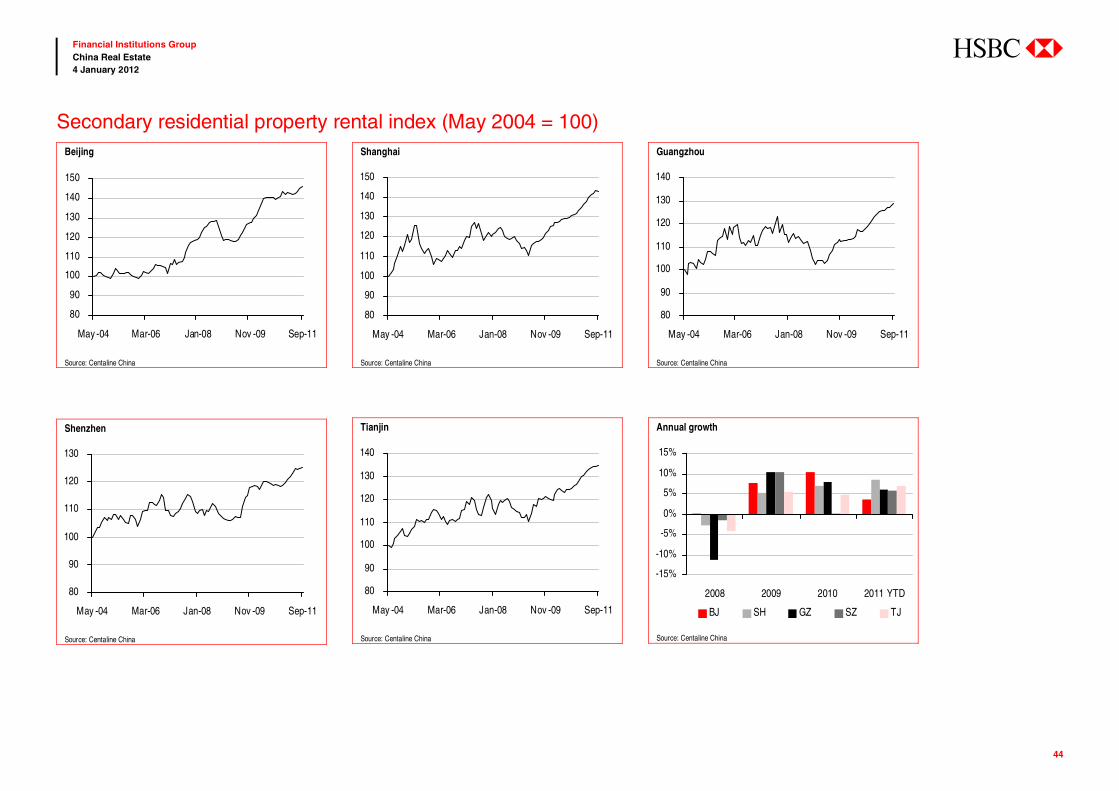
abc
44
Financial Institutions Group China Real Estate 4 January 2012
Beijing
80
90
100
110
120
130
140
150
May -04 Mar-06 Jan-08 Nov -09 Sep-11
Source: Centaline China
Shenzhen
80
90
100
110
120
130
May -04 Mar-06 Jan-08 Nov -09 Sep-11
Source: Centaline China
Shanghai
80
90
100
110
120
130
140
150
May -04 Mar-06 Jan-08 Nov -09 Sep-11
Source: Centaline China
Tianjin
80
90
100
110
120
130
140
May -04 Mar-06 Jan-08 Nov -09 Sep-11
Source: Centaline China
Guangzhou
80
90
100
110
120
130
140
May -04 Mar-06 Jan-08 Nov -09 Sep-11
Source: Centaline China
Annual growth
-15%
-10%
-5%
0%
5%
10%
15%
2008 2009 2010 2011 YTD
BJ SH GZ SZ TJ
Source: Centaline China
Secondary residential property rental index (May 2004 = 100)
渐飞研究报告 - http://bg.panlv.net
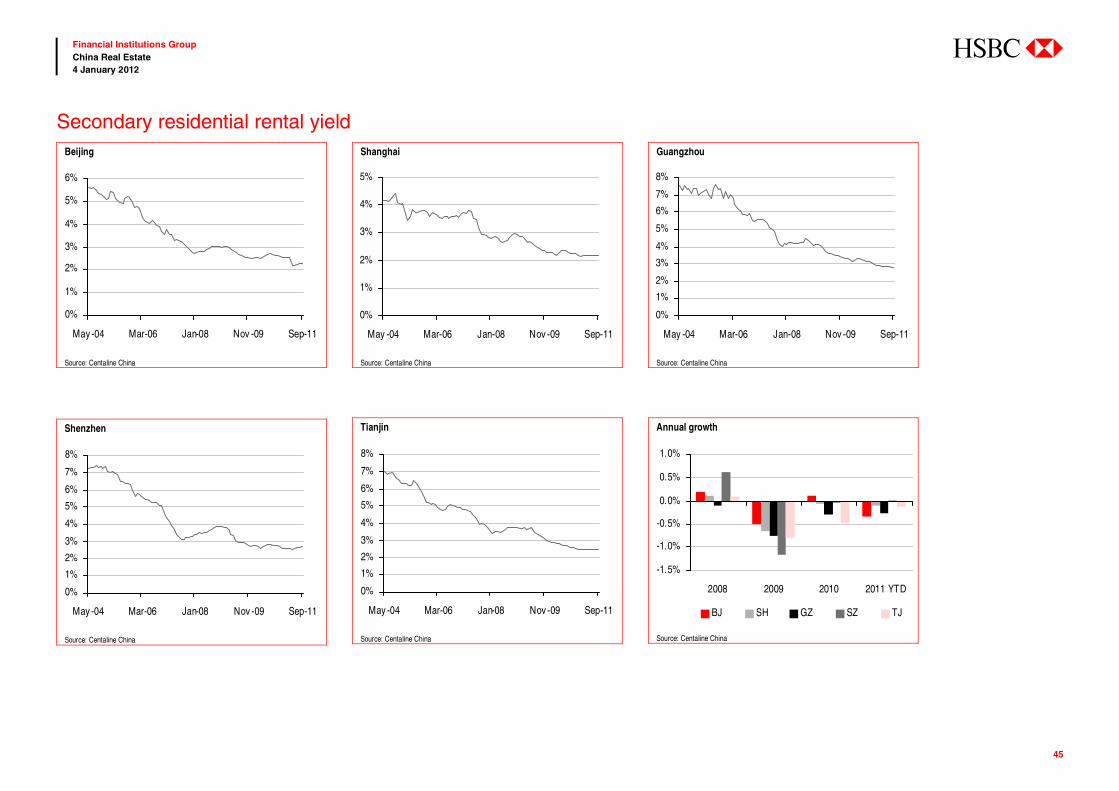
abc
45
Financial Institutions Group China Real Estate 4 January 2012
Beijing
0%
1%
2%
3%
4%
5%
6%
May -04 Mar-06 Jan-08 Nov -09 Sep-11
Source: Centaline China
Shenzhen
0%
1%
2%
3%
4%
5%
6%
7%
8%
May -04 Mar-06 Jan-08 Nov -09 Sep-11
Source: Centaline China
Shanghai
0%
1%
2%
3%
4%
5%
May -04 Mar-06 Jan-08 Nov -09 Sep-11
Source: Centaline China
Tianjin
0%
1%
2%
3%
4%
5%
6%
7%
8%
May -04 Mar-06 Jan-08 Nov -09 Sep-11
Source: Centaline China
Guangzhou
0%
1%
2%
3%
4%
5%
6%
7%
8%
May -04 Mar-06 Jan-08 Nov -09 Sep-11
Source: Centaline China
Annual growth
-1.5%
-1.0%
-0.5%
0.0%
0.5%
1.0%
2008 2009 2010 2011 YTD
BJ SH GZ SZ TJ
Source: Centaline China
Secondary residential rental yield
渐飞研究报告 - http://bg.panlv.net
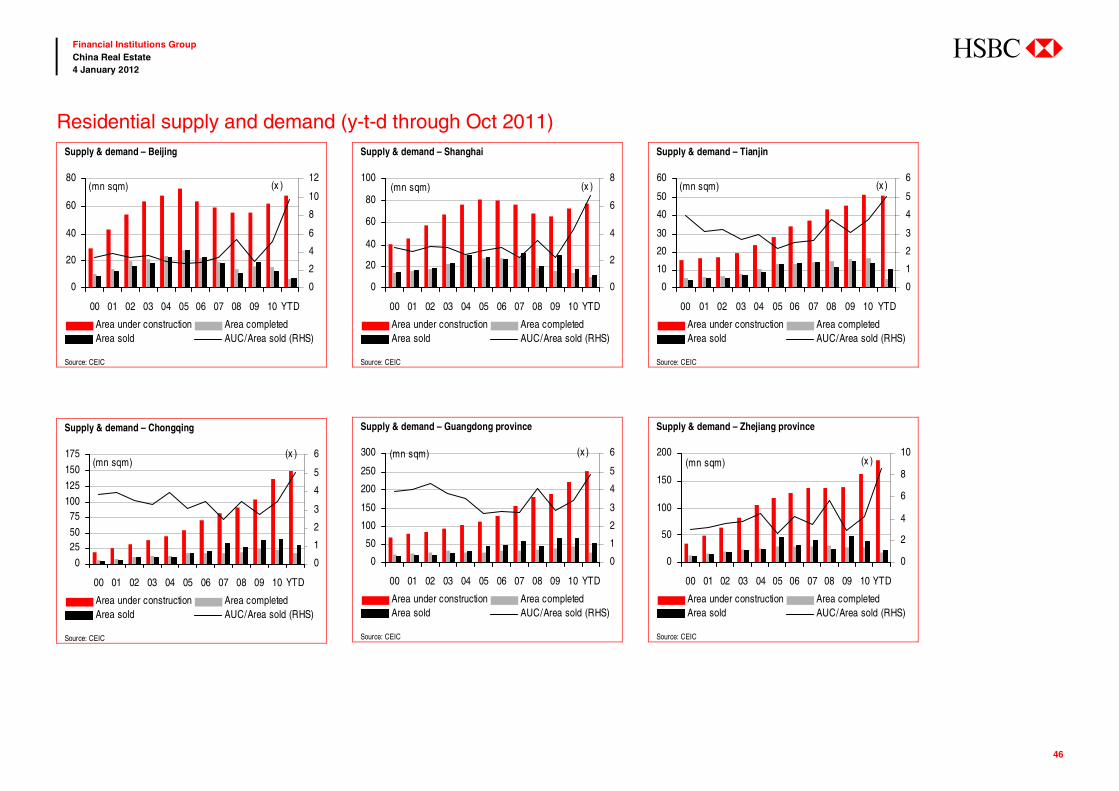
abc
46
Financial Institutions Group China Real Estate 4 January 2012
Supply & demand – Beijing
0
20
40
60
80
00 01 02 03 04 05 06 07 08 09 10 YTD
(mn sqm)
0
2
4
6
8
10
12(x )
Area under construction Area completedArea sold AUC/Area sold (RHS)
Source: CEIC
Supply & demand – Chongqing
0
2550
75100125
150
175
00 01 02 03 04 05 06 07 08 09 10 YTD
(mn sqm)
0
1
2
3
4
5
6(x )
Area under construction Area completedArea sold AUC/Area sold (RHS)
Source: CEIC
Supply & demand – Shanghai
0
20
40
60
80
100
00 01 02 03 04 05 06 07 08 09 10 YTD
(mn sqm)
0
2
4
6
8(x )
Area under construction Area completedArea sold AUC/Area sold (RHS)
Source: CEIC
Supply & demand – Guangdong province
0
50
100
150
200
250
300
00 01 02 03 04 05 06 07 08 09 10 YTD
(mn sqm)
0
1
2
3
4
5
6(x )
Area under construction Area completedArea sold AUC/Area sold (RHS)
Source: CEIC
Supply & demand – Tianjin
0
10
20
30
40
50
60
00 01 02 03 04 05 06 07 08 09 10 YTD
(mn sqm)
0
1
2
3
4
5
6(x )
Area under construction Area completedArea sold AUC/Area sold (RHS)
Source: CEIC
Supply & demand – Zhejiang province
0
50
100
150
200
00 01 02 03 04 05 06 07 08 09 10 YTD
(mn sqm)
0
2
4
6
8
10(x )
Area under construction Area completedArea sold AUC/Area sold (RHS)
Source: CEIC
Residential supply and demand (y-t-d through Oct 2011)
渐飞研究报告 - http://bg.panlv.net
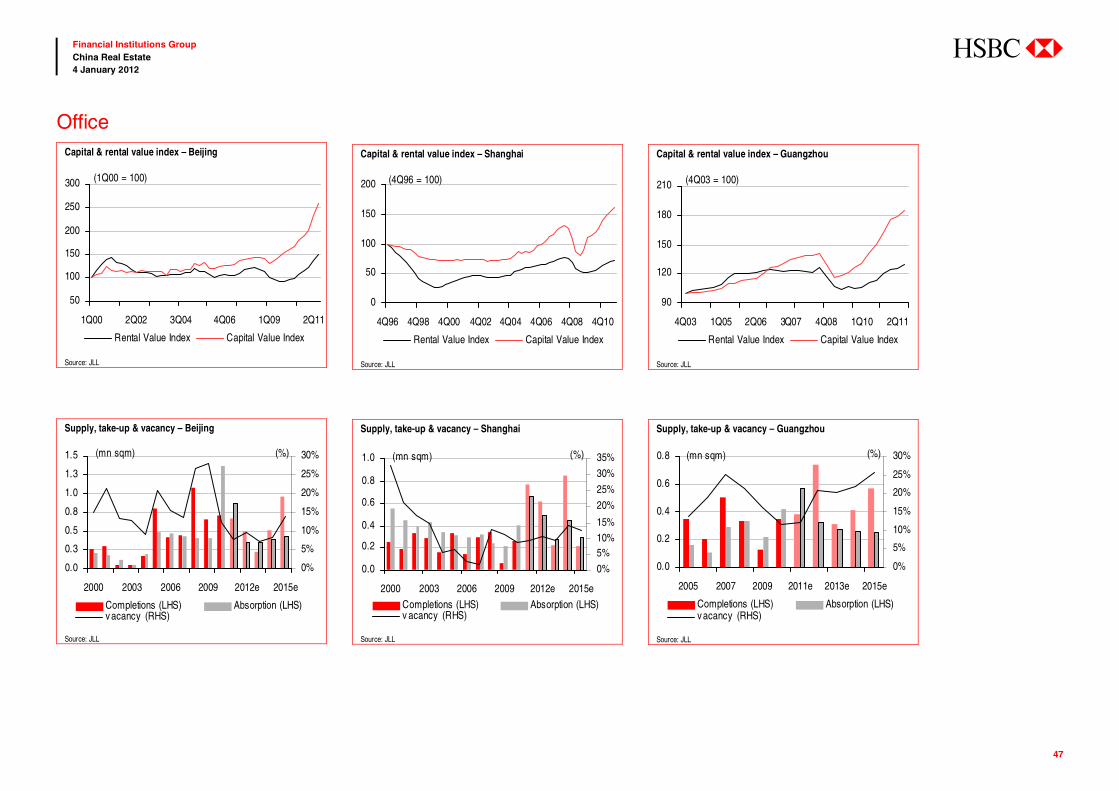
abc
47
Financial Institutions Group China Real Estate 4 January 2012
Office Capital & rental value index – Beijing
50
100
150
200
250
300
1Q00 2Q02 3Q04 4Q06 1Q09 2Q11
(1Q00 = 100)
Rental Value Index Capital Value Index
Source: JLL
Supply, take-up & vacancy – Beijing
0.0
0.3
0.5
0.8
1.0
1.3
1.5
2000 2003 2006 2009 2012e 2015e
(%)(mn sqm)
0%
5%
10%
15%
20%
25%
30%
Completions (LHS) Absorption (LHS)v acancy (RHS)
Source: JLL
Capital & rental value index – Shanghai
0
50
100
150
200
4Q96 4Q98 4Q00 4Q02 4Q04 4Q06 4Q08 4Q10
(4Q96 = 100)
Rental Value Index Capital Value Index
Source: JLL
Supply, take-up & vacancy – Shanghai
0.0
0.2
0.4
0.6
0.8
1.0
2000 2003 2006 2009 2012e 2015e
(%)(mn sqm)
0%
5%10%15%
20%
25%
30%
35%
Completions (LHS) Absorption (LHS)v acancy (RHS)
Source: JLL
Capital & rental value index – Guangzhou
90
120
150
180
210
4Q03 1Q05 2Q06 3Q07 4Q08 1Q10 2Q11
(4Q03 = 100)
Rental Value Index Capital Value Index
Source: JLL
Supply, take-up & vacancy – Guangzhou
0.0
0.2
0.4
0.6
0.8
2005 2007 2009 2011e 2013e 2015e
(%)(mn sqm)
0%
5%
10%
15%
20%
25%
30%
Completions (LHS) Absorption (LHS)v acancy (RHS)
Source: JLL
渐飞研究报告 - http://bg.panlv.net
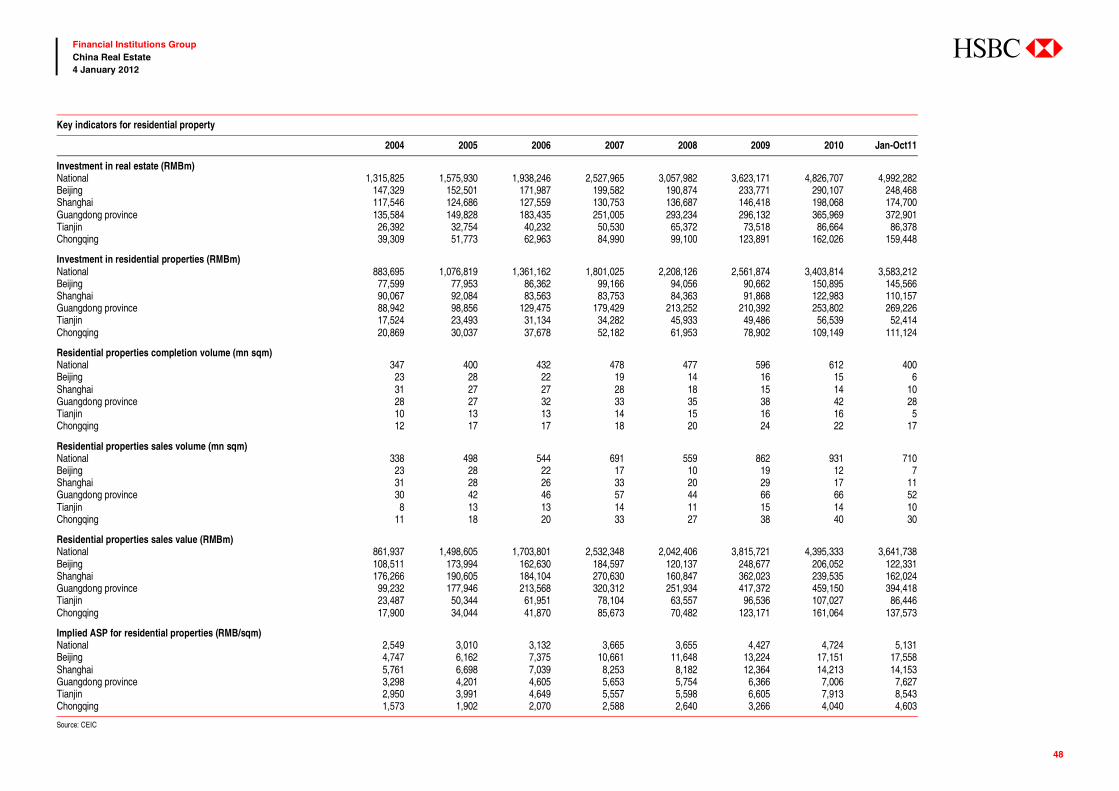
abc
48
Financial Institutions Group China Real Estate 4 January 2012
Key indicators for residential property
2004 2005 2006 2007 2008 2009 2010 Jan-Oct11
Investment in real estate (RMBm) National 1,315,825 1,575,930 1,938,246 2,527,965 3,057,982 3,623,171 4,826,707 4,992,282Beijing 147,329 152,501 171,987 199,582 190,874 233,771 290,107 248,468Shanghai 117,546 124,686 127,559 130,753 136,687 146,418 198,068 174,700Guangdong province 135,584 149,828 183,435 251,005 293,234 296,132 365,969 372,901Tianjin 26,392 32,754 40,232 50,530 65,372 73,518 86,664 86,378Chongqing 39,309 51,773 62,963 84,990 99,100 123,891 162,026 159,448
Investment in residential properties (RMBm) National 883,695 1,076,819 1,361,162 1,801,025 2,208,126 2,561,874 3,403,814 3,583,212Beijing 77,599 77,953 86,362 99,166 94,056 90,662 150,895 145,566Shanghai 90,067 92,084 83,563 83,753 84,363 91,868 122,983 110,157Guangdong province 88,942 98,856 129,475 179,429 213,252 210,392 253,802 269,226Tianjin 17,524 23,493 31,134 34,282 45,933 49,486 56,539 52,414Chongqing 20,869 30,037 37,678 52,182 61,953 78,902 109,149 111,124
Residential properties completion volume (mn sqm) National 347 400 432 478 477 596 612 400Beijing 23 28 22 19 14 16 15 6Shanghai 31 27 27 28 18 15 14 10Guangdong province 28 27 32 33 35 38 42 28Tianjin 10 13 13 14 15 16 16 5Chongqing 12 17 17 18 20 24 22 17
Residential properties sales volume (mn sqm) National 338 498 544 691 559 862 931 710Beijing 23 28 22 17 10 19 12 7Shanghai 31 28 26 33 20 29 17 11Guangdong province 30 42 46 57 44 66 66 52Tianjin 8 13 13 14 11 15 14 10Chongqing 11 18 20 33 27 38 40 30
Residential properties sales value (RMBm) National 861,937 1,498,605 1,703,801 2,532,348 2,042,406 3,815,721 4,395,333 3,641,738Beijing 108,511 173,994 162,630 184,597 120,137 248,677 206,052 122,331Shanghai 176,266 190,605 184,104 270,630 160,847 362,023 239,535 162,024Guangdong province 99,232 177,946 213,568 320,312 251,934 417,372 459,150 394,418Tianjin 23,487 50,344 61,951 78,104 63,557 96,536 107,027 86,446Chongqing 17,900 34,044 41,870 85,673 70,482 123,171 161,064 137,573
Implied ASP for residential properties (RMB/sqm) National 2,549 3,010 3,132 3,665 3,655 4,427 4,724 5,131Beijing 4,747 6,162 7,375 10,661 11,648 13,224 17,151 17,558Shanghai 5,761 6,698 7,039 8,253 8,182 12,364 14,213 14,153Guangdong province 3,298 4,201 4,605 5,653 5,754 6,366 7,006 7,627Tianjin 2,950 3,991 4,649 5,557 5,598 6,605 7,913 8,543Chongqing 1,573 1,902 2,070 2,588 2,640 3,266 4,040 4,603
Source: CEIC
渐飞研究报告 - http://bg.panlv.net
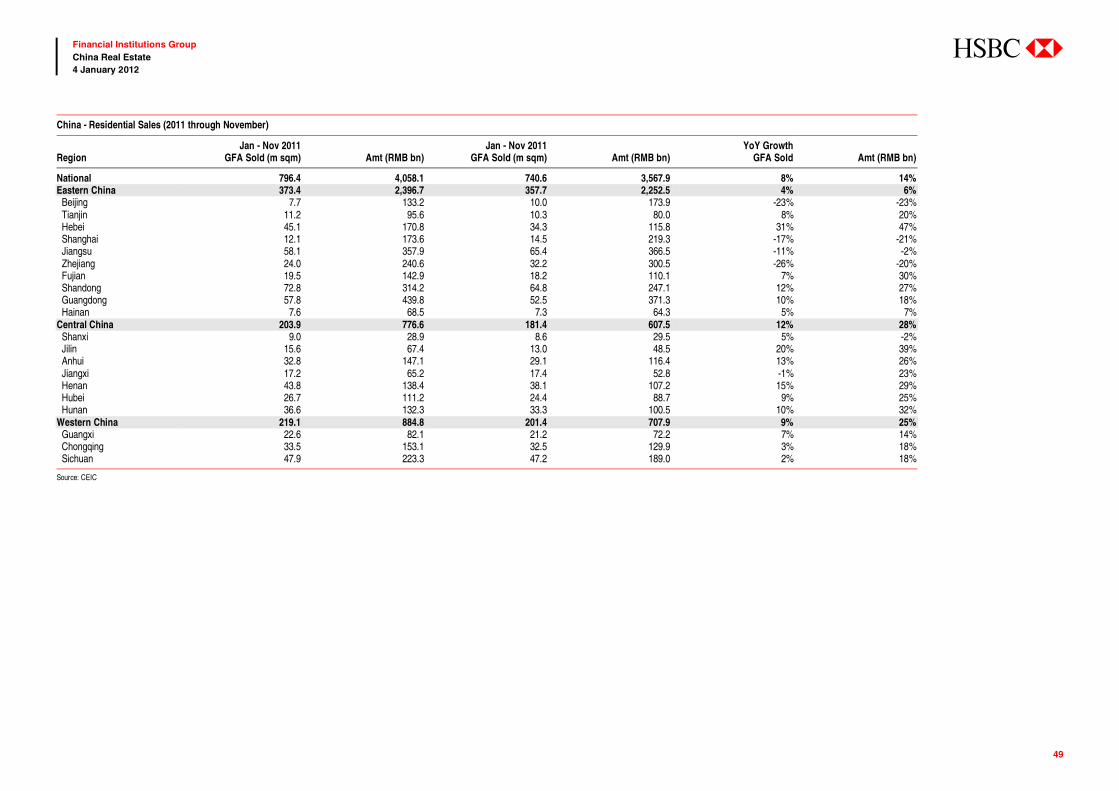
abc
49
Financial Institutions Group China Real Estate 4 January 2012
China - Residential Sales (2011 through November)
Jan - Nov 2011 Jan - Nov 2011 YoY GrowthRegion GFA Sold (m sqm) Amt (RMB bn) GFA Sold (m sqm) Amt (RMB bn) GFA Sold Amt (RMB bn)
National 796.4 4,058.1 740.6 3,567.9 8% 14%Eastern China 373.4 2,396.7 357.7 2,252.5 4% 6% Beijing 7.7 133.2 10.0 173.9 -23% -23% Tianjin 11.2 95.6 10.3 80.0 8% 20% Hebei 45.1 170.8 34.3 115.8 31% 47% Shanghai 12.1 173.6 14.5 219.3 -17% -21% Jiangsu 58.1 357.9 65.4 366.5 -11% -2% Zhejiang 24.0 240.6 32.2 300.5 -26% -20% Fujian 19.5 142.9 18.2 110.1 7% 30% Shandong 72.8 314.2 64.8 247.1 12% 27% Guangdong 57.8 439.8 52.5 371.3 10% 18% Hainan 7.6 68.5 7.3 64.3 5% 7%Central China 203.9 776.6 181.4 607.5 12% 28% Shanxi 9.0 28.9 8.6 29.5 5% -2% Jilin 15.6 67.4 13.0 48.5 20% 39% Anhui 32.8 147.1 29.1 116.4 13% 26% Jiangxi 17.2 65.2 17.4 52.8 -1% 23% Henan 43.8 138.4 38.1 107.2 15% 29% Hubei 26.7 111.2 24.4 88.7 9% 25% Hunan 36.6 132.3 33.3 100.5 10% 32%Western China 219.1 884.8 201.4 707.9 9% 25% Guangxi 22.6 82.1 21.2 72.2 7% 14% Chongqing 33.5 153.1 32.5 129.9 3% 18% Sichuan 47.9 223.3 47.2 189.0 2% 18%
Source: CEIC
渐飞研究报告 - http://bg.panlv.net
abc
50
Financial Institutions Group China Real Estate 4 January 2012
This page left blank intentionally.
渐飞研究报告 - http://bg.panlv.net

abc
51
Financial Institutions Group China Real Estate 4 January 2012
Company write-ups
渐飞研究报告 - http://bg.panlv.net
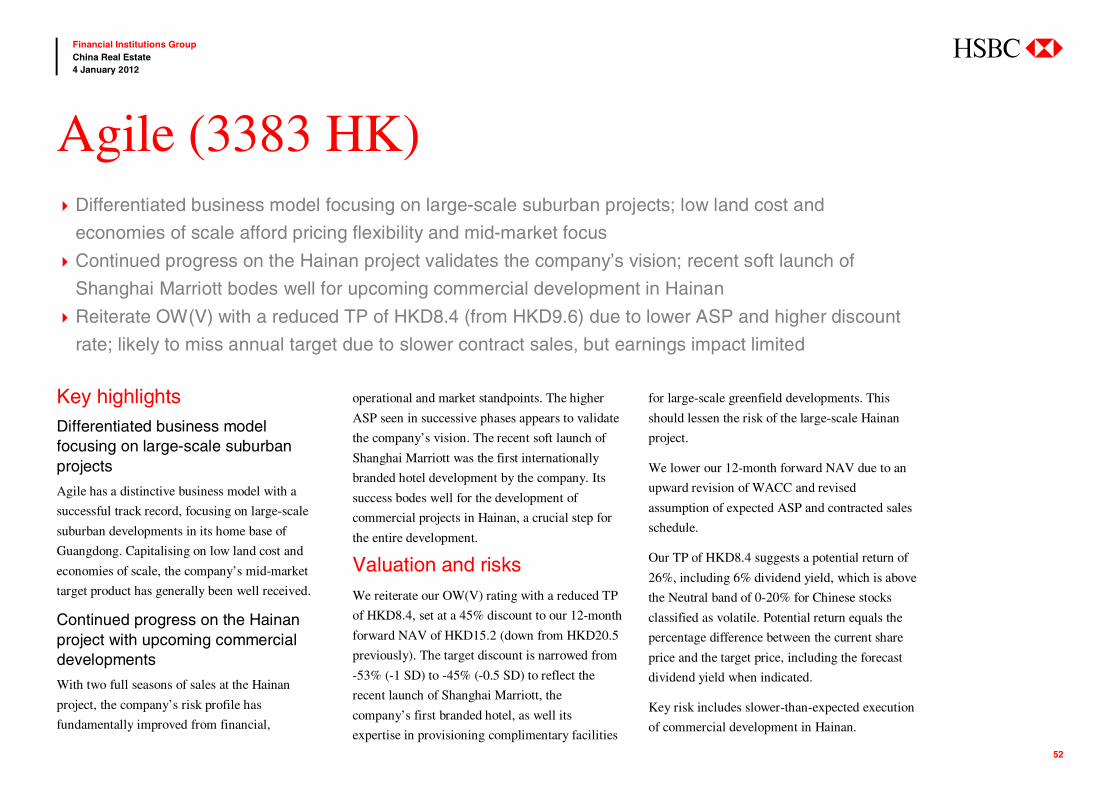
abc
52
Financial Institutions Group China Real Estate 4 January 2012
Key highlights Differentiated business model focusing on large-scale suburban projects
Agile has a distinctive business model with a
successful track record, focusing on large-scale
suburban developments in its home base of
Guangdong. Capitalising on low land cost and
economies of scale, the company’s mid-market
target product has generally been well received.
Continued progress on the Hainan project with upcoming commercial developments
With two full seasons of sales at the Hainan
project, the company’s risk profile has
fundamentally improved from financial,
operational and market standpoints. The higher
ASP seen in successive phases appears to validate
the company’s vision. The recent soft launch of
Shanghai Marriott was the first internationally
branded hotel development by the company. Its
success bodes well for the development of
commercial projects in Hainan, a crucial step for
the entire development.
Valuation and risks We reiterate our OW(V) rating with a reduced TP
of HKD8.4, set at a 45% discount to our 12-month
forward NAV of HKD15.2 (down from HKD20.5
previously). The target discount is narrowed from
-53% (-1 SD) to -45% (-0.5 SD) to reflect the
recent launch of Shanghai Marriott, the
company’s first branded hotel, as well its
expertise in provisioning complimentary facilities
for large-scale greenfield developments. This
should lessen the risk of the large-scale Hainan
project.
We lower our 12-month forward NAV due to an
upward revision of WACC and revised
assumption of expected ASP and contracted sales
schedule.
Our TP of HKD8.4 suggests a potential return of
26%, including 6% dividend yield, which is above
the Neutral band of 0-20% for Chinese stocks
classified as volatile. Potential return equals the
percentage difference between the current share
price and the target price, including the forecast
dividend yield when indicated.
Key risk includes slower-than-expected execution
of commercial development in Hainan.
Agile (3383 HK) Differentiated business model focusing on large-scale suburban projects; low land cost and
economies of scale afford pricing flexibility and mid-market focus
Continued progress on the Hainan project validates the company’s vision; recent soft launch of
Shanghai Marriott bodes well for upcoming commercial development in Hainan
Reiterate OW(V) with a reduced TP of HKD8.4 (from HKD9.6) due to lower ASP and higher discount
rate; likely to miss annual target due to slower contract sales, but earnings impact limited
渐飞研究报告 - http://bg.panlv.net
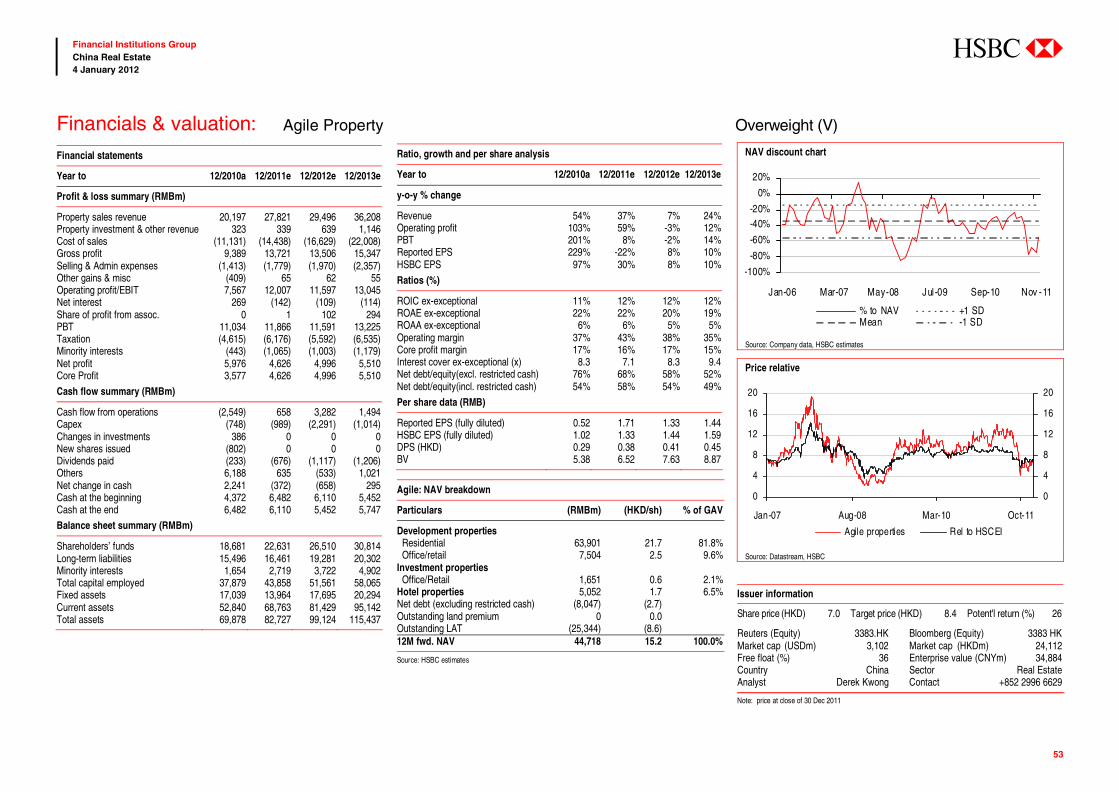
abc
53
Financial Institutions Group China Real Estate 4 January 2012
Financial statements
Year to 12/2010a 12/2011e 12/2012e 12/2013e
Profit & loss summary (RMBm)
Property sales revenue 20,197 27,821 29,496 36,208 Property investment & other revenue 323 339 639 1,146 Cost of sales (11,131) (14,438) (16,629) (22,008)Gross profit 9,389 13,721 13,506 15,347 Selling & Admin expenses (1,413) (1,779) (1,970) (2,357)Other gains & misc (409) 65 62 55 Operating profit/EBIT 7,567 12,007 11,597 13,045 Net interest 269 (142) (109) (114)Share of profit from assoc. 0 1 102 294 PBT 11,034 11,866 11,591 13,225 Taxation (4,615) (6,176) (5,592) (6,535)Minority interests (443) (1,065) (1,003) (1,179)Net profit 5,976 4,626 4,996 5,510 Core Profit 3,577 4,626 4,996 5,510
Cash flow summary (RMBm)
Cash flow from operations (2,549) 658 3,282 1,494 Capex (748) (989) (2,291) (1,014)Changes in investments 386 0 0 0 New shares issued (802) 0 0 0 Dividends paid (233) (676) (1,117) (1,206)Others 6,188 635 (533) 1,021 Net change in cash 2,241 (372) (658) 295 Cash at the beginning 4,372 6,482 6,110 5,452 Cash at the end 6,482 6,110 5,452 5,747
Balance sheet summary (RMBm)
Shareholders’ funds 18,681 22,631 26,510 30,814 Long-term liabilities 15,496 16,461 19,281 20,302 Minority interests 1,654 2,719 3,722 4,902 Total capital employed 37,879 43,858 51,561 58,065 Fixed assets 17,039 13,964 17,695 20,294 Current assets 52,840 68,763 81,429 95,142 Total assets 69,878 82,727 99,124 115,437
Ratio, growth and per share analysis
Year to 12/2010a 12/2011e 12/2012e 12/2013e
y-o-y % change
Revenue 54% 37% 7% 24%Operating profit 103% 59% -3% 12%PBT 201% 8% -2% 14%Reported EPS 229% -22% 8% 10%HSBC EPS 97% 30% 8% 10%
Ratios (%)
ROIC ex-exceptional 11% 12% 12% 12%ROAE ex-exceptional 22% 22% 20% 19%ROAA ex-exceptional 6% 6% 5% 5%Operating margin 37% 43% 38% 35%Core profit margin 17% 16% 17% 15%Interest cover ex-exceptional (x) 8.3 7.1 8.3 9.4 Net debt/equity(excl. restricted cash) 76% 68% 58% 52%Net debt/equity(incl. restricted cash) 54% 58% 54% 49%
Per share data (RMB)
Reported EPS (fully diluted) 0.52 1.71 1.33 1.44HSBC EPS (fully diluted) 1.02 1.33 1.44 1.59DPS (HKD) 0.29 0.38 0.41 0.45BV 5.38 6.52 7.63 8.87 Agile: NAV breakdown
Particulars (RMBm) (HKD/sh) % of GAV
Development properties Residential 63,901 21.7 81.8% Office/retail 7,504 2.5 9.6%Investment properties Office/Retail 1,651 0.6 2.1%Hotel properties 5,052 1.7 6.5%Net debt (excluding restricted cash) (8,047) (2.7)Outstanding land premium 0 0.0 Outstanding LAT (25,344) (8.6)12M fwd. NAV 44,718 15.2 100.0%
Source: HSBC estimates
NAV discount chart
-100%
-80%
-60%
-40%-20%
0%
20%
Jan-06 Mar-07 May-08 Jul -09 Sep-10 Nov -11
% to NAV +1 SDMean -1 SD
Source: Company data, HSBC estimates
Price relative
0
4
8
12
16
20
Jan-07 Aug-08 Mar-10 Oct-11
0
4
8
12
16
20
Agile properties Rel to HSCEI
Source: Datastream, HSBC
Issuer information
Share price (HKD) 7.0 Target price (HKD) 8.4 Potent'l return (%) 26
Reuters (Equity) 3383.HK Bloomberg (Equity) 3383 HK Market cap (USDm) 3,102 Market cap (HKDm) 24,112 Free float (%) 36 Enterprise value (CNYm) 34,884 Country China Sector Real Estate Analyst Derek Kwong Contact +852 2996 6629
Note: price at close of 30 Dec 2011
Financials & valuation: Agile Property Overweight (V)
渐飞研究报告 - http://bg.panlv.net
abc
54
Financial Institutions Group China Real Estate 4 January 2012
Key highlights Overachiever in sales performance
China Overseas Land (COLI) appears is an
overachiever in terms of sales delivery. Year-to-
November, COLI posted aggregate sales of
RMB67.4bn, or 98% of its full-year target,
significantly outpacing peers, which secured 85%
on average. At the current pace of sales, we
expect COLI to comfortably beat its full-year
target, giving it flexibility to pace itself through
the end of 2011. For this reason, we would not be
surprised to see COLI take a breather in sales in
the final months of 2011, particularly as global
equity markets remain weak.
Balance sheet strength accompanied by cost of capital advantage
In addition to sales delivery, COLI stands out as
having the lowest cost of capital in the sector, as
multiple funding channels are made available to
it. Without the need to tap into the offshore high
yield market and with access to syndicated loans,
COLI can borrow at much lower costs than its
peers. In our view, the company’s significant cost
of capital advantage is a key investment attribute,
particularly as credit (both onshore and offshore)
remains tight amid slowing residential sales.
Furthermore, prudent balance sheet management
should underpin COLI’s financial flexibility
against a rather challenging market environment.
Strong earnings visibility
The combination of strong sales in prior years and
consistent contracted sales delivery y-t-d is the key
reason behind COLI’s strong earnings visibility.
With unbooked sales of RMB63bn as at July 2011
and aggregate sales of RMB67.4bn y-t-d, COLI
should have theoretically secured 98% of its 2012e
property development revenue. The strong
earnings security is also ahead of the sector, which
has locked in 70% of 2012e bookings on average.
Valuation and risks COLI is a conviction stock. We are OW(V) with a
new TP of HKD21, set at a 5% discount (versus par
previously) to our 12-month forward NAV of
HKD22.1. We tweak the target discount to reflect
increased market volatility that leads to a wider
measure of standard deviation from mean, but the
target discount is effectively unchanged at 0.5
standard deviation above mean.
Our TP of HKD21 suggests a potential return of
65%, including 3% dividend yield, which is above
the Neutral rating band of 0-20% for Chinese
stocks classified as volatile. Potential return
equals the percentage difference between the
current share price and the target price, including
the forecast dividend yield when indicated.
Key risks include any hiccup in contracted sales
delivery and deterioration in its cash collection
ratio as sales were concentrated in the final
months of 1H11.
China Overseas Land (688 HK) Industry bellwether with a proven execution platform underlined by consistent sales delivery
Significant cost of capital advantage amid continual tightness in credit
A conviction stock; reiterate OW (adding the volatility flag) with a reduced TP of HKD21 (from
HKD24.2) due to minor adjustment to target discount on the back of increased market volatility
渐飞研究报告 - http://bg.panlv.net
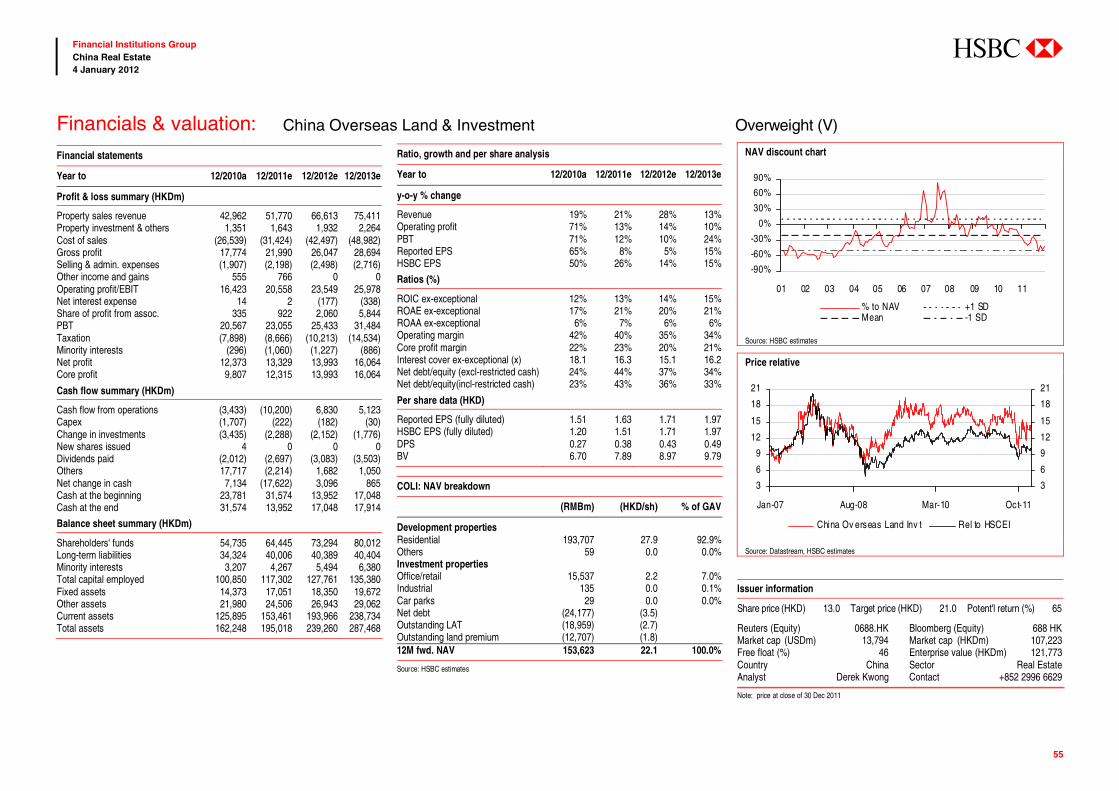
abc
55
Financial Institutions Group China Real Estate 4 January 2012
Financial statements
Year to 12/2010a 12/2011e 12/2012e 12/2013e
Profit & loss summary (HKDm)
Property sales revenue 42,962 51,770 66,613 75,411 Property investment & others 1,351 1,643 1,932 2,264 Cost of sales (26,539) (31,424) (42,497) (48,982)Gross profit 17,774 21,990 26,047 28,694 Selling & admin. expenses (1,907) (2,198) (2,498) (2,716)Other income and gains 555 766 0 0 Operating profit/EBIT 16,423 20,558 23,549 25,978 Net interest expense 14 2 (177) (338)Share of profit from assoc. 335 922 2,060 5,844 PBT 20,567 23,055 25,433 31,484 Taxation (7,898) (8,666) (10,213) (14,534)Minority interests (296) (1,060) (1,227) (886)Net profit 12,373 13,329 13,993 16,064 Core profit 9,807 12,315 13,993 16,064
Cash flow summary (HKDm)
Cash flow from operations (3,433) (10,200) 6,830 5,123 Capex (1,707) (222) (182) (30)Change in investments (3,435) (2,288) (2,152) (1,776)New shares issued 4 0 0 0 Dividends paid (2,012) (2,697) (3,083) (3,503)Others 17,717 (2,214) 1,682 1,050 Net change in cash 7,134 (17,622) 3,096 865 Cash at the beginning 23,781 31,574 13,952 17,048 Cash at the end 31,574 13,952 17,048 17,914
Balance sheet summary (HKDm)
Shareholders' funds 54,735 64,445 73,294 80,012 Long-term liabilities 34,324 40,006 40,389 40,404 Minority interests 3,207 4,267 5,494 6,380 Total capital employed 100,850 117,302 127,761 135,380 Fixed assets 14,373 17,051 18,350 19,672 Other assets 21,980 24,506 26,943 29,062 Current assets 125,895 153,461 193,966 238,734 Total assets 162,248 195,018 239,260 287,468
Ratio, growth and per share analysis
Year to 12/2010a 12/2011e 12/2012e 12/2013e
y-o-y % change
Revenue 19% 21% 28% 13%Operating profit 71% 13% 14% 10%PBT 71% 12% 10% 24%Reported EPS 65% 8% 5% 15%HSBC EPS 50% 26% 14% 15%
Ratios (%)
ROIC ex-exceptional 12% 13% 14% 15%ROAE ex-exceptional 17% 21% 20% 21%ROAA ex-exceptional 6% 7% 6% 6%Operating margin 42% 40% 35% 34%Core profit margin 22% 23% 20% 21%Interest cover ex-exceptional (x) 18.1 16.3 15.1 16.2 Net debt/equity (excl-restricted cash) 24% 44% 37% 34%Net debt/equity(incl-restricted cash) 23% 43% 36% 33%
Per share data (HKD)
Reported EPS (fully diluted) 1.51 1.63 1.71 1.97HSBC EPS (fully diluted) 1.20 1.51 1.71 1.97DPS 0.27 0.38 0.43 0.49BV 6.70 7.89 8.97 9.79 COLI: NAV breakdown
(RMBm) (HKD/sh) % of GAV
Development properties Residential 193,707 27.9 92.9%Others 59 0.0 0.0%Investment properties Office/retail 15,537 2.2 7.0%Industrial 135 0.0 0.1%Car parks 29 0.0 0.0%Net debt (24,177) (3.5)Outstanding LAT (18,959) (2.7)Outstanding land premium (12,707) (1.8)12M fwd. NAV 153,623 22.1 100.0%
Source: HSBC estimates
NAV discount chart
-90%
-60%
-30%
0%
30%
60%
90%
01 02 03 04 05 06 07 08 09 10 11
% to NAV +1 SDMean -1 SD
Source: HSBC estimates Price relative
3
6
9
12
15
18
21
Jan-07 Aug-08 Mar-10 Oct-11
3
6
9
12
15
18
21
China Ov erseas Land Inv t Rel to HSCEI
Source: Datastream, HSBC estimates
Issuer information
Share price (HKD) 13.0 Target price (HKD) 21.0 Potent'l return (%) 65
Reuters (Equity) 0688.HK Bloomberg (Equity) 688 HK Market cap (USDm) 13,794 Market cap (HKDm) 107,223 Free float (%) 46 Enterprise value (HKDm) 121,773 Country China Sector Real Estate Analyst Derek Kwong Contact +852 2996 6629
Note: price at close of 30 Dec 2011
Financials & valuation: China Overseas Land & Investment Overweight (V)
渐飞研究报告 - http://bg.panlv.net
abc
56
Financial Institutions Group China Real Estate 4 January 2012
Key highlights Pick-up in contracted sales momentum provides comfort on execution
China Resources Land (CRL) had a strong 2H11
in terms of sales, with 100% of its sales target
locked in as of November. Given the
improvement in sales momentum, we believe
CRL has the flexibility to pace itself through the
end of 2011and smooth out December sales to
2012. CRL has planned for several new launches
through year-end, including Oak Bay in Beijing
and Shanghai.
SOE background provides cost of capital advantage
With SOE backing from its parent company,
China Resources Hldg, CRL is able to reap the
benefits of significant cost of capital advantage,
driven by access to low-cost debt. Following
COLI’s lead, the company’s weighted cost of debt
is around 5%, based on our analysis. In our view,
this is a key positive attribute for the company in
such a capital-intensive environment.
Valuation and risks We upgrade to OW(V) from N and a new TP of
HKD17.6, set at a 15% discount (versus 55%
previously) to our revised 12-month forward
NAV of HKD20.7. In our view, operational
improvements in recent months, coupled with the
cost of capital advantage and balance sheet
strength, are the key reasons behind the narrowing
of the target NAV discount.
Our TP of HKD17.6 suggests a potential return of
44%, including 4% dividend yield, which is above
the Neutral rating band of 0-20% for Chinese
stocks classified as volatile. Potential return
equals the percentage difference between the
current share price and the target price, including
the forecast dividend yield when indicated.
Key risks include the inability to sustain current
contracted sales momentum and to contain
gearing levels. Moving forward, CRL needs to
take on a prudent land banking approach. Another
risk is the potential dilutive impact from large-
scale asset injection that may require equity
issuance at a significant discount.
China Resources Land (1109 HK) A pick-up in contracted sales momentum saw CRL exceed its 2011 full-year sales target by November
Strong fundamentals include solid balance sheet, low cost of capital and a huge recurring income base
Upgrade to OW(V) from N with a higher TP of HKD17.6 (from HKD11) on narrowing target discount to
15% (+0.5 SD) from 55% (-1 SD). We add CRL as a conviction stock
渐飞研究报告 - http://bg.panlv.net
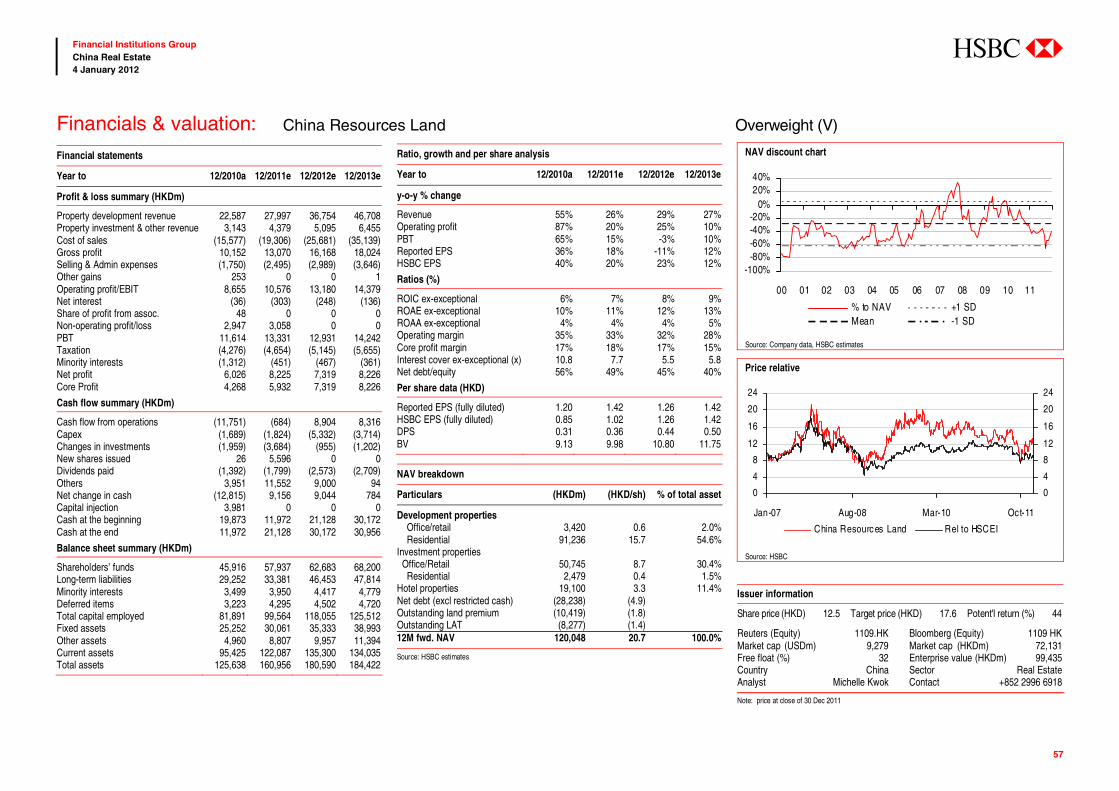
abc
57
Financial Institutions Group China Real Estate 4 January 2012
Financial statements
Year to 12/2010a 12/2011e 12/2012e 12/2013e
Profit & loss summary (HKDm)
Property development revenue 22,587 27,997 36,754 46,708 Property investment & other revenue 3,143 4,379 5,095 6,455 Cost of sales (15,577) (19,306) (25,681) (35,139)Gross profit 10,152 13,070 16,168 18,024 Selling & Admin expenses (1,750) (2,495) (2,989) (3,646)Other gains 253 0 0 1 Operating profit/EBIT 8,655 10,576 13,180 14,379 Net interest (36) (303) (248) (136)Share of profit from assoc. 48 0 0 0 Non-operating profit/loss 2,947 3,058 0 0 PBT 11,614 13,331 12,931 14,242 Taxation (4,276) (4,654) (5,145) (5,655)Minority interests (1,312) (451) (467) (361)Net profit 6,026 8,225 7,319 8,226 Core Profit 4,268 5,932 7,319 8,226
Cash flow summary (HKDm)
Cash flow from operations (11,751) (684) 8,904 8,316 Capex (1,689) (1,824) (5,332) (3,714)Changes in investments (1,959) (3,684) (955) (1,202)New shares issued 26 5,596 0 0 Dividends paid (1,392) (1,799) (2,573) (2,709)Others 3,951 11,552 9,000 94 Net change in cash (12,815) 9,156 9,044 784 Capital injection 3,981 0 0 0 Cash at the beginning 19,873 11,972 21,128 30,172 Cash at the end 11,972 21,128 30,172 30,956
Balance sheet summary (HKDm)
Shareholders’ funds 45,916 57,937 62,683 68,200 Long-term liabilities 29,252 33,381 46,453 47,814 Minority interests 3,499 3,950 4,417 4,779 Deferred items 3,223 4,295 4,502 4,720 Total capital employed 81,891 99,564 118,055 125,512 Fixed assets 25,252 30,061 35,333 38,993 Other assets 4,960 8,807 9,957 11,394 Current assets 95,425 122,087 135,300 134,035 Total assets 125,638 160,956 180,590 184,422
Ratio, growth and per share analysis
Year to 12/2010a 12/2011e 12/2012e 12/2013e
y-o-y % change
Revenue 55% 26% 29% 27%Operating profit 87% 20% 25% 10%PBT 65% 15% -3% 10%Reported EPS 36% 18% -11% 12%HSBC EPS 40% 20% 23% 12%
Ratios (%)
ROIC ex-exceptional 6% 7% 8% 9%ROAE ex-exceptional 10% 11% 12% 13%ROAA ex-exceptional 4% 4% 4% 5%Operating margin 35% 33% 32% 28%Core profit margin 17% 18% 17% 15%Interest cover ex-exceptional (x) 10.8 7.7 5.5 5.8 Net debt/equity 56% 49% 45% 40%
Per share data (HKD)
Reported EPS (fully diluted) 1.20 1.42 1.26 1.42HSBC EPS (fully diluted) 0.85 1.02 1.26 1.42DPS 0.31 0.36 0.44 0.50BV 9.13 9.98 10.80 11.75 NAV breakdown
Particulars (HKDm) (HKD/sh) % of total asset
Development properties Office/retail 3,420 0.6 2.0% Residential 91,236 15.7 54.6%Investment properties Office/Retail 50,745 8.7 30.4% Residential 2,479 0.4 1.5%Hotel properties 19,100 3.3 11.4%Net debt (excl restricted cash) (28,238) (4.9) Outstanding land premium (10,419) (1.8) Outstanding LAT (8,277) (1.4) 12M fwd. NAV 120,048 20.7 100.0%
Source: HSBC estimates
NAV discount chart
-100%-80%-60%-40%-20%
0%20%40%
00 01 02 03 04 05 06 07 08 09 10 11
% to NAV +1 SDMean -1 SD
Source: Company data, HSBC estimates
Price relative
0
4
8
12
16
20
24
Jan-07 Aug-08 Mar-10 Oct-11
0
4
8
12
16
20
24
China Resources Land Rel to HSCEI
Source: HSBC
Issuer information
Share price (HKD) 12.5 Target price (HKD) 17.6 Potent'l return (%) 44
Reuters (Equity) 1109.HK Bloomberg (Equity) 1109 HK Market cap (USDm) 9,279 Market cap (HKDm) 72,131 Free float (%) 32 Enterprise value (HKDm) 99,435 Country China Sector Real Estate Analyst Michelle Kwok Contact +852 2996 6918
Note: price at close of 30 Dec 2011
Financials & valuation: China Resources Land Overweight (V)
渐飞研究报告 - http://bg.panlv.net
abc
58
Financial Institutions Group China Real Estate 4 January 2012
Key highlights Firmly on track to achieve contracted sales target
Franshion secured nearly 90% of its contracted
sales target of RMB10bn year-to-November,
excluding a portion of subscription sales from
Beijing Jin Mao Palace that are yet to be
contracted. This sales run rate compares
favourably with the sector average of c80%. We
expect sales to slow down in the final months of
2011, driven by the remaining inventory of
Beijing Jin Mao Palace and Shanghai Jinmao
Noble Manor.
Execution of Changsha project off to a good start
The primary development project at Changsha and
continuous disposal of commercial buildings in
Shanghai will be key revenue stabilisers for
Franshion in the coming five years, in our view.
Following the land sale in Changsha in October, we
expect Franshion to continue to sell 600-900mu of
land pa in the coming five years. Excluding the
portion bought back by the company for secondary
development, we expect this development to
contribute RMB1-2bn pa, representing 10-20% of
our estimated gross revenue.
Much improvement seen in earnings visibility
The satisfactory sales of Beijing Jin Mao Palace
in 2011 helped secure nearly 30% of our
estimated development revenue in 2012, barring
any completion slippage. In addition, the
company is in negotiation to dispose of another
commercial building in Shanghai for an estimated
consideration of RMB4bn. Upon materialisation
of this en-bloc transaction, the revenue lock-in
ratio would reach 50%.
Valuation and risks We reiterate our OW rating and set a new TP of
HKD1.9 based on a 60% discount (versus 55%
previously) to our 12-month forward NAV of
HKD4.8 (down from HKD5.4). While we continue
to set the target discount at 1 SD below the
historical mean, the discount has widened on an
absolute basis due to increased market volatility.
Our TP of HKD1.9 suggests potential return of
30%, inclusive of 3% dividend yield, which is
above the Neutral band of 5-15% for Chinese
stocks classified as non-volatile. Potential return
equals the percentage difference between the
current share price and the target price, including
the forecast dividend yield when indicated.
Key risks include slippage in the development
schedule/lower-than-expected demand for the
Changsha project and lower-than-expected ASP
from major en-bloc sales.
Franshion (817 HK) Year-to-November contracted sales progress firmly on target
The Changsha land sale marks the beginning of a more exciting growth platform
Reiterate OW with a reduced TP of HKD1.9 (from HKD2.5); target discount mildly adjusted to 60% but
remains 1 SD below mean
渐飞研究报告 - http://bg.panlv.net
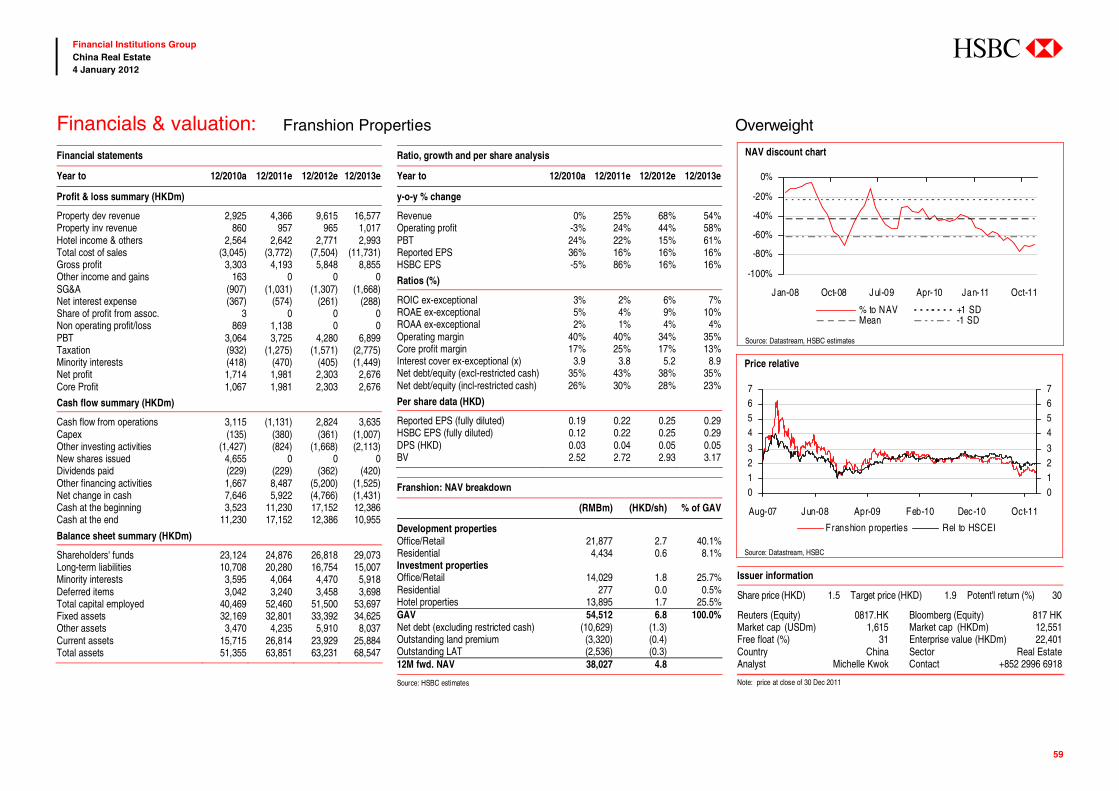
abc
59
Financial Institutions Group China Real Estate 4 January 2012
Financial statements
Year to 12/2010a 12/2011e 12/2012e 12/2013e
Profit & loss summary (HKDm)
Property dev revenue 2,925 4,366 9,615 16,577 Property inv revenue 860 957 965 1,017 Hotel income & others 2,564 2,642 2,771 2,993 Total cost of sales (3,045) (3,772) (7,504) (11,731)Gross profit 3,303 4,193 5,848 8,855 Other income and gains 163 0 0 0 SG&A (907) (1,031) (1,307) (1,668)Net interest expense (367) (574) (261) (288)Share of profit from assoc. 3 0 0 0 Non operating profit/loss 869 1,138 0 0 PBT 3,064 3,725 4,280 6,899 Taxation (932) (1,275) (1,571) (2,775)Minority interests (418) (470) (405) (1,449)Net profit 1,714 1,981 2,303 2,676 Core Profit 1,067 1,981 2,303 2,676
Cash flow summary (HKDm)
Cash flow from operations 3,115 (1,131) 2,824 3,635 Capex (135) (380) (361) (1,007)Other investing activities (1,427) (824) (1,668) (2,113)New shares issued 4,655 0 0 0 Dividends paid (229) (229) (362) (420)Other financing activities 1,667 8,487 (5,200) (1,525)Net change in cash 7,646 5,922 (4,766) (1,431)Cash at the beginning 3,523 11,230 17,152 12,386 Cash at the end 11,230 17,152 12,386 10,955
Balance sheet summary (HKDm)
Shareholders' funds 23,124 24,876 26,818 29,073 Long-term liabilities 10,708 20,280 16,754 15,007 Minority interests 3,595 4,064 4,470 5,918 Deferred items 3,042 3,240 3,458 3,698 Total capital employed 40,469 52,460 51,500 53,697 Fixed assets 32,169 32,801 33,392 34,625 Other assets 3,470 4,235 5,910 8,037 Current assets 15,715 26,814 23,929 25,884 Total assets 51,355 63,851 63,231 68,547
Ratio, growth and per share analysis
Year to 12/2010a 12/2011e 12/2012e 12/2013e
y-o-y % change
Revenue 0% 25% 68% 54%Operating profit -3% 24% 44% 58%PBT 24% 22% 15% 61%Reported EPS 36% 16% 16% 16%HSBC EPS -5% 86% 16% 16%
Ratios (%)
ROIC ex-exceptional 3% 2% 6% 7%ROAE ex-exceptional 5% 4% 9% 10%ROAA ex-exceptional 2% 1% 4% 4%Operating margin 40% 40% 34% 35%Core profit margin 17% 25% 17% 13%Interest cover ex-exceptional (x) 3.9 3.8 5.2 8.9 Net debt/equity (excl-restricted cash) 35% 43% 38% 35%Net debt/equity (incl-restricted cash) 26% 30% 28% 23%
Per share data (HKD)
Reported EPS (fully diluted) 0.19 0.22 0.25 0.29HSBC EPS (fully diluted) 0.12 0.22 0.25 0.29DPS (HKD) 0.03 0.04 0.05 0.05BV 2.52 2.72 2.93 3.17 Franshion: NAV breakdown
(RMBm) (HKD/sh) % of GAV
Development properties Office/Retail 21,877 2.7 40.1%Residential 4,434 0.6 8.1%Investment properties Office/Retail 14,029 1.8 25.7%Residential 277 0.0 0.5%Hotel properties 13,895 1.7 25.5%GAV 54,512 6.8 100.0%Net debt (excluding restricted cash) (10,629) (1.3)Outstanding land premium (3,320) (0.4)Outstanding LAT (2,536) (0.3)12M fwd. NAV 38,027 4.8
Source: HSBC estimates
NAV discount chart
-100%
-80%
-60%
-40%
-20%
0%
Jan-08 Oct-08 Jul-09 Apr-10 Jan-11 Oct-11
% to NAV +1 SDMean -1 SD
Source: Datastream, HSBC estimates
Price relative
0123
4567
Aug-07 Jun-08 Apr-09 Feb-10 Dec-10 Oct-11
0123
4567
Franshion properties Rel to HSCEI
Source: Datastream, HSBC Issuer information
Share price (HKD) 1.5 Target price (HKD) 1.9 Potent'l return (%) 30
Reuters (Equity) 0817.HK Bloomberg (Equity) 817 HK Market cap (USDm) 1,615 Market cap (HKDm) 12,551 Free float (%) 31 Enterprise value (HKDm) 22,401 Country China Sector Real Estate Analyst Michelle Kwok Contact +852 2996 6918
Note: price at close of 30 Dec 2011
Financials & valuation: Franshion Properties Overweight
渐飞研究报告 - http://bg.panlv.net
abc
60
Financial Institutions Group China Real Estate 4 January 2012
Key highlights Lags the pack in contracted sales
Year-to-November, Guangzhou R&F secured
RMB26.3bn of contracted sales, representing 82%
of the revised full-year target (RMB32bn) or 66%
of the initial target (RMB40bn), lagging the sector
average of 85%. We believe contracted sales for
December (and full-year 2011) will hinge on three
major new launches in December 2011, namely
Guangzhou Yingkai Plaza, Taiyuan Edinburg
Residence and Nanjing Qi Lin Hi-tech Park, with
total saleable resources of RMB8.7bn. We
estimate a sell-through rate of over 70% will be
needed for the company to achieve its full-year
sales target, which is much higher than the current
sell-through rate of about 50%. We therefore
expect the company to miss its 2011 full-year
sales target by 5%.
Maintaining dividend payout, while slowing acquisition plan for 2012
Since listing in 2005, Guangzhou R&F has
consistently distributed 40-45% of underlying
profit to shareholders, including in 2008.
Management is confident of maintaining a stable
payout ratio for 2011, on the back of a reasonable
balance sheet and a slowdown in land acquisition.
As of November, the company had RMB1.7bn
unpaid land premium outstanding, but a strong cash
balance of RMB12bn (including restricted cash).
Valuation and risks In view of the slow momentum in contracted sales
year-to-November, we reiterate our OW rating
(adding the volatility flag) with a reduced TP of
HKD7.1, set at a 60% discount (from 56%) to our
12-month forward NAV of HKD17.8 (from
HKD20.4).
We fine tune the target discount modestly to 60%
from 56%, due to increased market volatility that
leads to a wider 1 SD from mean, and maintain
the target discount at 1 SD below mean.
We lower our 12-month forward NAV due to an
upward revision of WACC and revised
assumption of expected ASP and the contracted
sales schedule.
Our TP of HKD7.1 suggests a potential return of
26%, including 10% dividend yield, which is
above the Neutral band of 0-20% for Chinese
stocks classified as volatile. Potential return
equals the percentage difference between the
current share price and the target price, including
the forecast dividend yield when indicated.
Key risk includes slower execution of new
launches, especially Guangzhou Yingkai Plaza.
Guangzhou R&F (2777 HK) Likely to miss already-revised full-year sales target of RMB32bn, unless en-bloc transaction kicks in
Management confident of maintaining the dividend payout ratio at the historical level
Reiterate OW (adding the volatility flag) with a reduced TP of HKD7.1 (from HKD8.9) based on 60%
target discount (1 SD below mean)
渐飞研究报告 - http://bg.panlv.net
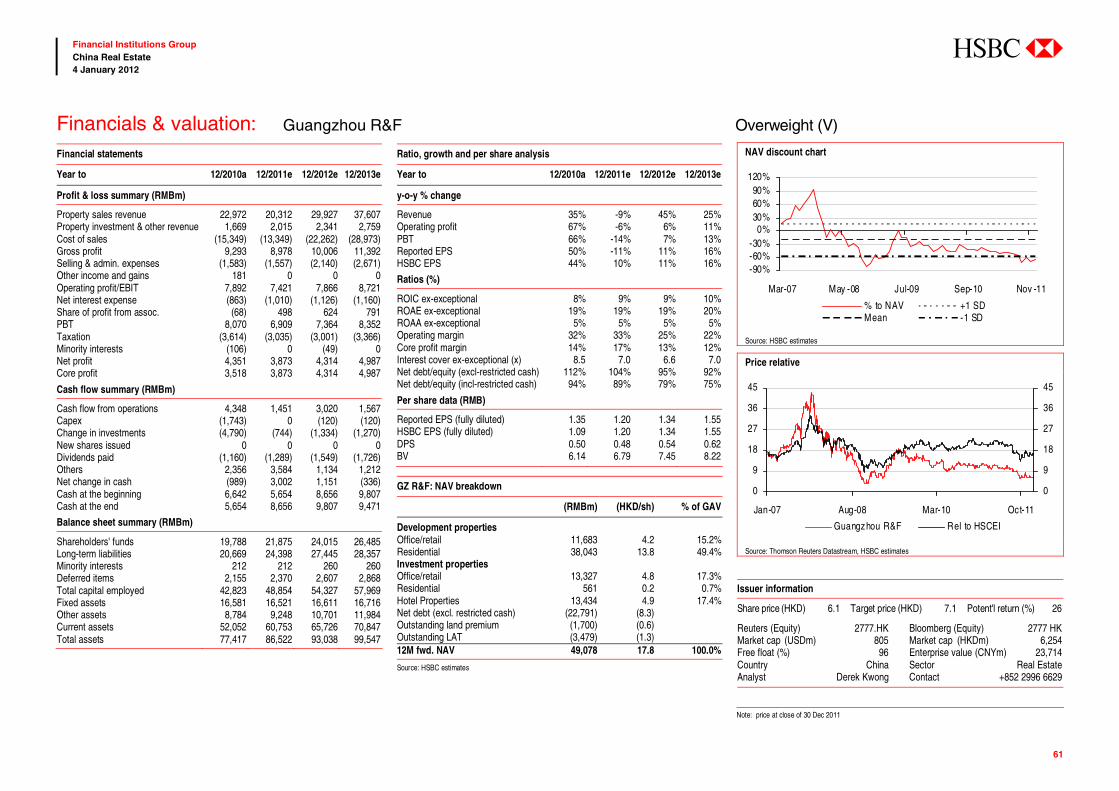
abc
61
Financial Institutions Group China Real Estate 4 January 2012
Financial statements
Year to 12/2010a 12/2011e 12/2012e 12/2013e
Profit & loss summary (RMBm)
Property sales revenue 22,972 20,312 29,927 37,607 Property investment & other revenue 1,669 2,015 2,341 2,759 Cost of sales (15,349) (13,349) (22,262) (28,973)Gross profit 9,293 8,978 10,006 11,392 Selling & admin. expenses (1,583) (1,557) (2,140) (2,671)Other income and gains 181 0 0 0 Operating profit/EBIT 7,892 7,421 7,866 8,721 Net interest expense (863) (1,010) (1,126) (1,160)Share of profit from assoc. (68) 498 624 791 PBT 8,070 6,909 7,364 8,352 Taxation (3,614) (3,035) (3,001) (3,366)Minority interests (106) 0 (49) 0 Net profit 4,351 3,873 4,314 4,987 Core profit 3,518 3,873 4,314 4,987
Cash flow summary (RMBm)
Cash flow from operations 4,348 1,451 3,020 1,567 Capex (1,743) 0 (120) (120)Change in investments (4,790) (744) (1,334) (1,270)New shares issued 0 0 0 0 Dividends paid (1,160) (1,289) (1,549) (1,726)Others 2,356 3,584 1,134 1,212 Net change in cash (989) 3,002 1,151 (336)Cash at the beginning 6,642 5,654 8,656 9,807 Cash at the end 5,654 8,656 9,807 9,471
Balance sheet summary (RMBm)
Shareholders' funds 19,788 21,875 24,015 26,485 Long-term liabilities 20,669 24,398 27,445 28,357 Minority interests 212 212 260 260 Deferred items 2,155 2,370 2,607 2,868 Total capital employed 42,823 48,854 54,327 57,969 Fixed assets 16,581 16,521 16,611 16,716 Other assets 8,784 9,248 10,701 11,984 Current assets 52,052 60,753 65,726 70,847 Total assets 77,417 86,522 93,038 99,547
Ratio, growth and per share analysis
Year to 12/2010a 12/2011e 12/2012e 12/2013e
y-o-y % change
Revenue 35% -9% 45% 25%Operating profit 67% -6% 6% 11%PBT 66% -14% 7% 13%Reported EPS 50% -11% 11% 16%HSBC EPS 44% 10% 11% 16%
Ratios (%)
ROIC ex-exceptional 8% 9% 9% 10%ROAE ex-exceptional 19% 19% 19% 20%ROAA ex-exceptional 5% 5% 5% 5%Operating margin 32% 33% 25% 22%Core profit margin 14% 17% 13% 12%Interest cover ex-exceptional (x) 8.5 7.0 6.6 7.0 Net debt/equity (excl-restricted cash) 112% 104% 95% 92%Net debt/equity (incl-restricted cash) 94% 89% 79% 75%
Per share data (RMB)
Reported EPS (fully diluted) 1.35 1.20 1.34 1.55HSBC EPS (fully diluted) 1.09 1.20 1.34 1.55DPS 0.50 0.48 0.54 0.62BV 6.14 6.79 7.45 8.22 GZ R&F: NAV breakdown
(RMBm) (HKD/sh) % of GAV
Development properties Office/retail 11,683 4.2 15.2%Residential 38,043 13.8 49.4%Investment properties Office/retail 13,327 4.8 17.3%Residential 561 0.2 0.7%Hotel Properties 13,434 4.9 17.4%Net debt (excl. restricted cash) (22,791) (8.3)Outstanding land premium (1,700) (0.6)Outstanding LAT (3,479) (1.3)12M fwd. NAV 49,078 17.8 100.0%
Source: HSBC estimates
NAV discount chart
-90%-60%-30%
0%30%60%90%
120%
Mar-07 May -08 Jul-09 Sep-10 Nov -11
% to NAV +1 SDMean -1 SD
Source: HSBC estimates Price relative
0
9
18
27
36
45
Jan-07 Aug-08 Mar-10 Oct-11
0
9
18
27
36
45
Guangzhou R&F Rel to HSCEI
Source: Thomson Reuters Datastream, HSBC estimates
Issuer information
Share price (HKD) 6.1 Target price (HKD) 7.1 Potent'l return (%) 26
Reuters (Equity) 2777.HK Bloomberg (Equity) 2777 HK Market cap (USDm) 805 Market cap (HKDm) 6,254 Free float (%) 96 Enterprise value (CNYm) 23,714 Country China Sector Real Estate Analyst Derek Kwong Contact +852 2996 6629
Note: price at close of 30 Dec 2011
Financials & valuation: Guangzhou R&F Overweight (V)
渐飞研究报告 - http://bg.panlv.net
abc
62
Financial Institutions Group China Real Estate 4 January 2012
Key highlights Capitalised on the distressed valuation of a quality mid-cap
We reiterate our positive view on KWG, which is
now trading near the distressed level of a 78%
discount to our forward NAV of HKD13. While
the company’s operational performance has
declined in 2H11, its liquidity position is
manageable given the absence of large land
acquisitions. The pipeline indicates more project
launches in early 2012, which should boost
contract sales and act as a key share price catalyst.
Our new target is set at a 65% discount to our
forward NAV, which captures the 10-20% price
decline assumption.
Contract sales to be below annual target
KWG is the laggard of the pack with year-to-
November contracted sales tracking significantly
behind schedule at a run rate of only 73% versus the
full-year target of RMB15bn. The key reason for the
slower-than-expected contract sales has been the
lack of new project launches throughout 2011. Thus
far, the company has not launched any of its
Shanghai projects, and we believe some of these
launches did not happen until 2012. In Guangzhou,
the company finally launched the Liede project
(Riviera) in late November. We believe full-year
sales will fall short of the target by c20%.
Valuation and risks We reiterate OW and add a volatility flag with a TP
of HKD4.5 (from HKD8.5). We revise our target
discount to 65% or 0.5 SD below the mean on the
back of weaker operations in 2H11. Previously, the
target discount was 45% or 0.5 SD above the
historical mean. We lower our 12-month forward
NAV to HKD13 from HKD15.5, reflecting lower
ASP and widened WACC assumption.
Our TP suggests a potential return of 81%, including
8% dividend yield, which is above the Neutral band
of 0-20% for Chinese stocks classified as volatile.
Potential return equals the percentage difference
between the current share price and the target price,
including the forecast dividend yield when indicated.
Key risks include ASP declines greater than our
assumptions and continued delay in project launches.
KWG Property (1813 HK) KWG is a quality mid-cap trading at a near-distress valuation; our “value” pick within the Chinese
property space
Delay in project launches led to lower contract sales in 2H11, full-year sales likely to miss target by
20%, but liquidity position manageable given the absence of large land acquisitions
Reiterate OW (adding the volatility flag) with a reduced TP of HKD4.5 (from HKD8.5) based on a 65%
discount to our forward NAV estimate
渐飞研究报告 - http://bg.panlv.net
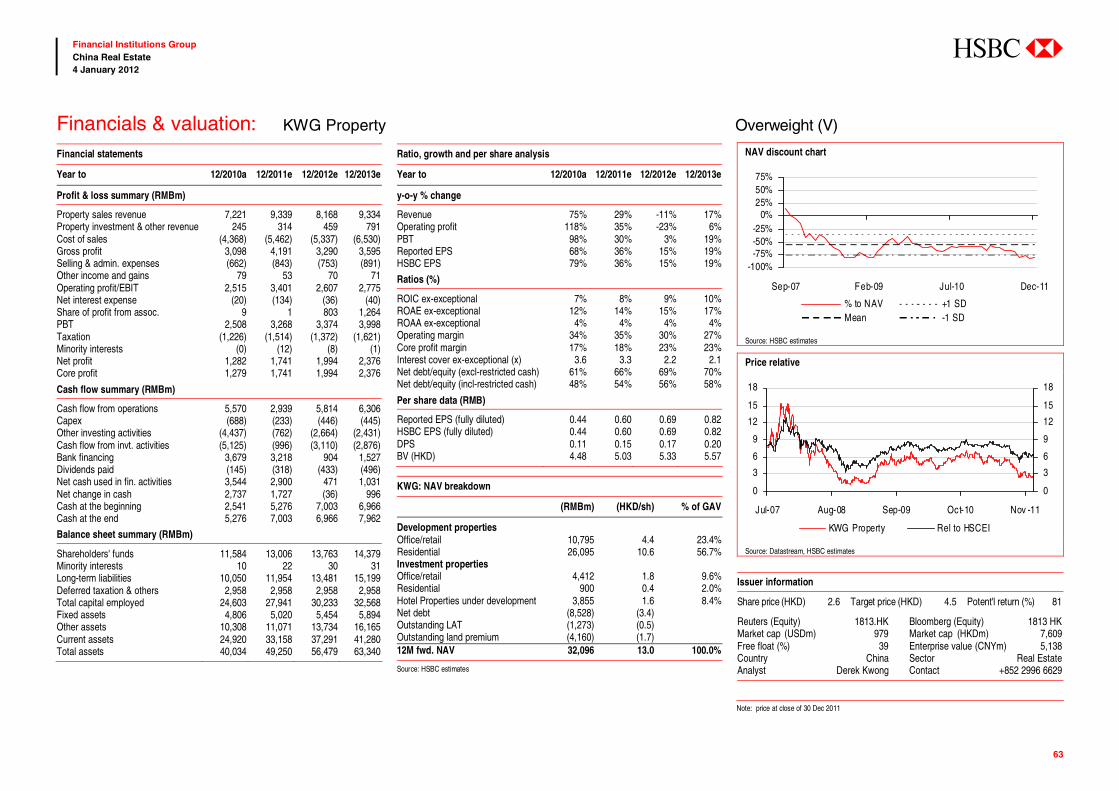
abc
63
Financial Institutions Group China Real Estate 4 January 2012
Financial statements
Year to 12/2010a 12/2011e 12/2012e 12/2013e
Profit & loss summary (RMBm)
Property sales revenue 7,221 9,339 8,168 9,334 Property investment & other revenue 245 314 459 791 Cost of sales (4,368) (5,462) (5,337) (6,530)Gross profit 3,098 4,191 3,290 3,595 Selling & admin. expenses (662) (843) (753) (891)Other income and gains 79 53 70 71 Operating profit/EBIT 2,515 3,401 2,607 2,775 Net interest expense (20) (134) (36) (40)Share of profit from assoc. 9 1 803 1,264 PBT 2,508 3,268 3,374 3,998 Taxation (1,226) (1,514) (1,372) (1,621)Minority interests (0) (12) (8) (1)Net profit 1,282 1,741 1,994 2,376 Core profit 1,279 1,741 1,994 2,376
Cash flow summary (RMBm)
Cash flow from operations 5,570 2,939 5,814 6,306 Capex (688) (233) (446) (445)Other investing activities (4,437) (762) (2,664) (2,431)Cash flow from invt. activities (5,125) (996) (3,110) (2,876)Bank financing 3,679 3,218 904 1,527 Dividends paid (145) (318) (433) (496)Net cash used in fin. activities 3,544 2,900 471 1,031 Net change in cash 2,737 1,727 (36) 996 Cash at the beginning 2,541 5,276 7,003 6,966 Cash at the end 5,276 7,003 6,966 7,962
Balance sheet summary (RMBm)
Shareholders' funds 11,584 13,006 13,763 14,379 Minority interests 10 22 30 31 Long-term liabilities 10,050 11,954 13,481 15,199 Deferred taxation & others 2,958 2,958 2,958 2,958 Total capital employed 24,603 27,941 30,233 32,568 Fixed assets 4,806 5,020 5,454 5,894 Other assets 10,308 11,071 13,734 16,165 Current assets 24,920 33,158 37,291 41,280 Total assets 40,034 49,250 56,479 63,340
Ratio, growth and per share analysis
Year to 12/2010a 12/2011e 12/2012e 12/2013e
y-o-y % change
Revenue 75% 29% -11% 17%Operating profit 118% 35% -23% 6%PBT 98% 30% 3% 19%Reported EPS 68% 36% 15% 19%HSBC EPS 79% 36% 15% 19%
Ratios (%)
ROIC ex-exceptional 7% 8% 9% 10%ROAE ex-exceptional 12% 14% 15% 17%ROAA ex-exceptional 4% 4% 4% 4%Operating margin 34% 35% 30% 27%Core profit margin 17% 18% 23% 23%Interest cover ex-exceptional (x) 3.6 3.3 2.2 2.1Net debt/equity (excl-restricted cash) 61% 66% 69% 70%Net debt/equity (incl-restricted cash) 48% 54% 56% 58%
Per share data (RMB)
Reported EPS (fully diluted) 0.44 0.60 0.69 0.82HSBC EPS (fully diluted) 0.44 0.60 0.69 0.82DPS 0.11 0.15 0.17 0.20BV (HKD) 4.48 5.03 5.33 5.57 KWG: NAV breakdown
(RMBm) (HKD/sh) % of GAV
Development properties Office/retail 10,795 4.4 23.4%Residential 26,095 10.6 56.7%Investment properties Office/retail 4,412 1.8 9.6%Residential 900 0.4 2.0%Hotel Properties under development 3,855 1.6 8.4%Net debt (8,528) (3.4)Outstanding LAT (1,273) (0.5)Outstanding land premium (4,160) (1.7)12M fwd. NAV 32,096 13.0 100.0%
Source: HSBC estimates
NAV discount chart
-100%-75%-50%-25%
0%25%50%75%
Sep-07 Feb-09 Jul-10 Dec-11
% to NAV +1 SDMean -1 SD
Source: HSBC estimates Price relative
0
3
6
9
12
15
18
Jul-07 Aug-08 Sep-09 Oct-10 Nov -11
0
3
6
9
12
15
18
KWG Property Rel to HSCEI
Source: Datastream, HSBC estimates
Issuer information
Share price (HKD) 2.6 Target price (HKD) 4.5 Potent'l return (%) 81
Reuters (Equity) 1813.HK Bloomberg (Equity) 1813 HK Market cap (USDm) 979 Market cap (HKDm) 7,609 Free float (%) 39 Enterprise value (CNYm) 5,138 Country China Sector Real Estate Analyst Derek Kwong Contact +852 2996 6629
Note: price at close of 30 Dec 2011
Financials & valuation: KWG Property Overweight (V)
渐飞研究报告 - http://bg.panlv.net
abc
64
Financial Institutions Group China Real Estate 4 January 2012
Key highlights Market concerns over contract sales and price cuts appear overdone
The company reignited a brisk pace of contract
sales after a slowdown in June and July 2011. We
expect the strong momentum to help the company
exceed its annual target. Recent price promotions
were enthusiastically received by the market,
resulting in 90%-plus sell-through rates.
Effectively managing HPR by shifting product mix and geographic focus
Longfor has effectively managed the impact of
HPR by shifting product mix and geographic
focus. By focusing on market consolidation in key
cities in the Western Region and engaging in
direct price competition in the Yangtze River
Delta and Pan Bohai Region, the company has
achieved healthy cash flow through strong sell-
through and quick cash collection.
Aligning operational changes with long-term strategy; enhancing institutional capabilities
The company’s long-term strategy is to dominate
the mid- to high-end of the market, providing
quality products with a compelling value
proposition across a broad market segment.
IP portfolio of mid-market retail properties to enhance income stability and margin preservation The company has identified mid-market retail properties as the key recurrent income asset to help preserve margin over the long term. It intends to grow its IP portfolio at a measured pace such that it may contribute up to 25% of net income in 10-15 years.
Valuation and risks We reiterate OW(V) with a TP of HKD13.3.
Longfor is one of our conviction stocks in the
China property space, and we believe its
execution and strategy will continue to support
share price outperformance. We revise our target
discount to be in line with the historical average.
We lower our 12-month forward NAV estimate to
HKD19 from HKD21.5, reflecting lower ASP and
widened WACC assumptions.
Our TP suggests a potential return of 55%, including
3% dividend yield, which is above the Neutral band
of 0-20% return around the current share price for
Chinese stocks classified as volatile. Potential return
equals the percentage difference between the current
share price and the target price, including the
forecast dividend yield when indicated. Key risks
include ASP declines greater than our assumptions.
Longfor (960 HK) Despite the market’s concern over recent price cuts, Longfor remains on track to deliver its operational
targets
Strong conviction on management’s long-term vision and strategy to create a “market leader”
A conviction stock; reiterate OW(V) with a reduced TP of HKD13.3 (from HKD17.2) based on a 30%
discount to forward NAV of HKD19
渐飞研究报告 - http://bg.panlv.net
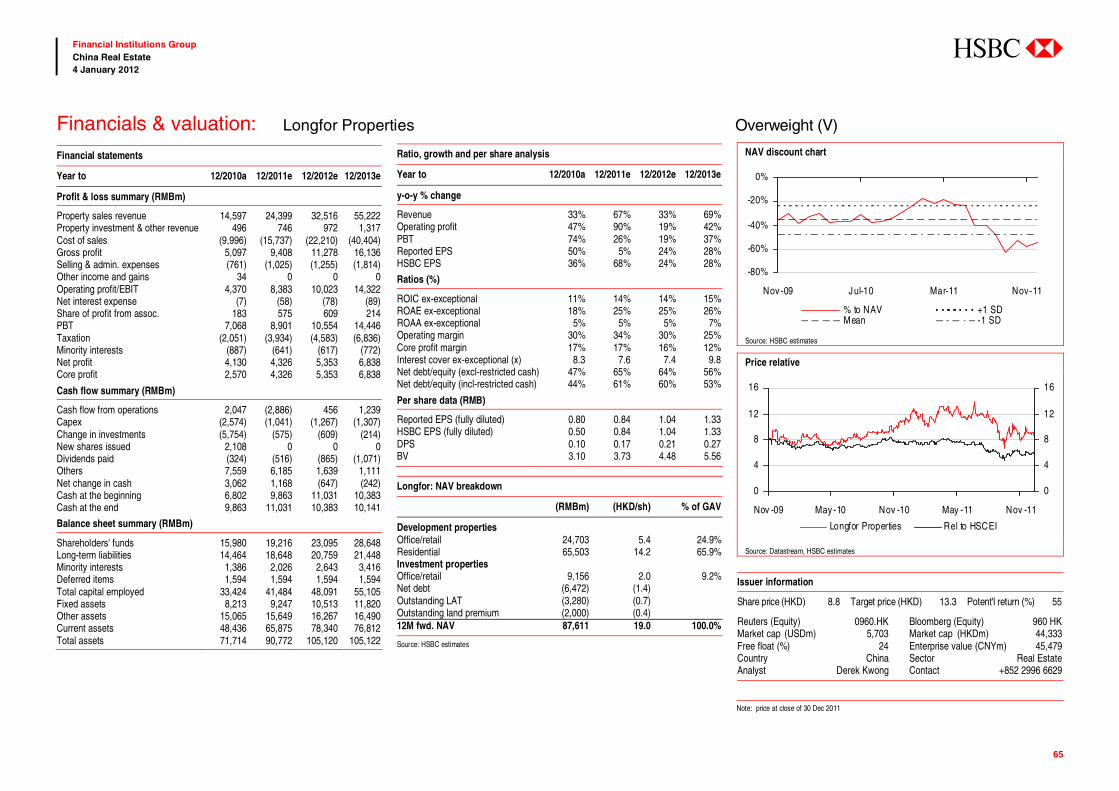
abc
65
Financial Institutions Group China Real Estate 4 January 2012
Financial statements
Year to 12/2010a 12/2011e 12/2012e 12/2013e
Profit & loss summary (RMBm)
Property sales revenue 14,597 24,399 32,516 55,222 Property investment & other revenue 496 746 972 1,317 Cost of sales (9,996) (15,737) (22,210) (40,404)Gross profit 5,097 9,408 11,278 16,136 Selling & admin. expenses (761) (1,025) (1,255) (1,814)Other income and gains 34 0 0 0 Operating profit/EBIT 4,370 8,383 10,023 14,322 Net interest expense (7) (58) (78) (89)Share of profit from assoc. 183 575 609 214 PBT 7,068 8,901 10,554 14,446 Taxation (2,051) (3,934) (4,583) (6,836)Minority interests (887) (641) (617) (772)Net profit 4,130 4,326 5,353 6,838 Core profit 2,570 4,326 5,353 6,838
Cash flow summary (RMBm)
Cash flow from operations 2,047 (2,886) 456 1,239 Capex (2,574) (1,041) (1,267) (1,307)Change in investments (5,754) (575) (609) (214)New shares issued 2,108 0 0 0 Dividends paid (324) (516) (865) (1,071)Others 7,559 6,185 1,639 1,111 Net change in cash 3,062 1,168 (647) (242)Cash at the beginning 6,802 9,863 11,031 10,383 Cash at the end 9,863 11,031 10,383 10,141
Balance sheet summary (RMBm)
Shareholders' funds 15,980 19,216 23,095 28,648 Long-term liabilities 14,464 18,648 20,759 21,448 Minority interests 1,386 2,026 2,643 3,416 Deferred items 1,594 1,594 1,594 1,594 Total capital employed 33,424 41,484 48,091 55,105 Fixed assets 8,213 9,247 10,513 11,820 Other assets 15,065 15,649 16,267 16,490 Current assets 48,436 65,875 78,340 76,812 Total assets 71,714 90,772 105,120 105,122
Ratio, growth and per share analysis
Year to 12/2010a 12/2011e 12/2012e 12/2013e
y-o-y % change
Revenue 33% 67% 33% 69%Operating profit 47% 90% 19% 42%PBT 74% 26% 19% 37%Reported EPS 50% 5% 24% 28%HSBC EPS 36% 68% 24% 28%
Ratios (%)
ROIC ex-exceptional 11% 14% 14% 15%ROAE ex-exceptional 18% 25% 25% 26%ROAA ex-exceptional 5% 5% 5% 7%Operating margin 30% 34% 30% 25%Core profit margin 17% 17% 16% 12%Interest cover ex-exceptional (x) 8.3 7.6 7.4 9.8 Net debt/equity (excl-restricted cash) 47% 65% 64% 56%Net debt/equity (incl-restricted cash) 44% 61% 60% 53%
Per share data (RMB)
Reported EPS (fully diluted) 0.80 0.84 1.04 1.33HSBC EPS (fully diluted) 0.50 0.84 1.04 1.33DPS 0.10 0.17 0.21 0.27BV 3.10 3.73 4.48 5.56 Longfor: NAV breakdown
(RMBm) (HKD/sh) % of GAV
Development properties
Office/retail 24,703 5.4 24.9%Residential 65,503 14.2 65.9%Investment properties Office/retail 9,156 2.0 9.2%Net debt (6,472) (1.4) Outstanding LAT (3,280) (0.7) Outstanding land premium (2,000) (0.4) 12M fwd. NAV 87,611 19.0 100.0%
Source: HSBC estimates
NAV discount chart
-80%
-60%
-40%
-20%
0%
Nov -09 Jul-10 Mar-11 Nov-11
% to NAV +1 SDMean -1 SD
Source: HSBC estimates Price relative
0
4
8
12
16
Nov -09 May -10 Nov -10 May -11 Nov -11
0
4
8
12
16
Longfor Properties Rel to HSCEI
Source: Datastream, HSBC estimates
Issuer information
Share price (HKD) 8.8 Target price (HKD) 13.3 Potent'l return (%) 55
Reuters (Equity) 0960.HK Bloomberg (Equity) 960 HK Market cap (USDm) 5,703 Market cap (HKDm) 44,333 Free float (%) 24 Enterprise value (CNYm) 45,479 Country China Sector Real Estate Analyst Derek Kwong Contact +852 2996 6629
Note: price at close of 30 Dec 2011
Financials & valuation: Longfor Properties Overweight (V)
渐飞研究报告 - http://bg.panlv.net
abc
66
Financial Institutions Group China Real Estate 4 January 2012
Key highlights Weakening contracted sales outlook through 2012
Shimao’s efforts to deleverage are necessary but
initiatives on this front will happen at the expense
of growth as the company scales back
construction. We forecast contracted sales in 2012
to stay flat y-o-y, after lowering our 2011 sales
estimate by 8% to about RMB32bn. This comes
on the back of slower-than-expected sales year-to-
November, while 2012’s modest outlook is
mainly due to constraints in saleable resources
given the scaled back construction.
Difficult to see operational upside
In our view, it will be difficult for Shimao’s
medium-term sales growth to surprise on the
upside, noting that the company beat its 2011 full-
year sales target by the smallest margin among
non-SOE developers in 2010. Furthermore, its
contracted sales target growth of 18% in 2011 is
lower than the industry range of 25-64% y-o-y. In
order to propel itself to the next level, Shimao
needs to be able to achieve stronger sales via
higher sell-through rates, which is difficult against
a weakening physical market backdrop.
Feasibility of organic deleveraging hinges heavily on sales delivery
Based on our projected contracted sales, we
forecast a cash balance of RMB12.5bn by end
2011, which is relatively low and equivalent to
around 4.5 months worth of sales. In our view,
there are three preconditions to deleveraging: 1)
Shimao needs to deliver the projected sales, which
are its most significant source of cash; 2) it needs
to scale back land acquisitions; and 3) it needs to
reduce SG&A expenses.
Valuation and risks We downgrade to N(V) with a lower TP of
HKD7, set at a 60% discount (versus 57%
previously) to our revised 12-month forward
NAV of HKD17.5.
Our TP of HKD7 suggests a potential return of
12%, including 7% dividend yield, which is within
the Neutral rating band of 0-20% for Chinese
stocks classified as volatile. Potential return equals
the percentage difference between the current
share price and the target price, including the
forecast dividend yield when indicated.
Key downside risks include failure to deleverage
and slower-than-expected contracted sales, which
will take a toll on cash inflow, while further
dampening investors’ confidence on execution.
Key upside risks include higher than expected
contracted sales momentum and ASP.
Shimao (813 HK) Contracted sales outlook is grim
Success of deleveraging hinges heavily on sales delivery, and scaling back new acquisitions
Downgrade to N (adding the volatility flag) from OW with a reduced TP of HKD7 (from HKD8.4), set at
a 60% to our revised 12m forward NAV of HKD17.5
渐飞研究报告 - http://bg.panlv.net
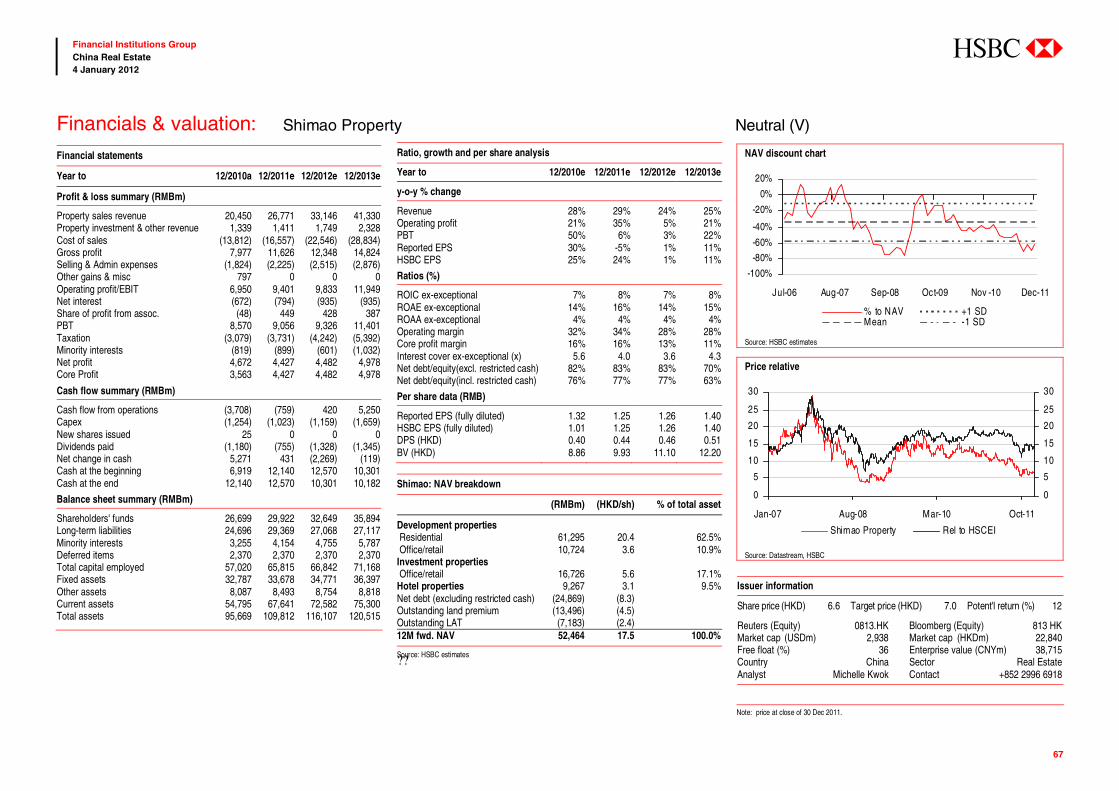
abc
67
Financial Institutions Group China Real Estate 4 January 2012
Financial statements
Year to 12/2010a 12/2011e 12/2012e 12/2013e
Profit & loss summary (RMBm)
Property sales revenue 20,450 26,771 33,146 41,330 Property investment & other revenue 1,339 1,411 1,749 2,328 Cost of sales (13,812) (16,557) (22,546) (28,834)Gross profit 7,977 11,626 12,348 14,824 Selling & Admin expenses (1,824) (2,225) (2,515) (2,876)Other gains & misc 797 0 0 0 Operating profit/EBIT 6,950 9,401 9,833 11,949 Net interest (672) (794) (935) (935)Share of profit from assoc. (48) 449 428 387 PBT 8,570 9,056 9,326 11,401 Taxation (3,079) (3,731) (4,242) (5,392)Minority interests (819) (899) (601) (1,032)Net profit 4,672 4,427 4,482 4,978 Core Profit 3,563 4,427 4,482 4,978
Cash flow summary (RMBm)
Cash flow from operations (3,708) (759) 420 5,250 Capex (1,254) (1,023) (1,159) (1,659)New shares issued 25 0 0 0 Dividends paid (1,180) (755) (1,328) (1,345)Net change in cash 5,271 431 (2,269) (119)Cash at the beginning 6,919 12,140 12,570 10,301 Cash at the end 12,140 12,570 10,301 10,182
Balance sheet summary (RMBm)
Shareholders' funds 26,699 29,922 32,649 35,894 Long-term liabilities 24,696 29,369 27,068 27,117 Minority interests 3,255 4,154 4,755 5,787 Deferred items 2,370 2,370 2,370 2,370 Total capital employed 57,020 65,815 66,842 71,168 Fixed assets 32,787 33,678 34,771 36,397 Other assets 8,087 8,493 8,754 8,818 Current assets 54,795 67,641 72,582 75,300 Total assets 95,669 109,812 116,107 120,515
Ratio, growth and per share analysis
Year to 12/2010e 12/2011e 12/2012e 12/2013e
y-o-y % change
Revenue 28% 29% 24% 25%Operating profit 21% 35% 5% 21%PBT 50% 6% 3% 22%Reported EPS 30% -5% 1% 11%HSBC EPS 25% 24% 1% 11%
Ratios (%)
ROIC ex-exceptional 7% 8% 7% 8%ROAE ex-exceptional 14% 16% 14% 15%ROAA ex-exceptional 4% 4% 4% 4%Operating margin 32% 34% 28% 28%Core profit margin 16% 16% 13% 11%Interest cover ex-exceptional (x) 5.6 4.0 3.6 4.3 Net debt/equity(excl. restricted cash) 82% 83% 83% 70%Net debt/equity(incl. restricted cash) 76% 77% 77% 63%
Per share data (RMB)
Reported EPS (fully diluted) 1.32 1.25 1.26 1.40HSBC EPS (fully diluted) 1.01 1.25 1.26 1.40DPS (HKD) 0.40 0.44 0.46 0.51BV (HKD) 8.86 9.93 11.10 12.20 Shimao: NAV breakdown
(RMBm) (HKD/sh) % of total asset
Development properties
Residential 61,295 20.4 62.5% Office/retail 10,724 3.6 10.9%Investment properties Office/retail 16,726 5.6 17.1%Hotel properties 9,267 3.1 9.5%Net debt (excluding restricted cash) (24,869) (8.3) Outstanding land premium (13,496) (4.5) Outstanding LAT (7,183) (2.4) 12M fwd. NAV 52,464 17.5 100.0%
Source: HSBC estimates ??
NAV discount chart
-100%
-80%
-60%
-40%
-20%
0%
20%
Jul-06 Aug-07 Sep-08 Oct-09 Nov -10 Dec-11
% to NAV +1 SDMean -1 SD
Source: HSBC estimates
Price relative
0
5
10
15
20
25
30
Jan-07 Aug-08 Mar-10 Oct-11
0
5
10
15
20
25
30
Shimao Property Rel to HSCEI
Source: Datastream, HSBC
Issuer information
Share price (HKD) 6.6 Target price (HKD) 7.0 Potent'l return (%) 12
Reuters (Equity) 0813.HK Bloomberg (Equity) 813 HK Market cap (USDm) 2,938 Market cap (HKDm) 22,840 Free float (%) 36 Enterprise value (CNYm) 38,715 Country China Sector Real Estate Analyst Michelle Kwok Contact +852 2996 6918
Note: price at close of 30 Dec 2011.
Financials & valuation: Shimao Property Neutral (V)
渐飞研究报告 - http://bg.panlv.net
abc
68
Financial Institutions Group China Real Estate 4 January 2012
Key highlights Access to various financing channels relieves balance sheet strain Our cash flow analysis indicates that Shui On
Land (SOL) is under more cash flow pressure than its peers. In recognition of such balance sheet strain, management has meaningfully stepped up
efforts in sourcing funds over the past few months. Key funding channels include offshore syndicated loans and disposal of non-core assets,
as well as minority stakes in other developments. The most recent fundraising deal saw SOL dispose of a 45% effective interest in Lot 18
(GFA of 108,400 sqm) in Foshan Lingnan Tiandi to a Japanese investor for RMB391m. With a buyback clause, this is effectively a financing
transaction, rather than an asset sale.
Commercial sales help make up the slack in the residential segment Following the disposal of a commercial property at Shanghai KIC project for RMB600m, SOL is targeting to offload other non-core assets over the
next six months. Specifically, management indicated that the Chongqing project sale, expected to be closed by the end of 2011, could bring in
proceeds of RMB3.3bn. Aggregate commercial sales of nearly RMB4bn, coupled with residential sales of RMB6bn through November 2011, should
bring SOL to its target of RMB10bn in 2011.
Approaching a key milestone for business transformation At the end of 2012, SOL expects to complete its three-year plan of delivering 1m sqm GFA. In our view, the market will look at this as a milestone for
SOL to transform its business model into one that better suits the policy sensitive and dynamic real estate market. Successful implementation should
make SOL appeal to a wider group of investors.
Valuation and risks We reiterate OW and have a new TP of HKD2.9, set at a 60% discount (versus 55% previously) to our 12-month forward NAV of HKD7.3 (down
from HKD8.8). While we have maintained the target discount at 1 SD below the mean, the discount widened on an absolute basis due to
increased market volatility.
Our TP of HKD2.9 suggests a potential return of
29%, including 5% of dividend yield, which is above the Neutral band of 5-15% for Chinese stocks classified as non-volatile. Potential return
equals the percentage difference between the current share price and the target price, including the forecast dividend yield when indicated.
Key risks include failure to dispose of non-core commercial assets, failure to reach 1m sqm GFA
of completion by end-2012, and lower than expected residential demand, particularly for the launches in 4Q11 such as Dalian Tiandi Ph 2.
Shui On Land (272 HK) Access to a wide range of financing channels improves cash flow and asset turnover
Ability to improve asset turnover provides a key milestone
Reiterate OW with a reduced TP of HKD2.9 (from HKD4) due to an increase in number of shares and
a wider target discount
渐飞研究报告 - http://bg.panlv.net
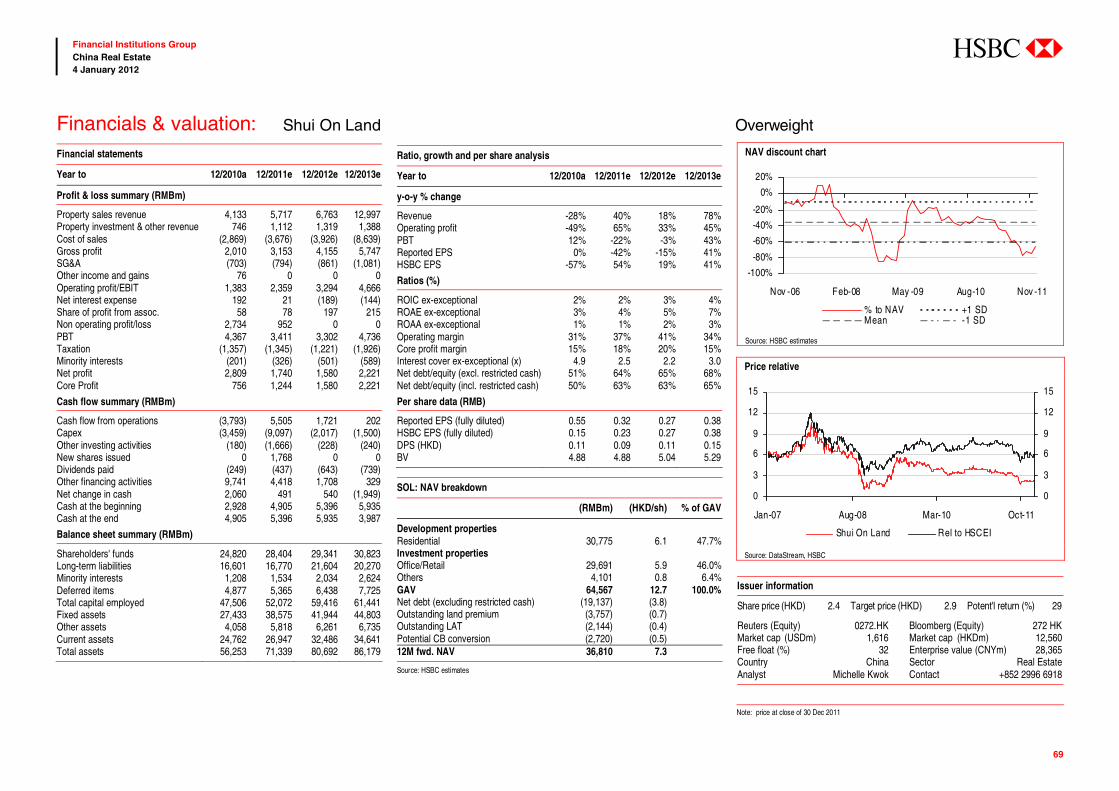
abc
69
Financial Institutions Group China Real Estate 4 January 2012
Financial statements
Year to 12/2010a 12/2011e 12/2012e 12/2013e
Profit & loss summary (RMBm)
Property sales revenue 4,133 5,717 6,763 12,997 Property investment & other revenue 746 1,112 1,319 1,388 Cost of sales (2,869) (3,676) (3,926) (8,639)Gross profit 2,010 3,153 4,155 5,747 SG&A (703) (794) (861) (1,081)Other income and gains 76 0 0 0 Operating profit/EBIT 1,383 2,359 3,294 4,666 Net interest expense 192 21 (189) (144)Share of profit from assoc. 58 78 197 215 Non operating profit/loss 2,734 952 0 0 PBT 4,367 3,411 3,302 4,736 Taxation (1,357) (1,345) (1,221) (1,926)Minority interests (201) (326) (501) (589)Net profit 2,809 1,740 1,580 2,221 Core Profit 756 1,244 1,580 2,221
Cash flow summary (RMBm)
Cash flow from operations (3,793) 5,505 1,721 202 Capex (3,459) (9,097) (2,017) (1,500)Other investing activities (180) (1,666) (228) (240)New shares issued 0 1,768 0 0 Dividends paid (249) (437) (643) (739)Other financing activities 9,741 4,418 1,708 329 Net change in cash 2,060 491 540 (1,949)Cash at the beginning 2,928 4,905 5,396 5,935 Cash at the end 4,905 5,396 5,935 3,987
Balance sheet summary (RMBm)
Shareholders' funds 24,820 28,404 29,341 30,823 Long-term liabilities 16,601 16,770 21,604 20,270 Minority interests 1,208 1,534 2,034 2,624 Deferred items 4,877 5,365 6,438 7,725 Total capital employed 47,506 52,072 59,416 61,441 Fixed assets 27,433 38,575 41,944 44,803 Other assets 4,058 5,818 6,261 6,735 Current assets 24,762 26,947 32,486 34,641 Total assets 56,253 71,339 80,692 86,179
Ratio, growth and per share analysis
Year to 12/2010a 12/2011e 12/2012e 12/2013e
y-o-y % change
Revenue -28% 40% 18% 78%Operating profit -49% 65% 33% 45%PBT 12% -22% -3% 43%Reported EPS 0% -42% -15% 41%HSBC EPS -57% 54% 19% 41%
Ratios (%)
ROIC ex-exceptional 2% 2% 3% 4%ROAE ex-exceptional 3% 4% 5% 7%ROAA ex-exceptional 1% 1% 2% 3%Operating margin 31% 37% 41% 34%Core profit margin 15% 18% 20% 15%Interest cover ex-exceptional (x) 4.9 2.5 2.2 3.0 Net debt/equity (excl. restricted cash) 51% 64% 65% 68%Net debt/equity (incl. restricted cash) 50% 63% 63% 65%
Per share data (RMB)
Reported EPS (fully diluted) 0.55 0.32 0.27 0.38HSBC EPS (fully diluted) 0.15 0.23 0.27 0.38DPS (HKD) 0.11 0.09 0.11 0.15BV 4.88 4.88 5.04 5.29 SOL: NAV breakdown
(RMBm) (HKD/sh) % of GAV
Development properties Residential 30,775 6.1 47.7%Investment properties Office/Retail 29,691 5.9 46.0%Others 4,101 0.8 6.4%GAV 64,567 12.7 100.0%Net debt (excluding restricted cash) (19,137) (3.8)Outstanding land premium (3,757) (0.7)Outstanding LAT (2,144) (0.4)Potential CB conversion (2,720) (0.5)12M fwd. NAV 36,810 7.3
Source: HSBC estimates
NAV discount chart
-100%
-80%
-60%
-40%
-20%
0%
20%
Nov -06 Feb-08 May -09 Aug-10 Nov -11
% to NAV +1 SDMean -1 SD
Source: HSBC estimates
Price relative
0
3
6
9
12
15
Jan-07 Aug-08 Mar-10 Oct-11
0
3
6
9
12
15
Shui On Land Rel to HSCEI
Source: DataStream, HSBC
Issuer information
Share price (HKD) 2.4 Target price (HKD) 2.9 Potent'l return (%) 29
Reuters (Equity) 0272.HK Bloomberg (Equity) 272 HK Market cap (USDm) 1,616 Market cap (HKDm) 12,560 Free float (%) 32 Enterprise value (CNYm) 28,365 Country China Sector Real Estate Analyst Michelle Kwok Contact +852 2996 6918
Note: price at close of 30 Dec 2011
Financials & valuation: Shui On Land Overweight
渐飞研究报告 - http://bg.panlv.net
abc
70
Financial Institutions Group China Real Estate 4 January 2012
Key highlights Risk of contracted sales shortfall
Year-to-October, SOHO recorded contracted sales
of RMB10.6bn, well behind the indicated
RMB23.8bn target for 2011. While most developers’
sales through November 2011 are also behind
schedule by a varying degree with an average run-
rate of 85%, SOHO has secured merely 45% of
target. In bringing 2011 full-year sales to target,
SOHO is heavily dependent on the sales progress of
two projects: 1) SOHO Zhongshan Plaza and 2)
Wangjing SOHO, which have admittedly been slow
since their launch dates in mid August 2011. We see
risk of a sales shortfall as slowing demand in
commercial real estate is unlikely to result in SOHO
reporting sales worth RMB10bn in December 2011.
Financial strength to partially buffer sales shortfall
SOHO has been in a net cash position since listing
in 2007. As at 17 September 11, SOHO had cash
on hand of RMB18.3bn. Netting off debt and the
HKD2.8bn convertible bond, the company is in a
net cash position of RMB3.3bn. Such balance
sheet strength should allow SOHO to withstand a
shortfall in contracted sales, more than its peers
with net gearing levels of 40-110% as at June
2011. Stress testing SOHO’s balance sheet, we
expect its financial liquidity to remain intact even
if it does not launch any new projects for sale.
Under this scenario, we estimate a reasonably
healthy cash balance of RMB8.5bn by end-2012,
assuming no new acquisitions
Valuation and risks We downgrade to Neutral with a lowered TP of
HKD5.4, set at an unchanged 45% discount (0.5
SD below mean) to our 12-month forward NAV
of HKD9.8 (down from HKD11.6 previously).
We lower our 12-month forward NAV from
HKD11.6 due mainly to the slower than expected
sales schedule and upward revision of WACC. We
increase WACC by 120bp to 10.3%, as we increase
the assumed cost of debt. While a significant portion
of SOHO’s land bank is non-residential, our revised
ASP assumptions have minimal impact on NAV.
Our TP of HKD5.4 suggests a potential return of
10%, including 6% of dividend yield, which is
within the Neutral band of 5-15% for Chinese
stocks classified as non-volatile. Potential return
equals the percentage difference between the
current share price and the target price, including
the forecast dividend yield when indicated.
Key downside risks include slower than expected
sales progress and lower than expected ASP. Key
upside risks include a surprise en-bloc sale that
boosts contracted sales and substantial
improvement in demand for commercial properties.
SOHO China (410 HK) Subdued sales suggest likelihood of a shortfall
However financial liquidity should partially provide a buffer to operational stability
Downgrade to N from OW with a reduced TP of HKD5.4 (from HKD6.4); target discount unchanged at
0.5 SD below mean
渐飞研究报告 - http://bg.panlv.net
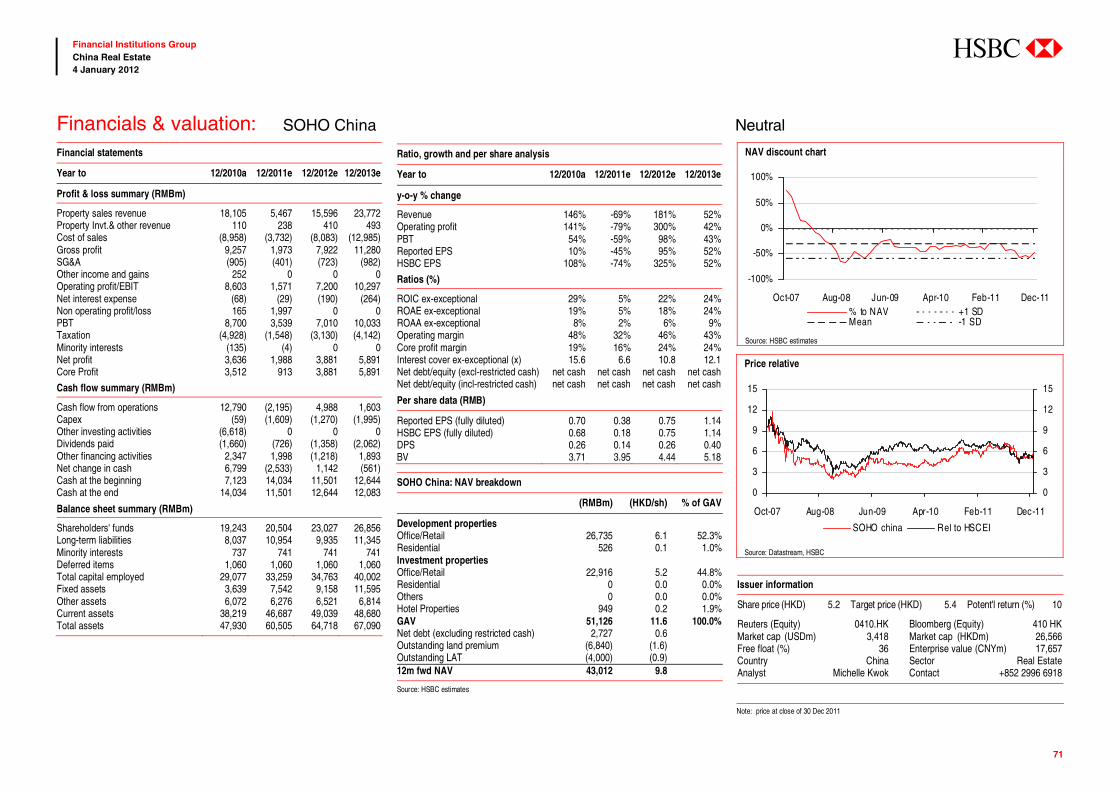
abc
71
Financial Institutions Group China Real Estate 4 January 2012
Financial statements
Year to 12/2010a 12/2011e 12/2012e 12/2013e
Profit & loss summary (RMBm)
Property sales revenue 18,105 5,467 15,596 23,772 Property Invt.& other revenue 110 238 410 493 Cost of sales (8,958) (3,732) (8,083) (12,985)Gross profit 9,257 1,973 7,922 11,280 SG&A (905) (401) (723) (982)Other income and gains 252 0 0 0 Operating profit/EBIT 8,603 1,571 7,200 10,297 Net interest expense (68) (29) (190) (264)Non operating profit/loss 165 1,997 0 0 PBT 8,700 3,539 7,010 10,033 Taxation (4,928) (1,548) (3,130) (4,142)Minority interests (135) (4) 0 0 Net profit 3,636 1,988 3,881 5,891 Core Profit 3,512 913 3,881 5,891
Cash flow summary (RMBm)
Cash flow from operations 12,790 (2,195) 4,988 1,603 Capex (59) (1,609) (1,270) (1,995)Other investing activities (6,618) 0 0 0 Dividends paid (1,660) (726) (1,358) (2,062)Other financing activities 2,347 1,998 (1,218) 1,893 Net change in cash 6,799 (2,533) 1,142 (561)Cash at the beginning 7,123 14,034 11,501 12,644 Cash at the end 14,034 11,501 12,644 12,083
Balance sheet summary (RMBm)
Shareholders' funds 19,243 20,504 23,027 26,856 Long-term liabilities 8,037 10,954 9,935 11,345 Minority interests 737 741 741 741 Deferred items 1,060 1,060 1,060 1,060 Total capital employed 29,077 33,259 34,763 40,002 Fixed assets 3,639 7,542 9,158 11,595 Other assets 6,072 6,276 6,521 6,814 Current assets 38,219 46,687 49,039 48,680 Total assets 47,930 60,505 64,718 67,090
Ratio, growth and per share analysis
Year to 12/2010a 12/2011e 12/2012e 12/2013e
y-o-y % change
Revenue 146% -69% 181% 52%Operating profit 141% -79% 300% 42%PBT 54% -59% 98% 43%Reported EPS 10% -45% 95% 52%HSBC EPS 108% -74% 325% 52%
Ratios (%)
ROIC ex-exceptional 29% 5% 22% 24%ROAE ex-exceptional 19% 5% 18% 24%ROAA ex-exceptional 8% 2% 6% 9%Operating margin 48% 32% 46% 43%Core profit margin 19% 16% 24% 24%Interest cover ex-exceptional (x) 15.6 6.6 10.8 12.1 Net debt/equity (excl-restricted cash) net cash net cash net cash net cashNet debt/equity (incl-restricted cash) net cash net cash net cash net cash
Per share data (RMB)
Reported EPS (fully diluted) 0.70 0.38 0.75 1.14HSBC EPS (fully diluted) 0.68 0.18 0.75 1.14DPS 0.26 0.14 0.26 0.40BV 3.71 3.95 4.44 5.18 SOHO China: NAV breakdown
(RMBm) (HKD/sh) % of GAV
Development properties Office/Retail 26,735 6.1 52.3%Residential 526 0.1 1.0%Investment properties Office/Retail 22,916 5.2 44.8%Residential 0 0.0 0.0%Others 0 0.0 0.0%Hotel Properties 949 0.2 1.9%GAV 51,126 11.6 100.0%Net debt (excluding restricted cash) 2,727 0.6 Outstanding land premium (6,840) (1.6)Outstanding LAT (4,000) (0.9)12m fwd NAV 43,012 9.8
Source: HSBC estimates
NAV discount chart
-100%
-50%
0%
50%
100%
Oct-07 Aug-08 Jun-09 Apr-10 Feb-11 Dec-11% to NAV +1 SDMean -1 SD
Source: HSBC estimates
Price relative
0
3
6
9
12
15
Oct-07 Aug-08 Jun-09 Apr-10 Feb-11 Dec-11
0
3
6
9
12
15
SOHO china Rel to HSCEI
Source: Datastream, HSBC
Issuer information
Share price (HKD) 5.2 Target price (HKD) 5.4 Potent'l return (%) 10
Reuters (Equity) 0410.HK Bloomberg (Equity) 410 HK Market cap (USDm) 3,418 Market cap (HKDm) 26,566 Free float (%) 36 Enterprise value (CNYm) 17,657 Country China Sector Real Estate Analyst Michelle Kwok Contact +852 2996 6918
Note: price at close of 30 Dec 2011
Financials & valuation: SOHO China Neutral
渐飞研究报告 - http://bg.panlv.net
abc
72
Financial Institutions Group China Real Estate 4 January 2012
Key highlights
Thinly covered and misunderstood
Despite its long trading history, Yanlord is a
thinly covered stock and its operations are
somewhat misunderstood. While it is regarded as
a quality high-end residential developer that
commands superior margins on the strength of its
brand, we think its historically high margins are
largely driven by previously low land acquisition
costs. As this low cost land bank has run dry, we
expect the margin compression that appeared in
2011 to continue in the foreseeable future.
Downside limited, upside constrained
We believe a further de-rating in the stock is
unlikely, given it trades only slightly above trough
valuation. The company can maintain reasonable
cash flow despite its compressed margin, slow
contract sales and heavy refinancing needs. It is
also supported by superior access to funding,
strategic relationships with financially strong
partners and significant brand equity. On the other
hand, we believe growth opportunities are limited,
in light of the margin compression and slow asset
turnover.
Strategic shift necessary for rerating
In our view, a rerating is only possible if
management embarks on a comprehensive
strategic shift. The company should focus on
increasing asset turnover, specifically reducing
the time between land acquisition and presale
launch. The company should also incorporate
pricing flexibility to ensure quick sell-through of
existing launches and inventories. Given the
current sector headwinds and the difficulty in
scaling up area under construction, the company
may be well advised to engage in organizational
capacity building to prepare for a faster asset turn
business model once macro conditions turn
favourable.
Valuation and risks We initiate with N and our target price of SGD1.1
is based on a 56% discount to our 12-month
forward NAV, which is 1 SD below the historical
mean. We believe our target price represents a fair
valuation given the stock’s prolonged de-rating
since mid-2009, weak operational metrics and the
absence of strategic shift needed for rerating.
Our target price implies a potential return of 8%
including a dividend yield of 1%, which is within
the Neutral rating band of 0-20% for Chinese
stocks classified as volatile. Potential return
equals the percentage difference between the
current share price and the target price, including
the forecast dividend yield when indicated.
Key upside risks include an improvement in macro
conditions or continued share purchase from high-
profile investors. Key downside risks include
deteriorating contract sales performance, or capital
market volatility leading to refinancing issues.
Yanlord Land (YLLG SP) Downside protection afforded by reasonable cash flow, access to funding and strong brand equity
But overall growth prospects subdued due to margin compression and structurally slow asset turnover
Initiate with N(V) and target price of SGD1; trades at trough valuation but strategic shift needed to
drive rerating
渐飞研究报告 - http://bg.panlv.net
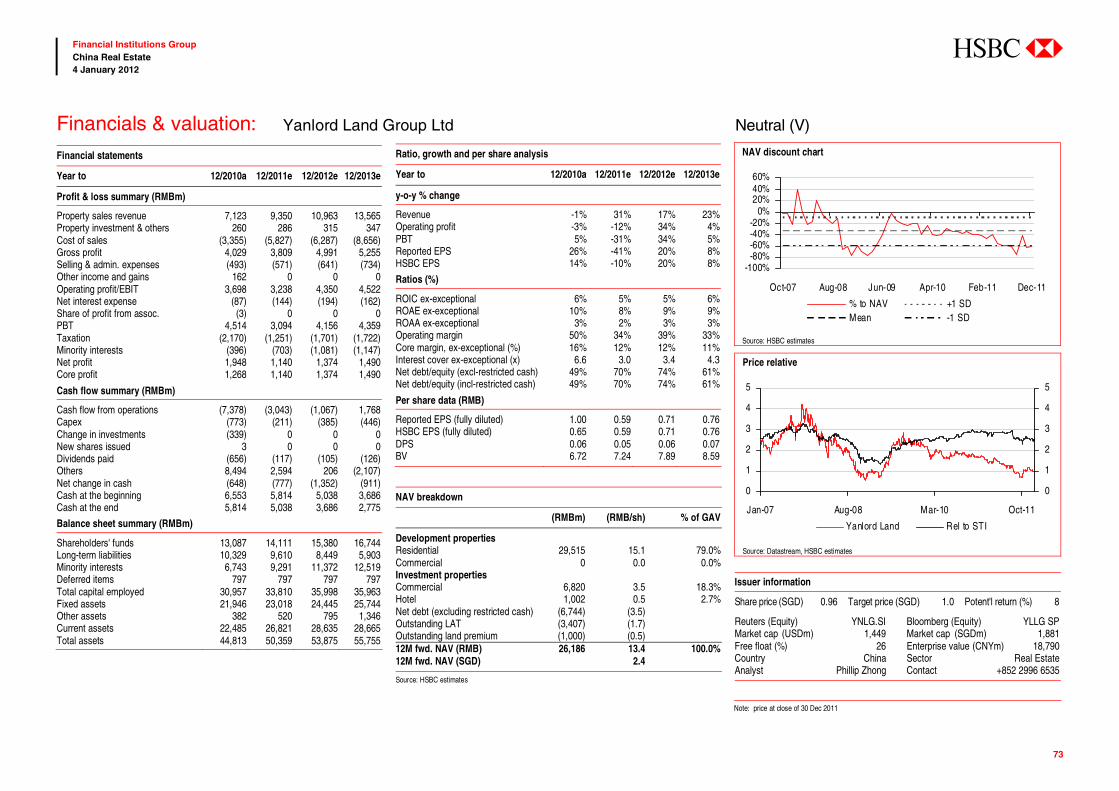
abc
73
Financial Institutions Group China Real Estate 4 January 2012
Financial statements
Year to 12/2010a 12/2011e 12/2012e 12/2013e
Profit & loss summary (RMBm)
Property sales revenue 7,123 9,350 10,963 13,565 Property investment & others 260 286 315 347 Cost of sales (3,355) (5,827) (6,287) (8,656)Gross profit 4,029 3,809 4,991 5,255 Selling & admin. expenses (493) (571) (641) (734)Other income and gains 162 0 0 0 Operating profit/EBIT 3,698 3,238 4,350 4,522 Net interest expense (87) (144) (194) (162)Share of profit from assoc. (3) 0 0 0 PBT 4,514 3,094 4,156 4,359 Taxation (2,170) (1,251) (1,701) (1,722)Minority interests (396) (703) (1,081) (1,147)Net profit 1,948 1,140 1,374 1,490 Core profit 1,268 1,140 1,374 1,490
Cash flow summary (RMBm)
Cash flow from operations (7,378) (3,043) (1,067) 1,768 Capex (773) (211) (385) (446)Change in investments (339) 0 0 0 New shares issued 3 0 0 0 Dividends paid (656) (117) (105) (126)Others 8,494 2,594 206 (2,107)Net change in cash (648) (777) (1,352) (911)Cash at the beginning 6,553 5,814 5,038 3,686 Cash at the end 5,814 5,038 3,686 2,775
Balance sheet summary (RMBm)
Shareholders' funds 13,087 14,111 15,380 16,744 Long-term liabilities 10,329 9,610 8,449 5,903 Minority interests 6,743 9,291 11,372 12,519 Deferred items 797 797 797 797 Total capital employed 30,957 33,810 35,998 35,963 Fixed assets 21,946 23,018 24,445 25,744 Other assets 382 520 795 1,346 Current assets 22,485 26,821 28,635 28,665 Total assets 44,813 50,359 53,875 55,755
Ratio, growth and per share analysis
Year to 12/2010a 12/2011e 12/2012e 12/2013e
y-o-y % change
Revenue -1% 31% 17% 23%Operating profit -3% -12% 34% 4%PBT 5% -31% 34% 5%Reported EPS 26% -41% 20% 8%HSBC EPS 14% -10% 20% 8%
Ratios (%)
ROIC ex-exceptional 6% 5% 5% 6%ROAE ex-exceptional 10% 8% 9% 9%ROAA ex-exceptional 3% 2% 3% 3%Operating margin 50% 34% 39% 33%Core margin, ex-exceptional (%) 16% 12% 12% 11%Interest cover ex-exceptional (x) 6.6 3.0 3.4 4.3 Net debt/equity (excl-restricted cash) 49% 70% 74% 61%Net debt/equity (incl-restricted cash) 49% 70% 74% 61%
Per share data (RMB)
Reported EPS (fully diluted) 1.00 0.59 0.71 0.76HSBC EPS (fully diluted) 0.65 0.59 0.71 0.76DPS 0.06 0.05 0.06 0.07BV 6.72 7.24 7.89 8.59
NAV breakdown
(RMBm) (RMB/sh) % of GAV
Development properties
Residential 29,515 15.1 79.0%Commercial 0 0.0 0.0%Investment properties Commercial 6,820 3.5 18.3%Hotel 1,002 0.5 2.7%Net debt (excluding restricted cash) (6,744) (3.5) Outstanding LAT (3,407) (1.7) Outstanding land premium (1,000) (0.5) 12M fwd. NAV (RMB) 26,186 13.4 100.0%12M fwd. NAV (SGD) 2.4
Source: HSBC estimates
NAV discount chart
-100%-80%-60%-40%-20%
0%20%40%60%
Oct-07 Aug-08 Jun-09 Apr-10 Feb-11 Dec-11
% to NAV +1 SDMean -1 SD
Source: HSBC estimates Price relative
0
1
2
3
4
5
Jan-07 Aug-08 Mar-10 Oct-11
0
1
2
3
4
5
Yanlord Land Rel to STI
Source: Datastream, HSBC estimates
Issuer information
Share price (SGD) 0.96 Target price (SGD) 1.0 Potent'l return (%) 8
Reuters (Equity) YNLG.SI Bloomberg (Equity) YLLG SP Market cap (USDm) 1,449 Market cap (SGDm) 1,881 Free float (%) 26 Enterprise value (CNYm) 18,790 Country China Sector Real Estate Analyst Phillip Zhong Contact +852 2996 6535
Note: price at close of 30 Dec 2011
Financials & valuation: Yanlord Land Group Ltd Neutral (V)
渐飞研究报告 - http://bg.panlv.net
abc
74
Financial Institutions Group China Real Estate 4 January 2012
Disclosure appendix Analyst Certification The following analyst(s), economist(s), and/or strategist(s) who is(are) primarily responsible for this report, certifies(y) that the opinion(s) on the subject security(ies) or issuer(s) and/or any other views or forecasts expressed herein accurately reflect their personal view(s) and that no part of their compensation was, is or will be directly or indirectly related to the specific recommendation(s) or views contained in this research report: Derek Kwong, Michelle Kwok, Phillip Zhong, Stanley Cheung and Qi Zhuang
Important disclosures
Stock ratings and basis for financial analysis HSBC believes that investors utilise various disciplines and investment horizons when making investment decisions, which depend largely on individual circumstances such as the investor's existing holdings, risk tolerance and other considerations. Given these differences, HSBC has two principal aims in its equity research: 1) to identify long-term investment opportunities based on particular themes or ideas that may affect the future earnings or cash flows of companies on a 12 month time horizon; and 2) from time to time to identify short-term investment opportunities that are derived from fundamental, quantitative, technical or event-driven techniques on a 0-3 month time horizon and which may differ from our long-term investment rating. HSBC has assigned ratings for its long-term investment opportunities as described below.
This report addresses only the long-term investment opportunities of the companies referred to in the report. As and when HSBC publishes a short-term trading idea the stocks to which these relate are identified on the website at www.hsbcnet.com/research. Details of these short-term investment opportunities can be found under the Reports section of this website.
HSBC believes an investor's decision to buy or sell a stock should depend on individual circumstances such as the investor's existing holdings and other considerations. Different securities firms use a variety of ratings terms as well as different rating systems to describe their recommendations. Investors should carefully read the definitions of the ratings used in each research report. In addition, because research reports contain more complete information concerning the analysts' views, investors should carefully read the entire research report and should not infer its contents from the rating. In any case, ratings should not be used or relied on in isolation as investment advice.
Rating definitions for long-term investment opportunities
Stock ratings HSBC assigns ratings to its stocks in this sector on the following basis:
For each stock we set a required rate of return calculated from the cost of equity for that stock’s domestic or, as appropriate, regional market established by our strategy team. The price target for a stock represents the value the analyst expects the stock to reach over our performance horizon. The performance horizon is 12 months. For a stock to be classified as Overweight, the potential return, which equals the percentage difference between the current share price and the target price, including the forecast dividend yield when indicated, must exceed the required return by at least 5 percentage points over the next 12 months (or 10 percentage points for a stock classified as Volatile*). For a stock to be classified as Underweight, the stock must be expected to underperform its required return
渐飞研究报告 - http://bg.panlv.net
abc
75
Financial Institutions Group China Real Estate 4 January 2012
by at least 5 percentage points over the next 12 months (or 10 percentage points for a stock classified as Volatile*). Stocks between these bands are classified as Neutral.
Our ratings are re-calibrated against these bands at the time of any 'material change' (initiation of coverage, change of volatility status or change in price target). Notwithstanding this, and although ratings are subject to ongoing management review, expected returns will be permitted to move outside the bands as a result of normal share price fluctuations without necessarily triggering a rating change.
*A stock will be classified as volatile if its historical volatility has exceeded 40%, if the stock has been listed for less than 12 months (unless it is in an industry or sector where volatility is low) or if the analyst expects significant volatility. However, stocks which we do not consider volatile may in fact also behave in such a way. Historical volatility is defined as the past month's average of the daily 365-day moving average volatilities. In order to avoid misleadingly frequent changes in rating, however, volatility has to move 2.5 percentage points past the 40% benchmark in either direction for a stock's status to change.
Rating distribution for long-term investment opportunities
As of 03 January 2012, the distribution of all ratings published is as follows: Overweight (Buy) 54% (25% of these provided with Investment Banking Services)
Neutral (Hold) 35% (20% of these provided with Investment Banking Services)
Underweight (Sell) 11% (12% of these provided with Investment Banking Services)
Information regarding company share price performance and history of HSBC ratings and price targets in respect of its long-term investment opportunities for the companies the subject of this report,is available from www.hsbcnet.com/research.
HSBC & Analyst disclosures Disclosure checklist
Company Ticker Recent price Price Date Disclosure
AGILE PROPERTY 3383.HK 6.96 02-Jan-2012 1, 4, 5, 11CHINA OVERSEAS LAND & INV 0688.HK 12.98 02-Jan-2012 4, 11CHINA RESOURCES LAND 1109.HK 12.48 02-Jan-2012 1, 4, 5FRANSHION PROPERTIES 0817.HK 1.50 02-Jan-2012 1, 5GUANGZHOU R&F 2777.HK 6.14 02-Jan-2012 4, 11KWG 1813.HK 2.62 02-Jan-2012 1, 4, 5, 11LONGFOR PROPERTIES CO LTD 0960.HK 8.78 02-Jan-2012 1, 4, 5SHIMAO PROPERTY 0813.HK 6.63 02-Jan-2012 1, 4, 5, 11SHUI ON LAND LIMITED 0272.HK 2.36 02-Jan-2012 4, 6, 7SOHO CHINA LIMITED 0410.HK 5.17 02-Jan-2012 4YANLORD LAND GROUP LTD YNLG.SI 0.96 02-Jan-2012 1, 5, 6, 7
Source: HSBC
1 HSBC* has managed or co-managed a public offering of securities for this company within the past 12 months. 2 HSBC expects to receive or intends to seek compensation for investment banking services from this company in the next 3 months.
渐飞研究报告 - http://bg.panlv.net
abc
76
Financial Institutions Group China Real Estate 4 January 2012
3 At the time of publication of this report, HSBC Securities (USA) Inc. is a Market Maker in securities issued by this company. 4 As of 30 November 2011 HSBC beneficially owned 1% or more of a class of common equity securities of this company. 5 As of 30 November 2011, this company was a client of HSBC or had during the preceding 12 month period been a client of and/or paid compensation to
HSBC in respect of investment banking services. 6 As of 30 November 2011, this company was a client of HSBC or had during the preceding 12 month period been a client of and/or paid compensation to
HSBC in respect of non-investment banking-securities related services. 7 As of 30 November 2011, this company was a client of HSBC or had during the preceding 12 month period been a client of and/or paid compensation to
HSBC in respect of non-securities services. 8 A covering analyst/s has received compensation from this company in the past 12 months. 9 A covering analyst/s or a member of his/her household has a financial interest in the securities of this company, as detailed below. 10 A covering analyst/s or a member of his/her household is an officer, director or supervisory board member of this company, as detailed below. 11 At the time of publication of this report, HSBC is a non-US Market Maker in securities issued by this company and/or in securities in respect of this company Analysts, economists, and strategists are paid in part by reference to the profitability of HSBC which includes investment banking revenues.
For disclosures in respect of any company mentioned in this report, please see the most recently published report on that company available at www.hsbcnet.com/research.
* HSBC Legal Entities are listed in the Disclaimer below.
Additional disclosures 1 This report is dated as at 04 January 2012. 2 All market data included in this report are dated as at close 30 December 2011, unless otherwise indicated in the report. 3 HSBC has procedures in place to identify and manage any potential conflicts of interest that arise in connection with its Research business. HSBC's analysts
and its other staff who are involved in the preparation and dissemination of Research operate and have a management reporting line independent of HSBC's Investment Banking business. Information Barrier procedures are in place between the Investment Banking and Research businesses to ensure that any confidential and/or price sensitive information is handled in an appropriate manner.
4 As of 30 November 2011, HSBC and/or its affiliates (including the funds, portfolios and investment clubs in securities managed by such entities) either, directly or indirectly, own or are involved in the acquisition, sale or intermediation of, 1% or more of the total capital of the subject companies securities in the market for the following Company(ies) : CHINA RESOURCES LAND , AGILE PROPERTY , CHINA OVERSEAS LAND & INV , SOHO CHINA LIMITED , SHUI ON LAND LIMITED , KWG , GUANGZHOU R&F , SHIMAO PROPERTY , LONGFOR PROPERTIES CO LTD
渐飞研究报告 - http://bg.panlv.net
abc
77
Financial Institutions Group China Real Estate 4 January 2012
Disclaimer * Legal entities as at 04 March 2011 ‘UAE’ HSBC Bank Middle East Limited, Dubai; ‘HK’ The Hongkong and Shanghai Banking Corporation Limited, Hong Kong; ‘TW’ HSBC Securities (Taiwan) Corporation Limited; ‘CA’ HSBC Securities (Canada) Inc, Toronto; HSBC Bank, Paris Branch; HSBC France; ‘DE’ HSBC Trinkaus & Burkhardt AG, Düsseldorf; 000 HSBC Bank (RR), Moscow; ‘IN’ HSBC Securities and Capital Markets (India) Private Limited, Mumbai; ‘JP’ HSBC Securities (Japan) Limited, Tokyo; ‘EG’ HSBC Securities Egypt SAE, Cairo; ‘CN’ HSBC Investment Bank Asia Limited, Beijing Representative Office; The Hongkong and Shanghai Banking Corporation Limited, Singapore Branch; The Hongkong and Shanghai Banking Corporation Limited, Seoul Securities Branch; The Hongkong and Shanghai Banking Corporation Limited, Seoul Branch; HSBC Securities (South Africa) (Pty) Ltd, Johannesburg; ‘GR’ HSBC Securities SA, Athens; HSBC Bank plc, London, Madrid, Milan, Stockholm, Tel Aviv; ‘US’ HSBC Securities (USA) Inc, New York; HSBC Yatirim Menkul Degerler AS, Istanbul; HSBC México, SA, Institución de Banca Múltiple, Grupo Financiero HSBC; HSBC Bank Brasil SA – Banco Múltiplo; HSBC Bank Australia Limited; HSBC Bank Argentina SA; HSBC Saudi Arabia Limited; The Hongkong and Shanghai Banking Corporation Limited, New Zealand Branch
Issuer of report The Hongkong and Shanghai Banking Corporation Limited Level 19, 1 Queen’s Road Central
Hong Kong SAR Telephone: +852 2843 9111
Telex: 75100 CAPEL HX
Fax: +852 2596 0200 Website: www.research.hsbc.com
This document has been issued by The Hongkong and Shanghai Banking Corporation Limited (“HSBC”) in the conduct of its Hong Kong regulated business for the information of its institutional and professional customers; it is not intended for and should not be distributed to retail customers in Hong Kong. The Hongkong and Shanghai Banking Corporation Limited is regulated by the Securities and Futures Commission. All enquires by recipients in Hong Kong must be directed to your HSBC contact in Hong Kong. If it is received by a customer of an affiliate of HSBC, its provision to the recipient is subject to the terms of business in place between the recipient and such affiliate. This document is not and should not be construed as an offer to sell or the solicitation of an offer to purchase or subscribe for any investment. HSBC has based this document on information obtained from sources it believes to be reliable but which it has not independently verified; HSBC makes no guarantee, representation or warranty and accepts no responsibility or liability as to its accuracy or completeness. Expressions of opinion are those of the Research Division of HSBC only and are subject to change without notice. HSBC and its affiliates and/or their officers, directors and employees may have positions in any securities mentioned in this document (or in any related investment) and may from time to time add to or dispose of any such securities (or investment). HSBC and its affiliates may act as market maker or have assumed an underwriting commitment in the securities of companies discussed in this document (or in related investments), may sell them to or buy them from customers on a principal basis and may also perform or seek to perform investment banking or underwriting services for or relating to thosecompanies. HSBC Securities (USA) Inc. accepts responsibility for the content of this research report prepared by its non-US foreign affiliate. All U.S. persons receiving and/or accessing this report and wishing to effect transactions in any security discussed herein should do so with HSBC Securities (USA) Inc. in the United States and not with its non-US foreign affiliate, the issuer of this report. In the UK this report may only be distributed to persons of a kind described in Article 19(5) of the Financial Services and Markets Act 2000 (Financial Promotion) Order 2001. The protections afforded by the UK regulatory regime are available only to those dealing with a representative of HSBC Bank plc in the UK. In Singapore, this publication is distributed by The Hongkong and Shanghai Banking Corporation Limited, Singapore Branch for the general information of institutional investors or other persons specified in Sections 274 and 304 of the Securities and Futures Act (Chapter 289) (“SFA”) and accredited investors and other persons in accordance with the conditions specified in Sections 275 and 305 of the SFA. This publication is not a prospectus as defined in the SFA. It may not be further distributed in whole or in part for any purpose. The Hongkong and Shanghai Banking Corporation Limited Singapore Branch is regulated by the Monetary Authority of Singapore. Recipients in Singapore should contact a "Hongkong and Shanghai Banking Corporation Limited, Singapore Branch" representative in respect of any matters arising from, or in connection with this report. In Australia, this publication has been distributed by The Hongkong and Shanghai Banking Corporation Limited (ABN 65 117 925 970, AFSL 301737) for the general information of its “wholesale” customers (as definedin the Corporations Act 2001). Where distributed to retail customers, this research is distributed by HSBC Bank Australia Limited (AFSL No. 232595). These respective entities make no representations that the products or services mentioned in this document are available to persons in Australia or are necessarily suitable for any particular person or appropriate in accordance with local law. No consideration has been given to the particular investment objectives, financial situation or particular needs of any recipient. This publication is distributed in New Zealand by The Hongkong and Shanghai Banking Corporation Limited, New Zealand Branch. In Japan, this publication has been distributed by HSBC Securities (Japan) Limited. It may not be further distributed in whole or in part for any purpose. In Korea, this publication is distributed by The Hongkong and Shanghai Banking Corporation Limited, Seoul Securities Branch ("HBAP SLS") for the general information of professional investors specified in Article 9 of the Financial Investment Services and Capital Markets Act (“FSCMA”). This publication is not a prospectus as defined in the FSCMA. It may not be further distributed in whole or in part for any purpose. HBAP SLS is regulated by the Financial Services Commission and the Financial Supervisory Service of Korea. © Copyright. The Hongkong and Shanghai Banking Corporation Limited 2012, ALL RIGHTS RESERVED. No part of this publication may be reproduced, stored in a retrieval system, or transmitted, on any form or by any means, electronic, mechanical, photocopying, recording, or otherwise, without the prior written permission of The Hongkong and Shanghai Banking Corporation Limited. MICA (P) 208/04/2011 and MICA (P) 040/04/2011
[316499]
渐飞研究报告 - http://bg.panlv.net
abc
Banks
Europe Robin Down Analyst, Global Sector Head, Banks +44 20 7991 6926 [email protected]
Monica Patrascu +44 20 7991 6828 [email protected]
Peter Toeman +44 20 7991 6791 [email protected]
Rob Murphy +44 20 7991 6748 [email protected]
Iason Kepaptsoglou +44 20 7991 6722 [email protected]
Lorraine Quoirez +44 20 7991 6667 [email protected]
Johannes Thormann Global Head of Exchanges +49 211 910 3017 [email protected]
Dimitris Haralabopoulos +30 210 6965 214 [email protected]
CEEMEA Gyorgy Olah Head of Ceemea Banks Research +44 20 7991 6709 [email protected]
Aybek Islamov +44 20 7992 3624 [email protected]
Tamer Sengun +90 212 376 46 15 [email protected]
Jan Rost +27 11 676 4209 [email protected]
Avinash Prakash Goel +91 80 3001 3704 [email protected]
Latin America Victor Galliano +1 212 525 5253 [email protected]
Paulo E Ribeiro Diversified Financial Services +1 212 525 4430 [email protected]
Mariel Santiago Financials +1 212 525 5418 [email protected]
Felipe Rodrigues +55 11 3847 9029 [email protected]
Leonardo Martins +55 11 3847 9881 [email protected]
Asia Todd Dunivant Analyst, Head of Banks, Asia-Pacific +852 2996 6599 [email protected]
York Pun +852 2822 4396 [email protected]
Eric Mak +852 2996 6585 [email protected]
Kathy Park +82 2 3706 8755 [email protected]
Sachin Sheth +91 22 2268 1224 [email protected]
Tejas Mehta +91 22 2268 1243 [email protected]
Kar Weng Loo +65 6239 0654 [email protected]
Xiushi Cai +65 6239 0624 [email protected]
Bruce Warden +886 2 8725 6028 [email protected]
Insurance
Europe Kailesh Mistry Analyst, Head of European Insurance +44 20 7991 6756 [email protected]
Dhruv Gahlaut +44 207 991 6728 [email protected]
Thomas Fossard +33 1 56 52 43 40 [email protected]
CEEMEA Erol Hullu +90 212 376 46 16 [email protected]
Asia James Garner Analyst, Head of Asian Insurance +852 2822 4321 [email protected]
Michael Chang +852 2996 6555 [email protected]
Grace Zhou +852 2822 3053 [email protected]
Sinyoung Park +822 3706 8770 [email protected]
Real Estate
Europe John Fraser-Andrews Head of Real Estate Equity Research, Europe +44 20 7991 6732 [email protected]
Thomas Martin +49 211 910 3276 [email protected]
Stéphanie Dossmann +33 1 56 52 43 01 [email protected]
Asia Derek Kwong Head of Real Estate Equity Research, Asia +852 2996 6629 [email protected]
Ashutosh Narkar +91 22 2268 1474 [email protected]
Michelle Kwok +852 2996 6918 [email protected]
Phillip Zhong +852 2996 6535 [email protected]
Perveen Wong +852 2996 6571 [email protected]
Pratik Burman Ray +65 6239 0652 [email protected]
David Choo +65 6239 0651 [email protected]
Abel Lee +886 2 8725 6026 [email protected]
CEEMEA Levent Bayar +90 212 376 46 17 [email protected]
Credit Research
Banks and Insurance
Asia Dilip Shahani Analyst, Head of Global Research, Asia-Pacific +852 2822 4520 [email protected]
Devendran Mahendran Sovereigns and Financial Institutions +852 2822 4521 [email protected]
North America Van Hesser Global Head of Credit Research, US Banks +1 212 525 3114 [email protected]
Monica A Parekh Associate +1 212 525 4117 [email protected]
Arjun Bowry Associate +1 212 525 3119 [email protected]
Specialist Sales Nigel Grinyer +44 20 7991 5386 [email protected]
Martin Williams +44 20 7991 5381 [email protected]
Juergen Werner +49 211 910 4461 [email protected]
Philip P Dragoumis +30 210 696 5128 [email protected]
Matthew Robertson +44 20 7991 5077 [email protected]
Global Financial Institution Group Research Team Carlo Digrandi Global Industry Head, FIG +44 20 7991 6843 [email protected]
渐飞研究报告 - http://bg.panlv.net