Embed Size (px)
Citation preview

Working Papers of the Priority Programme 1859
Experience and Expectation. Historical Foundations of Economic Behaviour
Edited by Alexander Nützenadel und Jochen Streb
No 11 (2019, September)
Working Papers of the Priority Programme 1859 „Experience and Expectation. Historical Foundations of Economic Behaviour”
No 11 (2019, September)
Horn, Sebastian / Reinhart, Carmen / Trebesch, Christoph
China’s Overseas Lending

Arbeitspapiere des Schwerpunktprogramms 1859 der Deutschen Forschungsgemeinschaft „Erfahrung und Erwartung. Historische Grundlagen ökonomischen Handelns“ /
Working Papers of the German Research Foundation’s Priority Programme 1859 “Experience and Expectation. Historical Foundations of Economic Behaviour”
Published in co-operation with the documentation and publication service of the Humboldt University, Berlin (https://edoc.hu-berlin.de).
ISSN: 2510-053X
Redaktion: Alexander Nützenadel, Jochen Streb, Ingo Köhler
V.i.S.d.P.: Alexander Nützenadel, Jochen Streb
SPP 1859 "Erfahrung und Erwartung. Historische Grundlagen ökonomischen Handelns" Sitz der Geschäftsführung: Humboldt-Universität Friedrichstr. 191-193, 10117 Berlin Tel: 0049-30-2093-70615, Fax: 0049-30-2093-70644 Web: https://www.experience-expectation.de Koordinatoren: Alexander Nützenadel, Jochen Streb Assistent der Koordinatoren: Ingo Köhler
Recommended citation:
Horn, Sebastian / Reinhart, Carmen / Trebesch, Christoph (2019): China’s Overseas Lending. Working Papers of the Priority Programme 1859 “Experience and Expectation. Historical Foundations of Economic Behaviour” No 11 (September), Berlin
© 2019 DFG-Schwerpunktprogramm 1859 „Erfahrung und Erwartung. Historische Grundlagen ökonomischen Handelns“
The opinions and conclusions set forth in the Working Papers of the Priority Programme 1859 Experience and Expectation. Historical Foundations of Economic Behaviour are those of the authors. Reprints and any other use for publication that goes beyond the usual quotations and references in academic research and teaching require the explicit approval of the editors and must state the authors and original source.
China’s Overseas Lending
Sebastian Horn University of Munich and Kiel Institute
Carmen Reinhart Harvard University
Christoph Trebesch Kiel Institute and University of Kiel
September 2019
Abstract
Compared with China’s dominance in world trade, its expanding role in global finance is poorly documented and understood. Over the past decades, China has exported record amounts of capital to the rest of the world. Many of these financial flows are not reported to the IMF, the BIS or the World Bank. “Hidden debts” to China are especially significant for about three dozen developing countries, and distort the risk assessment in both policy surveillance and the market pricing of sovereign debt. We establish the size, destination, and characteristics of China’s overseas lending. We identify three key distinguishing features. First, almost all of China’s lending and investment abroad is official. As a result, the standard “push” and “pull” drivers of private cross-border flows do not play the same role in this case. Second, the documentation of China’s capital exports is (at best) opaque. China does not report on its official lending and there is no comprehensive standardized data on Chinese overseas debt stocks and flows. Third, the type of flows is tailored by recipient. Advanced and higher middle-income countries tend to receive portfolio debt flows, via sovereign bond purchases of the People’s Bank of China. Lower income developing economies mostly receive direct loans from China’s state-owned banks, often at market rates and backed by collateral such as oil. Our new dataset covers a total of 1,974 Chinese loans and 2,947 Chinese grants to 152 countries from 1949 to 2017. We find that about one half of China’s overseas loans to the developing world are “hidden”.
JEL classification: F21, F34, F42, F6, G15, H63, N25
Keywords: China, international capital flows, official finance, hidden debts, sovereign risk, Belt and Road initiative Address: [email protected]; [email protected]; [email protected]
Acknowledgement: We thank Max Tchirikov, Mattis Bös and Martin Wiegand for excellent research assistance as well as the German Research Foundation (DFG) for financial support (SPP 1859). Sebastian Horn gratefully acknowledges financial support from the Egon Sohmen Graduate Center at LMU Munich. We thank Vincent Reinhart, Robert Subbaraman, and seminar participants at Harvard Kennedy School for helpful comments.
1
1. Introduction
In this paper we document the surge in China’s capital exports to the rest of the world during the
past decades. While China’s dominant footprint in world trade is well known, its expanding role in
global finance is poorly documented and understood. This paper helps fill this void by establishing
the size, destination, and characteristics of China’s global capital flows.
Unlike other major economies, almost all of China’s overseas lending and investment is official,
meaning that it is undertaken by the Chinese government, state-owned companies or the state-
controlled central bank. Most notable is the fact that the documentation of China’s capital exports
is (at best) opaque. China does not report on its official lending and there is no comprehensive
standardized data on Chinese overseas debt stocks and flows. Documentation of China’s overseas
lending literally falls through the cracks. Credit rating agencies, like Moody’s and Standard and
Poor’s, monitor sovereign borrowing from private creditors (banks, bondholders, or others); official
lending to sovereigns is off their radar screen. The Paris Club tracks sovereign borrowing from
official bilateral creditors (i.e., other sovereigns), which in principle, should cover most of China’s
overseas lending. However, China is not a member of the Paris Club and therefore has not been
subject to the standard disclosure requirements.
Adding to the data scarcity, commercial providers such as Bloomberg or Dealogic do not keep
track of China’s official overseas loans, and such lending is missed even by the most ambitious
recent attempts to measure international capital flows (e.g. Avdjiev et al. 2017, Coppola et al.
2019). The People’s Bank of China (PBoC) does not publish its sovereign bond purchases or the
composition of its portfolio. Similarly, China does not provide details on its “Belt and Road”
initiative and its direct lending activities. Apart from the aforementioned omissions in reporting to
the Paris Club, China does not divulge data on its official flows with the OECD’s Creditor
Reporting System, and it is not part of the OECD Export Credit Group, which provides data on
long- and short-term trade credit flows. With regard to cross-border banking, China recently joined
the list of countries reporting to the Bank for International Settlements (BIS), but the data are not
made available on a bilateral basis and the coverage is incomplete, as we will discuss below. Taken
together, these data limitations make it very challenging to do rigorous empirical work on China’s
official capital exports.
Apart from the lapses in reporting, the entry of China in the international financial system about
two decades ago has created a major gap in the academic literature. There is almost no research on
the consequences of China’s global “finance shock”, while the China “trade shock” has been
studied extensively (Autor et al. 2013).1 Most international macroeconomists continue to focus on
the role of the United States and the capital markets of London and New York, which have
1 For a survey on the large and growing literature on the Chinese trade shock see Autor et al. (2016).
2
dominated for the past two centuries. The literature on a “global financial cycle”, for example,
focuses almost exclusively on the spillovers from the United States, proxied with variables such as
US interest rates or the VIX - the volatility of US stock markets (Obstfeld 2015, Rey 2015,
Miranda-Aggripino and Rey 2015, Jordá et al. 2018). Few, if any papers, study similar financial
spillovers from China. Also the broader literature on international capital flows or on “global
liquidity” typically centers on US financial conditions and a related set of well-known “push” and
“pull” factors (Calvo et al. 1993, Forbes and Warnock 2012, Fratzscher 2012, Bruno and Shin
2014).2
As we document in this paper, this approach is not well suited to characterize China’s massive
official capital outflows. Instead, we find that variables linked to Chinese domestic activity and
commodity prices do best in explaining the time-variation in China’s government-led investments
abroad. It is not surprising that China’s official flows do not necessarily mirror the incentives of
private agents searching for yield, in the same way that it would be wildly inappropriate to assert
that the post-WWII Marshall Plan was driven by the search for yield. As might be expected,
official lending is likely to be shaped by the geopolitical objectives of the Chinese government.
This is in line with historical precedent. As we show in Horn et al. (forthcoming), rising economic
powers have recurrently used state-driven lending to tap into new markets abroad, to secure
commodity imports, and to further their global ambitions. These are factors usually excluded from
the empirical literature on capital flow drivers.
Another obstacle to understanding China’s role in international finance today is a “silo problem” in
the literature, as the various strands of relevant research have remained largely disconnected. One
branch of research has studied central bank reserve accumulation and “uphill” capital flows from
emerging markets to advanced countries (e.g. Song et al. 2011, Alfaro et al. 2014, Gourinchas and
Jeanne 2013). In that work, China features prominently as a buyer of advanced country bonds, but
this particular type of capital exports is not studied in tandem with China’s other forms of investing
overseas. Other papers have explored Chinese FDI and equity investments in advanced countries
(e.g. Fuest et al. 2019), or China’s capital flows to developing countries, in particular via aid, grants
and loans (see e.g. Dreher and Fuchs 2016, Dreher et al. 2018).3 Yet another strand of work
analyzes the global role of China’s currency in the international monetary system, but without
studying the associated capital flows in detail (Prasad 2016, Farhi and Maggiori 2019, Ilzetzki et al.
2019). While these studies shed light on components of the Chinese official capital outflow surge,
they miss an encompassing picture of China’s international capital exports, ranging from portfolio
investment, asset purchases, cross-border bank lending, and trade credits, to official lending
between governments and between central banks.
2 See also the literature on global imbalances, which focuses, front and center, on the dominant role of the United States (Caballero et al. 2008, Mendoza et al. 2009, Gourinchas and Rey 2014). 3 There is also some research on the growth spillovers from China to other emerging markets, but this work abstracts from financial spillovers, or broader issues relevant for the international financial architecture.
3
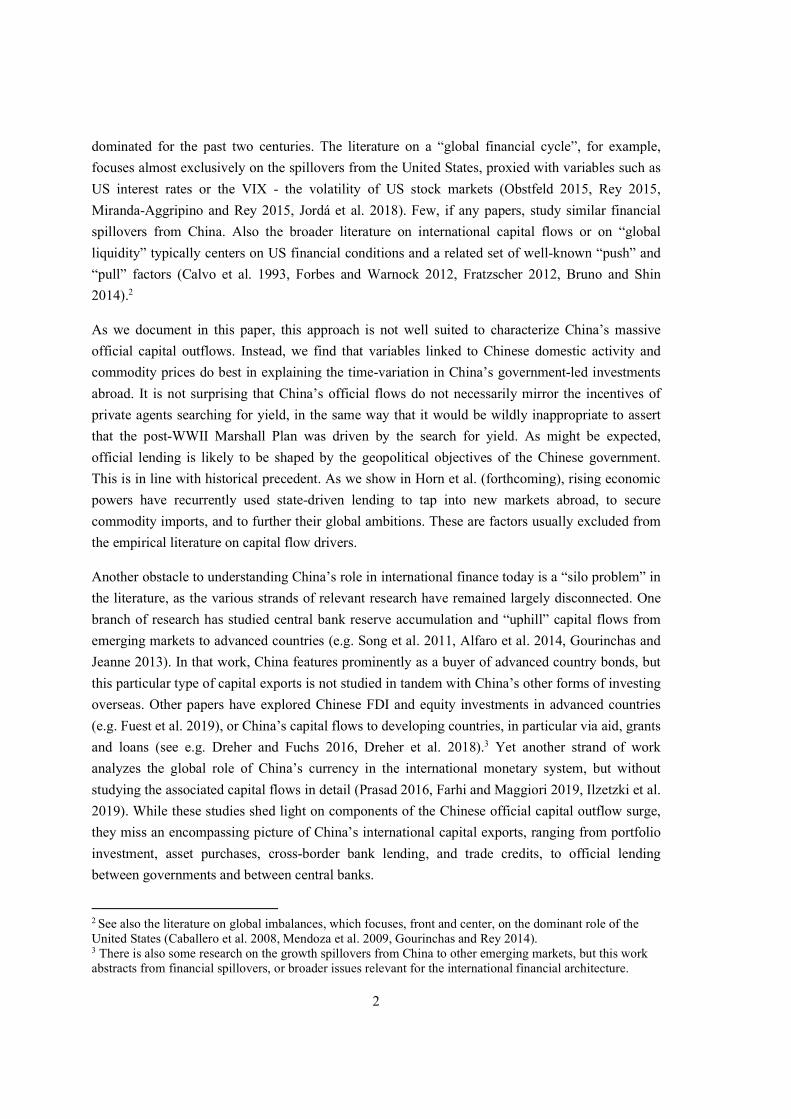
Here, we take a first step toward quantifying and understanding China’s global capital exports,
including its opaque overseas lending to developing countries that remains largely unexplored. To
motivate our analysis on China’s overseas lending, Figure 1 uses aggregate data from China’s
balance of payments (BoP) statistics. China’s direct loans and trade credits have climbed from
almost zero in 1998 to more than 1.6 trillion USD, or close to 2 percent of world GDP in 2018.4
These loans mostly go to low- and middle-income countries. In total, estimates suggest that the
Chinese state now accounts for a quarter of total bank lending to emerging markets.5 This has
transformed China into the largest official creditor, easily surpassing the IMF or the World Bank.
Beyond that, however, little is known. Among our tasks is to identify these borrowers.
Figure 1. China’s Overseas Lending Boom
Note: This figure shows a subset of outstanding Chinese overseas debt claims as reported in China’s BoP Statistics, scaled by global GDP. Trade credit includes short- and long-term trade credits and advances. FDI debt claims arise in case of inter-company lending across borders (see Footnote 5). Portfolio debt is excluded (see Figure 2). Source: PBoC and IMF.
In light of the acute data shortcomings, our first step is to compile a new “consensus” database of
Chinese loans to the rest of the world and construct corresponding debt flow and stock estimates.
Our new dataset covers a total of 1,974 Chinese loans and 2,947 Chinese grants to 152 emerging or
developing countries from 1949 to 2017. “Consensus” refers to the approach adopted, which
attempts to reconcile what multiple sources record about the same bilateral lending transaction.6
4 The numbers include debt claims from China’s FDI - a channel of Chinese overseas debt that has received little attention. FDI debt claims arise, if there is inter-company lending between a foreign direct investor and a non-resident entity, over which the foreign direct investor has significant control. 5 This number includes flows via offshore financial centers (Cerutti et al. 2018). 6 This approach has well-established antecedents in the capital flow literature. Studies on the measurement of capital flight via trade mis-invoicing (see Chang et al. 1997, for instance) also attempted to reconcile multiple
4
Our newly assembled database of Chinese lending abroad spans more than six decades from 1949,
when the People’s Republic was established, until 2017. The data is granular and was gathered
from a variety of sources (the consensus approach as described), including international treaties,
debt contracts, policy reports, as well as the work of academics such as the AidData team at
William and Mary (Dreher et al. 2017). Overall, we combined details on more than 1,947 loans as
well as 2,947 grants extended by the Chinese government and state-owned creditor agencies since
1949, to more than 150 countries worldwide, with total commitments of 530 billion US$.
Whenever possible, we also gathered loan-level information on the interest rates, currency
denomination, and the repayment terms of Chinese lending and check what part of the debt is
publicly reported and how much is “hidden”, in the sense that it is not picked up by official
statistics of the IMF, World Bank or BIS.
We find that the People’s Republic has always been an active international lender, even in the
1950s and 1960s, when it lent substantial amounts to Communist brother states. That is, official
Chinese lending has always had a strategic element. What has made China such a dominant global
creditor in the recent 20 years is the drastic increase of China’s GDP, combined with China’s
“Going Global Strategy” to foster Chinese investment abroad, which was initiated in 1999.
Chinese loans have helped to finance large-scale investments in infrastructure, energy and mining
in more than 100 developing and emerging market countries, with potentially large positive effects
for growth and prosperity. At the same time, however, the large lending flows resulted in the build-
up of high debt servicing burdens. For the 50 main recipients of Chinese direct lending, the average
stock of debt owed to China has increased from less than 1% of GDP in 2005 to more than 15% of
debtor country GDP in 2017, at least according to our lower bound estimates. For these countries,
debt to China now accounts for more than 40% of total external debt, on average.
More importantly, using unpublished data from the World Banks’s Debtor Reporting System and
data on BIS reported bank claims, we find that about 50% of China’s lending is “hidden”. Neither
the IMF, nor the World Bank, nor credit rating agencies report on these “hidden” debt stocks,
which have grown to more than 200 billion USD as of 2016. The problem of “hidden” Chinese
debts is particularly severe in crisis countries such as Venezuela, Zimbabwe, and Iran. Indeed,
China does not report any bank claims towards these countries to the BIS, despite substantial
known lending flows over the past 15 years. These findings have important implications for debt
sustainability in recipient countries, also because China’s state-driven lending abroad differs
strongly from other official lenders such as the World Bank or OECD governments.
data sources. The typical exercise compared what a country recorded as exports (imports) versus what its trading partners posted on their books. For example, if a country reported a level of exports that were lower than the level of imports its trading partners recorded (export under-invoicing), it was interpreted as a proxy for capital flight (export proceeds that were left abroad). A similar logic applied to import over-invoicing.
5
Over the past decades, official creditors have typically lent to developing countries at
concessionary terms with long maturities and at below-market interest rates. China, instead, often
lends at market terms (with risk premia), shorter maturities, and partly with collateral clauses that
secure repayment through commodity export proceeds, in particular from oil. The latter establishes
China’s comparatively high level of seniority among other international creditors (see Schlegl et al.
2019). These practices have a historical analogue. Indeed, China’s overseas loans share many
features with French, German and British 19th century foreign lending, which also tended to be
market based, partially collateralized by commodity income, and characterized by a close link of
political and commercial interests (Feis 1930, Borchardt 1951).
With a view to financial stability, another relevant historical analogue is the lending boom of the
1970s, when resource-rich, low-income countries received large amounts of syndicated bank loans
while commodity prices boomed. The Chinese lending flows during 2008 to 2015 share similarities
with the 1970s lending cycle, which did not end happily once commodity prices, export revenues,
and economic growth slumped across many of the countries that had gone on a borrowing spree.
After 1982, dozens of sovereigns went into default, resulting in a “lost decade” in Latin America
and elsewhere. The sharp increase in the incidence of sovereign debt restructurings of Chinese debt
since 2011 suggests a new wave of debt overhangs. We show that debt sustainability concerns are
largest in developing countries that have received the most Chinese loans, several of which have
benefitted from the HIPC debt relief initiative. Debt levels and the debt service burdens in two
dozen developing countries are much higher than previously thought.
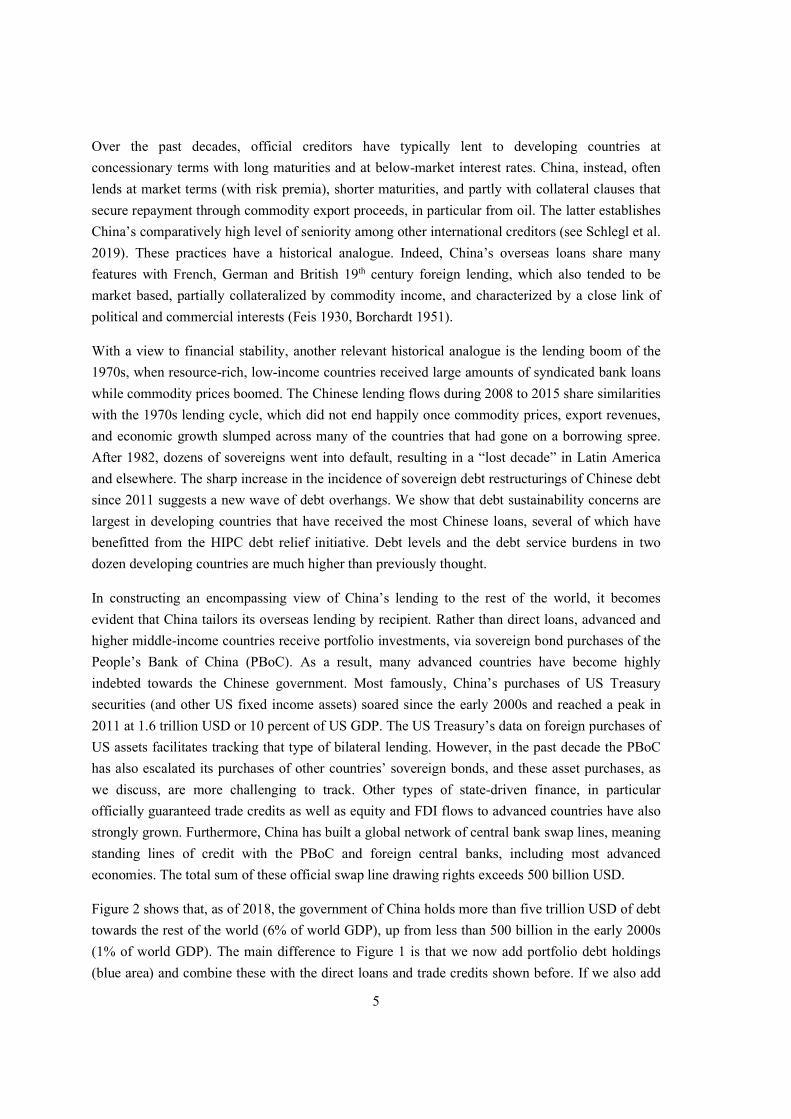
In constructing an encompassing view of China’s lending to the rest of the world, it becomes
evident that China tailors its overseas lending by recipient. Rather than direct loans, advanced and
higher middle-income countries receive portfolio investments, via sovereign bond purchases of the
People’s Bank of China (PBoC). As a result, many advanced countries have become highly
indebted towards the Chinese government. Most famously, China’s purchases of US Treasury
securities (and other US fixed income assets) soared since the early 2000s and reached a peak in
2011 at 1.6 trillion USD or 10 percent of US GDP. The US Treasury’s data on foreign purchases of
US assets facilitates tracking that type of bilateral lending. However, in the past decade the PBoC
has also escalated its purchases of other countries’ sovereign bonds, and these asset purchases, as
we discuss, are more challenging to track. Other types of state-driven finance, in particular
officially guaranteed trade credits as well as equity and FDI flows to advanced countries have also
strongly grown. Furthermore, China has built a global network of central bank swap lines, meaning
standing lines of credit with the PBoC and foreign central banks, including most advanced
economies. The total sum of these official swap line drawing rights exceeds 500 billion USD.
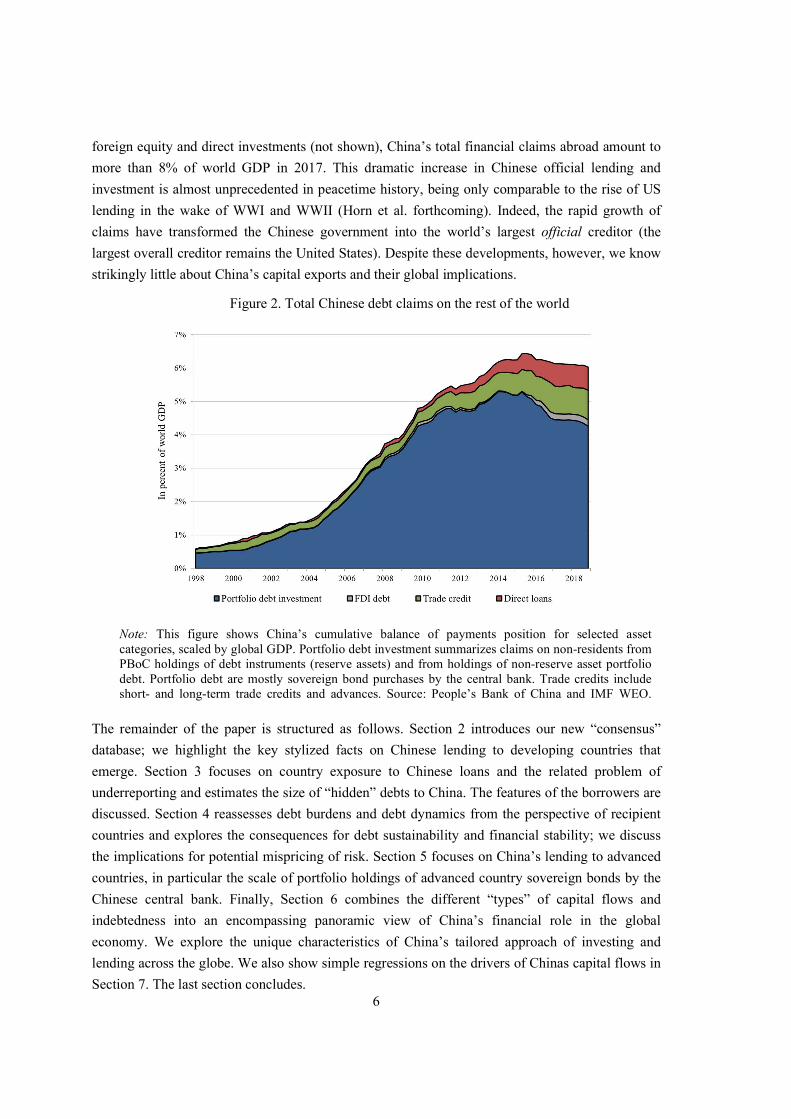
Figure 2 shows that, as of 2018, the government of China holds more than five trillion USD of debt
towards the rest of the world (6% of world GDP), up from less than 500 billion in the early 2000s
(1% of world GDP). The main difference to Figure 1 is that we now add portfolio debt holdings
(blue area) and combine these with the direct loans and trade credits shown before. If we also add
6
foreign equity and direct investments (not shown), China’s total financial claims abroad amount to
more than 8% of world GDP in 2017. This dramatic increase in Chinese official lending and
investment is almost unprecedented in peacetime history, being only comparable to the rise of US
lending in the wake of WWI and WWII (Horn et al. forthcoming). Indeed, the rapid growth of
claims have transformed the Chinese government into the world’s largest official creditor (the
largest overall creditor remains the United States). Despite these developments, however, we know
strikingly little about China’s capital exports and their global implications.
Figure 2. Total Chinese debt claims on the rest of the world
Note: This figure shows China’s cumulative balance of payments position for selected asset categories, scaled by global GDP. Portfolio debt investment summarizes claims on non-residents from PBoC holdings of debt instruments (reserve assets) and from holdings of non-reserve asset portfolio debt. Portfolio debt are mostly sovereign bond purchases by the central bank. Trade credits include short- and long-term trade credits and advances. Source: People’s Bank of China and IMF WEO.
The remainder of the paper is structured as follows. Section 2 introduces our new “consensus”
database; we highlight the key stylized facts on Chinese lending to developing countries that
emerge. Section 3 focuses on country exposure to Chinese loans and the related problem of
underreporting and estimates the size of “hidden” debts to China. The features of the borrowers are
discussed. Section 4 reassesses debt burdens and debt dynamics from the perspective of recipient
countries and explores the consequences for debt sustainability and financial stability; we discuss
the implications for potential mispricing of risk. Section 5 focuses on China’s lending to advanced
countries, in particular the scale of portfolio holdings of advanced country sovereign bonds by the
Chinese central bank. Finally, Section 6 combines the different “types” of capital flows and
indebtedness into an encompassing panoramic view of China’s financial role in the global
economy. We explore the unique characteristics of China’s tailored approach of investing and
lending across the globe. We also show simple regressions on the drivers of Chinas capital flows in
Section 7. The last section concludes.
7
2. Chinese direct lending to the developing world: a new database and stylized facts
2.1. Why China’s overseas lending is opaque
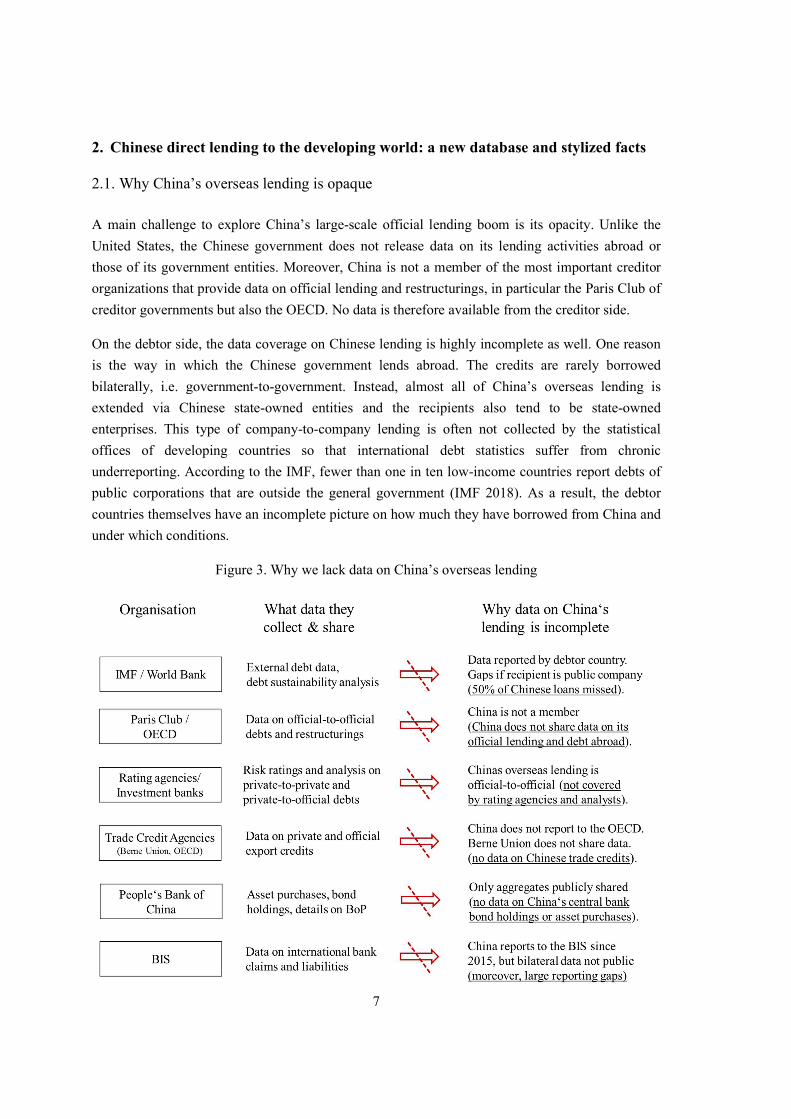
A main challenge to explore China’s large-scale official lending boom is its opacity. Unlike the
United States, the Chinese government does not release data on its lending activities abroad or
those of its government entities. Moreover, China is not a member of the most important creditor
organizations that provide data on official lending and restructurings, in particular the Paris Club of
creditor governments but also the OECD. No data is therefore available from the creditor side.
On the debtor side, the data coverage on Chinese lending is highly incomplete as well. One reason
is the way in which the Chinese government lends abroad. The credits are rarely borrowed
bilaterally, i.e. government-to-government. Instead, almost all of China’s overseas lending is
extended via Chinese state-owned entities and the recipients also tend to be state-owned
enterprises. This type of company-to-company lending is often not collected by the statistical
offices of developing countries so that international debt statistics suffer from chronic
underreporting. According to the IMF, fewer than one in ten low-income countries report debts of
public corporations that are outside the general government (IMF 2018). As a result, the debtor
countries themselves have an incomplete picture on how much they have borrowed from China and
under which conditions.
Figure 3. Why we lack data on China’s overseas lending

8
Also the private financial industry does not monitor China’s state-driven cross-border lending
flows. Rating agencies such as S&P or Moody’s track debt and credit events (defaults) on private-
to-private or private-to-official flows, but they miss official lending, such as the loans by state-
owned Chinese policy banks. For similar reasons, major data providers such as Bloomberg or
Dealogic have failed to identify the international Chinese lending boom. They carefully track
publicly traded debt instruments such as sovereign bonds or private syndicated loans, but miss
China’s official loans, which are not priced in international markets.
The data provided by the BIS locational banking statistics do not help either. China started to report
to the BIS in 2015, but the government has not agreed to publicly release the bilateral (country-by-
country) claims data, as many other BIS reporting countries do. Only aggregate Chinese claims are
available, and only back to 2015. Nevertheless, in Section 3.2., we describe a way to infer the size
of Chinese claims from BIS data as of end-2015. The evidence suggests that China only reports
parts of its overseas claims to the BIS, with large reporting gaps particularly in high-risk countries.
One potential explanation for the incomplete reporting to the BIS is that China uses a “circular”
lending strategy that minimizes the risk of default on its loans. For risky debtors, China’s state-
owned policy banks often choose not to transfer any money to accounts controlled by the recipient
government. Instead, the loans are disbursed directly to the Chinese contractor firm that
implements the construction project abroad – a closed circle.7 The loans thus remain within the
Chinese financial system, making it harder for recipient countries to misuse the money. Because
this type of overseas loan is not actually transferred abroad, there is nothing to report to the BIS,
which could explain part of China’s large reporting gaps.
Figure 3 summarizes why we know so little about China’s overseas lending. The knowledge gap is
a major problem for debt management, surveillance work and asset pricing alike. Debt
sustainability analyses are challenging, to say the least, if large parts of a country’s debt and debt
service burden remain excluded from the official aggregates. The same is true for the IMF’s
surveillance work. From the perspective of private investors, the opacity makes risk pricing
difficult. If a substantial portion of total external debts of a country is unknown, it is almost
impossible to price sovereign bonds and the associated default risk properly. Finally, opacity is a
problem when it comes to crisis resolution. In case of a default, the stock and composition of a
country’s debt is crucial information to assure fair burden sharing and an orderly process to manage
and exit the crisis.
In the remainder of this section we address the lack of transparency, by creating a new consensus
database of Chinese overseas lending and summarize its main characteristics.
7 Bräutigam (2009) calls this strategy the “Eximbank Cycle”.
9
2.2. Identifying Chinese lending: a database of flows and stocks
A key contribution of this paper is to create a new consensus database of Chinese overseas lending
(loans and grants) spanning seven decades (1949-2017) that builds on a broad range of existing
data sources, historical archives and the existing literature. We then use the loan-level data to
compute debt stock and debt servicing profiles for each country, focusing on the period 2000-2017.
Data sources and merging approach: Appendix I describes our approach and the sources in detail.
For the modern period, our main source is AidData’s Chinese Official Finance database (Dreher et
al. 2017), which encompasses more than 1,200 loans and 2,300 grants to 140 recipient countries
during 2000-2014 and was coded from hundreds of primary sources. We complement and cross-
check this rich source with various region- and sector-specific databases that have excellent
coverage for subsets of China’s foreign lending and which allow us to extend our dataset until
2017. These sources are summarized in Table 1 below and in Appendix I. To go further back in
time, we collected a large number of historical sources, most importantly a set of recently
declassified CIA reports that contain rich transaction-level details on China’s international grants
and loans in the post-WWII era. We cross-check and complement the information from this source
with multiple other archival documents and sources on Chinese lending going back to 1949, when
the People’s Republic was founded.
Table 1. Data sources on Chinese foreign lending, 1950 - 2018
Note: This table summarizes the main existing data sources on Chinese overseas lending for the modern, post-2000 period. A complete list of sources and the respective references are provided in the appendix. Commitments are expressed in current USD.
To generate a consensus database, we compare each loan or grant across all sources in case of
overlaps, filter out duplicates, identify missing data points and, in case of conflicting information,
consult additional primary sources. Our final, unified dataset covers 1974 loans and 2947 grants by
China's Official Finance Database Global 2000 - 2014 Loans and grants 279 bn
China's Public Diplomacy Dataset East Asia & Oceania 2000 - 2016 Loans and grants 38 bn
Boston University GDPC China's Global Energy Finance Global 2000 - 2018 Energy finance 250 bn
Inter-American Dialogue China - LA Finance Database Latin America 2005 - 2018 Loans 141 bn
John Hopkins CARI Chinese Loans to Africa Africa 2000 - 2017 Loans 144 bn
Lowy Institute Chinese Aid in the Pacific Pacific Islands 2002 - 2018 Loans and grants 6 bn
US Export Import Bank Competitiveness Reports Global 2013 - 2017 Export credits 50 bn
CIA Reports on Communist Aid Global 1950 - 1983 Loans and grants 5.9 bn
Bartke (1989) Chinese Aid Projects Global 1950 - 1988 Aid projects n.a.
Lin (1993) Forein Aid of the PRC Global 1950 - 1992 Loans and grants n.a.
Copper (2016) China's Foreign Aid & Investment Global 1950 - 2015 Country case studies n.a.
Our merged database Horn, Reinhart, Trebesch (2019) Global 1950 - 2017 Loans and grants 530 bn
TypeTotal
commitment
AidData at William & Mary
Institution Geographic coverage Time coverageDataset / source
10
different Chinese official and state-owned creditors to more than 150 countries and spans the entire
history of the People’s Republic from 1949 to 2017, with total recorded commitments amounting to
530 billion USD.
From flows to stocks: To transform the flow data into stocks we computed estimated repayment
histories for each loan and then aggregate these on a country-year level. This procedure requires
reliable data on the repayment terms of the loans which is best available for the period 2000-2017.
For about one third of all loans in this period, we know all necessary details from the existing
datasets. For an additional 45 percent of loans we can approximate the repayment terms by making
use of the fact that Chinese lending practices are highly standardized, i.e. largely predetermined by
who lends (creditor agency). We first created a typology of creditor-specific Chinese lending terms
by combining qualitative and quantitative information and cross-checking our results with existing
literature (see Appendix I for details). In a nutshell, Chinese foreign loans fall into three broad
categories: (i) interest-free loans, (ii) other concessional loans by the China Export Import Bank
and (iii) commercial loans extended by a variety of state-owned banks and enterprises. Taken
together, this approach gives us detailed lending terms for around 75 percent of loans in our
database. For the remaining 25 percent, we make the conservative assumption that loans are
extended at concessional terms, thus under-estimating debt service to China. The product is a new
yearly database of debt stocks owed to China, and the resulting interest and amortization payments.
The dataset starts in 2000 and covers 106 recipient countries of Chinese direct lending that have
received Chinese loans of at least 1 percent of GDP (see Table 5 in Appendix I for the country list).
Comparison to aggregate figures: Our estimates on debt to China represent a conservative, lower
bound. We might overestimate debt figures in a few individual cases (see Appendix I), but for the
large majority of countries the true debt levels and debt service payments to China are likely to be
higher than our conservative estimates.8 This is because, despite our best efforts to gather loan-
level data from dozens of sources, we still capture only about 60 percent of total Chinese overseas
loans. In total, our estimates for 106 developing and emerging countries amount to 400 billion USD
to China at the end of 2017. This compares to 650 billion of outstanding loans reported in China’s
BoP statistics. Another piece of evidence is provided by Cerutti et al. (2018) who use confidential
data reported to the BIS to show that, at the end of 2018, Chinese bank claims towards emerging
market debtors reached 919 billion USD. This is more than twice the amount of 400 billion USD
we were able to trace down for developing and emerging markets at the end of 20179. They further
show that two thirds of total Chinese bank lending to EMEs is channeled through offshore financial
8 In Appendix I we discuss the caveats of our approach. Most importantly, we rely on loan-level data that is based on commitments rather than actually disbursed loans. While we do our best to drop non-disbursed parts of Chinese lending, it is possible that total debt stocks are lower than what we estimate in some countries, because not all promised loans were paid out. 9 This gap might partly be explained by bank lending to Chinese corporations operating abroad, which we do not aim to cover in our estimates.
11
centers and foreign affiliates of Chinese banks. These offshore flows are often hardest to track, as
emphasized by Zucman (2013) or Coppola et al. (2019).
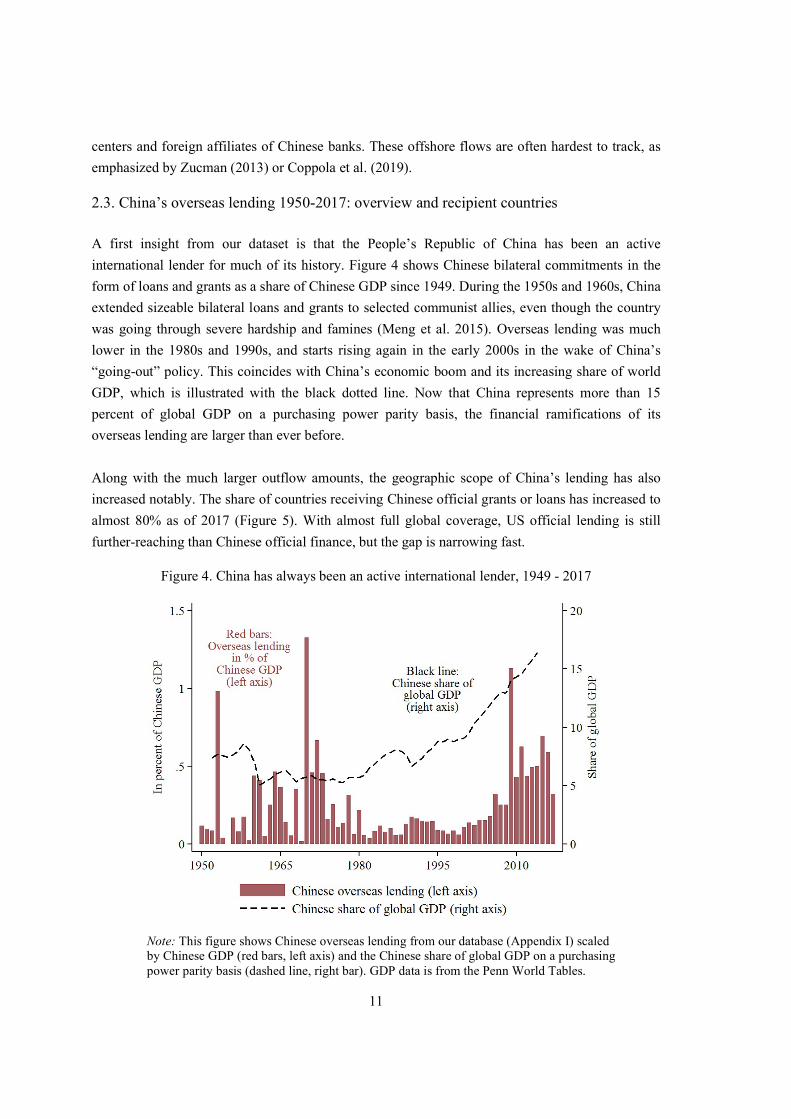
2.3. China’s overseas lending 1950-2017: overview and recipient countries
A first insight from our dataset is that the People’s Republic of China has been an active
international lender for much of its history. Figure 4 shows Chinese bilateral commitments in the
form of loans and grants as a share of Chinese GDP since 1949. During the 1950s and 1960s, China
extended sizeable bilateral loans and grants to selected communist allies, even though the country
was going through severe hardship and famines (Meng et al. 2015). Overseas lending was much
lower in the 1980s and 1990s, and starts rising again in the early 2000s in the wake of China’s
“going-out” policy. This coincides with China’s economic boom and its increasing share of world
GDP, which is illustrated with the black dotted line. Now that China represents more than 15
percent of global GDP on a purchasing power parity basis, the financial ramifications of its
overseas lending are larger than ever before.
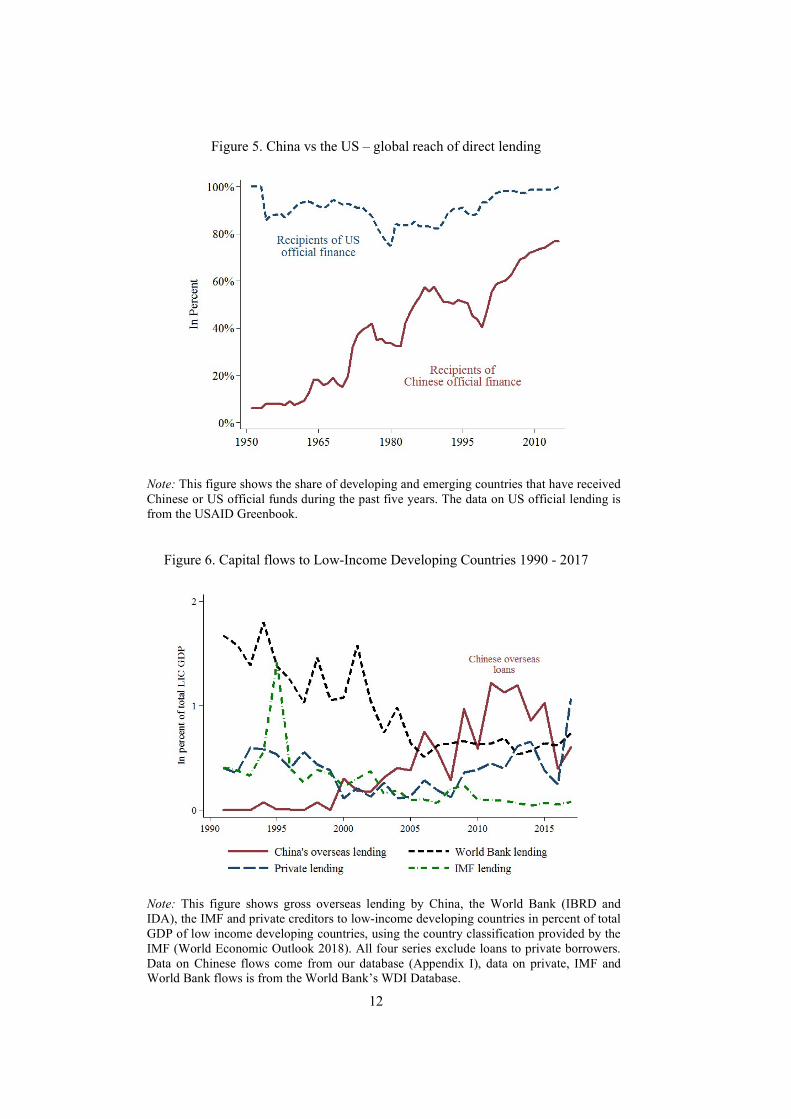
Along with the much larger outflow amounts, the geographic scope of China’s lending has also
increased notably. The share of countries receiving Chinese official grants or loans has increased to
almost 80% as of 2017 (Figure 5). With almost full global coverage, US official lending is still
further-reaching than Chinese official finance, but the gap is narrowing fast.
Figure 4. China has always been an active international lender, 1949 - 2017
Note: This figure shows Chinese overseas lending from our database (Appendix I) scaled by Chinese GDP (red bars, left axis) and the Chinese share of global GDP on a purchasing power parity basis (dashed line, right bar). GDP data is from the Penn World Tables.
12
Figure 5. China vs the US – global reach of direct lending
Note: This figure shows the share of developing and emerging countries that have received Chinese or US official funds during the past five years. The data on US official lending is from the USAID Greenbook.
Figure 6. Capital flows to Low-Income Developing Countries 1990 - 2017
Note: This figure shows gross overseas lending by China, the World Bank (IBRD and IDA), the IMF and private creditors to low-income developing countries in percent of total GDP of low income developing countries, using the country classification provided by the IMF (World Economic Outlook 2018). All four series exclude loans to private borrowers. Data on Chinese flows come from our database (Appendix I), data on private, IMF and World Bank flows is from the World Bank’s WDI Database.
13
The overseas lending boom has transformed China into one of the major official creditors
worldwide. The footprint of China is particularly large among low-income countries, where
Chinese lending flows have surpassed total capital flows from multilateral creditors such as the
IMF or the World Bank, as well as flows from private creditors (Figure 6). Figure A3 in the
Appendix shows a similar comparison of China versus other creditors, using outstanding debts.
The flipside of China’s large-scale lending flows is an increasing debt stock and growing annual
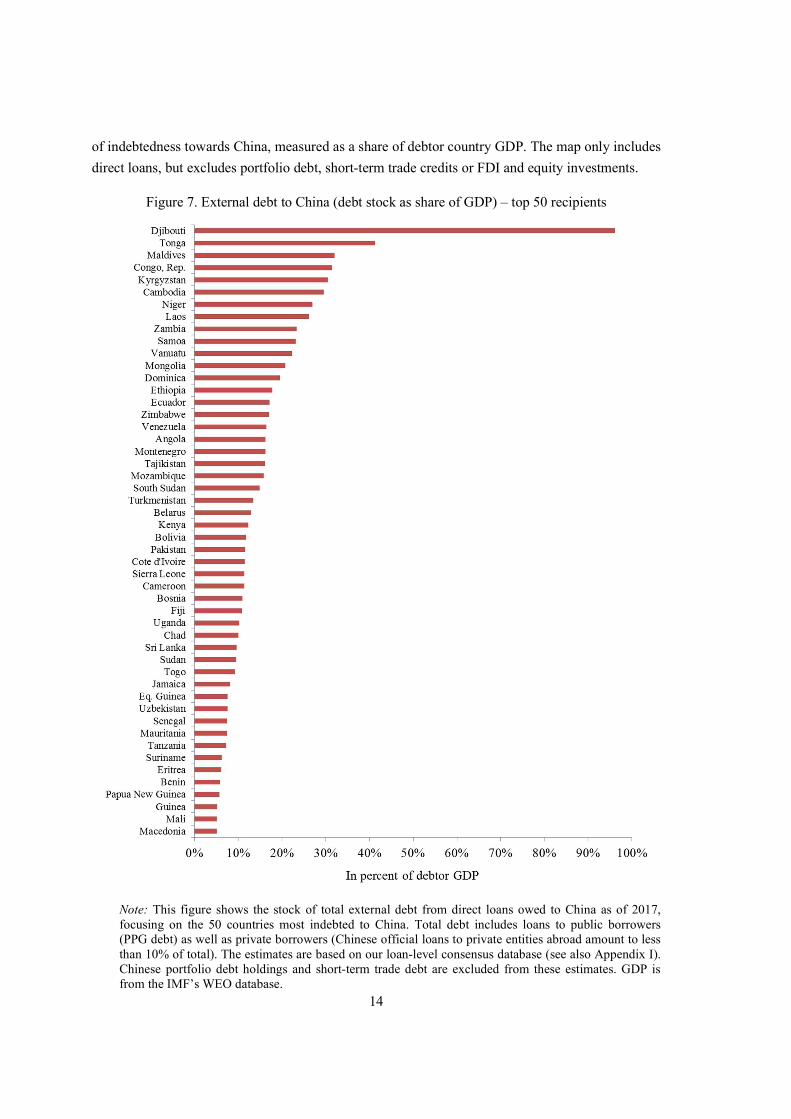
debt service obligations in many recipient countries. Figure 7 ranks countries that are most
indebted to China according to our estimates. The debt stock estimates include both loans to public
borrowers (public and publicly guaranteed debt) as well as to private borrowers in recipient
countries. As mentioned earlier, the large bulk of China’s state-driven lending goes to public
entities, while loans to private entities account for less than 10% of total (we drop private
borrowing in parts of our analysis below).
More than two dozen countries now owe more than 10% of their GDP to the Chinese government.
On average, for the top 50 recipients of Chinese direct loans, debt to China has increased to more
than 16% of GDP in 2017. Chinese official lending now also trumps that by other major official
creditor nations. Developing and emerging countries are now much more indebted to China than to
all other major creditor governments combined: According to our estimates, developing and
emerging market sovereigns owe 380 billion USD to China compared to 246 billion USD in debt
owed to the group of 22 Paris Club member governments (see also Appendix I.4).
The country group most exposed to China are low income developing countries (LIDCs), many of
whom are commodity exporters and some are former highly-indebted poor countries (HIPCs) who
benefitted from large-scale official debt relief in the 1990s and 2000s. This can be seen in Figure 8
(Panel A), which shows that the average LIDC indebtedness to China was 11% of GDP as of 2017.
In comparison, emerging market (EME) countries owed 6.5% of GDP in debt to China, on average,
using our sample and database. Another highly exposed group are oil-exporting countries, such as
Angola, Ecuador, Niger or Venezuela, as well as countries that are commonly associated with
China’s “Belt and Road” initiative (listed in World Bank 2018). For the BRI countries, the median
in our data is comparatively low (3.6% debt to GDP), while the average is more than twice as high
(8.8% debt to GDP). This reflects the fact that some BRI countries have already borrowed heavily
from China (pushing up the average), while others have only recently joined and are not as highly
indebted as of 2017, such as countries in Eastern Europe and the Middle East.
The regions most indebted to China are Far East Asia and Central Asia, including highly exposed,
small economies that are in geographic proximity to China such as Laos, Cambodia and the Kyrgyz
Republic (see Panel B of Figure 8). Next come Sub-Saharan Africa and Latin America, as well as
some parts of the MENA (Middle East and North Africa) region. The debt flows to Eastern Europe
are smaller, when measured as a share of debtor country GDP, but the amounts of credit to Europe
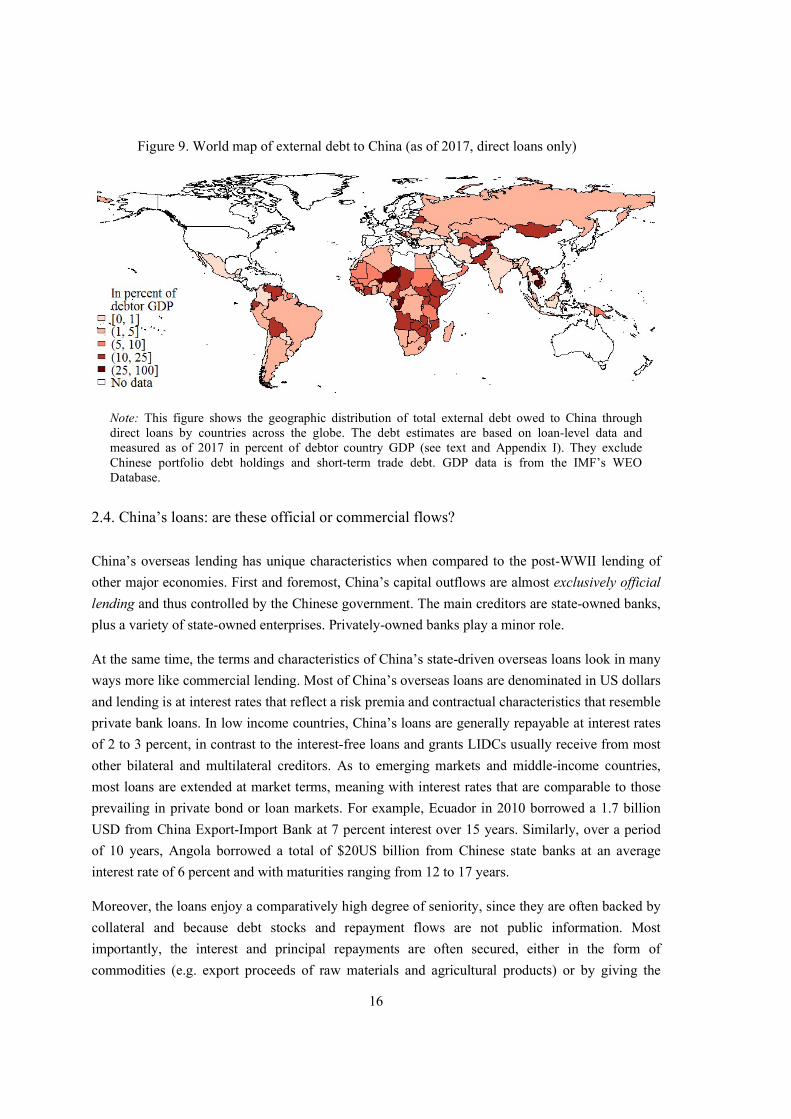
have been growing substantially over the past five years. Figure 9 shows a world map on the scale
14
of indebtedness towards China, measured as a share of debtor country GDP. The map only includes
direct loans, but excludes portfolio debt, short-term trade credits or FDI and equity investments.
Figure 7. External debt to China (debt stock as share of GDP) – top 50 recipients
Note: This figure shows the stock of total external debt from direct loans owed to China as of 2017, focusing on the 50 countries most indebted to China. Total debt includes loans to public borrowers (PPG debt) as well as private borrowers (Chinese official loans to private entities abroad amount to less than 10% of total). The estimates are based on our loan-level consensus database (see also Appendix I). Chinese portfolio debt holdings and short-term trade debt are excluded from these estimates. GDP is from the IMF’s WEO database.

15
Figure 8. External debt to China by region and functional groups (as of 2017, share of GDP)
Panel A. Debt to China by country group
Panel B. Debt to China by region
Note: This figure shows average debt to China (blue dots), median debt to China (red squares) and the inter-quartile range (the distance from the lower to the upper quartile of the debt distribution, grey lines) for different country groups (Panel A) and regions (Panel B), each as a share of debtor country GDP in 2017. Debt estimates are based on loan-level data (see text and Appendix I) and include loans to public borrowers (PPG debt) as well as to private borrowers (Chinese loans to private entities abroad are less than 10% of total). Chinese portfolio debt and short-term trade debt are excluded. GDP and country classifications from IMF WEO, LIDCs stands for Low Income Developing Countries. See Appendix I for the list of countries in our sample.
16
Figure 9. World map of external debt to China (as of 2017, direct loans only)
Note: This figure shows the geographic distribution of total external debt owed to China through direct loans by countries across the globe. The debt estimates are based on loan-level data and measured as of 2017 in percent of debtor country GDP (see text and Appendix I). They exclude Chinese portfolio debt holdings and short-term trade debt. GDP data is from the IMF’s WEO Database.
2.4. China’s loans: are these official or commercial flows?
China’s overseas lending has unique characteristics when compared to the post-WWII lending of
other major economies. First and foremost, China’s capital outflows are almost exclusively official
lending and thus controlled by the Chinese government. The main creditors are state-owned banks,
plus a variety of state-owned enterprises. Privately-owned banks play a minor role.
At the same time, the terms and characteristics of China’s state-driven overseas loans look in many
ways more like commercial lending. Most of China’s overseas loans are denominated in US dollars
and lending is at interest rates that reflect a risk premia and contractual characteristics that resemble
private bank loans. In low income countries, China’s loans are generally repayable at interest rates
of 2 to 3 percent, in contrast to the interest-free loans and grants LIDCs usually receive from most
other bilateral and multilateral creditors. As to emerging markets and middle-income countries,
most loans are extended at market terms, meaning with interest rates that are comparable to those
prevailing in private bond or loan markets. For example, Ecuador in 2010 borrowed a 1.7 billion
USD from China Export-Import Bank at 7 percent interest over 15 years. Similarly, over a period
of 10 years, Angola borrowed a total of $20US billion from Chinese state banks at an average
interest rate of 6 percent and with maturities ranging from 12 to 17 years.
Moreover, the loans enjoy a comparatively high degree of seniority, since they are often backed by
collateral and because debt stocks and repayment flows are not public information. Most
importantly, the interest and principal repayments are often secured, either in the form of
commodities (e.g. export proceeds of raw materials and agricultural products) or by giving the
17
creditor the right to attach the profits of state-owned enterprises. To our knowledge, no other
official lender collateralizes its international loans in this way, at least not this systematically.
The institutional and legal characteristics of China’s loans also have commercial rather than official
characteristics. The loans are extended by a variety of creditors, including more than a dozen public
banks and public enterprises that behave like private entities. In addition, the lending contracts
often look like commercial loans, with secrecy and arbitration clauses, so that repayment amounts,
or any default or restructuring details are kept outside of the public domain.
All of these features are highly unusual for official lending as extended by OECD governments and
Paris Club member countries during the post-WWII era. Around 70 percent of Paris Club claims on
low-income and emerging countries are in the form of Official Development Assistance as defined
by the OECD, i.e. are concessional in character and have a grant element of at least 25 percent. The
United States government, for example, typically extends funds for military and economic
cooperation in the form of grants rather than loans. The same is true for official creditors in Europe,
where the European Stability Mechanism, ESM, lent with maturities of up to 30 years and at almost
no risk premia (Corsetti et al. 2018).
In sum, China’s official lending overseas is not comparable to the lending activities by most other
creditor governments, in particular those organized in the OECD and Paris Club (see Kraay 2014 or
Horn et al. forthcoming).
To provide more details, Figure 10 shows a compact overview of the characteristics of China’s
overseas lending, based on all loans from our consensus database between 2000 and 2017, and
weighted by commitment amounts. More than half of total lending was extended at commercial
terms, compared to 15% at concessionary terms. These shares were rather stable over time, as
shown in Appendix I, which summarizes the lending terms in each year since 2000.
Two banks have dominated China’s overseas lending universe: the Chinese Export-Import Bank
and China Development Bank. Together, they account for more than 75% of all direct cross-border
lending between 2000 and 2017, while government entities such as the Ministry of Commerce play
only a subordinated role (see also Figure A5 in Appendix III showing the share of each creditor per
year).10 The two banks are both owned by and subordinated to the Chinese State council, as shown
in the overview chart in Appendix 2. Against this backdrop, it is evident that the Chinese
government could add transparency on much of its overseas lending activities by publishing
balance sheet and claims data from just these two banks.
Figure 10 also shows that most of China’s overseas loans are denominated in foreign currencies.
Around 85 percent of loans in our sample are contracted in US dollars, while Renminbi
10In recent years, China’s large state-owned, commercial banks such as the Bank of China and the Industrial and Commercial Bank of China have strongly increased their overseas loan portfolios. This increase is not captured in our data collection.

18
denominated loans play a minor role. Furthermore, we depict numbers by Bräutigam and Gallagher
(2014) who estimate that around 50 percent of Chinese overseas lending is collateralized by a
broad range of different commodities.
Figure 10. Characteristics of Chinese overseas loans
Note: This figure shows main characteristics of Chinese overseas loans as debt-weighted shares in our sample of Chinese loan commitments since 2000. The share of collateralized loans (*) is taken from estimates of Bräutigam and Gallagher (2014) based on Chinese loans to South America and Africa.
3. Hidden debts: how large is the underreporting problem?
The opaqueness of China’s lending abroad results in potentially severe underreporting of external
debt stocks (primarily public and publicly-guaranteed). This is especially true in the developing
world, which has received the bulk of China’s direct loans. Here, we quantify the degree of
“hidden” Chinese debt flows and stocks with a focus on more than 100 debtor countries. In a first
step, we benchmark our lower-bound debt stock estimates to World Bank data. Second, we
compare our estimates to claims by China extracted from the BIS banking statistics. In both cases
we find large discrepancies between the stock of debt gathered from our well-documented micro
sources on the one hand and the debtor- and creditor-reported aggregates of official statistics on the
other hand.
3.1. Estimating “hidden debts” part 1: country reporting to the World Bank (debtor side)
To assess the scope of underreporting of Chinese claims in IMF and World Bank statistics, we use
non-public data from the so-called Debtor Reporting System (DRS), to which developing debtor
19
countries around the world report on a regular basis. The World Bank publishes the aggregates
from the DRS in its International Debt Statistics, but bilateral (country to country) claims are not
publicly released. Here, we use an unpublished, bilateral data extract on Chinese loan commitments
by country and year (loans by China to public and publicly guaranteed entities). The DRS data is
used as an input to our calculations but not shown here, for reasons of confidentiality.
Based on this data, we can assess the size of missing commitments by China, i.e. the amounts of
Chinese loans that we know of but that do not appear in the most widely used external debt
statistics. For the comparison we clean and rearrange our own dataset of Chinese loans to match the
exact definition of the DRS data extract we have. Specifically, our subset of the DRS data
aggregates all loans extended by China to public and publicly guaranteed recipients, including the
central government. These claims do not include, however, loans by China’s state-owned but
commercial creditor banks, such as the Bank of China or ICBC, so that we purge these from our
consensus dataset. We also drop the (few) Chinese loans extended to private borrowers abroad.
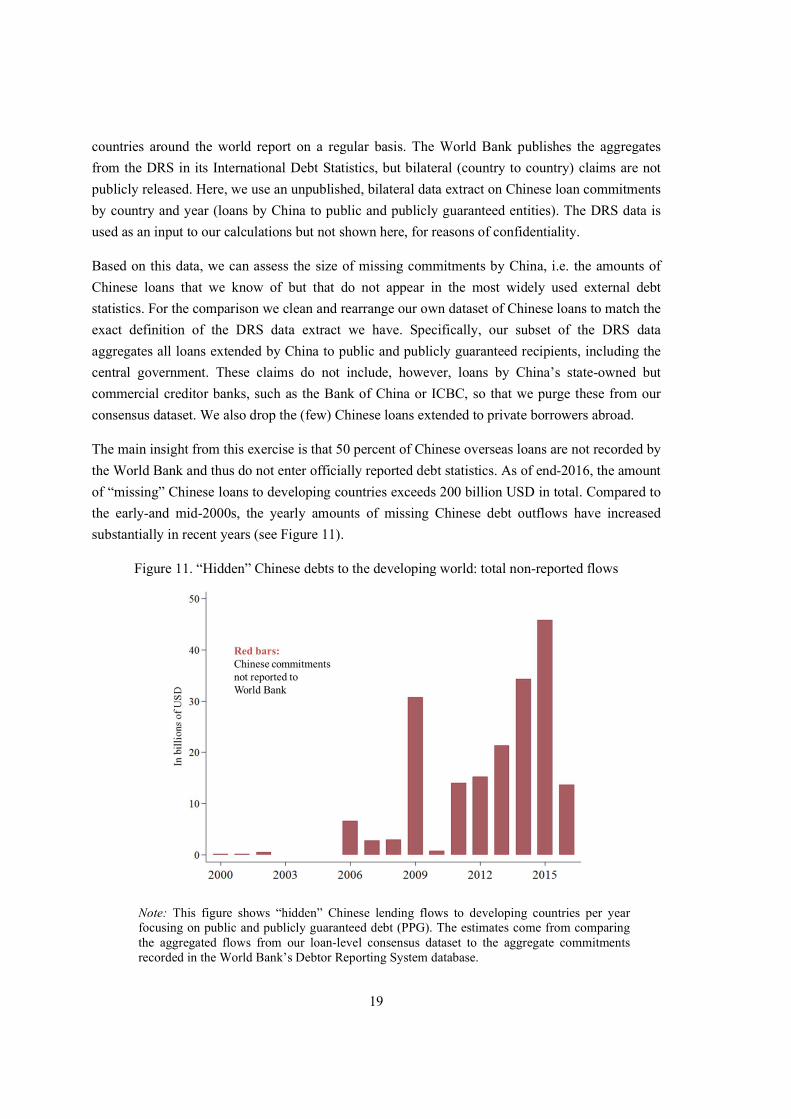
The main insight from this exercise is that 50 percent of Chinese overseas loans are not recorded by
the World Bank and thus do not enter officially reported debt statistics. As of end-2016, the amount
of “missing” Chinese loans to developing countries exceeds 200 billion USD in total. Compared to
the early-and mid-2000s, the yearly amounts of missing Chinese debt outflows have increased
substantially in recent years (see Figure 11).
Figure 11. “Hidden” Chinese debts to the developing world: total non-reported flows
Note: This figure shows “hidden” Chinese lending flows to developing countries per year focusing on public and publicly guaranteed debt (PPG). The estimates come from comparing the aggregated flows from our loan-level consensus dataset to the aggregate commitments recorded in the World Bank’s Debtor Reporting System database.
20
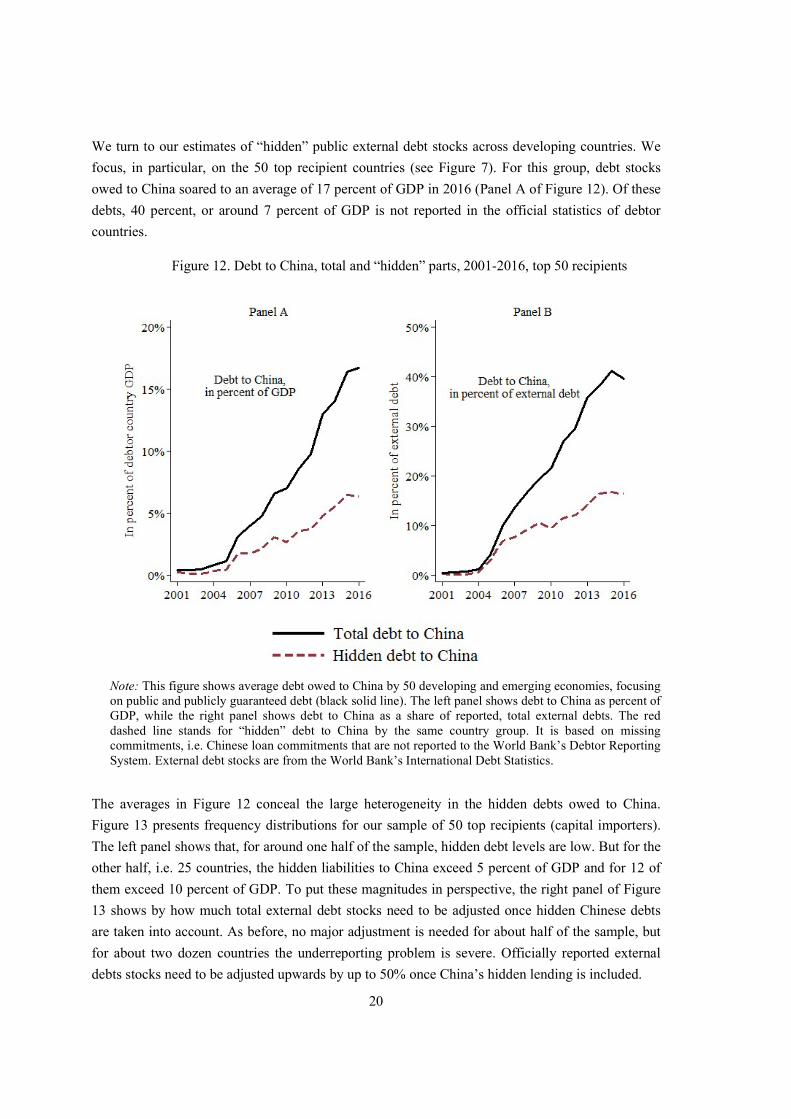
We turn to our estimates of “hidden” public external debt stocks across developing countries. We
focus, in particular, on the 50 top recipient countries (see Figure 7). For this group, debt stocks
owed to China soared to an average of 17 percent of GDP in 2016 (Panel A of Figure 12). Of these
debts, 40 percent, or around 7 percent of GDP is not reported in the official statistics of debtor
countries.
Figure 12. Debt to China, total and “hidden” parts, 2001-2016, top 50 recipients
Note: This figure shows average debt owed to China by 50 developing and emerging economies, focusing on public and publicly guaranteed debt (black solid line). The left panel shows debt to China as percent of GDP, while the right panel shows debt to China as a share of reported, total external debts. The red dashed line stands for “hidden” debt to China by the same country group. It is based on missing commitments, i.e. Chinese loan commitments that are not reported to the World Bank’s Debtor Reporting System. External debt stocks are from the World Bank’s International Debt Statistics.
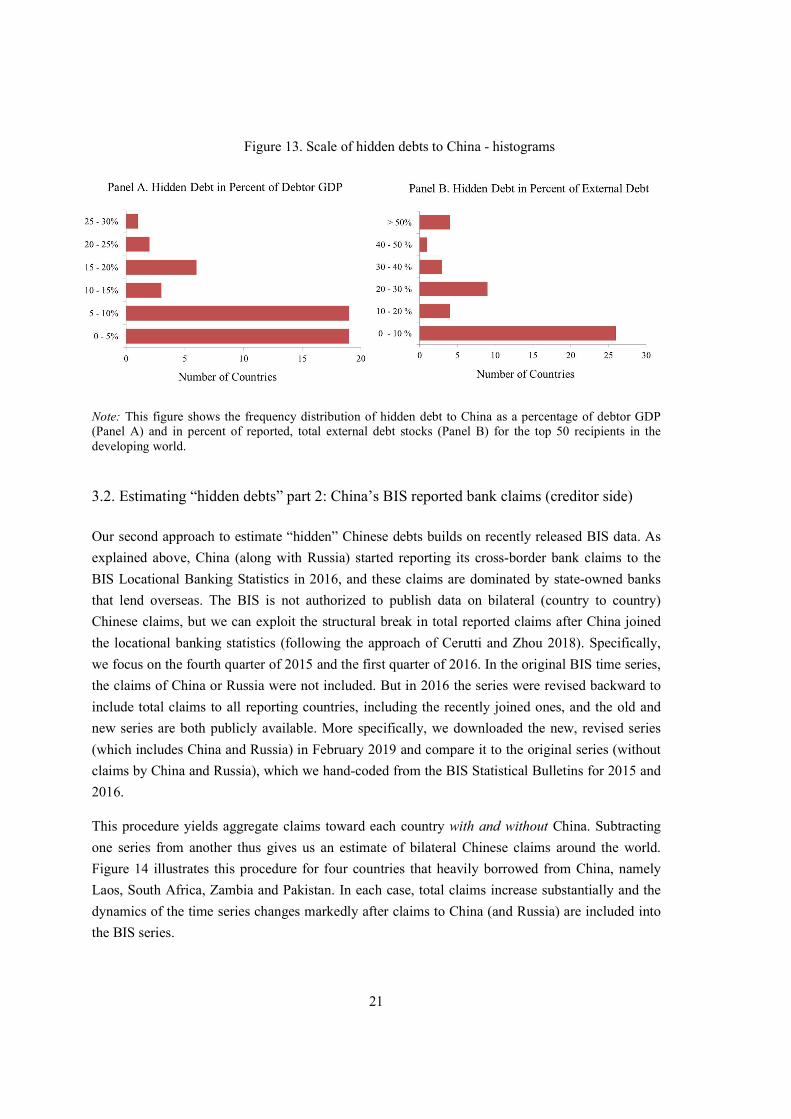
The averages in Figure 12 conceal the large heterogeneity in the hidden debts owed to China.
Figure 13 presents frequency distributions for our sample of 50 top recipients (capital importers).
The left panel shows that, for around one half of the sample, hidden debt levels are low. But for the
other half, i.e. 25 countries, the hidden liabilities to China exceed 5 percent of GDP and for 12 of
them exceed 10 percent of GDP. To put these magnitudes in perspective, the right panel of Figure
13 shows by how much total external debt stocks need to be adjusted once hidden Chinese debts
are taken into account. As before, no major adjustment is needed for about half of the sample, but
for about two dozen countries the underreporting problem is severe. Officially reported external
debts stocks need to be adjusted upwards by up to 50% once China’s hidden lending is included.
21
Figure 13. Scale of hidden debts to China - histograms
Note: This figure shows the frequency distribution of hidden debt to China as a percentage of debtor GDP (Panel A) and in percent of reported, total external debt stocks (Panel B) for the top 50 recipients in the developing world.
3.2. Estimating “hidden debts” part 2: China’s BIS reported bank claims (creditor side) Our second approach to estimate “hidden” Chinese debts builds on recently released BIS data. As
explained above, China (along with Russia) started reporting its cross-border bank claims to the
BIS Locational Banking Statistics in 2016, and these claims are dominated by state-owned banks
that lend overseas. The BIS is not authorized to publish data on bilateral (country to country)
Chinese claims, but we can exploit the structural break in total reported claims after China joined
the locational banking statistics (following the approach of Cerutti and Zhou 2018). Specifically,
we focus on the fourth quarter of 2015 and the first quarter of 2016. In the original BIS time series,
the claims of China or Russia were not included. But in 2016 the series were revised backward to
include total claims to all reporting countries, including the recently joined ones, and the old and
new series are both publicly available. More specifically, we downloaded the new, revised series
(which includes China and Russia) in February 2019 and compare it to the original series (without
claims by China and Russia), which we hand-coded from the BIS Statistical Bulletins for 2015 and
2016.
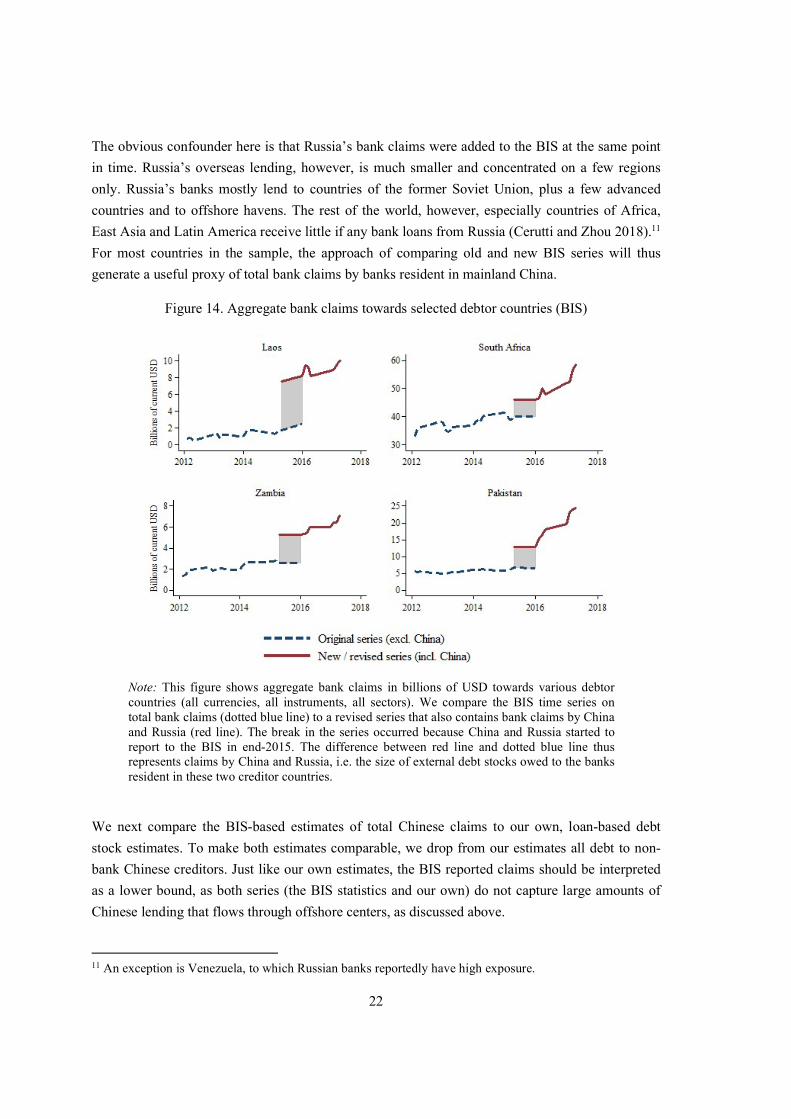
This procedure yields aggregate claims toward each country with and without China. Subtracting
one series from another thus gives us an estimate of bilateral Chinese claims around the world.
Figure 14 illustrates this procedure for four countries that heavily borrowed from China, namely
Laos, South Africa, Zambia and Pakistan. In each case, total claims increase substantially and the
dynamics of the time series changes markedly after claims to China (and Russia) are included into
the BIS series.
22
The obvious confounder here is that Russia’s bank claims were added to the BIS at the same point
in time. Russia’s overseas lending, however, is much smaller and concentrated on a few regions
only. Russia’s banks mostly lend to countries of the former Soviet Union, plus a few advanced
countries and to offshore havens. The rest of the world, however, especially countries of Africa,
East Asia and Latin America receive little if any bank loans from Russia (Cerutti and Zhou 2018).11
For most countries in the sample, the approach of comparing old and new BIS series will thus
generate a useful proxy of total bank claims by banks resident in mainland China.
Figure 14. Aggregate bank claims towards selected debtor countries (BIS)
Note: This figure shows aggregate bank claims in billions of USD towards various debtor countries (all currencies, all instruments, all sectors). We compare the BIS time series on total bank claims (dotted blue line) to a revised series that also contains bank claims by China and Russia (red line). The break in the series occurred because China and Russia started to report to the BIS in end-2015. The difference between red line and dotted blue line thus represents claims by China and Russia, i.e. the size of external debt stocks owed to the banks resident in these two creditor countries.
We next compare the BIS-based estimates of total Chinese claims to our own, loan-based debt
stock estimates. To make both estimates comparable, we drop from our estimates all debt to non-
bank Chinese creditors. Just like our own estimates, the BIS reported claims should be interpreted
as a lower bound, as both series (the BIS statistics and our own) do not capture large amounts of
Chinese lending that flows through offshore centers, as discussed above.
11 An exception is Venezuela, to which Russian banks reportedly have high exposure.
23
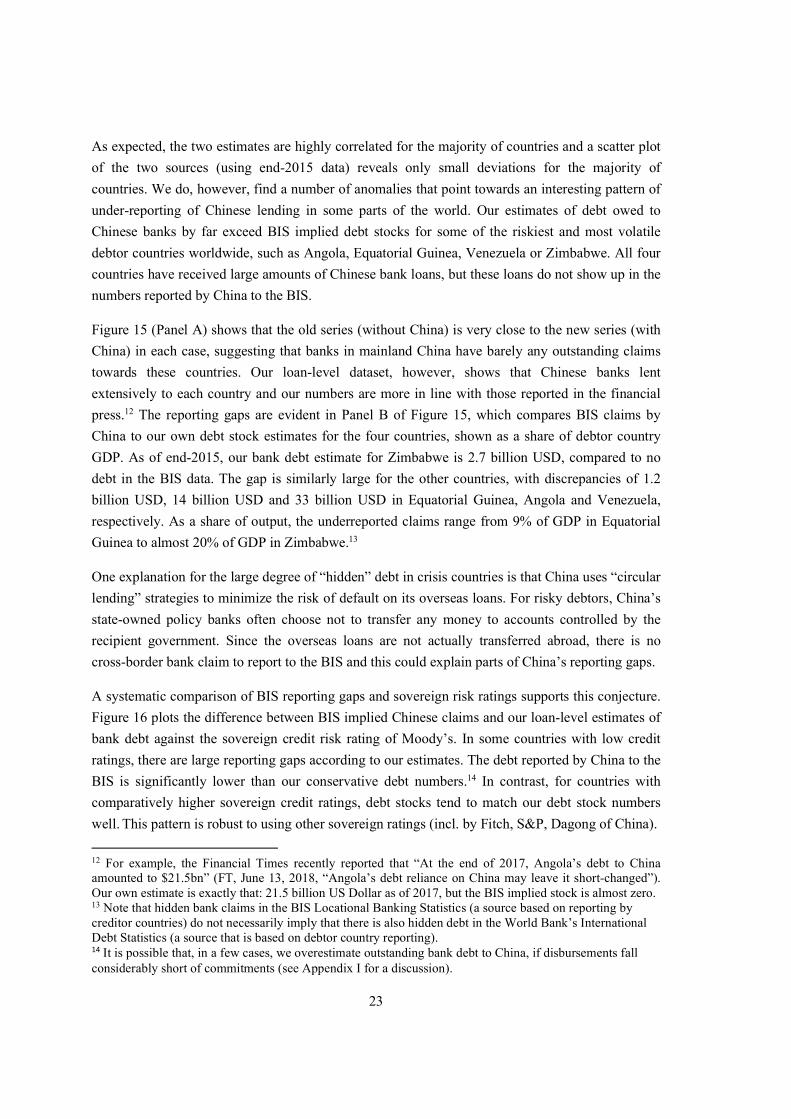
As expected, the two estimates are highly correlated for the majority of countries and a scatter plot
of the two sources (using end-2015 data) reveals only small deviations for the majority of
countries. We do, however, find a number of anomalies that point towards an interesting pattern of
under-reporting of Chinese lending in some parts of the world. Our estimates of debt owed to
Chinese banks by far exceed BIS implied debt stocks for some of the riskiest and most volatile
debtor countries worldwide, such as Angola, Equatorial Guinea, Venezuela or Zimbabwe. All four
countries have received large amounts of Chinese bank loans, but these loans do not show up in the
numbers reported by China to the BIS.
Figure 15 (Panel A) shows that the old series (without China) is very close to the new series (with
China) in each case, suggesting that banks in mainland China have barely any outstanding claims
towards these countries. Our loan-level dataset, however, shows that Chinese banks lent
extensively to each country and our numbers are more in line with those reported in the financial
press.12 The reporting gaps are evident in Panel B of Figure 15, which compares BIS claims by
China to our own debt stock estimates for the four countries, shown as a share of debtor country
GDP. As of end-2015, our bank debt estimate for Zimbabwe is 2.7 billion USD, compared to no
debt in the BIS data. The gap is similarly large for the other countries, with discrepancies of 1.2
billion USD, 14 billion USD and 33 billion USD in Equatorial Guinea, Angola and Venezuela,
respectively. As a share of output, the underreported claims range from 9% of GDP in Equatorial
Guinea to almost 20% of GDP in Zimbabwe.13
One explanation for the large degree of “hidden” debt in crisis countries is that China uses “circular
lending” strategies to minimize the risk of default on its overseas loans. For risky debtors, China’s
state-owned policy banks often choose not to transfer any money to accounts controlled by the
recipient government. Since the overseas loans are not actually transferred abroad, there is no
cross-border bank claim to report to the BIS and this could explain parts of China’s reporting gaps.
A systematic comparison of BIS reporting gaps and sovereign risk ratings supports this conjecture.
Figure 16 plots the difference between BIS implied Chinese claims and our loan-level estimates of
bank debt against the sovereign credit risk rating of Moody’s. In some countries with low credit
ratings, there are large reporting gaps according to our estimates. The debt reported by China to the
BIS is significantly lower than our conservative debt numbers.14 In contrast, for countries with
comparatively higher sovereign credit ratings, debt stocks tend to match our debt stock numbers
well. This pattern is robust to using other sovereign ratings (incl. by Fitch, S&P, Dagong of China).
12 For example, the Financial Times recently reported that “At the end of 2017, Angola’s debt to China amounted to $21.5bn” (FT, June 13, 2018, “Angola’s debt reliance on China may leave it short-changed”). Our own estimate is exactly that: 21.5 billion US Dollar as of 2017, but the BIS implied stock is almost zero. 13 Note that hidden bank claims in the BIS Locational Banking Statistics (a source based on reporting by creditor countries) do not necessarily imply that there is also hidden debt in the World Bank’s International Debt Statistics (a source that is based on debtor country reporting). 14 It is possible that, in a few cases, we overestimate outstanding bank debt to China, if disbursements fall considerably short of commitments (see Appendix I for a discussion).
24
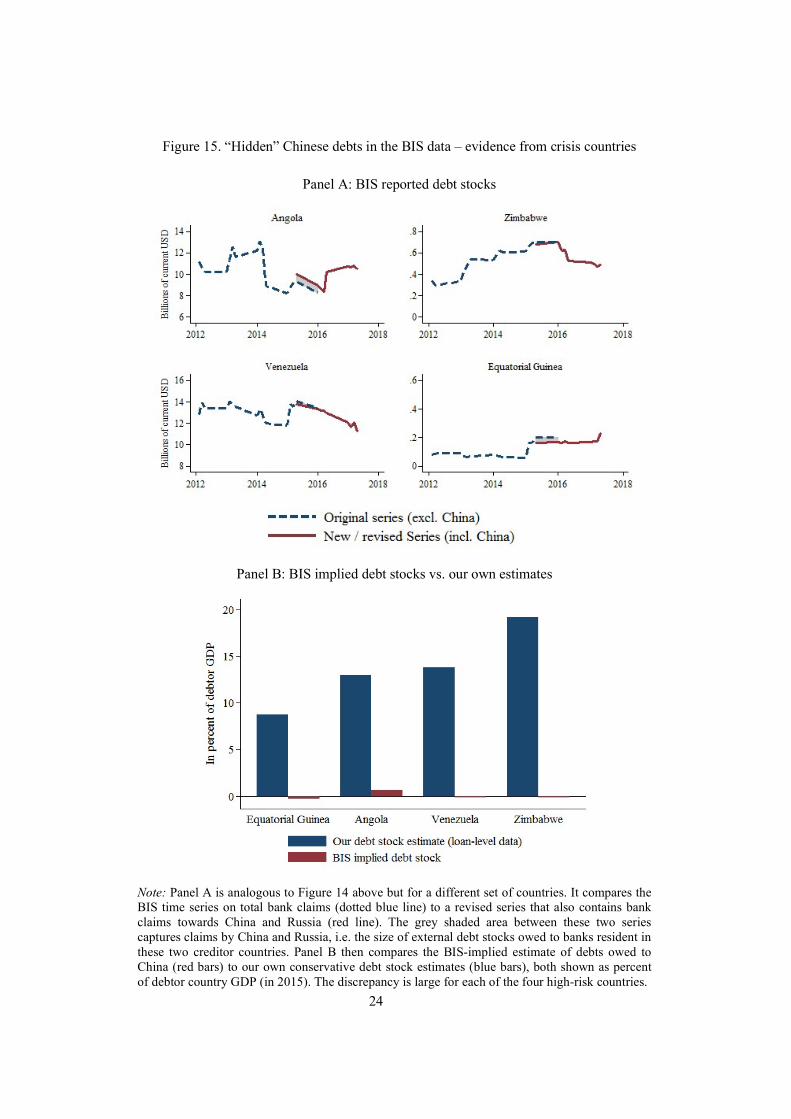
Figure 15. “Hidden” Chinese debts in the BIS data – evidence from crisis countries
Panel A: BIS reported debt stocks
Panel B: BIS implied debt stocks vs. our own estimates
Note: Panel A is analogous to Figure 14 above but for a different set of countries. It compares the BIS time series on total bank claims (dotted blue line) to a revised series that also contains bank claims towards China and Russia (red line). The grey shaded area between these two series captures claims by China and Russia, i.e. the size of external debt stocks owed to banks resident in these two creditor countries. Panel B then compares the BIS-implied estimate of debts owed to China (red bars) to our own conservative debt stock estimates (blue bars), both shown as percent of debtor country GDP (in 2015). The discrepancy is large for each of the four high-risk countries.

25
Figure 16. BIS underreporting and country risk 2015
Note: This figure shows a scatter plot of BIS underreporting in percent of debtor GDP and sovereign credit risk ratings by Moody’s. BIS underreporting is measured as the difference between our conservative loan-level based estimate of bank debt to China and BIS implied debt stocks to banks resident in mainland China. All values are from 2015. The red line shows fitted values of a linear regression. Sovereign ratings from the Moody’s webpage.
4. Looking ahead: a debt crisis with Chinese characteristics?
In this section, we focus on the implications of China’s overseas lending boom for financial
stability and debt sustainability in recipient countries. First, we re-examine the debt dynamics and
the debt servicing burden of developing countries after taking into account the large amounts of
“hidden” Chinese debts. In a second step, we compare the ongoing Chinese lending boom with
historical experiences. In particular, we draw parallels to the 1970s syndicated loan boom, in which
Western banks (led by the US) channeled large amounts of foreign capital to poor, resource rich
countries of Africa, Asia and Latin America. That boom ended in a wave of financial crises and
economic depressions in the early 1980s that was followed by a string of sovereign defaults, most
of which were resolved only a decade later.
4.1. Reassessing external debt dynamics in the developing world
The hidden Chinese lending calls for a reassessment of external debt trends in the developing
world. To do so, we start with the reported debt/GDP series by the World Bank and then add the
“hidden” liabilities to China using our conservative estimates. Figure 17 shows the evolution of
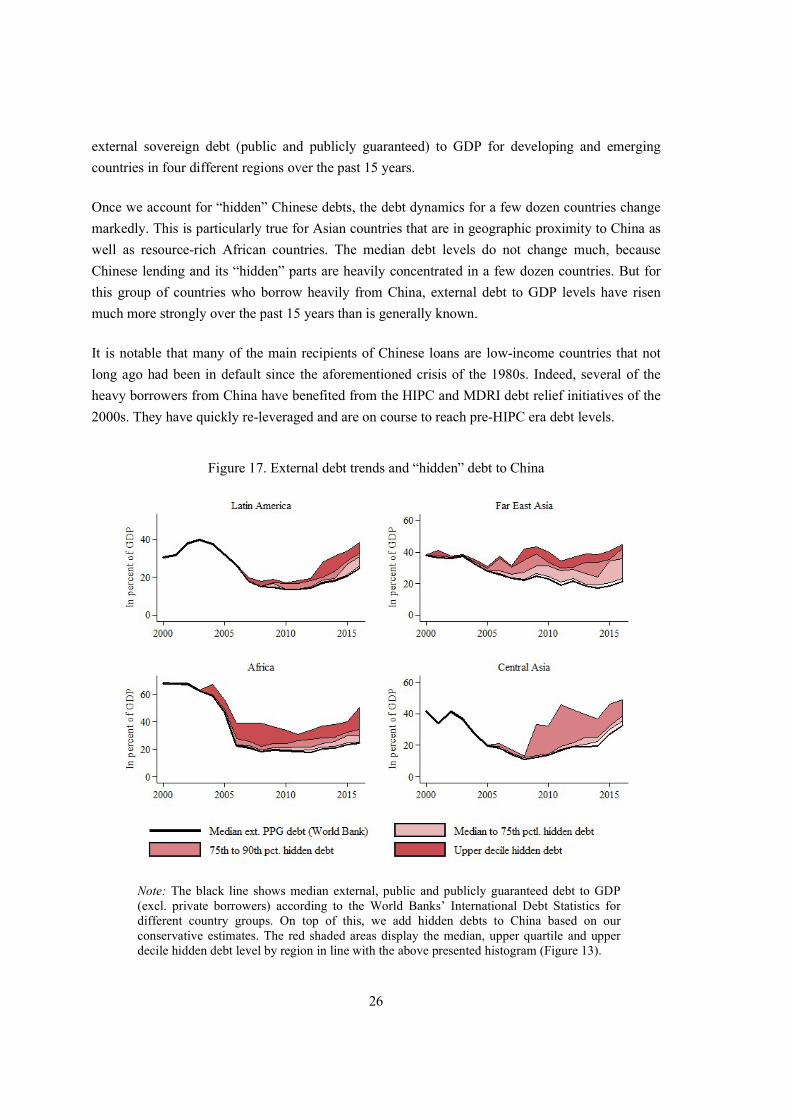
26
external sovereign debt (public and publicly guaranteed) to GDP for developing and emerging
countries in four different regions over the past 15 years.
Once we account for “hidden” Chinese debts, the debt dynamics for a few dozen countries change
markedly. This is particularly true for Asian countries that are in geographic proximity to China as
well as resource-rich African countries. The median debt levels do not change much, because
Chinese lending and its “hidden” parts are heavily concentrated in a few dozen countries. But for
this group of countries who borrow heavily from China, external debt to GDP levels have risen
much more strongly over the past 15 years than is generally known.
It is notable that many of the main recipients of Chinese loans are low-income countries that not
long ago had been in default since the aforementioned crisis of the 1980s. Indeed, several of the
heavy borrowers from China have benefited from the HIPC and MDRI debt relief initiatives of the
2000s. They have quickly re-leveraged and are on course to reach pre-HIPC era debt levels.
Figure 17. External debt trends and “hidden” debt to China
Note: The black line shows median external, public and publicly guaranteed debt to GDP (excl. private borrowers) according to the World Banks’ International Debt Statistics for different country groups. On top of this, we add hidden debts to China based on our conservative estimates. The red shaded areas display the median, upper quartile and upper decile hidden debt level by region in line with the above presented histogram (Figure 13).

27
Turning to “hidden” debt service payments, the picture changes even more dramatically. Figure 18
shows the evolution of debt servicing costs to GDP as reported by the World Bank (black line) and
adds the hidden debt service to China. The numbers capture both interest rate and amortization
payments on the country’s total external debt per year (by the public and private sectors, not just by
the sovereign). For China, we use the debt stock and debt servicing estimates constructed from
loan-level data (see Section 2.2) to derive both total and hidden interest and amortization flows. It
is evident that the rebound in external debt levels in Figure 17 above has been accompanied by a
more than proportional increase in debt service payment in Figure 18.
Figure 18. “Hidden” debt service payments to China
Notes: The black line shows median external, public and private, debt service payments to GDP according to the World Banks’ International Debt Statistics for different country groups (interest payments plus principal). On top of this, we add median, upper quartile and upper decile, hidden debt service payments to China (red shaded areas). Estimates of hidden debt service are based on loan-level and creditor-level data (see Appendix I).
The main explanation for the over-proportional increase in debt servicing costs is that China tends
to lend at market terms, with interest rates that are significantly higher than those paid to the other
main creditors, in particular compared to the low, concessionary rates on World Bank loans or on
bilateral loans by OECD governments. In addition, the maturity and grace periods of Chinese loans
tend to be shorter than those on the remainder of the debt, which increases annual debt service
amounts (see Section 2.4).
28
In sum, despite benign global conditions and record-low US and other advanced economy interest
rates, debt service payments by low-income and emerging market countries have been on the rise,
as debt stocks climbed. A subgroup of low-income countries is close to reaching the pre-HIPC
levels, with Chinese lending being one of the main drivers.
4.2. A historical analogue: the developing country lending boom of the 1970s
China’s overseas lending boom shares many characteristics with earlier lending booms to periphery
countries. The parallels are particularly striking with regard to the 1970s sovereign bank debt
lending boom (see Cline 1995 and Rieffel 2003 for a review of this episode). The main borrowers
at the time were developing and resource-rich countries, many of which had not been able to access
international capital markets for decades. From the early 1970s on, however, these countries
quickly started to receive large debt inflows in the form of bank loans, typically from a syndicate of
10 or more Western Banks from the US, Europe and Japan. The lending recipients were the central
government or public companies and the loan’s purpose was often to improve the country’s
infrastructure, its resource extracting industries, or to finance other potentially growth-enhancing
projects. The bulk of the lending was in US Dollars, maturities were rather short, typically between
three and seven years, and interest rates implied risk premia, mostly between 1-2% above LIBOR
or more. Moreover, much of the lending was not picked up by official statistics so debtor countries
and the IMF and the World Bank also had an incomplete picture on the resulting debt flows and
debt sustainability risks at that time.15
It is stunning that almost all of these characteristics apply to the ongoing Chinese overseas lending
boom as well. Many of the recipients are the very same countries, lending is again bank-based
rather than bond-based, the loans are issued in USD at market terms, and a lack of data and
oversight is a major problem. The two lending booms can largely be seen as “twins”.
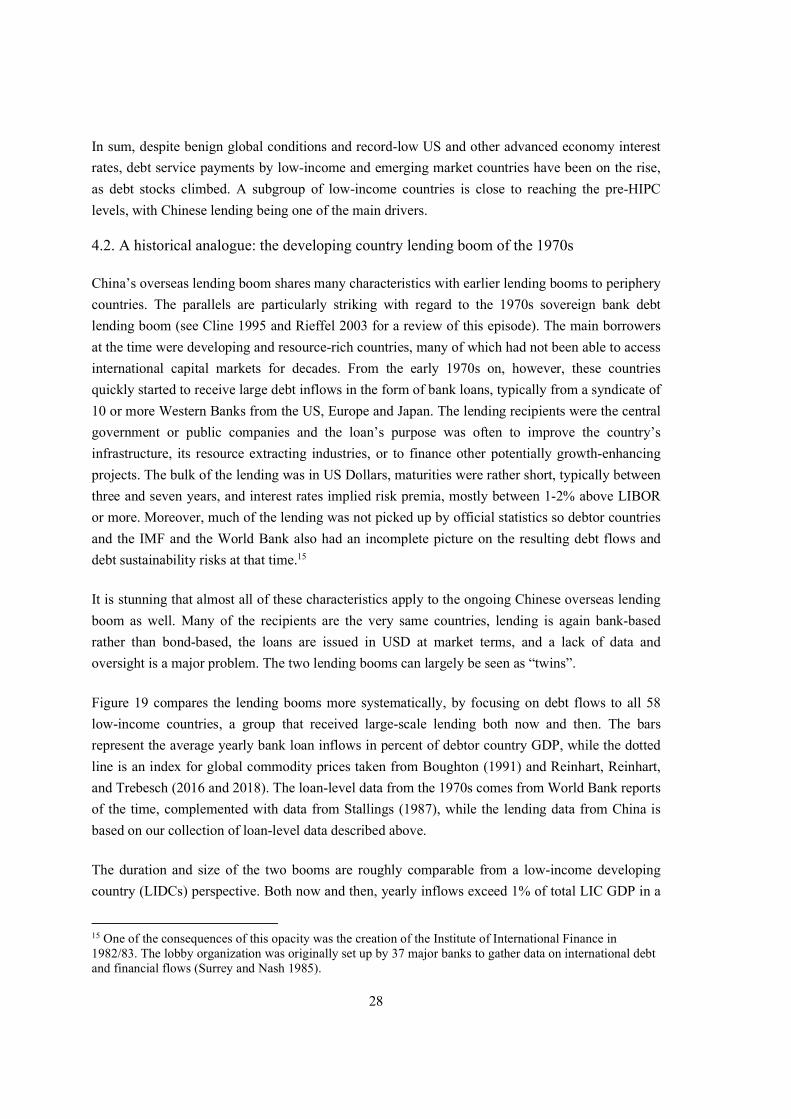
Figure 19 compares the lending booms more systematically, by focusing on debt flows to all 58
low-income countries, a group that received large-scale lending both now and then. The bars
represent the average yearly bank loan inflows in percent of debtor country GDP, while the dotted
line is an index for global commodity prices taken from Boughton (1991) and Reinhart, Reinhart,
and Trebesch (2016 and 2018). The loan-level data from the 1970s comes from World Bank reports
of the time, complemented with data from Stallings (1987), while the lending data from China is
based on our collection of loan-level data described above.
The duration and size of the two booms are roughly comparable from a low-income developing
country (LIDCs) perspective. Both now and then, yearly inflows exceed 1% of total LIC GDP in a
15 One of the consequences of this opacity was the creation of the Institute of International Finance in 1982/83. The lobby organization was originally set up by 37 major banks to gather data on international debt and financial flows (Surrey and Nash 1985).
29
spell of about 10 years. Moreover, both booms were accompanied by a large boom-bust cycle in
commodity prices. The more recent commodity-price boom was even more pronounced than the
one of the 1970s (see Reinhart et al. 2018). After 1982, after US interest rates had spiked and with
commodity prices decreasing further, bank lending to the developing world quickly dried up.
Mexico’s debt default in August 1982 was only the most visible sign of distress. Today, it is
difficult to say whether the Chinese overseas lending boom is slowing or has ended. Total lending
amounts have decreased in 2016 and 2017, but lending to LICs remains relatively high. Whether or
not lending will continue on the same scale or even increase further, will depend, for example, on
China’s GDP growth as well as on the dynamics of US interest rates.
Figure 19. A tale of two international bank lending booms: 1970s (blue) vs 2010s (red)
Note: The bars show average yearly loan commitments by Western commercial banks (Panel A, blue bars, 1970s) and by Chinese official creditors (Panel B, red bars, post-2000), both in percent of debtor country GDP and both focusing on 58 low income developing countries. The dashed black line is a commodity price index with base year 1970 (left panel) and base year 2000 (right panel) using data from Boughton (1991) until 1979 and from the IMF Index of Primary Commodity Prices thereafter. Data on Chinese lending post-2000 is from our database, the data on syndicated bank lending in the 1970s is from Stallings (1987) and World Bank (several years).
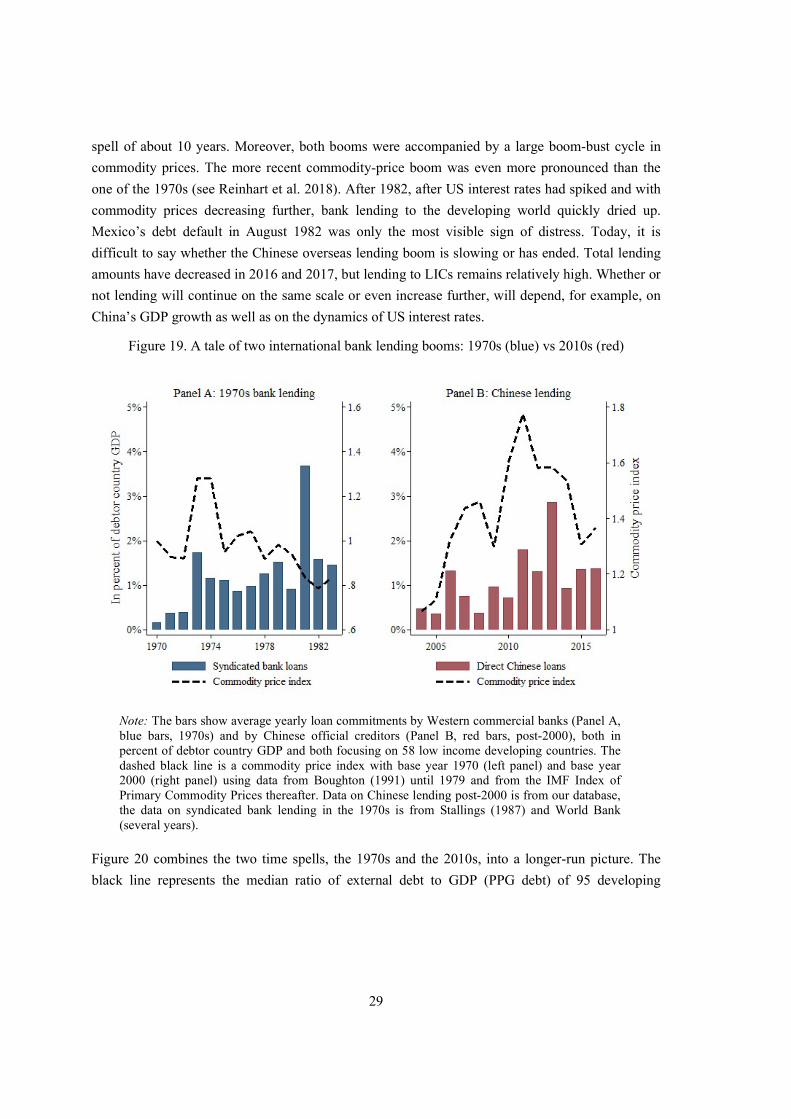
Figure 20 combines the two time spells, the 1970s and the 2010s, into a longer-run picture. The
black line represents the median ratio of external debt to GDP (PPG debt) of 95 developing
30
countries across five decades.16 On top, we again add our estimate of hidden debt to China and
illustrate the changing debt dynamics.
The main take away from Figure 20 is that today’s debt levels in the developing world look
dangerously close to their level in 1981, just before the so called “Third World Debt Crisis” broke
out. This is particularly true once we add “hidden” Chinese debts. The countries most exposed
towards China saw their debt burdens grow particularly fast, to levels comparable to the early
1980s. These insights only strengthen the debt sustainability concerns raised by the IMF.17
Figure 20. Long-run debt and commodity price trends in developing and emerging countries
Notes: The black line shows median external, public and private, debt to GDP according to the World Banks’ International Debt Statistics for 95 developing and emerging countries. On top of this, we add the median, upper quartile and upper decile hidden debt level in line with the above presented histogram (Figure 13). Data on commodity prices is from Boughton (1991) until 1979 and from the IMF Index of Primary Commodity Prices thereafter.
4.3. “Missing defaults” on Chinese overseas loans
In their 200-year history of capital flows, Reinhart, Reinhart, and Trebesch (2016 and 2018)
document that the global economy has been subject to a double bust since 2012, with a collapse in
commodity prices and stark decline in capital inflows (and in some cases, outflows). Yet, unlike
16 We include all countries in our sample that are in the IDS database, i.e. that report to the World Bank. 17 See Speech by Lagarde “Managing Debt Vulnerabilities in Low-Income Countries”, September 13, 2018.
31
prior episodes of similar adverse shocks over the long horizon they study, the worldwide incidence
of sovereign defaults has risen only modestly. According to the predictions of their model, there
should have been an additional 15 to 20 defaults. These are what they dub the “missing defaults.”
Fully explaining the missing default puzzle is beyond the scope of this paper, but part of the answer
lies in the fact that the international credit rating agencies do not record credit events involving
official creditors. The increasing number of defaults and debt restructurings on Chinese loans is a
part of the missing default puzzle in recent years. As is the case for the lending data, there is no
publicly available dataset of defaults and restructuring operations on Chinese loans. It is, however,
possible to generate an (incomplete) picture using the information on defaults and debt
restructurings from AidData, Hurley et al. (2018) and from a recent report by Kratz et al. (2019).
We can then compare the number of restructurings of Chinese overseas loans to restructurings with
other foreign creditors, in particular commercial loans and bonds. For the latter we use data on
external sovereign debt restructurings with private creditors (banks and bondholders) from Cruces
and Trebesch (2012) and Meyer et al. (2019).
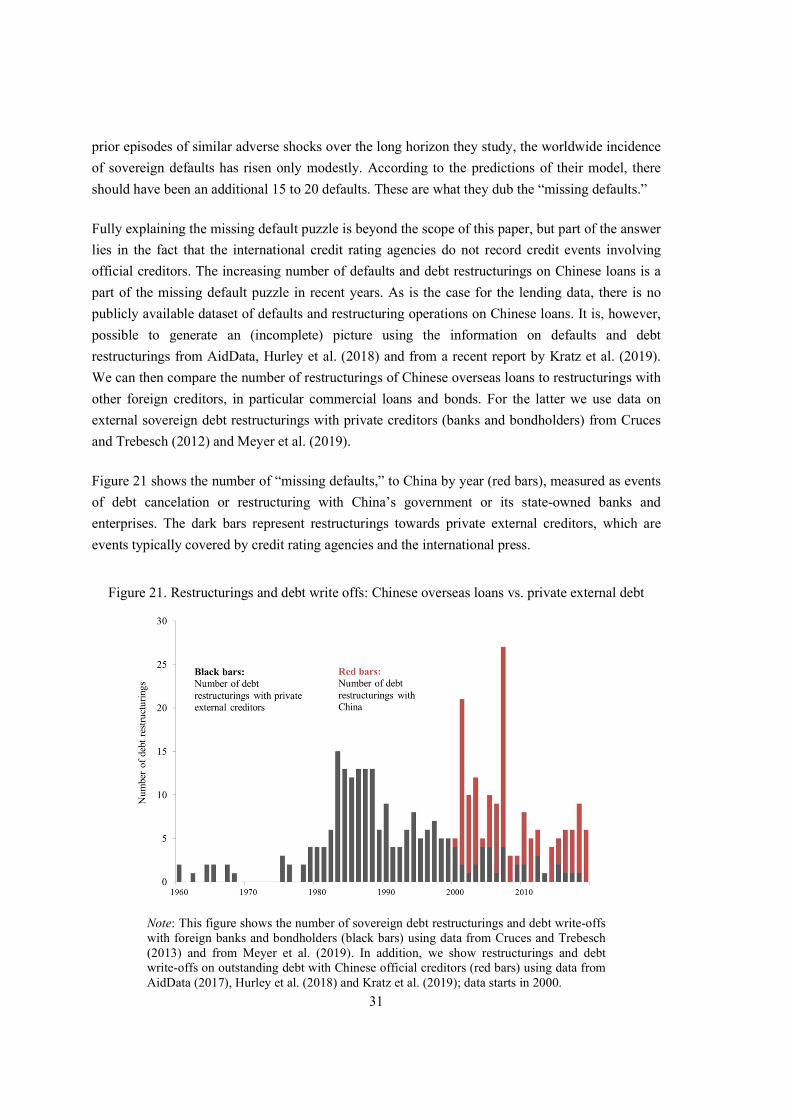
Figure 21 shows the number of “missing defaults,” to China by year (red bars), measured as events
of debt cancelation or restructuring with China’s government or its state-owned banks and
enterprises. The dark bars represent restructurings towards private external creditors, which are
events typically covered by credit rating agencies and the international press.
Figure 21. Restructurings and debt write offs: Chinese overseas loans vs. private external debt
Note: This figure shows the number of sovereign debt restructurings and debt write-offs with foreign banks and bondholders (black bars) using data from Cruces and Trebesch (2013) and from Meyer et al. (2019). In addition, we show restructurings and debt write-offs on outstanding debt with Chinese official creditors (red bars) using data from AidData (2017), Hurley et al. (2018) and Kratz et al. (2019); data starts in 2000.
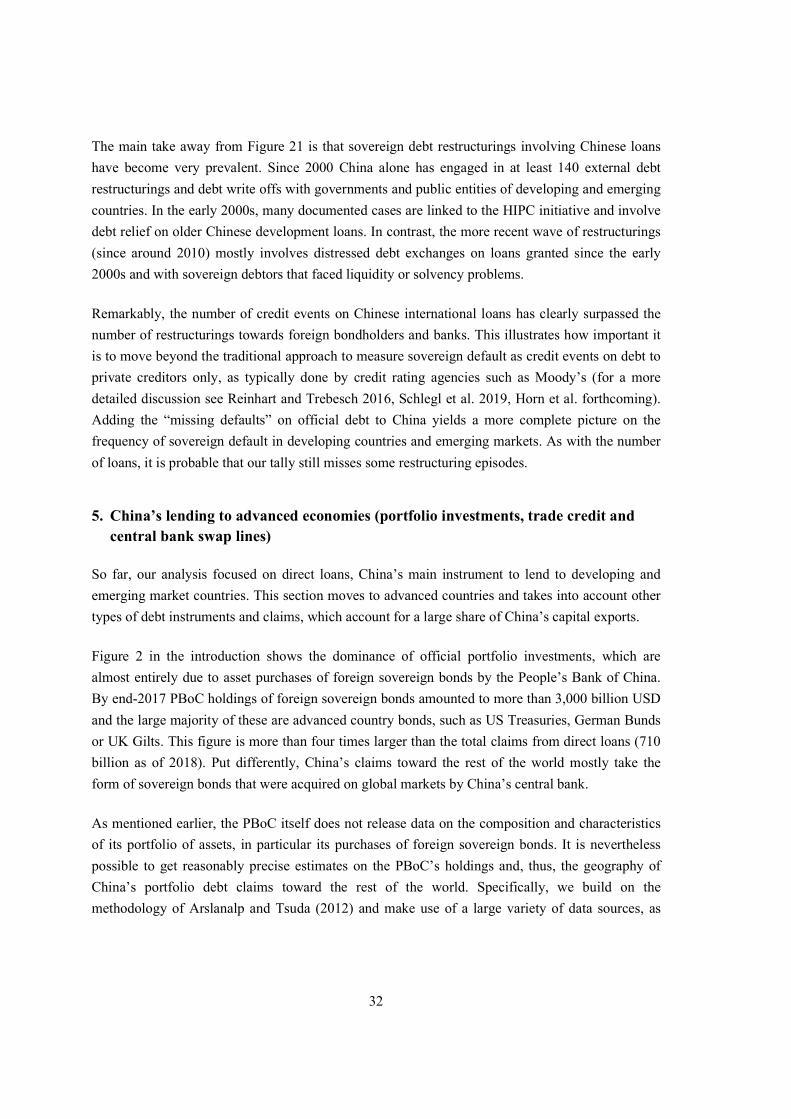
32
The main take away from Figure 21 is that sovereign debt restructurings involving Chinese loans
have become very prevalent. Since 2000 China alone has engaged in at least 140 external debt
restructurings and debt write offs with governments and public entities of developing and emerging
countries. In the early 2000s, many documented cases are linked to the HIPC initiative and involve
debt relief on older Chinese development loans. In contrast, the more recent wave of restructurings
(since around 2010) mostly involves distressed debt exchanges on loans granted since the early
2000s and with sovereign debtors that faced liquidity or solvency problems.
Remarkably, the number of credit events on Chinese international loans has clearly surpassed the
number of restructurings towards foreign bondholders and banks. This illustrates how important it
is to move beyond the traditional approach to measure sovereign default as credit events on debt to
private creditors only, as typically done by credit rating agencies such as Moody’s (for a more
detailed discussion see Reinhart and Trebesch 2016, Schlegl et al. 2019, Horn et al. forthcoming).
Adding the “missing defaults” on official debt to China yields a more complete picture on the
frequency of sovereign default in developing countries and emerging markets. As with the number
of loans, it is probable that our tally still misses some restructuring episodes.
5. China’s lending to advanced economies (portfolio investments, trade credit and central bank swap lines)
So far, our analysis focused on direct loans, China’s main instrument to lend to developing and
emerging market countries. This section moves to advanced countries and takes into account other
types of debt instruments and claims, which account for a large share of China’s capital exports.
Figure 2 in the introduction shows the dominance of official portfolio investments, which are
almost entirely due to asset purchases of foreign sovereign bonds by the People’s Bank of China.
By end-2017 PBoC holdings of foreign sovereign bonds amounted to more than 3,000 billion USD
and the large majority of these are advanced country bonds, such as US Treasuries, German Bunds
or UK Gilts. This figure is more than four times larger than the total claims from direct loans (710
billion as of 2018). Put differently, China’s claims toward the rest of the world mostly take the
form of sovereign bonds that were acquired on global markets by China’s central bank.
As mentioned earlier, the PBoC itself does not release data on the composition and characteristics
of its portfolio of assets, in particular its purchases of foreign sovereign bonds. It is nevertheless
possible to get reasonably precise estimates on the PBoC’s holdings and, thus, the geography of
China’s portfolio debt claims toward the rest of the world. Specifically, we build on the
methodology of Arslanalp and Tsuda (2012) and make use of a large variety of data sources, as
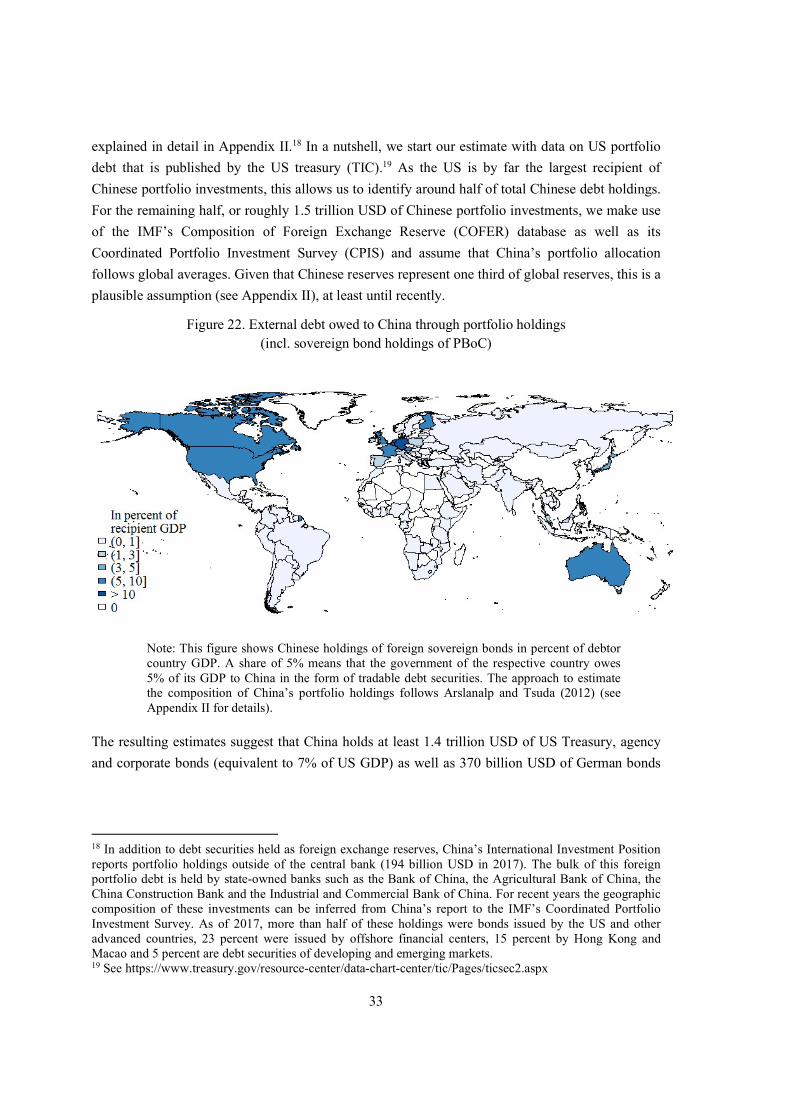
33
explained in detail in Appendix II.18 In a nutshell, we start our estimate with data on US portfolio
debt that is published by the US treasury (TIC).19 As the US is by far the largest recipient of
Chinese portfolio investments, this allows us to identify around half of total Chinese debt holdings.
For the remaining half, or roughly 1.5 trillion USD of Chinese portfolio investments, we make use
of the IMF’s Composition of Foreign Exchange Reserve (COFER) database as well as its
Coordinated Portfolio Investment Survey (CPIS) and assume that China’s portfolio allocation
follows global averages. Given that Chinese reserves represent one third of global reserves, this is a
plausible assumption (see Appendix II), at least until recently.
Figure 22. External debt owed to China through portfolio holdings (incl. sovereign bond holdings of PBoC)
Note: This figure shows Chinese holdings of foreign sovereign bonds in percent of debtor country GDP. A share of 5% means that the government of the respective country owes 5% of its GDP to China in the form of tradable debt securities. The approach to estimate the composition of China’s portfolio holdings follows Arslanalp and Tsuda (2012) (see Appendix II for details).
The resulting estimates suggest that China holds at least 1.4 trillion USD of US Treasury, agency
and corporate bonds (equivalent to 7% of US GDP) as well as 370 billion USD of German bonds
18 In addition to debt securities held as foreign exchange reserves, China’s International Investment Position reports portfolio holdings outside of the central bank (194 billion USD in 2017). The bulk of this foreign portfolio debt is held by state-owned banks such as the Bank of China, the Agricultural Bank of China, the China Construction Bank and the Industrial and Commercial Bank of China. For recent years the geographic composition of these investments can be inferred from China’s report to the IMF’s Coordinated Portfolio Investment Survey. As of 2017, more than half of these holdings were bonds issued by the US and other advanced countries, 23 percent were issued by offshore financial centers, 15 percent by Hong Kong and Macao and 5 percent are debt securities of developing and emerging markets. 19 See https://www.treasury.gov/resource-center/data-chart-center/tic/Pages/ticsec2.aspx
34
(10% of German GDP) and 190 billion USD of UK bonds (7% of UK GDP).20 For the Eurozone as
a whole, China holds 850 billion USD of bonds, an amount equivalent to seven percent of
Eurozone GDP. The large majority of these bonds are likely to be sovereign bonds. When
calculated as a share of total outstanding sovereign bonds, China is estimated to hold around six
percent of all US Treasury bonds, 17 percent of all German government bonds, and around six
percent of all UK sovereign bonds. Furthermore, China holds approximately 30 billion USD of
bonds issued by emerging markets, in particular by Brazil, Indonesia, Malaysia, Mexico, Poland
and South Africa. This amount is a small share of China’s total reserves, but it is substantial from
the perspective of these debtor countries.
Another important category of China’s lending are short-term trade credits. China’s trade credits
are extended by a large variety of state-owned and private corporations, mostly in the form of
advances to foreign importers of Chinese goods. A substantial share of these loans is insured by
China’s state-owned export credit agencies, in particular Sinosure. As a result, much of the trade
credits are official debts, with the final claimant being the Chinese government. Specifically,
Sinosure provides short-term coverage for more than 17 percent of total Chinese exports, in total
insuring 412 billion USD of credits during 2017. In comparison, short-term export credits insured
by the German government (via Euler-Hermes) or the US government (via the US Export-Import
Bank) amount to less than 5% of what China insures per year. The Chinese state is thus a major
player in the global market for trade credits, with large amounts lent to advanced economies.
Furthermore, advanced countries often receive Chinese credits that are coupled with FDI
investments, as discussed above. In total, Chinese FDI debt claims abroad amounted to 250 billion
USD at the end of 2017, which corresponds to 15 percent of total Chinese outward FDI. The
geographic distribution of these FDI debt claims is not reported by China, but most recipient
countries do publish the debt-equity composition of their inward FDI stocks by counterparty in the
context of the IMF’s Coordinated Direct Investment Survey. This way we can identify Chinese FDI
debt claims vis-à-vis 102 recipient countries and use an approximation approach for the remainder
of countries.21
Arguably, the least-known instrument of China’s foreign lending are the large-scale swap lines
arranged between the People’s Bank of China and foreign central banks. Swap lines are standing
lines of credit between central banks and thus another form of official finance. Of course, this does
not alter cross border flows unless the line is activated. After the global financial crisis of 2008, the
PBoC has strongly extended its swap line network, first with advanced country central banks and
20 US TIC data on non-resident holdings of US securities is collected on a custodial basis. Our estimate therefore does not incorporate Chinese holdings of US securities outside China. Setser (2018), for example, suggests that China holds 60 billion USD in treasuries through a Belgian custodian. 21 Specifically, for countries not reporting on their Chinese inward FDI to the IMF, we assume that FDI debt is 15 percent of the total Chinese inward FDI stock, in line with global averages.
35
then moving on to selected emerging and developing countries. In total, as of 2018, China has
signed swap agreements with more than 40 foreign central banks and for drawing rights amounting
to 550 billion USD in total. In terms of geographical reach, this is by far the largest swap network
of any central bank worldwide (Horn et al. 2019).
Figure 23. Countries with access to standing credit line at China’s central bank
(swap line network of the PBoC)
Note: This figure shows outstanding swap line agreements between China’s central bank (PBoC) and foreign central banks. Dark shaded countries have a standing credit line agreement with the PBoC as of 2017. In total, China has agreements with more than 40 foreign central banks for drawing rights of 550 billion USD. The figure also considers the multilateral swap agreements within the so called Chiang Mai initiative and within the Contingent Reserve Arrangement of BRICS countries.
The PBoC does not publish detailed data on the usage of its swap lines, but we do know the
countries and years of the agreements. Figure 23 uses this information to give a geographic
overview of China’s swap line network as of 2018. In addition, we can infer outstanding claims of
swap lines by inspecting recipient central banks’ balance sheets. This exercise suggests that since
2013 Pakistan, Argentina, Mongolia and Russia have made use of their standing lines with the
PBOC to curb market pressures and to bolster foreign exchange reserves The most recent data
suggest that China currently has outstanding claims towards one country only: Argentina, which
had initially drawn around 10.5 billion USD from China’s central bank. After an agreement to
expand the swap facility to $18.7 US billion in late 2018, Argentina’s central bank debt to China
has likely increased further.
36
6. The big picture: China’s tailored approach to overseas lending and investment
This section combines the results on Chinese overseas lending we presented so far into a bigger
picture. We also explore another type of capital exports: equity investments, in particular China’s
outbound FDI flows and Chinese portfolio holdings of foreign equity instruments. Regarding FDI
outflows, the official statistics published by the Ministry of Commerce do not adequately capture
China’s large FDI flows through offshore financial centers, in particular via Hong Kong. We
therefore draw on the most complete data collection on this topic, namely the “Chinese investment
dataset” by the American Enterprise Institute and Heritage Foundation (see Appendix II for
details). On top of this, we add China’s portfolio holdings of equity instruments. Specifically, we
infer the geographic distribution of portfolio equity holdings from the IMF’s Coordinated Portfolio
Investment Survey. Figure 24 is the resulting world map, which shows that Chinese equity
investments are directed both to developing and advanced economies. Among the main recipients
of Chinese outbound FDI are the crisis countries of periphery Europe (e.g. Italy, Greece),
Scandinavia, Germany, the UK, as well as a variety of African, Asian and Latin American
countries. For the developing world, there is a high correlation in the direction of FDI flows on the
one hand and direct lending flows on the other. These two types of flows mostly tend to be directed
to the same set of countries.
To get a broader perspective of Chinese capital exports worldwide, we now combine the equity
flow data presented above with the data on direct lending, the data on portfolio debt holdings (bond
purchases), as well as lending via trade credits that we covered in previous sections, both in
advanced as in emerging economies. Figure 25 shows the resulting world map of total Chinese debt
and equity claims in percent of recipient country GDP in 2017. It is clear that China’s capital
exports span the entire globe and that the concentration of claims is particular large in a few dozen
countries, including rich and poor countries alike.
The combined data illustrate how China’s capital exports differ across country groups. Figure 26
shows that the outstanding Chinese claims towards advanced economies are dominated by
sovereign bond holdings and equity investments. In contrast, direct lending is the main investment
vehicle towards emerging and low-income countries, followed by FDI and trade credits.
37
Figure 24. China’s overseas equity investments, 2017
Note: This figure shows the geographic allocation of Chinese equity investments, consisting of foreign direct investment and Chinese portfolio holdings of equity instruments issued by non-residents. Data on FDI stocks is from the American Enterprise Institute, data on portfolio equity investments is from the IMF’s Coordinated Portfolio Investment Survey (CIPS).
Figure 25. Total Chinese claims (total debt plus equity)
Note: This figure shows the geographic distribution of China’s foreign assets, including debt claims from direct lending, trade advances, FDI debt instruments and portfolio holdings of foreign bonds and equity claims from foreign direct investment and portfolio holdings of foreign equity instruments. This figure is based on multiple different sources (see Appendix I and II).

38
Figure 26. China’s tailored approach of exporting capital: country groups
Note: This figure shows the composition of Chinese foreign claims into different asset classes and instruments by recipient country group. Data on Chinese claims is based on numerous different data sources (see Appendices I and II), country classification into income groups follows the IMF World Economic Outlook database.
This various tiers of Chinese capital exports are presented in a stylized way in Table 2. We show
the most relevant Chinese overseas investment instruments by country group and summarize how
the characteristics of China’s capital exports differ from those of other countries, building on the
insights above.
Table 2: China’s tailored approach of overseas lending and investing: a typology
Country group
Main instruments Special characteristics
Low-income countries
o Direct loans
o FDI in commodity producing industries, transport and energy
o Official loans (by the government and
state-owned companies)
o High opacity of lending
o Repayments often backed by collateral (e.g. oil, copper, corporate profits)
o “Circular lending” between Chinese banks and Chinese contractors abroad (to avoid loan disbursement to debtor country government)
39
Middle-income and emerging markets
o Direct loans
o Sovereign bond purchases of selected EMEs
o Swap lines with selected EMEs
o FDI, mainly in energy and transport
o Official loans that are extended at market interest rates (with risk premia)
o High opacity of lending
o Repayments sometimes backed by collateral (e.g. oil, copper, corporate profits)
Advanced economies
o Large-scale sovereign bond
purchases (especially of US, Eurozone, UK, Japan)
o Central bank swap lines with most advanced economies (not the US)
o FDI, in high-tech, finance, energy and transport
o Opacity of central bank holdings
o State-directed FDI
7. What drives official Chinese capital outflows?
This section presents ongoing work on the determinants of Chinese official capital outflows to the
rest of the world, including outflows to both advanced and developing economies. We build on the
received literature on “push” and “pull” factors of international capital flows, and explore whether
the established framework helps to explain the size and time variation of China’s state-driven
cross-border investment.
Specifically, we consider global monetary and financial conditions as a potential “push” factor of
capital outflows and “search for yield” abroad (Calvo et al. 1993, Obstfeld 2015, Rey 2015,
Miranda-Agrippino and Rey 2015, Forbes and Warnock 2012, Fratzscher 2012, Bruno and Shin
2015). Following this literature, we focus on US short-term interest rates, proxied by the widely
used “shadow rate” of Wu and Xia (2016), which captures both nominal interest rates as well as the
Fed’s unconventional monetary policy measures. The implied volatility of S&P 500 index options
(VIX), as a measure of global risk aversion, commonly included as a push factor in this literature,
supplements our analysis. Both measures have been identified to be key drivers of the global
financial cycle, i.e. of the synchronized capital outflows from industrialized countries.
Moreover, we explore the role of Chinese “push” factors. First, we consider Chinese real GDP
growth, second, the Chinese monetary policy stance and, third, an index of China’s import
commodity prices. When using these variables, a variety of measurement problems need to be
addressed. For Chinese real GDP growth, we use a quarterly time series from China’s National
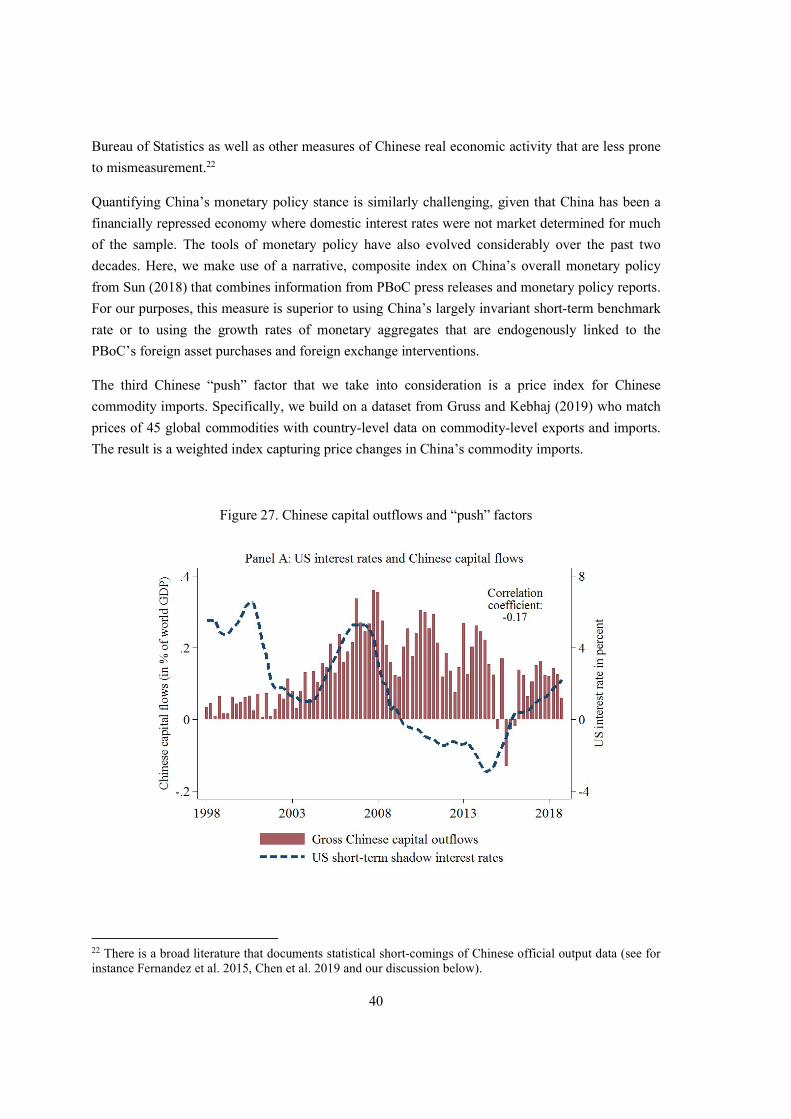
40
Bureau of Statistics as well as other measures of Chinese real economic activity that are less prone
to mismeasurement.22
Quantifying China’s monetary policy stance is similarly challenging, given that China has been a
financially repressed economy where domestic interest rates were not market determined for much
of the sample. The tools of monetary policy have also evolved considerably over the past two
decades. Here, we make use of a narrative, composite index on China’s overall monetary policy
from Sun (2018) that combines information from PBoC press releases and monetary policy reports.
For our purposes, this measure is superior to using China’s largely invariant short-term benchmark
rate or to using the growth rates of monetary aggregates that are endogenously linked to the
PBoC’s foreign asset purchases and foreign exchange interventions.
The third Chinese “push” factor that we take into consideration is a price index for Chinese
commodity imports. Specifically, we build on a dataset from Gruss and Kebhaj (2019) who match
prices of 45 global commodities with country-level data on commodity-level exports and imports.
The result is a weighted index capturing price changes in China’s commodity imports.
Figure 27. Chinese capital outflows and “push” factors
22 There is a broad literature that documents statistical short-comings of Chinese official output data (see for instance Fernandez et al. 2015, Chen et al. 2019 and our discussion below).
41
Note: This figure plots gross quarterly Chinese capital outflows from the PBoC’s balance of payments statistics in percent of world GDP (red bars, left scale) and two potential “push” factors (dashed blue lines, right scale) from 1998 until 2018. Panel A includes the US federal funds shadow rate as estimated by Wu and Xia (2016). Panel B includes China’s real GDP growth rate as published by the National Bureau of Statistics.
We begin with a preliminary look at the data. Figure 27 combines the quarterly time series of
Chinese gross capital outflows as a share of Chinese GDP with two key “push” factors that feature
prominently in the capital flow literature: US short-term interest rates (as measured by Wu and Xia
2016) and domestic GDP growth (from China). There are two main take-aways. First, US interest
rates appear to be only weakly correlated with Chinese gross capital outflows. In contrast, Chinese
real GDP growth is highly correlated with Chinese gross capital outflows, suggesting a strong role
for Chinese push factors in explaining the time-variation of Chinese capital flows.
Table 3 shows the results of a simple OLS regression of Chinese gross capital outflows on the
above presented push factors as well as a dummy for the financial crisis year 2008. The data spans
76 quarters from 2000 to 2018 and considers total gross capital outflows as reported by the PBoC.
As the main dependent variable we use Chinese capital flows scaled by Chinese GDP (Columns 1-
3) to eliminate the strong time trend in Chinese capital flows and possible valuation effects from
US dollar exchange rate fluctuations.
The three Chinese “push” factors are all significantly correlated with Chinese capital outflows and
jointly explain around 75% of their overall variation (Column 1). In comparison, US-centered
“push” factors such as the VIX and the US shadow rate have less explanatory power. The VIX is
not statistically significant and the R2 value in Column 2 is only 0.18. This result is supported by
42
the joint model shown in Column 3. Only the Chinese real GDP growth rate and China’s monetary
policy stance remain significant and adding the VIX and US interest rates does little in increasing
the R2 in comparison to the specification in Column 1 that focuses on Chinese push factors only.
The results are further confirmed in Columns 4-6, which use Chinese capital outflows scaled by
world GDP as a dependent variable. Again Chinese “push” factors are significant and show a larger
R2 than global financial factors. Furthermore, the coefficient size of our Chinese push factors
suggests very sizeable effects from an economic point of view: In our baseline specification, a one
percentage point increase in China’s real GDP growth rate is associated with an increase in capital
outflows of 1.7 percent of Chinese GDP.
Table 3. Drivers of Chinese gross capital outflows – OLS Regression
Note: This table shows OLS regression results for Chinese and global push factors. The dependent variable is the quarterly gross Chinese capital outflow scaled by Chinese GDP (Columns 1 to 3), or scaled by world GDP (Columns 4 to 6). China’s monetary policy index is from Sun (2018). US federal funds shadow rate from Wu and Xia (2016). Heteroscedasticity and auto-correlation robust standard errors in parentheses; * p < 0.1, ** p < 0.05, *** p < 0.01.
(1) (2) (3) (4) (5) (6)
Chinese push factors
Real GDP growth tate 1.71*** 1.78*** 0.01*** 0.02***(0.17) (0.20) (0.00) (0.00)
China monetary policy index 0.91*** 0.69* 0.02** 0.01(0.31) (0.38) (0.01) (0.01)
China commodity import prices 3.80* 3.94 0.14** 0.18***(2.21) (2.48) (0.06) (0.06)
Global / US push factors
VIX -2.15 -1.89 -0.06* -0.06**(1.91) (1.28) (0.03) (0.03)
US shadow interest rate 0.92*** -0.01 -0.00 -0.02***(0.25) (0.13) (0.00) (0.00)
2008 financial crisis 7.31*** 2.57 9.16*** 0.12*** 0.06 0.20***(1.09) (2.19) (1.59) (0.03) (0.04) (0.04)
Constant -8.03*** 12.82** -3.32 0.02 0.32*** 0.11(1.46) (5.49) (3.12) (0.04) (0.09) (0.08)
Observations 76 76 76 76 76 76R-squared 0.757 0.184 0.767 0.372 0.035 0.524
Dependent variable: Gross Chinese capital outflows
in percent of Chinese GDP in percent of world GDP
43
The main take away from these simple regressions is that strong output growth in China as well as
rising commodity prices are associated with increased capital exports from China to the rest of
world. In contrast, global market conditions do not seem to play a dominant role.
However, there are several shortcomings and caveats of the OLS approach. First, there is the issue
of parameter instability potentially arising from China’s increasing global integration over the
course of the sample. We address this point by running moving regressions over sub-periods of 30
quarters and document the extent of time-variation. Our results confirm the empirical importance of
Chinese push factors for the majority of subsamples.
Second, OLS does not adequately capture the dynamic structure of the explanatory and the
dependent variables as well as their high degree of auto-correlation. One possibility to address this
issue is to apply a GLS (Prais-Winsten) estimator, which yields similar results. Another option is to
estimate vector auto-regressions as in Rey (2015) or Bruno and Shin (2015). Using a recursive
VAR with Cholesky ordering that includes the VIX, Chinese gross capital outflows, the Chinese
monetary policy stance and Chinese real GDP growth, we find statistically significant impulse
responses of gross capital flows to shocks in Chinese real GDP growth. A variance decomposition
further shows that the largest share of the forecast error in gross capital outflows is driven by
Chinese push factors, while VIX plays only a sub-ordinated role. The findings are thus consistent
with the simple OLS results above.
Third, the data suffer from measurement problems. A large literature has documented statistical
shortcomings in official Chinese GDP data. China’s output and GDP is hard to track, also because
China’s national accounts are compiled by local authorities that face politically prescribed growth
targets and thus have incentives to over-report GDP (Chen et al. 2019). As a robustness check, we
therefore rerun our regressions using alternative indicators of Chinese economic activity. Our
preferred indicator follows Fernald et al. (2015), who construct a proxy variable of Chinese real
economic output growth as the first principal component of Chinese electricity production in
kilowatt hours, railway freight traffic in tons and retail spending in billions of RMB. The results for
Chinese GDP are similar when using this alternative measure.
Fourth and finally, the regressions suffer from a variety of endogeneity problems that are pertinent
in the capital flow literature and for which there are no easy fixes. China, like the US, is a major
global economy, and news on China’s economy are likely to affect US interest rates, the VIX and
global commodity prices. Furthermore, in China’s fixed exchange rate system, the monetary policy
stance is closely linked to the stabilization of foreign exchange markets and thus with scale of
PBoC bond purchases. For these reasons, further analysis is needed to explore the unique
determinants of China’s capital flows in a rigorous way.
44
8. Conclusion Over the past two decades, China has become a dominant player in the international financial
system. This paper documents the size, characteristics, and direction of the capital exports of China
to the rest of the world. By our reckoning, about one half of China’s large-scale lending to
developing countries is “hidden” and not recorded in the main international databases used by
researchers and practitioners alike.
These hidden overseas debts pose serious challenges for country risk analysis and bond pricing.
Debt sustainability metrics are poorer than generally perceived, especially so in about two dozen
developing countries that borrowed heavily from China during the boom decade of 2003-2013.
Moreover, private investors may not appreciate the extent to which they are junior to the Chinese
government.
Advanced countries have also become increasingly indebted to China, mostly via the PBoC’s
sovereign bond purchases and other FDI debt.
More generally, this paper has provided evidence that the global financial landscape has changed
markedly in the past two decades, as China has emerged as a global economic power. In the
Bretton Woods era following WWII, global capital flows were largely dominated by official flows
from the United States, as capital controls kept a tight lid on private sector cross border activity.
The dismantling of capital account restrictions in advanced economies following the breakdown of
Bretton Woods gave rise to a new era of private capital flows in international finance; the 1970s
and 1980s was importantly shaped by international syndicated bank lending, until portfolio bond
and equity flows displaced bank loans from the 1990s until today. The academic literature that
emerged during these past decades has almost entirely focused on understanding the drivers, nature
and economic effects of private cross-border flows.
Our work suggests that the surge of Chinese official overseas lending documented here has swung
the pendulum back, albeit partially. To develop an informed understanding of global capital flows
and external indebtedness it is now necessary to go beyond private sector flows in Western capital
markets and incorporate a relatively new but systemically important creditor - China. The scope for
academic and policy research, not to mention data collection by official and private sources, is vast.
45
References Alfaro, Laura, Sebnem Kalemli-Ozcan, and Vadym Volosovych. 2014. Sovereigns, Upstream Capital Flows, and Global Imbalances. Journal of the European Economic Association, 12 (5), 1240-84.
Arslanalp, Serkan, and Takahiro Tsuda. 2012. Tracking Global Demand for Advanced Country Sovereign Debt. IMF Working Paper No 12/284.
Arslanalp, Serkan, and Takahiro Tsuda. 2014. Tracking Global Demand for Emerging Market Sovereign Debt. IMF Working Paper No 14/39.
Avdjiev, Stefan, Bryan Hardy, Sebnem Kalemli-Ozcan, and Luis Sérven. 2017. Gross Capital Flows by Banks, Corporates and Sovereigns. NBER Working Paper No 23116.
Boughton, James. 1991. Commodity and Manufactures Prices in the Long Run. IMF Working Paper No. 91/47.
Bräutigam, Deborah. 2009. The Dragon’s Gift. Oxford: Oxford University Press.
Bräutigam, Deborah, and Kevin P. Gallagher. 2014. Bartering Globalization: China’s Commodity-backed Finance in Africa and Latin America. Global Policy, 5(3), 346-352.
Bruno, Valentina, and Hyun Song Shin. 2014. Cross-Border Banking and Global Liquidity. Review of Economic Studies, 82 (2), 535-64.
Bruno, Valentina, and Hyun Song Shin. 2015. Capital Flows and the Risk-Taking Channel of Monetary Policy. Journal of Monetary Economics, 71 (C), 119-32.
Caballero, Ricardo J, Emmanuel Farhi, and Pierre-Olivier Gourinchas. 2008. An Equilibrium, Model of ‘Global Imbalances’ and Low Interest Rates. American Economic Review, 98 (1), 358-93.
Calvo, Guillermo, Leonardo Leiderman, and Carmen Reinhart. 1993. Capital Inflows and Real Exchange Rate Appreciation in Latin America: The Role of External Factors. IMF Staff Papers, 40(1), 108-151.
Cerutti, Eugenio, and Haonan Zhou. 2018. The Chinese Banking System: Much more than a Domestic Giant. VoxEU.
Cerutti, Eugenio, Catherine Koch, and Swapan-Kumar Pradhan. 2018. The growing footprint of EME banks in the international banking system. BIS Quarterly Review, December 2018.
Chang, Kevin P. H., Stijn Claessens, and Robert E. Cumby. 1997. Conceptual and Methodological Issues in the Measurement of Capital Flight. International Journal of Finance & Economics, 2(2), 101-119.
Chazan, Yigal. 2018. Angola’s Debt Reliance on China May Leave It Short-Changed. Financial Times. https://www.ft.com/content/fb9f8528-6f03-11e8-92d3-6c13e5c92914 (accessed June 28, 2019).
46
Chen, Wei, Xilu Chen, Chang-Tai Hsieh, and Zheng Song. 2019. A Forensic Examination of China’s National Accounts. Brookings Papers on Economic Activity, Spring 2019, 1-54.
Cline, William R. 1995. International Debt Reexamined. Washington D.C.: Institute for International Economics.
Coppola, Antonio, Matteo Maggiori, Brent Neiman, and Jesse Schreger. 2019. Redrawing the Map of Global Capital Flows: The Role of Cross-Border Financing and Tax Havens. Mimeo.
Corsetti, Giancarlo, Aitor Erce, and Timothy Uy. 2018. Debt Sustainability and the Terms of Official Support. CEPR Discussion Paper DP13292.
Cruces, Juan J., and Christoph Trebesch. 2013. Sovereign Defaults: The Price of Haircuts. American Economic Journal: Macroeconomics, 5(3), 85–117.
Dreher, Axel, and Andreas Fuchs. 2016. Rogue aid? An empirical analysis of China’s aid allocation. Canadian Journal of Economics, 48(3), 988-1023.
Dreher, Axel, Andreas Fuchs, Bradley Parks, Austin M. Strange, and Michael J. Tierney. 2017. Aid, China, and Growth: Evidence from a New Global Development Finance Dataset. AidData Working Paper 46.
Dreher, Axel, Andreas Fuchs, Bradley Parks, Austin M. Strange, and Michael J. Tierney. 2018. Apples and Dragon Fruits: The Determinants of Aid and Other Forms of State Financing from China to Africa. International Studies Quarterly, 62(1), 182 – 194.
Farhi, Emmanuel, and Matteo Maggiori. 2019. China versus the United States: IMS meets IPS. American Economic Review, 109 (May), 476-481.
Feis, Herbert. 1930. Europe, the World’s Banker, 1870-1914: An Account of European Foreign Investment and the Connection of World Finance with Diplomacy before the War. New Haven: Yale University Press.
Fernald, John, Eric Hsu, and Mark M. Spiegel. 2015. Is China Fudging its Figures? Evidence from Trading Partner Data. Federal Reserve Bank of San Francisco Working Paper 2015-12.
Forbes, Kristin J., and Francis E. Warnock. 2012. Capital Flow Waves: Surges, Stops, Flight, and Retrenchment. Journal of International Economics, 88 (2), 235-51.
Fratzscher, Marcel. 2012. Capital Flows, Push versus Pull Factors and the Global Financial Crisis. Journal of International Economics, 88 (2), 341-56.
Fuest, Clemens, Felix Hugger, Samina Sultan, and Jing Xing. 2019. Chinese acquisitions abroad: are they different? CESifo Working Paper 7585.
Gallagher, Kevin P., Amos Irwin, and Katherine Koleski. 2012. The New Banks in Town: Chinese Finance in Latin America. Washington D.C.: Inter-American Dialogue.
Gourinchas, Pierre-Olivier, and Olivier Jeanne. 2013. Capital Flows to Developing Countries: The Allocation Puzzle. The Review of Economic Studies, 80(4), 1484-1515.
47
Gourinchas, Pierre-Olivier, and Hélène Rey. 2014. External Adjustment, Global Imbalances, Valuation Effects. In Handbook of International Economics, 4, 585-645. Elsevier.
Gruss, Bertrand, and Suhaib Kebhaj. 2019. Commodity Terms of Trade: A New Database. IMF Working Paper No. 19/21.
Horn, Sebastian, Carmen M. Reinhart, and Christoph Trebesch (forthcoming). The Forgotten History of Official Debt.
Hurley, John, Scott Morris, and Gailyn Portelance. 2018. Examining the Debt Sustainability Implications of the Belt and Road Initiative from a Policy Perspective. CGD Policy Paper, 121.
Ilzetzki, Ethan, Carmen M. Reinhart, and Kenneth Rogoff. 2019. Exchange Arrangements Entering the 21st Century: Which Anchor Will Hold? Quarterly Journal of Economics, 134(2), 599-646.
International Monetary Fund. 2018. Macroeconomic Developments and Prospects in Low-Income Developing Countries. IMF Policy Paper.
International Monetary Fund. 2015. Coordinated Direct Investment Survey – Guide. Washington D.C.: IMF Statistics Department.
International Monetary Fund. 2017. Coordinated Portfolio Investment Survey Guide – 3rd edition. Washington D.C.: IMF Statistics Department.
Jordà, Òscar, Moritz Schularick, Alan M. Taylor, and Felix Ward. 2018. Global Financial Cycles and Risk Premiums. NBER Working Paper No. 24677.
Kraay, Aart. 2014. Government Spending Multipliers in Developing Countries: Evidence from Lending by Official Creditors. American Economic Journal: Macroeconomics, 6 (4), 170-208.
Kratz, Agatha, Allen Feng, and Logan Wright. 2019. New Data on the ‘Debt Trap’ Question. Rhodium Group.
Mendoza, Enrique G., Vincenzo Quadrini, and José-Víctor Ríos-Rull. 2009. Financial Integration, Financial Development, and Global Imbalances. Journal of Political Economy, 117 (3), 371-416.
Meng, Xin, Nancy Qian, and Pierre Yared. 2015. The Institutional Causes of China’s Great Famine, 1959–1961. Review of Economic Studies, 82 (4), 1568-1611.
Meyer, Josefin, Carmen M. Reinhart, and Christoph Trebesch. 2019. Sovereign Bonds since Waterloo. NBER Working Paper No. 25543.
Miranda-Agrippino, Silvia, and Hélène Rey. 2015. US Monetary Policy and the Global Financial Cycle. NBER Working Paper No. 21722.
Obstfeld, Maurice. 2015. Trilemmas and Tradeoffs: Living with Financial Globalization. In Global Liquidity, Spillovers to Emerging Markets and Policy Responses, edited by Claudio Raddatz, Diego Saravia, and Jaume Ventura, 13-78. Santiago: Central Bank of Chile.

48
Organization for Economic Cooperation and Development. 2015. Chinese Export Credit Policies and Programs. Paris: Working Party on Export Credits and Credit Guarantees.
Prasad, Eswar S. 2017. Gaining Currency: The Rise of the Renminbi. New York: Oxford University Press.
Reinhart, Carmen M., and Christoph Trebesch. 2016. The International Monetary Fund: 70 Years of Reinvention. Journal of Economic Perspectives, 30(1), 3-28.
Reinhart, Carmen M., Vincent Reinhart and Christoph Trebesch. “Global Cycles: Capital Flows, Commodities, and Sovereign Defaults, 1815-2015,” American Economic Review, Vol. 106(5), May 2016, 574-580.
Reinhart, Carmen M., Vincent Reinhart, and Christoph Trebesch. 2018. Capital Flow Cycles – A Long, Global View. Mimeo.
Rey, Hélène. 2015. Dilemma Not Trilemma: The Global Financial Cycle and Monetary Policy Independence. NBER Working Paper No. 21162.
Rieffel, Lex. 2003. Restructuring Sovereign Debt: The Case for Ad Hoc Machinery. Washington D.C.: Brookings Institution Press.
Schlegl, Matthias, Christoph Trebesch and Mark L. J. Wright. 2019. The Seniority Structure of Sovereign Debt. NBER Working Paper No. 25793.
Setser, Brad. 2018. A few words on China’s holdings of US bonds. https://www.cfr.org/blog/few-words-chinas-holdings-us-bonds
Song, Zheng, Kjetil Storesletten, and Fabrizio Zilibotti. 2011. Growing Like China. American Economic Review, 101 (1), 196-233.
Stallings, Barbara. 1987. Banker to the Third World: US Portfolio Investment in Latin America, 1900-1986. Berkeley: University of California Press.
Sun, Rongrong. 2018. A Narrative Indicator of Monetary Conditions in China. International Journal of Central Banking, 14 (4), 1-42.
Surrey, Walter, and Peri Nash. 1985. Bankers Look Beyond the Debt Crisis: The Institute for International Finance, Inc. Columbia Journal of Transnational Law, 23 (1), 111-113.
Wu, Cynthia J., and Fan D. Xia. 2016. Measuring the Macroeconomic Impact of Monetary Policy at the Zero Lower Bound. Journal of Money, Credit and Banking, 48 (2-3), 253-291.
Zucman, Gabriel. 2013. The Missing Wealth of Nations: Are Europe and the U.S. Net Debtors or Net Creditors? Quarterly Journal of Economics, 128 (3), 1321-64.
49
Appendix I – Dataset on Chinese overseas lending: sources and methods
AI.1. Compiling the dataset on Chinese overseas loans, 1950-2017
We obtain a comprehensive, micro-level dataset of Chinese overseas lending since 1949 by
drawing on dozens of primary and secondary data sources.
Sources for 2000-2017: The starting point of our data collection is AidData’s Chinese Official
Finance database, the most comprehensive, publicly available source on Chinese foreign official
finance (Dreher et al. 2017). It is based on hundreds of primary sources such as creditor and debtor
annual reports, embassy press releases, news sources, debtor aid management systems and the
academic literature to identify Chinese foreign loans and grants to 140 recipient countries between
2000 and 2014. Transactions only enter the final dataset after an extensive data triangulation. This
way AidData identifies 1200 Chinese loans and more than 2300 grants amounting to a total of 280
billion USD in Chinese official commitments.23
One draw-back of this database is that it ends in 2014 and thus misses much of the lending flows
associated with the Belt and Road Initiative, which was unveiled in end-2013.24 Moreover, there is
no data prior to 2000, which makes it difficult to study China’s evolution as an international
creditor. Moreover, the coverage is incomplete for a few countries and sectors, in particular
regarding loans from China’s state-owned commercial creditors.
We therefore expand on AidData by combining it with a number of region- and sector-specific
databases that have excellent coverage for subsets of China’s foreign lending and that therefore
allow us to fill gaps and carefully cross-check with AidData. We also identify a variety of old and
new sources that allow us to expand the time coverage on Chinese overseas lending for the years
pre-2000 and post-2014.
The China-Latin America Finance Database by Gallagher and Myers (2019) from the Inter-
American Dialogue provides loan-level data on 141 billion USD in Chinese loans to 15 Latin
American and Caribbean sovereigns and their state-owned enterprises between 2005 and 2018. The
China-Africa Research Initiative at John Hopkins University (SAIS-CARI) provides data on 143
billion USD in Chinese official loans to 55 African countries since 2000. For Oceania, the Lowy
Institute released the Chinese Aid in the Pacific Database as well as the Pacific Aid Map, which
together trace 6 billion USD in Chinese official financial flows to 14 countries since 2002.
23 We exclude from our dataset all transactions linked to technical assistance, debt relief, scholarships or training. 24 For the countries of Far East Asia and Oceania an AidData update is available that includes years 2015 and 2016 (see Custer et al. 2018 and the associated dataset).

50
In addition to these region-specific data sources, we make use of the China Global Energy Finance
Database at Boston University (Gallagher 2019), which tracks 238 projects in the fossil fuel,
nuclear power and renewable energy sector around the world and since 2000, with total financing
amounts of 250 billion USD, extended by either the China Export-Import Bank or the China
Development Bank. We also draw on the China Export Credit Agency Project database that is
regularly updated by the US Export-Import Bank and which covers medium and long-term export
loans extended by China’s Export-Import Bank since 2013.
Whenever available, we also make use of debtor-specific resources such as national debt
management systems. As we explained in Section 3, the coverage of debtor country statistics
regarding Chinese lending is often imperfect, to say the least. Nevertheless, national debt
management systems are useful to cross-check amounts and lending terms from other sources and
to expand the coverage for more recent years and selected countries, especially when no other loan-
level data is available.
Historical sources: To obtain a long-run perspective on Chinese foreign lending, we go back all the
way to the foundation of the People’s Republic of China in 1949. For this purpose, we again build
on a broad array of different sources. An excellent overview of early Chinese lending is provided
by historic CIA reports that were compiled from the end of World War II until the late 1980s. The
confidential reports were recently declassified and contain rich transaction-level details on China’s
international grants and loans. We cross-check the information from this source with the work of
political scientists and historians, such as a collection of international Chinese treaties by Bartke
(1992) and early work on Chinese foreign aid by Eckstein (1996), Law (1984) and Lin (1993). We
again reconcile conflicting information and supplement the coverage of the CIA reports in cases of
incomplete documentation.
The 1990s are a more challenging period to identify Chinese overseas lending. No CIA reports
have been made public and the modern databases described above only start tracing Chinese flows
in the early 2000s. Our data collection for this period builds on the three-volume work of John
Copper (2016), which documents Chinese economic and military aid to dozens of developing
countries in the form of country case studies. We carefully examine these case studies and code
Chinese foreign loans and grant commitments amounting to a total of 13 billion USD from 1990 to
1999.
List of Academic Sources:
Bartke, Wolfgang. 1989. The economic aid of the PR China to developing and socialist countries. Göttingen: K.G. Saur Verlag.
Bartke 1992: The agreements of the People’s Republic of China with foreign countries. Göttingen: K.G. Saur Verlag.
Brant, Philippa. 2018. Chinese Aid in the Pacific. Lowy Institute.
51
Bräutigam, Deborah, and Jyhjong Wang. 2016. Eastern Promises: New Data on Chinese Loans in Africa, 2000 to 2014. John Hopkins China-Africa Research Initiative Working Paper 4, April 2016.
Central Intelligence Agency. Multiple Years. Review of Communist Aid. China Africa Research Initiative. 2019. Chinese Loans to Africa. John Hopkins University. Copper, John. 2016. China’s Foreign Aid and Investment Diplomacy. New York: Palgrave
MacMillan. Custer, Samantha, Brooke Russell, Matthew DiLorenzo, Mengfan Cheng, Siddhartha
Ghose, Jacob Sims, Jennifer Turner, Harsh Desai. 2018. Ties That Bind: Quantifying China’s public diplomacy and its “good neighbor” effect .Williamsburg, VA: AidData at William & Mary.
Dreher, Axel, Andreas Fuchs, Bradley Parks, Austin M. Strange, and Michael J. Tierney. 2017. Aid, China, and Growth: Evidence from a New Global Development Finance Dataset. AidData Working Paper, 46.
Eckstein, A. 1966. Communist China’s economic growth and foreign trade: implications for U.S. policy. New York: McGraw-Hill.
Gallagher, Kevin P. 2019. China’s Global Energy Finance. Global Economic Governance Initiative, Boston University.
Gallagher, Kevin P. and Margaret Myers. 2019. China-Latin America Finance Database. Washington: Inter-American Dialogue.
Law, Yu-Fai. 1984. Chinese Foreign Aid: A Study of its Nature and Goals. University of Bielefeld: Dissertation.
Lin. 1993. The foreign aid policy of the People’s Republic of China: A theoretical analysis. University of Michigan: Dissertation.
Strange, Austin M., Axel Dreher, Andreas Fuchs, Bradley Parks, and Michael J. Tierney. 2017. Tracking Underreported Financial Flows: China’s Development Finance and the Aid–Conflict Nexus Revisited. Journal of Conflict Resolution, 61 (5), 935–63.
List of National Debtor Sources:
Bolivia: Banco Central de Bolivia. Informe de la Deuda Externa Pública of each year. Table “Desembolsos de la Deuda Externa Pública por Sector Económico y Proyecto de Destino”; (downloadable from https://www.bcb.gob.bo/?q=informes-deuda-externa-publica, accessed 21.05.2019)
Congo, Rep.: Embassy of France in the Republic of the Congo. Note de Conjoncture Économique (http://primature.cg/wp-content/uploads/2018/04/grand-dossier1.pdf, accessed 31.05.2019)
Ecuador: Ministry of Finance and Economy Ecuador. Boletín de Deuda Externa for December of each year. Table 11: “Deuda Externa del Sector Público: Préstamos Contratados” (downloadable from https://www.finanzas.gob.ec/deuda-publica/, accessed 24.06.2019)
Ethiopia: Ministry of Finance and Economic Development. Public Sector Debt Statistical Bulletin (http://www.mofed.gov.et/documents/10182/19277/Public+Sector+Debt+Statistical+Bulltien+No.+23+(2012+-13++-++2016-17+and+30-09-2017)+(1).pdf/a98283bf-5760-41c2-855e-9e5ecd0d4328, accessed 21.05.2019)
Guyana: Ministry of Finance Guyana. Public Debt Annual Report 2016. Appendix 18: Loans Contracted and Disbursed during the period May 26, 2015 to September 30, 2017 (https://finance.gov.gy/wp-content/uploads/2017/11/Public-Debt-Annual-Report-2016-Final.pdf, accessed 24.06.2019)

52
Maldives: Ministry of Finance Maldives. Table “Active External Loans as at end 2018 (http://www.finance.gov.mv/public/attachments/3DTVQS8jF1l0aIUZiAPYh5a1vaSyI4Ptiy6HfkOk.pdf, accessed 31.05.2019)
Montenegro: Ministry of Finance Montenegro. Report on the Public Debt of Montenegro for each year. Tables “Foreign Guarantees” and “Debt stock” (downloadable from http://www.mf.gov.me/en/sections/state-debt/, accessed 24.06.2019)
Serbia: Ministry of Finance Serbia. Public Debt Stock and Structure 2016 – Monthly Report. Table “External Debt Direct Liabilities” (http://www.javnidug.gov.rs/upload/Bilteni/Bilten%20engleski/2016/Mesecni%20izvestaj%20Uprave%20za%20javni%20dug%20-%20ENG%20decembar%202016.pdf, accessed 21.05.2019)
Uganda: Ministry of Finance, Planning and Economic Development. Report on Public Debt (Domestic and External Loans), Guarantees and other Financial Liabilities and Grants for each year. Table “New Loans approved by Parliament during FY” and “Status of Pipeline loan Projects” (downloadable from https://finance.go.ug/publication/reports-public-debt-guarantees-other-financial-liabilities-and-grants-financial-years, accessed 24.05.2019)
Final database: To bring all these different data sources together, we embark on an extensive
merging and cleaning process. First, we carefully examine the details of more than 5000 loans and
grants and compare the entries across all sources in case of overlaps. We then filter out duplicates
and identify missing data points, e.g. the interest rate or maturity of individual loans. To reconcile
conflicting information between databases, we move beyond the above listed databases whenever
possible and consult the primary sources ourselves. This was particularly important for the data
provided in the annual reports of the US Export-Import Bank. Unlike the other databases, the US
Export-Import Bank does not undertake a rigorous verification procedure so that this source
contains both confirmed and unconfirmed Chinese loans. To avoid noise and double counting we
thus only consider those Chinese commitments that are confirmed by official sources on either the
recipient of the creditor side, resulting in a coverage of 90 transactions or a total of 50 billion USD
since 2013.
Our final, unified data source covers 1974 loans and 2947 grants by different Chinese official and
state-owned creditors to more than 150 countries and spans the entire history of the People’s
Republic from 1949 to 2017, with total recorded commitments amounting to 530 billion USD.
Terms of Chinese Lending: For about one third of all loans in our dataset, we know all necessary
details on interest rates and repayment terms, in particular grace period and maturity, mainly using
the entries from AidData and the national debt management systems listed above.
For an additional 45 percent of loans we approximate the repayment terms using information on the
Chinese creditor agency and the type of lending instrument. We thus make use of the fact that
Chinese lending practices are standardized and largely predetermined by who lends. In a first step,
we therefore created a typology of creditor-specific lending terms, complementing the quantitative
patterns we see in the data with qualitative information from the websites and annual reports of the
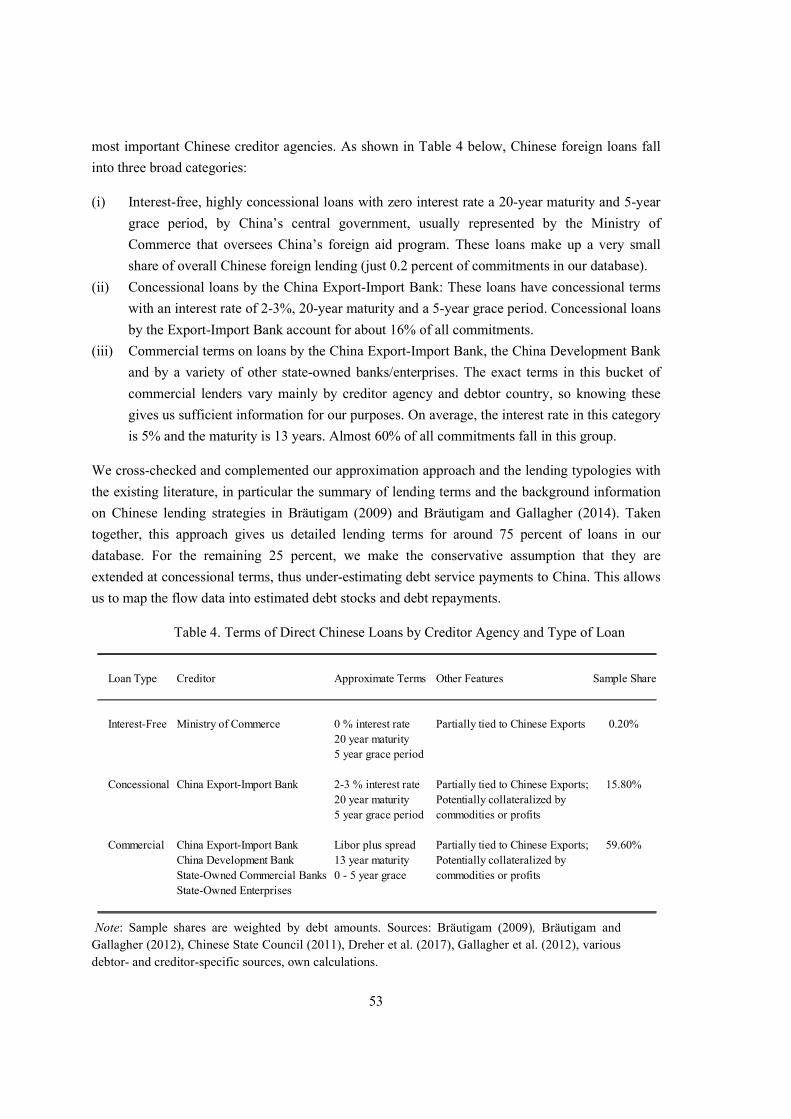
53
most important Chinese creditor agencies. As shown in Table 4 below, Chinese foreign loans fall
into three broad categories:
(i) Interest-free, highly concessional loans with zero interest rate a 20-year maturity and 5-year
grace period, by China’s central government, usually represented by the Ministry of
Commerce that oversees China’s foreign aid program. These loans make up a very small
share of overall Chinese foreign lending (just 0.2 percent of commitments in our database).
(ii) Concessional loans by the China Export-Import Bank: These loans have concessional terms
with an interest rate of 2-3%, 20-year maturity and a 5-year grace period. Concessional loans
by the Export-Import Bank account for about 16% of all commitments.
(iii) Commercial terms on loans by the China Export-Import Bank, the China Development Bank
and by a variety of other state-owned banks/enterprises. The exact terms in this bucket of
commercial lenders vary mainly by creditor agency and debtor country, so knowing these
gives us sufficient information for our purposes. On average, the interest rate in this category
is 5% and the maturity is 13 years. Almost 60% of all commitments fall in this group.
We cross-checked and complemented our approximation approach and the lending typologies with
the existing literature, in particular the summary of lending terms and the background information
on Chinese lending strategies in Bräutigam (2009) and Bräutigam and Gallagher (2014). Taken
together, this approach gives us detailed lending terms for around 75 percent of loans in our
database. For the remaining 25 percent, we make the conservative assumption that they are
extended at concessional terms, thus under-estimating debt service payments to China. This allows
us to map the flow data into estimated debt stocks and debt repayments.
Table 4. Terms of Direct Chinese Loans by Creditor Agency and Type of Loan
Note: Sample shares are weighted by debt amounts. Sources: Bräutigam (2009), Bräutigam and Gallagher (2012), Chinese State Council (2011), Dreher et al. (2017), Gallagher et al. (2012), various debtor- and creditor-specific sources, own calculations.
Loan Type Creditor Approximate Terms Other Features Sample Share
Interest-Free Ministry of Commerce 0 % interest rate Partially tied to Chinese Exports 0.20%20 year maturity5 year grace period
Concessional China Export-Import Bank 2-3 % interest rate Partially tied to Chinese Exports; 15.80%20 year maturity Potentially collateralized by 5 year grace period commodities or profits
Commercial China Export-Import Bank Libor plus spread Partially tied to Chinese Exports; 59.60%China Development Bank 13 year maturity Potentially collateralized by State-Owned Commercial Banks 0 - 5 year grace commodities or profitsState-Owned Enterprises
54
AI.2 From flows to stocks: Estimating debt stocks owed to China, 2000-2017
The above mentioned sources all report Chinese lending flows, but not outstanding debt stocks, for
example as a share of debtor country GDP. The lack of data on debt stocks owed to China is an
important gap in the existing literature. One exception is the work by Hurley et al. (2018) from the
Center for Global Development, who estimate a snapshot on the size of debt stocks for a subsample
of 23 countries participating in the Belt and Road Initiative in the year 2016. Here, we estimate
debt stocks owed to China for 106 developing and emerging countries that have received more than
one percent of GDP in Chinese loans for each year from 2000 until 2017 (see Table 5 for a list of
included countries). Our estimate of outstanding debt stocks builds on the loan-level data, in
particular the data on amounts, currency and repayment terms that we have assembled.
Procedure: To transform the flow data into debt stock and debt servicing burdens by country and
year we computed repayment histories for each loan. We then aggregate the loan-level cash flow
streams to estimate total outstanding debt stocks as well as the interest and amortization payments
on a country-year level.
Caveats: Two caveats need to be made in this context. First, much of the loan-level data we use is
based on commitment amounts. We do not have systematic data on actual disbursements, i.e.
whether the committed loan amounts have been disbursed in full. Second, we cannot trace actual
repayments, i.e. we do not know whether payments have been made on schedule or not. We deal
with these two “known unknowns” by making two conservative assumptions.
We assume that all repayments have been made on schedule, meaning that there are no arrears on
debt service obligations to China. This assumption is likely to result in an underestimation of debt
stocks, because we know that many developing countries are serial defaulters and have large
outstanding arrears on official and private creditors (Reinhart et al. 2003, Schlegl et al. 2019).
Furthermore, we drop a large number of projects from the sample, for which the full disbursement
of committed amounts is uncertain. Specifically, we exclude all projects that have been cancelled
or suspended. We further exclude all loans that as of the end of 2017 remained in an initial “pledge
phase”, i.e. projects, for which only an initial Memorandum of Understanding has been signed, but
for which there is no evidence that the loan has been formalized and paid out. Moreover, we drop
all umbrella or framework agreements that represent general credit lines between China and the
recipient countries without specifying actual projects. Dropping these entries is again likely to lead
to a downward bias in estimated debt stocks, which is preferable to double counting and
overestimation. This said, it is still possible that we might overestimate debt to China for individual
countries or years, in case disbursements fall considerably short of promised commitment amounts.
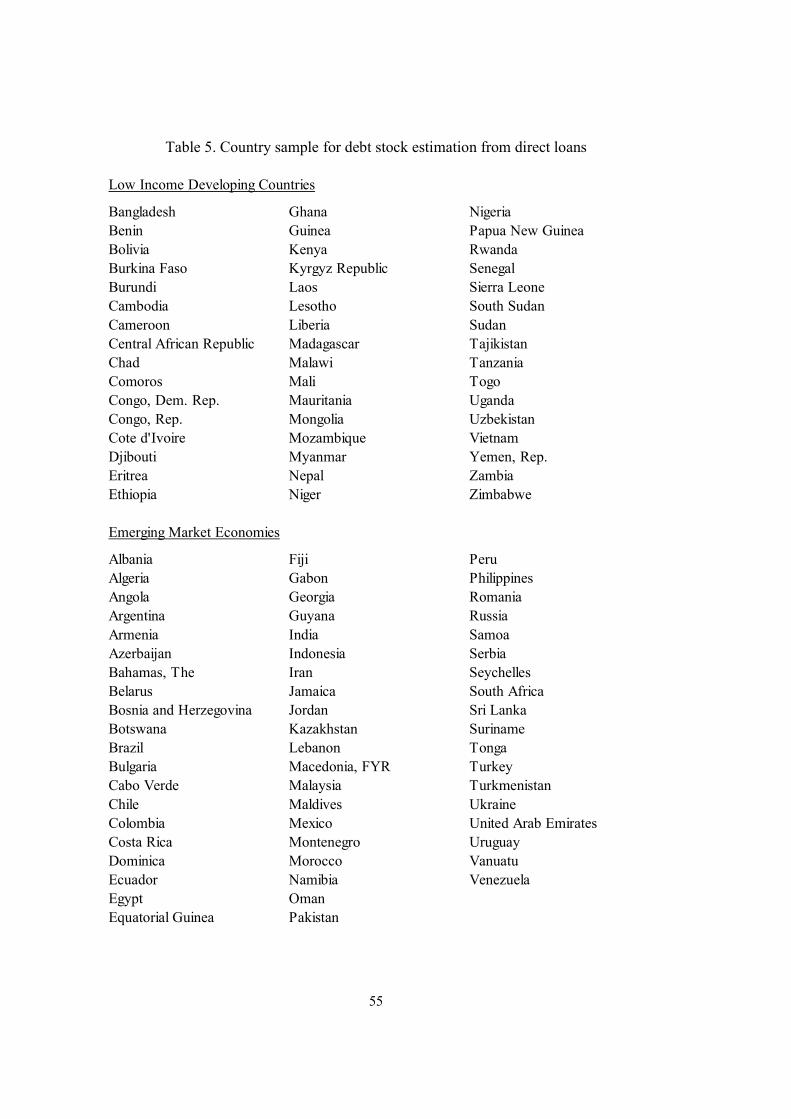
55
Table 5. Country sample for debt stock estimation from direct loans
Low Income Developing Countries
Bangladesh Ghana NigeriaBenin Guinea Papua New GuineaBolivia Kenya RwandaBurkina Faso Kyrgyz Republic SenegalBurundi Laos Sierra LeoneCambodia Lesotho South SudanCameroon Liberia SudanCentral African Republic Madagascar TajikistanChad Malawi TanzaniaComoros Mali TogoCongo, Dem. Rep. Mauritania UgandaCongo, Rep. Mongolia UzbekistanCote d'Ivoire Mozambique VietnamDjibouti Myanmar Yemen, Rep.Eritrea Nepal ZambiaEthiopia Niger Zimbabwe
Emerging Market Economies
Albania Fiji PeruAlgeria Gabon PhilippinesAngola Georgia RomaniaArgentina Guyana RussiaArmenia India SamoaAzerbaijan Indonesia SerbiaBahamas, The Iran SeychellesBelarus Jamaica South AfricaBosnia and Herzegovina Jordan Sri LankaBotswana Kazakhstan SurinameBrazil Lebanon TongaBulgaria Macedonia, FYR TurkeyCabo Verde Malaysia TurkmenistanChile Maldives UkraineColombia Mexico United Arab EmiratesCosta Rica Montenegro UruguayDominica Morocco VanuatuEcuador Namibia VenezuelaEgypt OmanEquatorial Guinea Pakistan
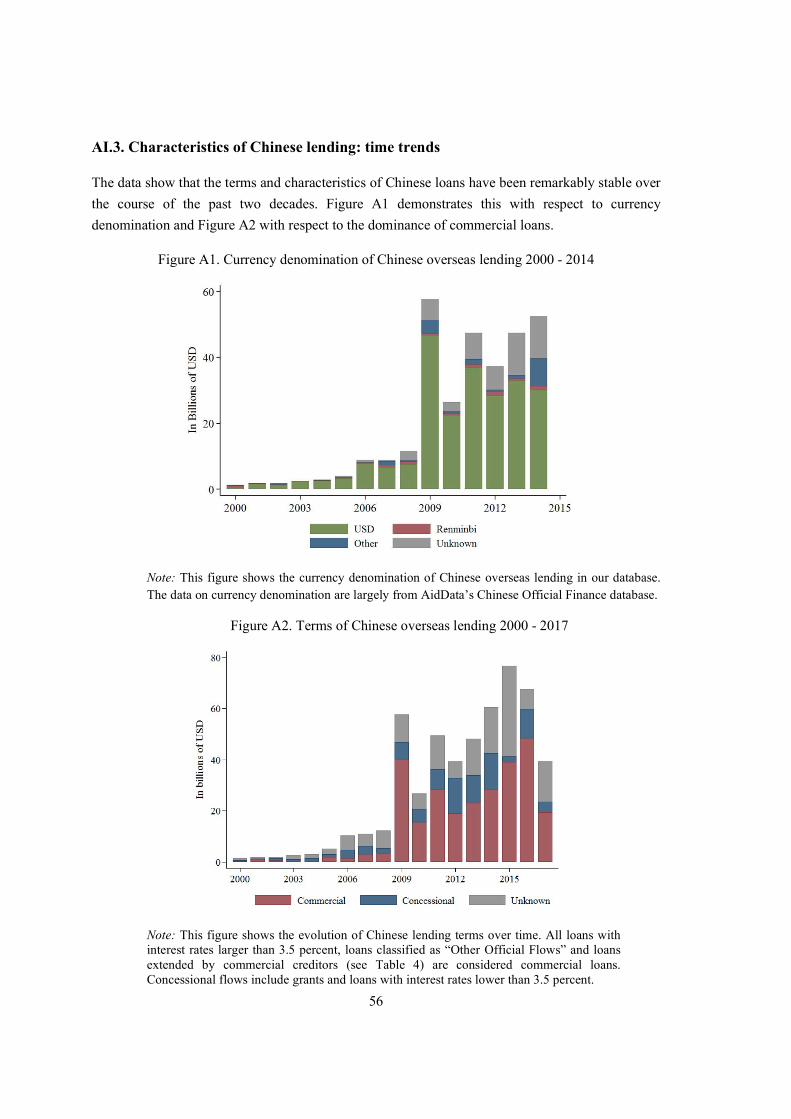
56
AI.3. Characteristics of Chinese lending: time trends
The data show that the terms and characteristics of Chinese loans have been remarkably stable over
the course of the past two decades. Figure A1 demonstrates this with respect to currency
denomination and Figure A2 with respect to the dominance of commercial loans.
Figure A1. Currency denomination of Chinese overseas lending 2000 - 2014
Note: This figure shows the currency denomination of Chinese overseas lending in our database. The data on currency denomination are largely from AidData’s Chinese Official Finance database.
Figure A2. Terms of Chinese overseas lending 2000 - 2017
Note: This figure shows the evolution of Chinese lending terms over time. All loans with interest rates larger than 3.5 percent, loans classified as “Other Official Flows” and loans extended by commercial creditors (see Table 4) are considered commercial loans. Concessional flows include grants and loans with interest rates lower than 3.5 percent.
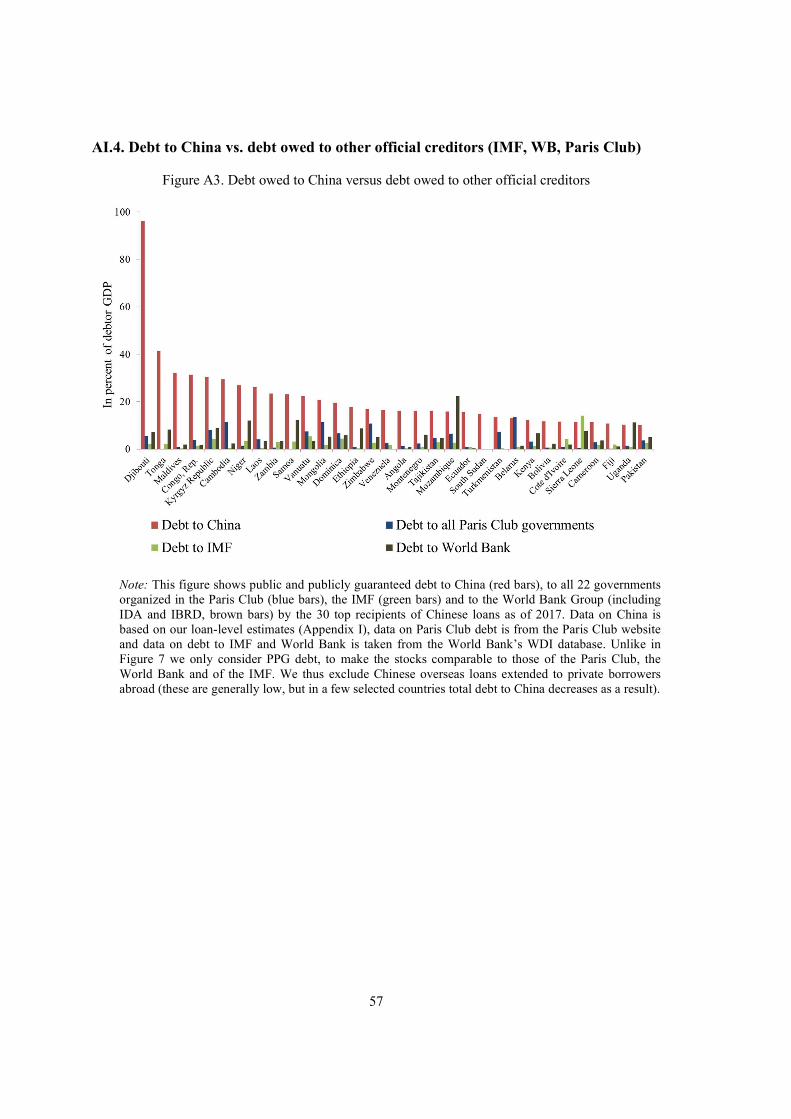
57
AI.4. Debt to China vs. debt owed to other official creditors (IMF, WB, Paris Club)
Figure A3. Debt owed to China versus debt owed to other official creditors
Note: This figure shows public and publicly guaranteed debt to China (red bars), to all 22 governments organized in the Paris Club (blue bars), the IMF (green bars) and to the World Bank Group (including IDA and IBRD, brown bars) by the 30 top recipients of Chinese loans as of 2017. Data on China is based on our loan-level estimates (Appendix I), data on Paris Club debt is from the Paris Club website and data on debt to IMF and World Bank is taken from the World Bank’s WDI database. Unlike in Figure 7 we only consider PPG debt, to make the stocks comparable to those of the Paris Club, the World Bank and of the IMF. We thus exclude Chinese overseas loans extended to private borrowers abroad (these are generally low, but in a few selected countries total debt to China decreases as a result).
58
Appendix II – Data and sources on other types of capital exports (Portfolio Investments, Trade Debt, FDI Debt, Swap Lines)
Debt Portfolio Investments
Reserve Asset Portfolio Investment: As Figure 19 shows, the largest share of Chinese overseas
lending consists of official portfolio investments, i.e. holdings of foreign, sovereign bonds by the
People’s Bank of China. These holdings reflect China’s accumulation of large foreign exchange
reserves during years of sustained and sizeable current account surpluses. The composition of
foreign reserve assets is confidential and therefore no official Chinese data exists. We can,
however, obtain reasonably precise estimates of Chinese exposure to different countries by using a
large number of different debt sources and international statistics and by following an approach
introduced by Arslanalp and Tsuda (2012).
Our starting point is given by total reserve assets as published by SAFE. We subtract from total
reserves the amount of reserves held in the form of gold, in foreign bank deposits or in the form of
foreign equity securities, and obtain the market value of all debt instruments held as reserve assets
by the Chinese central bank. While we can obtain data on gold holdings and deposits from the
PBOC and from the IMF’s International Reserve and Foreign Currency Liquidity Template, no
official data exists on the share of reserves held as equity. Instead, we use an estimate based on the
share of equity securities in total Chinese holdings of US securities as given by the US TIC data.
This estimate suggests that around 10 percent of Chinese holdings were in the form of debt.
Making these adjustments, we arrive at estimated Chinese official holdings of foreign debt
securities of 2.8 trillion USD at the end of 2017.
We decompose this total into security holdings for single issuer countries by following an approach
introduced by Arslanalp and Tsuda (2012). We start by using US TIC data to identify Chinese
holdings of US treasury, agency and corporate debt securities and thereby identify a total of 1.3
trillion USD or close to 50% of total Chinese foreign security holdings.25 To estimate the country
allocation of the remaining 1.5 trillion USD, we work under the assumption that Chinese reserve
investments are proportional to the average global reserve asset allocation and use the IMF’s
Composition of Foreign Exchange Reserves (COFER) database and Table 9 of the IMF’s
Coordinated Portfolio Investment Survey to assign Chinese debt security holdings to specific
debtor countries (see Arslanalp and Tsuda 2012 for details).
Note that these estimates only give us the total amount of debt securities issued by a specific
country and held by China. In order to additionally identify Chinese holdings of sovereign (central
government) debt, we assume that 85% of debt securities held by China are issued by sovereigns.
25 Given that US TIC data collects information on non-resident holders on a custodial basis, these estimates are likely to underestimate China’s security holdings. Brad Setser (2018), for example, argues that around 60 billion USD of Chinese US treasury holdings are invested through a Belgian custodian.
59
This assumption follows from US TIC data that shows that 85% of Chinese holdings of US debt
securities are in the form of US Treasury bonds.
Non-Reserve Asset Debt Investment: In addition to debt securities held as reserve assets, China’s
International Investment Position reports debt securities not held as part of official reserves of 194
billion USD at the of 2017. This sum likely represents the portfolio holdings of large state-owned
banks such as the Bank of China, the Agricultural Bank of China, the China Construction Bank and
the Industrial and Commercial Bank of China. For recent years the geographic composition of
these investments can be inferred from China’s report to the IMF’s Coordinated Portfolio
Investment Survey. At the end of 2017, more than half of non-reserve asset portfolio investments
were held in debt securities issued by the US or other advanced country residents, 23 percent were
invested in debt securities issued by offshore financial centers and 15 percent in securities issued
by Hong Kong and Macao. The remaining 5 percent were invested in debt securities of developing
and emerging market countries. These numbers include so called panda bonds, debt securities
denominated in RMB and issued in the Chinese onshore market by non-Chinese residents. Since
2015, panda bonds have gained the interest of foreign sovereigns, with Korea, the Philippines,
Hungary and Poland tapping the market and Italy recently announcing its first panda bond issue.
Portfolio Equity Investments
China’s non-reserve, portfolio equity investments amounted to 310 billion USD in the end of 2017.
As in the case of non-reserve portfolio debt investments, China has reported the geographic
allocation of these claims to the IMF’s Coordinated Portfolio Investment Survey (CPIS). CPIS data
reveals that the large majority of Chinese portfolio equity is invested in advanced economies and
offshore financial centers. Around 40 % of total portfolio equity claims are held against Hong
Kong residents, followed by 25% of equity claims against US residents.
Foreign Direct Investment
Total FDI: The statistics on FDI outflows published by China’s Ministry do not capture the large
amounts of Chinese outward investment channeled through offshore financial centers such as Hong
Kong. As an alternative, we therefore rely on the widely used data on Chinese FDI that was hand-
collected by the American Enterprise Institute and Heritage Foundation. Their “Chinese investment
dataset” codes publicly known Chinese foreign investment transactions that exceed 100 million
USD since 2005 and with global coverage. We aggregate these investments into stocks of outward
Chinese FDI positions and scale them by GDP.
60
FDI Debt Instruments: For China, the international investment position reveals that around 15
percent of outward direct investment is in the form of debt instruments.26 The overall debt claims
from direct investment therefore amounted to 232 billion USD at the end of 2017. Chinese official
statistics do not reveal the geographic distribution of these claims, but a large number of recipient
countries do publish the debt-equity composition of their inward FDI stocks by counterparty in the
context of the IMF’s Coordinated Direct Investment Survey. This way we can identify Chinese FDI
debt claims vis-à-vis a total of 102 recipient countries. To arrive at an estimate for the remaining
countries that do not report to the CDIS, we assume that their FDI debt to China amounts to 15
percent of the total Chinese inward FDI stock, in line with global averages.
Short-Term Trade Debt
A substantial share of Chinese debt claims further exists in the form of trade credit. These advances
to foreign importers of Chinese goods are likely to be short-term in nature and held by a large
variety of Chinese state-owned and private corporations. It is reported that a substantial share of
these claims is insured by China’s state-owned export credit agencies (Skarp 2015). Sinosure,
China’s leading ECA, is reported to have provided short-term coverage for 17 percent of total
Chinese exports or an equivalent of 413 billion USD in 2017 (US Ex-Im Bank 2018). While
Sinosure shares data on the geographic allocation of these claims within the context of the Berne
Union, no data on bilateral exposures is publically available. In the absence of better information,
we assume that short-term trade credit insurance is proportional to Chinese exports. From a
recipient country perspective, this implies an outstanding stock of short-term liabilities to Chinese
ECAs amounting to 17 percent of annual imports from China (short-term trade credit has maturities
of one year or less).
PBOC Swap Lines
A final form of direct Chinese lending is given through bilateral swap lines between the PBOC and
foreign central banks. Over the course of the past 10 years, the PBOC has signed swap agreements
with more than 40 foreign central banks for drawing rights amounting to 550 billion USD. We
collect data on the amount of outstanding drawing rights and on signature and expiration dates
from press releases by the PBOC and recipient central bank. While the PBOC does not publish any
data on the usage of its swap lines, an inspection of recipient central banks’ balance sheets suggests
that as of the end of 2017 only Argentina had made substantial use of its swap line by drawing
around 10.5 billion USD from China’s Central Bank.
26 This order of magnitude is similar to the share of debt instruments in the outward foreign direct investment of most OECD countries.
61
List of Sources on Other Types of Capital Flows
American Enterprise Institute and Heritage Foundation. 2019. China Global Investment Tracker (downloadable from https://www.aei.org/china-global-investment-tracker/)
Arslanalp, Serkan, and Takahiro Tsuda. 2012. Tracking Global Demand for Advanced Country Sovereign Debt. IMF Working Paper No 12/284.
State Administration of Foreign Exchage. 2019. The time series data of Balance of Payments of China (downloadable from http://www.safe.gov.cn/en/DataandStatistics/index.html)
IMF. 2019. Data Template on International Reserves and Foreign Currency Liquidity (downloadable from http://data.imf.org/?sk=2DFB3380-3603-4D2C-90BE-A04D8BBCE237)
IMF. 2019. Currency Composition of Official Foreign Exchange Reserves (downloadable from http://data.imf.org/?sk=E6A5F467-C14B-4AA8-9F6D-5A09EC4E62A4)
IMF. 2019. Coordinated Portfolio Investment Survey (downloadable from http://data.imf.org/?sk=B981B4E3-4E58-467E-9B90-9DE0C3367363)
IMF 2019. Coordinated Direct Investment Survey (downloadable from http://data.imf.org/?sk=40313609-F037-48C1-84B1-E1F1CE54D6D5)
IMF and World Bank. 2019. Quarterly External Debt Statistics (downloadable from https://datatopics.worldbank.org/debt/qeds)
Skarp, Lennart (2015). Chinese Export Credit Policies and Programmes. OECD Working Party on Export Credits and Credit Guarantees.
US Treasury International Capital (TIC) System. 2019. Multiple series (downloadable from https://www.treasury.gov/resource-center/data-chart-center/tic/Pages/index.aspx)
US Export-Import Bank. 2018. Report to the US Congress on Global Export Credit Competition. Washington DC: US Ex-Im Bank.
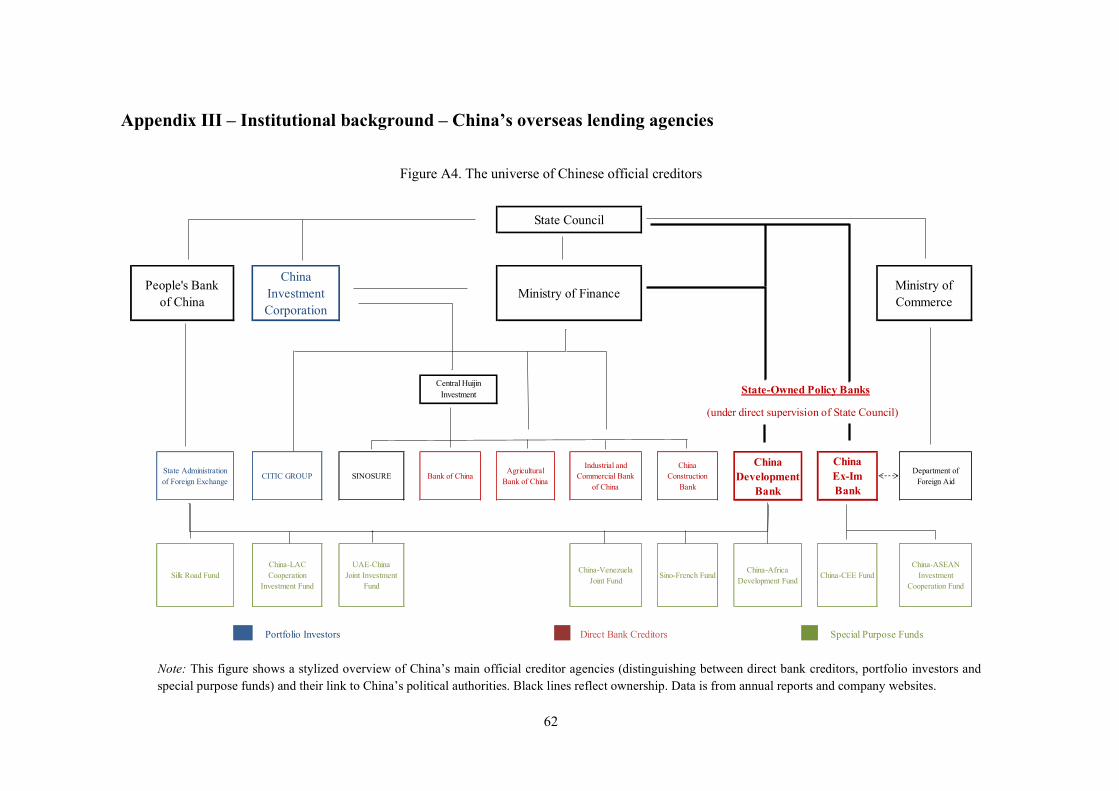
62
Appendix III – Institutional background – China’s overseas lending agencies
Figure A4. The universe of Chinese official creditors
Note: This figure shows a stylized overview of China’s main official creditor agencies (distinguishing between direct bank creditors, portfolio investors and special purpose funds) and their link to China’s political authorities. Black lines reflect ownership. Data is from annual reports and company websites.
State Administration of Foreign Exchange
CITIC GROUP SINOSURE Bank of ChinaAgricultural
Bank of China
Industrial and Commercial Bank
of China
ChinaConstruction
Bank
China Development
Bank
Silk Road FundChina-LAC Cooperation
Investment Fund
UAE-China Joint Investment
Fund
China-Venezuela Joint Fund
Sino-French FundChina-Africa
Development Fund
Portfolio Investors Direct Bank Creditors Special Purpose Funds
State Council
Ministry of Commerce
People's Bank of China
ChinaInvestmentCorporation
Central Huijin Investment
Ministry of Finance
China Ex-ImBank
Department of Foreign Aid
China-CEE FundChina-ASEAN
Investment Cooperation Fund
State-Owned Policy Banks
(under direct supervision of State Council)74%
39%
63
Figure A4 gives a stylized overview on the universe of Chinese official creditor agencies. We also show
the links and ownership structures between banks, portfolio investors, special purpose funds, and China’s
political authorities.
The two most important overseas creditors, by a large margin, are China’s two state-owned policy banks:
China Export-Import Bank and China Development Bank. Both operate under direct ownership and
supervision of the Ministry of Finance and the State Council. Figure A5 below shows that the two banks
have dominated Chinese foreign credit extension over the past decade.
In recent years, China’s four main state-owned commercial banks have also started to engage more
actively in overseas lending: the Bank of China, the Agricultural Bank of China, the Industrial and
Commercial Bank of China and the China Construction Bank. They are the world’s largest four banks as
measured by total assets and they offer a broad variety of traditional financial services. At the same time,
these banks emphasize their role in furthering China’s national interest, e.g. by promoting Renminbi
internationalization and by acting as the “financial artery” of the Belt and Road Initiative (see for example
the annual reports of the Bank of China). Over the course of the past decade, their foreign asset holdings
have risen rapidly, largely driven by lending through Hong Kong and other foreign affiliates. The four
banks are likely to hold a substantial part of China’s 919 billion USD of bank claims on other emerging
market economics (Cerutti et al. 2018).
China’s foreign portfolio investments are primarily carried out by three funds. First, the State
Administration of Foreign Exchange (SAFE), a subdivision of the People’s Bank of China, which is in
charge of managing China’s official foreign exchange reserves. Second, CITIC Group and, third, the
China Investment Corporation (CIC), China’s official sovereign wealth fund that was established to
diversify China’s foreign exchange reserve holdings. Both the CITIC and CIC funds now hold broad and
diversified international portfolios. Through a subsidiary, Central Huijin Investment, CIC also holds
majority stakes in Sinosure, China’s main Export Credit Agency, and in China’s four largest commercial
banks.
Finally, China Ex-Im Bank and China Development Bank manage a diverse group of special purpose
funds, each with a narrower geographic mandate. Most of these funds were set up in cooperation with
recipient countries and invest in foreign corporations via equity flows. Traditionally, these special funds
focused on developing and middle-income countries, but in the past five years have increasingly been set
up in advanced countries.
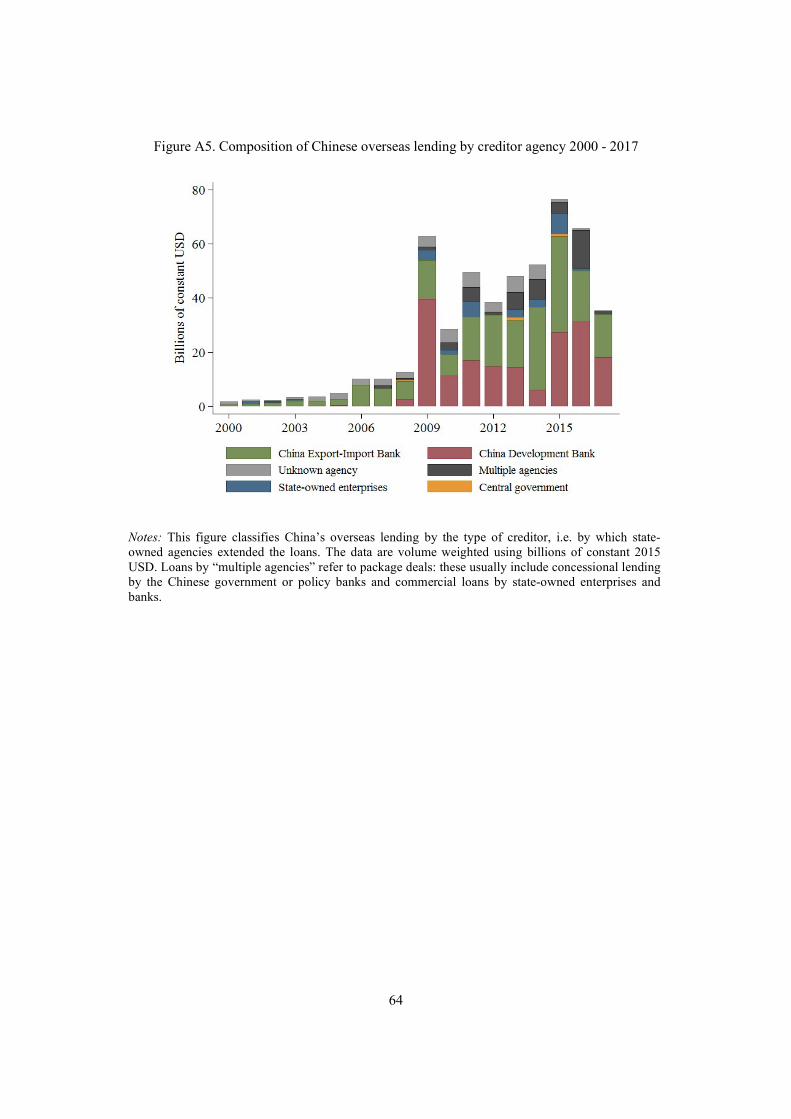
64
Figure A5. Composition of Chinese overseas lending by creditor agency 2000 - 2017
Notes: This figure classifies China’s overseas lending by the type of creditor, i.e. by which state-owned agencies extended the loans. The data are volume weighted using billions of constant 2015 USD. Loans by “multiple agencies” refer to package deals: these usually include concessional lending by the Chinese government or policy banks and commercial loans by state-owned enterprises and banks.