Embed Size (px)
Citation preview
DISCLOSURE APPENDIX AT THE BACK OF THIS REPORT CONTAINS IMPORTANT DISCLOSURES, ANALYST CERTIFICATIONS, AND THE STATUS OF NON-US ANALYSTS. US Disclosure: Credit Suisse does and seeks to do business with companies covered in its research reports. As a result, investors should be aware that the Firm may have a conflict of interest that could affect the objectivity of this report. Investors should consider this report as only a single factor in making their investment decision.
CREDIT SUISSE SECURITIES RESEARCH & ANALYTICS BEYOND INFORMATION®
Client-Driven Solutions, Insights, and Access
28 July 2015
Asia Pacific/China
Equity Research
Automobile Distributors
China Harmony New Energy Auto Holding Limited (3836.HK / 3836 HK)
INITIATION
From luxury dealer to high-end EV maker
■ Initiating with OUTPERFORM and a TP of HK$8.80 implying a 42% potential upside. Harmony Auto, a leading luxury dealer group in China, is transforming into a new energy vehicle (NEV) maker. It has tied up with Foxconn and Tencent and has acquired an 88% stake in Greenfield Motor (a NEV maker). Although the traditional car dealership operation remains the major near-term earnings contributor (97-99% in 2016-17) for Harmony, we think its new NEV operation is likely to provide it a decent long-term growth potential. After the 47% correction from its last peak, the stock is trading at 12.6/9x 2015/16E P/E and its risk-reward potential looks attractive.
■ Aftersales income to jump on expanding independent service network. By doubling its independent luxury car service centers from 43 in 2014 to 80 in 2015, Harmony auto has been able to capture the fast-growing luxury vehicles service and emerging electric vehicles after-sales market growth, resulting in a 40% earnings CAGR from independent service centers. The company thinks it
can offer outstanding balance between aftersales service quality and price.
■ The ambitious alliance is aiming to break into high-end EV market. We understand there are quite a few EV new entrants, but Foxconn-Tencent-Harmony alliance is most likely to work out, in our view. Our confidence stems from Foxconn's well-developed EV component supply chain, Tencent's internet expertise, and Harmony's dealership network. High-end EV operation is estimated to book Rmb408/974 mn in profit in 2019/20E after Rmb288 mn in
loss in 2018.
■ Valuation. Our HK$8.80 target price is DCF-based, as simple multiples cannot fully exhibit dealer business' long-term earnings power and Harmony's new endeavour in the electric vehicle market. Key risk: Weaker-than-expected
luxury car demand may ignite a price war, hurting dealers' margins.
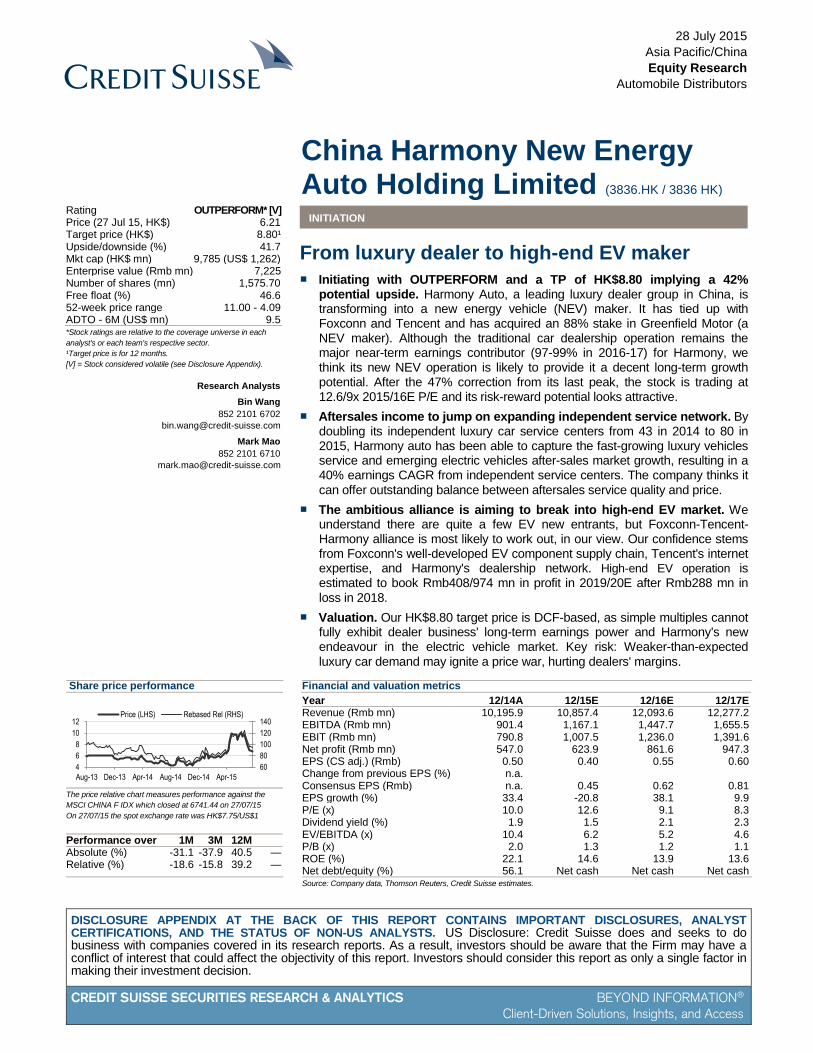
Share price performance
60
80
100
120
140
4
6
8
10
12
Aug-13 Dec-13 Apr-14 Aug-14 Dec-14 Apr-15
Price (LHS) Rebased Rel (RHS)
The price relative chart measures performance against the
MSCI CHINA F IDX which closed at 6741.44 on 27/07/15
On 27/07/15 the spot exchange rate was HK$7.75/US$1
Performance over 1M 3M 12M Absolute (%) -31.1 -37.9 40.5 — Relative (%) -18.6 -15.8 39.2 —
Financial and valuation metrics
Year 12/14A 12/15E 12/16E 12/17E Revenue (Rmb mn) 10,195.9 10,857.4 12,093.6 12,277.2 EBITDA (Rmb mn) 901.4 1,167.1 1,447.7 1,655.5 EBIT (Rmb mn) 790.8 1,007.5 1,236.0 1,391.6 Net profit (Rmb mn) 547.0 623.9 861.6 947.3 EPS (CS adj.) (Rmb) 0.50 0.40 0.55 0.60 Change from previous EPS (%) n.a. Consensus EPS (Rmb) n.a. 0.45 0.62 0.81 EPS growth (%) 33.4 -20.8 38.1 9.9 P/E (x) 10.0 12.6 9.1 8.3 Dividend yield (%) 1.9 1.5 2.1 2.3 EV/EBITDA (x) 10.4 6.2 5.2 4.6 P/B (x) 2.0 1.3 1.2 1.1 ROE (%) 22.1 14.6 13.9 13.6 Net debt/equity (%) 56.1 Net cash Net cash Net cash
Source: Company data, Thomson Reuters, Credit Suisse estimates.
Rating OUTPERFORM* [V] Price (27 Jul 15, HK$) 6.21 Target price (HK$) 8.80¹ Upside/downside (%) 41.7 Mkt cap (HK$ mn) 9,785 (US$ 1,262) Enterprise value (Rmb mn) 7,225 Number of shares (mn) 1,575.70 Free float (%) 46.6 52-week price range 11.00 - 4.09 ADTO - 6M (US$ mn) 9.5
*Stock ratings are relative to the coverage universe in each
analyst's or each team's respective sector.
¹Target price is for 12 months.
[V] = Stock considered volatile (see Disclosure Appendix).
Research Analysts
Bin Wang
852 2101 6702
Mark Mao
852 2101 6710
28 July 2015
China Harmony New Energy Auto Holding Limited (3836.HK / 3836 HK) 2
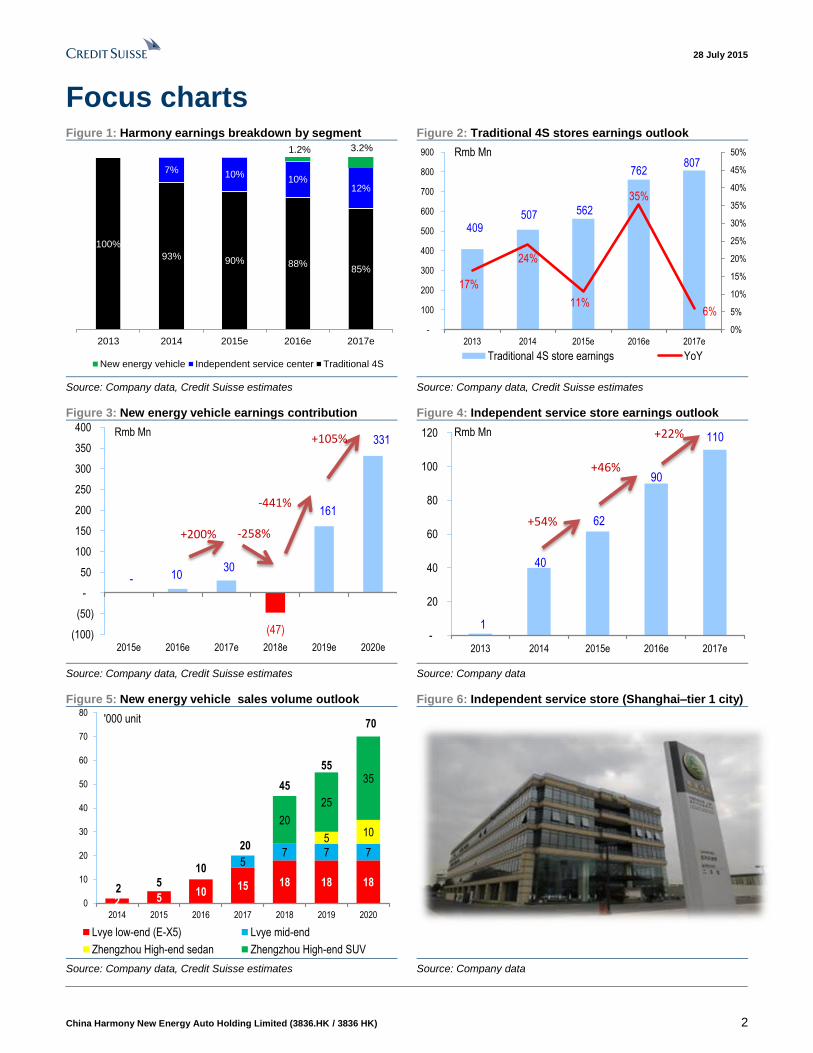
Focus charts Figure 1: Harmony earnings breakdown by segment Figure 2: Traditional 4S stores earnings outlook
100%
93% 90% 88%85%
7% 10%10%
12%
1.2% 3.2%
2013 2014 2015e 2016e 2017e
New energy vehicle Independent service center Traditional 4S
409 507 562
762 807
17%
24%
11%
35%
6%
0%
5%
10%
15%
20%
25%
30%
35%
40%
45%
50%
-
100
200
300
400
500
600
700
800
900
2013 2014 2015e 2016e 2017e
Rmb Mn
Traditional 4S store earnings YoY
Source: Company data, Credit Suisse estimates Source: Company data, Credit Suisse estimates
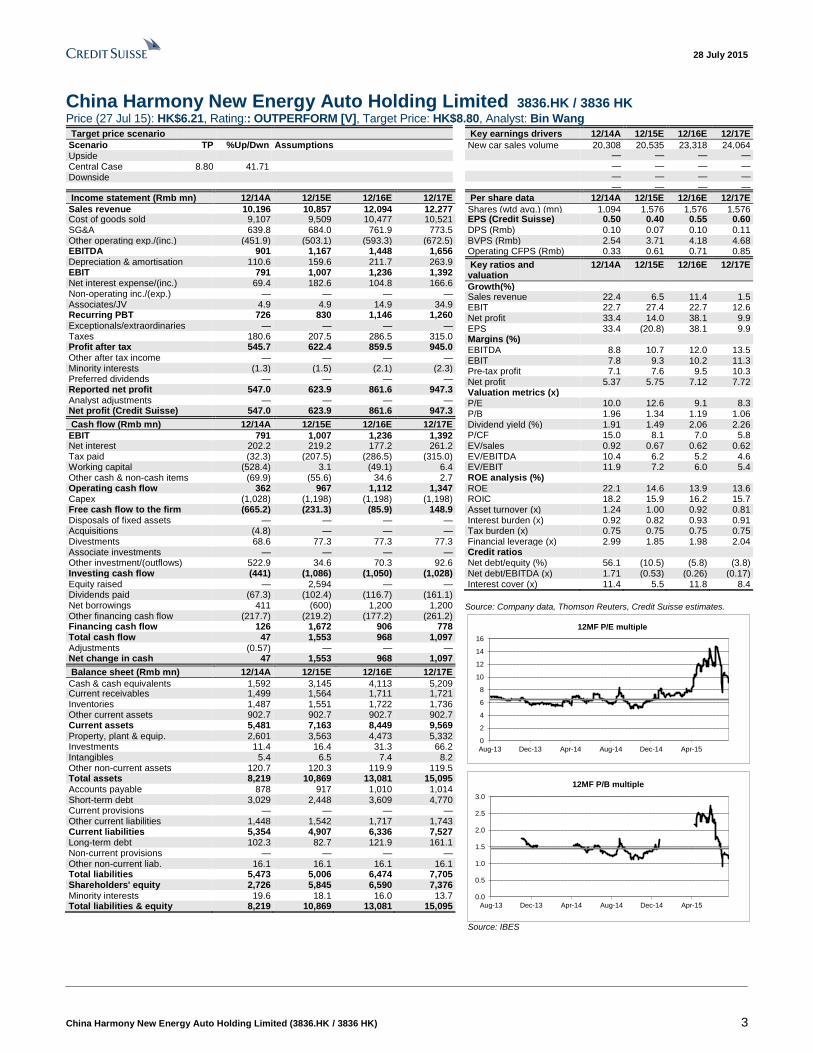
Figure 3: New energy vehicle earnings contribution Figure 4: Independent service store earnings outlook
- 10 30
(47)
161
331
(100)
(50)
-
50
100
150
200
250
300
350
400
2015e 2016e 2017e 2018e 2019e 2020e
Rmb Mn
+200% -258%
-441%
+105%
1
40
62
90
110
-
20
40
60
80
100
120
2013 2014 2015e 2016e 2017e
Rmb Mn
+54%
+46%
+22%
Source: Company data, Credit Suisse estimates Source: Company data
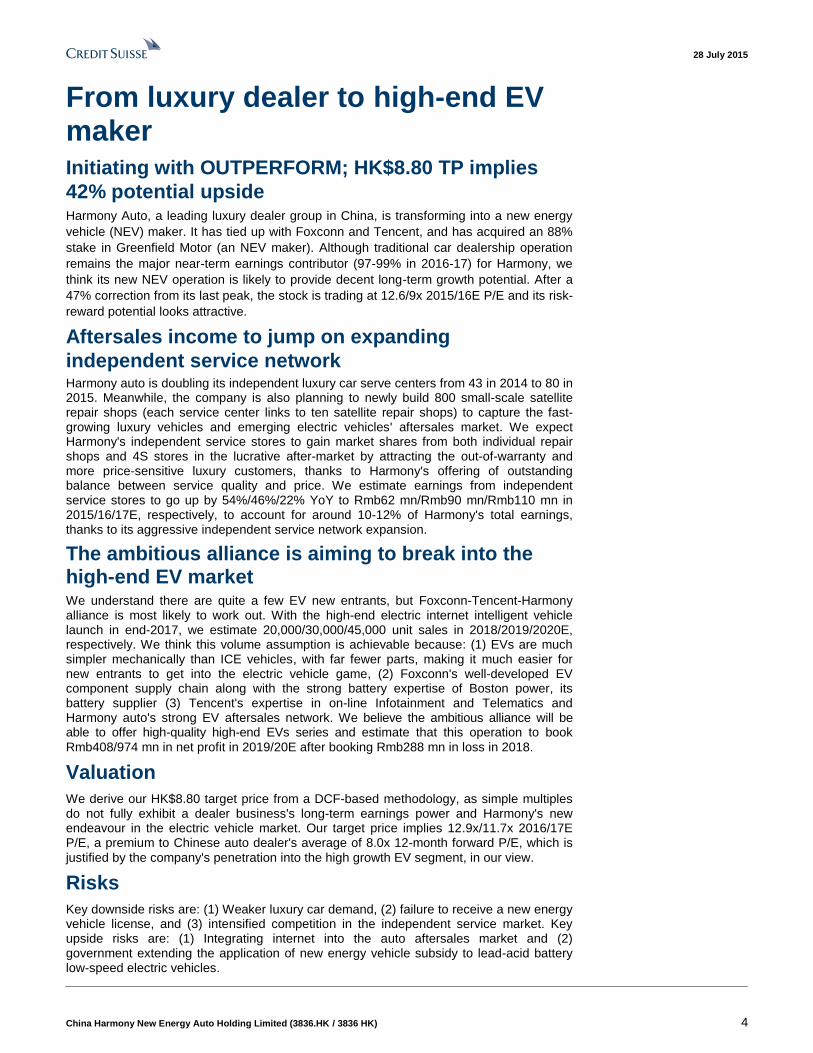
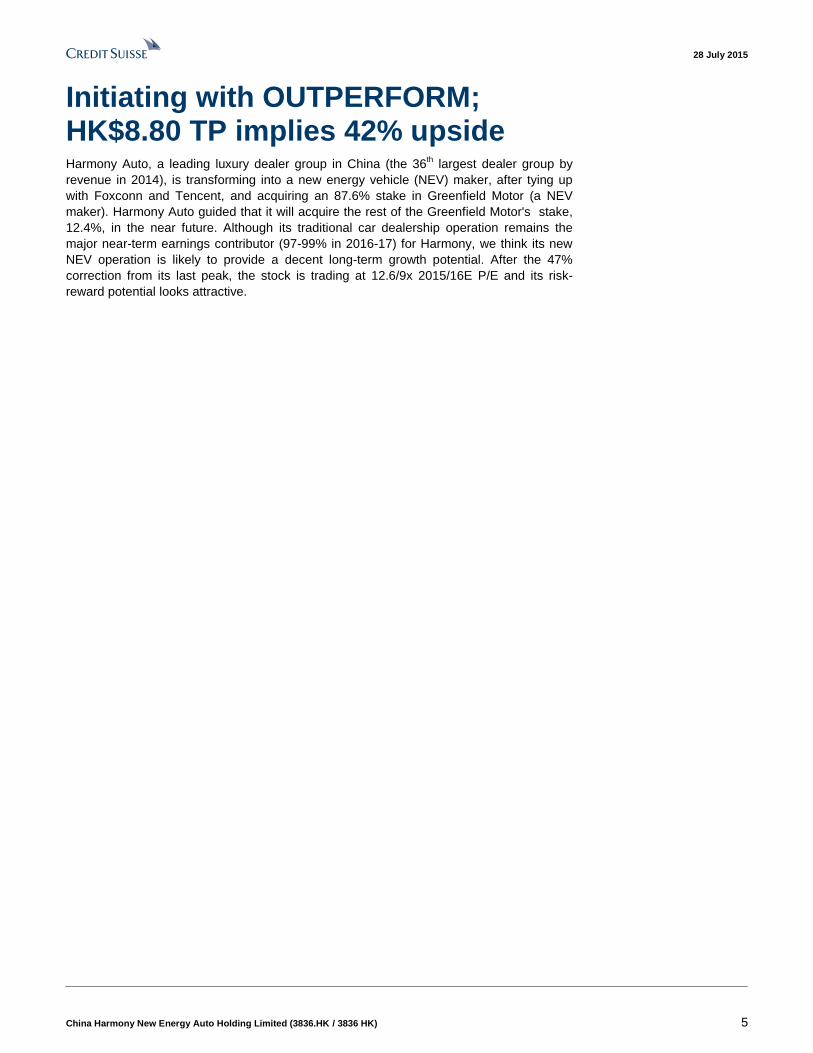
Figure 5: New energy vehicle sales volume outlook Figure 6: Independent service store (Shanghai–tier 1 city)
2 510
15 18 18 18
57 7 7
510
20
25
35
25
10
20
45
55
70
0
10
20
30
40
50
60
70
80
2014 2015 2016 2017 2018 2019 2020
'000 unit
Lvye low-end (E-X5) Lvye mid-end
Zhengzhou High-end sedan Zhengzhou High-end SUV
Source: Company data, Credit Suisse estimates Source: Company data
28 July 2015
China Harmony New Energy Auto Holding Limited (3836.HK / 3836 HK) 3
China Harmony New Energy Auto Holding Limited 3836.HK / 3836 HK Price (27 Jul 15): HK$6.21, Rating:: OUTPERFORM [V], Target Price: HK$8.80, Analyst: Bin Wang
Target price scenario
Scenario TP %Up/Dwn Assumptions Upside Central Case 8.80 41.71 Downside
Key earnings drivers 12/14A 12/15E 12/16E 12/17E
New car sales volume 20,308 20,535 23,318 24,064 — — — — — — — — — — — — — — — —
Income statement (Rmb mn) 12/14A 12/15E 12/16E 12/17E
Sales revenue 10,196 10,857 12,094 12,277 Cost of goods sold 9,107 9,509 10,477 10,521 SG&A 639.8 684.0 761.9 773.5 Other operating exp./(inc.) (451.9) (503.1) (593.3) (672.5) EBITDA 901 1,167 1,448 1,656 Depreciation & amortisation 110.6 159.6 211.7 263.9 EBIT 791 1,007 1,236 1,392 Net interest expense/(inc.) 69.4 182.6 104.8 166.6 Non-operating inc./(exp.) — — — — Associates/JV 4.9 4.9 14.9 34.9 Recurring PBT 726 830 1,146 1,260 Exceptionals/extraordinaries — — — — Taxes 180.6 207.5 286.5 315.0 Profit after tax 545.7 622.4 859.5 945.0 Other after tax income — — — — Minority interests (1.3) (1.5) (2.1) (2.3) Preferred dividends — — — — Reported net profit 547.0 623.9 861.6 947.3 Analyst adjustments — — — — Net profit (Credit Suisse) 547.0 623.9 861.6 947.3
Cash flow (Rmb mn) 12/14A 12/15E 12/16E 12/17E
EBIT 791 1,007 1,236 1,392 Net interest 202.2 219.2 177.2 261.2 Tax paid (32.3) (207.5) (286.5) (315.0) Working capital (528.4) 3.1 (49.1) 6.4 Other cash & non-cash items (69.9) (55.6) 34.6 2.7 Operating cash flow 362 967 1,112 1,347 Capex (1,028) (1,198) (1,198) (1,198) Free cash flow to the firm (665.2) (231.3) (85.9) 148.9 Disposals of fixed assets — — — — Acquisitions (4.8) — — — Divestments 68.6 77.3 77.3 77.3 Associate investments — — — — Other investment/(outflows) 522.9 34.6 70.3 92.6 Investing cash flow (441) (1,086) (1,050) (1,028) Equity raised — 2,594 — — Dividends paid (67.3) (102.4) (116.7) (161.1) Net borrowings 411 (600) 1,200 1,200 Other financing cash flow (217.7) (219.2) (177.2) (261.2) Financing cash flow 126 1,672 906 778 Total cash flow 47 1,553 968 1,097 Adjustments (0.57) — — — Net change in cash 47 1,553 968 1,097
Balance sheet (Rmb mn) 12/14A 12/15E 12/16E 12/17E
Cash & cash equivalents 1,592 3,145 4,113 5,209 Current receivables 1,499 1,564 1,711 1,721 Inventories 1,487 1,551 1,722 1,736 Other current assets 902.7 902.7 902.7 902.7 Current assets 5,481 7,163 8,449 9,569 Property, plant & equip. 2,601 3,563 4,473 5,332 Investments 11.4 16.4 31.3 66.2 Intangibles 5.4 6.5 7.4 8.2 Other non-current assets 120.7 120.3 119.9 119.5 Total assets 8,219 10,869 13,081 15,095 Accounts payable 878 917 1,010 1,014 Short-term debt 3,029 2,448 3,609 4,770 Current provisions — — — — Other current liabilities 1,448 1,542 1,717 1,743 Current liabilities 5,354 4,907 6,336 7,527 Long-term debt 102.3 82.7 121.9 161.1 Non-current provisions — — — — Other non-current liab. 16.1 16.1 16.1 16.1 Total liabilities 5,473 5,006 6,474 7,705 Shareholders' equity 2,726 5,845 6,590 7,376 Minority interests 19.6 18.1 16.0 13.7 Total liabilities & equity 8,219 10,869 13,081 15,095
Per share data 12/14A 12/15E 12/16E 12/17E
Shares (wtd avg.) (mn) 1,094 1,576 1,576 1,576 EPS (Credit Suisse) (Rmb)
0.50 0.40 0.55 0.60 DPS (Rmb) 0.10 0.07 0.10 0.11 BVPS (Rmb) 2.54 3.71 4.18 4.68 Operating CFPS (Rmb) 0.33 0.61 0.71 0.85
Key ratios and valuation
12/14A 12/15E 12/16E 12/17E
Growth(%) Sales revenue 22.4 6.5 11.4 1.5 EBIT 22.7 27.4 22.7 12.6 Net profit 33.4 14.0 38.1 9.9 EPS 33.4 (20.8) 38.1 9.9 Margins (%)
EBITDA 8.8 10.7 12.0 13.5 EBIT 7.8 9.3 10.2 11.3 Pre-tax profit 7.1 7.6 9.5 10.3 Net profit 5.37 5.75 7.12 7.72 Valuation metrics (x) P/E 10.0 12.6 9.1 8.3 P/B 1.96 1.34 1.19 1.06 Dividend yield (%) 1.91 1.49 2.06 2.26 P/CF 15.0 8.1 7.0 5.8 EV/sales 0.92 0.67 0.62 0.62 EV/EBITDA 10.4 6.2 5.2 4.6 EV/EBIT 11.9 7.2 6.0 5.4 ROE analysis (%) ROE 22.1 14.6 13.9 13.6 ROIC 18.2 15.9 16.2 15.7 Asset turnover (x) 1.24 1.00 0.92 0.81 Interest burden (x) 0.92 0.82 0.93 0.91 Tax burden (x) 0.75 0.75 0.75 0.75 Financial leverage (x) 2.99 1.85 1.98 2.04 Credit ratios Net debt/equity (%) 56.1 (10.5) (5.8) (3.8) Net debt/EBITDA (x) 1.71 (0.53) (0.26) (0.17) Interest cover (x) 11.4 5.5 11.8 8.4
Source: Company data, Thomson Reuters, Credit Suisse estimates.
0
2
4
6
8
10
12
14
16
Aug-13 Dec-13 Apr-14 Aug-14 Dec-14 Apr-15
12MF P/E multiple
0.0
0.5
1.0
1.5
2.0
2.5
3.0
Aug-13 Dec-13 Apr-14 Aug-14 Dec-14 Apr-15
12MF P/B multiple
Source: IBES
28 July 2015
China Harmony New Energy Auto Holding Limited (3836.HK / 3836 HK) 4
From luxury dealer to high-end EV maker Initiating with OUTPERFORM; HK$8.80 TP implies
42% potential upside Harmony Auto, a leading luxury dealer group in China, is transforming into a new energy
vehicle (NEV) maker. It has tied up with Foxconn and Tencent, and has acquired an 88%
stake in Greenfield Motor (an NEV maker). Although traditional car dealership operation
remains the major near-term earnings contributor (97-99% in 2016-17) for Harmony, we
think its new NEV operation is likely to provide decent long-term growth potential. After a
47% correction from its last peak, the stock is trading at 12.6/9x 2015/16E P/E and its risk-
reward potential looks attractive.
Aftersales income to jump on expanding
independent service network Harmony auto is doubling its independent luxury car serve centers from 43 in 2014 to 80 in 2015. Meanwhile, the company is also planning to newly build 800 small-scale satellite repair shops (each service center links to ten satellite repair shops) to capture the fast-growing luxury vehicles and emerging electric vehicles' aftersales market. We expect Harmony's independent service stores to gain market shares from both individual repair shops and 4S stores in the lucrative after-market by attracting the out-of-warranty and more price-sensitive luxury customers, thanks to Harmony's offering of outstanding balance between service quality and price. We estimate earnings from independent service stores to go up by 54%/46%/22% YoY to Rmb62 mn/Rmb90 mn/Rmb110 mn in 2015/16/17E, respectively, to account for around 10-12% of Harmony's total earnings, thanks to its aggressive independent service network expansion.
The ambitious alliance is aiming to break into the high-end EV market We understand there are quite a few EV new entrants, but Foxconn-Tencent-Harmony alliance is most likely to work out. With the high-end electric internet intelligent vehicle launch in end-2017, we estimate 20,000/30,000/45,000 unit sales in 2018/2019/2020E, respectively. We think this volume assumption is achievable because: (1) EVs are much simpler mechanically than ICE vehicles, with far fewer parts, making it much easier for new entrants to get into the electric vehicle game, (2) Foxconn's well-developed EV component supply chain along with the strong battery expertise of Boston power, its battery supplier (3) Tencent's expertise in on-line Infotainment and Telematics and Harmony auto's strong EV aftersales network. We believe the ambitious alliance will be able to offer high-quality high-end EVs series and estimate that this operation to book
Rmb408/974 mn in net profit in 2019/20E after booking Rmb288 mn in loss in 2018.
Valuation
We derive our HK$8.80 target price from a DCF-based methodology, as simple multiples do not fully exhibit a dealer business's long-term earnings power and Harmony's new endeavour in the electric vehicle market. Our target price implies 12.9x/11.7x 2016/17E P/E, a premium to Chinese auto dealer's average of 8.0x 12-month forward P/E, which is
justified by the company's penetration into the high growth EV segment, in our view.
Risks
Key downside risks are: (1) Weaker luxury car demand, (2) failure to receive a new energy vehicle license, and (3) intensified competition in the independent service market. Key upside risks are: (1) Integrating internet into the auto aftersales market and (2) government extending the application of new energy vehicle subsidy to lead-acid battery low-speed electric vehicles.
28 July 2015
China Harmony New Energy Auto Holding Limited (3836.HK / 3836 HK) 5
Initiating with OUTPERFORM; HK$8.80 TP implies 42% upside Harmony Auto, a leading luxury dealer group in China (the 36
th largest dealer group by
revenue in 2014), is transforming into a new energy vehicle (NEV) maker, after tying up
with Foxconn and Tencent, and acquiring an 87.6% stake in Greenfield Motor (a NEV
maker). Harmony Auto guided that it will acquire the rest of the Greenfield Motor's stake,
12.4%, in the near future. Although its traditional car dealership operation remains the
major near-term earnings contributor (97-99% in 2016-17) for Harmony, we think its new
NEV operation is likely to provide a decent long-term growth potential. After the 47%
correction from its last peak, the stock is trading at 12.6/9x 2015/16E P/E and its risk-
reward potential looks attractive.
28 July 2015
China Harmony New Energy Auto Holding Limited (3836.HK / 3836 HK) 6
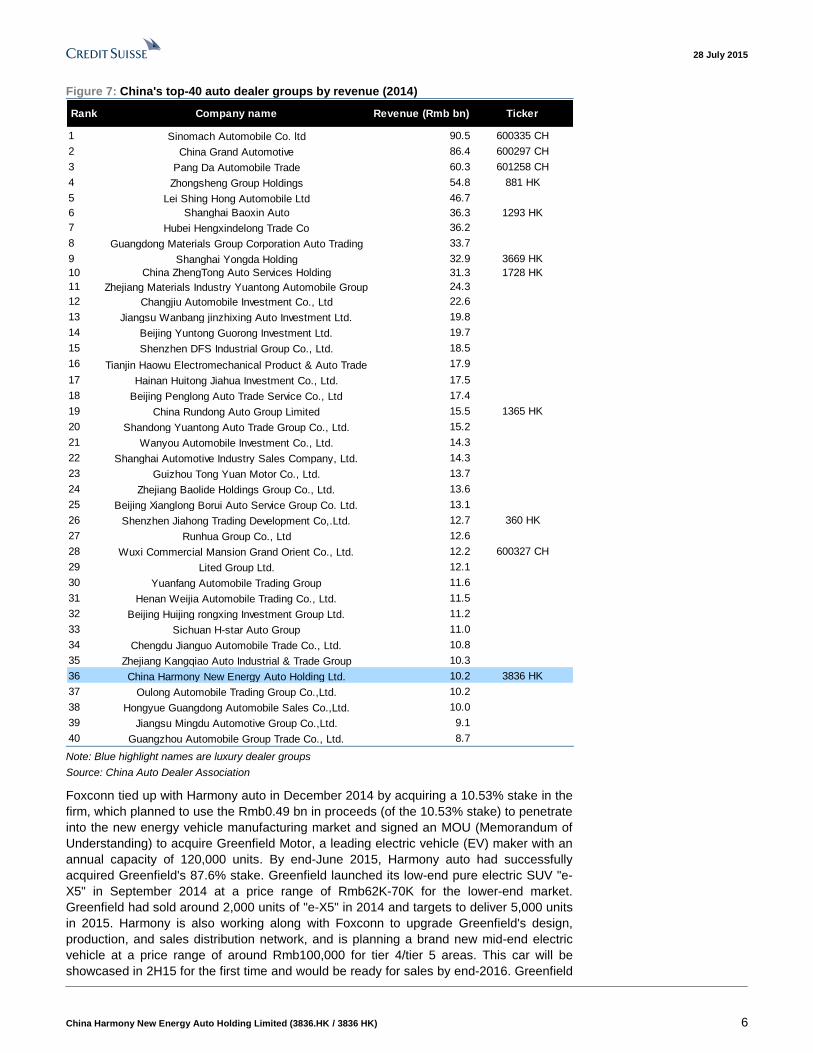
Figure 7: China's top-40 auto dealer groups by revenue (2014)
Rank Company name Revenue (Rmb bn) Ticker
1 Sinomach Automobile Co. ltd 90.5 600335 CH
2 China Grand Automotive 86.4 600297 CH
3 Pang Da Automobile Trade 60.3 601258 CH
4 Zhongsheng Group Holdings 54.8 881 HK
5 Lei Shing Hong Automobile Ltd 46.7
6 Shanghai Baoxin Auto 36.3 1293 HK
7 Hubei Hengxindelong Trade Co 36.2
8 Guangdong Materials Group Corporation Auto Trading 33.7
9 Shanghai Yongda Holding 32.9 3669 HK
10 China ZhengTong Auto Services Holding 31.3 1728 HK
11 Zhejiang Materials Industry Yuantong Automobile Group 24.3
12 Changjiu Automobile Investment Co., Ltd 22.6
13 Jiangsu Wanbang jinzhixing Auto Investment Ltd. 19.8
14 Beijing Yuntong Guorong Investment Ltd. 19.7
15 Shenzhen DFS Industrial Group Co., Ltd. 18.5
16 Tianjin Haowu Electromechanical Product & Auto Trade 17.9
17 Hainan Huitong Jiahua Investment Co., Ltd. 17.5
18 Beijing Penglong Auto Trade Service Co., Ltd 17.4
19 China Rundong Auto Group Limited 15.5 1365 HK
20 Shandong Yuantong Auto Trade Group Co., Ltd. 15.2
21 Wanyou Automobile Investment Co., Ltd. 14.3
22 Shanghai Automotive Industry Sales Company, Ltd. 14.3
23 Guizhou Tong Yuan Motor Co., Ltd. 13.7
24 Zhejiang Baolide Holdings Group Co., Ltd. 13.6
25 Beijing Xianglong Borui Auto Service Group Co. Ltd. 13.1
26 Shenzhen Jiahong Trading Development Co,.Ltd. 12.7 360 HK
27 Runhua Group Co., Ltd 12.6
28 Wuxi Commercial Mansion Grand Orient Co., Ltd. 12.2 600327 CH
29 Lited Group Ltd. 12.1
30 Yuanfang Automobile Trading Group 11.6
31 Henan Weijia Automobile Trading Co., Ltd. 11.5
32 Beijing Huijing rongxing Investment Group Ltd. 11.2
33 Sichuan H-star Auto Group 11.0
34 Chengdu Jianguo Automobile Trade Co., Ltd. 10.8
35 Zhejiang Kangqiao Auto Industrial & Trade Group 10.3
36 China Harmony New Energy Auto Holding Ltd. 10.2 3836 HK
37 Oulong Automobile Trading Group Co.,Ltd. 10.2
38 Hongyue Guangdong Automobile Sales Co.,Ltd. 10.0
39 Jiangsu Mingdu Automotive Group Co.,Ltd. 9.1
40 Guangzhou Automobile Group Trade Co., Ltd. 8.7 Note: Blue highlight names are luxury dealer groups
Source: China Auto Dealer Association
Foxconn tied up with Harmony auto in December 2014 by acquiring a 10.53% stake in the
firm, which planned to use the Rmb0.49 bn in proceeds (of the 10.53% stake) to penetrate
into the new energy vehicle manufacturing market and signed an MOU (Memorandum of
Understanding) to acquire Greenfield Motor, a leading electric vehicle (EV) maker with an
annual capacity of 120,000 units. By end-June 2015, Harmony auto had successfully
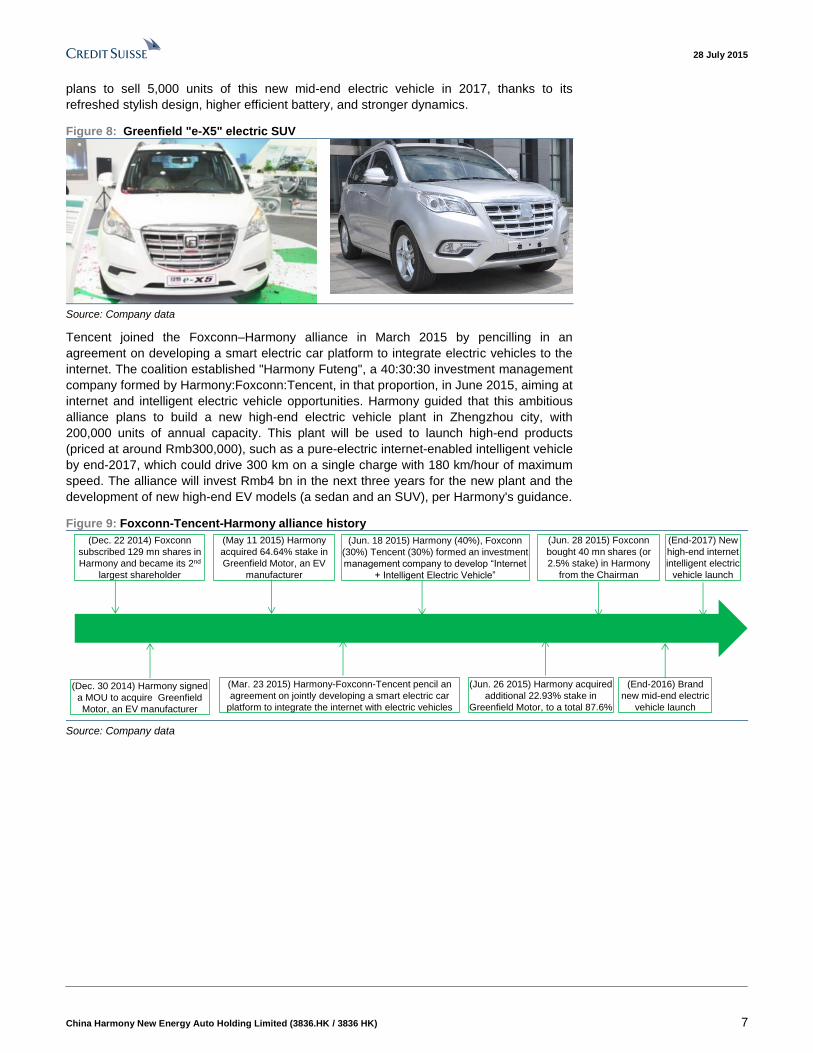
acquired Greenfield's 87.6% stake. Greenfield launched its low-end pure electric SUV "e-
X5" in September 2014 at a price range of Rmb62K-70K for the lower-end market.
Greenfield had sold around 2,000 units of "e-X5" in 2014 and targets to deliver 5,000 units
in 2015. Harmony is also working along with Foxconn to upgrade Greenfield's design,
production, and sales distribution network, and is planning a brand new mid-end electric
vehicle at a price range of around Rmb100,000 for tier 4/tier 5 areas. This car will be
showcased in 2H15 for the first time and would be ready for sales by end-2016. Greenfield
28 July 2015
China Harmony New Energy Auto Holding Limited (3836.HK / 3836 HK) 7
plans to sell 5,000 units of this new mid-end electric vehicle in 2017, thanks to its
refreshed stylish design, higher efficient battery, and stronger dynamics.
Figure 8: Greenfield "e-X5" electric SUV
Source: Company data
Tencent joined the Foxconn–Harmony alliance in March 2015 by pencilling in an
agreement on developing a smart electric car platform to integrate electric vehicles to the
internet. The coalition established "Harmony Futeng", a 40:30:30 investment management
company formed by Harmony:Foxconn:Tencent, in that proportion, in June 2015, aiming at
internet and intelligent electric vehicle opportunities. Harmony guided that this ambitious
alliance plans to build a new high-end electric vehicle plant in Zhengzhou city, with
200,000 units of annual capacity. This plant will be used to launch high-end products
(priced at around Rmb300,000), such as a pure-electric internet-enabled intelligent vehicle
by end-2017, which could drive 300 km on a single charge with 180 km/hour of maximum
speed. The alliance will invest Rmb4 bn in the next three years for the new plant and the
development of new high-end EV models (a sedan and an SUV), per Harmony's guidance.
Figure 9: Foxconn-Tencent-Harmony alliance history
(Dec. 22 2014) Foxconn
subscribed 129 mn shares in
Harmony and became its 2nd
largest shareholder
(May 11 2015) Harmony
acquired 64.64% stake in
Greenfield Motor, an EV
manufacturer
(Jun. 26 2015) Harmony acquired
additional 22.93% stake in
Greenfield Motor, to a total 87.6%
(Jun. 18 2015) Harmony (40%), Foxconn
(30%) Tencent (30%) formed an investment
management company to develop “Internet
+ Intelligent Electric Vehicle”
(Jun. 28 2015) Foxconn
bought 40 mn shares (or
2.5% stake) in Harmony
from the Chairman
(Dec. 30 2014) Harmony signed
a MOU to acquire Greenfield
Motor, an EV manufacturer
(Mar. 23 2015) Harmony-Foxconn-Tencent pencil an
agreement on jointly developing a smart electric car
platform to integrate the internet with electric vehicles
(End-2016) Brand
new mid-end electric
vehicle launch
(End-2017) New
high-end internet
intelligent electric
vehicle launch
Source: Company data
28 July 2015
China Harmony New Energy Auto Holding Limited (3836.HK / 3836 HK) 8
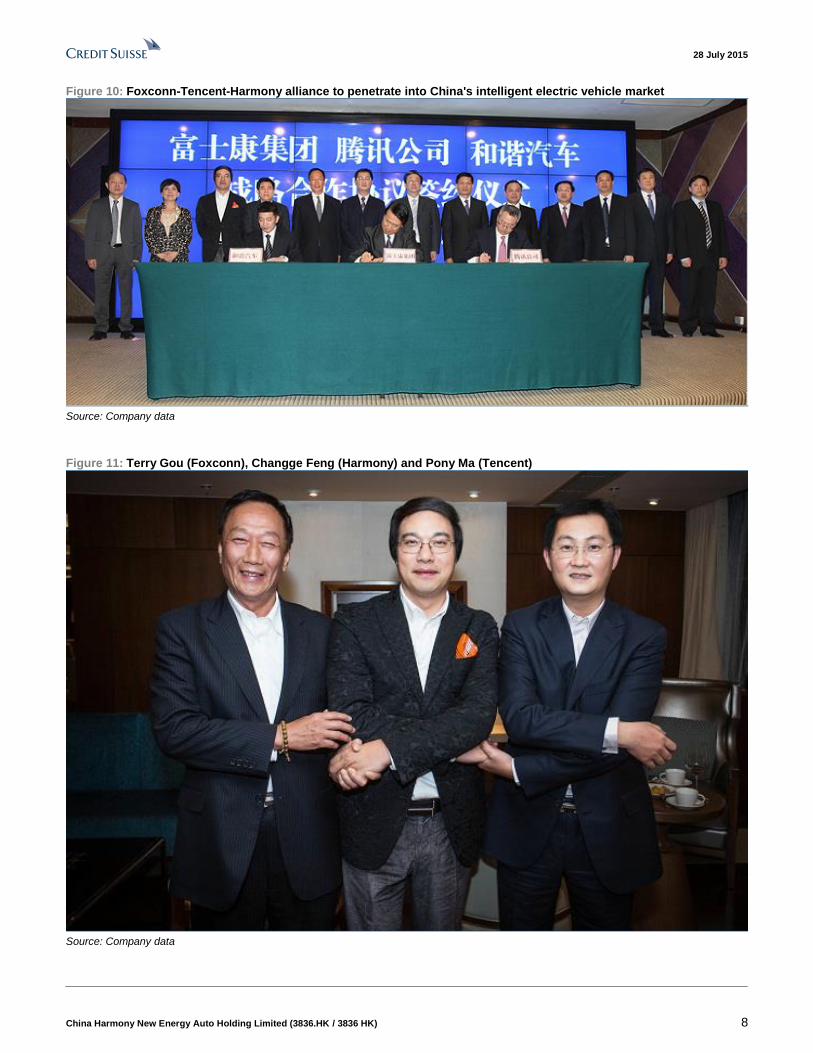
Figure 10: Foxconn-Tencent-Harmony alliance to penetrate into China's intelligent electric vehicle market
Source: Company data
Figure 11: Terry Gou (Foxconn), Changge Feng (Harmony) and Pony Ma (Tencent)
Source: Company data
28 July 2015
China Harmony New Energy Auto Holding Limited (3836.HK / 3836 HK) 9
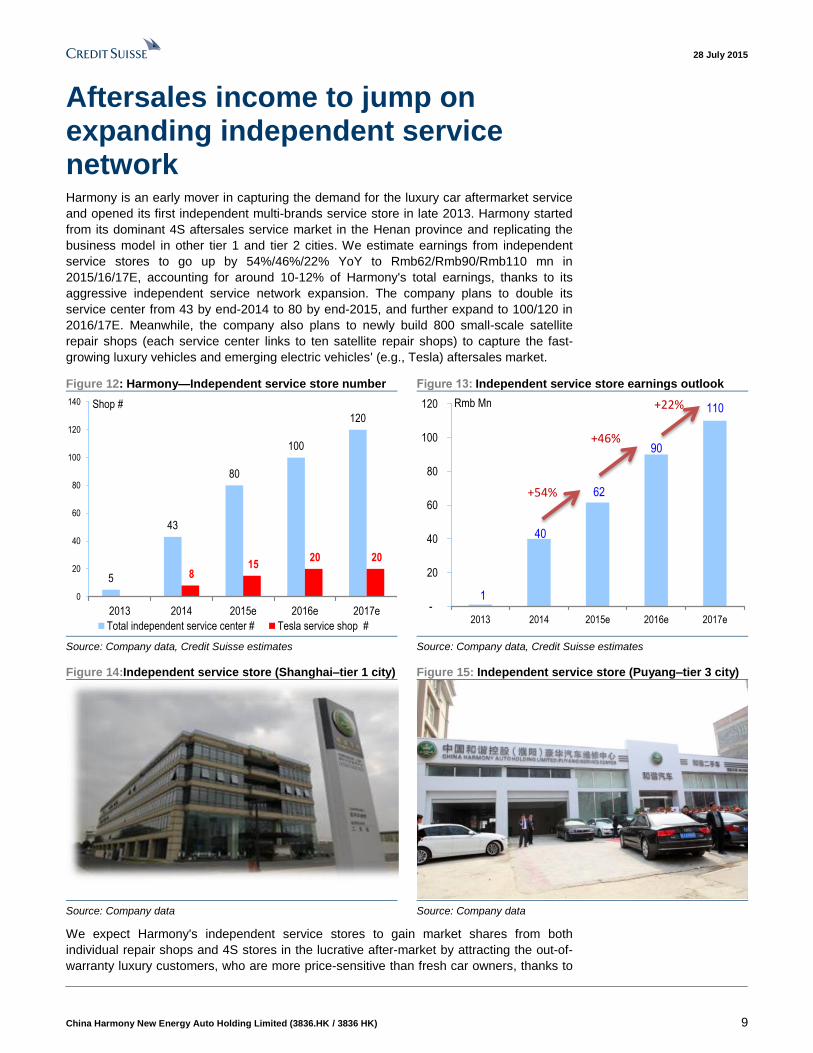
Aftersales income to jump on expanding independent service network Harmony is an early mover in capturing the demand for the luxury car aftermarket service
and opened its first independent multi-brands service store in late 2013. Harmony started
from its dominant 4S aftersales service market in the Henan province and replicating the
business model in other tier 1 and tier 2 cities. We estimate earnings from independent
service stores to go up by 54%/46%/22% YoY to Rmb62/Rmb90/Rmb110 mn in
2015/16/17E, accounting for around 10-12% of Harmony's total earnings, thanks to its
aggressive independent service network expansion. The company plans to double its
service center from 43 by end-2014 to 80 by end-2015, and further expand to 100/120 in
2016/17E. Meanwhile, the company also plans to newly build 800 small-scale satellite
repair shops (each service center links to ten satellite repair shops) to capture the fast-
growing luxury vehicles and emerging electric vehicles' (e.g., Tesla) aftersales market.
Figure 12: Harmony—Independent service store number Figure 13: Independent service store earnings outlook
5
43
80
100
120
8 15
20 20
0
20
40
60
80
100
120
140
2013 2014 2015e 2016e 2017e
Shop #
Total independent service center # Tesla service shop #
1
40
62
90
110
-
20
40
60
80
100
120
2013 2014 2015e 2016e 2017e
Rmb Mn
+54%
+46%
+22%
Source: Company data, Credit Suisse estimates Source: Company data, Credit Suisse estimates
Figure 14:Independent service store (Shanghai–tier 1 city) Figure 15: Independent service store (Puyang–tier 3 city)
Source: Company data Source: Company data
We expect Harmony's independent service stores to gain market shares from both
individual repair shops and 4S stores in the lucrative after-market by attracting the out-of-
warranty luxury customers, who are more price-sensitive than fresh car owners, thanks to
28 July 2015
China Harmony New Energy Auto Holding Limited (3836.HK / 3836 HK) 10
Harmony's reputation for service quality and price. Meanwhile, we expect a rising demand
for new energy vehicle aftersales service to help Harmony capture the emerging
opportunities, thanks to its strong EV service expertise via its partnership with Tesla for its
aftersales service.
Low service quality still a challenge for individual repair shops. Individual repair
shops are generally short of experienced high-quality technicians as they have limited
access to repair-related technical information on luxury OEMs and professional training.
Customers are also at the risk of accepting lower-quality, or even counterfeit parts, despite
the individual repair shops' low price. Harmony's independent service stores could
maintain the high service-quality standards set by 4S stores, backed by their deep repair-
related know-how of luxury brands, decent brand awareness, and experienced service
staff members.
Signature price competitiveness edges out 4S stores. Compared with 4S stores, which
are required to use high-priced OEM-authorised spare parts, Harmony's independent
service stores enjoy strong price competitiveness. Harmony could provide customers
options between OEM authorised spare parts and lower-priced non-OEM branded but
authentic parts, on the back of its diversified parts sourcing channels. As a result,
independent service stores can generate higher returns than a typical 4S shop. The
company has guided that the capex for an independent service center is around Rmb4 mn
(as the company mainly rents the building), which is substantially lower than that of a
typical 4S dealership. We expect the average per store annual revenue to reach Rmb8 mn
and assume a 45% gross margin and 12.5% net margin (Rmb3.6 mn in gross profit and
Rmb1.0 mn in net profit). The payback period is around four years on an average—much
better than that of a typical 4S dealership.
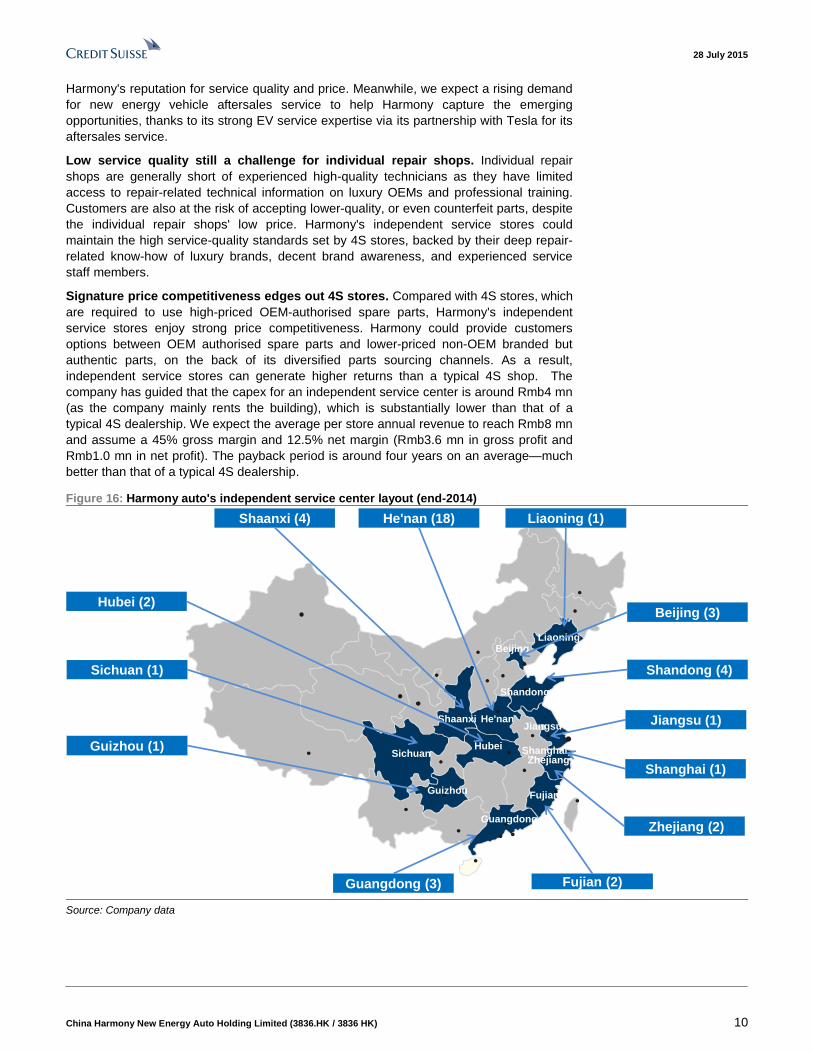
Figure 16: Harmony auto's independent service center layout (end-2014)
Beijing (3)
Shandong (4)
He'nan (18)
Shaanxi
Hubei
Beijing
Shandong
Jiangsu
Zhejiang
Guangdong
Shanghai
He'nan
Guizhou
Sichuan
Liaoning
Shaanxi (4)
Guangdong (3)
Shanghai (1)
Jiangsu (1)
Zhejiang (2)
Hubei (2)
Liaoning (1)
Guizhou (1)
Sichuan (1)
Fujian (2)
Fujian
Source: Company data
28 July 2015
China Harmony New Energy Auto Holding Limited (3836.HK / 3836 HK) 11
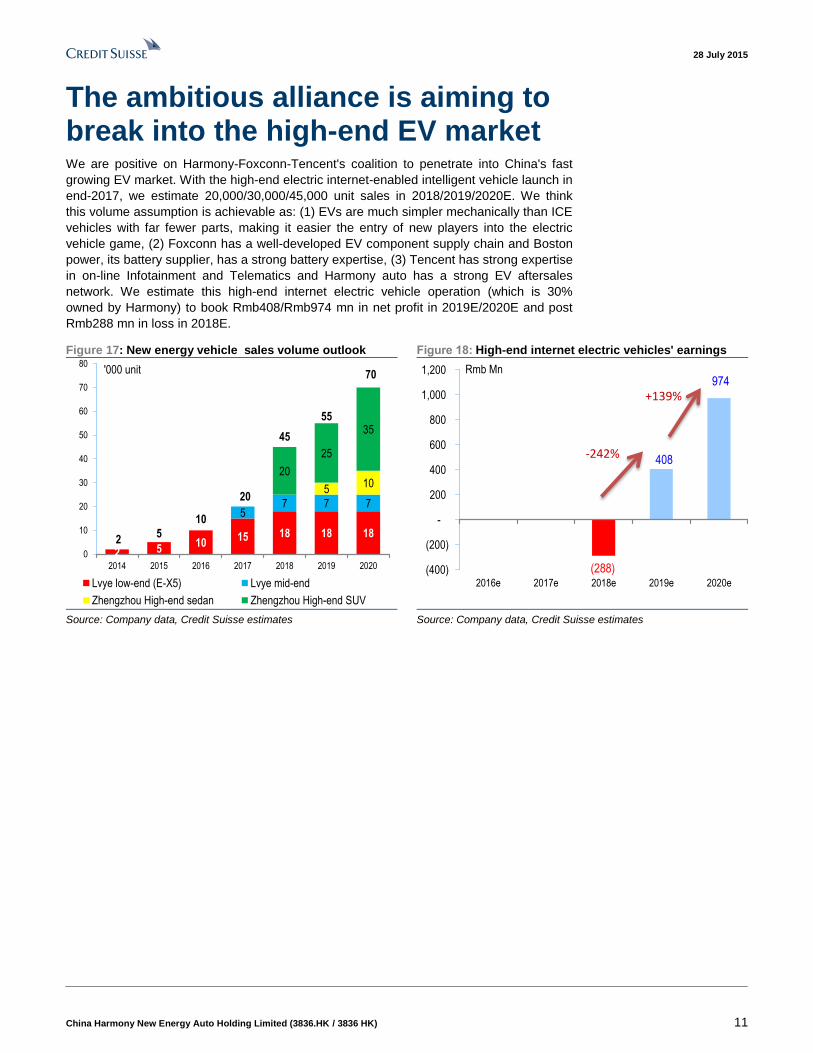
The ambitious alliance is aiming to break into the high-end EV market We are positive on Harmony-Foxconn-Tencent's coalition to penetrate into China's fast
growing EV market. With the high-end electric internet-enabled intelligent vehicle launch in
end-2017, we estimate 20,000/30,000/45,000 unit sales in 2018/2019/2020E. We think
this volume assumption is achievable as: (1) EVs are much simpler mechanically than ICE
vehicles with far fewer parts, making it easier the entry of new players into the electric
vehicle game, (2) Foxconn has a well-developed EV component supply chain and Boston
power, its battery supplier, has a strong battery expertise, (3) Tencent has strong expertise
in on-line Infotainment and Telematics and Harmony auto has a strong EV aftersales
network. We estimate this high-end internet electric vehicle operation (which is 30%
owned by Harmony) to book Rmb408/Rmb974 mn in net profit in 2019E/2020E and post
Rmb288 mn in loss in 2018E.
Figure 17: New energy vehicle sales volume outlook Figure 18: High-end internet electric vehicles' earnings
2 510
15 18 18 18
57 7 7
510
20
25
35
25
10
20
45
55
70
0
10
20
30
40
50
60
70
80
2014 2015 2016 2017 2018 2019 2020
'000 unit
Lvye low-end (E-X5) Lvye mid-end
Zhengzhou High-end sedan Zhengzhou High-end SUV
(288)
408
974
(400)
(200)
-
200
400
600
800
1,000
1,200
2016e 2017e 2018e 2019e 2020e
Rmb Mn
-242%
+139%
Source: Company data, Credit Suisse estimates Source: Company data, Credit Suisse estimates
28 July 2015
China Harmony New Energy Auto Holding Limited (3836.HK / 3836 HK) 12
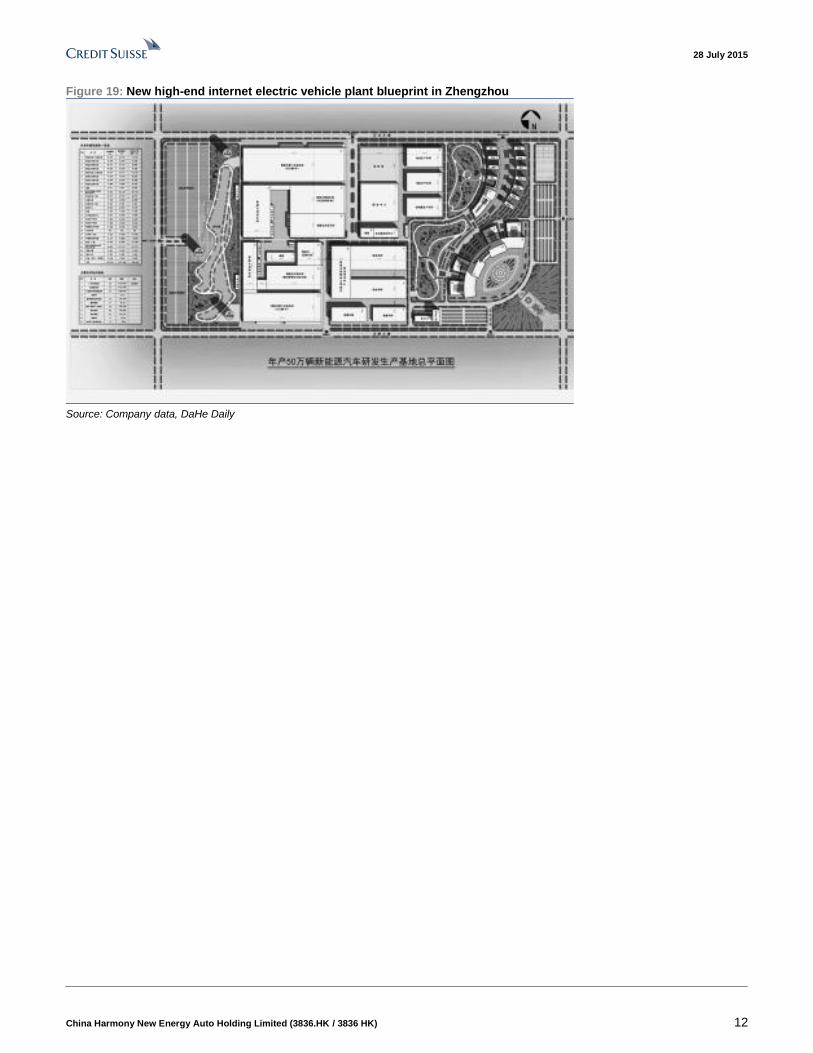
Figure 19: New high-end internet electric vehicle plant blueprint in Zhengzhou
Source: Company data, DaHe Daily
28 July 2015
China Harmony New Energy Auto Holding Limited (3836.HK / 3836 HK) 13
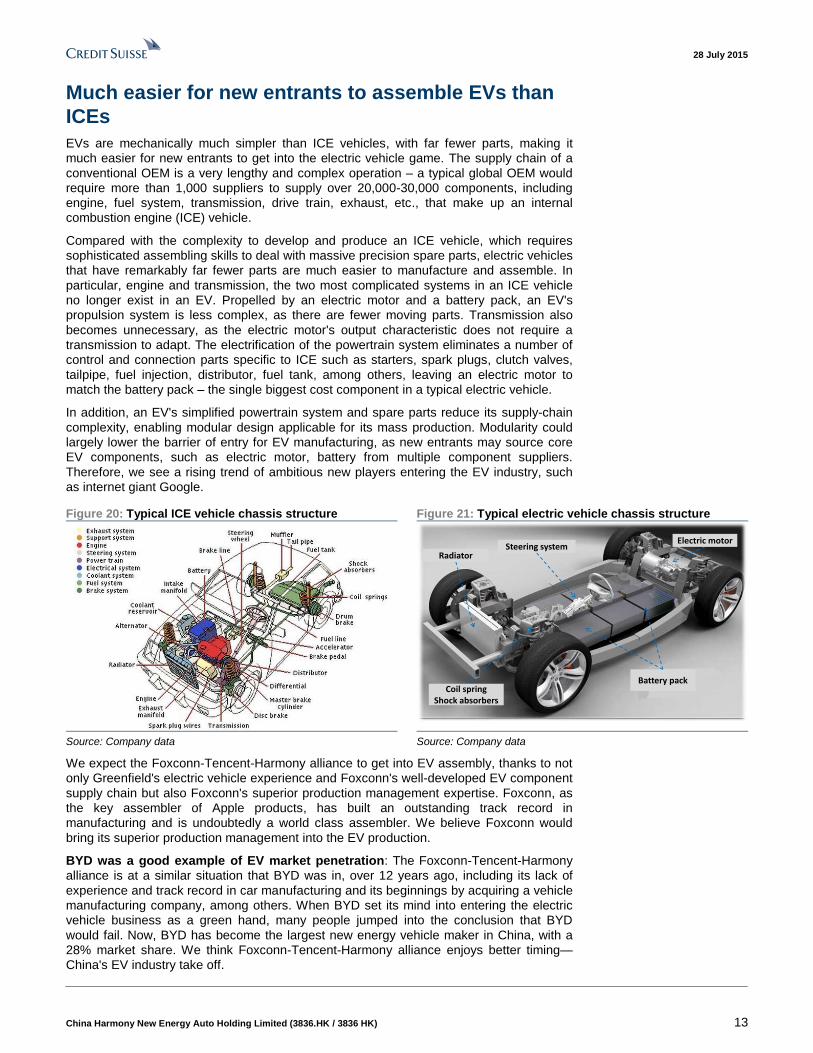
Much easier for new entrants to assemble EVs than
ICEs
EVs are mechanically much simpler than ICE vehicles, with far fewer parts, making it
much easier for new entrants to get into the electric vehicle game. The supply chain of a
conventional OEM is a very lengthy and complex operation – a typical global OEM would
require more than 1,000 suppliers to supply over 20,000-30,000 components, including
engine, fuel system, transmission, drive train, exhaust, etc., that make up an internal
combustion engine (ICE) vehicle.
Compared with the complexity to develop and produce an ICE vehicle, which requires
sophisticated assembling skills to deal with massive precision spare parts, electric vehicles
that have remarkably far fewer parts are much easier to manufacture and assemble. In
particular, engine and transmission, the two most complicated systems in an ICE vehicle
no longer exist in an EV. Propelled by an electric motor and a battery pack, an EV's
propulsion system is less complex, as there are fewer moving parts. Transmission also
becomes unnecessary, as the electric motor's output characteristic does not require a
transmission to adapt. The electrification of the powertrain system eliminates a number of
control and connection parts specific to ICE such as starters, spark plugs, clutch valves,
tailpipe, fuel injection, distributor, fuel tank, among others, leaving an electric motor to
match the battery pack – the single biggest cost component in a typical electric vehicle.
In addition, an EV's simplified powertrain system and spare parts reduce its supply-chain
complexity, enabling modular design applicable for its mass production. Modularity could
largely lower the barrier of entry for EV manufacturing, as new entrants may source core
EV components, such as electric motor, battery from multiple component suppliers.
Therefore, we see a rising trend of ambitious new players entering the EV industry, such
as internet giant Google.
Figure 20: Typical ICE vehicle chassis structure Figure 21: Typical electric vehicle chassis structure
Battery pack
Electric motorSteering system
Coil springShock absorbers
Radiator
Source: Company data Source: Company data
We expect the Foxconn-Tencent-Harmony alliance to get into EV assembly, thanks to not
only Greenfield's electric vehicle experience and Foxconn's well-developed EV component
supply chain but also Foxconn's superior production management expertise. Foxconn, as
the key assembler of Apple products, has built an outstanding track record in
manufacturing and is undoubtedly a world class assembler. We believe Foxconn would
bring its superior production management into the EV production.
BYD was a good example of EV market penetration: The Foxconn-Tencent-Harmony
alliance is at a similar situation that BYD was in, over 12 years ago, including its lack of
experience and track record in car manufacturing and its beginnings by acquiring a vehicle
manufacturing company, among others. When BYD set its mind into entering the electric
vehicle business as a green hand, many people jumped into the conclusion that BYD
would fail. Now, BYD has become the largest new energy vehicle maker in China, with a
28% market share. We think Foxconn-Tencent-Harmony alliance enjoys better timing—
China's EV industry take off.
28 July 2015
China Harmony New Energy Auto Holding Limited (3836.HK / 3836 HK) 14
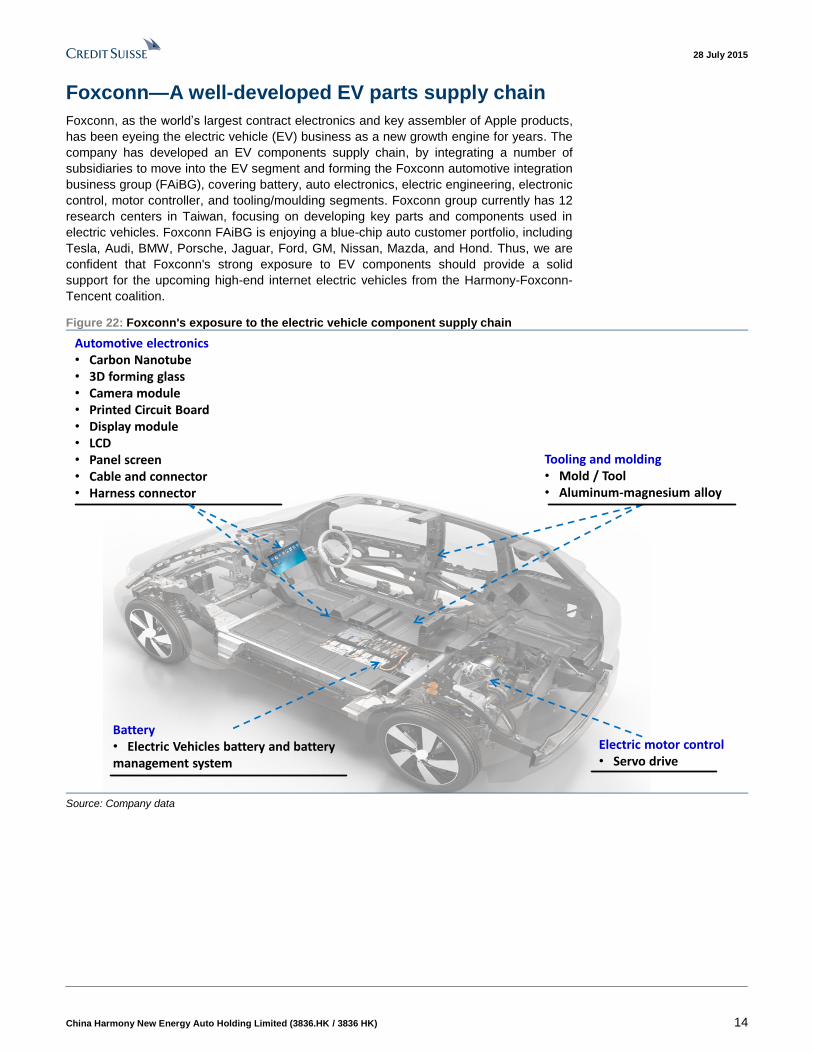
Foxconn—A well-developed EV parts supply chain
Foxconn, as the world’s largest contract electronics and key assembler of Apple products,
has been eyeing the electric vehicle (EV) business as a new growth engine for years. The
company has developed an EV components supply chain, by integrating a number of
subsidiaries to move into the EV segment and forming the Foxconn automotive integration
business group (FAiBG), covering battery, auto electronics, electric engineering, electronic
control, motor controller, and tooling/moulding segments. Foxconn group currently has 12
research centers in Taiwan, focusing on developing key parts and components used in
electric vehicles. Foxconn FAiBG is enjoying a blue-chip auto customer portfolio, including
Tesla, Audi, BMW, Porsche, Jaguar, Ford, GM, Nissan, Mazda, and Hond. Thus, we are
confident that Foxconn's strong exposure to EV components should provide a solid
support for the upcoming high-end internet electric vehicles from the Harmony-Foxconn-
Tencent coalition.
Figure 22: Foxconn's exposure to the electric vehicle component supply chain
Tooling and molding• Mold / Tool • Aluminum-magnesium alloy
Automotive electronics• Carbon Nanotube• 3D forming glass• Camera module • Printed Circuit Board• Display module • LCD• Panel screen• Cable and connector• Harness connector
Battery• Electric Vehicles battery and battery management system
Electric motor control• Servo drive
Source: Company data
28 July 2015
China Harmony New Energy Auto Holding Limited (3836.HK / 3836 HK) 15
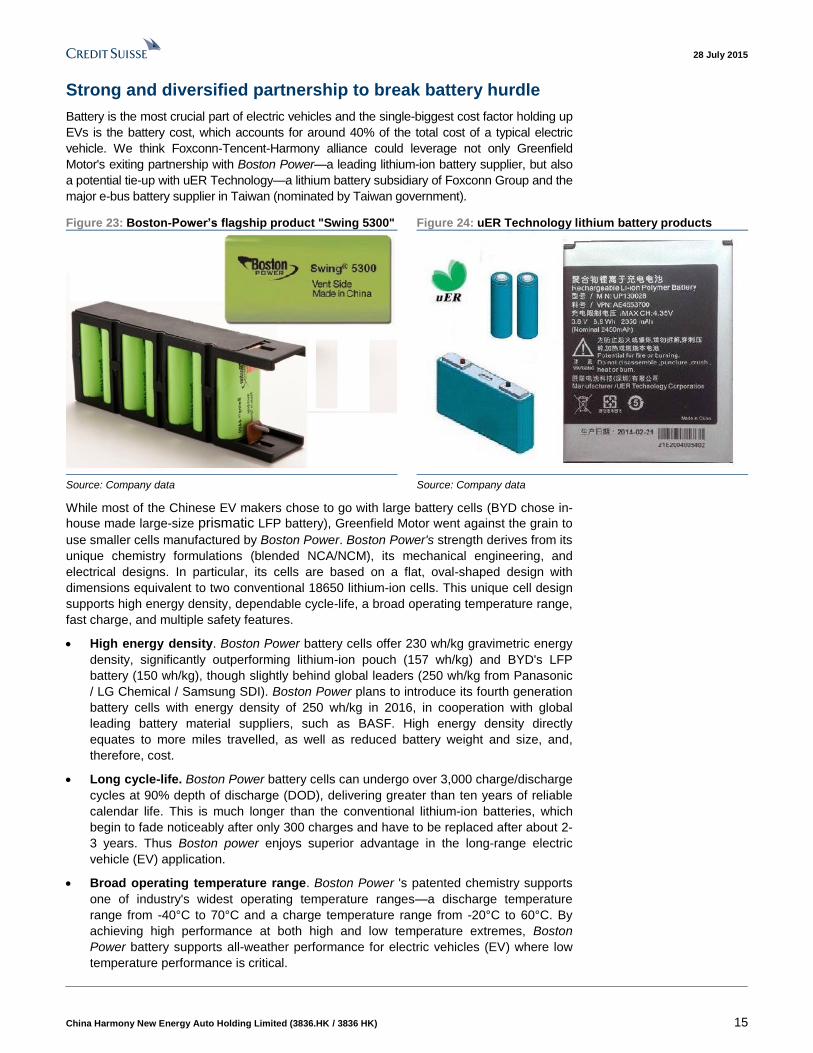
Strong and diversified partnership to break battery hurdle
Battery is the most crucial part of electric vehicles and the single-biggest cost factor holding up
EVs is the battery cost, which accounts for around 40% of the total cost of a typical electric
vehicle. We think Foxconn-Tencent-Harmony alliance could leverage not only Greenfield
Motor's exiting partnership with Boston Power—a leading lithium-ion battery supplier, but also
a potential tie-up with uER Technology—a lithium battery subsidiary of Foxconn Group and the
major e-bus battery supplier in Taiwan (nominated by Taiwan government).
Figure 23: Boston-Power’s flagship product "Swing 5300" Figure 24: uER Technology lithium battery products
Source: Company data Source: Company data
While most of the Chinese EV makers chose to go with large battery cells (BYD chose in-
house made large-size prismatic LFP battery), Greenfield Motor went against the grain to
use smaller cells manufactured by Boston Power. Boston Power's strength derives from its
unique chemistry formulations (blended NCA/NCM), its mechanical engineering, and
electrical designs. In particular, its cells are based on a flat, oval-shaped design with
dimensions equivalent to two conventional 18650 lithium-ion cells. This unique cell design
supports high energy density, dependable cycle-life, a broad operating temperature range,
fast charge, and multiple safety features.
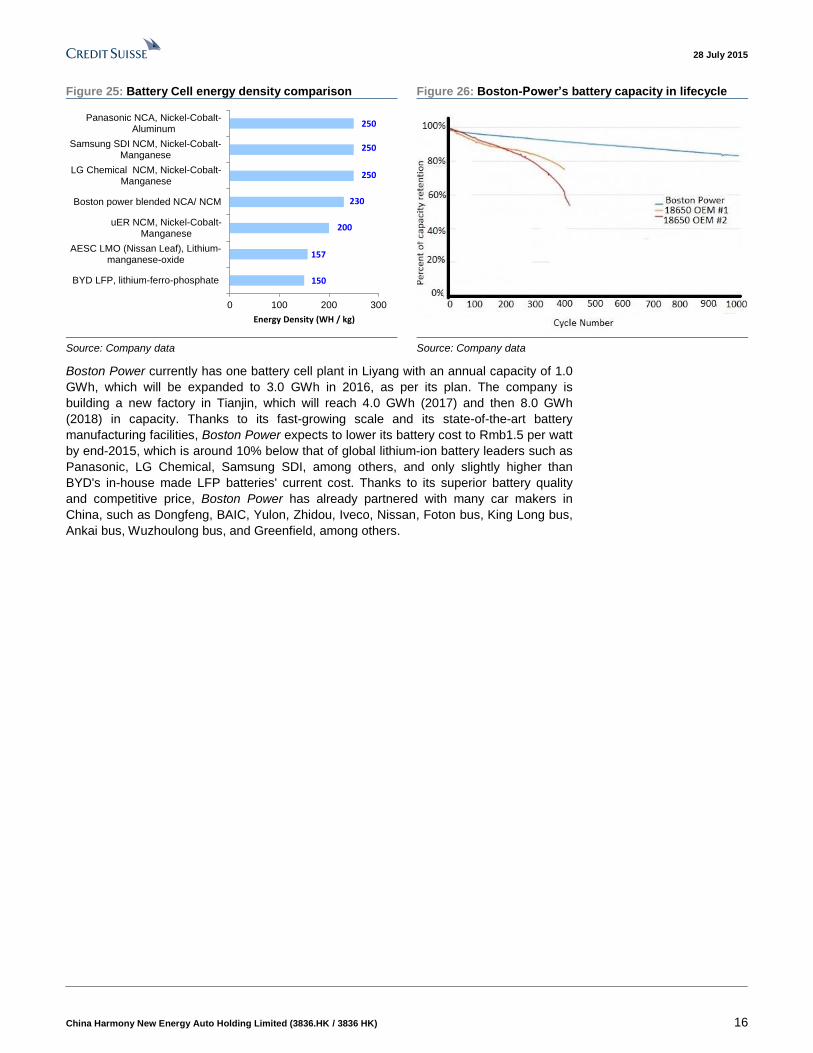
High energy density. Boston Power battery cells offer 230 wh/kg gravimetric energy
density, significantly outperforming lithium-ion pouch (157 wh/kg) and BYD's LFP
battery (150 wh/kg), though slightly behind global leaders (250 wh/kg from Panasonic
/ LG Chemical / Samsung SDI). Boston Power plans to introduce its fourth generation
battery cells with energy density of 250 wh/kg in 2016, in cooperation with global
leading battery material suppliers, such as BASF. High energy density directly
equates to more miles travelled, as well as reduced battery weight and size, and,
therefore, cost.
Long cycle-life. Boston Power battery cells can undergo over 3,000 charge/discharge
cycles at 90% depth of discharge (DOD), delivering greater than ten years of reliable
calendar life. This is much longer than the conventional lithium-ion batteries, which
begin to fade noticeably after only 300 charges and have to be replaced after about 2-
3 years. Thus Boston power enjoys superior advantage in the long-range electric
vehicle (EV) application.
Broad operating temperature range. Boston Power 's patented chemistry supports
one of industry's widest operating temperature ranges—a discharge temperature
range from -40°C to 70°C and a charge temperature range from -20°C to 60°C. By
achieving high performance at both high and low temperature extremes, Boston
Power battery supports all-weather performance for electric vehicles (EV) where low
temperature performance is critical.
28 July 2015
China Harmony New Energy Auto Holding Limited (3836.HK / 3836 HK) 16
Figure 25: Battery Cell energy density comparison Figure 26: Boston-Power’s battery capacity in lifecycle
150
157
200
230
250
250
250
0 100 200 300
BYD LFP, lithium-ferro-phosphate
AESC LMO (Nissan Leaf), Lithium-manganese-oxide
uER NCM, Nickel-Cobalt-Manganese
Boston power blended NCA/ NCM
LG Chemical NCM, Nickel-Cobalt-Manganese
Samsung SDI NCM, Nickel-Cobalt-Manganese
Panasonic NCA, Nickel-Cobalt-Aluminum
Energy Density (WH / kg)
Source: Company data Source: Company data
Boston Power currently has one battery cell plant in Liyang with an annual capacity of 1.0
GWh, which will be expanded to 3.0 GWh in 2016, as per its plan. The company is
building a new factory in Tianjin, which will reach 4.0 GWh (2017) and then 8.0 GWh
(2018) in capacity. Thanks to its fast-growing scale and its state-of-the-art battery
manufacturing facilities, Boston Power expects to lower its battery cost to Rmb1.5 per watt
by end-2015, which is around 10% below that of global lithium-ion battery leaders such as
Panasonic, LG Chemical, Samsung SDI, among others, and only slightly higher than
BYD's in-house made LFP batteries' current cost. Thanks to its superior battery quality
and competitive price, Boston Power has already partnered with many car makers in
China, such as Dongfeng, BAIC, Yulon, Zhidou, Iveco, Nissan, Foton bus, King Long bus,
Ankai bus, Wuzhoulong bus, and Greenfield, among others.
28 July 2015
China Harmony New Energy Auto Holding Limited (3836.HK / 3836 HK) 17
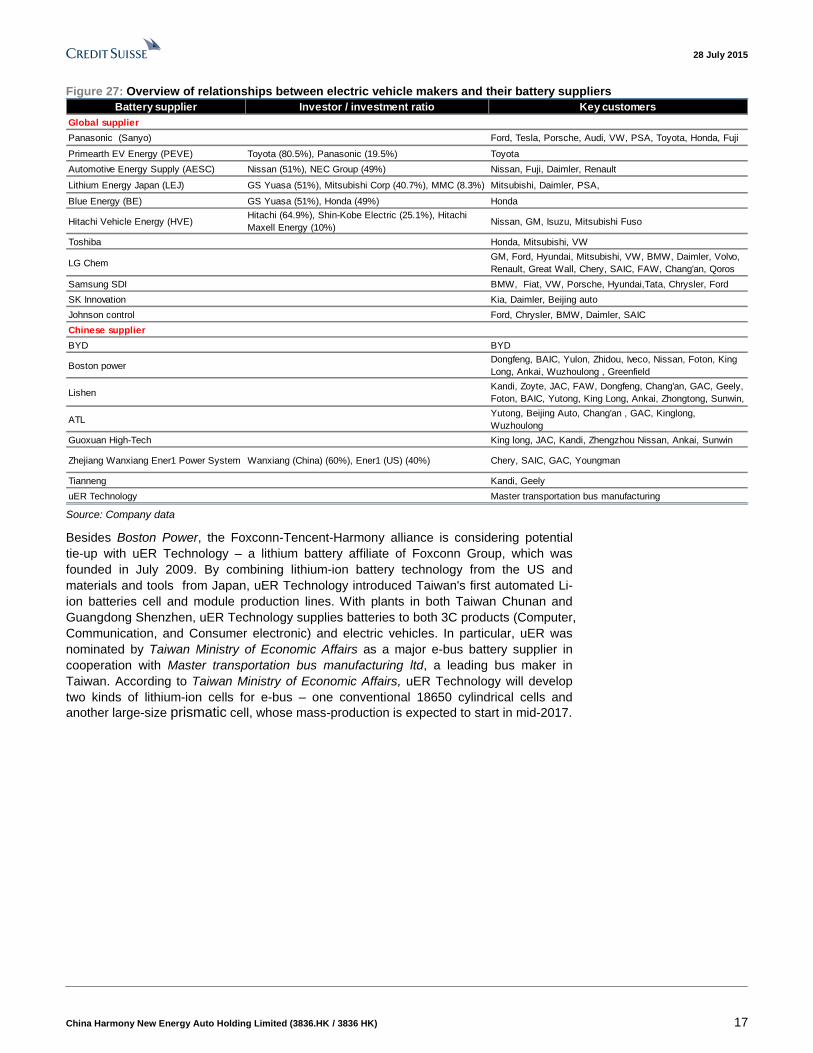
Figure 27: Overview of relationships between electric vehicle makers and their battery suppliers
Battery supplier Investor / investment ratio Key customers
Global supplier
Panasonic (Sanyo) Ford, Tesla, Porsche, Audi, VW, PSA, Toyota, Honda, Fuji
Primearth EV Energy (PEVE) Toyota (80.5%), Panasonic (19.5%) Toyota
Automotive Energy Supply (AESC) Nissan (51%), NEC Group (49%) Nissan, Fuji, Daimler, Renault
Lithium Energy Japan (LEJ) GS Yuasa (51%), Mitsubishi Corp (40.7%), MMC (8.3%) Mitsubishi, Daimler, PSA,
Blue Energy (BE) GS Yuasa (51%), Honda (49%) Honda
Hitachi Vehicle Energy (HVE)Hitachi (64.9%), Shin-Kobe Electric (25.1%), Hitachi
Maxell Energy (10%)Nissan, GM, Isuzu, Mitsubishi Fuso
Toshiba Honda, Mitsubishi, VW
LG Chem GM, Ford, Hyundai, Mitsubishi, VW, BMW, Daimler, Volvo,
Renault, Great Wall, Chery, SAIC, FAW, Chang'an, Qoros
Samsung SDI BMW, Fiat, VW, Porsche, Hyundai,Tata, Chrysler, Ford
SK Innovation Kia, Daimler, Beijing auto
Johnson control Ford, Chrysler, BMW, Daimler, SAIC
Chinese supplier
BYD BYD
Boston powerDongfeng, BAIC, Yulon, Zhidou, Iveco, Nissan, Foton, King
Long, Ankai, Wuzhoulong , Greenfield
LishenKandi, Zoyte, JAC, FAW, Dongfeng, Chang'an, GAC, Geely,
Foton, BAIC, Yutong, King Long, Ankai, Zhongtong, Sunwin,
ATLYutong, Beijing Auto, Chang'an , GAC, Kinglong,
Wuzhoulong
Guoxuan High-Tech King long, JAC, Kandi, Zhengzhou Nissan, Ankai, Sunwin
Zhejiang Wanxiang Ener1 Power System Wanxiang (China) (60%), Ener1 (US) (40%) Chery, SAIC, GAC, Youngman
Tianneng Kandi, Geely
uER Technology Master transportation bus manufacturing Source: Company data
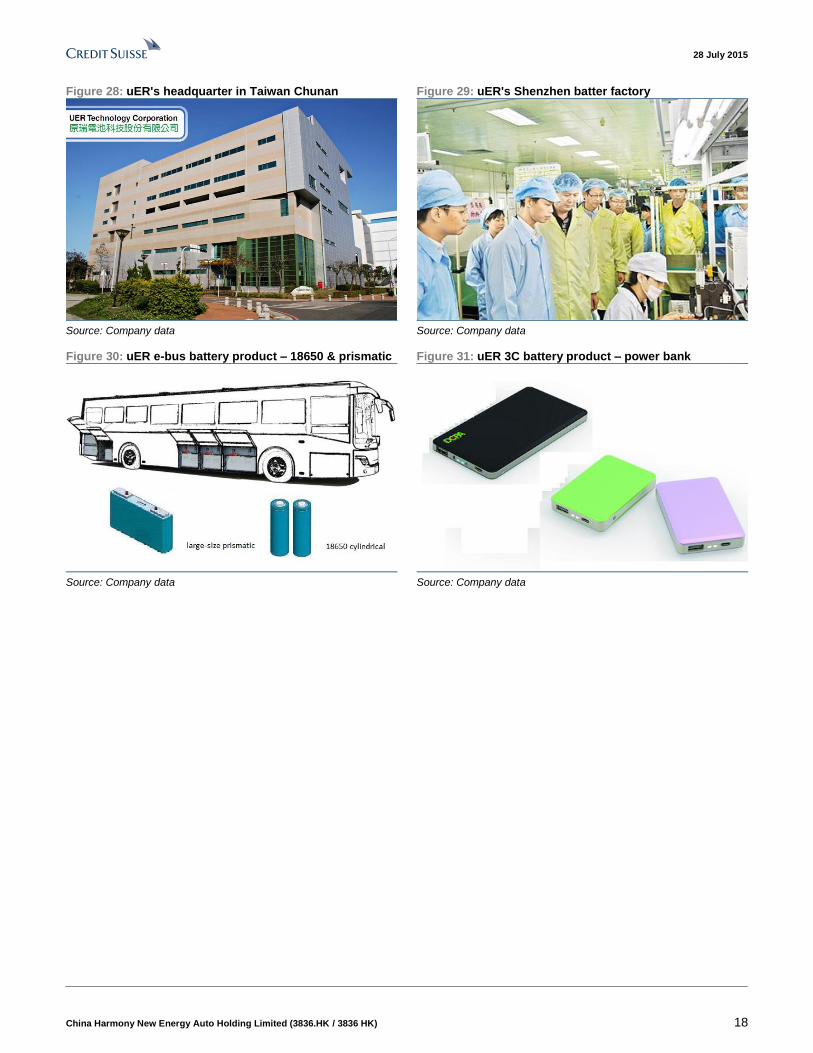
Besides Boston Power, the Foxconn-Tencent-Harmony alliance is considering potential
tie-up with uER Technology – a lithium battery affiliate of Foxconn Group, which was
founded in July 2009. By combining lithium-ion battery technology from the US and
materials and tools from Japan, uER Technology introduced Taiwan's first automated Li-
ion batteries cell and module production lines. With plants in both Taiwan Chunan and
Guangdong Shenzhen, uER Technology supplies batteries to both 3C products (Computer,
Communication, and Consumer electronic) and electric vehicles. In particular, uER was
nominated by Taiwan Ministry of Economic Affairs as a major e-bus battery supplier in
cooperation with Master transportation bus manufacturing ltd, a leading bus maker in
Taiwan. According to Taiwan Ministry of Economic Affairs, uER Technology will develop
two kinds of lithium-ion cells for e-bus – one conventional 18650 cylindrical cells and
another large-size prismatic cell, whose mass-production is expected to start in mid-2017.
28 July 2015
China Harmony New Energy Auto Holding Limited (3836.HK / 3836 HK) 18
Figure 28: uER's headquarter in Taiwan Chunan Figure 29: uER's Shenzhen batter factory
Source: Company data Source: Company data
Figure 30: uER e-bus battery product – 18650 & prismatic Figure 31: uER 3C battery product – power bank
Source: Company data Source: Company data
28 July 2015
China Harmony New Energy Auto Holding Limited (3836.HK / 3836 HK) 19
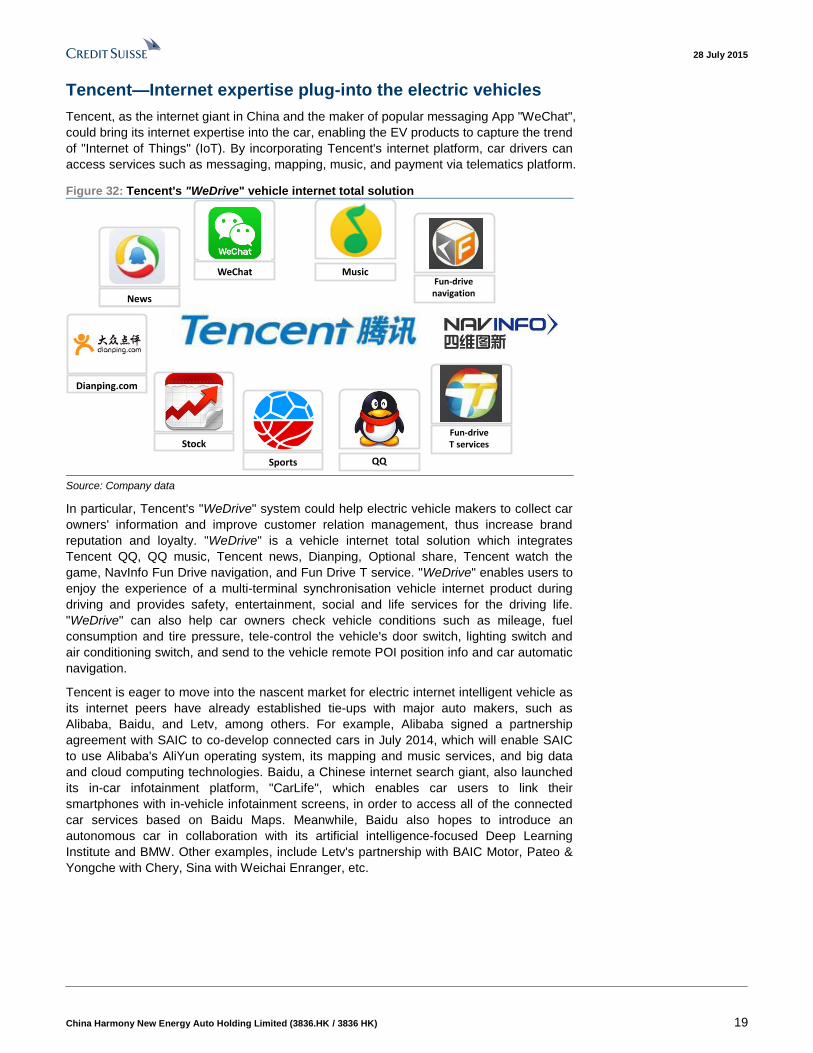
Tencent—Internet expertise plug-into the electric vehicles
Tencent, as the internet giant in China and the maker of popular messaging App "WeChat",
could bring its internet expertise into the car, enabling the EV products to capture the trend
of "Internet of Things" (IoT). By incorporating Tencent's internet platform, car drivers can
access services such as messaging, mapping, music, and payment via telematics platform.
Figure 32: Tencent's "WeDrive" vehicle internet total solution
News
Stock
QQSports
Music
Dianping.com
Fun-drive navigation
Fun-drive T services
Source: Company data
In particular, Tencent's "WeDrive" system could help electric vehicle makers to collect car
owners' information and improve customer relation management, thus increase brand
reputation and loyalty. "WeDrive" is a vehicle internet total solution which integrates
Tencent QQ, QQ music, Tencent news, Dianping, Optional share, Tencent watch the
game, NavInfo Fun Drive navigation, and Fun Drive T service. "WeDrive" enables users to
enjoy the experience of a multi-terminal synchronisation vehicle internet product during
driving and provides safety, entertainment, social and life services for the driving life.
"WeDrive" can also help car owners check vehicle conditions such as mileage, fuel
consumption and tire pressure, tele-control the vehicle's door switch, lighting switch and
air conditioning switch, and send to the vehicle remote POI position info and car automatic
navigation.
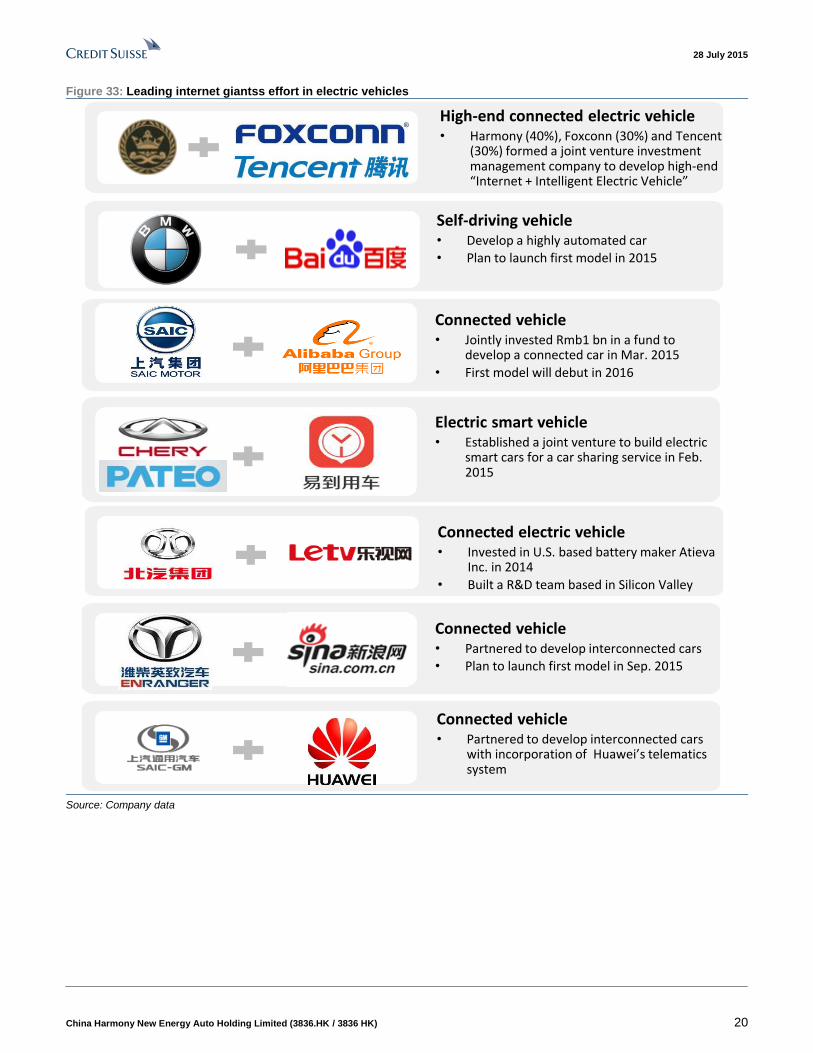
Tencent is eager to move into the nascent market for electric internet intelligent vehicle as
its internet peers have already established tie-ups with major auto makers, such as
Alibaba, Baidu, and Letv, among others. For example, Alibaba signed a partnership
agreement with SAIC to co-develop connected cars in July 2014, which will enable SAIC
to use Alibaba's AliYun operating system, its mapping and music services, and big data
and cloud computing technologies. Baidu, a Chinese internet search giant, also launched
its in-car infotainment platform, "CarLife", which enables car users to link their
smartphones with in-vehicle infotainment screens, in order to access all of the connected
car services based on Baidu Maps. Meanwhile, Baidu also hopes to introduce an
autonomous car in collaboration with its artificial intelligence-focused Deep Learning
Institute and BMW. Other examples, include Letv's partnership with BAIC Motor, Pateo &
Yongche with Chery, Sina with Weichai Enranger, etc.
28 July 2015
China Harmony New Energy Auto Holding Limited (3836.HK / 3836 HK) 20
Figure 33: Leading internet giantss effort in electric vehicles
Connected electric vehicle• Invested in U.S. based battery maker Atieva
Inc. in 2014
• Built a R&D team based in Silicon Valley
Connected vehicle• Jointly invested Rmb1 bn in a fund to
develop a connected car in Mar. 2015
• First model will debut in 2016
Electric smart vehicle• Established a joint venture to build electric
smart cars for a car sharing service in Feb. 2015
Self-driving vehicle• Develop a highly automated car
• Plan to launch first model in 2015
High-end connected electric vehicle• Harmony (40%), Foxconn (30%) and Tencent
(30%) formed a joint venture investment management company to develop high-end “Internet + Intelligent Electric Vehicle”
Connected vehicle• Partnered to develop interconnected cars
• Plan to launch first model in Sep. 2015
Connected vehicle• Partnered to develop interconnected cars
with incorporation of Huawei’s telematics system
Source: Company data
28 July 2015
China Harmony New Energy Auto Holding Limited (3836.HK / 3836 HK) 21
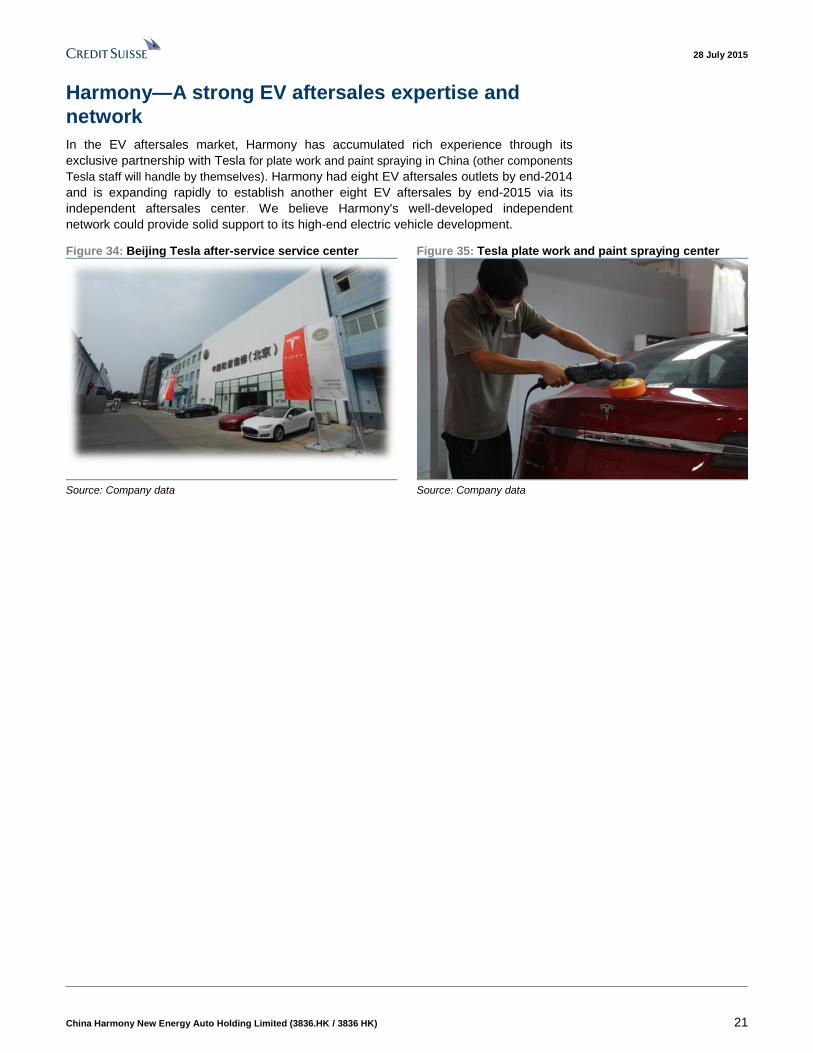
Harmony—A strong EV aftersales expertise and
network
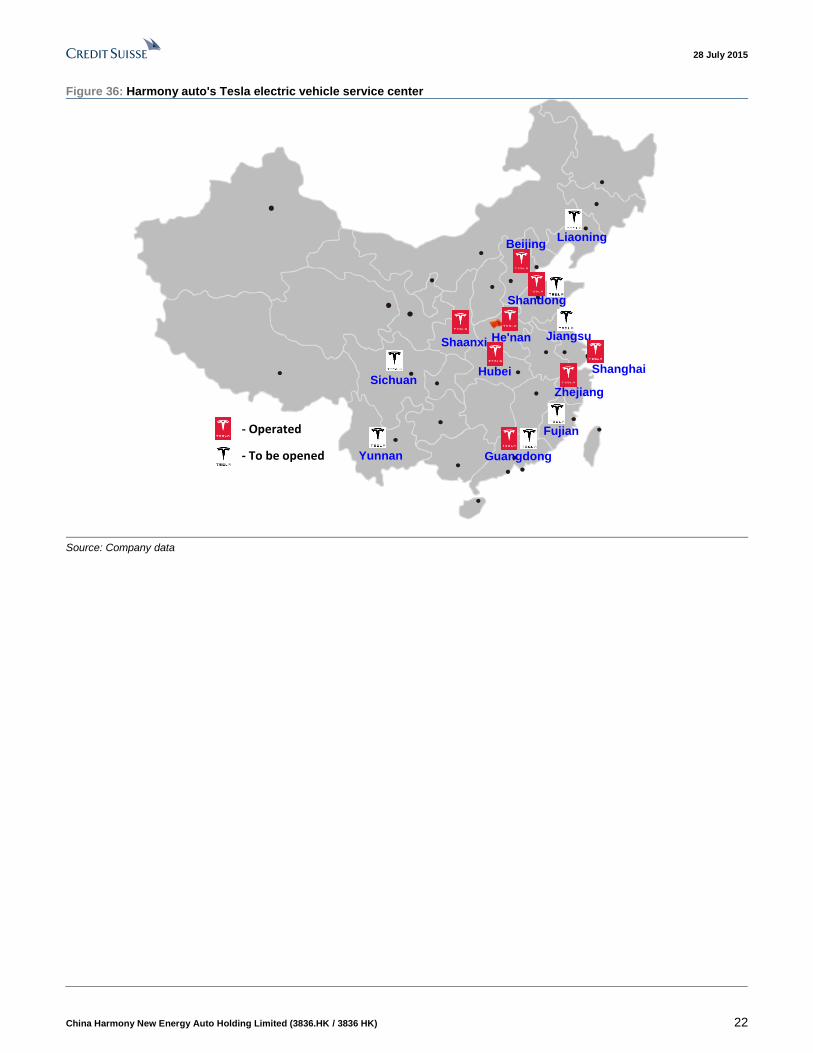
In the EV aftersales market, Harmony has accumulated rich experience through its
exclusive partnership with Tesla for plate work and paint spraying in China (other components
Tesla staff will handle by themselves). Harmony had eight EV aftersales outlets by end-2014
and is expanding rapidly to establish another eight EV aftersales by end-2015 via its
independent aftersales center. We believe Harmony's well-developed independent
network could provide solid support to its high-end electric vehicle development.
Figure 34: Beijing Tesla after-service service center Figure 35: Tesla plate work and paint spraying center
Source: Company data Source: Company data
28 July 2015
China Harmony New Energy Auto Holding Limited (3836.HK / 3836 HK) 22
Figure 36: Harmony auto's Tesla electric vehicle service center
Shaanxi
Hubei
Beijing
Shandong
Zhejiang
Guangdong
Shanghai
He'nan
Sichuan
Liaoning
Jiangsu
Fujian
Yunnan- To be opened
- Operated
Source: Company data
28 July 2015
China Harmony New Energy Auto Holding Limited (3836.HK / 3836 HK) 23
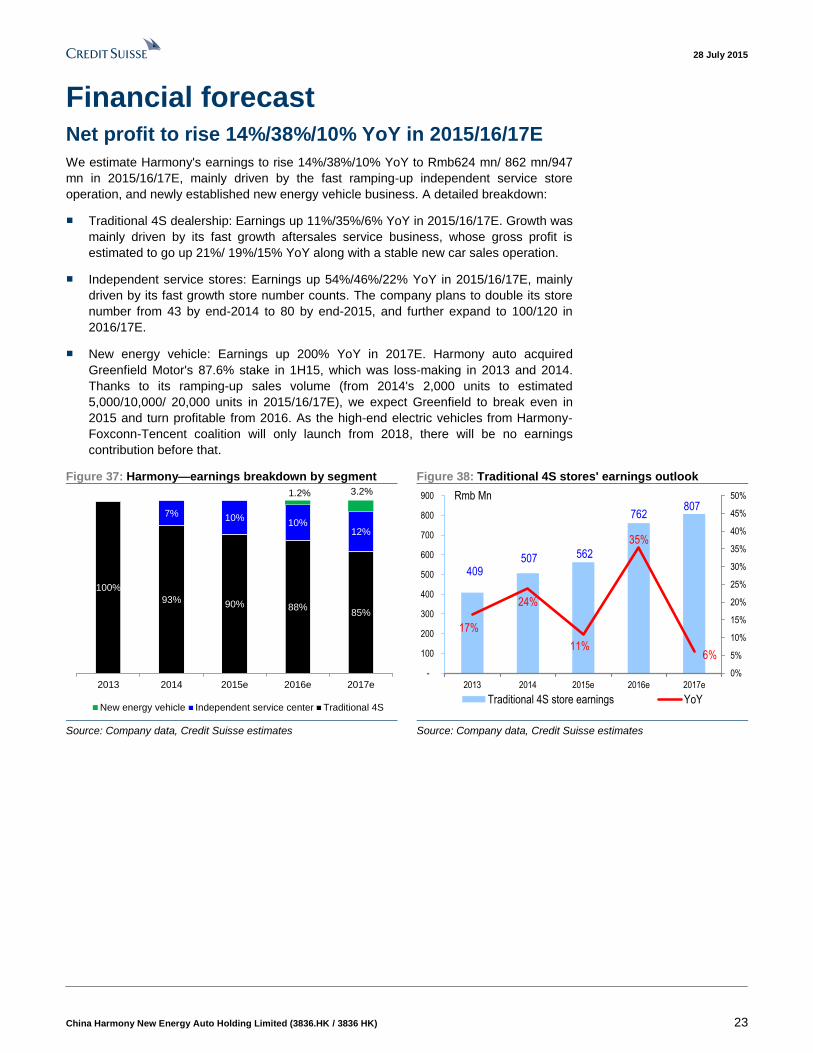
Financial forecast Net profit to rise 14%/38%/10% YoY in 2015/16/17E
We estimate Harmony's earnings to rise 14%/38%/10% YoY to Rmb624 mn/ 862 mn/947
mn in 2015/16/17E, mainly driven by the fast ramping-up independent service store
operation, and newly established new energy vehicle business. A detailed breakdown:
■ Traditional 4S dealership: Earnings up 11%/35%/6% YoY in 2015/16/17E. Growth was
mainly driven by its fast growth aftersales service business, whose gross profit is
estimated to go up 21%/ 19%/15% YoY along with a stable new car sales operation.
■ Independent service stores: Earnings up 54%/46%/22% YoY in 2015/16/17E, mainly
driven by its fast growth store number counts. The company plans to double its store
number from 43 by end-2014 to 80 by end-2015, and further expand to 100/120 in
2016/17E.
■ New energy vehicle: Earnings up 200% YoY in 2017E. Harmony auto acquired
Greenfield Motor's 87.6% stake in 1H15, which was loss-making in 2013 and 2014.
Thanks to its ramping-up sales volume (from 2014's 2,000 units to estimated
5,000/10,000/ 20,000 units in 2015/16/17E), we expect Greenfield to break even in
2015 and turn profitable from 2016. As the high-end electric vehicles from Harmony-
Foxconn-Tencent coalition will only launch from 2018, there will be no earnings
contribution before that.
Figure 37: Harmony—earnings breakdown by segment Figure 38: Traditional 4S stores' earnings outlook
100%
93% 90% 88%85%
7% 10%10%
12%
1.2% 3.2%
2013 2014 2015e 2016e 2017e
New energy vehicle Independent service center Traditional 4S
409 507 562
762 807
17%
24%
11%
35%
6%
0%
5%
10%
15%
20%
25%
30%
35%
40%
45%
50%
-
100
200
300
400
500
600
700
800
900
2013 2014 2015e 2016e 2017e
Rmb Mn
Traditional 4S store earnings YoY
Source: Company data, Credit Suisse estimates Source: Company data, Credit Suisse estimates
28 July 2015
China Harmony New Energy Auto Holding Limited (3836.HK / 3836 HK) 24
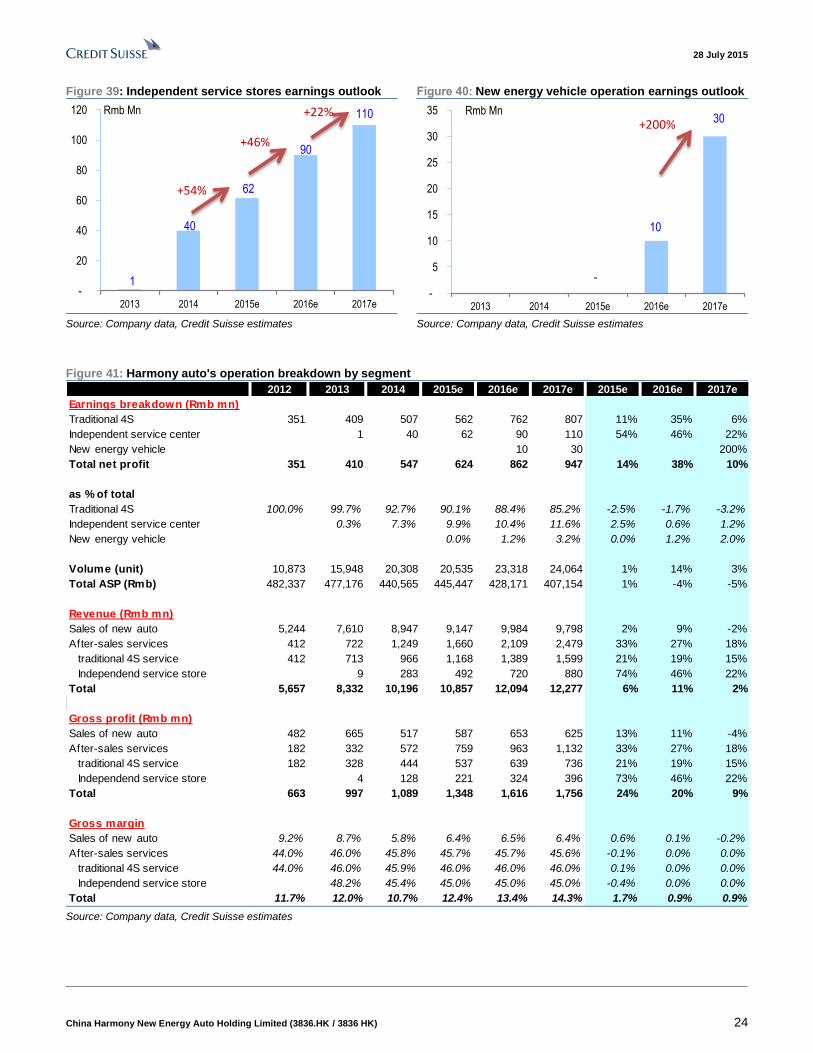
Figure 39: Independent service stores earnings outlook Figure 40: New energy vehicle operation earnings outlook
1
40
62
90
110
-
20
40
60
80
100
120
2013 2014 2015e 2016e 2017e
Rmb Mn
+54%
+46%
+22%
-
10
30
-
5
10
15
20
25
30
35
2013 2014 2015e 2016e 2017e
Rmb Mn
+200%
Source: Company data, Credit Suisse estimates Source: Company data, Credit Suisse estimates
Figure 41: Harmony auto's operation breakdown by segment
2012 2013 2014 2015e 2016e 2017e 2015e 2016e 2017e
Earnings breakdown (Rmb mn)
Traditional 4S 351 409 507 562 762 807 11% 35% 6%
Independent service center 1 40 62 90 110 54% 46% 22%
New energy vehicle 10 30 200%
Total net profit 351 410 547 624 862 947 14% 38% 10%
as % of total
Traditional 4S 100.0% 99.7% 92.7% 90.1% 88.4% 85.2% -2.5% -1.7% -3.2%
Independent service center 0.3% 7.3% 9.9% 10.4% 11.6% 2.5% 0.6% 1.2%
New energy vehicle 0.0% 1.2% 3.2% 0.0% 1.2% 2.0%
Volume (unit) 10,873 15,948 20,308 20,535 23,318 24,064 1% 14% 3%
Total ASP (Rmb) 482,337 477,176 440,565 445,447 428,171 407,154 1% -4% -5%
Revenue (Rmb mn)
Sales of new auto 5,244 7,610 8,947 9,147 9,984 9,798 2% 9% -2%
After-sales services 412 722 1,249 1,660 2,109 2,479 33% 27% 18%
traditional 4S service 412 713 966 1,168 1,389 1,599 21% 19% 15%
Independend service store 9 283 492 720 880 74% 46% 22%
Total 5,657 8,332 10,196 10,857 12,094 12,277 6% 11% 2%
Gross profit (Rmb mn)
Sales of new auto 482 665 517 587 653 625 13% 11% -4%
After-sales services 182 332 572 759 963 1,132 33% 27% 18%
traditional 4S service 182 328 444 537 639 736 21% 19% 15%
Independend service store 4 128 221 324 396 73% 46% 22%
Total 663 997 1,089 1,348 1,616 1,756 24% 20% 9%
Gross margin
Sales of new auto 9.2% 8.7% 5.8% 6.4% 6.5% 6.4% 0.6% 0.1% -0.2%
After-sales services 44.0% 46.0% 45.8% 45.7% 45.7% 45.6% -0.1% 0.0% 0.0%
traditional 4S service 44.0% 46.0% 45.9% 46.0% 46.0% 46.0% 0.1% 0.0% 0.0%
Independend service store 48.2% 45.4% 45.0% 45.0% 45.0% -0.4% 0.0% 0.0%
Total 11.7% 12.0% 10.7% 12.4% 13.4% 14.3% 1.7% 0.9% 0.9% Source: Company data, Credit Suisse estimates
28 July 2015
China Harmony New Energy Auto Holding Limited (3836.HK / 3836 HK) 25
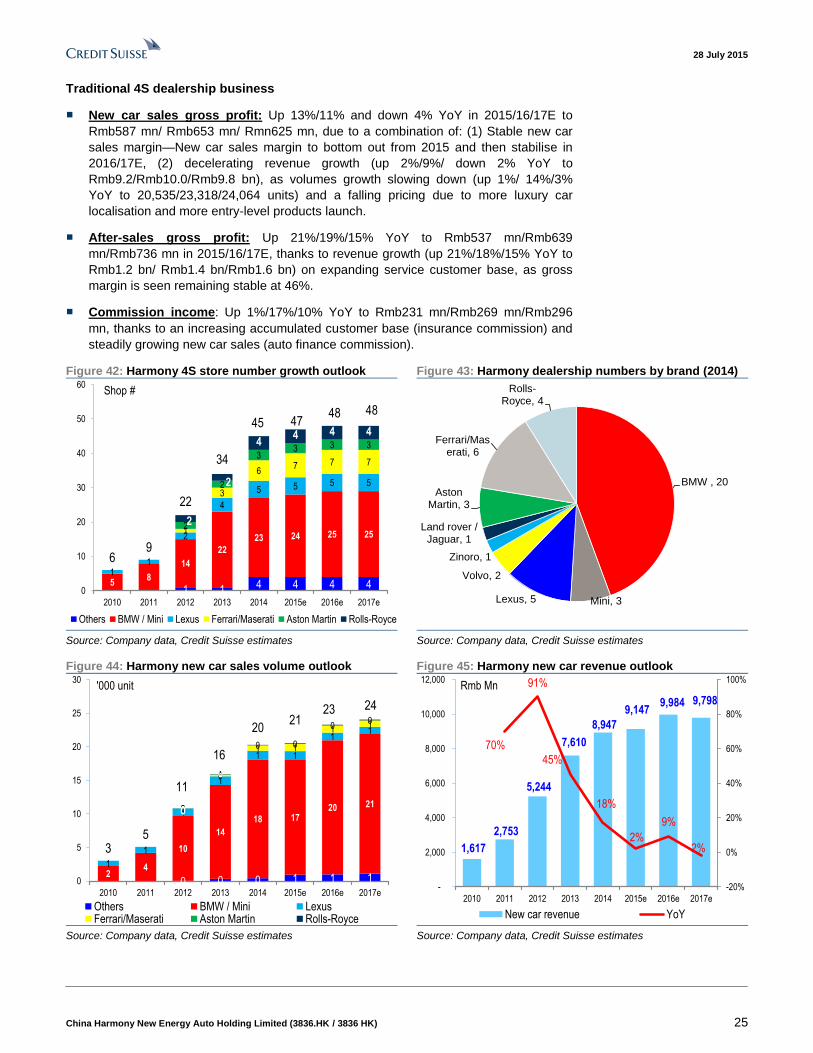
Traditional 4S dealership business
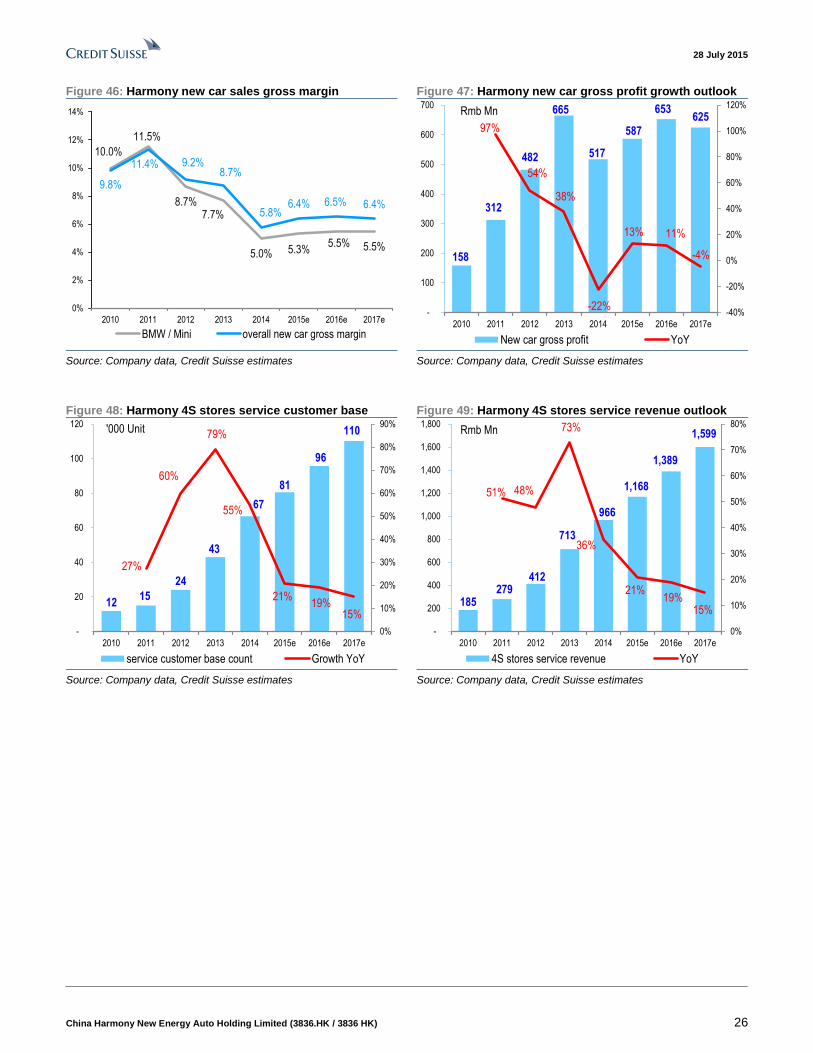
■ New car sales gross profit: Up 13%/11% and down 4% YoY in 2015/16/17E to
Rmb587 mn/ Rmb653 mn/ Rmn625 mn, due to a combination of: (1) Stable new car
sales margin—New car sales margin to bottom out from 2015 and then stabilise in
2016/17E, (2) decelerating revenue growth (up 2%/9%/ down 2% YoY to
Rmb9.2/Rmb10.0/Rmb9.8 bn), as volumes growth slowing down (up 1%/ 14%/3%
YoY to 20,535/23,318/24,064 units) and a falling pricing due to more luxury car
localisation and more entry-level products launch.
■ After-sales gross profit: Up 21%/19%/15% YoY to Rmb537 mn/Rmb639
mn/Rmb736 mn in 2015/16/17E, thanks to revenue growth (up 21%/18%/15% YoY to
Rmb1.2 bn/ Rmb1.4 bn/Rmb1.6 bn) on expanding service customer base, as gross
margin is seen remaining stable at 46%.
■ Commission income: Up 1%/17%/10% YoY to Rmb231 mn/Rmb269 mn/Rmb296
mn, thanks to an increasing accumulated customer base (insurance commission) and
steadily growing new car sales (auto finance commission).
Figure 42: Harmony 4S store number growth outlook Figure 43: Harmony dealership numbers by brand (2014)
1 1 4 4 4 458
14
22
23 24 25 25
11
2
4
5 5 5 5
1
3
67 7 7
2
2
33 3 3
2
2
44 4 4
69
22
34
45 4748 48
0
10
20
30
40
50
60
2010 2011 2012 2013 2014 2015e 2016e 2017e
Shop #
Others BMW / Mini Lexus Ferrari/Maserati Aston Martin Rolls-Royce
BMW , 20
Mini, 3Lexus, 5
Volvo, 2
Zinoro, 1
Land rover / Jaguar, 1
Aston Martin, 3
Ferrari/Maserati, 6
Rolls-Royce, 4
Source: Company data, Credit Suisse estimates Source: Company data, Credit Suisse estimates
Figure 44: Harmony new car sales volume outlook Figure 45: Harmony new car revenue outlook
0 0 0 1 1 124
10
14
18 1720 21
1
1
1
1
1 1
11
0
0
1 1
11
0
0
0 0
00
0
0
0 0
0 0
35
11
16
2021
23 24
0
5
10
15
20
25
30
2010 2011 2012 2013 2014 2015e 2016e 2017e
'000 unit
Others BMW / Mini LexusFerrari/Maserati Aston Martin Rolls-Royce
1,617
2,753
5,244
7,610
8,947
9,147 9,984 9,798
70%
91%
45%
18%
2%
9%
-2%
-20%
0%
20%
40%
60%
80%
100%
-
2,000
4,000
6,000
8,000
10,000
12,000
2010 2011 2012 2013 2014 2015e 2016e 2017e
Rmb Mn
New car revenue YoY
Source: Company data, Credit Suisse estimates Source: Company data, Credit Suisse estimates
28 July 2015
China Harmony New Energy Auto Holding Limited (3836.HK / 3836 HK) 26
Figure 46: Harmony new car sales gross margin Figure 47: Harmony new car gross profit growth outlook
10.0%
11.5%
8.7%7.7%
5.0% 5.3%5.5% 5.5%
9.8%
11.4% 9.2%8.7%
5.8%6.4% 6.5% 6.4%
0%
2%
4%
6%
8%
10%
12%
14%
2010 2011 2012 2013 2014 2015e 2016e 2017e
BMW / Mini overall new car gross margin
158
312
482
665
517
587
653 625
97%
54%
38%
-22%
13% 11%
-4%
-40%
-20%
0%
20%
40%
60%
80%
100%
120%
-
100
200
300
400
500
600
700
2010 2011 2012 2013 2014 2015e 2016e 2017e
Rmb Mn
New car gross profit YoY
Source: Company data, Credit Suisse estimates Source: Company data, Credit Suisse estimates
Figure 48: Harmony 4S stores service customer base Figure 49: Harmony 4S stores service revenue outlook
12 15
24
43
67
81
96
110
27%
60%
79%
55%
21%19%
15%
0%
10%
20%
30%
40%
50%
60%
70%
80%
90%
-
20
40
60
80
100
120
2010 2011 2012 2013 2014 2015e 2016e 2017e
'000 Unit
Tho
usan
ds
service customer base count Growth YoY
185 279
412
713
966
1,168
1,389
1,599
51% 48%
73%
36%
21%19%
15%
0%
10%
20%
30%
40%
50%
60%
70%
80%
-
200
400
600
800
1,000
1,200
1,400
1,600
1,800
2010 2011 2012 2013 2014 2015e 2016e 2017e
Rmb Mn
4S stores service revenue YoY
Source: Company data, Credit Suisse estimates Source: Company data, Credit Suisse estimates
28 July 2015
China Harmony New Energy Auto Holding Limited (3836.HK / 3836 HK) 27
Figure 50: Harmony 4S stores service gross margin Figure 51: Harmony 4S stores service gross profit outlook
39.6%37.6%
44.0%46.0% 45.9% 46.0% 46.0% 46.0%
0%
5%
10%
15%
20%
25%
30%
35%
40%
45%
50%
2010 2011 2012 2013 2014 2015e 2016e 2017e
73 105
182
328
444
537
639
736
44%
73%
81%
35%
21% 19%
15%
0%
10%
20%
30%
40%
50%
60%
70%
80%
90%
-
100
200
300
400
500
600
700
800
2010 2011 2012 2013 2014 2015e 2016e 2017e
Rmb Mn
4S stores service gross profit YoY
Source: Company data, Credit Suisse estimates Source: Company data, Credit Suisse estimates
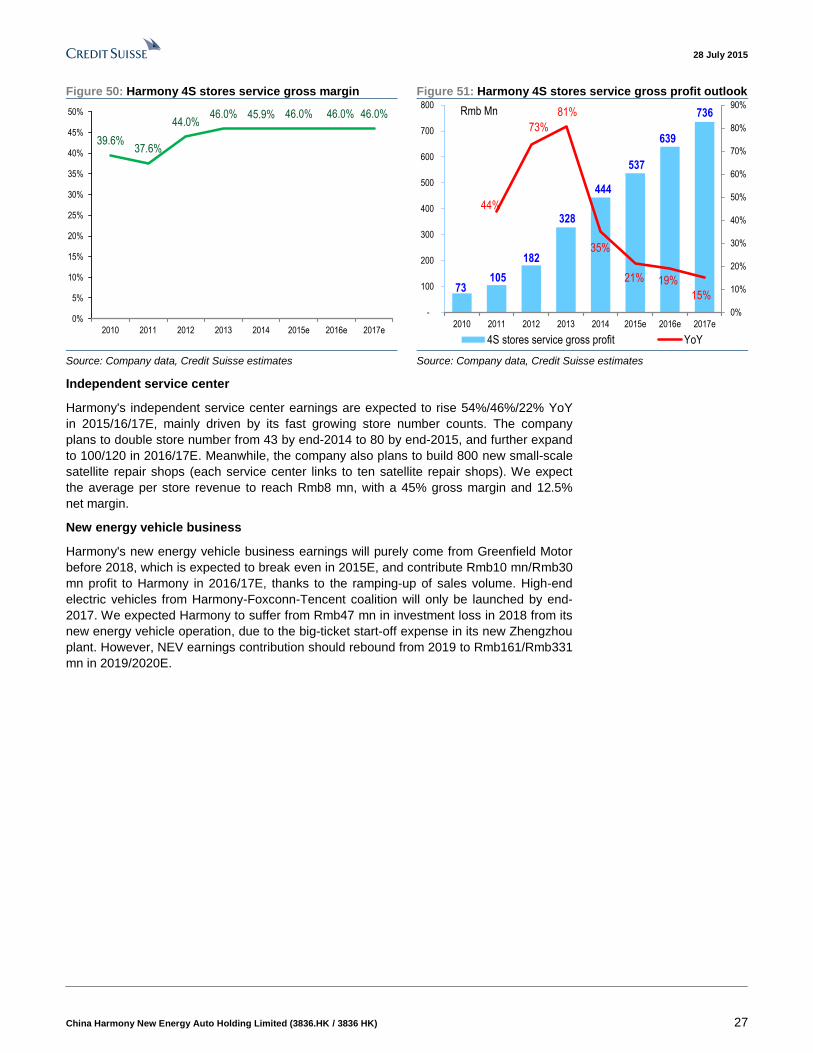
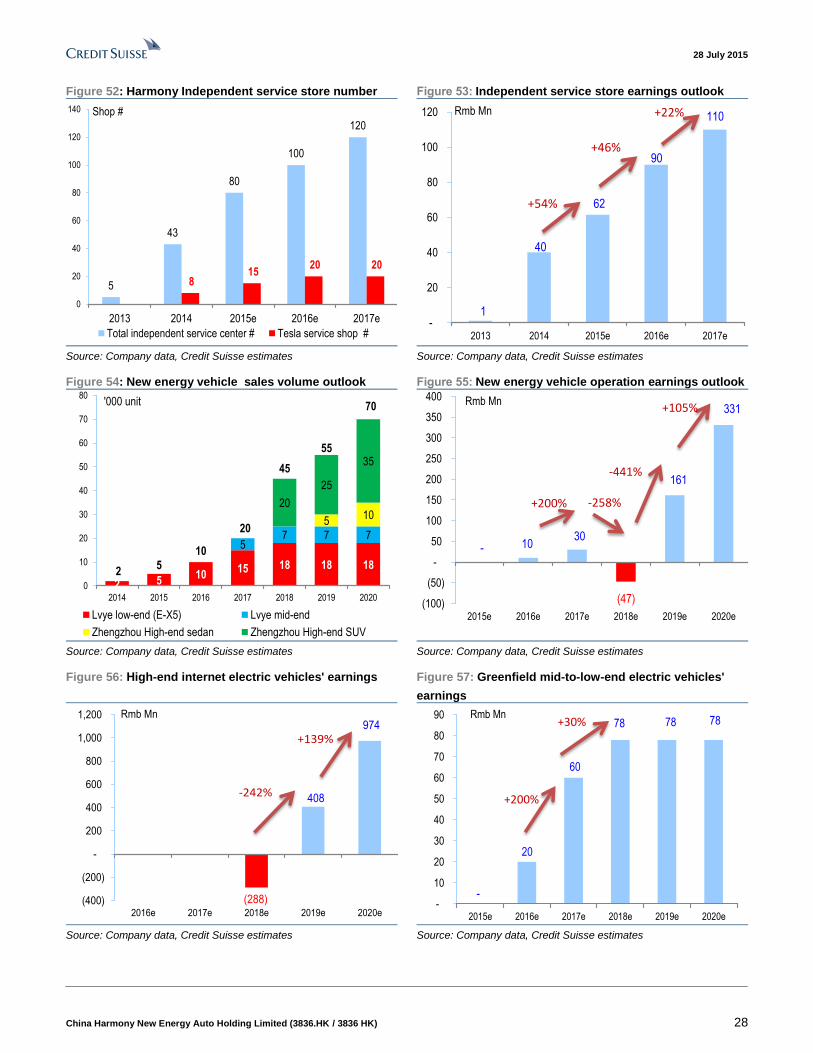
Independent service center
Harmony's independent service center earnings are expected to rise 54%/46%/22% YoY
in 2015/16/17E, mainly driven by its fast growing store number counts. The company
plans to double store number from 43 by end-2014 to 80 by end-2015, and further expand
to 100/120 in 2016/17E. Meanwhile, the company also plans to build 800 new small-scale
satellite repair shops (each service center links to ten satellite repair shops). We expect
the average per store revenue to reach Rmb8 mn, with a 45% gross margin and 12.5%
net margin.
New energy vehicle business
Harmony's new energy vehicle business earnings will purely come from Greenfield Motor
before 2018, which is expected to break even in 2015E, and contribute Rmb10 mn/Rmb30
mn profit to Harmony in 2016/17E, thanks to the ramping-up of sales volume. High-end
electric vehicles from Harmony-Foxconn-Tencent coalition will only be launched by end-
2017. We expected Harmony to suffer from Rmb47 mn in investment loss in 2018 from its
new energy vehicle operation, due to the big-ticket start-off expense in its new Zhengzhou
plant. However, NEV earnings contribution should rebound from 2019 to Rmb161/Rmb331
mn in 2019/2020E.
28 July 2015
China Harmony New Energy Auto Holding Limited (3836.HK / 3836 HK) 28
Figure 52: Harmony Independent service store number Figure 53: Independent service store earnings outlook
5
43
80
100
120
8 15
20 20
0
20
40
60
80
100
120
140
2013 2014 2015e 2016e 2017e
Shop #
Total independent service center # Tesla service shop #
1
40
62
90
110
-
20
40
60
80
100
120
2013 2014 2015e 2016e 2017e
Rmb Mn
+54%
+46%
+22%
Source: Company data, Credit Suisse estimates Source: Company data, Credit Suisse estimates
Figure 54: New energy vehicle sales volume outlook Figure 55: New energy vehicle operation earnings outlook
2 510
15 18 18 18
57 7 7
510
20
25
35
25
10
20
45
55
70
0
10
20
30
40
50
60
70
80
2014 2015 2016 2017 2018 2019 2020
'000 unit
Lvye low-end (E-X5) Lvye mid-end
Zhengzhou High-end sedan Zhengzhou High-end SUV
- 10 30
(47)
161
331
(100)
(50)
-
50
100
150
200
250
300
350
400
2015e 2016e 2017e 2018e 2019e 2020e
Rmb Mn
+200% -258%
-441%
+105%
Source: Company data, Credit Suisse estimates Source: Company data, Credit Suisse estimates
Figure 56: High-end internet electric vehicles' earnings Figure 57: Greenfield mid-to-low-end electric vehicles'
earnings
(288)
408
974
(400)
(200)
-
200
400
600
800
1,000
1,200
2016e 2017e 2018e 2019e 2020e
Rmb Mn
-242%
+139%
-
20
60
78 78 78
-
10
20
30
40
50
60
70
80
90
2015e 2016e 2017e 2018e 2019e 2020e
Rmb Mn
+200%
+30%
Source: Company data, Credit Suisse estimates Source: Company data, Credit Suisse estimates
28 July 2015
China Harmony New Energy Auto Holding Limited (3836.HK / 3836 HK) 29
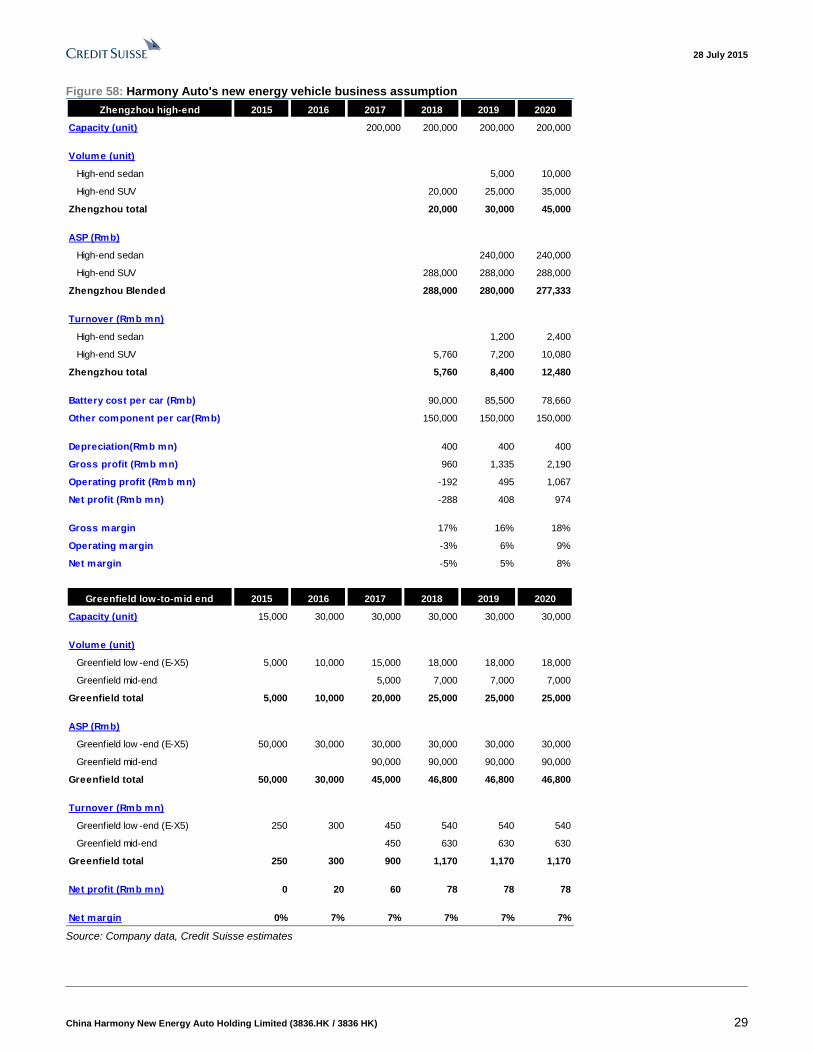
Figure 58: Harmony Auto's new energy vehicle business assumption
Zhengzhou high-end 2015 2016 2017 2018 2019 2020
Capacity (unit) 200,000 200,000 200,000 200,000
Volume (unit)
High-end sedan 5,000 10,000
High-end SUV 20,000 25,000 35,000
Zhengzhou total 20,000 30,000 45,000
ASP (Rmb)
High-end sedan 240,000 240,000
High-end SUV 288,000 288,000 288,000
Zhengzhou Blended 288,000 280,000 277,333
Turnover (Rmb mn)
High-end sedan 1,200 2,400
High-end SUV 5,760 7,200 10,080
Zhengzhou total 5,760 8,400 12,480
Battery cost per car (Rmb) 90,000 85,500 78,660
Other component per car(Rmb) 150,000 150,000 150,000
Depreciation(Rmb mn) 400 400 400
Gross profit (Rmb mn) 960 1,335 2,190
Operating profit (Rmb mn) -192 495 1,067
Net profit (Rmb mn) -288 408 974
Gross margin 17% 16% 18%
Operating margin -3% 6% 9%
Net margin -5% 5% 8%
Greenfield low-to-mid end 2015 2016 2017 2018 2019 2020
Capacity (unit) 15,000 30,000 30,000 30,000 30,000 30,000
Volume (unit)
Greenfield low -end (E-X5) 5,000 10,000 15,000 18,000 18,000 18,000
Greenfield mid-end 5,000 7,000 7,000 7,000
Greenfield total 5,000 10,000 20,000 25,000 25,000 25,000
ASP (Rmb)
Greenfield low -end (E-X5) 50,000 30,000 30,000 30,000 30,000 30,000
Greenfield mid-end 90,000 90,000 90,000 90,000
Greenfield total 50,000 30,000 45,000 46,800 46,800 46,800
Turnover (Rmb mn)
Greenfield low -end (E-X5) 250 300 450 540 540 540
Greenfield mid-end 450 630 630 630
Greenfield total 250 300 900 1,170 1,170 1,170
Net profit (Rmb mn) 0 20 60 78 78 78
Net margin 0% 7% 7% 7% 7% 7% Source: Company data, Credit Suisse estimates
28 July 2015
China Harmony New Energy Auto Holding Limited (3836.HK / 3836 HK) 30
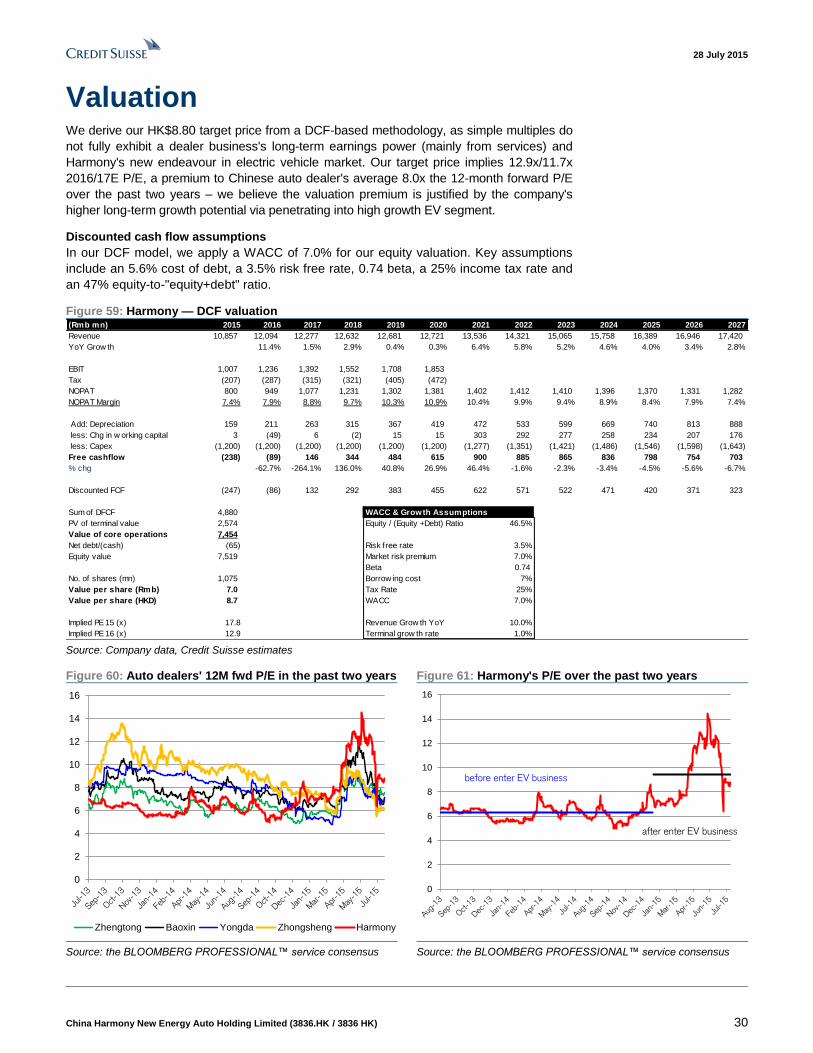
Valuation We derive our HK$8.80 target price from a DCF-based methodology, as simple multiples do
not fully exhibit a dealer business's long-term earnings power (mainly from services) and
Harmony's new endeavour in electric vehicle market. Our target price implies 12.9x/11.7x
2016/17E P/E, a premium to Chinese auto dealer's average 8.0x the 12-month forward P/E
over the past two years – we believe the valuation premium is justified by the company's
higher long-term growth potential via penetrating into high growth EV segment.
Discounted cash flow assumptions
In our DCF model, we apply a WACC of 7.0% for our equity valuation. Key assumptions
include an 5.6% cost of debt, a 3.5% risk free rate, 0.74 beta, a 25% income tax rate and
an 47% equity-to-"equity+debt" ratio.
Figure 59: Harmony — DCF valuation (Rmb mn) 2015 2016 2017 2018 2019 2020 2021 2022 2023 2024 2025 2026 2027
Revenue 10,857 12,094 12,277 12,632 12,681 12,721 13,536 14,321 15,065 15,758 16,389 16,946 17,420
YoY Grow th 11.4% 1.5% 2.9% 0.4% 0.3% 6.4% 5.8% 5.2% 4.6% 4.0% 3.4% 2.8%
EBIT 1,007 1,236 1,392 1,552 1,708 1,853
Tax (207) (287) (315) (321) (405) (472)
NOPAT 800 949 1,077 1,231 1,302 1,381 1,402 1,412 1,410 1,396 1,370 1,331 1,282
NOPAT Margin 7.4% 7.9% 8.8% 9.7% 10.3% 10.9% 10.4% 9.9% 9.4% 8.9% 8.4% 7.9% 7.4%
Add: Depreciation 159 211 263 315 367 419 472 533 599 669 740 813 888
less: Chg in w orking capital 3 (49) 6 (2) 15 15 303 292 277 258 234 207 176
less: Capex (1,200) (1,200) (1,200) (1,200) (1,200) (1,200) (1,277) (1,351) (1,421) (1,486) (1,546) (1,598) (1,643)
Free cashflow (238) (89) 146 344 484 615 900 885 865 836 798 754 703
% chg -62.7% -264.1% 136.0% 40.8% 26.9% 46.4% -1.6% -2.3% -3.4% -4.5% -5.6% -6.7%
Discounted FCF (247) (86) 132 292 383 455 622 571 522 471 420 371 323
Sum of DFCF 4,880 WACC & Growth Assumptions
PV of terminal value 2,574 Equity / (Equity +Debt) Ratio 46.5%
Value of core operations 7,454
Net debt/(cash) (65) Risk free rate 3.5%
Equity value 7,519 Market risk premium 7.0%
Beta 0.74
No. of shares (mn) 1,075 Borrow ing cost 7%
Value per share (Rmb) 7.0 Tax Rate 25%
Value per share (HKD) 8.7 WACC 7.0%
Implied PE 15 (x) 17.8 Revenue Grow th YoY 10.0%
Implied PE 16 (x) 12.9 Terminal grow th rate 1.0% Source: Company data, Credit Suisse estimates
Figure 60: Auto dealers' 12M fwd P/E in the past two years Figure 61: Harmony's P/E over the past two years
0
2
4
6
8
10
12
14
16
Zhengtong Baoxin Yongda Zhongsheng Harmony
0
2
4
6
8
10
12
14
16
before enter EV business
after enter EV business
Source: the BLOOMBERG PROFESSIONAL™ service consensus Source: the BLOOMBERG PROFESSIONAL™ service consensus
28 July 2015
China Harmony New Energy Auto Holding Limited (3836.HK / 3836 HK) 31
Risks Downside risks
Luxury car demand slowdown may ignite price wars and hurt dealers’ margins
Historical data shows a clear correlation between the dealer's new car margins and
market-wide luxury dealer per store sales volumes. If luxury demand decelerates due to a
weaker-than-expected macro-economy and more intensified government anti-corruption
campaign, we see downside risk to dealers' new car sales margins. A slowdown in luxury
car sales and fast-expanding dealership number might drag down per dealership sales
and increase pricing pressure.
The company's NEV development plan may be delayed if it fails to receive a
passenger vehicle production license
The company plans to deliver its sample electric vehicles to Ministry of Industry and
Information Technology (MIIT) in 2H15 as one of the process to apply for new energy
vehicle production license. Any delay in sample EV delivery or failure in passenger vehicle
production license application may impose negative impact on company's new energy
vehicle development plan (both mid-end lithium-ion battery EV and high-end EV models).
Intensified competition in independent service market may result in lower margin or
sales growth of company's independent service business
Given the relatively low entry barriers for independent service market, new entrants,
especially those leading dealers group's foraying into the market may impose margin
depression or sales growth slowing down to company's independent service business.
Upside risks
Integrating internet into auto aftersales market could be a new growth engine
By incorporating internet companies' online platforms with dealers' offline networks, auto
aftersales market may find a new growth engine driver to fuel the online-to-offline (O2O)
segment. The company has established a broad strategic cooperation with many domestic
internet platforms, such as Tencent, Tmall.com, JD.com, and could benefit from the rising
O2O trend.
The government may extend the application of new energy vehicle subsidy to lead-
acid battery low-speed electric vehicle
Currently, only lithium-ion battery electric vehicles are eligible for the government's new
energy vehicle subsidies. With the loosening of government's restriction on low speed
electric vehicles, the government may extend subsidy application and grant subsidy to
lead-acid battery electric vehicle. Company's "Green field" subsidiary could be one of the
key beneficiaries.
Company background
China Harmony New Energy Auto is a leading luxury dealership group in China in terms of
the number of 4S stores (45 by end-2014). Its main focus is on luxury and ultra-luxury auto
brands, such as Rolls-Royce, Aston Martin, Ferrari, Maserati, BMW, Land Rover, Jaguar,
Lexus, MINI, Volvo, and Zinoro. Harmony also operated 43 independent after-sales
service stores by end-2014. The company is transforming into a new energy vehicle (NEV)
maker, after its tie-up with Foxconn and Tencent and after acquiring an 87.6% stake in
Greenfield Motor (a NEV maker).
28 July 2015
China Harmony New Energy Auto Holding Limited (3836.HK / 3836 HK) 32
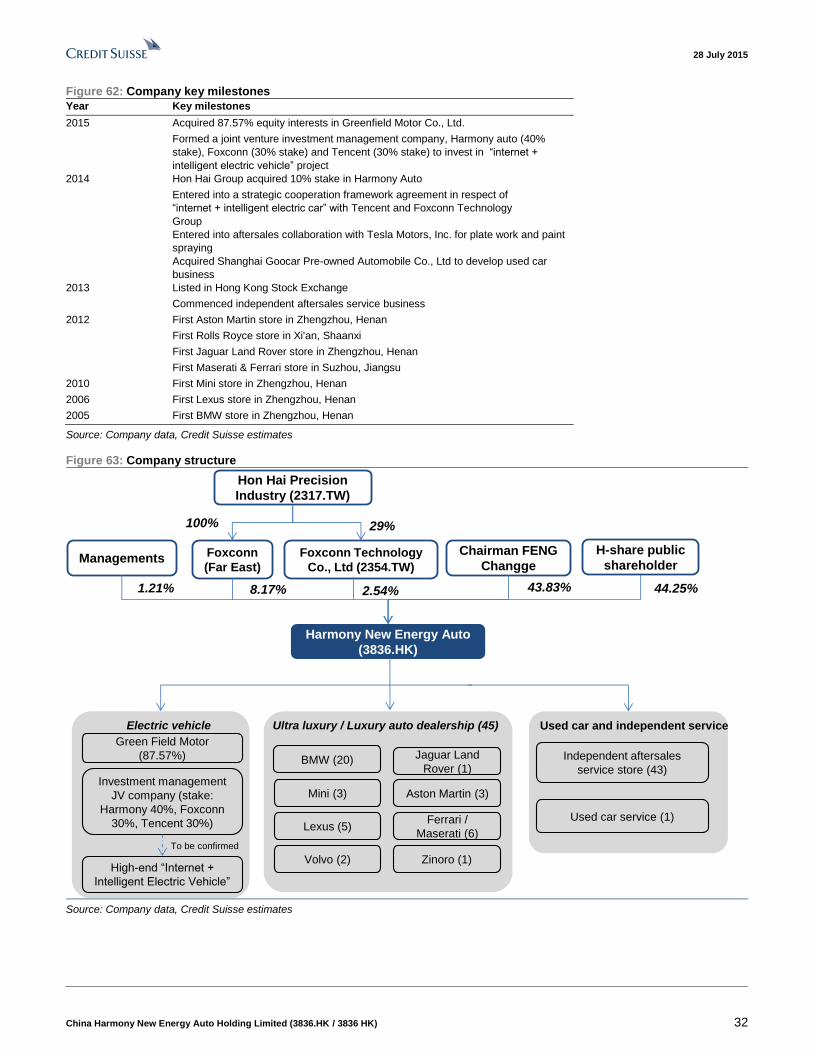
Figure 62: Company key milestones
Year Key milestones
2015 Acquired 87.57% equity interests in Greenfield Motor Co., Ltd.
Formed a joint venture investment management company, Harmony auto (40%
stake), Foxconn (30% stake) and Tencent (30% stake) to invest in “internet +
intelligent electric vehicle” project
2014 Hon Hai Group acquired 10% stake in Harmony Auto
Entered into a strategic cooperation framework agreement in respect of
“internet + intelligent electric car” with Tencent and Foxconn Technology
Group
Entered into aftersales collaboration with Tesla Motors, Inc. for plate work and paint
spraying
Acquired Shanghai Goocar Pre-owned Automobile Co., Ltd to develop used car
business
2013 Listed in Hong Kong Stock Exchange
Commenced independent aftersales service business
2012 First Aston Martin store in Zhengzhou, Henan
First Rolls Royce store in Xi'an, Shaanxi
First Jaguar Land Rover store in Zhengzhou, Henan
First Maserati & Ferrari store in Suzhou, Jiangsu
2010 First Mini store in Zhengzhou, Henan
2006 First Lexus store in Zhengzhou, Henan
2005 First BMW store in Zhengzhou, Henan
Source: Company data, Credit Suisse estimates
Figure 63: Company structure
Harmony New Energy Auto
(3836.HK)
Foxconn
(Far East)
Ultra luxury / Luxury auto dealership (45) Used car and independent service
8.17%
H-share public
shareholder
44.25%
BMW (20) Independent aftersales
service store (43)
Electric vehicle
Green Field Motor
(87.57%)
Managements
1.21%
Chairman FENG
Changge
43.83%
Mini (3)
Lexus (5)
Volvo (2) Zinoro (1)
Jaguar Land
Rover (1)
Aston Martin (3)
Ferrari /
Maserati (6)
Used car service (1)
Investment management
JV company (stake:
Harmony 40%, Foxconn
30%, Tencent 30%)
High-end “Internet +
Intelligent Electric Vehicle”
To be confirmed
Hon Hai Precision
Industry (2317.TW)
Foxconn Technology
Co., Ltd (2354.TW)
2.54%
29%100%
Source: Company data, Credit Suisse estimates
28 July 2015
China Harmony New Energy Auto Holding Limited (3836.HK / 3836 HK) 33
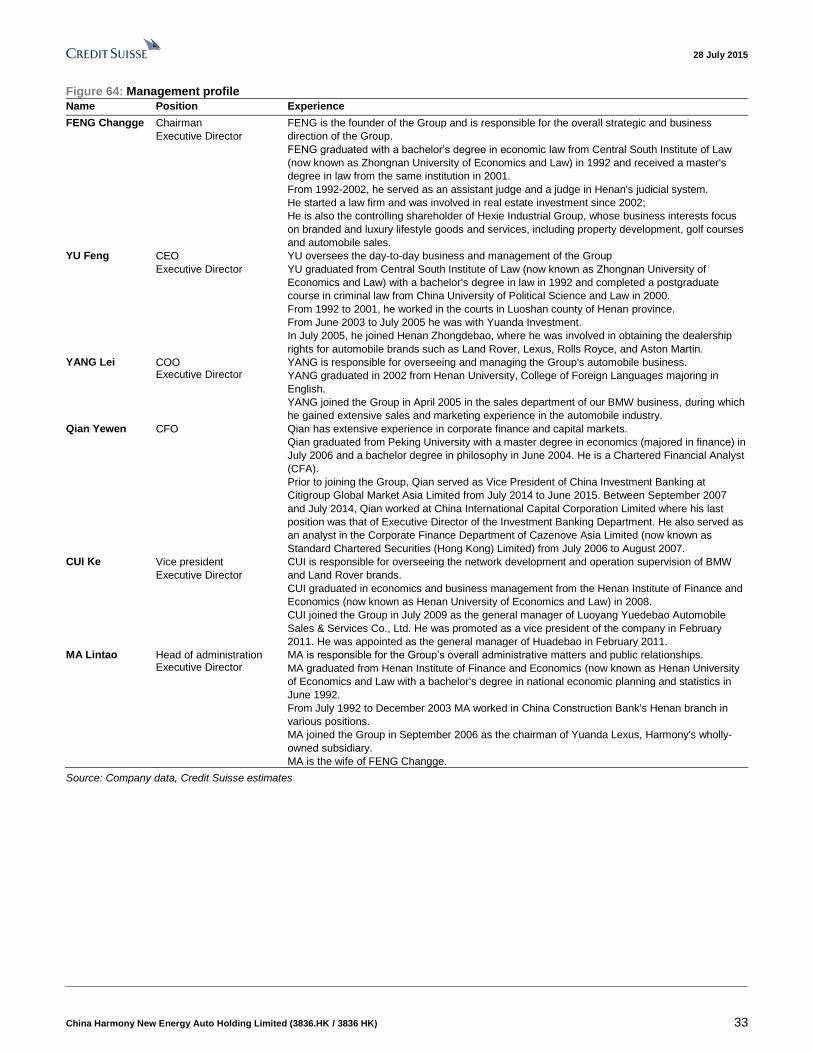
Figure 64: Management profile
Name Position Experience
FENG Changge Chairman
Executive Director
FENG is the founder of the Group and is responsible for the overall strategic and business
direction of the Group.
FENG graduated with a bachelor’s degree in economic law from Central South Institute of Law
(now known as Zhongnan University of Economics and Law) in 1992 and received a master's
degree in law from the same institution in 2001.
From 1992-2002, he served as an assistant judge and a judge in Henan's judicial system.
He started a law firm and was involved in real estate investment since 2002;
He is also the controlling shareholder of Hexie Industrial Group, whose business interests focus
on branded and luxury lifestyle goods and services, including property development, golf courses
and automobile sales.
YU Feng CEO
Executive Director
YU oversees the day-to-day business and management of the Group
YU graduated from Central South Institute of Law (now known as Zhongnan University of
Economics and Law) with a bachelor's degree in law in 1992 and completed a postgraduate
course in criminal law from China University of Political Science and Law in 2000.
From 1992 to 2001, he worked in the courts in Luoshan county of Henan province.
From June 2003 to July 2005 he was with Yuanda Investment.
In July 2005, he joined Henan Zhongdebao, where he was involved in obtaining the dealership
rights for automobile brands such as Land Rover, Lexus, Rolls Royce, and Aston Martin.
YANG Lei COO Executive Director
YANG is responsible for overseeing and managing the Group's automobile business.
YANG graduated in 2002 from Henan University, College of Foreign Languages majoring in
English.
YANG joined the Group in April 2005 in the sales department of our BMW business, during which
he gained extensive sales and marketing experience in the automobile industry.
Qian Yewen CFO Qian has extensive experience in corporate finance and capital markets.
Qian graduated from Peking University with a master degree in economics (majored in finance) in
July 2006 and a bachelor degree in philosophy in June 2004. He is a Chartered Financial Analyst
(CFA).
Prior to joining the Group, Qian served as Vice President of China Investment Banking at
Citigroup Global Market Asia Limited from July 2014 to June 2015. Between September 2007
and July 2014, Qian worked at China International Capital Corporation Limited where his last
position was that of Executive Director of the Investment Banking Department. He also served as
an analyst in the Corporate Finance Department of Cazenove Asia Limited (now known as
Standard Chartered Securities (Hong Kong) Limited) from July 2006 to August 2007.
CUI Ke Vice president
Executive Director
CUI is responsible for overseeing the network development and operation supervision of BMW
and Land Rover brands.
CUI graduated in economics and business management from the Henan Institute of Finance and
Economics (now known as Henan University of Economics and Law) in 2008.
CUI joined the Group in July 2009 as the general manager of Luoyang Yuedebao Automobile
Sales & Services Co., Ltd. He was promoted as a vice president of the company in February
2011. He was appointed as the general manager of Huadebao in February 2011.
MA Lintao Head of administration Executive Director
MA is responsible for the Group’s overall administrative matters and public relationships.
MA graduated from Henan Institute of Finance and Economics (now known as Henan University
of Economics and Law with a bachelor's degree in national economic planning and statistics in
June 1992.
From July 1992 to December 2003 MA worked in China Construction Bank's Henan branch in
various positions.
MA joined the Group in September 2006 as the chairman of Yuanda Lexus, Harmony's wholly-
owned subsidiary.
MA is the wife of FENG Changge.
Source: Company data, Credit Suisse estimates
28 July 2015
China Harmony New Energy Auto Holding Limited (3836.HK / 3836 HK) 34
Companies Mentioned (Price as of 27-Jul-2015)
Alibaba Group Holding Limited (BABA.N, $83.02) BAIC Motor Corporation Limited (1958.HK, HK$6.95) BMW (BMWG.DE, €89.08) Baidu Inc (BIDU.OQ, $206.25) Baoxin Auto Group Ltd (1293.HK, HK$3.7) China Harmony New Energy Auto Holding Limited (3836.HK, HK$6.21, OUTPERFORM[V], TP HK$8.8) China Yongda Automobiles Services Holding limited (3669.HK, HK$4.59) China Zhengtong Auto Services Holding limited (1728.HK, HK$4.14) Foxconn Technology Corp (2354.TW, NT$93.0) General Motors Corp. (GM.N, $31.06) Hon Hai Precision (2317.TW, NT$90.1) SAIC Motor Corp Ltd (600104.SS, Rmb19.2) Sina Corporation (SINA.OQ, $42.51) Tencent Holdings (0700.HK, HK$145.6) Tesla Motors Inc. (TSLA.OQ, $265.41) Weichai Power Co. Ltd (2338.HK, HK$10.7) Zhongsheng Group Holding limited (0881.HK, HK$4.53)
Disclosure Appendix
Important Global Disclosures
I, Bin Wang, certify that (1) the views expressed in this report accurately reflect my personal views about all of the subject companies and securities and (2) no part of my compensation was, is or will be directly or indirectly related to the specific recommendations or views expressed in this report.
The analyst(s) responsible for preparing this research report received Compensation that is based upon various factors including Credit Suisse's total revenues, a portion of which are generated by Credit Suisse's investment banking activities
As of December 10, 2012 Analysts’ stock rating are defined as follows:
Outperform (O) : The stock’s total return is expected to outperform the relevant benchmark*over the next 12 months.
Neutral (N) : The stock’s total return is expected to be in line with the relevant benchmark* over the next 12 months.
Underperform (U) : The stock’s total return is expected to underperform the relevant benchmark* over the next 12 months.
*Relevant benchmark by region: As of 10th December 2012, Japanese ratings are based on a stock’s total return relative to the analyst's coverage universe which consists of all companies covered by the analyst within the relevant sector, with Outperforms representing the most attractive, Neutrals the less attractive, and Underperforms the least attractive investment opportunities. As of 2nd October 2012, U.S. and Canadian as well as European ra tings are based on a stock’s total return relative to the analyst's coverage universe which consists of all companies covered by the analyst within the relevant sector, with Outperforms representing the most attractive, Neutrals the less attractive, and Underperforms the least a ttractive investment opportunities. For Latin American and non-Japan Asia stocks, ratings are based on a stock’s total return relative to the average total return of the relevant country or regional benchmark; prior to 2nd October 2012 U.S. and Canadian ratings were based on (1) a stock’s absolute total return potential to its current share price and (2) the relative attractiven ess of a stock’s total return potential within an analyst’s coverage universe. For Australian and New Zealand stocks, the expected total return (ETR) calculation includes 12-month rolling dividend yield. An Outperform rating is assigned where an ETR is greater than or equal to 7.5%; Underperform where an ETR less than or equal to 5%. A Neutral may be assigned where the ETR is between -5% and 15%. The overlapping rating range allows analysts to assign a rating that puts ETR in the context of associated risks. Prior to 18 May 2015, ETR ranges for Outperform and Underperform ratings did not overlap with Neutral thresholds between 15% and 7.5%, which was in operation from 7 July 2011.
Restricted (R) : In certain circumstances, Credit Suisse policy and/or applicable law and regulations preclude certain types of communications, including an investment recommendation, during the course of Credit Suisse's engagement in an investment banking transaction and in certain other circumstances.
Volatility Indicator [V] : A stock is defined as volatile if the stock price has moved up or down by 20% or more in a month in at least 8 of the past 24 months or the analyst expects significant volatility going forward.
Analysts’ sector weightings are distinct from analysts’ stock ratings and are based on the analyst’s expectations for the fundamentals and/or valuation of the sector* relative to the group’s historic fundamentals and/or valuation:
Overweight : The analyst’s expectation for the sector’s fundamentals and/or valuation is favorable over the next 12 months.
Market Weight : The analyst’s expectation for the sector’s fundamentals and/or valuation is neutral over the next 12 months.
Underweight : The analyst’s expectation for the sector’s fundamentals and/or valuation is cautious over the next 12 months.
*An analyst’s coverage sector consists of all companies covered by the analyst within the relevant sec tor. An analyst may cover multiple sectors.
28 July 2015
China Harmony New Energy Auto Holding Limited (3836.HK / 3836 HK) 35
Credit Suisse's distribution of stock ratings (and banking clients) is:
Global Ratings Distribution
Rating Versus universe (%) Of which banking clients (%)
Outperform/Buy* 49% (27% banking clients)
Neutral/Hold* 35% (43% banking clients)
Underperform/Sell* 13% (38% banking clients)
Restricted 3%
*For purposes of the NYSE and NASD ratings distribution disclosure requirements, our stock ratings of Outperform, Neutral, an d Underperform most closely correspond to Buy, Hold, and Sell, respectively; however, the meanings are not the same, as our stock ratings are determined on a relati ve basis. (Please refer to definitions above.) An investor's decision to buy or sell a security should be based on investment objec tives, current holdings, and other individual factors.
Credit Suisse’s policy is to update research reports as it deems appropriate, based on developments with the subject company, the sector or the market that may have a material impact on the research views or opinions stated herein.
Credit Suisse's policy is only to publish investment research that is impartial, independent, clear, fair and not misleading. For more detail please refer to Credit Suisse's Policies for Managing Conflicts of Interest in connection with Investment Research: http://www.csfb.com/research-and-analytics/disclaimer/managing_conflicts_disclaimer.html
Credit Suisse does not provide any tax advice. Any statement herein regarding any US federal tax is not intended or written to be used, and cannot be used, by any taxpayer for the purposes of avoiding any penalties.
Price Target: (12 months) for China Harmony New Energy Auto Holding Limited (3836.HK)
Method: We derive our HK$8.80 target price for China Harmony New Energy Auto Holding Limited from a DCF (discounted cash flow)-based methodology, as simple multiples do not fully exhibit a dealer business's long-term earnings power (mainly from services) and Harmony's new endeavour in electric vehicle market. We apply a WACC (weighted average cost of capital) of 7.0% for our equity valuation. Key assumptions include an 5.6% cost of debt, a 3.5% risk free rate, 0.74 beta, a 25% income tax rate and an 47% equity-to-"equity+debt" ratio. Our target price implies 12.9x/11.7x 2016/17E P/E (price-to-earnings), a premium to other Chinese auto dealer peers. We believe the valuation premium is justified by company's higher long-term growth potential via penetrating into high growth EV segment.
Risk: Risks that could impede achievement of our target price of HK$8.80 for China Harmony New Energy Auto Holding Limited include: (1) Luxury car demand slowdown may ignite price wars and hurt dealers’ margins; (2) Company's EV development plan may be delayed if it fails in its application for a passenger vehicle production license; and (3) Intensified competition in independent service market may result in lower margin or sales growth of company's independent service business.
Please refer to the firm's disclosure website at https://rave.credit-suisse.com/disclosures for the definitions of abbreviations typically used in the target price method and risk sections.
See the Companies Mentioned section for full company names
The subject company (3836.HK) currently is, or was during the 12-month period preceding the date of distribution of this report, a client of Credit Suisse.
Credit Suisse provided investment banking services to the subject company (3836.HK) within the past 12 months.
Credit Suisse has managed or co-managed a public offering of securities for the subject company (3836.HK) within the past 12 months.
Credit Suisse has received investment banking related compensation from the subject company (3836.HK) within the past 12 months
Credit Suisse expects to receive or intends to seek investment banking related compensation from the subject company (3836.HK) within the next 3 months.
Important Regional Disclosures
Singapore recipients should contact Credit Suisse AG, Singapore Branch for any matters arising from this research report.
The analyst(s) involved in the preparation of this report have not visited the material operations of the subject company (3836.HK) within the past 12 months
Restrictions on certain Canadian securities are indicated by the following abbreviations: NVS--Non-Voting shares; RVS--Restricted Voting Shares; SVS--Subordinate Voting Shares.
Individuals receiving this report from a Canadian investment dealer that is not affiliated with Credit Suisse should be advised that this report may not contain regulatory disclosures the non-affiliated Canadian investment dealer would be required to make if this were its own report.
For Credit Suisse Securities (Canada), Inc.'s policies and procedures regarding the dissemination of equity research, please visit https://www.credit-suisse.com/sites/disclaimers-ib/en/canada-research-policy.html.
28 July 2015
China Harmony New Energy Auto Holding Limited (3836.HK / 3836 HK) 36
Credit Suisse has acted as lead manager or syndicate member in a public offering of securities for the subject company (3836.HK) within the past 3 years.
As of the date of this report, Credit Suisse acts as a market maker or liquidity provider in the equities securities that are the subject of this report.
Principal is not guaranteed in the case of equities because equity prices are variable.
Commission is the commission rate or the amount agreed with a customer when setting up an account or at any time after that.
To the extent this is a report authored in whole or in part by a non-U.S. analyst and is made available in the U.S., the following are important disclosures regarding any non-U.S. analyst contributors: The non-U.S. research analysts listed below (if any) are not registered/qualified as research analysts with FINRA. The non-U.S. research analysts listed below may not be associated persons of CSSU and therefore may not be subject to the NASD Rule 2711 and NYSE Rule 472 restrictions on communications with a subject company, public appearances and trading securities held by a research analyst account.
Credit Suisse (Hong Kong) Limited ........................................................................................................................................ Bin Wang ; Mark Mao
For Credit Suisse disclosure information on other companies mentioned in this report, please visit the website at https://rave.credit-suisse.com/disclosures or call +1 (877) 291-2683.
28 July 2015
China Harmony New Energy Auto Holding Limited (3836.HK / 3836 HK) 37
References in this report to Credit Suisse include all of the subsidiaries and affiliates of Credit Suisse operating under its investment banking division. For more information on our structure, please use the following link: https://www.credit-suisse.com/who-we-are This report may contain material that is not directed to, or intended for distribution to or use by, any person or entity who is a citizen or resident of or located in any locality, state, country or other jurisdiction where such distribution, publication, availability or use would be contrary to law or regulation or which would subject Credit Suisse AG or its affiliates ("CS") to any registration or licensing requirement within such jurisdiction. All material presented in this report, unless specifically indicated otherwise, is under copyright to CS. None of the material, nor its content, nor any copy of it, may be altered in any way, transmitted to, copied or distributed to any other party, without the prior express written permission of CS. All trademarks, service marks and logos used in this report are trademarks or service marks or registered trademarks or service marks of CS or its affiliates. The information, tools and material presented in this report are provided to you for information purposes only and are not to be used or considered as an offer or the solicitation of an offer to sell or to buy or subscribe for securities or other financial instruments. CS may not have taken any steps to ensure that the securities referred to in this report are suitable for any particular investor. CS will not treat recipients of this report as its customers by virtue of their receiving this report. The investments and services contained or referred to in this report may not be suitable for you and it is recommended that you consult an independent investment advisor if you are in doubt about such investments or investment services. Nothing in this report constitutes investment, legal, accounting or tax advice, or a representation that any investment or strategy is suitable or appropriate to your individual circumstances, or otherwise constitutes a personal recommendation to you. CS does not advise on the tax consequences of investments and you are advised to contact an independent tax adviser. Please note in particular that the bases and levels of taxation may change. Information and opinions presented in this report have been obtained or derived from sources believed by CS to be reliable, but CS makes no representation as to their accuracy or completeness. CS accepts no liability for loss arising from the use of the material presented in this report, except that this exclusion of liability does not apply to the extent that such liability arises under specific statutes or regulations applicable to CS. This report is not to be relied upon in substitution for the exercise of independent judgment. CS may have issued, and may in the future issue, other communications that are inconsistent with, and reach different conclusions from, the information presented in this report. Those communications reflect the different assumptions, views and analytical methods of the analysts who prepared them and CS is under no obligation to ensure that such other communications are brought to the attention of any recipient of this report. Some investments referred to in this report will be offered solely by a single entity and in the case of some investments solely by CS, or an associate of CS or CS may be the only market maker in such investments. Past performance should not be taken as an indication or guarantee of future performance, and no representation or warranty, express or implied, is made regarding future performance. Information, opinions and estimates contained in this report reflect a judgment at its original date of publication by CS and are subject to change without notice. The price, value of and income from any of the securities or financial instruments mentioned in this report can fall as well as rise. The value of securities and financial instruments is subject to exchange rate fluctuation that may have a positive or adverse effect on the price or income of such securities or financial instruments. Investors in securities such as ADR's, the values of which are influenced by currency volatility, effectively assume this risk. Structured securities are complex instruments, typically involve a high degree of risk and are intended for sale only to sophisticated investors who are capable of understanding and assuming the risks involved. The market value of any structured security may be affected by changes in economic, financial and political factors (including, but not limited to, spot and forward interest and exchange rates), time to maturity, market conditions and volatility, and the credit quality of any issuer or reference issuer. Any investor interested in purchasing a structured product should conduct their own investigation and analysis of the product and consult with their own professional advisers as to the risks involved in making such a purchase. Some investments discussed in this report may have a high level of volatility. High volatility investments may experience sudden and large falls in their value causing losses when that investment is realised. Those losses may equal your original investment. Indeed, in the case of some investments the potential losses may exceed the amount of initial investment and, in such circumstances, you may be required to pay more money to support those losses. Income yields from investments may fluctuate and, in consequence, initial capital paid to make the investment may be used as part of that income yield. Some investments may not be readily realisable and it may be difficult to sell or realise those investments, similarly it may prove difficult for you to obtain reliable information about the value, or risks, to which such an investment is exposed. This report may provide the addresses of, or contain hyperlinks to, websites. Except to the extent to which the report refers to website material of CS, CS has not reviewed any such site and takes no responsibility for the content contained therein. Such address or hyperlink (including addresses or hyperlinks to CS's own website material) is provided solely for your convenience and information and the content of any such website does not in any way form part of this document. Accessing such website or following such link through this report or CS's website shall be at your own risk. This report is issued and distributed in Europe (except Switzerland) by Credit Suisse Securities (Europe) Limited, One Cabot Square, London E14 4QJ, England, which is authorised by the Prudential Regulation Authority and regulated by the Financial Conduct Authority and the Prudential Regulation Authority. This report is being distributed in Germany by Credit Suisse Securities (Europe) Limited Niederlassung Frankfurt am Main regulated by the Bundesanstalt fuer Finanzdienstleistungsaufsicht ("BaFin"). This report is being distributed in the United States and Canada by Credit Suisse Securities (USA) LLC; in Switzerland by Credit Suisse AG; in Brazil by Banco de Investimentos Credit Suisse (Brasil) S.A or its affiliates; in Mexico by Banco Credit Suisse (México), S.A. (transactions related to the securities mentioned in this report will only be effected in compliance with applicable regulation); in Japan by Credit Suisse Securities (Japan) Limited, Financial Instruments Firm, Director-General of Kanto Local Finance Bureau (Kinsho) No. 66, a member of Japan Securities Dealers Association, The Financial Futures Association of Japan, Japan Investment Advisers Association, Type II Financial Instruments Firms Association; elsewhere in Asia/ Pacific by whichever of the following is the appropriately authorised entity in the relevant jurisdiction: Credit Suisse (Hong Kong) Limited, Credit Suisse Equities (Australia) Limited, Credit Suisse Securities (Thailand) Limited, regulated by the Office of the Securities and Exchange Commission, Thailand, having registered address at 990 Abdulrahim Place, 27th Floor, Unit 2701, Rama IV Road, Silom, Bangrak, Bangkok 10500, Thailand, Tel. +66 2614 6000, Credit Suisse Securities (Malaysia) Sdn Bhd, Credit Suisse AG, Singapore Branch, Credit Suisse Securities (India) Private Limited (CIN no. U67120MH1996PTC104392) regulated by the Securities and Exchange Board of India (registration Nos. INB230970637; INF230970637; INB010970631; INF010970631), having registered address at 9th Floor, Ceejay House, Dr.A.B. Road, Worli, Mumbai - 18, India, T- +91-22 6777 3777, Credit Suisse Securities (Europe) Limited, Seoul Branch, Credit Suisse AG, Taipei Securities Branch, PT Credit Suisse Securities Indonesia, Credit Suisse Securities (Philippines ) Inc., and elsewhere in the world by the relevant authorised affiliate of the above. Research on Taiwanese securities produced by Credit Suisse AG, Taipei Securities Branch has been prepared by a registered Senior Business Person. Research provided to residents of Malaysia is authorised by the Head of Research for Credit Suisse Securities (Malaysia) Sdn Bhd, to whom they should direct any queries on +603 2723 2020. This report has been prepared and issued for distribution in Singapore to institutional investors, accredited investors and expert investors (each as defined under the Financial Advisers Regulations) only, and is also distributed by Credit Suisse AG, Singapore branch to overseas investors (as defined under the Financial Advisers Regulations). By virtue of your status as an institutional investor, accredited investor, expert investor or overseas investor, Credit Suisse AG, Singapore branch is exempted from complying with certain compliance requirements under the Financial Advisers Act, Chapter 110 of Singapore (the "FAA"), the Financial Advisers Regulations and the relevant Notices and Guidelines issued thereunder, in respect of any financial advisory service which Credit Suisse AG, Singapore branch may provide to you. This information is being distributed by Credit Suisse AG, Dubai Branch, duly licensed and regulated by the Dubai Financial Services Authority (DFSA), and is directed at Professional Clients or Market Counterparties only, as defined by the DFSA. The financial products or financial services to which the information relates will only be made available to a client who meets the regulatory criteria to be a Professional Client or Market Counterparty only, as defined by the DFSA, and is not intended for any other person. This research may not conform to Canadian disclosure requirements. In jurisdictions where CS is not already registered or licensed to trade in securities, transactions will only be effected in accordance with applicable securities legislation, which will vary from jurisdiction to jurisdiction and may require that the trade be made in accordance with applicable exemptions from registration or licensing requirements. Non-U.S. customers wishing to effect a transaction should contact a CS entity in their local jurisdiction unless governing law permits otherwise. U.S. customers wishing to effect a transaction should do so only by contacting a representative at Credit Suisse Securities (USA) LLC in the U.S. Please note that this research was originally prepared and issued by CS for distribution to their market professional and institutional investor customers. Recipients who are not market professional or institutional investor customers of CS should seek the advice of their independent financial advisor prior to taking any investment decision based on this report or for any necessary explanation of its contents. This research may relate to investments or services of a person outside of the UK or to other matters which are not authorised by the Prudential Regulation Authority and regulated by the Financial Conduct Authority and the Prudential Regulation Authority or in respect of which the protections of the Prudential Regulation Authority and Financial Conduct Authority for private customers and/or the UK compensation scheme may not be available, and further details as to where this may be the case are available upon request in respect of this report. CS may provide various services to US municipal entities or obligated persons ("municipalities"), including suggesting individual transactions or trades and entering into such transactions. Any services CS provides to municipalities are not viewed as "advice" within the meaning of Section 975 of the Dodd-Frank Wall Street Reform and Consumer Protection Act. CS is providing any such services and related information solely on an arm's length basis and not as an advisor or fiduciary to the municipality. In connection with the provision of the any such services, there is no agreement, direct or indirect, between any municipality (including the officials, management, employees or agents thereof) and CS for CS to provide advice to the municipality. Municipalities should consult with their financial, accounting and legal advisors regarding any such services provided by CS. In addition, CS is not acting for direct or indirect compensation to solicit the municipality on behalf of an unaffiliated broker, dealer, municipal securities dealer, municipal advisor, or investment adviser for the purpose of obtaining or retaining an engagement by the municipality for or in connection with Municipal Financial Products, the issuance of municipal securities, or of an investment adviser to provide investment advisory services to or on behalf of the municipality. If this report is being distributed by a financial institution other than Credit Suisse AG, or its affiliates, that financial institution is solely responsible for distribution. Clients of that institution should contact that institution to effect a transaction in the securities mentioned in this report or require further information. This report does not constitute investment advice by Credit Suisse to the clients of the distributing financial institution, and neither Credit Suisse AG, its affiliates, and their respective officers, directors and employees accept any liability whatsoever for any direct or consequential loss arising from their use of this report or its content. Principal is not guaranteed. Commission is the commission rate or the amount agreed with a customer when setting up an account or at any time after that.
Copyright © 2015 CREDIT SUISSE AG and/or its affiliates. All rights reserved.
Investment principal on bonds can be eroded depending on sale price or market price. In addition, there are bonds on which investment principal can be eroded due to changes in redemption amounts. Care is required when investing in such instruments. When you purchase non-listed Japanese fixed income securities (Japanese government bonds, Japanese municipal bonds, Japanese government guaranteed bonds, Japanese corporate bonds) from CS as a seller, you will be requested to pay the purchase price only.
AU0400.doc