Embed Size (px)
Citation preview

China Electricity Supply: Challenges and TrendsIs there Light at the End of the Tunnel?
Liutong Zhang ([email protected])

The Lantau Group
Renewable curtailment in China – All ready to generate but no place to go
1
TWh
RE curtailment in China
50
89
34
5
0
10
20
30
40
50
60
70
80
90
100
Hydrocurtailment*
2015 windcurtailment
2015 solarcurtailment
Total
Total curtailment amount in 2015 is equivalent
to 2x Singapore’s power consumption
This presentation is to discuss the challenges facing China electricity supply
Hydro
Wind
Solar
Introduction
It is very common to see titles like below in
the newspaper in the past year

The Lantau Group
Agenda
1
2
3
4
5
Background of China electricity market
Market fundamentals
Grid infrastructure
Policy and Regulation
Summary
2
The Lantau Group
China is not a monolithic region – huge differences in energy drivers, ranging
from fuel access, to demand growth and development trends
3
Xinjiang
Tibet
Qinghai
Gansu
Inner Mongolia
Ningxia
Sichuan
Yunnan
Guizhou
Chongqing
Fujian
Taiwan
Jiangxi
Guangxi
Hunan
Hubei
Henan
Anhui
Jiangsu
Shanghai
Shandong
Liaoning
Jilin
Heilongjiang
Shaanxi
Hebei
Beijing
Zhejiang
Hainan
Shanxi
Guangdong
China’s
hydropower
bases
China’s coal/unconventional
gases/wind/solar energy bases
and China’s future energy
warehouses
China’s most
developed and
populated regions and
energy/power demand
centers

The Lantau Group
Generation
• SOE generators
• local government-owned generators
• IPPs
• Others
End-users
Regulatory
Legislation: NPC
State Council
NDRC, NEA, MoF,
MEP, …
Provincial DRC and
others
City DRC and others
Grid operators
Local governments
Central Government
More on
Implementation and
monitoring roles
Generation
Reform initiatives:
• On-grid pricing
reform
Grid operators as single buyers
(Increasingly more direct purchase)
Transmission
• SGCC (State Grid)
• CSG (China Southern Grid)
• Local government-owned grid operators
Distribution
• SGCC
• CSG
• Local government-owned grid operators
Retail:
• SGCC and CSG subsidiaries;
• local government-owned grid operators;
• independent retailers
Reform initiatives:
• Incremental
demand open to
private retailers
(“direct power
purchase”)
• Pricing of
transmission
and distribution
services
• Offtake policy of
renewables
• Reform of
dispatch policies
The market is regulated, and dominated by powerful players with heavy
government involvement at both the central and local levels
4

The Lantau Group
China’s confusing quota-based dispatch system: annual quota allocations are
currently linked to political factors, not just economic ones
5
General guideline of dispatch document from
the Economic and Information Commission
The dispatch order from local generation sources
(“energy-saving power dispatch”):
• Intermittent renewable resources such as wind,
solar, wave and run-of-the-river hydro;
• Hyro-power with storage, municipality waste
generation and geothermal
• Nuclear plant
• Power generation from integrated use of waste
heat, waste gas and coal-bed methane from non-
coal resources;
• National demonstration project (like IGCC);
• Coal-fired combined heat and power (CHP);
• Natural gas and coal-to-gas generation plant;
• Coal-fired power plants and
• Fuel oil-fired power plants.
“Unified Dispatch and Multi-level
Management” dispatch principle
Level Entity Key FunctionsNational dispatch
organisation
1
State Grid Inter-regional
balancing, inter-
regional dispatch
Regional dispatch
organisation
2
Regional grid
companies
Inter-provincial
balancing, inter-
provincial dispatch
Provincial (PDO) (
3
Provincial grid
companies
Intra-provincial
balancing, intra-
provincial dispatch,
coordinating load
management
Prefecture
dispatch
organisation
4
Prefecture
power supply
organizations
Prefecture load
management
County dispatch
organisation
5
County power
supply
organisations
County load
management

The Lantau Group6
Gansu Example: allocation of dispatched quota for different generation
sources in 2016
Total Consumption 104.2 TWh
Export 12 TWh
Total Generation 116.2 TWh
Quota for provincial dispatch 89 TWh
Less Lijiaxia hydro 0.5 TWh
Less captive generation 15 TWh
Local generation 73.5 TWh
Priority dispatch (1st type)
10 TWhWind and solar
19.9 TWhCoal peaking
2.5 TWhGrid safety
7.6 TWhCombined heat and power
6.7 TWhCogen
Priority dispatch (2nd type)
23 TWhHydro-power
Dispatch not under priority
dispatch (likely to be coal)3.8 TWh
Source: Gansu Economic and Information Commission
Some coal and hydro-power plants are
under regional dispatch for inter-provincial
balancing
Gansu wind capacity: 12.7 GW
Gansu solar capacity: 6.78 GW
The guaranteed generation quota implies
that the minimum hour is only about 513,
far below National Development Reform
Commission’s guidance of 1,800 hours for
wind and 1,400-1,500 hours for solar

The Lantau Group
Summary: The Chinese Electricity Sector
• A country with huge differences among the provinces in energy drivers, ranging from fuel
access, to demand growth and development trends
• The market is regulated, and dominated by powerful players with heavy government involvement
at both the central and local levels
– China’s power sector operates more like a merchant market than a traditional PPA market
• On-grid pricing provides no long-term pricing certainty
• On-grid pricing reflects expectations of dispatched generation “sales” which may not materialise
• Overall dispatch regime is complicated and subject to non-economic factors
– Transmission and Distribution reforms are key to ensure other reforms (like direct power purchase) can
work.
• Legal or functional separation between transmission and distribution is required to allow fair and efficient third-party
access
• Allow third parties to investment on grid assets and efficient regulation on interfaces between them and dominant players
• Pricing of grid services (including ancillary services if grid operators are obligated to provide them)
• Power dispatch is based on annual quota, which is still linked to political factors, not just
economic ones
– Although solar, wind and hydropower generation is in the priority dispatch list, their generation is not
guaranteed as the grid also has to accommodate many other types of “priority” dispatch power plants.
7

The Lantau Group
Agenda
1
2
3
4
5
Background of China electricity market
Market fundamentals
Grid infrastructure
Policy and Regulation
Summary
8

The Lantau Group9
0
500
1,000
1,500
2,000
2,500
3,000
3,500
4,000
200 2,200 4,200 6,200 8,200
kWh Consumption
per capita
GDP per Capita (USD)
Total Consumption per capita vs GDP per Capita (1989-2013)
Thailand
Cambodia
Indonesia
Pakistan
Philippines
Sri Lanka
Vietnam
India
China
Myanmar
Laos
Sri Lanka
Indonesia
China’s demand growth has slowed down materially in recent years
China
Thailand
Vietnam
India
Recent trend in ChinaConsumption per capital has saturated
China’s GDP and electricity demand growth
0%
5%
10%
15%
20%
2006 2007 2008 2009 2010 2011 2012 2013 2014 2015
GDP Electricity
China’s monthly electricity demand growth Year-on-year
Source: World Bank, China Electric Council, Morgan Stanley Research and TLG analysis
Year-on-year
Total
Secondary
(industrial)
Fundamentals Grid Policy

The Lantau Group
But supply addition continues, leading to large over-capacity in the country
10
-
20
40
60
80
100
120
140
160
2010 2011 2012 2013 2014 2015
Solar
Wind
Hydro
Nuclear
Gas
Coal
Averageload growth
GW
Incremental annual power supply & demandNo supply response to slow-down in demand growth so
far…
Source: CEC; TLG research and analysis
850
889
320
11642
-
200
400
600
800
1,000
1,200
1,400
1,600
Max Demand 2015 installedcapacity
Others
Solar
Wind
Hydro
Nuclear
Oil
Gas
Coal
GW
1500+76 percent
Annual average incremental surplus capacity
is about 90 GW in 2012-2015, close to the
total installed capacity in UK
Reserve margin is at historically high level
Over-supplied situation is particularly serious
in the resource - rich regions in the inland
provinces.
Fundamentals Grid Policy

The Lantau Group
4,982 4,958
4,551
3,854
5,074
5,767
4,657
3,8524,048
4,3294,049
3,7163,326
4,9794,730
3,778
1,879
2,682
1,500
2,000
2,500
3,000
3,500
4,000
4,500
5,000
5,500
6,000
China Guangdong Shanghai Jilin InnerMongolia
Xinjiang Gansu Yunnan Sichuan
2012
2013
2014
2015
The coal-fired power generation, the dominant and “infamous” source, is taking
the biggest hit in the over-supplied environment
11
Annual average generation hours of thermal capacity in China
Utilization hoursCoal, solar and wind regions Hydro regionsDemand centres
050
100150200250300350
200
0
200
1
200
2
200
3
200
4
200
5
200
6
200
7
200
8
200
9
201
0
201
1
201
2
201
3
201
4
201
5
201
6
Import
Export
Million tonnes
China coal import and export
Source: CEC; TLG research and analysis
Fundamentals Grid Policy

The Lantau Group
Dilemma on coal retirement: most of the coal capacity is relatively new, and
more new capacity is still under construction/plan
12
-25
-5
15
35
55
75
95
2006 2007 2008 2009 2010 2011 2012 2013 2014
New thermal capacity Retirement of thermal capacity
Annual thermal capacity addition and retirement
GW
• Most of small and old coal
plants were retired in
2006-2010.
• About two third of current
coal capacity is added in
the past ten years in
China.
• China continues to add
new coal projects
aggressively.
‒ In 2015, on average,
two large new coal
projects was
approved every
week.
Source: CEC; TLG research and analysis
Fundamentals Grid Policy
The Lantau Group
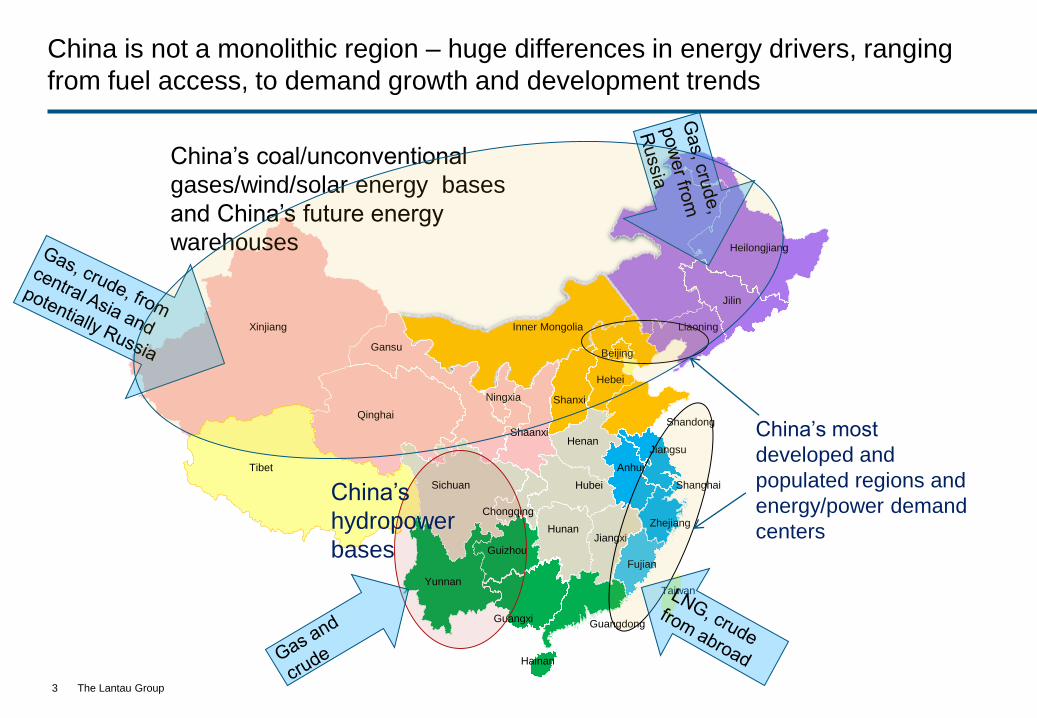
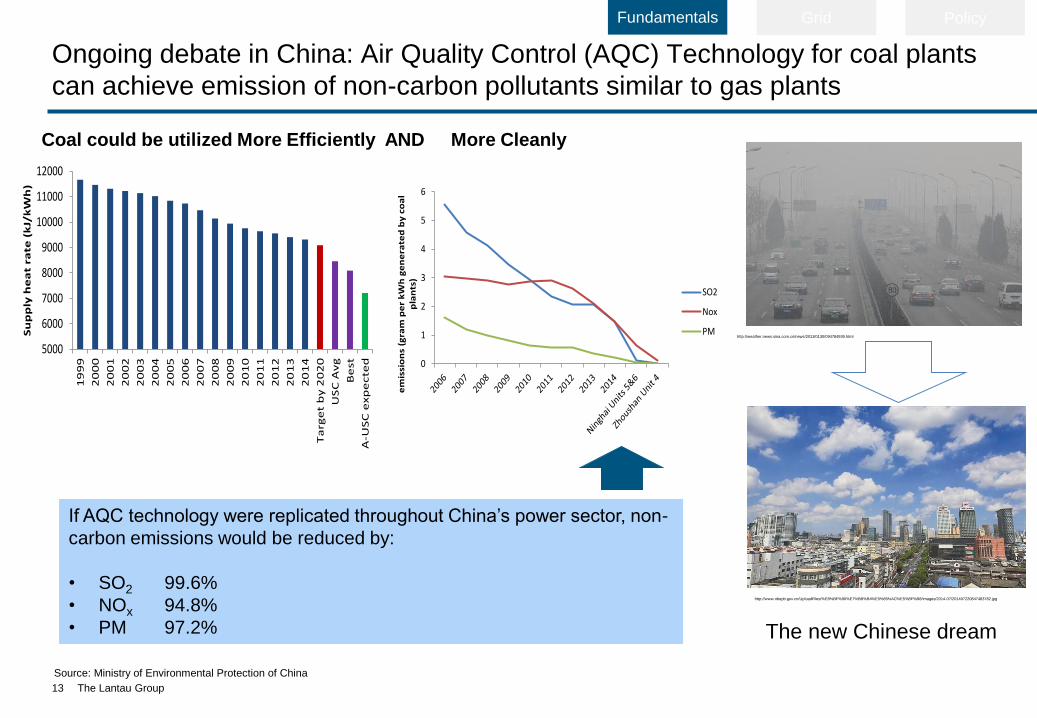
Ongoing debate in China: Air Quality Control (AQC) Technology for coal plants
can achieve emission of non-carbon pollutants similar to gas plants
13
Source: Ministry of Environmental Protection of China
http://www.nbepb.gov.cn/UploadFiles/%E8%BF%90%E7%BB%B4%E5%85%AC%E5%8F%B8/images/2014-07/201407220847483782.jpg
http://weather.news.sina.com.cn/news/2013/0130/094784939.html
If AQC technology were replicated throughout China’s power sector, non-
carbon emissions would be reduced by:
• SO2 99.6%
• NOx 94.8%
• PM 97.2% The new Chinese dream
Fundamentals Grid Policy
5000
6000
7000
8000
9000
10000
11000
12000
19
99
20
00
20
01
20
02
20
03
20
04
20
05
20
06
20
07
20
08
20
09
20
10
20
11
20
12
20
13
20
14
Ta
rge
t b
y 2
02
0
US
C A
vg
Be
st
A-U
SC
exp
ecte
d
Su
pp
ly h
ea
t ra
te (
kJ/
kW
h)
0
1
2
3
4
5
6
em
issi
on
s (g
ram
pe
r k
Wh
ge
ne
rate
d b
y c
oa
l p
lan
ts)
SO2
Nox
PM
Coal could be utilized More Efficiently AND More Cleanly

The Lantau Group
The focus of the “fight” against environmental pollution has gradually shifted to the dirty coal use in the non-power sector - an opportunity for the power sector
14
Coal use by sectors (based on 2012 data)
• China’s emissions standards for local pollutants by coal-fired power generation
are relatively high, even compared to US and EU
• Policy focus likely to be on enforcement
• Also likely to see enablement of more large, clean coal-fired power plants in
inland provinces via expansion of ultra-high voltage (UHV) grid
• These small boilers are dirty and difficult to be regulated. They contribute 40% of
China’s dust emissions, 22 % of SO2, and 10.5% of NOx.
• Central government and coastal city governments plans to shut down the small
and dirty boilers:
Shift the need for steam and heat to the power sector by building large
combined heat and power (CHP) plants.
Retrofit to use natural gas (gas availability, infrastructure build-up and cost
are the key determining factors on the pace of the switch to gas)
Million tonnes of coal
Source: Government statistics and TLG analysis
0
500
1,000
1,500
2,000
2,500
3,000
3,500
4,000
4,500
Coal
Power, 48%
Steel, 15%
Cement, 13%
Chemical, 5%
Industrial boilers, 17%
Fundamentals Grid Policy
The Lantau Group
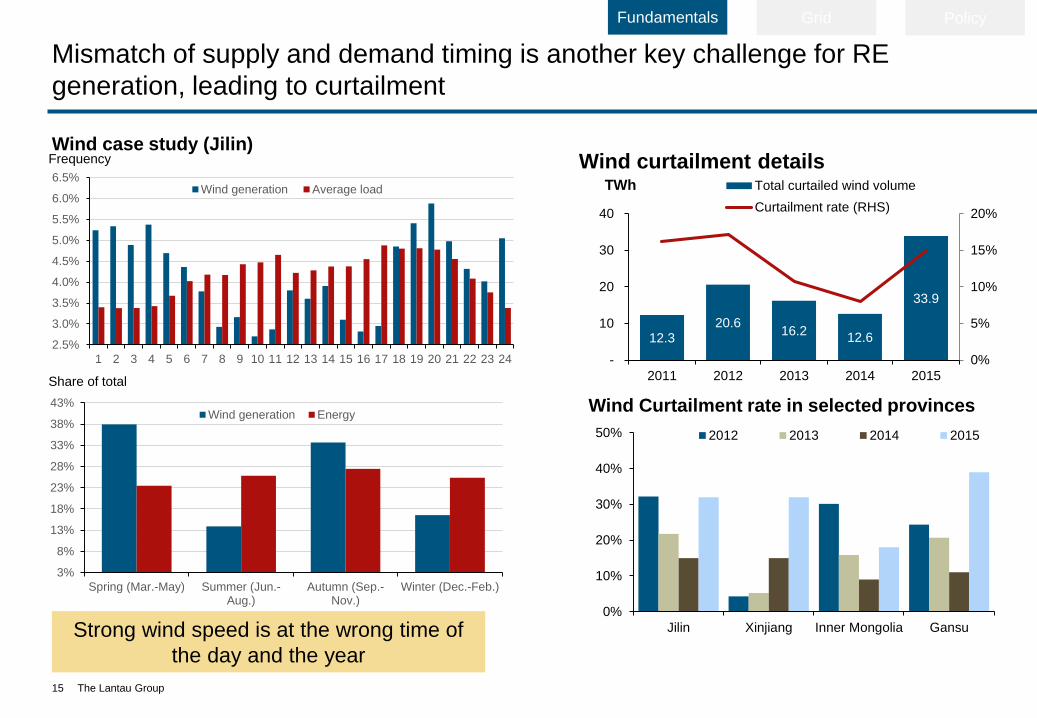
3%
8%
13%
18%
23%
28%
33%
38%
43%
Spring (Mar.-May) Summer (Jun.-Aug.)
Autumn (Sep.-Nov.)
Winter (Dec.-Feb.)
Wind generation Energy
Mismatch of supply and demand timing is another key challenge for RE
generation, leading to curtailment
15
Fundamentals Grid Policy
Wind case study (Jilin)
Strong wind speed is at the wrong time of
the day and the year
12.320.6
16.212.6
33.9
0%
5%
10%
15%
20%
-
10
20
30
40
2011 2012 2013 2014 2015
Total curtailed wind volume
Curtailment rate (RHS)
TWh
0%
10%
20%
30%
40%
50%
Jilin Xinjiang Inner Mongolia Gansu
2012 2013 2014 2015
Wind curtailment details
Wind Curtailment rate in selected provinces
2.5%
3.0%
3.5%
4.0%
4.5%
5.0%
5.5%
6.0%
6.5%
1 2 3 4 5 6 7 8 9 10 11 12 13 14 15 16 17 18 19 20 21 22 23 24
Wind generation Average load
Frequency
Share of total

The Lantau Group
Hydro variation is also a real issue
16
Source: china meteorological
administration
Note: 1989 data are not available
Fuzhou rainfall data (difference from the long term average of 1985-2013)
and Fujian rainfall data (difference from the long term average of 2004-2013)
Fuzhou FujianJan Feb Mar Apr May Jun Jul Aug Sep Oct Nov Dec Annual Annual
1985 -4% -9% -12% 4% 7% 11% -13% -9% -10% -15% -31% -21% -4%
1986 -88% 8% 140% 1% -49% 9% -64% -68% -46% -5% -71% -70% -18%
1987 -41% -25% 46% -16% 56% -24% -57% -92% 46% 2% 125% -92% -6%
1988 -75% -24% 85% 25% 13% -37% -76% -73% 156% 5% -77% 16% 1%
1989
1990 70% 62% -56% 68% 3% -31% -79% 249% 249% -65% -45% -63% 48%
1991 -26% -77% -20% 6% -42% 33% -92% -55% 99% 18% -78% -55% -16%
1992 54% 139% 101% 27% -26% -33% 58% 83% -21% -93% -39% -24% 23%
1993 0% 5% -20% -23% -8% 33% -33% -68% -19% -49% -42% -43% -18%
1994 -57% 45% 12% -14% 28% 47% -12% -33% 22% -61% -99% 172% 7%
1995 2% -25% 11% -43% 27% -25% -18% -53% -93% -98% -68% -45% -30%
1996 -70% -25% 44% 8% 6% -27% -38% 78% -53% -77% 55% -86% -5%
1997 -6% 31% 10% -37% 17% 37% 40% 53% 63% 69% 29% 132% 31%
1998 137% 152% 42% -51% -20% -34% -72% -91% -37% 207% -45% -46% -12%
1999 69% -79% 25% 11% 4% -75% 57% 44% 81% 48% -90% -80% 6%
2000 10% 17% -79% 60% -82% 103% 33% 48% -87% -6% 152% 82% 11%
2001 108% -42% -16% -6% -10% -2% 39% -45% -10% -73% -66% 40% -9%
2002 66% -75% -49% -26% 1% 11% -10% 19% 42% 55% -19% 94% 2%
2003 12% -71% -47% -2% -29% -33% -87% -35% -57% -49% -64% -95% -42%
2004 -38% -11% 8% -53% -22% -60% -50% -34% 34% -97% -41% -15% -29% -20%
2005 -84% 66% -31% -63% 83% -41% 123% -45% 79% 441% -64% -71% 22% 12%
2006 -75% -11% 20% 25% 53% 71% 217% 2% -65% -100% 125% 98% 36% 25%
2007 -17% -3% -39% 11% -66% 2% -78% 51% -83% 19% -19% 33% -21% -9%
2008 35% -44% -49% 3% 38% 20% 153% -41% -72% 144% -27% -70% 6% -7%
2009 -54% -85% -15% -27% -63% 27% 64% 115% -84% -77% 95% 67% -2% -16%
2010 22% 66% 22% 127% -10% 52% -5% -70% -9% 27% -78% 1% 14% 22%
2011 -62% -38% -72% -76% 30% -52% 101% 30% -72% -7% 221% -43% -11% -21%
2012 206% 98% -36% 75% 37% 22% -59% 61% 12% -70% 228% 57% 36% 20%
2013 -93% -47% -24% -15% 27% -5% -43% -21% -64% -94% 33% 125% -19% -5%
Ratio of total
rainfal3.7% 5.9% 9.7% 10.2% 13.8% 14.8% 9.2% 12.5% 10.4% 3.5% 3.4% 2.9%
Frequency
for rainfall <
2011
22% 30% 4% 0% 78% 7% 85% 63% 19% 52% 93% 41% 33%
Fundamentals Grid Policy

The Lantau Group
Even for large hydro with storage, hydro curtailment is still possible due to
mismatch of supply and demand timing and export arrangement
17
• This results in excess hydro power supply
during flat and wet years
Excess supply (after export) In Yunnan
Source: The Causes and Spatial and Temporal Distribution of Seasonal
Hydro-electricity in Yunnan Province. Gao et al. (EHV Power
Transmission Company, China Southern Power Grid and Yunnan Electric
Power Design Institute) Yunnan Electric Power Vol 42 No. 5. Oct 2014.
100 GWh
Jan Feb Mar Apr May Jun Jul Aug Sep Oct Nov Dec
Wet season is in
summer, while
industrial demand
decreases as
rainfall affects
mining activities
Export arrangement to
Guangdong and
Guangxi are based on
dry year hydrology to
ensure there is
sufficient local supply
Excess during
normal years
Exported
Provincial
demandCoal and non-hydro RE
Hydro
Fundamentals Grid Policy

The Lantau Group
New projects will likely be delayed, and the excessive power equipment
manufacturing and EPC capacities in China will worsen
Too much generation turbine manufacturing capacity
Source: China’s National Bureau of Statistics, and TLG Research (2015 coal capacity additions estimated)
Annual addition of power plant capacities
Note: annual coal capacity addition before 2005 refer to annual thermal capacity addition.
0
20
40
60
80
100
120
140
160
0
20
40
60
80
100
120
140
160
An
nu
al
gen
era
tio
n t
urb
ine m
an
ufa
ctu
red
(G
W)
An
nu
al
ad
dit
ion
of
co
al
pla
nt
cap
acit
ies
(GW
)
Coal Others Generation Turbines
18
The Chinese power companies have been expanding to the overseas markets aggressively, partly because of the need to
relieve their excess power equipment and EPC capacities due to the slow-down in the domestic market
Fundamentals Grid Policy

The Lantau Group
Agenda
1
2
3
4
5
Background of China electricity market
Market fundamentals
Grid infrastructure
Policy and Regulation
Summary
19

The Lantau Group
UHV DC and AC lines expansions will enable power exports from the curtailed
regions, but they are also driving new generation capacity additions
20
UHV AC lines UHV DC lines
Substation
Operating
Building
Proposed
DC Terminal
±660kV EHV DC in Operation
UHV DC in Operation
UHV DC under construction
UHV DC approved
UHV DC proposed
Large new coal plants +
solar/wind
Key hydro
resources
The power re-balancing across provinces/regions in China due to the commissioning of these
UHV lines is a key factor to watch
Fundamentals Grid Policy

The Lantau Group
But load centers may not need more power imports in a slow growing market;
and tension between exporting and importing provinces is growing
More exports to
Load centres
(coastal cities in
South and East
China) via the
UHV lines?
21
Coal + Solar/wind or
Large hydro in
resource rich regions
Local governments do
not want more imports
to squeeze out more
local generation as
demand growth slows
Guizhou
贵州
Guangdong广东
Guangxi
广西
Yunnan云南
3,000 MW
from 2006
Three Gorges
• Massive transmission projects have been completed,
significantly increasing the import capacity to Guangdong, need
more?
• Massive hydro plants have just been completed to export power
to Guangdong in Yunnan Provinces.
• Guangdong (Yuedian Group) has been building coal-fired
power station in Guizhou to export to Guangdong.
• Some plans to sell electricity to Vietnam from Yunnan, but will
this be feasible?
Fundamentals Grid Policy
Guangdong Example

The Lantau Group
Agenda
1
2
3
4
5
Background of China electricity market
Market fundamentals
Grid infrastructure
Policy and Regulation
Summary
22

The Lantau Group
• Reform of transmission and
distribution sector: uncertain impact
on RE and coal dispatch.
• Direct negotiation between
generators and large end-users: likely
negative for RE and positive for large
cheap and clean coal plants.
• Continuing on-grid tariff reform:
uncertain impact on RE and coal
dispatch.
• More stringent environmental
regulation: Increasing cost for coal
generation.
Reform and policy changes are under-way, and progress could be slow
23
Sector-wise reform and policy changes Proposed policies to mitigate curtailment
• Slow-down approval or halt new coal,
solar and wind projects in highly
curtailed regions: POSITIVE
• Better planning and coordination of real-
time dispatch: POSITIVE
• More pumped storage plants: POSITIVE
• Increasing flexibility of the system:
POSITIVE
• Various RE Targets and guaranteed
generation hours for RE*: UNCERTAIN
• Wind/solar for heating: UNCERTAIN
* Note: Several Non-hydro RE targets have been discussed in China:
• Consumption-side: 5-13 percent each province (nation-wide average at 9 percent) in 2020. Non-hydro RE generation needs to almost double from current level.
• Generation-side: 15 percent non-hydro RE obligation on coal power
Fundamentals Grid Policy
There are no magic bullets to solve the over-capacity and RE curtailment problem

The Lantau Group
Agenda
1
2
3
4
5
Background of China electricity market
Market fundamentals
Grid infrastructure
Policy and Regulation
Summary
24

The Lantau Group
RE curtailment – probably will get worse before getting better
• Slow demand growth
• Supply – Still no visibility on slow-
down in new addition
• No easy way to resolve the RE
supply and demand mismatch
• Coal utilization hours will likely
continue be squeezed; but will there
be early retirements?
• Tension between imports and local
generation will increase
• Push on direct purchase will
probably favor non-RE projects
• Policy initiatives such as proactively
slow-down/halt new build will be
most positive to reduce curtailment if
implemented
• More enhancement of local and
regional grids
• More UHV DC and AC lines are built
and approved
• BUT Who will take the power?
25
Core Fundamentals Grid Policy
Each provinces face different trends, but likely will become worse
before getting better

The Lantau Group26
Quantitative wind curtailment forecast from TLG’s model (for illustration)
0
1
2
3
4
5
6
7
8
9
10
Wind curtailment
peaking
wind
Mingen
2016 Spring (Mar-May)
Curtailment = 46 percentGW
0
1
2
3
4
5
6
7
8
9
10
0:0
0
1:0
0
2:0
0
3:0
0
4:0
0
5:0
0
6:0
0
7:0
0
8:0
0
9:0
0
10
:00
11
:00
12
:00
13
:00
14
:00
15
:00
16
:00
17
:00
18
:00
19
:00
20
:00
21
:00
22
:00
23
:00
GW2016 Autumn (Sep-Nov)
Curtailment = 45 percent
0%
5%
10%
15%
20%
25%
30%
35%
40%
45%
50%
201
4
201
5
201
6
201
7
201
8
201
9
202
0
202
1
202
2
202
3
202
4
202
5
202
6
202
7
202
8
202
9
203
0
Spring Summer Autumn
Winter Annual
Case study: Wind curtailment forecast in
Jilin

The Lantau Group
Thank you
For more information please contact us:
Liutong Zhang, Senior Manager
By phone+852 2521 5501 (office)
By mail4602-4606 Tower 1, Metroplaza
223 Hing Fong Road,
Kwai Fong, Hong Kong
Onlinewww.lantaugroup.com
Rigour
Value
Insight
NetworksElectricity Gas
27

The Lantau Group28
APPENDICES

The Lantau Group
On-grid tariffs in China mean that coal plant investment is essentially a call
option on the spread between the tariff and the coal price
29
250
270
290
310
330
350
370
390
410
430
0
200
400
600
800
1,000
1,200
1,400
Jan-06 May-07 Sep-08 Feb-10 Jun-11 Nov-12 Mar-14
Qinghuangdao coal price (5,500kcal/kg)
Average on-grid coal plant tariff
RMB/MT RMB/MWh
• China's on-grid tariffs have been
strictly controlled and set by the
government
• A coal price-grid tariff linkage
mechanism was established in 2005
– it permitted the assimilation (pass-
through) of 70% of coal price
increases over 5% within 6 monthly
cycles
• In practice, this adjustment
mechanism caused heavy losses to
many coal-fired power plants when
coal prices increased rapidly
• According to a State Council circular
published at the end of 2012, China
will review on-grid power tariffs on
an annual basis and adjust them if
coal prices fluctuate more than 5%
in a year
• Under the new mechanism, when
average coal prices rise by more
than 5% within a year, 90% (rather
than 70%) of that increase will be
passed-through via an increase in
on-grid tariffs
China coal price and average on-grid coal plant tariff
Source: Bloomberg; News articles; TLG analysis
Lag in tariff
increase
Lag in tariff
decrease

The Lantau Group
Overview of five tier dispatch system
30
Level Entity Jurisdiction Key FunctionsNational dispatch organisation
(or Guodiao)
1
State Grid Voltage level > 500 kV
Geographic: Regional interties
Generators: Large thermal or hydropower
plants exporting power across regions
Inter-regional balancing, inter-
regional dispatch
Regional dispatch organisation
(or Wangdiao or Zongdian)
2
Regional grid companies Voltage level: 330-500 kV
Geographic: Provincial interties
Generators: e.g. Pumped hydro storage
Inter-provincial balancing, inter-
provincial dispatch
Provincial (PDO) (or Shengdiao
or Zhongdiao)
3
Provincial grid companies Voltage level: 220 kV (330-750 kV terminal
substations)
Geographic: Bulk provincial system
Generators: Larger generators not controlled
by regional or national dispatch organisation
Intra-provincial balancing, intra-
provincial dispatch, coordinating
load management
Prefecture dispatch organisation
(Didiao or Shidiao)
4
Prefecture power supply
organizations
Voltage level: ≤220 kV
Geographic: Local system
Generators: Smaller local generators
Prefecture load management
County dispatch organisation
(Xiandiao)
5
County power supply
organisations
Voltage level: ≤110 kV
Geographic: County system
Generators: Any remaining generators such
as small hydropower plants
County load management

The Lantau Group31
Energy Sector Reform
Reform Plans Reform Contents Drivers Timeline
T&D Reform • Unbundling transmission, distribution and retail
services.
• Independent (regulated) pricing of
transmission and distribution services
• Promote broader power industry reform
such as bilateral transactions and
centralised competitive markets
• Promote efficient investment and
effective planning and investments on
grid assets
• Increase transparency of grid operation
• Open ways for retail sector reform
Undergoing,
major goals likely
achievable with
13th FYP (2016-
2020)
New pricing
mechanisms
• Bilateral transaction between generators and
end-users
• On-grid price linkages to fuel: (Coal-Power
Price Linkage Scheme and recent Gas-Power
Price Linkage Scheme)
• Centralised power exchanges: platforms (with
grid operators at present) for trading
generation rights, bilateral contracting, or
surplus power
• Pricing of ancillary services
• Increases energy dispatch efficiency
• Enable supply and demand market
negotiate directly
Undergoing
Achievable with
13th FYP
Regulation
Reform
In near term, focuses on:
• Project/investment approval process,
renewable power projects have mainly a
response for local governments
• More flexible pricing approval mechanism to
local authorities
• Promote efficient planning and
investment
• Reduce corruptions and barriers
Undergoing

The Lantau Group32
Energy Sector Reform
Reform
PlansReform Contents Drivers Timeline
Competitive
Pool Markets
Not in near term agenda
• Establish a competitive
whole market
• Promote efficient
allocation of resources
• Produce right market
signals
High uncertainties and not in near agenda.
Entry of participants and market services will be
gradual..
Uniform
pricing
scheme
Long-term goal as specified
in Electric Power Law of
PRC
• Reflect the fundamental
value of electricity without
discrimination of generation
sources
Highly uncertain, but may be possible to
achieve uniform price by 2025

The Lantau Group
A planned nationwide carbon market in 2016 is delayed, and even with a
carbon market, the carbon prices would be likely low
33
Currently running around US$ 4 to 9 per tonne of CO2
Carbon price, yuan/tonne-CO2
80
60
40
20
0
HubeiTianjin
Shanghai
Beijing
Guangzhou
Shenzhen
BJ SH GZ TJ SZ HB CQ
Chongqing
Jan ‘14 Feb Mar Apr May Jun Jul Aug Sep Oct

The Lantau Group
New capacity construction in China also appears to continue despite of slowing
demand growth, and the size of coal fleet continues to be much bigger than gas
34
Suggested
target
The gas generation share is at a level of 2.2% of total generation (comparing with coal’s share of 68-72%), and new coal capacity addition is still far more than gas
GW
0
10
20
30
40
50
60
70
80
90
100
0
10
20
30
40
50
60
70
80
90
100
2010 2011 2012 2013 2014 2015 2020
GW
The total gas fleet is comparable to
ONLY one year of coal capacity
addition
Total Natural Gas Generation CapacityAnnual INCREMENTAL Coal Capacity Addition

The Lantau Group
China’s overseas EPC
35
China’s Overseas EPC contract value in billion USD
Source: China’s National Bureau of Statistics, 2016
The number of workers at overseas at year end had a
fast growing period from 1995 to 2001, and a plateau
period until 2014. 2014 could be a turning point for
another growing period for labor export.
The EPC contract value in 2015 was USD 210.1
billion, from 2008 to 2015, the average annual
increments of EPC contract value is USD 16.6
billion.
0
100,000
200,000
300,000
400,000
500,000
600,000
700,000
199
5
199
6
199
7
199
8
199
9
200
0
200
1
200
2
200
3
200
4
200
5
200
6
200
7
200
8
200
9
201
0
201
1
201
2
201
3
201
4
Num
ber
of
work
ers
at
overs
eas
under
fore
ign labor
coopera
tion
agre
em
ents
0
50
100
150
200
250
199
5
199
6
199
7
199
8
199
9
200
0
200
1
200
2
200
3
200
4
200
5
200
6
200
7
200
8
200
9
201
0
201
1
201
2
201
3
201
4
201
5
Overs
eas E
PC
contr
act
valu
e (
bill
ion
US
D)
CAGR = 10.5%

The Lantau Group
ONE Belt One Road – What is it?
• One Belt – a land route through Central Asian Capital – Teheran – Istanbul
– Moscow – Europe
• One Road – a waterway route through Hanoi – KL – Jakarta – Kolkata –
Colombo – Nairobi – Europe
• Economic corridors
– China – Pakistan Economic Corridor (CPEC) – OBOR program with
most substance to date. $47Bn infrastructure investments in Pakistan
by China. Including Gwadar port (world’s 3rd deepest), highways to
China and inside Pakistan (3000km), and power plants (>10,000MW)
– Bangladesh-China-India-Myanmar Economic Corridor (BCIM) -
Not much tangible beyond a Kunming-Kolkata highway and plans for a
similar railroad.
• A broadening of industries for investments, and geographical focus
– Maybe mean more for non-power industries - OBOR may mean
more for investments in industries other than energy, resource and
electricity industries – where China has been investing aggressively for
years already.
– Maybe mean more for non-ASEAN countries – China has been a
major investor in many ASEA economies for many years already.
• May not make much difference for electricity industry in most DGA
countries – China was already there.
– China was already dominating hydro and coal power plant EPC in
Mekong and Indonesia, as well as building pipelines in Myanmar.
– Philippines is not even on the OBOR list.
– Pakistan may be an exception with a recent Chinese tsunami in
Pakistan electricity and energy industry.
• Is it a key policy initiative?
– Foreign policy to creating a Chinese economic empire – Make
greater Asian region more dependent on China, and tie their
economic success to the success of China.
– Help China domestic policy – Alleviate China’s over capacity in
heavy industry and infrastructure construction, to help bride
• Or is it more fluff then substance?
– Part of President Xi’s “Chinese Dream” – To reclaim national
pride and enhance personal well-being.
– President Xi planting the flag, but being vague on details
(Carnegie-Tsinghua Center in Beijing) – Leaving it to
bureaucrats to flesh out vague and contradictory statements,
and put meat on the bones.
– A Christmas Tree (Center for Strategic and International
Studies in Washington) - You can hang a lot of policy goals on
it, but no one has done a proper economic analysis.
– A repackaging that needs a slogan - They are just putting a new
slogan on stuff they’ve wanted to do for a long time (a western
diplomat quoted by FT)
• Is it simply clever “white knight tactics”? – Without having to
explain or produce any “proofs in the pudding” China has got most of
Asia (and parts of the rest of the world) to come to Beijing to invite
China. No need for China to invite itself?

The Lantau Group
AIIB – A new institutional lender is making its presence across 67 member
countries, with China taking a dominant role
37
• A multilateral development bank with heavy Chinese
involvement - AIIB initiative was announced by the Chinese
President Xi in 2013 to promote interconnectivity and economic
integration in Asia. It has an initial paid-up capital of US$100bn.
• Advanced countries’ participation are justified by their
export interest– Out of the 67 members, 48 members are
within Asia while 19 countries are from outside. Participation of
the advanced countries such as Australia and UK are due to
their large historical trading relationship with China, while Japan
has not yet participated as to protect their interest in ADB
• AIIB imposes looser environmental requirement in
disbursing its loans, making it the preferred creditor for
financing coal-fired power projects- Activities focus on
infrastructure development, energy and power, transportation,
urban development and logistics in Southeast Asia. Recent
project includes $1bn loans to Indonesia for coal power
projects.
• Privatization will not become a conditionality for loans –
Unlike ADB which recommends free market policies, AIIB would
follow the local conditions of each country. The bank also aims
to have a simpler administrative process.
• Possibility to cooperate with multilaterals – ADB has agreed
to identify projects for co-financing with the AIIB, while the
European bank of Reconstruction and Development are ready
to co-finance several projects with AIIB from 2016
Vice President
President – Elected by BOG
Board of Directors
26 Board of Directors from various countries, inc.2 from China
Board of Governors
2 representatives from each country
Decision making structure in AIIB
Other members of AIIB

The Lantau Group
The Silk Road Fund - China is expanding investments in power development
projects through both acquisition of equity stakes and provision of debt financing
Ownership China SAFE, Exim Bank.
CIC, CDB
Founded Year 2014
Start Up Fund US$40 billion
38
• Focused on investment in infrastructure, resources and
industrial and financial cooperation investment between
China and Eurasia, the Mediterranean and Asia
Scope
Project Country China Stake Cost (US$) Year SRF Investment type Other investors
KazMunayGaz Kazakhstan 51% $500m 2015 Equity investments Kazakh gov
Kazakh uranium deposits Kazakhstan Minority $4bn 2015 Equity investments JSC NAK
KazAtomProm, CNPC
Karot hydro power project Pakistan - $1.65bn 2016 Loan, co-financed by
EIBC
Pakistan Private Power
and Infrastructure Board
Dairut CCGT Egypt - $2.2bn 2017 Loan Acwa, Hassan Allam,
GE Capital
Nam Dinh 1 thermal power
plant project
Vietnam <50% $2.2bn 2017 Equity investments AWCA
Hassyan Clean Coal
Power Plant
United Arab
Emirates
- $1.8bn 2020 Loan, co-financed by
EIBC, CBC, BOC,
standard Chartered
DEWA, ACWA
Yamal LNG project Russia 9.9% $968m 2021 15 year loan Novatek, France’s Total,
CNPC
Track Record of investment projects via SRF
China securing more LNG imported from Russia
Opportunity for China EPC
China securing import of Kazakh oil