Embed Size (px)
Citation preview
CHINA CREDIT INFORMATION SERVICE, LTD. INVESTIGATION REPORT
Report Date: Apr. DD, 20YY Case No.: 0X041101NN Subject Number: C9830426 Given Name: CHI AN OPTOELECTRONICS CORP.
Given Address: No. 1000, Taye Rd., Taichung Science Park, Tashih Township, Taichung County, Taiwan, R.O.C.
Remark: Given address is registered address, actual operating office address.
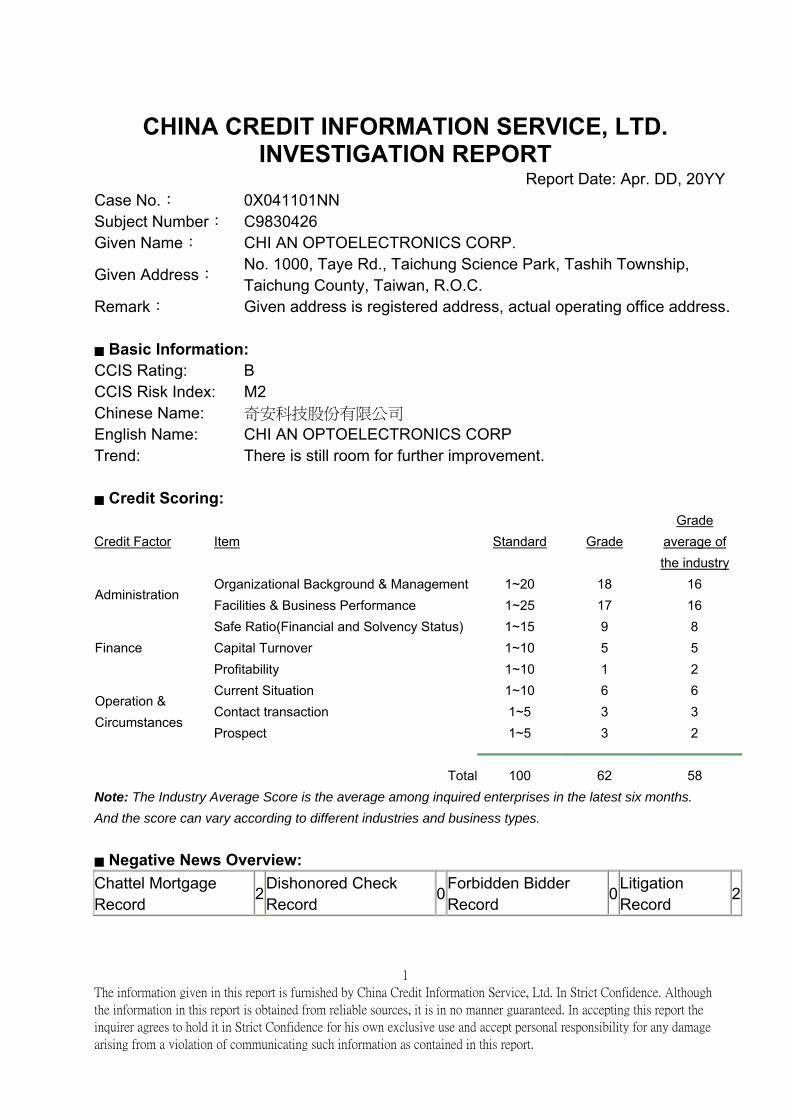
■ Basic Information: CCIS Rating: B CCIS Risk Index: M2 Chinese Name: 奇安科技股份有限公司 English Name: CHI AN OPTOELECTRONICS CORP Trend: There is still room for further improvement. ■ Credit Scoring:
Credit Factor Item Standard Grade Grade
average of the industry
Organizational Background & Management 1~20 18 16 Administration
Facilities & Business Performance 1~25 17 16 Safe Ratio(Financial and Solvency Status) 1~15 9 8 Capital Turnover 1~10 5 5 Finance Profitability 1~10 1 2 Current Situation 1~10 6 6 Contact transaction 1~5 3 3
Operation & Circumstances
Prospect 1~5 3 2 Total 100 62 58 Note: The Industry Average Score is the average among inquired enterprises in the latest six months.
And the score can vary according to different industries and business types. ■ Negative News Overview: Chattel Mortgage Record
2 Dishonored Check Record
0Forbidden Bidder Record
0 Litigation Record
2
The information given in this report is furnished by China Credit Information Service, Ltd. In Strict Confidence. Although
the information in this report is obtained from reliable sources, it is in no manner guaranteed. In accepting this report the
inquirer agrees to hold it in Strict Confidence for his own exclusive use and accept personal responsibility for any damage
arising from a violation of communicating such information as contained in this report.
1
Industry Score Comparison Chart Maximum 79Minimum 51
Subject 62
0 10 20 30 40 50 60 70 80 90 100
Industry Average Radar Chart
0
5
10
15
20
Organizational
Background
Facilities & Business
Performance
Safe Ratio
Capital Turnover
Profitability
Prospect
Grade average ofthe industry
Subject
Credit Score Tracking in Past Three Years
30
40
50
60
70
80
90
100
2006
09
2006
12
2007
03
2007
06
2007
09
2007
12
2008
03
2008
05
2008
09
2008
12
2009
03
2009
05
Time
Cre
dit
Sco
re
The information given in this report is furnished by China Credit Information Service, Ltd. In Strict Confidence. Although
the information in this report is obtained from reliable sources, it is in no manner guaranteed. In accepting this report the
inquirer agrees to hold it in Strict Confidence for his own exclusive use and accept personal responsibility for any damage
arising from a violation of communicating such information as contained in this report.
2
The information given in this report is furnished by China Credit Information Service, Ltd. In Strict Confidence. Although
the information in this report is obtained from reliable sources, it is in no manner guaranteed. In accepting this report the
inquirer agrees to hold it in Strict Confidence for his own exclusive use and accept personal responsibility for any damage
arising from a violation of communicating such information as contained in this report.
3
■ Basic Information: Name: CHI AN OPTOELECTRONICS CORP.
Registered Address: No. 1000, Taye Rd., Taichung Science Park, Tashih Township, Taichung County, Taiwan, R.O.C.
Communication Address:
No. 1000, Taye Rd., Taichung Science Park, Tashih Township, Taichung County, Taiwan, R.O.C.
URL: http://www.chichi.com.tw E-Mail: [email protected] Tel: 0X-2555-8888 Fax: 0 X-2555-8889 Registration No.: 16161616 Stock Code: XX50X
Registered Authority: Development Preparatory Office of Central Taiwan Science-Based Park
Paid-up Capital: X7,126,119 (NT$1,000) Legal Representative: Wang Hsiang No. of Employees: 1X255 Established: Aug. 06, 19YY
Business Type: Manufacture (OPTOELECTRONIC MATERIALS, COMPONENTS & PRODUCTS)
Business Size: Super Large Legal Form: Company limited by shares. ■ FACTORY OR BRANCH OFFICE: LCD factory I & actual operation office
Address: No. 1, Taye Rd., Taichung Science Based Industrial Park, Tashih Township, Taichung County, Taiwan, R.O.C.
Reg. No.: 98000020 Tel: 04-2555-8888 Fax: 04-2555-8889 LCD factory II
Address: No. 2, Sec. 29, Huansi Rd., Taichung Science Based Industrial Park, Tashih Township, Taichung County, Taiwan, R.O.C.
Reg. No.: 98000021 Tel: 04-2555-1889
The information given in this report is furnished by China Credit Information Service, Ltd. In Strict Confidence. Although
the information in this report is obtained from reliable sources, it is in no manner guaranteed. In accepting this report the
inquirer agrees to hold it in Strict Confidence for his own exclusive use and accept personal responsibility for any damage
arising from a violation of communicating such information as contained in this report.
4
LCD factory III (5th-generation and 5.5th-generation factory)
Address: No. 2-1, Sec. 29, Huansi Rd., Taichung Science Based Industrial Park, Tashih Township, Taichung County, Taiwan, R.O.C.
Reg. No.: 98000022 Tel: 04-2555-1890 LCD factory IV
Address: No. 3, Sec. 9, Huansi Rd., Taichung Science Based Industrial Park, Tashih Township, Taichung County, Taiwan, R.O.C.
Reg. No.: 98000023 Tel: 04-2555-1891 LCM general module factory
Address: No. 112, Nanke 6th Rd., Taichung Science Based Industrial Park, Tashih Township, Taichung County, Taiwan, R.O.C.
Reg. No.: 98000024 Tel: 04-2555-1880 Taipei sales office
Address: 1F, No. 1600, Sec. 8, Nanjing E. Rd., Songshan District, Taipei City, Taiwan, R.O.C.
Tel: 02-2555-7777 Fax: 02-2555-9999 Japanese branch
Address: 2F BLDG Minamibosi Hatijyusyu Gohyaku Gou 2ban 2tyoume Hatijyusyu Tyuuouku Tokyoutonishon
Tel: 81-3-5555-5555 Fax: 81-3-5555-7777 ■ MAJOR AFFILIATE(S): NAME: CHI CHI TECHNOLOGIES, INC. Reg. No: *16131613 Person-in charge: Wu, Yi-Chang Major business activities: Manufacture and sales of LCD driver ICs. NAME: CHI CHI COMMUNICATION SYSTEMS, INC. Reg. No: 12781278 Person-in charge: Wu, Yi-Chang
Major business activities: Design, manufacturing & sales of wireless communication modules, contract manufacturing service of cell phones
The information given in this report is furnished by China Credit Information Service, Ltd. In Strict Confidence. Although
the information in this report is obtained from reliable sources, it is in no manner guaranteed. In accepting this report the
inquirer agrees to hold it in Strict Confidence for his own exclusive use and accept personal responsibility for any damage
arising from a violation of communicating such information as contained in this report.
5
NAME: CHI CHI INVESTMENT CORP. Reg. No: * 27836666 Person-in charge: Yang Yang Major business activities: General investment NAME: CHI CHI LOGISTICS INC. Reg. No: * 28074766 Person-in charge: Ling Jung Major business activities: Storage service ■ MAJOR AFFILIATE(S) In China: NAME: NINGBO CHI CHI STORAGE CORP. Person-in charge: Yang Yang Major business activities: Storage service NAME: NINGBO CHI CHI ELECTRONICS CORP. Person-in charge: Yang Yang Major business activities: Assembly and sales of TFT-LCD modules ■ MAJOR AFFILIATE(S) OVERSEA: NAME: ONTERNATIONAL DISPLAY TECHNOLOGY LTD. Person-in charge: Yang Yang Major business activities: Sales of LCD products NAME: CHI CHI OPTOELECTRONICS EUROPE B.V. Person-in charge: Yang Yang
Major business activities: Electronic parts and computer monitors after-sales service and sales
NAME: CHI CHI OPTOELECTRONICS (SINGAPORE) PTE., LTD. Major business activities: Electronic parts quality control, design and after-sales serviceNote:*The information of affiliated company of subject is recorded in the consolidated financial statement of
subject. ■ HISTORY: Subject was originally established as CHI HUA OPTOELECTRONICS CORP. in Aug. 1998.On Apr. 15, 2000, subject merged with CHI YI ELECTRONIC INDUSTRIAL CO., LTD., and subject was the acquiring company; later, it changed its name to the present one.
The information given in this report is furnished by China Credit Information Service, Ltd. In Strict Confidence. Although
the information in this report is obtained from reliable sources, it is in no manner guaranteed. In accepting this report the
inquirer agrees to hold it in Strict Confidence for his own exclusive use and accept personal responsibility for any damage
arising from a violation of communicating such information as contained in this report.
6
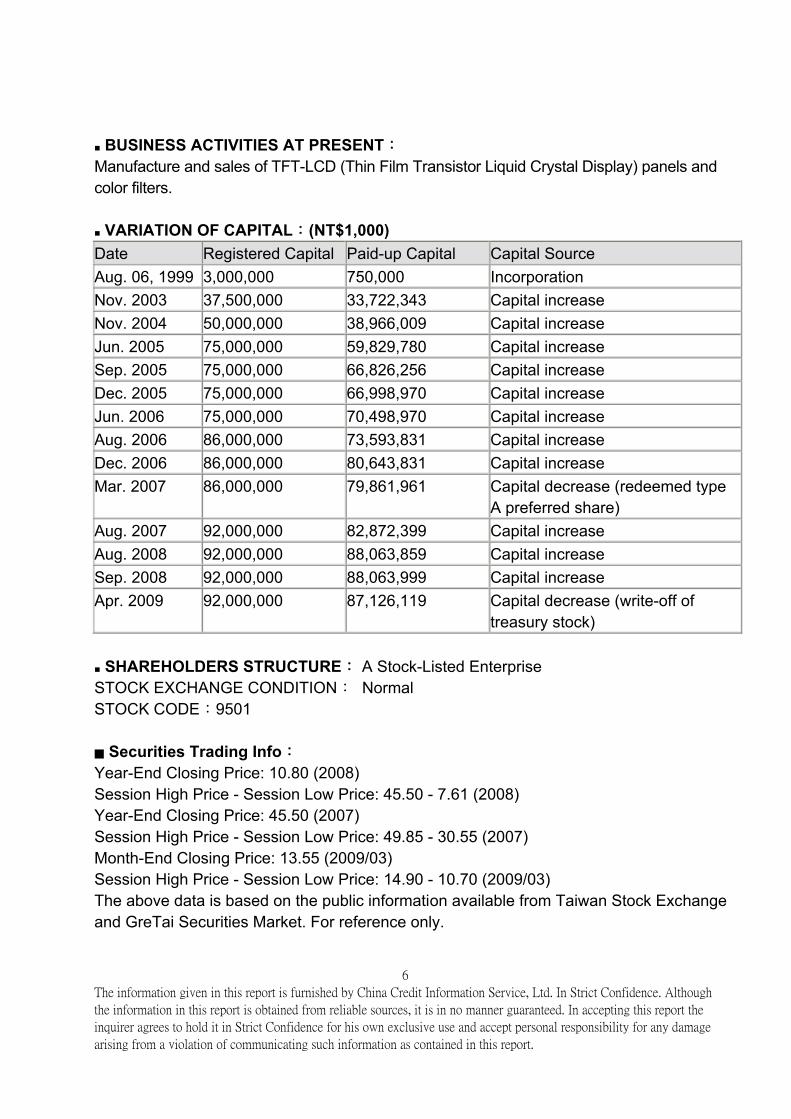
■ BUSINESS ACTIVITIES AT PRESENT: Manufacture and sales of TFT-LCD (Thin Film Transistor Liquid Crystal Display) panels and color filters.
■ VARIATION OF CAPITAL:(NT$1,000) Date Registered Capital Paid-up Capital Capital Source Aug. 06, 1999 3,000,000 750,000 Incorporation Nov. 2003 37,500,000 33,722,343 Capital increase Nov. 2004 50,000,000 38,966,009 Capital increase Jun. 2005 75,000,000 59,829,780 Capital increase Sep. 2005 75,000,000 66,826,256 Capital increase Dec. 2005 75,000,000 66,998,970 Capital increase Jun. 2006 75,000,000 70,498,970 Capital increase Aug. 2006 86,000,000 73,593,831 Capital increase Dec. 2006 86,000,000 80,643,831 Capital increase Mar. 2007 86,000,000 79,861,961 Capital decrease (redeemed type
A preferred share) Aug. 2007 92,000,000 82,872,399 Capital increase Aug. 2008 92,000,000 88,063,859 Capital increase Sep. 2008 92,000,000 88,063,999 Capital increase Apr. 2009 92,000,000 87,126,119 Capital decrease (write-off of
treasury stock) ■ SHAREHOLDERS STRUCTURE: A Stock-Listed Enterprise STOCK EXCHANGE CONDITION: Normal STOCK CODE:9501 ■ Securities Trading Info: Year-End Closing Price: 10.80 (2008) Session High Price - Session Low Price: 45.50 - 7.61 (2008) Year-End Closing Price: 45.50 (2007) Session High Price - Session Low Price: 49.85 - 30.55 (2007) Month-End Closing Price: 13.55 (2009/03) Session High Price - Session Low Price: 14.90 - 10.70 (2009/03) The above data is based on the public information available from Taiwan Stock Exchange and GreTai Securities Market. For reference only.
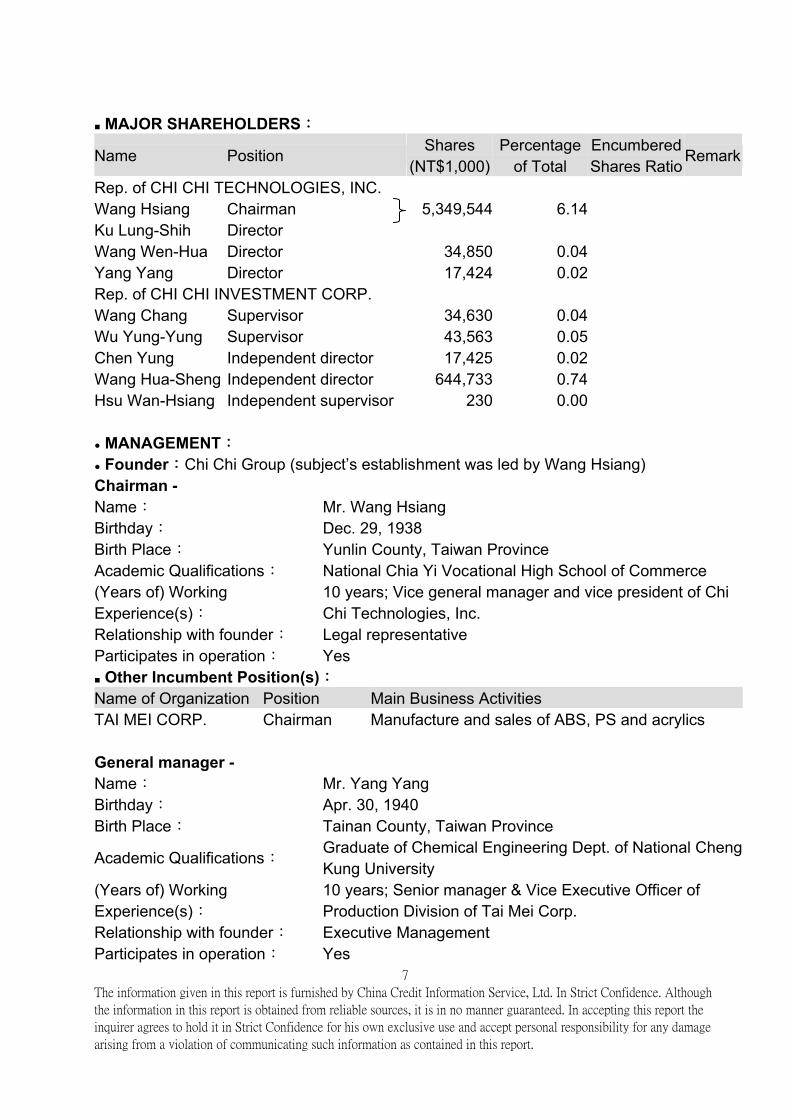
■ MAJOR SHAREHOLDERS:
Name Position Shares (NT$1,000)
Percentage of Total
EncumberedShares Ratio
Remark
Rep. of CHI CHI TECHNOLOGIES, INC. Wang Hsiang Chairman 5,349,544 6.14 Ku Lung-Shih Director Wang Wen-Hua Director 34,850 0.04 Yang Yang Director 17,424 0.02 Rep. of CHI CHI INVESTMENT CORP. Wang Chang Supervisor 34,630 0.04 Wu Yung-Yung Supervisor 43,563 0.05 Chen Yung Independent director 17,425 0.02 Wang Hua-Sheng Independent director 644,733 0.74 Hsu Wan-Hsiang Independent supervisor 230 0.00 ● MANAGEMENT: ● Founder:Chi Chi Group (subject’s establishment was led by Wang Hsiang) Chairman - Name: Mr. Wang Hsiang Birthday: Dec. 29, 1938 Birth Place: Yunlin County, Taiwan Province Academic Qualifications: National Chia Yi Vocational High School of Commerce (Years of) Working Experience(s):
10 years; Vice general manager and vice president of Chi Chi Technologies, Inc.
Relationship with founder: Legal representative Participates in operation: Yes ■ Other Incumbent Position(s): Name of Organization Position Main Business Activities TAI MEI CORP. Chairman Manufacture and sales of ABS, PS and acrylics General manager - Name: Mr. Yang Yang Birthday: Apr. 30, 1940 Birth Place: Tainan County, Taiwan Province
Academic Qualifications: Graduate of Chemical Engineering Dept. of National Cheng Kung University
(Years of) Working Experience(s):
10 years; Senior manager & Vice Executive Officer of Production Division of Tai Mei Corp.
Relationship with founder: Executive Management Participates in operation: Yes
The information given in this report is furnished by China Credit Information Service, Ltd. In Strict Confidence. Although
the information in this report is obtained from reliable sources, it is in no manner guaranteed. In accepting this report the
inquirer agrees to hold it in Strict Confidence for his own exclusive use and accept personal responsibility for any damage
arising from a violation of communicating such information as contained in this report.
7
The information given in this report is furnished by China Credit Information Service, Ltd. In Strict Confidence. Although
the information in this report is obtained from reliable sources, it is in no manner guaranteed. In accepting this report the
inquirer agrees to hold it in Strict Confidence for his own exclusive use and accept personal responsibility for any damage
arising from a violation of communicating such information as contained in this report.
8
■ Other Incumbent Position(s): Name of Organization Position Main Business Activities CHI MEI CORP. Director Manufacture and sales of ABS, PS and acrylics Note:The above management information is provided by Chen Shih-Hsien (Head of a division) ■ PREMISES:
Land: 36,000 ㎡ Rented Building: 29,089 ㎡ According to investigation, at the operating address: There are 4 records of building numbers, which is 00890000, Hsin-Ke Section; under subject's name.
LCD factory I & Actual operation office
There is 1 record of registration of supplementary rights. LCD factory II Land: 264,000 ㎡ Rented The 5th-generation factory and 5.5th-generation factory Land: 264,000 ㎡ Rented
Note:Property right information above is provided by local land administration authority/Mr. Chen Shih-Hsien
(Head of a division). This is for reference only. 1. Information above excludes building without the first registration of building's ownership. 2. Enquiry date: Apr. 30, 2009 There are many records of building numbers at subject’s operating address, and only one of them is provided
here for reference.
■ MAJOR PRODUCTION FACILITIES: Item:Color filter sites (5th-generation) Unit:2 Line Item:The 3.5 generation production line Unit:1 Line Item:The 4 generation production line Unit:1 Line Item:The 5 generation production line Unit:1 Line Item:The 5.5 generation production line Unit: 2 Line Item:The 7.5 generation production line Unit:1 Line
The information given in this report is furnished by China Credit Information Service, Ltd. In Strict Confidence. Although
the information in this report is obtained from reliable sources, it is in no manner guaranteed. In accepting this report the
inquirer agrees to hold it in Strict Confidence for his own exclusive use and accept personal responsibility for any damage
arising from a violation of communicating such information as contained in this report.
9
■ MORTGAGE OF TANGIBLE ASSETS RECORDS: Subject has been reported no mortgage record on its tangible assets. Note:The above record is based on the public announcements by concerned authorities in Taiwan Province
and Taipei City. It is for reference only. ■ OPERATING INCOMES 2004 - 2006:(In NT$1,000) Item\Year 2008 % 2007 % 2006 % Domestic sales 96,235,648 31.03 89,849,588 29.96 56,074,348 29.98Foreign trade 213,901,792 68.97 210,048,905 70.04 130,977,756 70.02Total 310,137,440 100.00 299,898,493 100.00 187,052,104 100.00Growth(%) 3.41 % 60.33 % -- % ■ OPERATING INCOMES OF 2007 BY PRODUCT:(Unit:NT$1,000)
Main Object Sales % TFT-LCD monitor 309,207,028 99.7Others 930,412 0.3 ■SALES PERFORMANCE Jan. 2009 ~ Mar. 2009 : (Unit:NT$1,000) 34,828,035 ■ TRADE REFERENCES:(Local Suppliers) Suppliers: TAIWAN YI CHAN GLASS CO., LTD. Product: Glass substrate Paid-up Capital:(NT$1,000) 90,000 Payment Terms: CHECK 30-60 days 100% Suppliers: CHI YI CO. LTD. Product: Photoresist Paid-up Capital:(NT$1,000) 12,000 Payment Terms: CHECK 60-90 days 100% Suppliers: YA MEI INDUSTRIAL GAS CO., LTD. Product: Industrial gas Paid-up Capital:(NT$1,000) 120,000 Payment Terms: CHECK 30-45 days 100% Suppliers: CHUNG HUA TECHNOLOGIES CO., LTD. Product: Backlight module Paid-up Capital:(NT$1,000) 800,000 Payment Terms: CHECK 60 days 100%
The information given in this report is furnished by China Credit Information Service, Ltd. In Strict Confidence. Although
the information in this report is obtained from reliable sources, it is in no manner guaranteed. In accepting this report the
inquirer agrees to hold it in Strict Confidence for his own exclusive use and accept personal responsibility for any damage
arising from a violation of communicating such information as contained in this report.
10
Suppliers: TAIWAN NINI OPTICAL CO., LTD. Product: Polarizer Paid-up Capital:(NT$1,000) 653,200 Payment Terms: CHECK 60 days 100% Suppliers: TAI LING CO., LTD. Product: Driver IC Paid-up Capital:(NT$1,000) 50,000 Payment Terms: CHECK 30 days 100% Suppliers: TAIWAN TUNGHSIA ELECTRONICS CO., LTD. Product: Driver IC Paid-up Capital:(NT$1,000) 150,000 Payment Terms: CHECK 30 days 100% ■ TRADE REFERENCES:(Overseas Suppliers) Product Area Merck, Nichimen liquid crystal, Hitachi LCD driver IC, Inabbata polarizer & backlight module Japan
Payment Terms:L/C 100%. ■ TRADE REFERENCES:(Local Customers) Customers: KUANG WEI KUANG COMPUTER CO., LTD. Product: TFT-LCD panels & displayer Paid-up Capital:(NT$1,000) 900,000 Payment Terms: CHECK 30-45 days 100% Customers: YI CHAO TECHNOLOGY CO., LTD. Product: TFT-LCD panels & displayer Paid-up Capital:(NT$1,000) 212,000 Payment Terms: CHECK 30-69 days 100% Customers: KUAN KUAN ELECTRONICS CO., LTD. Product: TFT-LCD panels & displayer Paid-up Capital:(NT$1,000) 520,000 Payment Terms: CHECK 45-60 days 100%
The information given in this report is furnished by China Credit Information Service, Ltd. In Strict Confidence. Although
the information in this report is obtained from reliable sources, it is in no manner guaranteed. In accepting this report the
inquirer agrees to hold it in Strict Confidence for his own exclusive use and accept personal responsibility for any damage
arising from a violation of communicating such information as contained in this report.
11
Customers: HUA CHI TECHNOLOGY CO., LTD. Product: TFT-LCD panels & displayer Paid-up Capital:(NT$1,000) 400,000 Payment Terms: CHECK 30-60 days 100% Customers: WEI TA COMPUTER CO., LTD. Product: TFT-LCD panels & displayer Paid-up Capital:(NT$1,000) 655,000 Payment Terms: CHECK 30-90 days 100% Customers: CHI SHIH ENTERPRISE CO., LTD. Product: TFT-LCD panels & displayer Paid-up Capital:(NT$1,000) 50,000 Payment Terms: CHECK 30-60 days 100% ■ TRADE REFERENCES:(Overseas Customers) Product Area TFT-LCD monitor U.S.A., Japan, Korea, Mainland China Payment Terms:L/C 100%. ■ BANKERS: Bank & Branch: Taichung Branch of Chang Hwa Commercial Bank A/C No: 0300009 Opened date: Aug. 1999 current balance(NT$1,000): N/A Relation: Normal Tel: 04-2221-2811 Bank & Branch: Tainan Branch of Hua Nan Commercial Bank A/C No: 9009088 Opened date: Sep. 1999 current balance(NT$1,000): N/A Relation: Normal Tel: 06-222-2111
The information given in this report is furnished by China Credit Information Service, Ltd. In Strict Confidence. Although
the information in this report is obtained from reliable sources, it is in no manner guaranteed. In accepting this report the
inquirer agrees to hold it in Strict Confidence for his own exclusive use and accept personal responsibility for any damage
arising from a violation of communicating such information as contained in this report.
12
■ PAYMENT RECORD: Subject has been reported no dishonored banking record. Subject's chairman has been reported no dishonored banking record. Subject's general manager has been reported no dishonored banking record. Note:The above banking record statements are based on the data obtained from the Clearing House as of
Apr. 24, 2009. ■ BIDDING FORBIDDEN RECORD:
Subject has not been listed as a forbidden bidder for government purchases as of the records since Jan. 01, 2002.
The above statement is based on the announcement by concerned government authorities. It is for reference only.
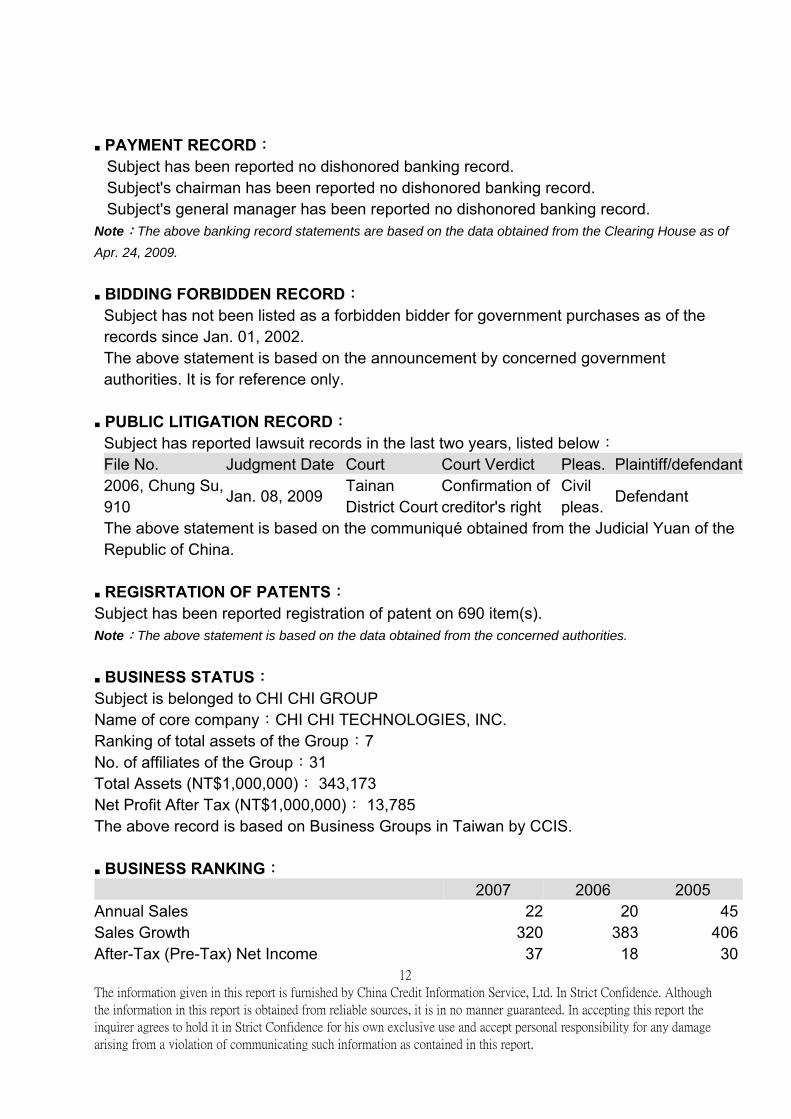
■ PUBLIC LITIGATION RECORD: Subject has reported lawsuit records in the last two years, listed below:
File No. Judgment Date Court Court Verdict Pleas. Plaintiff/defendant2006, Chung Su,10
Jan. 08, 2009 9
Tainan District Court
Confirmation of creditor's right
Civil pleas.
Defendant
The above statement is based on the communiqué obtained from the Judicial Yuan of the Republic of China.
■ REGISRTATION OF PATENTS: Subject has been reported registration of patent on 690 item(s). Note:The above statement is based on the data obtained from the concerned authorities. ■ BUSINESS STATUS: Subject is belonged to CHI CHI GROUP Name of core company:CHI CHI TECHNOLOGIES, INC. Ranking of total assets of the Group:7 No. of affiliates of the Group:31 Total Assets (NT$1,000,000): 343,173 Net Profit After Tax (NT$1,000,000): 13,785 The above record is based on Business Groups in Taiwan by CCIS. ■ BUSINESS RANKING: 2007 2006 2005 Annual Sales 22 20 45 Sales Growth 320 383 406 After-Tax (Pre-Tax) Net Income 37 18 30
The information given in this report is furnished by China Credit Information Service, Ltd. In Strict Confidence. Although
the information in this report is obtained from reliable sources, it is in no manner guaranteed. In accepting this report the
inquirer agrees to hold it in Strict Confidence for his own exclusive use and accept personal responsibility for any damage
arising from a violation of communicating such information as contained in this report.
13
Return on Sales 1,470 491 673 Ranking in Concerned Industry (OPTOELECTRONIC MATERIALS, COMPONENTS & PRODUCTS)
2 3 3
Source:Top 5000: Largest Corporations in Taiwan, and research on Business Groups in Taiwan. China Credit
Information Service.
Remark: We changed the item from ranking of income (loss) before income tax to income (loss) after income tax
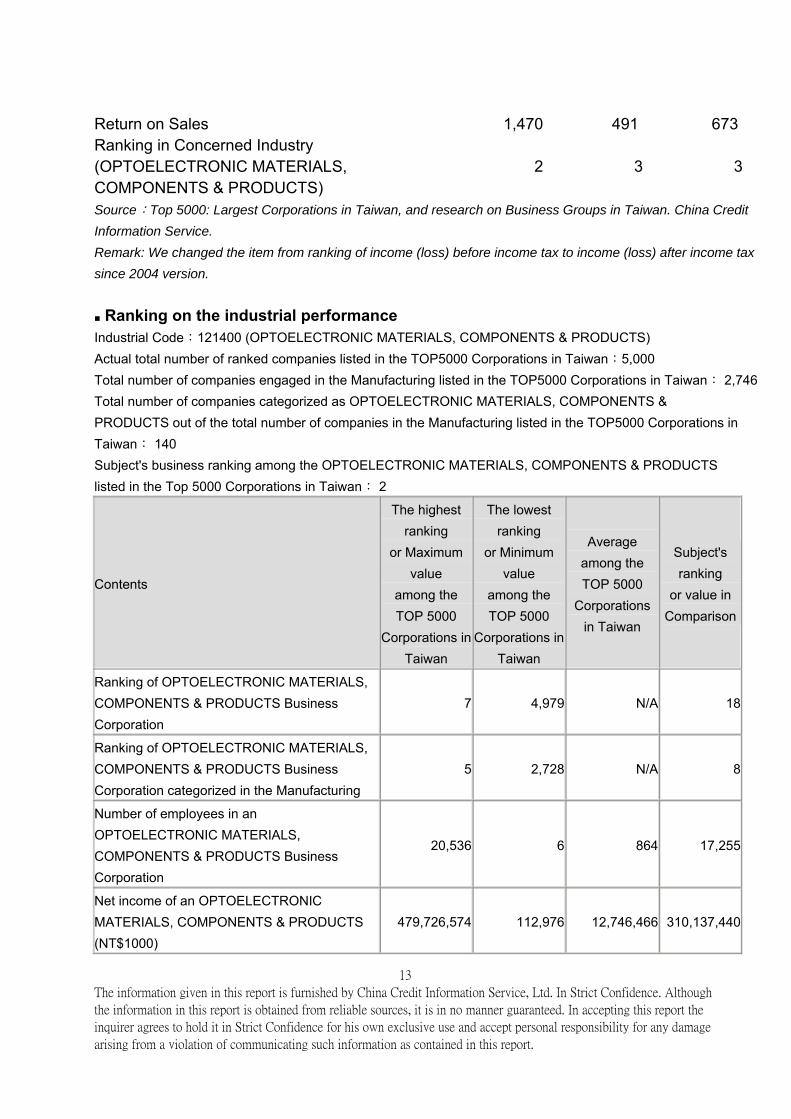
since 2004 version. ■ Ranking on the industrial performance Industrial Code:121400 (OPTOELECTRONIC MATERIALS, COMPONENTS & PRODUCTS) Actual total number of ranked companies listed in the TOP5000 Corporations in Taiwan:5,000 Total number of companies engaged in the Manufacturing listed in the TOP5000 Corporations in Taiwan: 2,746 Total number of companies categorized as OPTOELECTRONIC MATERIALS, COMPONENTS & PRODUCTS out of the total number of companies in the Manufacturing listed in the TOP5000 Corporations in Taiwan: 140 Subject's business ranking among the OPTOELECTRONIC MATERIALS, COMPONENTS & PRODUCTS listed in the Top 5000 Corporations in Taiwan: 2
Contents
The highest ranking
or Maximum value
among the TOP 5000
Corporations in Taiwan
The lowest ranking
or Minimum value
among the TOP 5000
Corporations in Taiwan
Average among the TOP 5000
Corporations in Taiwan
Subject's ranking
or value inComparison
Ranking of OPTOELECTRONIC MATERIALS, COMPONENTS & PRODUCTS Business Corporation
7 4,979 N/A 18
Ranking of OPTOELECTRONIC MATERIALS, COMPONENTS & PRODUCTS Business Corporation categorized in the Manufacturing
5 2,728 N/A 8
Number of employees in an OPTOELECTRONIC MATERIALS, COMPONENTS & PRODUCTS Business Corporation
20,536 6 864 17,255
Net income of an OPTOELECTRONIC MATERIALS, COMPONENTS & PRODUCTS (NT$1000)
479,726,574 112,976 12,746,466 310,137,440
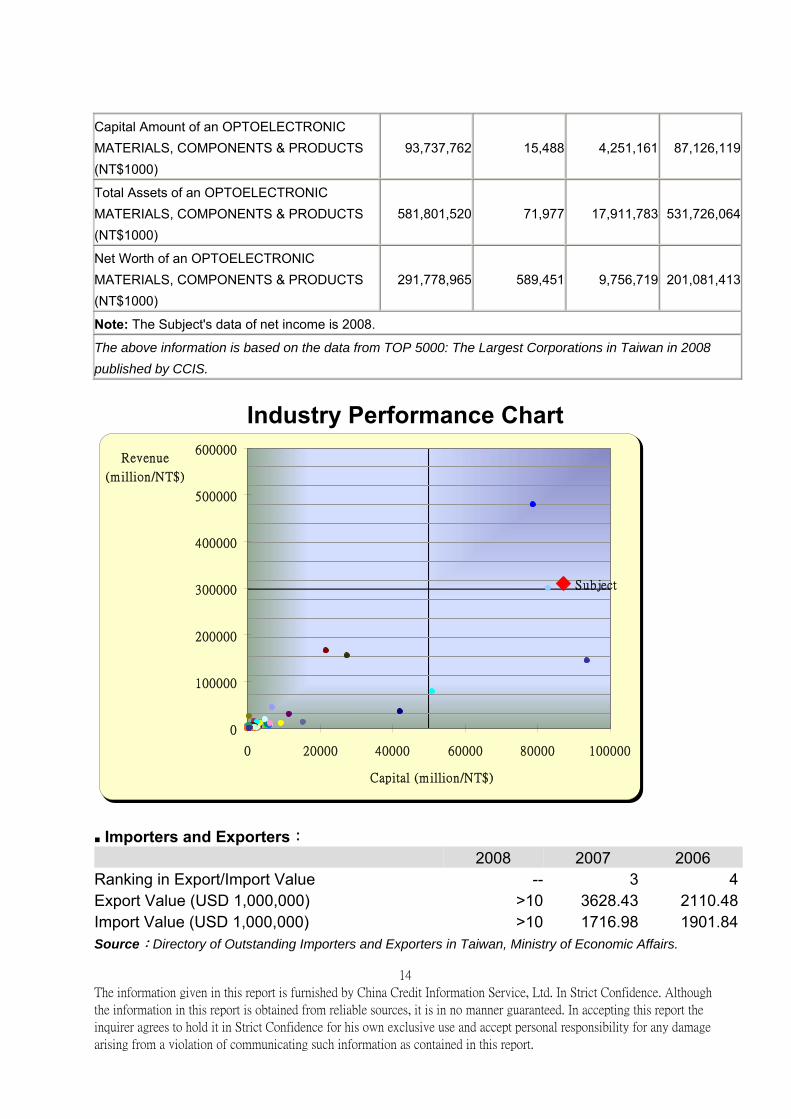
Capital Amount of an OPTOELECTRONIC MATERIALS, COMPONENTS & PRODUCTS (NT$1000)
93,737,762 15,488 4,251,161 87,126,119
Total Assets of an OPTOELECTRONIC MATERIALS, COMPONENTS & PRODUCTS (NT$1000)
581,801,520 71,977 17,911,783 531,726,064
Net Worth of an OPTOELECTRONIC MATERIALS, COMPONENTS & PRODUCTS (NT$1000)
291,778,965 589,451 9,756,719 201,081,413
Note: The Subject's data of net income is 2008.
The above information is based on the data from TOP 5000: The Largest Corporations in Taiwan in 2008
published by CCIS.
Industry Performance Chart
Subject
0
100000
200000
300000
400000
500000
600000
0 20000 40000 60000 80000 100000
Capital (million/NT$)
Revenue
(million/NT$)
■ Importers and Exporters: 2008 2007 2006 Ranking in Export/Import Value -- 3 4 Export Value (USD 1,000,000) >10 3628.43 2110.48 Import Value (USD 1,000,000) >10 1716.98 1901.84 Source:Directory of Outstanding Importers and Exporters in Taiwan, Ministry of Economic Affairs.
The information given in this report is furnished by China Credit Information Service, Ltd. In Strict Confidence. Although
the information in this report is obtained from reliable sources, it is in no manner guaranteed. In accepting this report the
inquirer agrees to hold it in Strict Confidence for his own exclusive use and accept personal responsibility for any damage
arising from a violation of communicating such information as contained in this report.
14
The information given in this report is furnished by China Credit Information Service, Ltd. In Strict Confidence. Although
the information in this report is obtained from reliable sources, it is in no manner guaranteed. In accepting this report the
inquirer agrees to hold it in Strict Confidence for his own exclusive use and accept personal responsibility for any damage
arising from a violation of communicating such information as contained in this report.
15
■ FINANCIAL PROFILE FOR YEARS 2004-2002:(NT$1,000) Financial Index 12/31/2008 2007/12/31 2006/12/31 Paid-In Capital 88,063,999 82,872,399 80,643,831Net Worth 201,081,413 220,648,025 188,282,567Total Liabilities 330,644,651 254,887,125 224,137,038Total Assets 531,726,064 475,535,150 412,419,605 ■ BUSINESS PERFORMANCE FOR YEARS 2004-2002:(NT$1,000) Financial Index 2008/01-2008/12 2007 2006 Net Sales 310,137,440 299,898,493 187,052,104Operating Profits 6,219,648 36,150,459 8,113,182Current Period Profits -6,037,580 36,171,411 3,543,081Please be noted that the above financial figures are: base on subject's year 2008,2007,2006 financial statements (CPA audited) ■ IMPORTANT NEWS FROM THE MEDIA: Date:Mar. 27, 2009 Title:Chi An plans to build 8G panel plant, heating up new wave of competition among panel makers. Source:Economic Daily News Date:Aug. 04, 2009 Title:Chi An ranks the world’s No. 1 in 32” panel supply. Source:Economic Daily News Date:Aug. 06, 2009 Title:Chi An eyes to build second 7.5G plant in April in Da Hua Park. Source:Economic Daily News Date:Aug. 06, 2009 Title:Chi An becomes the first panel make to enter LED sector. Source:Commercial Times Date:Aug. 09, 2009 Title:Chi An inks NT$60 billion syndicated loan. Source:Market Observation Post System
The information given in this report is furnished by China Credit Information Service, Ltd. In Strict Confidence. Although
the information in this report is obtained from reliable sources, it is in no manner guaranteed. In accepting this report the
inquirer agrees to hold it in Strict Confidence for his own exclusive use and accept personal responsibility for any damage
arising from a violation of communicating such information as contained in this report.
16
Date:Aug. 17, 2009 Title:With endeavors in backlight modules, Chi An’s self-made rate will surpass 50% Source:Economic Daily News Date:Aug. 29, 2009 Title:With merger of Au Optronics and Quanta Display, Chi An Optoelectronics will bring
forward construction of its two factories to this month. Source:Economic Daily News ■ GENERAL INFORMATION: I、Industrial Trend TFT-LCD According to the estimation of DisplaySearch, among the demand for 10.4-inch or above panel market in 2009, the demand volume of NB panel (excluding panel used in Netbook )will be 131.7 million pieces, decreasing by 2% compared with that of 2008, but the deman dvolume will have a obvious increase of 22 % in 2010, reaching 160.5 million piec es. Thedemand volume of LCD monitor in 2009 is about 165.3 million p ieces, decreasing by 4%compared with that of 2008, but the demand volume will increas e by 5% in 2010, reaching173.6 million pieces. The LCD TV panel which attracts high a ttention from people performswell, with demand volume increases by 18% in 2009 compared with t hat of 2008, reaching132.6 million piec es, and the demand volume of LCD TV panel will continue to maintain17% growth in 2001, about 154.9 million pieces. In terms of the shipment estimation of cu rrent panel manufacturers, LGD will be the moreactive one in 2009, whose ship ment of LCD TV panel reaches 46 millio n pieces and the total shipment is about 124.8 million pieces, so it is the one with highest shipment. The nextis Samsung, whose shipment is about 120 million piec es. The third is AU Optronics Corp.,whose shipment is about 103.4 million pieces. The fourth is Chi Mei Optoelectronics Corp.,whose sh ipment is about 86 million piec es. In 2009, AU Optronics Corp. and Hann starDisplay Corp. are the relatively active suppliers of small Netbook panel and it is estimatedthat the shipment of t heir small Netbook panel will reach 14 and 11 million pie cesrespectively, far higher than other panel manufacturers. DisplaySearch points out that the shipment of global LCD TVs is about 105 million s ets in2008. Affected by financial storm, it is conserva tively est5imated that the growth of LCD TVmarket will slow down and shipment will be about 120 million sets. Yet, the shipment o fLCD TVs in Mainland China in the 1Q of 2009 is better the expect ed and North Americamarket also begins recovering. T herefore, the shipment of LCD TVs in 2 009 is adjusted to126 million sets, increasing by 20%.
The information given in this report is furnished by China Credit Information Service, Ltd. In Strict Confidence. Although
the information in this report is obtained from reliable sources, it is in no manner guaranteed. In accepting this report the
inquirer agrees to hold it in Strict Confidence for his own exclusive use and accept personal responsibility for any damage
arising from a violation of communicating such information as contained in this report.
17
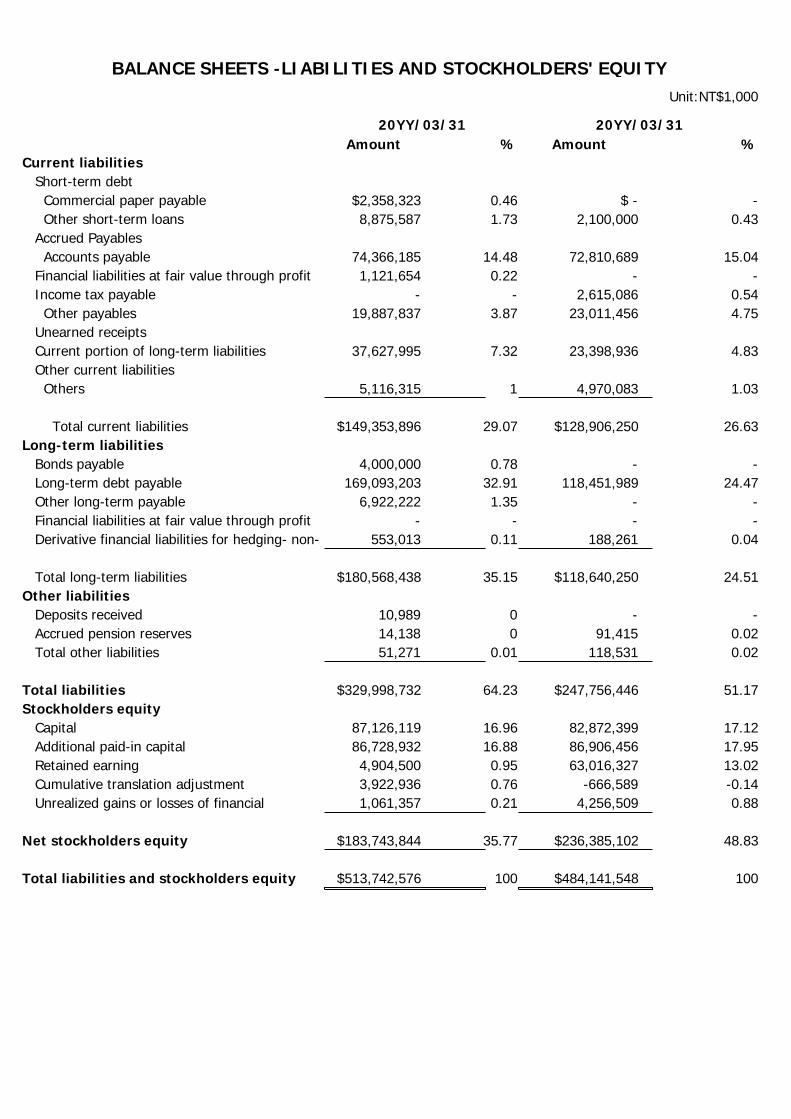
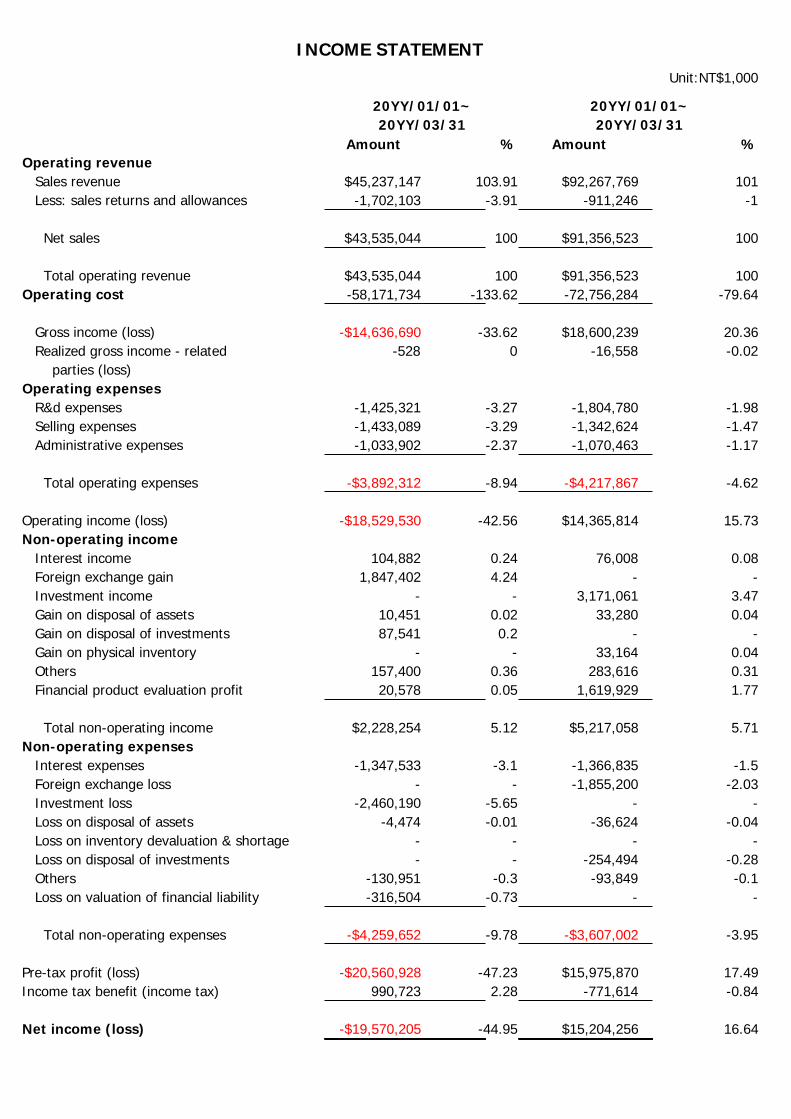
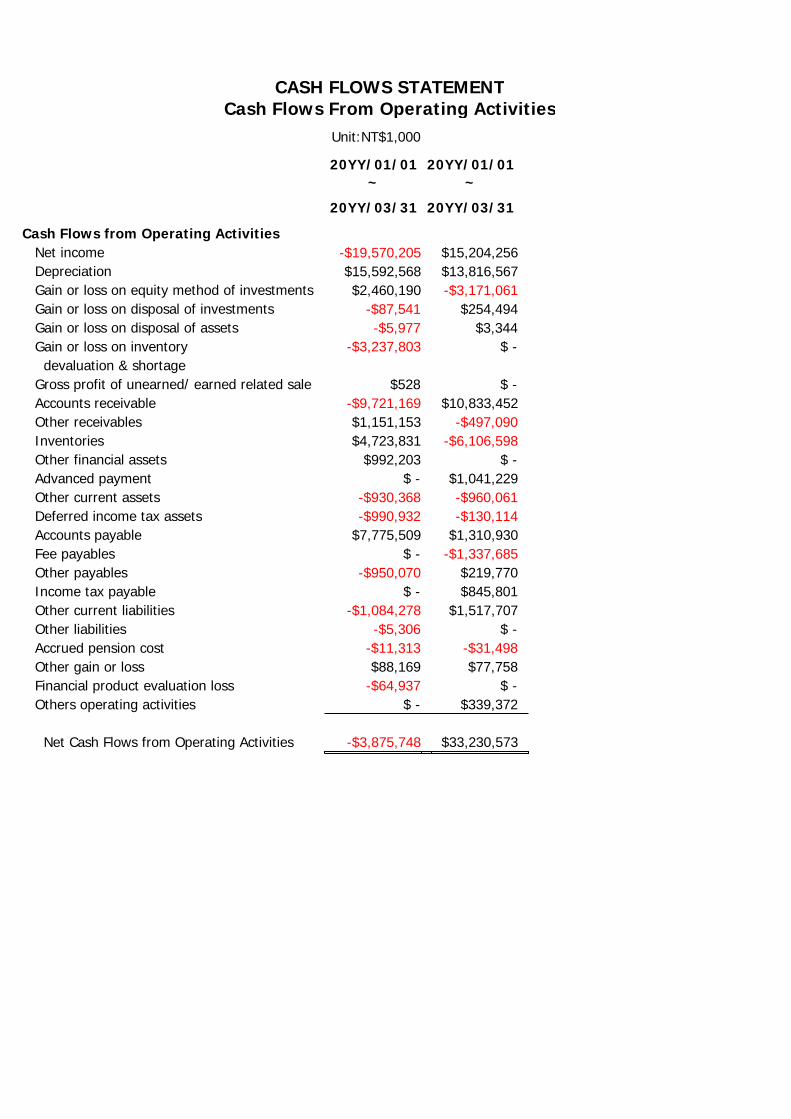
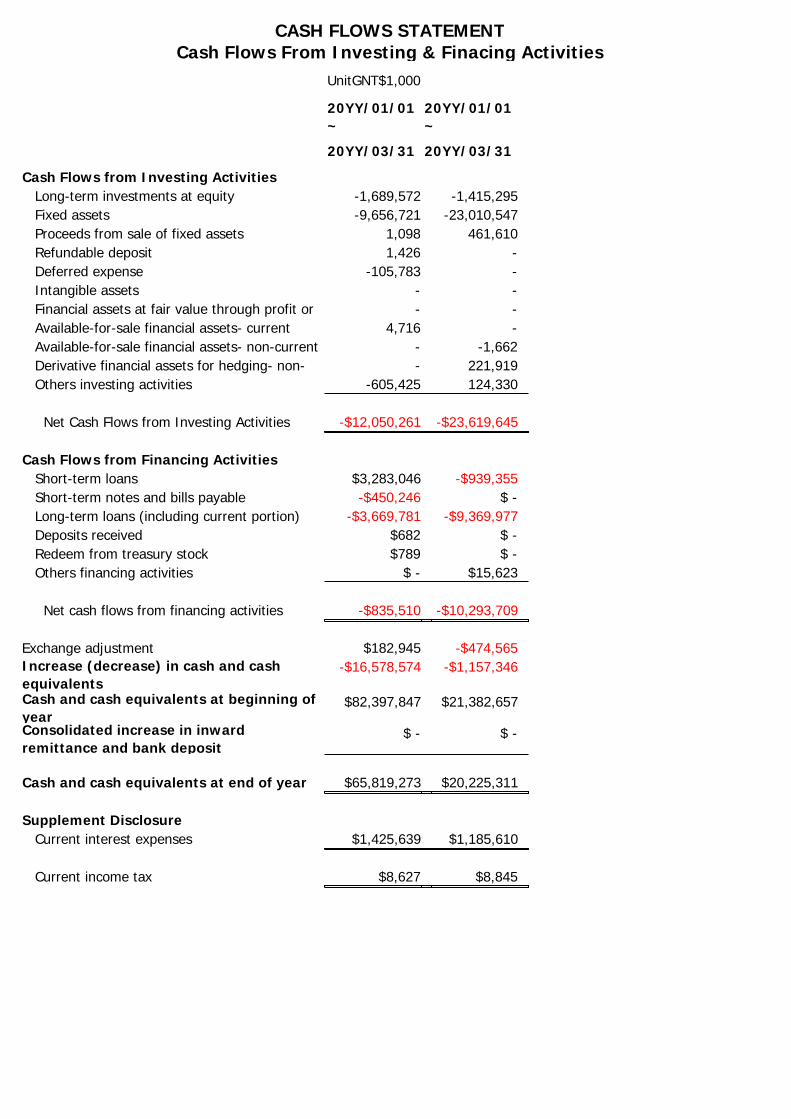
II、Financial and Solvency Status Based on subject's financial year of 2008: FINANCIAL STRUCTURE: Liability to asset ratio is relatively high, with supports from short-term loans; financial structure is to be strengthened. SOLVENCY ABILITY: The liquidity ratio and quick ratio are relatively low, indicating that its short-term debt-paying ability is in need of improvement. Interest coverage ratio is -0.04 time(s), showing that its interest-paying ability is not good. MANAGEMENT EFFICIENCY: Inventory turnover is normal; receivable collection is normal; whole capital turnover ratio is 0.62 times and its management ability is still to be improved. PROFITABILITY: Gross profit is not high but cost and expense management ability is unsatisfactory; current in deficit. Analysis of quarterly financial statements: According to subject’s financial statements in Q1 2009: Debt to asset rate is 64.23%. Financial structure is to be strengthened. Current/Quick ratios are relatively low. Short-term liquidity is in need of improvement. Current loss is NT$ 19,570,205,000. Profit ability is in dire need of improvement. Cash Flow: The cash flow for the current period is a net flow-out of NT$ 16,578,574 thousand, and operating cash flow is a net flow-out. Therefore the cash flow ratio is -2.59 %, indicating that its ability to pay short-term liability is to be improved, and the cash reinvestment ratio is -0.76 %, showing that its ability needed for reinvestment funding is to be improved. Consolidated financial statements: Subject’s year consolidated report for 2008 indicates that its liabilities to assets ratio is 65.59%, which is same as than it was before consolidation, and therefore its financial structure is to be strengthened; current and quick ratio is a bit low and short-term solvency is in need of improvement; long-term equity investments to total assets ratio is low , suggesting its transferred-investment transparency is relatively high ;current loss is NT$ 6,576,552 ,000 , and the profit-making situation is in dire need of improvement. The cash flow for the current period is a net flow-in of NT$ 82,752,962 thousand, and operating cash flow is a net flow-in. Therefore the cash flow ratio is 55.80 %, indicating that its ability to pay short-term liability is good, and the cash reinvestment ratio is 14.94 %, showing that its ability needed for reinvestment funding is good.
The information given in this report is furnished by China Credit Information Service, Ltd. In Strict Confidence. Although
the information in this report is obtained from reliable sources, it is in no manner guaranteed. In accepting this report the
inquirer agrees to hold it in Strict Confidence for his own exclusive use and accept personal responsibility for any damage
arising from a violation of communicating such information as contained in this report.
18
III、Current Operation & Prospect Business Contents: Subject is engaged in the manufacture and sale of the TFT-LCD and color filters. It is the leading TFT-LCD manufacturer in the w orld. Its products are divided into small andmedium-sized panels (10 inch and below) in term of size and the large-sized panels include NB panels, monitor panels, LCD TV panels, etc. Its clients are all leading system and home appliance vendors around the globe. In addition, subject is the 4th largest LCD TV panelsupplier in the world. Company's Features: Subject has been focused on R&D of wide visual angle & low color shift technology, wide visual angle technology, high contrast tech nology, color & image improvement technology, dynamic quality improvement technology and large size LCD TV technology for a long time;besides, due to business concerns, subject has teamed up with ITRI, Japanese FUJITSU, DNP, U.S. IBM for technical cooperation on R&D of TFT-LCDs; in 2005 it was awarded the 13th “Taiwan's Symbol of Excellence" by Ministry of Economic Affairs. In 2001, subject bought IBM’s third gener ation pr oduction line in Yasu, J apan and j ointly founded ODTech with IBM Japan, becoming t he first to join hands with the TFT-LCD Japanese counterparts in Taiwan. As deployment of new capacities in Taiwan gets ready, out of consideration for arrangement and managem ent efficiency of long-term product line, subject reached an agreement with Sony in Jan. 2005 to sell its ODTech Yasu factory to Sony as the second production base of LTPS (Low Temperature Poly -Silicon) LCD panelfor Sony’s portable 3C products. Moreover, in Jan. 2006, subject reac hed a cross-licensing agreement with world 's largest LCD TV company Sharp, and i t became the firs t panel company that reaches extensivecross-licensing agreement with Sharp. The cross licensing agreement covers LCD display technology of both companies in cluding PCs, NBs, and LCD TV in various size, medium & small size products. Meanwhile, both parties agreed that they w ould not sue each other o r their clients for any LCD patent . Moreover, subject announced on Feb. 27 that it has signed patent licensing agreement with Thomson Li-cens ing Inc., who agreed to authorize subject all the LCD patent technology related to LCD monitor products. Industrial Dynamics: For the TV panel sec tor still continues to looking u p, subject puts emphasis on LCD T V customers, products and market deployment wit h all the strength in 2008. In 2008, shipments of LCD TV panels reach 5.5 million and it is the world’s No. 3 largest LCD TV panel supplier. Subjec t’s 5.5-gen plant also r amps up capacities in Q4 of 2008; shipments of LCD TV panels pick up signif icantly and monthly tape-out volu me of hits 90,000 units in Dec. 32” TV panels which are the mainstream see output s hoot up, which f urther securessubject’s market share in TV panels. Moreover, thanks to LCD TV demand, subject’ssingle-month TV panel shipment in Dec. 2008 reaches over 700,000 units; TV panels takeup over a half of the overall revenue for the first time, bringing it to the world’s No.1.
The information given in this report is furnished by China Credit Information Service, Ltd. In Strict Confidence. Although
the information in this report is obtained from reliable sources, it is in no manner guaranteed. In accepting this report the
inquirer agrees to hold it in Strict Confidence for his own exclusive use and accept personal responsibility for any damage
arising from a violation of communicating such information as contained in this report.
19
Prospect: In aspect of business deployment in Chin a, subject was approved by Investment Commission of Ministry of Economic Affair for investment on log istic business in Ch ina in April 2008. Subject is going to invest indire ctly on "NINGBO CHI CHI LOGISTICS INC." to serve local back-end module c ustomers. Besides, t o lower cost, subject has investedNingbo Hua We Company in China. In Q4 of 2008, subject has gained 53% stake of Ningbo Chi Chi and officially took over the managing ri ght; this is subject’s fi rst time to set up LCM production line in China, and currently it has begun production and the second factory isnow under expans ion. In addition to deployment of overall bus iness in Ningbo, China, subject does not rule out the possibility of setting up the sec ond base in China, aside from Ningbo. Subject aggressively expand its business territo ry in LCD TV; in 2007, it newly built two factories, on 5G factory and one 7.5G factory; the second 5G factory is set to begin volumeproduction in Q4 2008 , and the major products will be 42 inch an d 47 inch p roducts, whilethe 7.5G factory will star t volume production in mid-2007. To accelerate its deployment in LCD TV panels, subject will continue to build new plants in 2009. For effects of the merge r between Au Optronics and Quanta Display are quickly felt in the line, subject initiates itsplants for its 6G and 8G factor ies at the same time; constr uction has been started in Apr.2009 and it speeds up the expansion plan for new fact ories. IN the future , it will target 37-inch, 50-inch and above LCD TV market. In view of the current status, subject’s second 5Gand 7.5G factories will continue to be built in 2010, which helps to improve the overallcapacities. In 2009, subject will challenge the goal to reach LCD TV shipments of 15 million units and continue to develop new models , aimi ng for larger size TV panels. Its futuredevelopment is still promising.
Information used to compose this report:up to Apr. 30, 2009
- End of Report - IMPORTANT NOTE: Information herein is believed to be reliable; Chin a Credit Information Service, however, does not warrant its completeness or accuracy. The report is furni shed in stri ct confidence for t he inqui rer's exclusive use for legitimate purposes. CCIS is not liable for any loss, damage, or in jury caused by negligence or other act or failure of CCIS in procuring, collecting, and communicating information contained herein.
The information given in this report is furnished by China Credit Information Service, Ltd. In Strict Confidence. Although
the information in this report is obtained from reliable sources, it is in no manner guaranteed. In accepting this report the
inquirer agrees to hold it in Strict Confidence for his own exclusive use and accept personal responsibility for any damage
arising from a violation of communicating such information as contained in this report.
20
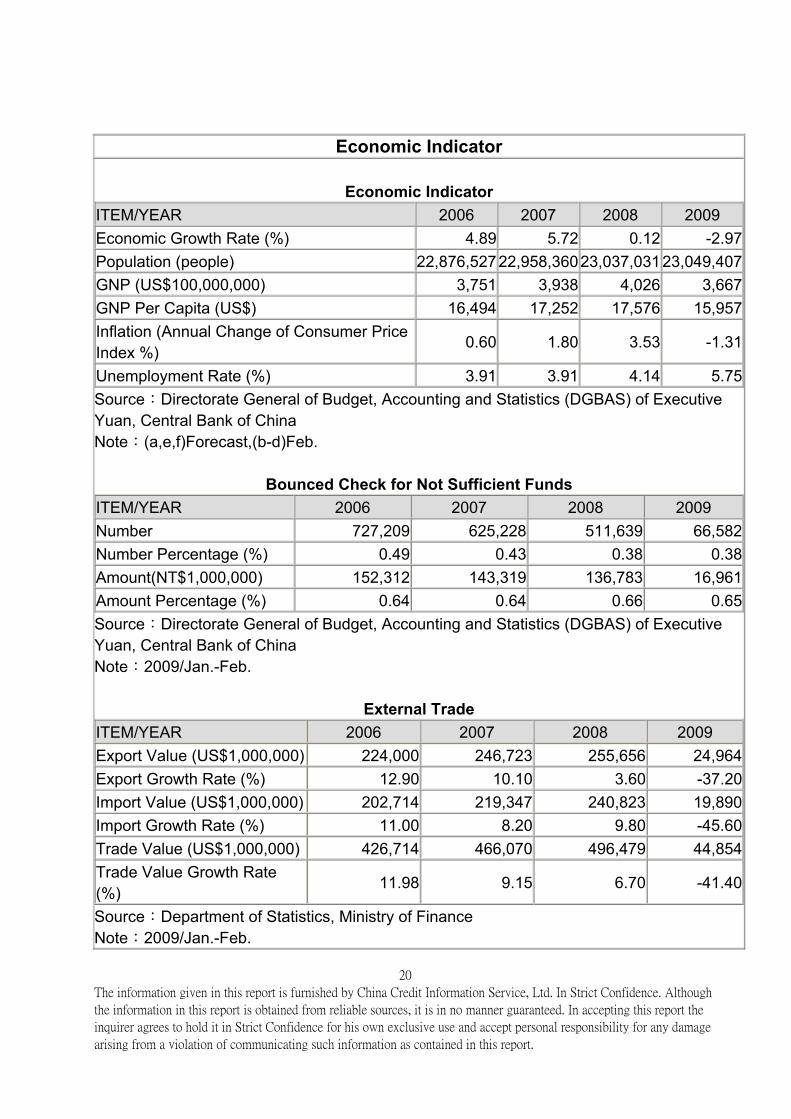
Economic Indicator
Economic Indicator
ITEM/YEAR 2006 2007 2008 2009 Economic Growth Rate (%) 4.89 5.72 0.12 -2.97Population (people) 22,876,52722,958,360 23,037,03123,049,407GNP (US$100,000,000) 3,751 3,938 4,026 3,667GNP Per Capita (US$) 16,494 17,252 17,576 15,957Inflation (Annual Change of Consumer Price Index %) 0.60 1.80 3.53 -1.31
Unemployment Rate (%) 3.91 3.91 4.14 5.75Source:Directorate General of Budget, Accounting and Statistics (DGBAS) of Executive Yuan, Central Bank of China Note:(a,e,f)Forecast,(b-d)Feb.
Bounced Check for Not Sufficient Funds
ITEM/YEAR 2006 2007 2008 2009 Number 727,209 625,228 511,639 66,582Number Percentage (%) 0.49 0.43 0.38 0.38Amount(NT$1,000,000) 152,312 143,319 136,783 16,961Amount Percentage (%) 0.64 0.64 0.66 0.65Source:Directorate General of Budget, Accounting and Statistics (DGBAS) of Executive Yuan, Central Bank of China Note:2009/Jan.-Feb.
External Trade
ITEM/YEAR 2006 2007 2008 2009 Export Value (US$1,000,000) 224,000 246,723 255,656 24,964Export Growth Rate (%) 12.90 10.10 3.60 -37.20Import Value (US$1,000,000) 202,714 219,347 240,823 19,890Import Growth Rate (%) 11.00 8.20 9.80 -45.60Trade Value (US$1,000,000) 426,714 466,070 496,479 44,854Trade Value Growth Rate (%) 11.98 9.15 6.70 -41.40
Source:Department of Statistics, Ministry of Finance Note:2009/Jan.-Feb.
The information given in this report is furnished by China Credit Information Service, Ltd. In Strict Confidence. Although
the information in this report is obtained from reliable sources, it is in no manner guaranteed. In accepting this report the
inquirer agrees to hold it in Strict Confidence for his own exclusive use and accept personal responsibility for any damage
arising from a violation of communicating such information as contained in this report.
21
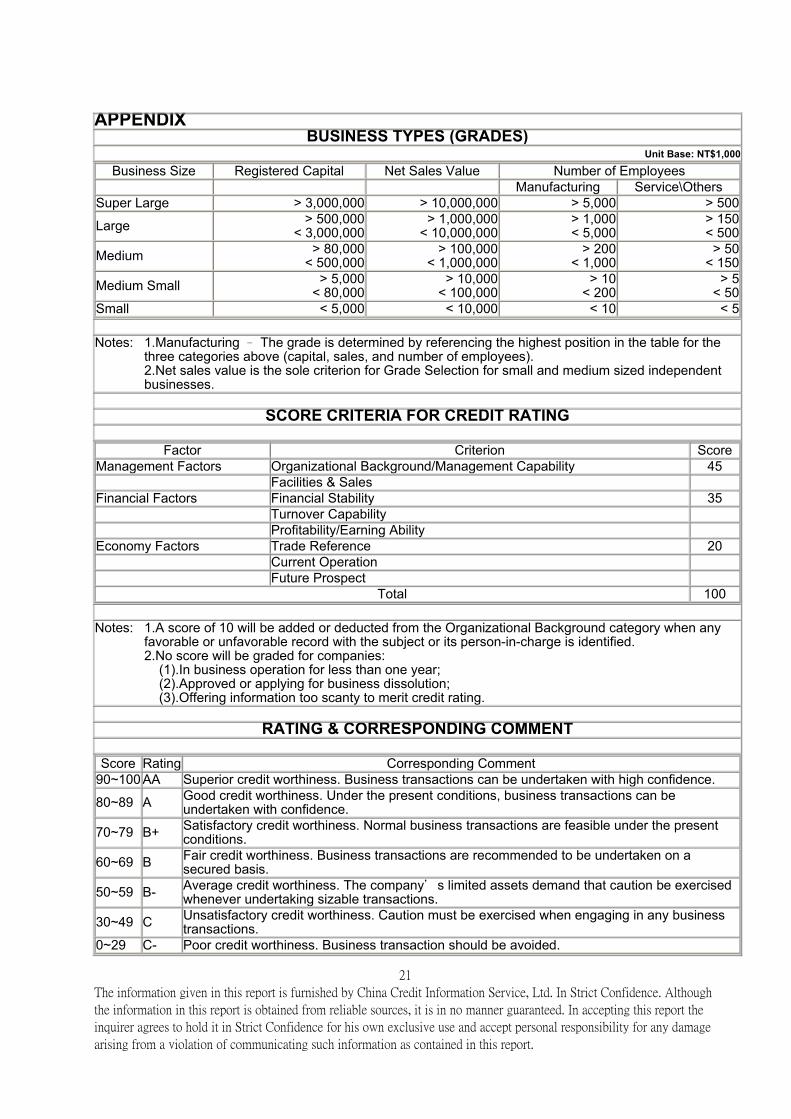
APPENDIX BUSINESS TYPES (GRADES)
Unit Base: NT$1,000
Business Size Registered Capital Net Sales Value Number of Employees Manufacturing Service\Others
Super Large > 3,000,000 > 10,000,000 > 5,000 > 500
Large > 500,000< 3,000,000
> 1,000,000< 10,000,000
> 1,000 < 5,000
> 150< 500
Medium > 80,000< 500,000
> 100,000< 1,000,000
> 200 < 1,000
> 50< 150
Medium Small > 5,000< 80,000
> 10,000< 100,000
> 10 < 200
> 5< 50
Small < 5,000 < 10,000 < 10 < 5
1.Manufacturing – The grade is determined by referencing the highest position in the table for the three categories above (capital, sales, and number of employees).
Notes:
2.Net sales value is the sole criterion for Grade Selection for small and medium sized independent businesses.
SCORE CRITERIA FOR CREDIT RATING
Factor Criterion Score
Management Factors Organizational Background/Management Capability 45 Facilities & Sales Financial Factors Financial Stability 35 Turnover Capability Profitability/Earning Ability Economy Factors Trade Reference 20 Current Operation Future Prospect
Total 100
1.A score of 10 will be added or deducted from the Organizational Background category when any favorable or unfavorable record with the subject or its person-in-charge is identified.
Notes:
2.No score will be graded for companies: (1).In business operation for less than one year; (2).Approved or applying for business dissolution; (3).Offering information too scanty to merit credit rating.
RATING & CORRESPONDING COMMENT
Score Rating Corresponding Comment
90~100 AA Superior credit worthiness. Business transactions can be undertaken with high confidence. 80~89 A Good credit worthiness. Under the present conditions, business transactions can be
undertaken with confidence. 70~79 B+ Satisfactory credit worthiness. Normal business transactions are feasible under the present
conditions. 60~69 B Fair credit worthiness. Business transactions are recommended to be undertaken on a
secured basis. 50~59 B- Average credit worthiness. The company's limited assets demand that caution be exercised
whenever undertaking sizable transactions. 30~49 C Unsatisfactory credit worthiness. Caution must be exercised when engaging in any business
transactions. 0~29 C- Poor credit worthiness. Business transaction should be avoided.
The information given in this report is furnished by China Credit Information Service, Ltd. In Strict Confidence. Although
the information in this report is obtained from reliable sources, it is in no manner guaranteed. In accepting this report the
inquirer agrees to hold it in Strict Confidence for his own exclusive use and accept personal responsibility for any damage
arising from a violation of communicating such information as contained in this report.
22
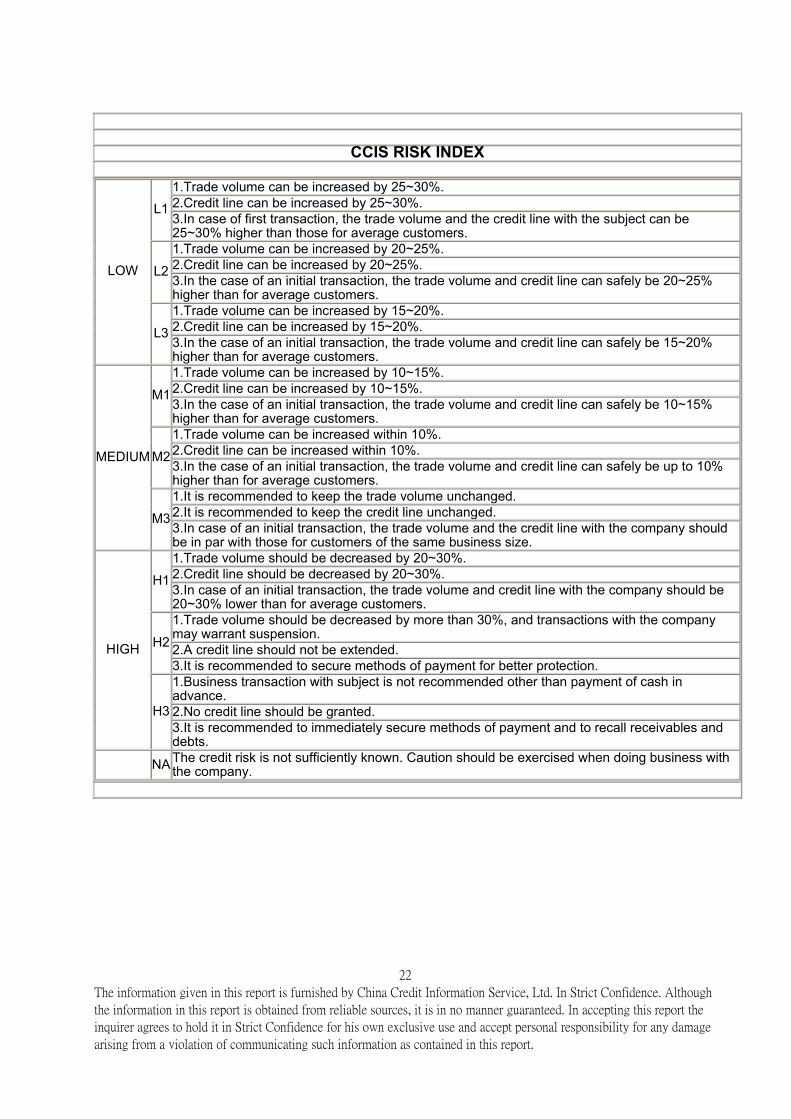
CCIS RISK INDEX
1.Trade volume can be increased by 25~30%. 2.Credit line can be increased by 25~30%. L1 3.In case of first transaction, the trade volume and the credit line with the subject can be 25~30% higher than those for average customers. 1.Trade volume can be increased by 20~25%. 2.Credit line can be increased by 20~25%. L2 3.In the case of an initial transaction, the trade volume and credit line can safely be 20~25% higher than for average customers. 1.Trade volume can be increased by 15~20%. 2.Credit line can be increased by 15~20%.
LOW
L3 3.In the case of an initial transaction, the trade volume and credit line can safely be 15~20% higher than for average customers. 1.Trade volume can be increased by 10~15%. 2.Credit line can be increased by 10~15%. M1 3.In the case of an initial transaction, the trade volume and credit line can safely be 10~15% higher than for average customers. 1.Trade volume can be increased within 10%. 2.Credit line can be increased within 10%. M2 3.In the case of an initial transaction, the trade volume and credit line can safely be up to 10% higher than for average customers. 1.It is recommended to keep the trade volume unchanged. 2.It is recommended to keep the credit line unchanged.
MEDIUM
M3 3.In case of an initial transaction, the trade volume and the credit line with the company should be in par with those for customers of the same business size. 1.Trade volume should be decreased by 20~30%. 2.Credit line should be decreased by 20~30%. H1 3.In case of an initial transaction, the trade volume and credit line with the company should be 20~30% lower than for average customers. 1.Trade volume should be decreased by more than 30%, and transactions with the company
warrant suspension. may2.A credit line should not be extended. H2 3.It is recommended to secure methods of payment for better protection. 1.Business transaction with subject is not recommended other than payment of cash in advance. 2.No credit line should be granted.
HIGH
H3 3.It is recommended to immediately secure methods of payment and to recall receivables and debts.
NA The credit risk is not sufficiently known. Caution should be exercised when doing business with the company.
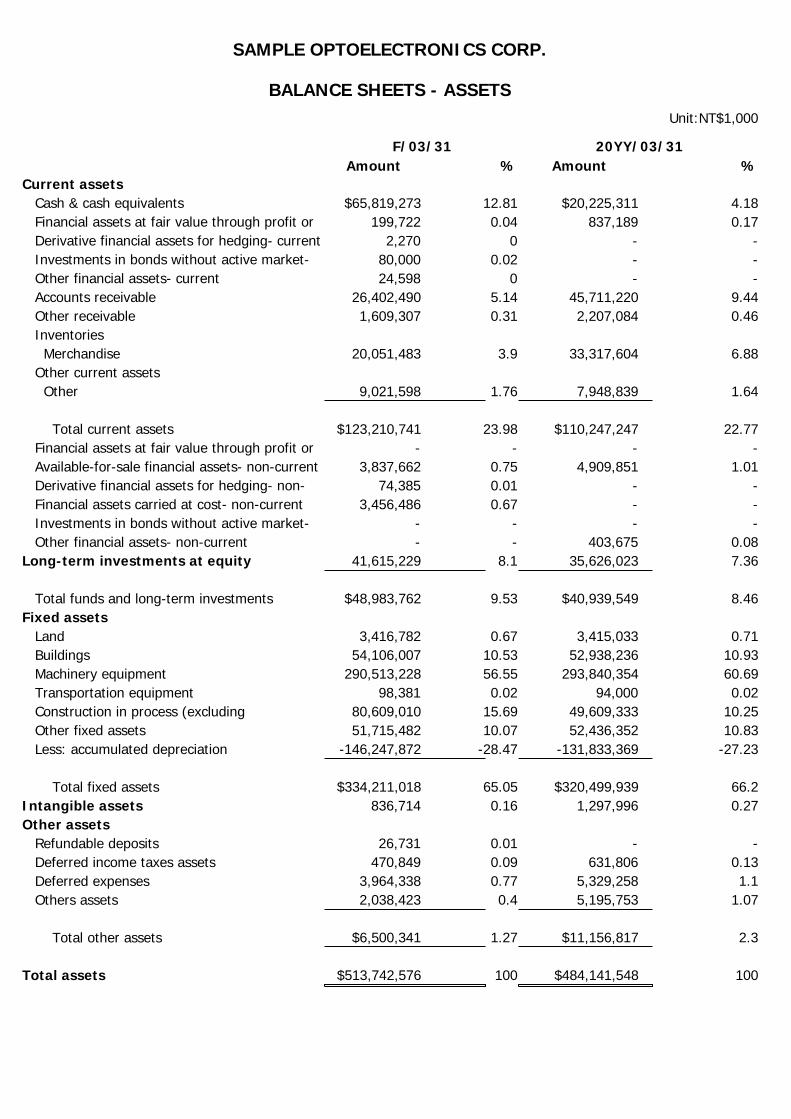
Amount % Amount %
$65,819,273 12.81 $20,225,311 4.18199,722 0.04 837,189 0.17
2,270 0 - -80,000 0.02 - -24,598 0 - -
26,402,490 5.14 45,711,220 9.441,609,307 0.31 2,207,084 0.46
20,051,483 3.9 33,317,604 6.88
9,021,598 1.76 7,948,839 1.64
$123,210,741 23.98 $110,247,247 22.77- - - -
3,837,662 0.75 4,909,851 1.0174,385 0.01 - -
3,456,486 0.67 - -- - - -- - 403,675 0.08
41,615,229 8.1 35,626,023 7.36
$48,983,762 9.53 $40,939,549 8.46
3,416,782 0.67 3,415,033 0.7154,106,007 10.53 52,938,236 10.93
290,513,228 56.55 293,840,354 60.6998,381 0.02 94,000 0.02
80,609,010 15.69 49,609,333 10.2551,715,482 10.07 52,436,352 10.83
-146,247,872 -28.47 -131,833,369 -27.23
$334,211,018 65.05 $320,499,939 66.2836,714 0.16 1,297,996 0.27
26,731 0.01 - -470,849 0.09 631,806 0.13
3,964,338 0.77 5,329,258 1.12,038,423 0.4 5,195,753 1.07
$6,500,341 1.27 $11,156,817 2.3
$513,742,576 100 $484,141,548 100
SAMPLE OPTOELECTRONICS CORP.
BALANCE SHEETS - ASSETS
Total assets
Total other assets
Deferred expenses Others assets
Intangible assetsOther assets Refundable deposits Deferred income taxes assets
Total fixed assets
Transportation equipment Construction in process (excluding Other fixed assets Less: accumulated depreciation
Fixed assets Land Buildings Machinery equipment
Total funds and long-term investments
Financial assets carried at cost- non-current Investments in bonds without active market- Other financial assets- non-currentLong-term investments at equity
Total current assets Financial assets at fair value through profit or Available-for-sale financial assets- non-current Derivative financial assets for hedging- non-
Other
Other receivable Inventories Merchandise Other current assets
Derivative financial assets for hedging- current Investments in bonds without active market- Other financial assets- current Accounts receivable
Current assets Cash & cash equivalents Financial assets at fair value through profit or
Unit:NT$1,000
F/03/31 20YY/03/31
Amount % Amount %
$2,358,323 0.46 $ - -8,875,587 1.73 2,100,000 0.43
74,366,185 14.48 72,810,689 15.041,121,654 0.22 - -
- - 2,615,086 0.5419,887,837 3.87 23,011,456 4.75
37,627,995 7.32 23,398,936 4.83
5,116,315 1 4,970,083 1.03
$149,353,896 29.07 $128,906,250 26.63
4,000,000 0.78 - -169,093,203 32.91 118,451,989 24.47
6,922,222 1.35 - -- - - -
553,013 0.11 188,261 0.04
$180,568,438 35.15 $118,640,250 24.51
10,989 0 - -14,138 0 91,415 0.0251,271 0.01 118,531 0.02
$329,998,732 64.23 $247,756,446 51.17
87,126,119 16.96 82,872,399 17.1286,728,932 16.88 86,906,456 17.954,904,500 0.95 63,016,327 13.023,922,936 0.76 -666,589 -0.141,061,357 0.21 4,256,509 0.88
$183,743,844 35.77 $236,385,102 48.83
$513,742,576 100 $484,141,548 100
BALANCE SHEETS -LIABILITIES AND STOCKHOLDERS' EQUITY
Total liabilities and stockholders equity
Net stockholders equity
Unrealized gains or losses of financial
Capital Additional paid-in capital Retained earning Cumulative translation adjustment
Total liabilitiesStockholders equity
Deposits received Accrued pension reserves Total other liabilities
Total long-term liabilitiesOther liabilities
Other long-term payable Financial liabilities at fair value through profit Derivative financial liabilities for hedging- non-
Total current liabilitiesLong-term liabilities Bonds payable Long-term debt payable
Other current liabilities Others
Income tax payable Other payables Unearned receipts Current portion of long-term liabilities
Other short-term loans Accrued Payables Accounts payable Financial liabilities at fair value through profit
Current liabilities Short-term debt Commercial paper payable
Unit:NT$1,000
20YY/03/31 20YY/03/31
Amount % Amount %
$45,237,147 103.91 $92,267,769 101-1,702,103 -3.91 -911,246 -1
$43,535,044 100 $91,356,523 100
$43,535,044 100 $91,356,523 100-58,171,734 -133.62 -72,756,284 -79.64
-$14,636,690 -33.62 $18,600,239 20.36
-1,425,321 -3.27 -1,804,780 -1.98-1,433,089 -3.29 -1,342,624 -1.47-1,033,902 -2.37 -1,070,463 -1.17
-$3,892,312 -8.94 -$4,217,867 -4.62
-$18,529,530 -42.56 $14,365,814 15.73
104,882 0.24 76,008 0.081,847,402 4.24 - -
- - 3,171,061 3.4710,451 0.02 33,280 0.0487,541 0.2 - -
- - 33,164 0.04157,400 0.36 283,616 0.3120,578 0.05 1,619,929 1.77
$2,228,254 5.12 $5,217,058 5.71
-1,347,533 -3.1 -1,366,835 -1.5- - -1,855,200 -2.03
-2,460,190 -5.65 - --4,474 -0.01 -36,624 -0.04
- - - -- - -254,494 -0.28
-130,951 -0.3 -93,849 -0.1-316,504 -0.73 - -
-$4,259,652 -9.78 -$3,607,002 -3.95
-$20,560,928 -47.23 $15,975,870 17.49990,723 2.28 -771,614 -0.84
-$19,570,205 -44.95 $15,204,256 16.64
INCOME STATEMENT
Net income (loss)
Pre-tax profit (loss)Income tax benefit (income tax)
Total non-operating expenses
Loss on disposal of investments Others Loss on valuation of financial liability
Foreign exchange loss Investment loss Loss on disposal of assets Loss on inventory devaluation & shortage
Total non-operating incomeNon-operating expenses Interest expenses
Others Financial product evaluation profit
Investment income Gain on disposal of assets Gain on disposal of investments Gain on physical inventory
Operating income (loss)Non-operating income Interest income Foreign exchange gain
Total operating expenses
R&d expenses Selling expenses Administrative expenses
0 -16,558 -0.02
Operating expenses
Gross income (loss) Realized gross income - related parties (loss)
-528
Operating cost Total operating revenue
Net sales
Operating revenue Sales revenue Less: sales returns and allowances
Unit:NT$1,000
20YY/01/01~20YY/03/31
20YY/01/01~20YY/03/31
20YY/01/01~
20YY/01/01~
20YY/03/31 20YY/03/31
-$19,570,205 $15,204,256$15,592,568 $13,816,567$2,460,190 -$3,171,061
-$87,541 $254,494-$5,977 $3,344
$528 $ --$9,721,169 $10,833,452$1,151,153 -$497,090$4,723,831 -$6,106,598
$992,203 $ -$ - $1,041,229
-$930,368 -$960,061-$990,932 -$130,114
$7,775,509 $1,310,930$ - -$1,337,685
-$950,070 $219,770$ - $845,801
-$1,084,278 $1,517,707-$5,306 $ -
-$11,313 -$31,498$88,169 $77,758
-$64,937 $ -$ - $339,372
-$3,875,748 $33,230,573 Net Cash Flows from Operating Activities
Other gain or loss Financial product evaluation loss Others operating activities
Income tax payable Other current liabilities Other liabilities Accrued pension cost
Deferred income tax assets Accounts payable Fee payables Other payables
Inventories Other financial assets Advanced payment Other current assets
$ -
Gross profit of unearned/ earned related sale Accounts receivable Other receivables
Gain or loss on disposal of assets Gain or loss on inventory devaluation & shortage
-$3,237,803
Net income Depreciation Gain or loss on equity method of investments Gain or loss on disposal of investments
Unit:NT$1,000
Cash Flows from Operating Activities
CASH FLOWS STATEMENTCash Flows From Operating Activities
20YY/01/01~
20YY/01/01~
20YY/03/31 20YY/03/31
-1,689,572 -1,415,295-9,656,721 -23,010,547
1,098 461,6101,426 -
-105,783 -- -- -
4,716 -- -1,662- 221,919
-605,425 124,330
-$12,050,261 -$23,619,645
$3,283,046 -$939,355-$450,246 $ -
-$3,669,781 -$9,369,977$682 $ -$789 $ -
$ - $15,623
-$835,510 -$10,293,709
$182,945 -$474,565-$16,578,574 -$1,157,346
$82,397,847 $21,382,657
$ - $ -
$65,819,273 $20,225,311
$1,425,639 $1,185,610
$8,627 $8,845
Supplement Disclosure Current interest expenses
Current income tax
Consolidated increase in inward remittance and bank deposit
Cash and cash equivalents at end of year
Exchange adjustmentIncrease (decrease) in cash and cash equivalentsCash and cash equivalents at beginning of year
Redeem from treasury stock Others financing activities
Net cash flows from financing activities
Short-term loans Short-term notes and bills payable Long-term loans (including current portion) Deposits received
Net Cash Flows from Investing Activities
Cash Flows from Financing Activities
Available-for-sale financial assets- current Available-for-sale financial assets- non-current Derivative financial assets for hedging- non- Others investing activities
Refundable deposit Deferred expense Intangible assets Financial assets at fair value through profit or
Cash Flows from Investing Activities Long-term investments at equity Fixed assets Proceeds from sale of fixed assets
UnitGNT$1,000
CASH FLOWS STATEMENTCash Flows From Investing & Finacing Activities
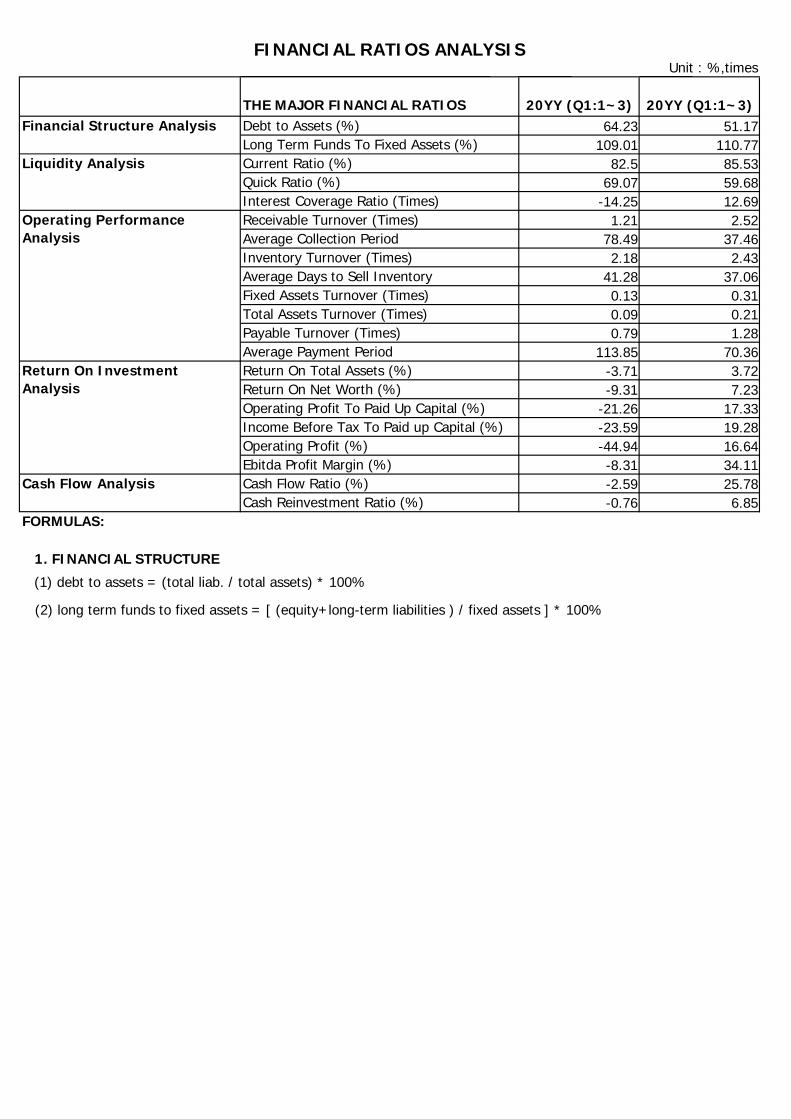
20YY (Q1:1~3) 20YY (Q1:1~3)64.23 51.17
109.01 110.7782.5 85.53
69.07 59.68-14.25 12.69
1.21 2.5278.49 37.462.18 2.43
41.28 37.060.13 0.310.09 0.210.79 1.28
113.85 70.36-3.71 3.72-9.31 7.23
-21.26 17.33-23.59 19.28-44.94 16.64-8.31 34.11-2.59 25.78-0.76 6.85
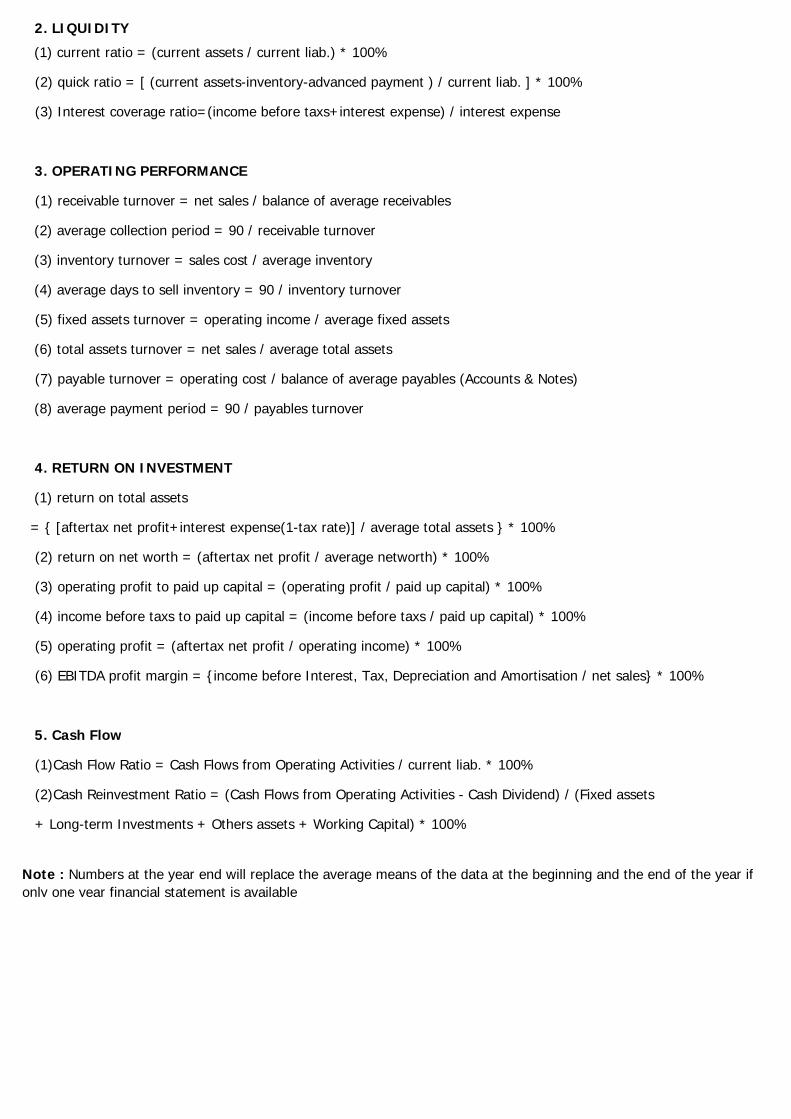
1. FINANCIAL STRUCTURE
(1) debt to assets = (total liab. / total assets) * 100%
(2) long term funds to fixed assets = [ (equity+long-term liabilities ) / fixed assets ] * 100%
Cash Flow Analysis Cash Flow Ratio (%)Cash Reinvestment Ratio (%)
FORMULAS:
Return On Investment Analysis
Return On Total Assets (%)Return On Net Worth (%)Operating Profit To Paid Up Capital (%)Income Before Tax To Paid up Capital (%)Operating Profit (%)Ebitda Profit Margin (%)
Operating Performance Analysis
Receivable Turnover (Times)Average Collection PeriodInventory Turnover (Times)Average Days to Sell InventoryFixed Assets Turnover (Times)Total Assets Turnover (Times)Payable Turnover (Times)Average Payment Period
Financial Structure Analysis Debt to Assets (%)Long Term Funds To Fixed Assets (%)
Liquidity Analysis Current Ratio (%)Quick Ratio (%) Interest Coverage Ratio (Times)
THE MAJOR FINANCIAL RATIOS
FINANCIAL RATIOS ANALYSISUnit : %,times
+ Long-term Investments + Others assets + Working Capital) * 100%
(1)Cash Flow Ratio = Cash Flows from Operating Activities / current liab. * 100%
Note : Numbers at the year end will replace the average means of the data at the beginning and the end of the year if only one year financial statement is available
= { [aftertax net profit+interest expense(1-tax rate)] / average total assets } * 100%
(2) return on net worth = (aftertax net profit / average networth) * 100%
(3) operating profit to paid up capital = (operating profit / paid up capital) * 100%
(4) income before taxs to paid up capital = (income before taxs / paid up capital) * 100%
5. Cash Flow
(2)Cash Reinvestment Ratio = (Cash Flows from Operating Activities - Cash Dividend) / (Fixed assets
(2) average collection period = 90 / receivable turnover
4. RETURN ON INVESTMENT
(1) return on total assets
(6) total assets turnover = net sales / average total assets
(5) operating profit = (aftertax net profit / operating income) * 100%
(6) EBITDA profit margin = {income before Interest, Tax, Depreciation and Amortisation / net sales} * 100%
(8) average payment period = 90 / payables turnover
(3) inventory turnover = sales cost / average inventory
(4) average days to sell inventory = 90 / inventory turnover
(5) fixed assets turnover = operating income / average fixed assets
(7) payable turnover = operating cost / balance of average payables (Accounts & Notes)
3. OPERATING PERFORMANCE
(1) receivable turnover = net sales / balance of average receivables
(3) Interest coverage ratio=(income before taxs+interest expense) / interest expense
2. LIQUIDITY
(1) current ratio = (current assets / current liab.) * 100%
(2) quick ratio = [ (current assets-inventory-advanced payment ) / current liab. ] * 100%


![[SEMI Theater] Taiwan Market Update SEMICON Taiwan](https://img.pdfslide.us/doc/110x75/55588b1ad8b42a5d328b52fd/semi-theater-taiwan-market-update-semicon-taiwan.jpg)