Embed Size (px)
Citation preview

CHINA COMMUNICATIONS SERVICES CORPORATION LIMITEDStock Code : 552
2018 Interim Results30 Aug 2018
http://www.chinaccs.com.hk

Management Present
MR. SI FURONG MS. HOU RUI
EXECUTIVE VICE PRESIDENT & CFO
PRESIDENTCHAIRMAN
MR. ZHANG ZHIYONG
2

Agenda
Financial Results
Business Review
Overview
3

Overview

Revenue growth hit 6-year high through successful transformation of growth momentum, while revenue structure optimized noticeably
Enhanced Growth Momentum
Transform towards digital services, and embark the new Smart journey
Expedited Transformation
Cyberpower, Digital Economy, Smart Society and 5G bring enormous opportunities
Cautiously Optimistic Outlook
Effective Execution on the Right Track
5

Encouraging Operating Results with Noticeable Revenue Structure Optimization
Unless otherwise stated, the following terms in the presentation are defined as follows:(1) Other than three telecommunications operators, domestic operator market also includes China Tower(2) Core businesses comprise TIS, Core BPO and ACO Businesses, i.e. excluded Products Distribution Business. Please refer to the business revenue breakdown on p.12 for details(3) Free cash flow = profit for the year + depreciation & amortization – changes in working capital – CAPEX
Customer structure continued to optimize,
portion from domestic non-operator and domestic
operators other than China Telecom
both reached 30% for the first time
Revenue grew by 13.2%
to RMB 50,792 million;
of which core businesses
revenue increased by
17.1%
Net profit achievedhigh single-digit growth of
8.6% to
RMB 1,595 million
Free cash flow reached
RMB 877 million,
accounted for
>50% of net profit
Revenue growth hit 6-year high
1H2013 1H2014 1H2015 1H2016 1H2017 1H2018
Revenue Growth Rate
4.3%
11.3%12.3%
6.4%
13.2%
9.6%
6

Transformation of Growth Momentum Led toNotably Accelerated Revenue Growth
Revenue Growth Drivers
(RMB’M)
DomesticOperatorCore BPO
+1,343
1H20181H2017
44,888
50,792
(+15.6%)
(+29.0%)
(+11.5%)
Products Distribution
-1,101Others+355
DomesticNon-operator
Core Businesses+3,244
(-28.9%)
DomesticOperator
TIS+2,063 (+10.8%)
1H2016
42,176
(-30.6%)
+6.4%
+13.2%
DomesticOperatorCore BPO
+888
Products Distribution
-1,681
Others-260Domestic
Non-operatorCore Businesses
+1,891
DomesticOperator
TIS+1,874
(-7.3%)(+11.5%)
(+11.6%)
(+20.3%)
Domestic Operator Domestic Non-operator Overseas Customer
Revenue growth was driven by 2 dual-engines, including “Domestic Non-operator + Domestic Operator” and “CAPEX + OPEX”
Made further progress on smart products promotion and drove strong momentum for domestic non-operator businesscontinuously, with core businesses growth accelerated to ≈ 30%
Endeavoured to increase market share, with TIS business from CAPEX of domestic operators maintained steady growth
Vigorously developed OPEX business of domestic operators, with Core BPO businesses growth expedited
Optimized business mix further by controlling products distribution business of low efficiency proactively
7

Pushing Forward Transformation with Remarkable Results
Transformation of CCS
Birth of CCS
New Journey of CCS
EMBARK NEW SMART JOURNEY
NURTURE SMART PRODUCTS
>14bn
>60bn
100bn
2006
2012
2018
Constructed world largest 3G, 4G, fiber optic and NB-IoT networks, also global submarine cables
Formed integrated solution capabilities for turnkey projects Top-level planning and consultation + smart products / platforms +
implementation + localized operation and maintenance
Uplifted R&D capabilities Annual R&D expenditure: ≈ RMB2.5bn Patents: ≈ 1,300 Software Copyrights: ≈ 3,000
Strengthened product and talent capabilities Over 20 smart products Over 20,000 consultation experts and software engineers
Launched ecological cooperation Enhanced cooperation with Chinese Academy of Sciences,
innovative enterprises and industrial funds
Continuous Improvement in CCS Competencies
Rev
en
ue
Sca
le (
RM
B’ b
n)
BUILD WORLD-CLASS NETWORKS
8
Ranked 6th in China’s Top 100 Software Enterprises
Established multi-businesses integrated service capabilities Possessed localized operation and support capabilities
Largest telecommunications infrastructure service provider in PRC

9
Builder of New Generation Information Infrastructure Facilities
Provider of Smart Products and
Platforms
Operator of Smart Services
Provider of Big Data Application Services
Construct high-speed, mobile,
ubiquitous and safe networks,
including network level and
network information security
Provide more than 20 smartproducts and open platformsbased on our capabilities andcollaborative developmentsuch as our Cloud and IoTplatforms
Make use of Big Data
application platform, provide
customers with integrated
big data analysis, modelling,
applications and solutions
Assist government, industriesand enterprises to launchSmart Operation
NEW SMART JOURNEYBuilding Smart Society; Boosting Digital Economy;
Serving a Good Life
Entering a New Era; Embarking New Journey

Cyberpower Digital Economy Smart Society
Leading Provider of Producer Services in the Informatization SectorValue‐driven, Seeking Steady yet Progressive Growth and High‐quality Development
Domestic Non-operator
Bolstering Cyberpower Strategy; Integrating into Ecosystem Construction; Serving Transformation and Upgrade
Serving Belt and Road Information Infrastructure Construction; Promoting Smart Society Construction Overseas
High-quality Operation High-quality Features High-quality Management High-quality Team
Adapting to New Situation; Seizing Opportunities and Expediting Development
Network and Information Country
Belt and Road Initiative
Bolstering Cyberpower
Strategy;
Building First-class
Enterprise;
Serving a Good Life
Building Smart Society;Boosting Digital Economy; Serving a Good Life
Domestic Operators
Overseas
10
SOE Reform …
Persist in the 3 Tracks of Development

Business Review

Business Revenue Breakdown
1H2017 1H2018 Change % % of Revenue
TIS (Telecommunications Infrastructure Services)
Design 5,089 5,355 5.2% 10.6%
Construction 17,235 20,942 21.5% 41.2%
Supervision 1,747 2,033 16.4% 4.0%
Subtotal 24,071 28,330 17.7% 55.8%
BPO (Business Process Outsourcing Services)
Maintenance 5,802 6,604 13.8% 13.0%
Facilities Management 2,094 2,353 12.4% 4.7%
Supply Chain 4,153 4,937 18.9% 9.7%
Subtotal 12,049 13,894 15.3% 27.4%
Products Distribution 3,815 2,714 -28.9% 5.3%
Subtotal 15,864 16,608 4.7% 32.7%
ACO (Applications, Content and Other Services)
System Integration 2,595 3,198 23.2% 6.3%
Software Development & System Support
742 950 28.1% 1.9%
Value-added Services 751 813 8.3% 1.6%
Others 865 893 3.2% 1.7%
Subtotal 4,953 5,854 18.2% 11.5%
Total 44,888 50,792 13.2% 100%
Core BPO Businesses
(RMB’M)
12
4,9534,345
5,854
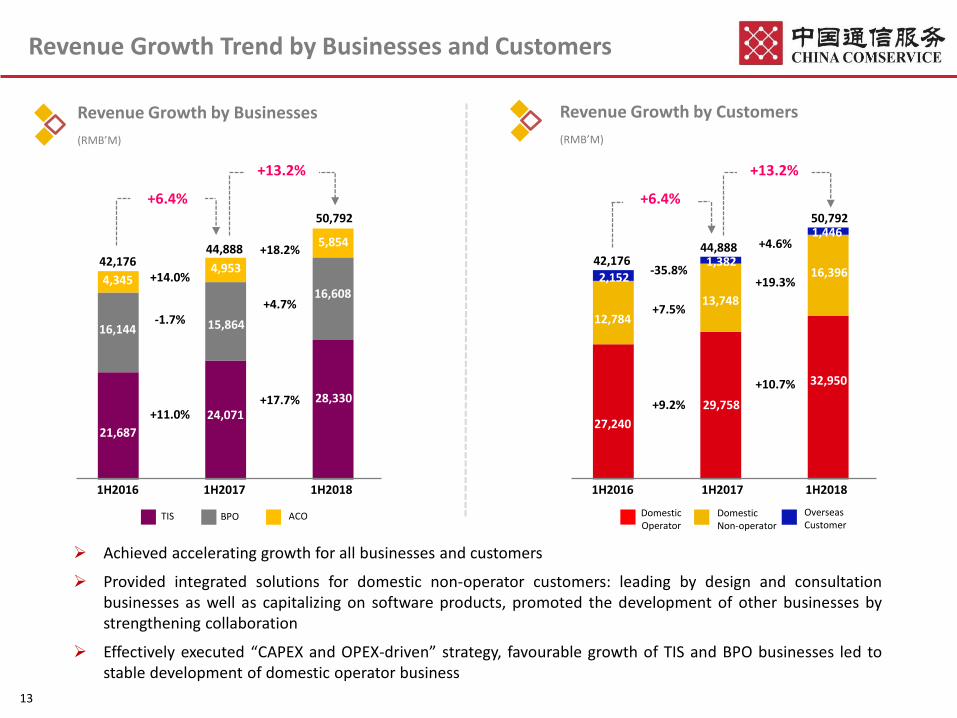
Revenue Growth Trend by Businesses and Customers
Revenue Growth by Customers
(RMB’M)
Revenue Growth by Businesses
(RMB’M)
50,792
ACO
44,888
+17.7%
+18.2%
+4.7%
TIS BPO
1H2017 1H2018
42,176
1H2016
+14.0%
-1.7%
+11.0%
16,608
15,86416,144
28,330
24,071
21,687
50,792
44,888
+10.7%
+4.6%
+19.3%
+13.2%
1H2017 1H2018
42,176
1H2016
-35.8%
+7.5%
+9.2%
+6.4%
1,446
12,784
13,748
27,240
29,758
16,396
32,950
+13.2%
+6.4%
1,3822,152
Overseas Customer
Domestic Operator
Domestic Non-operator
Achieved accelerating growth for all businesses and customers
Provided integrated solutions for domestic non-operator customers: leading by design and consultationbusinesses as well as capitalizing on software products, promoted the development of other businesses bystrengthening collaboration
Effectively executed “CAPEX and OPEX-driven” strategy, favourable growth of TIS and BPO businesses led tostable development of domestic operator business
13

Customer revenue structure further diversified and
showed noticeable changes:
Portion of revenue from domestic non-
operator escalated progressively and reached
30% for the first time
Portion of revenue from domestic operators
other than China Telecom reached 30% for
the first time
Portion of revenue from China Telecom
further reduced to 36.9%, and dependence
on a single customer further decreased
Customer Revenue Composition (By Core Businesses)
1H2016
1H2017
1H2018
36.9%(36.2%)*
42.1%(40.7%)*
41.7%(39.0%)*
30.0%(28.7%)*
27.3%(25.6%)*
28.4%(25.6%)*
30.1%(32.3%)*
27.3%(30.6%)*
25.4%(30.3%)*
4.5%(5.1%)*
3.3%(3.1%)*
3.0%(2.8%)*
China Telecom
China Mobile, China Unicom & China Tower
Domestic Non-operator
Overseas Customer
* as a % of total revenues, i.e. included Products Distribution Business14

1H2017 1H2018
11,204
Core Businesses
+3,244
2,544
Products Distribution
-596
Revenue Growth Drivers
(RMB’M)
13,748(+29.0%)
+19.3%
(-23.4%)16,396
1,948
14,448
1H2016
12,784
Core Businesses
+1,891
Products Distribution
-927
(+20.3%)
(-26.7%)
+7.5%
9,313
3,471
Domestic Non-operator Market I –Growth Momentum Enhanced
Seized the opportunities from Digital Economy and Smart Society to further enhance the integrated servicecapabilities and market influence
Continuously enriched a series of smart products and held Smart Product Release Conference to makeofficial introduction of over 20 smart products during China International Big Data Industry Expo 2018
Cooperated with Chinese Academy of Sciences and other innovative companies to form “Smart ServiceIndustrial Ecosystem Alliance”
Ranked 6th in China’s Top 100 Software Enterprises
Core Businesses Revenue
Products Distribution Revenue
15

16
1H2018 Newly-signed Contract Amount by Sectors
(%)
Transportation Software & IT Electricity Distribution
Network Reconstruction
IoT Big Data Cloud Information Security
(2)
Domestic Non-operator Market II – Market Potential
2016-2020CAGR: +13%
2016-2020CAGR: +15%
2016-2020CAGR: +30%
2015-2019CAGR: +30%
2016-2020CAGR: +20%
Vast Market Space(1)
8 trillion
2 trillion
1.5 trillion
1 trillion
0.43 trillion
(RMB)
0.2 trillion
15 trillion
(1) Sources: Related government documents (2) Investment in transportation includes highways, railways, aviation, marine transport, etc. Currently, we mainly focus on
electrical / mechanical work, informatization and pipeline relocation projects.
Government23%
Transportation11%
Construction9%
Internet & IT6%
Electricity6%
Others45%

Smart Maintenance
Design Construction Supervision SI Maintenance
4G/5G WiFi Broadband IoT Cloud Resources Network Level
Sensors Chipsets Cameras Scanners …… Perception Level
Security Products Security SI Network Security Security Services
Network Construction
Open IoT Platform
……
Cloud Platform
Platforms with Innovative
Capabilities
Smart SafetySmart
TransportationSmart Water Conservancy
Smart Enterprise
Smart Education
Smart City Smart Town Smart ParkSmart
ConstructionSmart Security
Smart Tourism Smart Court Smart JusticeSmart
Inspection ……
AI
“Big” Smart City
Big Data Cognitive Analysis
VR/AR Blockchain……
Domestic Non-operator Market III –Market Development : Enriched Smart Society Products
Smart Property
Management
Smart Supply Chain
Smart Customer
Service
SmartSecurity
Operation
Smart Transportation
Operation
Inte
gratedSe
rvices
Provider of Smart
Products and Platforms
Operator of Smart
Services
Builder of New Generation Information
Infrastructure Facilities
Provider of Big Data Application
Services
Big Data Applications and Services
17

Strengthen cooperation with government and vertical industries to promotethe launch of smart products
Accelerate integration of partners’ capabilities and markets, such as R&Dproducts of Chinese Academy of Sciences, to create new capabilities andexplore new businesses
Consolidate product, businessand delivery resources amongprovincial and localizedcompanies
Enhance synergistic operation insales and marketing throughtalent training camps
Deeply penetrate into keyindustries such as electricity andtransportation sectors to exploreintegrated service for industries
Create integrated servicesolutions for group level products
Leverage design capabilities andpromote “Consultant + Staff”business model
Build internal and externalplatforms to bolster ecosystemconstruction
Domestic Non-operator Market IV –Market Development : Construct Platforms and Ecosystem
Capabilities Accumulation
Expertise
After-sale Team
Sales Team
Delivery Team
Industrial Experts
Design & Consultation
Core Platforms and Group Level Products
Partners
Technology-basedCompanies
National Scientific R&DInstitution
Government Agencies
OneCCSCapabilities
Enabling
Capabilities Expansion
Localized Teams
18

Domestic Operator Market I – Customer Performance
Maintained steady growth in domestic operator market and our business fundamental further reinforced
Increased market share through enhancing project management and delivery quality
Revenue Growth Drivers
(RMB’M)
1H2017 1H2018
18,273
11,485
China Telecom
+9529,758
(+0.5%)
+10.7%
(+27.0%)
32,950
14,582
18,368
1H2016
27,240
China Telecom+1,838
China Mobile, China Unicom & China Tower
+680
(+11.2%)
(+6.3%)
+9.2%
China Telecom
16,435
10,805
China Mobile, China Unicom & China Tower
China Mobile, China Unicom & China Tower
+3,097
19

Products Distribution
-281
Products Distribution
-503
Domestic Operator Market II – Business Performance
Revenue Growth Drivers
(RMB’M)
ACO+37
ACO+289
(-18.3%)
(-40.1%)Core BPO
+888
2,226
29,758
1H2017
TIS+2,063
Core BPO+1,343
17,967
9,854
TIS BPO ACO
(+11.5%)
(+15.6%)
(+14.9%)
1H2018
1,937
32,950
10,694
20,030
1H2016
27,240
16,093
9,247
1,900
TIS+1,874
(+11.6%)
(+11.5%)(+2.0%)
: +10.9%
+10.7%
+9.2%
Through raising market share, TIS business maintained a double-digit growth although domestic
operators reduced CAPEX continuously
Growth of Core BPO businesses accelerated by vigorously developing OPEX business, and bolstered the
overall stable performance in domestic operator market
Core Businesses Revenue Growth
20
: +13.0%Core Businesses Revenue Growth

Domestic Operator Market III –CAPEX and OPEX Drive Future Development
-20%
-10%
0%
10%
20%
2016 2017 2018
Domestic Operators' CAPEX CCS TIS Business from Domestic Operators
Change of CAPEX(1)
and CCS TIS Business from Domestic Operators
-11.6%
13.3%7.9%
1H2018:11.5%
-15.6%
-7.7%
Maintenance(2) Supply Chain(2) Facilities Management(2)
1H2017 1H20181H2016
Firmly seize transformation and upgrade opportunities fromoperators
Focus new businesses from operators’ 5G and IoT throughenhancing informatization service capabilities
Dec 2017 Jun 2018 2019 2020
5G Expected Roadmap
Trial Network
Pre-Commercial
Trial
CommercialLaunch
TIS – CAPEX
1H2017 1H20181H20161H2017 1H20181H2016
Domestic Operators:
(1) Domestic operators’ CAPEX numbers are from three telecom operators and China Tower. 2018 data are the planned numbers announced by these companies.(2) Such data reflects revenues from domestic operator market only.
Set industry service benchmark; continue to promote branding unification of chain stores,consolidate logistic and warehousing resources, optimize nationwide unified logisticinformation system; promote synergistic operation for facilities
4,096
5,805
4,967
2,460 2,424
2,808
1,156 1,210
1,331
Strive to Increase Market Share
Continue to Improve Synergistic Operation Capabilities
(RMB’M)
21
5G NSAStandard Freezed
5G SAStandard Freezed
Construction Commercial Launch
(RMB’M) (RMB’M)
Full Year Guidance
BPO – OPEX

Overseas Market
Revenue from Overseas Market
(RMB’M)
1,4461,382
1H2017
+4.6%
-35.8%
2,152
1H20181H2016
Review
Prospect
Overseas business stabilized and key projects achieved progressthrough:
Deeply penetrating into telecom infrastructure business
Targeting on opportunities from key industries such aselectricity, education and healthcare
Extending smart products overseas
Cooperated with domestic operators and “Go Abroad” Chineseenterprises and made progress in jointly developed projects
Further optimized overseas management structure to synergizeresources, enhance service and risk-prevention capabilities
Telecom sector in Asia-Pacific region, Africa and the Middle Eastare mostly emerging markets with enormous infrastructuredemand
Belt and Road Initiative and related national policies providefavourable environment
Enhance cooperation with domestic operators and “Go Abroad”Chinese enterprises and extend smart products overseas
Push forward the implementation of key projects and realize thetransformation and upgrade of overseas business
22

Financial Results

1H2017 1H2018 Change % % of Revenue
Revenue 44,888 50,792 13.2% 100%
Cost of Revenue 39,179 44,616 13.9% 87.8%
Direct Personnel 4,101 3,959 -3.5% 7.8%
Materials 4,124 5,008 21.4% 9.8%
Direct Cost of Products Distribution
3,520 2,529 -28.1% 5.0%
Subcontracting 22,424 27,414 22.3% 54.0%
D & A 238 239 0.3% 0.5%
Others 4,772 5,468 14.6% 10.7%
Gross Profit 5,709 6,176 8.2% 12.2%
SG & A 4,347 4,661 7.2% 9.2%
Net Profit 1,469 1,595 8.6% 3.1%
EPS (RMB) 0.212 0.230 8.6% -
Financial Performance
(RMB’M)
24

Cost of Revenue as a % of Revenue
1H20181H2017 Rapid growth in businesses including construction, systemintegration and supply chain drove relatively fast increase inmaterials cost
Labour Productivity(1)
(RMB ’000/staff)
1H2016 1H2017 1H2018
+0.3%
+17.6%943
1,112946
87.8%
-2.9pp
+4.0pp
+0.1pp
+0.6pp
87.3%
-1.3pp 7.8%
9.8%
54.0%
5.0%
11.2%
9.1%
9.2%
7.9%
50.0%
11.1%
Products distribution business does not involvesubcontracting cost, and so a more meaningful analysis forsubcontracting cost is by comparing this with corebusinesses revenue, and also together with directpersonnel cost
By utilizing subcontracting resources adaptively andcontrolling total staff number, direct personnel cost as a %of revenue kept declining while labour productivityincreased rapidly
Direct Personnel Materials
Subcontracting D & A and others
Direct Cost of Products Distribution
(1) Labour Productivity = revenue (annualized basis)/ staff number
By proactively controlling the products distribution business,direct cost of products distribution as a % of revenuedecreased by 2.9 pp
25
1H2016 1H2017 1H2018
Direct Personnel +Subcontracting Cost
YoY Change
Core Businesses RevenueYoY Change
19.6%
12.0%
17.1%
25.5%
13.5%
18.3%

Net Profit
(RMB’M)
Revenue
(RMB’M)
Operating Efficiency
1H2016 1H2017 1H2018
+13.2%+6.4%
1H2016 1H2017 1H2018
1H20181H20171H2016
1,5951,469
42,176
50,79244,888
1,386
+5.9%+8.6%
12.7%
12.2%
12.8%
9.7%
9.2%
9.8%
3.3%3.1%
3.3%
Decreased service price and increased labour related cost led
to a decrease in gross profit margin
Realized the benefit from economies of scale and stringent
sales and admin expense control, SG&A as a % of revenue
further decreased
Strive to push forward transformation and control costs to
maintain stability in overall efficiency
Gross Profit Margin
SG&A as a % of Revenue
Net Profit Margin
26
Excluding the effect ofchanges in effective taxrates, net profit marginis around 3.2-3.3%

132 135139
124127
119
Working Capital Management
30.6.201730.6.2016Accounts Receivable Turnover Days
Accounts Payable Turnover Days
+17.5%
+10.7%
Accounts Receivable(1)
(RMB’M) Free Cash Flow
(RMB’M)
Accounts Payable
(RMB’M)
+10.8%
30.6.2018
+8.4%
30.6.2017 30.6.201830.6.2016
29,98033,215
35,996
21,89224,231
28,483
Due to the sharp increase in 2H2017, free cash flow in1H2018 was relatively lower
Accounts receivable and accounts payable days werestill under good control
27
1H2016 1H2017 1H20182H2016 2H2017
2,385
1,976 2,002
4,116
877
Average:2,271
(1) Disclosures on certain items of financial statements have been adjusted following the adoption of new accounting standards from 1 Jan 2018. To maintain the comparability with past yearfigures, the amount of accounts receivable as at 30 Jun 2018 is the sum of “Accounts and bills receivable, net” and “Contract assets” in financial statements.

31.12.2017 30.6.2018
Total Assets(1) 70,735 79,108
Total Liabilities 41,915 47,604
Equity Attributable to Equity Shareholders 28,329 31,022
Total Liabilities / Total Assets (%) 59.3% 60.2%
Debt-to-Capitalization Ratio (%) 1.1% 1.3%
Cash and Deposits 16,621 14,747
Interest-bearing Liabilities 327 408
Financial Position
(RMB’M)
Maintained at low debt and net cash position
Robust financial position offers financial flexibility to grasp new business opportunities
(1) Total assets as of 30 Jun 2018 included principal-protected wealth management products of approximately RMB6.5 billion (31 Dec 2017: approximately RMB5 billion)28

Thank you!
• 6th in Best Managed Company
• 4th in Most Committed to Corporate Governance
• 5th in Best at Corporate Social Responsibility
• 5th in Best at Investor Relations
--------by FinanceAsia
• Platinum Award - Excellence in Environmental,
Social and Corporate Governance
--------by The Asset
• Best CEO
• Best CFO
• Best Investor Relations
--------by Corporate Governance Asia

Appendix

Business Revenue Breakdown – By Customers
1H2017 1H2018 Change Change %
TIS (Telecommunications Infrastructure Services)
Domestic Operator 17,967 20,030 2,063 11.5%
Domestic Non-operator 5,043 7,273 2,230 44.2%
Overseas Customer 1,061 1,027 -34 -3.3%
TIS total 24,071 28,330 4,259 17.7%
Core BPO (Business Process Outsourcing Services)
Domestic Operator 8,600 9,943 1,343 15.6%
Domestic Non-operator 3,266 3,793 527 16.1%
Overseas Customer 183 158 -25 -13.7%
Subtotal (Core BPO) 12,049 13,894 1,845 15.3%
Products Distribution 3,815 2,714 -1,101 -28.9%
BPO total 15,864 16,608 744 4.7%
ACO (Applications, Content and Other Services)
Domestic Operator 1,937 2,226 289 14.9%
Domestic Non-operator 2,895 3,382 487 16.8%
Overseas Customer 121 246 125 103.9%
ACO total 4,953 5,854 901 18.2%
Total 44,888 50,792 5,904 13.2%
(RMB’M)
31

Smart Highway
32
Integrated with frontier technologies and driven by big data, the smart management system covers three major informatization areas for highway -
Big Data Driven
Smart Management
Surveillance Toll Maintenance and Operation
• Province-wide supervision network
• Real-time monitor of highway
• Operation status examination
• Operation data display
Multi-level Digital Surveillance System
First Class IT & Network Operation and Maintenance
• Support mainstream IT, networkand electromechanical equipment
• Automatic alarm system
• One-stop control overelectromechanical system androadside equipment
• Duo-camera vehicle identification system
• AI + Self-developed billing platform – electronic toll collection
• Blockchain credit system
Innovative Smart Toll Model
Surveillance, Toll, Maintenance and Operation

33
Real-time Information
• Process, analyze and display massive data, and the fastest
refresh rate is every 5 second
Flexible Display
• Display allows module assembly, and configurable
deployment, as well as seasonal or holiday specific themes
• One of the 10 most congested highway sections nationwide;
the system construction alleviated prolonged congestion
and ensured smooth operation during the 2018 Spring
Festival Travel at Hunan
• One of the three demonstrative projects from Ministry of
Transport, Jiangsu Economic and Information Technology
Commission and Jiangsu Provincial Department of
Transportation
Shanghai-Nanjing Expressway Changyi Expressway
Hunan Smart Highway –
Provincial Big Data Platform in China under Smart Management
Massive Data
• Collect and consolidate data from highway network
equipment, photos and videos, toll stations and road
condition
Smart Highway

Smart Security
Our Smart Security services are led by consultation, planning and design, taking applications as core competence
while leveraging on system integration and implementation
Safe City
Sharp Eyes Project
Social Resources
Smart Gateway
Industry Security
Emergency Command
Business Scenario
Smart Security Consultation
Smart Security Plan and Design
Smart Security Integration and Implementation
CompetenceLevel
One-touch Police Alarm Platform
Cloud Entry Approval Platform
Social Governance and Monitoring Platform
Integrated Community Service Platform
Demographic Data
Smart Engines
Industry DataFacial
PhotosVideo Data
Geographic Data
Data Exchange
InternetInfrastructure
NetworkDedicated Video Network Police Network
Application Level
PlatformLevel
Photos StructurationVideo StructurationFacial Recognition
Police Cloud / Big Data Platform
34

Smart Security
“Smart Watch”-Dynamic Monitoring on Key Areas
Crime Scene
“Smart Talk”-Visualized Applications for Police Mission
Command Center
One-touch Alarm
Smart Visitor SystemGrid Management
Command & Dispatch
Prevention & AlarmReal-time Monitoring
Facial Entry ApprovalPersonnel Tracking
Facial RecognitionVehicles Tracking
Comprehensive Analysis
Internet
110 Police Response
App for police alarming
One-touch Alarm Platform
PSTN
Police Hotline
Command Center
Facial Entry Approval
Internet
Police Station
Police Station
Key Suspects Tracking
One-touch Alarm: Xinjiang
Solutions
• One-touch Alarm: Swiftresponse from police stations
• 3-parties intercom: Policehotline pop-up window+Auto Police station group call
• Police-Video Connection:Live Video
Solutions• Facial recognition for entry• Store resident information and
entry record in cloud platform• Provide abnormal warning to
reduce police workload andincrease efficiency
One-touchAlarm
Results
• Reduced Crime
• Dynamic monitoring
for citizens
Results
• Police arrival within 1 minand lowered damage
• Reduced crime rate by50% and increasedsecurity level
Pop-up Windowfor crime scene live
video
35
Cloud-based Entry Approval:Chongqing Police Department

Cloud Services (“CCSYUN”)
Cloud integration: Integrated cloud services
Cloud Migration
Construction Capabilities on
Integrated Data Centers
• Customers cover various industries
• Constructed over 500k data center
racks
• Constructed Asia’s biggest, the
most environmental friendly, and
of highest security level cloud
computing information parks
Standardized Cloud Migration Services
• Completed various large-scalecloud migration projects fortelecom operators, industrialand manufacturing sectors, etc,which ensured no key data lossand business intermission
Equipment + Facilities Management
• Power Supply/Environment/AC/
Facilities…
IDC Management
• Racks/Network/Servers/Storage…
Heterogeneous Cloud Management
Platform
• Heterogeneous Cloud Computing/
Cloud Network/Cloud Storage…
36
Integrated Cloud +
Network Management

Cloud Services (“CCSYUN”)
37
Build Private Cloud for government, industries and enterprises
Developers Government/Industries/Enterprises
Partners
CCSYUN
…
Capabilities Enabling
Open
Safe
Capabilities Accumulation
Smart City
Smart Security
Smart Transportation
Smart Safety
SmartWater
Conservancy
Not only capable of managing Hybrid Cloud,but also can be integrated
Comprehensive security for businesses,platforms, network and data
Unified collaborative development tool toenhance efficiency
Sharing of data, applications and capabilities toovercome organizational barriers
Industry Cloud
Enterprise Cloud
Government Cloud

Forward-looking Statements
This presentation and the presentation materials distributed herewith include "forward-lookingstatements". All statements, other than statements of historical facts, that address activities,events or developments that China Communications Services Corporation Limited ("ChinaCommunications Services") expects or anticipates will or may occur in the future (including butnot limited to projections, targets, estimates and business plans) are forward-lookingstatements. China Communications Services' actual results or developments in the future,including those of the businesses that China Communications Services may acquire, may differmaterially from those indicated by these forward-looking statements as a result of variousfactors and uncertainties, including but not limited to the level of demand fortelecommunications services; competitive forces in more liberalized markets; the effects oftariff reduction initiatives; changes in the regulatory policies and other risks and factors beyondChina Communications Services’ control. In addition, China Communications Services makesthe forward-looking statements referred to herein as of today and undertakes no obligation toupdate these statements.
38