Embed Size (px)
Citation preview
Hong Kong / China – Auto 13 August 2014
Analyst certifications and other important disclosures on last page
China Auto Sector JV brands positioned for profit
JV brands in the sweet spot Robust sales growth by luxury brands looks
set to continue SUVs likely to continue to outperform Still prefer GAC and DFM
JV brands gaining market share Market share of China JV car brands has expanded from 57% at the end of 2013 to 65% by the end of July 2014 according to CAAM. Judging by their recent success, China’s JV car brands are better positioned than domestic own-brands, likely because they tend to offer a wider variety of entry-level models at competitive prices. In short, JVs are still in the sweet spot of the competitive China auto market. We look for Hong Kong-listed JV names like GAC, DFM and Brilliance to generate solid sales growth momentum in 2014F/2015F.
Customer pool for luxury brands expanding Luxury vehicles have shown good sales momentum. We estimate China’s top-ten luxury players have recorded 22% unit sales growth YTD, outperforming the overall market by 11 ppt. China luxury vehicle makers are seeing robust end demand responding to an ever expanding range of price competitive entry luxury models catering to a customer base that is growing due to the country’s rising affluence. We expect luxury vehicle makers like BMW and Mercedes, which have managed to gain a strong foothold in local markets, to perform better than international peers with a limited local presence.
“I want my, I want my, I want my SUV” SUV sales growth slowed from 35% YoY in 1H14 to 25% in July 2014. Nevertheless, we expect the SUV sub-segment to be the growth driver for foreign JVs. In July 2014, market share of the domestic SUV market reached 21.6%, a record level, largely due to a rising number of new launches and the appeal of off-road capabilities. An increasing number of new SUV models are being introduced by foreign JVs. We expect them to remain market leaders of the RMB150k-300k ASP category. Further, we expect the RMB150k-and-under ASP mini-compact SUV category to drive volume growth for mid-end foreign JVs.
We still like GAC and DFM Although Hong Kong-listed JV stocks had an impressive YTD run, we think there is still a lot of price performance to go in 2H14F and suggest investors accumulate on weakness. GAC’s multi-year growth story has legs owing to better sales from existing JVs and potential upside from new operations, notably Jeep/Acura. We direct investors seeking a value play to DFM’s undemanding valuation and solid growth momentum. Both GAC and DFM have impressive new model line-ups and offer potential upside from recently established operations.
1H14F results preview (JV-brands)
Company
Net income
(RMB b) YoY (%) Unit sales
YoY
(%)
Target
completion ratio
GAC 1.9 58 358k
(Toyota/Honda)
19 41
DFM 6.8 22 984k
(Nissan/PSA/Honda)
21 47
Brilliance 3.5 71 140k 33 52
Source: CCBIS
China auto YTD performance
Source: CCBIS
Ronnie Ho
(852) 2533 2486 [email protected]
Ke Qu (852) 2844 3601
0% 5% 10% 15% 20%
DFM
GAC
Brilliance
PV Index
China Auto Sector 13 August 2014
2
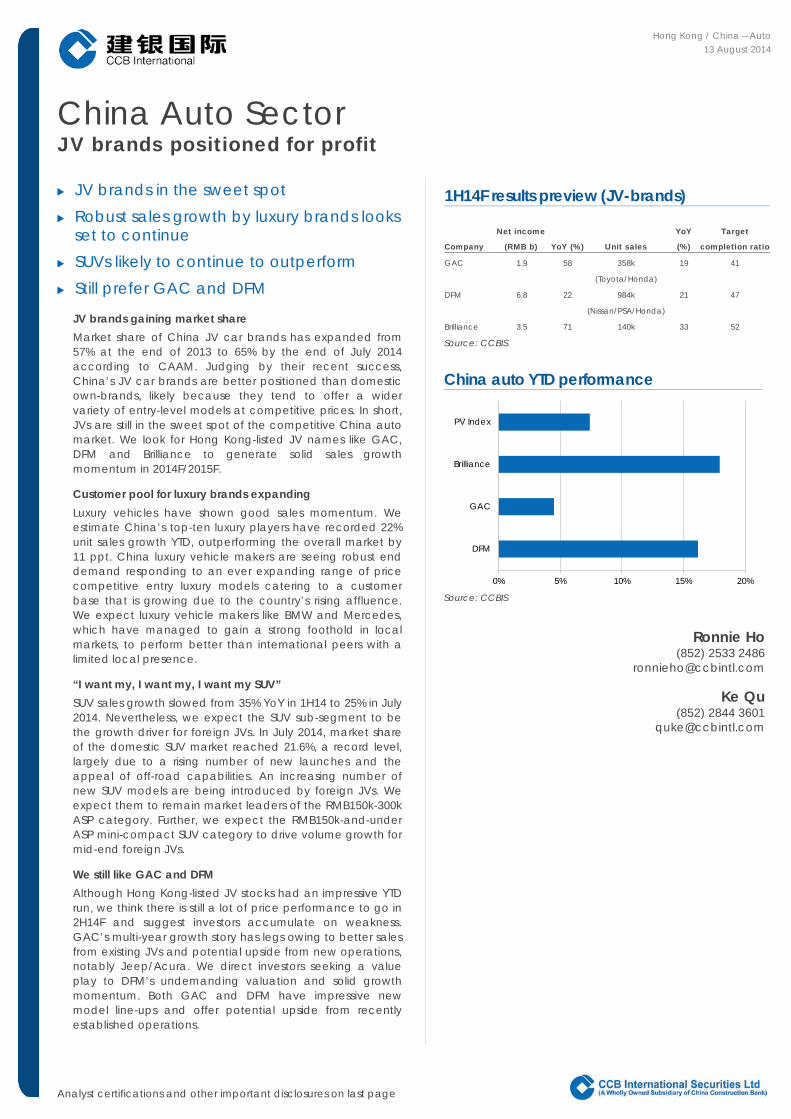
Robust passenger vehicle unit sales According to CAAM, personal vehicle (PV) sales were up 11% YoY to 11m units in 7M14, roughly in line with the market estimate of 10-12% YoY growth. PV sales slowed in July due to seasonal destocking, which saw OEMs scramble to achieve better 1H14 sales numbers. We now expect PV sales momentum to resume beginning sometime in September and believe double-digit YoY growth will sustain at least until the end of the year on higher demand from advance purchases, central and local government initiatives to eliminate high-polluting vehicles and robust replacement demand. We stick with our view that China PV sales will maintain 10% YoY growth for 2014F.
PV monthly sales in China SUV market share in China
Source: CAAM Source: Company
SUVs still the star of the show. Throughout the first seven months of the year, the SUV sub-segment in China remained the best-performing vehicle segment in the country, recording 1.8m unit sales, up 37.1% YoY and accounting for 18.9% market share of total PV sales. In our view, China’s SUV sub-segment is likely to see further market share expansion and achieve 20% market share by the end of 2014F.
Luxury brands on cruise control. Luxury vehicles have been generating good sales momentum. We estimate China’s top-ten luxury players have recorded 20% unit sales growth YTD, outperforming the overall market by 11 ppt. We expect luxury vehicle makers like Brilliance-BMW and BAIC-Daimler, which have a strong foothold in local markets, to perform better than international peers with a limited local presence.
JV brands gaining market share. JV brands have enjoyed robust YTD performance. JVs gained further market share, from 57% at the end of 2013 to 65% by the end of July 2014, according to CAAM. In our view, market share gains by JV brands will continue thanks to the competitive prices and widening range of models and features offered by the foreign brands.
NEV promotions underway. According to CAAM, 20,477 units of new energy vehicles (NEV) were sold in China in 1H14, over double the number sold in the same period the previous year. Though unit sales for NEVs are still slow, we expect favorable government polices like the purchase tax exception for NEV purchases, subsidies for plug-in hybrids and pure EVs, and the increasing number of NEVs being incorporated into government fleets to be behind resurgent NEV purchases.
(30)%
(20)%
(10)%
0%
10%
20%
30%
40%
50%
60%
0
200,000
400,000
600,000
800,000
1,000,000
1,200,000
1,400,000
1,600,000
1,800,000
2,000,000
Jan-
12Fe
b-12
Mar
-12
Ap
r-12
May
-12
Jun-
12Ju
l-12
Aug
-12
Sep
-12
Oct
-12
No
v-12
De
c-12
Jan-
13Fe
b-13
Mar
-13
Ap
r-13
May
-13
Jun-
13Ju
l-13
Aug
-13
Sep
-13
Oct
-13
No
v-13
De
c-13
Jan-
14Fe
b-14
Mar
-14
Ap
r-14
May
-14
Jun-
14Ju
l-14
PV monthly (LHS) PV YoY (RHS)
10.0%11.0%12.0%13.0%14.0%15.0%16.0%17.0%18.0%19.0%20.0%21.0%22.0%
0
200,000
400,000
600,000
800,000
1,000,000
1,200,000
Jan-
12Fe
b-1
2M
ar-
12A
pr-1
2M
ay-
12Ju
n-12
Jul-1
2A
ug-1
2Se
p-1
2O
ct-1
2N
ov-
12D
ec-
12Ja
n-13
Feb
-13
Ma
r-13
Ap
r-13
Ma
y-13
Jun-
13Ju
l-13
Aug
-13
Sep
-13
Oct
-13
No
v-13
De
c-13
Jan-
14Fe
b-1
4M
ar-
14A
pr-1
4M
ay-
14Ju
n-14
Jul-1
4
Sedan monthly (LHS) SUV monthly (LHS)MPV monthly (LHS) SUV/PV (%) (RHS)
China Auto Sector 13 August 2014
3
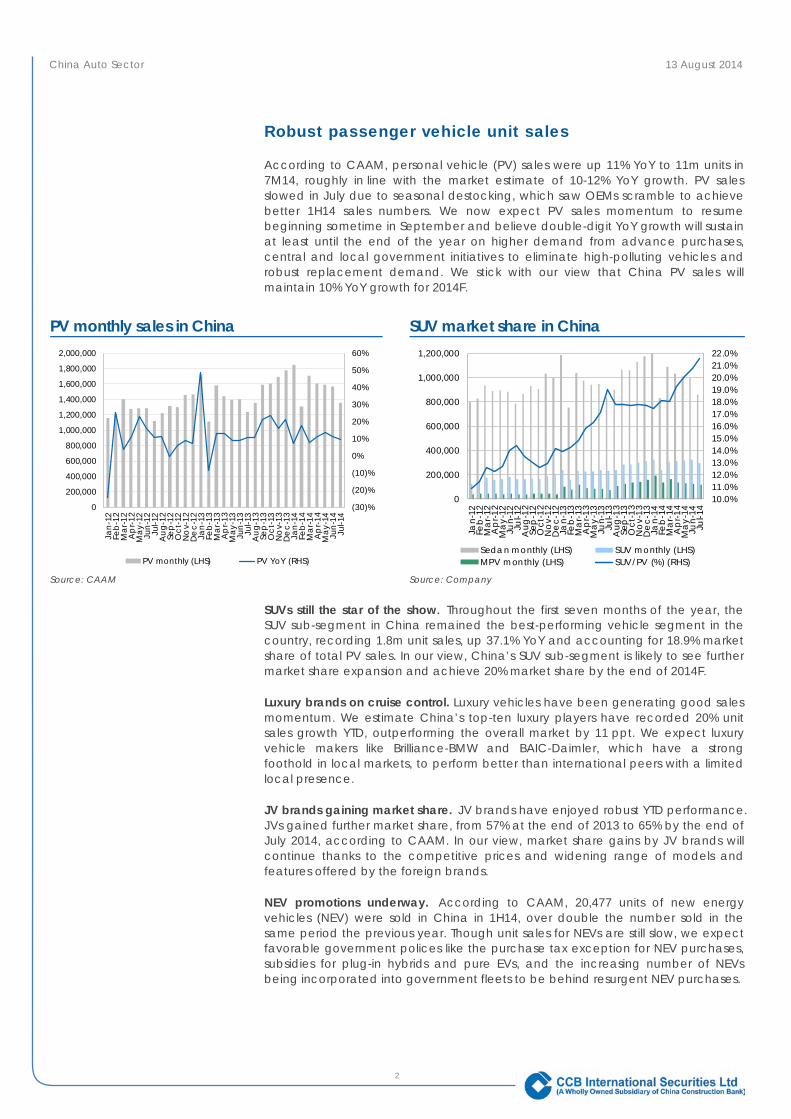
Market share of joint-venture PV brands Market share of joint-venture sedan brands
Source: CAAM Source: Company
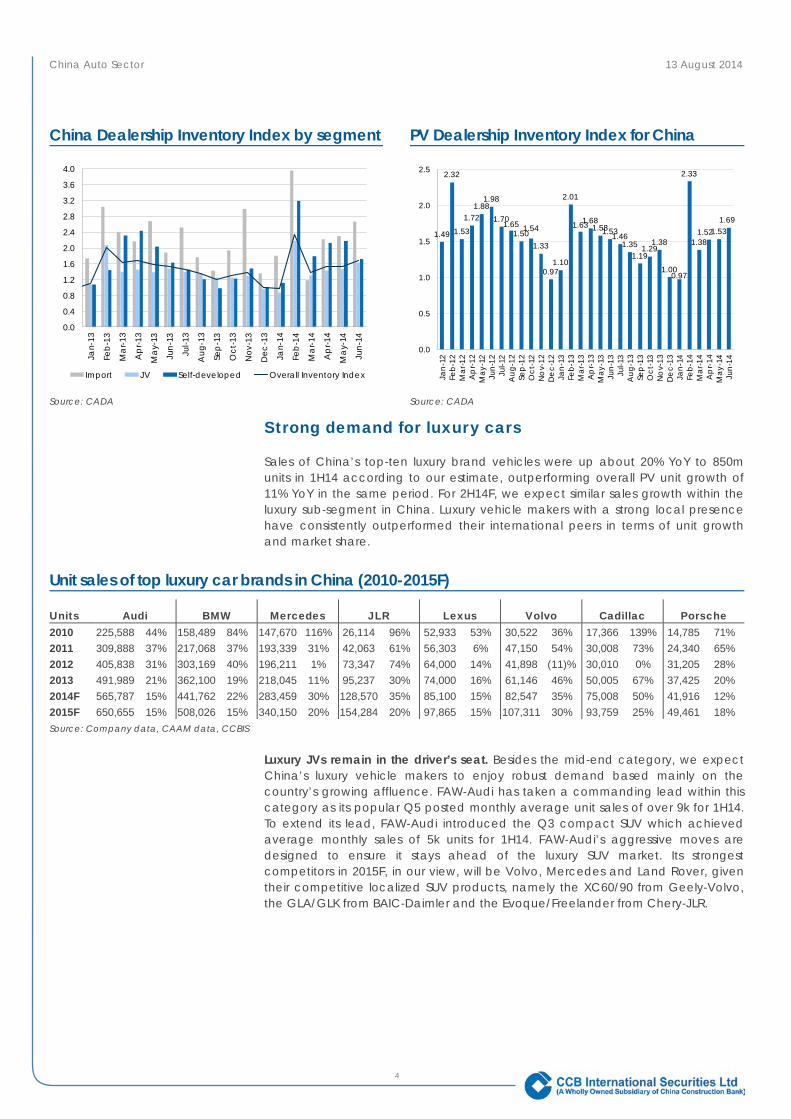
Overall inventory index remains healthy. According to CADA’s monthly report on China’s dealership space, the overall inventory level for all vehicle brands sales in China has gradually increased from the low recorded in March this year. Overall inventory is now slightly above the 1.50-month threshold, which is reasonable due to the seasonal effect. We expect general inventory to decline starting in July. Inventory level for the JV brands is the lowest of all the sub-segments. In June, the inventory index for imported cars, JVs and local brands was 2.66, 1.63 and 1.72, respectively.
New model launches support future growth. China’s JV brands have much stronger R&D departments and deeper pockets than local brands. They have the tools to closely monitor market trends in order to cater more specifically to customer demands. Most of the mainstream JV brands have committed to launching at least one new volume model in 2H14. Examples include the Hyundai ix25 compact SUV, Buick’s Envision standard SUV, GAC-Toyota’s Levin compact sedan and GAC-Honda’s Vezel compact SUV. In our view, foreign JVs will gain further market share based on their (1) comprehensive model line-ups, (2) ability to quickly ramp up production capacity for hit models, (3) single-model multi-generation variant strategy and (4) more advanced technology used to enhance fuel efficiency and design new energy vehicles.
57%57%57%
60%61%
62%
65%
62%62%
59%60%
57%
62%62%61%
63%63%64%
65%
50%
52%
54%
56%
58%
60%
62%
64%
66%
68%
Jan-
13Fe
b-1
3M
ar-
13A
pr-1
3M
ay-
13Ju
n-13
Jul-1
3A
ug-1
3Se
p-1
3O
ct-1
3N
ov-
13D
ec-
13Ja
n-14
Feb
-14
Ma
r-14
Ap
r-14
Ma
y-14
Jun-
14Ju
l-14
70%71%
72%
73% 73%
75%77%
75%74%
72%71%
69%
77%
79%
76%
78%79% 79%
82%
65%
69%
73%
77%
81%
85%
Jan-
13Fe
b-13
Mar
-13
Ap
r-13
May
-13
Jun-
13Ju
l-13
Aug
-13
Sep
-13
Oct
-13
No
v-13
De
c-13
Jan-
14Fe
b-14
Mar
-14
Ap
r-14
May
-14
Jun-
14Ju
l-14
China Auto Sector 13 August 2014
4
China Dealership Inventory Index by segment
PV Dealership Inventory Index for China
Source: CADA Source: CADA
Strong demand for luxury cars
Sales of China’s top-ten luxury brand vehicles were up about 20% YoY to 850m units in 1H14 according to our estimate, outperforming overall PV unit growth of 11% YoY in the same period. For 2H14F, we expect similar sales growth within the luxury sub-segment in China. Luxury vehicle makers with a strong local presence have consistently outperformed their international peers in terms of unit growth and market share.
Unit sales of top luxury car brands in China (2010-2015F)
Units Audi BMW Mercedes JLR Lexus Volvo Cadillac Porsche 2010 225,588 44% 158,489 84% 147,670 116% 26,114 96% 52,933 53% 30,522 36% 17,366 139% 14,785 71% 2011 309,888 37% 217,068 37% 193,339 31% 42,063 61% 56,303 6% 47,150 54% 30,008 73% 24,340 65% 2012 405,838 31% 303,169 40% 196,211 1% 73,347 74% 64,000 14% 41,898 (11)% 30,010 0% 31,205 28% 2013 491,989 21% 362,100 19% 218,045 11% 95,237 30% 74,000 16% 61,146 46% 50,005 67% 37,425 20% 2014F 565,787 15% 441,762 22% 283,459 30% 128,570 35% 85,100 15% 82,547 35% 75,008 50% 41,916 12% 2015F 650,655 15% 508,026 15% 340,150 20% 154,284 20% 97,865 15% 107,311 30% 93,759 25% 49,461 18% Source: Company data, CAAM data, CCBIS
Luxury JVs remain in the driver’s seat. Besides the mid-end category, we expect China’s luxury vehicle makers to enjoy robust demand based mainly on the country’s growing affluence. FAW-Audi has taken a commanding lead within this category as its popular Q5 posted monthly average unit sales of over 9k for 1H14. To extend its lead, FAW-Audi introduced the Q3 compact SUV which achieved average monthly sales of 5k units for 1H14. FAW-Audi’s aggressive moves are designed to ensure it stays ahead of the luxury SUV market. Its strongest competitors in 2015F, in our view, will be Volvo, Mercedes and Land Rover, given their competitive localized SUV products, namely the XC60/90 from Geely-Volvo, the GLA/GLK from BAIC-Daimler and the Evoque/Freelander from Chery-JLR.
0.0
0.4
0.8
1.2
1.6
2.0
2.4
2.8
3.2
3.6
4.0
Jan-
13
Feb
-13
Ma
r-13
Ap
r-13
Ma
y-13
Jun-
13
Jul-1
3
Aug
-13
Sep
-13
Oct
-13
Nov
-13
Dec
-13
Jan-
14
Feb
-14
Ma
r-14
Ap
r-14
Ma
y-14
Jun-
14
Import JV Self-developed Overall Inventory Index
1.49
2.32
1.53
1.721.88
1.98
1.701.651.501.54
1.33
0.971.10
2.01
1.631.681.581.531.46
1.351.19
1.291.38
1.000.97
2.33
1.381.521.53
1.69
0.0
0.5
1.0
1.5
2.0
2.5
Jan-
12Fe
b-12
Mar
-12
Ap
r-12
May
-12
Jun-
12Ju
l-12
Aug
-12
Sep
-12
Oct
-12
No
v-12
De
c-12
Jan-
13Fe
b-13
Mar
-13
Ap
r-13
May
-13
Jun-
13Ju
l-13
Aug
-13
Sep
-13
Oct
-13
No
v-13
De
c-13
Jan-
14Fe
b-14
Mar
-14
Ap
r-14
May
-14
Jun-
14
China Auto Sector 13 August 2014
5
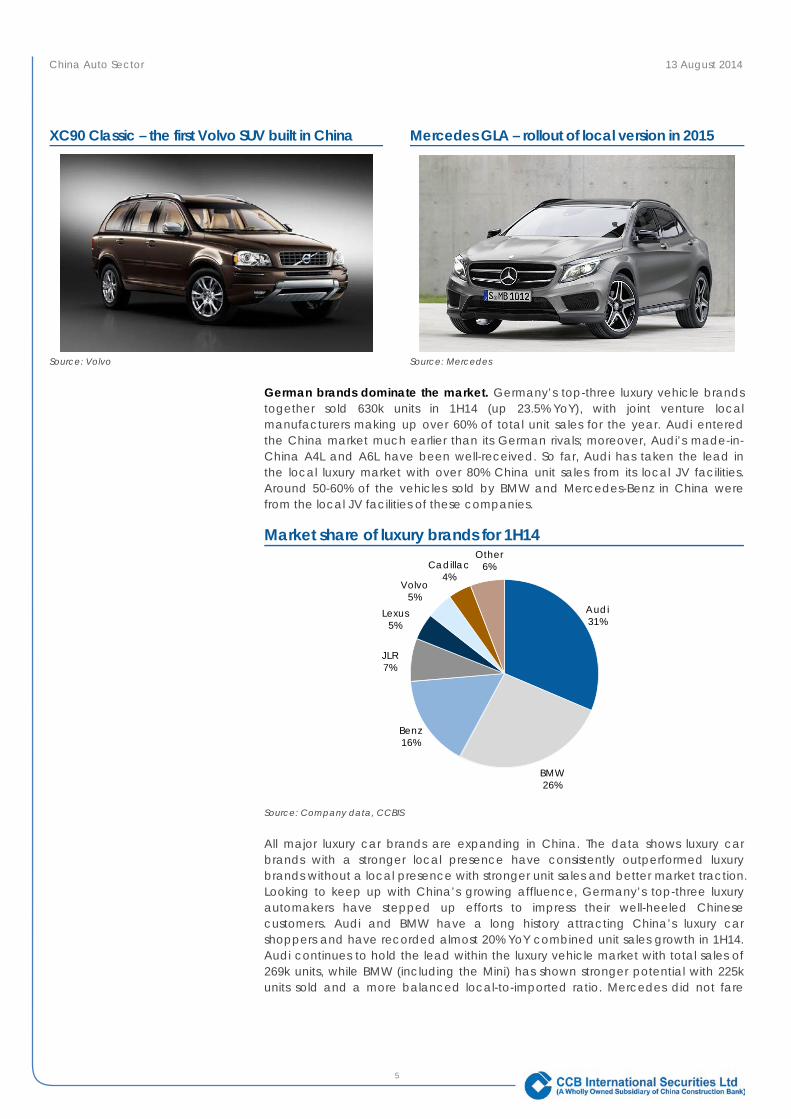
XC90 Classic – the first Volvo SUV built in China Mercedes GLA – rollout of local version in 2015
Source: Volvo Source: Mercedes
German brands dominate the market. Germany’s top-three luxury vehicle brands together sold 630k units in 1H14 (up 23.5% YoY), with joint venture local manufacturers making up over 60% of total unit sales for the year. Audi entered the China market much earlier than its German rivals; moreover, Audi’s made-in-China A4L and A6L have been well-received. So far, Audi has taken the lead in the local luxury market with over 80% China unit sales from its local JV facilities. Around 50-60% of the vehicles sold by BMW and Mercedes-Benz in China were from the local JV facilities of these companies.
Market share of luxury brands for 1H14
Source: Company data, CCBIS
All major luxury car brands are expanding in China. The data shows luxury car brands with a stronger local presence have consistently outperformed luxury brands without a local presence with stronger unit sales and better market traction. Looking to keep up with China’s growing affluence, Germany’s top-three luxury automakers have stepped up efforts to impress their well-heeled Chinese customers. Audi and BMW have a long history attracting China’s luxury car shoppers and have recorded almost 20% YoY combined unit sales growth in 1H14. Audi continues to hold the lead within the luxury vehicle market with total sales of 269k units, while BMW (including the Mini) has shown stronger potential with 225k units sold and a more balanced local-to-imported ratio. Mercedes did not fare
Audi31%
BMW26%
Benz16%
JLR7%
Lexus5%
Volvo5%
Cadillac4%
Other6%
China Auto Sector 13 August 2014
6
quite as well due to local capacity constraints and limited supply for its recently introduced new models. Nevertheless, we are very positive on Mercedes’ 2H14F/2015F outlook since the new generation C-class sedan and two entry-level products are already queued up for local production. Volvo, meanwhile, plans to locally manufacture its best-selling XC60 and XC90 SUVs on top of the made-in-China S60L sedan. In order to take advantage of China’s rising affluence and growing demand, emerging luxury automakers have plans to expand the production capacity of their Chinese JVs.
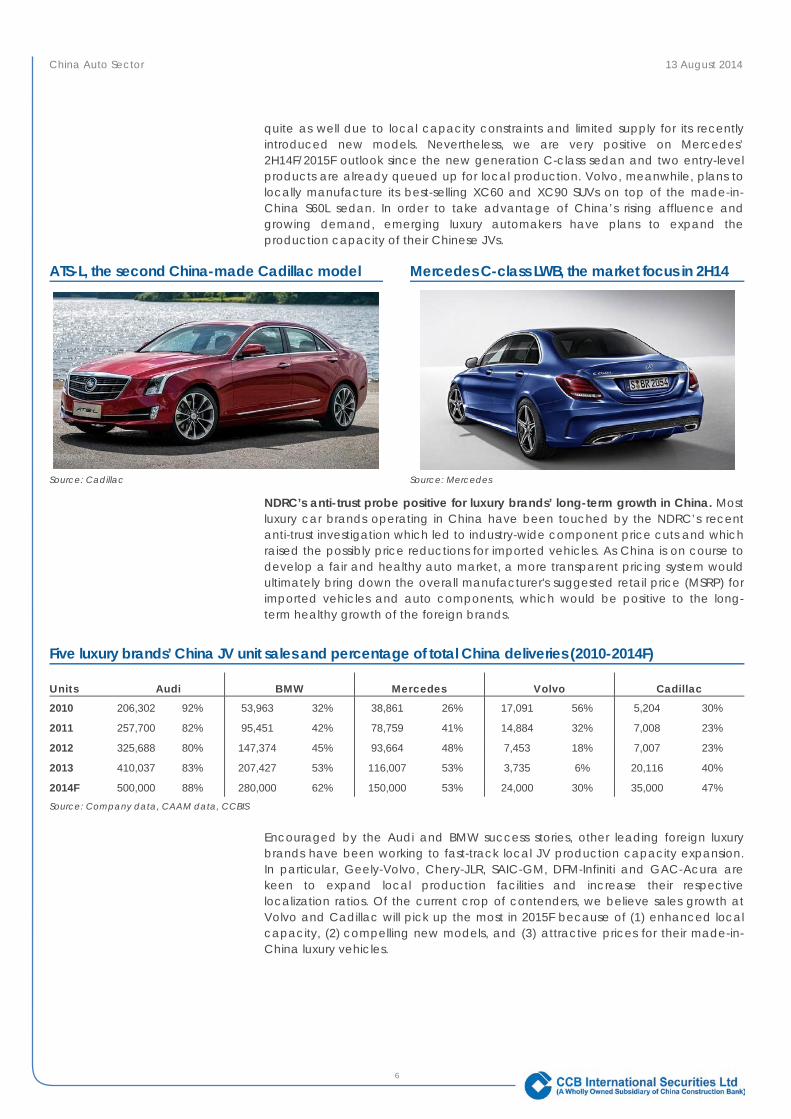
ATS-L, the second China-made Cadillac model Mercedes C-class LWB, the market focus in 2H14
Source: Cadillac Source: Mercedes
NDRC’s anti-trust probe positive for luxury brands’ long-term growth in China. Most luxury car brands operating in China have been touched by the NDRC’s recent anti-trust investigation which led to industry-wide component price cuts and which raised the possibly price reductions for imported vehicles. As China is on course to develop a fair and healthy auto market, a more transparent pricing system would ultimately bring down the overall manufacturer's suggested retail price (MSRP) for imported vehicles and auto components, which would be positive to the long-term healthy growth of the foreign brands.
Five luxury brands’ China JV unit sales and percentage of total China deliveries (2010-2014F)
Units Audi BMW Mercedes Volvo Cadillac
2010 206,302 92% 53,963 32% 38,861 26% 17,091 56% 5,204 30%
2011 257,700 82% 95,451 42% 78,759 41% 14,884 32% 7,008 23%
2012 325,688 80% 147,374 45% 93,664 48% 7,453 18% 7,007 23%
2013 410,037 83% 207,427 53% 116,007 53% 3,735 6% 20,116 40%
2014F 500,000 88% 280,000 62% 150,000 53% 24,000 30% 35,000 47% Source: Company data, CAAM data, CCBIS
Encouraged by the Audi and BMW success stories, other leading foreign luxury brands have been working to fast-track local JV production capacity expansion. In particular, Geely-Volvo, Chery-JLR, SAIC-GM, DFM-Infiniti and GAC-Acura are keen to expand local production facilities and increase their respective localization ratios. Of the current crop of contenders, we believe sales growth at Volvo and Cadillac will pick up the most in 2015F because of (1) enhanced local capacity, (2) compelling new models, and (3) attractive prices for their made-in-China luxury vehicles.
China Auto Sector 13 August 2014
7
SUVs continue to outperform
We expect SUV unit sales to continue to rise and believe the mid-end SUV segment in the RMB150k-300k range will be the market’s cornerstone because of the new model selections on offer and their attractive price points. Chinese consumers prefer SUVs as this category of vehicle combines the high clearance of off-road vehicles with the spaciousness of station wagons. They are the most desired category of PVs in China due to their robust exteriors, safety record and superior off-road capability. Unit sales of SUVs were up 37% in 1H14, and will continue to grow at least 25% in 2H14F. We remain positive on SUV growth for 2H14F/2015F because of (1) the low penetration rate for SUVs in China, (2) promising new SUV models from leading domestic and foreign JV makers, (3) attractive price points with better quality from local JVs and own brands, and (4) comprehensive product lineups catering to different customer demographics.
Leading SUV makers unit sales in China (1H14) Leading vehicle brands unit sales in China (1H14)
Rank Manufacturer 1H14 sales 1H14 YoY (%)
1 GWM 225,300 20.7
2 SAIC-VW 137,000 36.6 3 BAIC-Hyundai 126,200 (4.4)
4 Changan-Ford 105,600 85.7 5 FAW-VW 96,000 59.5
6 DFM-Honda 95,000 11.0
7 DFM-Nissan 89,500 52.8
8 Chery 74,100 59.6
9 FAW-Toyota 72,900 23.8
10 DF-Kia 69,400 8.4
Rank Brands Country of origin 1H14 unit
sales 1H14 YoY
(%)
1 VW Germany 1,390,000 18.5 2 Nissan Japan 620,400 5.0 3 Hyundai Korea 553,000 8.2 4 Toyota Japan 466,000 11.7 5 Buick USA 450,400 12.2 6 Ford USA 398,000 38.8 7 Chevrolet USA 358,000 1.0 8 Honda Japan 353,400 11.6 9 GWM China 347,400 (5.0) 10 PSA France 343,200 23.9
Source: Company data, CCBIS Source: Company data, CCBIS
Mid-end JV brands flexing their muscles. Competition within the SUV space has intensified and slowing new model rollouts from local brands is hurting their monthly sales in 1H14. YTD, only the GWM Haval and Chery Tiggo products made it into the top-ten SUV sellers; the others were all foreign JV brands. The mini-compact SUV segment, with ASPs in the RMB100k-150k range, has become the new battleground for local and JV brands after the foreign JVs’ blanketed the compact SUV space with comprehensive model coverage. In our view, the SUV sub-segment will remain competitive in 2H14F and into 2015F because of increasing numbers of new models coming onto the market and because of variants from the current fleet being developed by joint ventures, notably BAIC-Hyundai’s ix25, GAC-Honda’s Vezel, DFM-Nissan’s new Qashqai, SAIC-Buick’s Envision, DFM-Citroen’s first SUV and the recently launched Peugeot 2008. Revamped models will intensify competition and drive up market anticipation.
China Auto Sector 13 August 2014
8
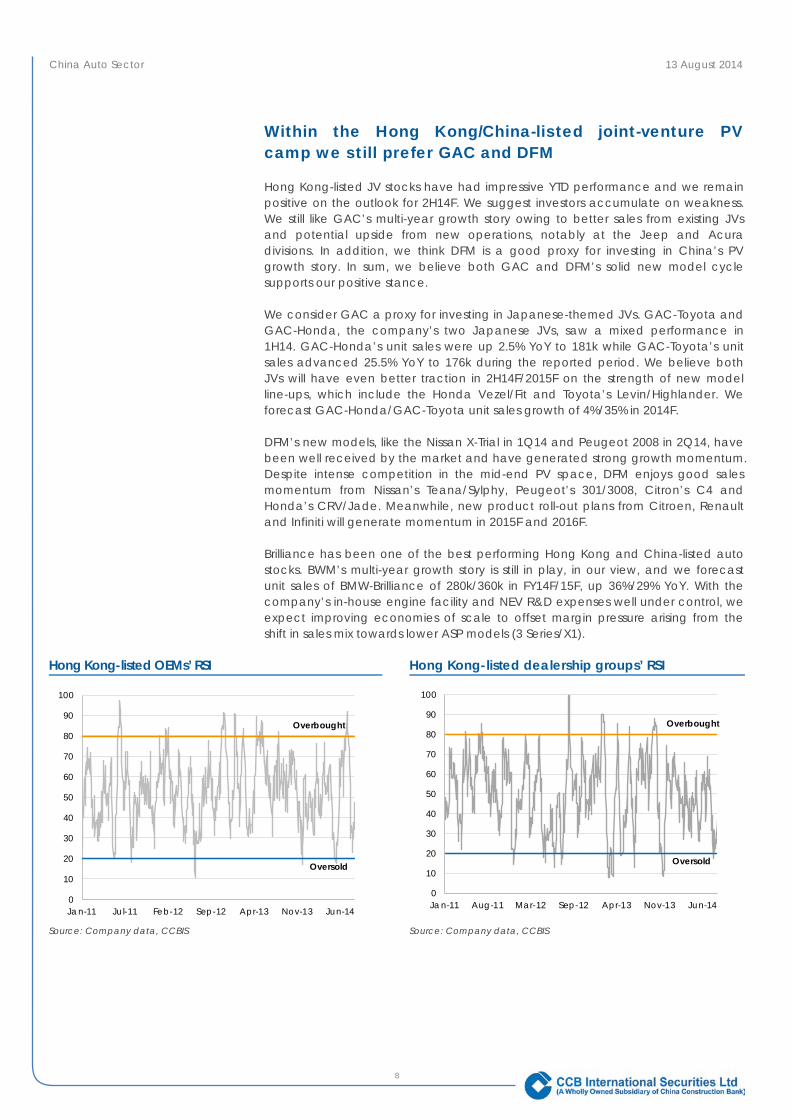
Within the Hong Kong/China-listed joint-venture PV camp we still prefer GAC and DFM
Hong Kong-listed JV stocks have had impressive YTD performance and we remain positive on the outlook for 2H14F. We suggest investors accumulate on weakness. We still like GAC’s multi-year growth story owing to better sales from existing JVs and potential upside from new operations, notably at the Jeep and Acura divisions. In addition, we think DFM is a good proxy for investing in China’s PV growth story. In sum, we believe both GAC and DFM’s solid new model cycle supports our positive stance.
We consider GAC a proxy for investing in Japanese-themed JVs. GAC-Toyota and GAC-Honda, the company’s two Japanese JVs, saw a mixed performance in 1H14. GAC-Honda’s unit sales were up 2.5% YoY to 181k while GAC-Toyota’s unit sales advanced 25.5% YoY to 176k during the reported period. We believe both JVs will have even better traction in 2H14F/2015F on the strength of new model line-ups, which include the Honda Vezel/Fit and Toyota’s Levin/Highlander. We forecast GAC-Honda/GAC-Toyota unit sales growth of 4%/35% in 2014F.
DFM’s new models, like the Nissan X-Trial in 1Q14 and Peugeot 2008 in 2Q14, have been well received by the market and have generated strong growth momentum. Despite intense competition in the mid-end PV space, DFM enjoys good sales momentum from Nissan’s Teana/Sylphy, Peugeot’s 301/3008, Citron’s C4 and Honda’s CRV/Jade. Meanwhile, new product roll-out plans from Citroen, Renault and Infiniti will generate momentum in 2015F and 2016F.
Brilliance has been one of the best performing Hong Kong and China-listed auto stocks. BWM’s multi-year growth story is still in play, in our view, and we forecast unit sales of BMW-Brilliance of 280k/360k in FY14F/15F, up 36%/29% YoY. With the company’s in-house engine facility and NEV R&D expenses well under control, we expect improving economies of scale to offset margin pressure arising from the shift in sales mix towards lower ASP models (3 Series/X1).
Hong Kong-listed OEMs’ RSI Hong Kong-listed dealership groups’ RSI
Source: Company data, CCBIS Source: Company data, CCBIS
Oversold
Overbought
0
10
20
30
40
50
60
70
80
90
100
Jan-11 Jul-11 Feb-12 Sep-12 Apr-13 Nov-13 Jun-14
Oversold
Overbought
0
10
20
30
40
50
60
70
80
90
100
Jan-11 Aug-11 Mar-12 Sep-12 Apr-13 Nov-13 Jun-14
China Auto Sector 13 August 2014
9
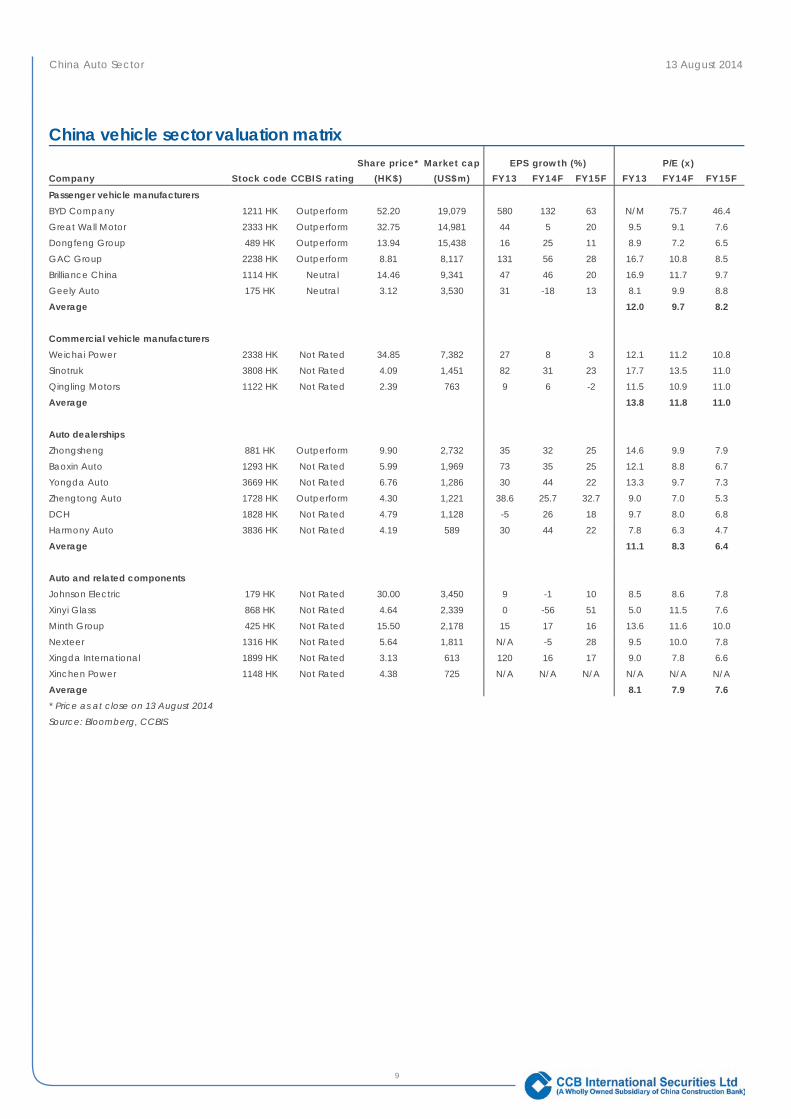
China vehicle sector valuation matrix Share price* Market cap EPS growth (%) P/E (x)
Company Stock code CCBIS rating (HK$) (US$m) FY13 FY14F FY15F FY13 FY14F FY15F
Passenger vehicle manufacturers BYD Company 1211 HK Outperform 52.20 19,079 580 132 63 N/M 75.7 46.4
Great Wall Motor 2333 HK Outperform 32.75 14,981 44 5 20 9.5 9.1 7.6
Dongfeng Group 489 HK Outperform 13.94 15,438 16 25 11 8.9 7.2 6.5
GAC Group 2238 HK Outperform 8.81 8,117 131 56 28 16.7 10.8 8.5
Brilliance China 1114 HK Neutral 14.46 9,341 47 46 20 16.9 11.7 9.7
Geely Auto 175 HK Neutral 3.12 3,530 31 -18 13 8.1 9.9 8.8
Average 12.0 9.7 8.2
Commercial vehicle manufacturers
Weichai Power 2338 HK Not Rated 34.85 7,382 27 8 3 12.1 11.2 10.8
Sinotruk 3808 HK Not Rated 4.09 1,451 82 31 23 17.7 13.5 11.0
Qingling Motors 1122 HK Not Rated 2.39 763 9 6 -2 11.5 10.9 11.0
Average 13.8 11.8 11.0
Auto dealerships
Zhongsheng 881 HK Outperform 9.90 2,732 35 32 25 14.6 9.9 7.9
Baoxin Auto 1293 HK Not Rated 5.99 1,969 73 35 25 12.1 8.8 6.7
Yongda Auto 3669 HK Not Rated 6.76 1,286 30 44 22 13.3 9.7 7.3
Zhengtong Auto 1728 HK Outperform 4.30 1,221 38.6 25.7 32.7 9.0 7.0 5.3
DCH 1828 HK Not Rated 4.79 1,128 -5 26 18 9.7 8.0 6.8
Harmony Auto 3836 HK Not Rated 4.19 589 30 44 22 7.8 6.3 4.7
Average 11.1 8.3 6.4
Auto and related components
Johnson Electric 179 HK Not Rated 30.00 3,450 9 -1 10 8.5 8.6 7.8
Xinyi Glass 868 HK Not Rated 4.64 2,339 0 -56 51 5.0 11.5 7.6
Minth Group 425 HK Not Rated 15.50 2,178 15 17 16 13.6 11.6 10.0
Nexteer 1316 HK Not Rated 5.64 1,811 N/A -5 28 9.5 10.0 7.8
Xingda International 1899 HK Not Rated 3.13 613 120 16 17 9.0 7.8 6.6
Xinchen Power 1148 HK Not Rated 4.38 725 N/A N/A N/A N/A N/A N/A
Average 8.1 7.9 7.6 * Price as at close on 13 August 2014
Source: Bloomberg, CCBIS
Hong Kong / China – Auto
13 August 2014
10
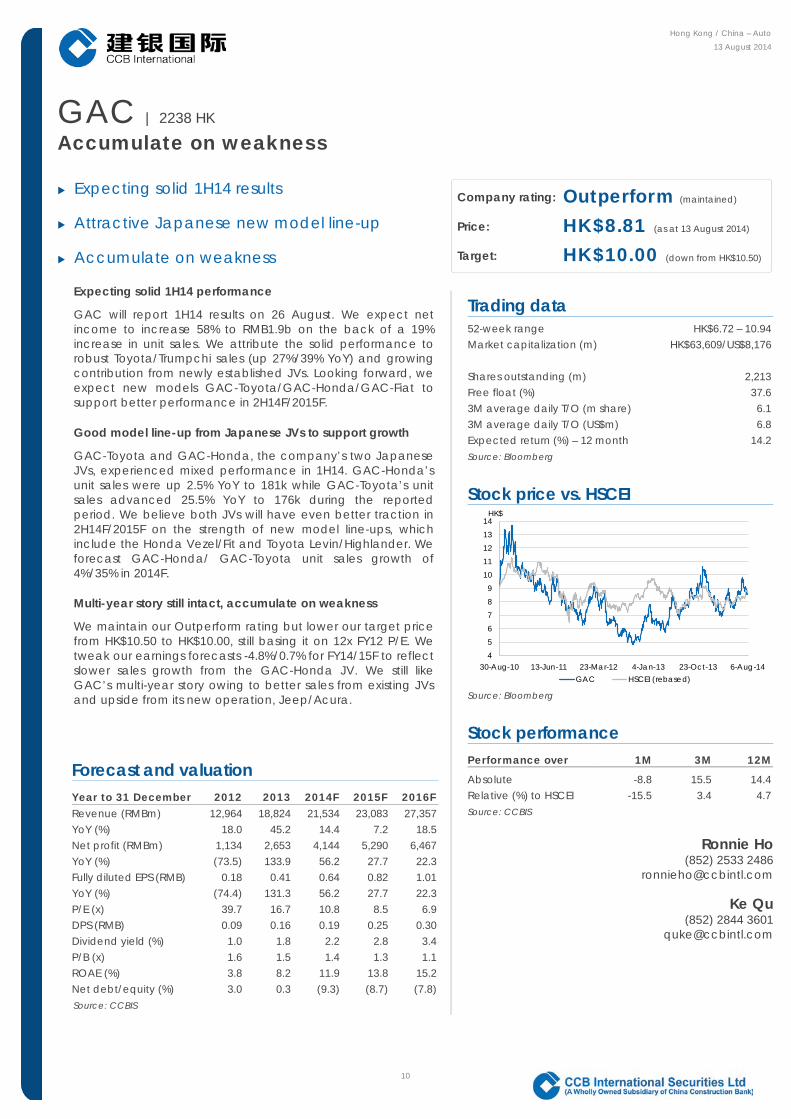
GAC | 2238 HK Accumulate on weakness
Expecting solid 1H14 results
Attractive Japanese new model line-up
Accumulate on weakness
Expecting solid 1H14 performance
GAC will report 1H14 results on 26 August. We expect net income to increase 58% to RMB1.9b on the back of a 19% increase in unit sales. We attribute the solid performance to robust Toyota/Trumpchi sales (up 27%/39% YoY) and growing contribution from newly established JVs. Looking forward, we expect new models GAC-Toyota/GAC-Honda/GAC-Fiat to support better performance in 2H14F/2015F.
Good model line-up from Japanese JVs to support growth
GAC-Toyota and GAC-Honda, the company’s two Japanese JVs, experienced mixed performance in 1H14. GAC-Honda’s unit sales were up 2.5% YoY to 181k while GAC-Toyota’s unit sales advanced 25.5% YoY to 176k during the reported period. We believe both JVs will have even better traction in 2H14F/2015F on the strength of new model line-ups, which include the Honda Vezel/Fit and Toyota Levin/Highlander. We forecast GAC-Honda/ GAC-Toyota unit sales growth of 4%/35% in 2014F.
Multi-year story still intact, accumulate on weakness
We maintain our Outperform rating but lower our target price from HK$10.50 to HK$10.00, still basing it on 12x FY12 P/E. We tweak our earnings forecasts -4.8%/0.7% for FY14/15F to reflect slower sales growth from the GAC-Honda JV. We still like GAC’s multi-year story owing to better sales from existing JVs and upside from its new operation, Jeep/Acura.
Company rating: Outperform (maintained)
Price: HK$8.81 (as at 13 August 2014)
Target: HK$10.00 (down from HK$10.50)
Trading data
52-week range HK$6.72 – 10.94 Market capitalization (m) HK$63,609/US$8,176 Shares outstanding (m) 2,213 Free float (%) 37.6 3M average daily T/O (m share) 6.1 3M average daily T/O (US$m) 6.8 Expected return (%) – 12 month 14.2 Source: Bloomberg
Stock price vs. HSCEI
Source: Bloomberg
Stock performance Performance over 1M 3M 12M
Absolute -8.8 15.5 14.4 Relative (%) to HSCEI -15.5 3.4 4.7 Source: CCBIS
Ronnie Ho (852) 2533 2486
Ke Qu (852) 2844 3601
Forecast and valuation Year to 31 December 2012 2013 2014F 2015F 2016F Revenue (RMBm) 12,964 18,824 21,534 23,083 27,357 YoY (%) 18.0 45.2 14.4 7.2 18.5 Net profit (RMBm) 1,134 2,653 4,144 5,290 6,467 YoY (%) (73.5) 133.9 56.2 27.7 22.3 Fully diluted EPS (RMB) 0.18 0.41 0.64 0.82 1.01 YoY (%) (74.4) 131.3 56.2 27.7 22.3 P/E (x) 39.7 16.7 10.8 8.5 6.9 DPS (RMB) 0.09 0.16 0.19 0.25 0.30 Dividend yield (%) 1.0 1.8 2.2 2.8 3.4 P/B (x) 1.6 1.5 1.4 1.3 1.1 ROAE (%) 3.8 8.2 11.9 13.8 15.2 Net debt/equity (%) 3.0 0.3 (9.3) (8.7) (7.8) Source: CCBIS
456789
1011121314
30-Aug-10 13-Jun-11 23-Mar-12 4-Jan-13 23-Oct-13 6-Aug-14
HK$
GAC HSCEI (rebased)
GAC (2238 HK) 13 August 2014
11
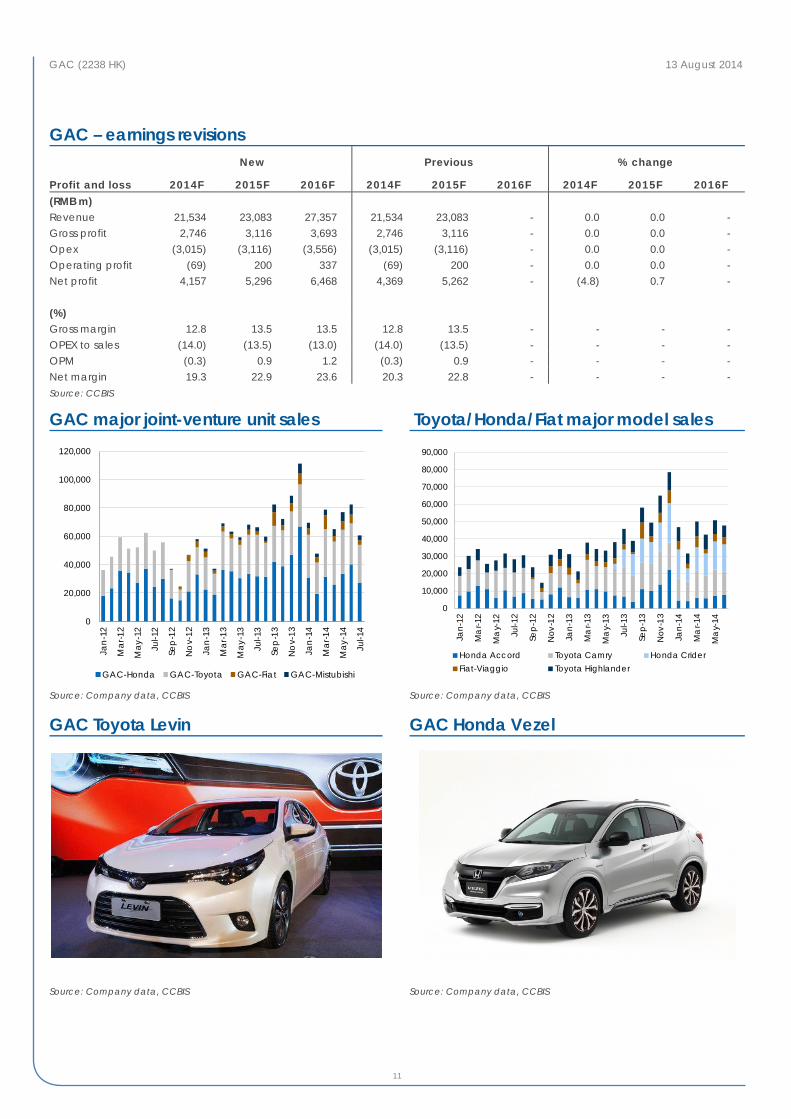
GAC – earnings revisions New Previous % change
Profit and loss 2014F 2015F 2016F 2014F 2015F 2016F 2014F 2015F 2016F (RMB m) Revenue 21,534 23,083 27,357 21,534 23,083 - 0.0 0.0 - Gross profit 2,746 3,116 3,693 2,746 3,116 - 0.0 0.0 - Opex (3,015) (3,116) (3,556) (3,015) (3,116) - 0.0 0.0 - Operating profit (69) 200 337 (69) 200 - 0.0 0.0 - Net profit 4,157 5,296 6,468 4,369 5,262 - (4.8) 0.7 - (%) Gross margin 12.8 13.5 13.5 12.8 13.5 - - - - OPEX to sales (14.0) (13.5) (13.0) (14.0) (13.5) - - - - OPM (0.3) 0.9 1.2 (0.3) 0.9 - - - - Net margin 19.3 22.9 23.6 20.3 22.8 - - - - Source: CCBIS
GAC major joint-venture unit sales Toyota/Honda/Fiat major model sales
Source: Company data, CCBIS Source: Company data, CCBIS
GAC Toyota Levin GAC Honda Vezel
Source: Company data, CCBIS Source: Company data, CCBIS
0
20,000
40,000
60,000
80,000
100,000
120,000
Jan-
12
Mar
-12
May
-12
Jul-1
2
Sep
-12
No
v-12
Jan-
13
Mar
-13
May
-13
Jul-1
3
Sep
-13
No
v-13
Jan-
14
Mar
-14
May
-14
Jul-1
4
GAC-Honda GAC-Toyota GAC-Fiat GAC-Mistubishi
0
10,000
20,000
30,000
40,000
50,000
60,000
70,000
80,000
90,000Ja
n-12
Ma
r-12
Ma
y-12
Jul-1
2
Sep-
12
Nov
-12
Jan-
13
Ma
r-13
Ma
y-13
Jul-1
3
Sep-
13
Nov
-13
Jan-
14
Ma
r-14
Ma
y-14
Honda Accord Toyota Camry Honda CriderFiat-Viaggio Toyota Highlander
GAC (2238 HK) 13 August 2014
12
GAC – income statement FYE 31 December (RMB m) 2012 2013 2014F 2015F 2016F 1H13 2H13 1H14F 2H14F
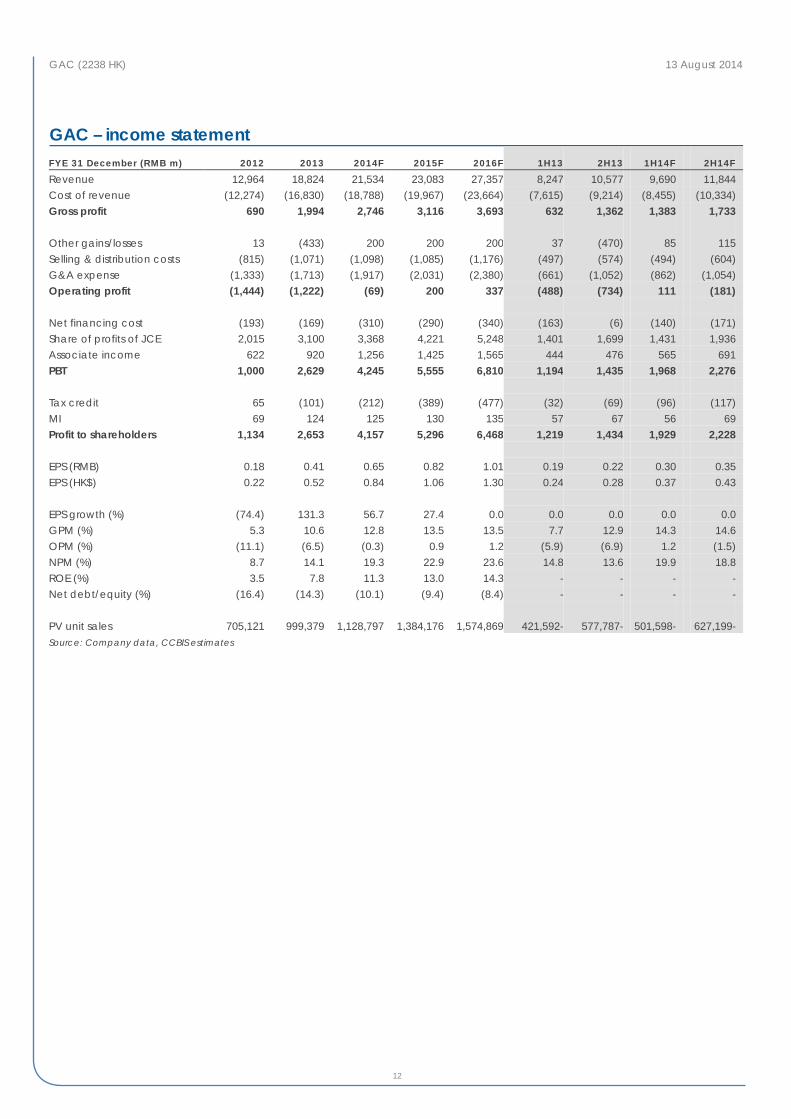
Revenue 12,964 18,824 21,534 23,083 27,357 8,247 10,577 9,690 11,844 Cost of revenue (12,274) (16,830) (18,788) (19,967) (23,664) (7,615) (9,214) (8,455) (10,334) Gross profit 690 1,994 2,746 3,116 3,693 632 1,362 1,383 1,733 Other gains/losses 13 (433) 200 200 200 37 (470) 85 115 Selling & distribution costs (815) (1,071) (1,098) (1,085) (1,176) (497) (574) (494) (604) G&A expense (1,333) (1,713) (1,917) (2,031) (2,380) (661) (1,052) (862) (1,054) Operating profit (1,444) (1,222) (69) 200 337 (488) (734) 111 (181) Net financing cost (193) (169) (310) (290) (340) (163) (6) (140) (171) Share of profits of JCE 2,015 3,100 3,368 4,221 5,248 1,401 1,699 1,431 1,936 Associate income 622 920 1,256 1,425 1,565 444 476 565 691 PBT 1,000 2,629 4,245 5,555 6,810 1,194 1,435 1,968 2,276 Tax credit 65 (101) (212) (389) (477) (32) (69) (96) (117) MI 69 124 125 130 135 57 67 56 69 Profit to shareholders 1,134 2,653 4,157 5,296 6,468 1,219 1,434 1,929 2,228 EPS (RMB) 0.18 0.41 0.65 0.82 1.01 0.19 0.22 0.30 0.35 EPS (HK$) 0.22 0.52 0.84 1.06 1.30 0.24 0.28 0.37 0.43 EPS growth (%) (74.4) 131.3 56.7 27.4 0.0 0.0 0.0 0.0 0.0 GPM (%) 5.3 10.6 12.8 13.5 13.5 7.7 12.9 14.3 14.6 OPM (%) (11.1) (6.5) (0.3) 0.9 1.2 (5.9) (6.9) 1.2 (1.5) NPM (%) 8.7 14.1 19.3 22.9 23.6 14.8 13.6 19.9 18.8 ROE (%) 3.5 7.8 11.3 13.0 14.3 - - - - Net debt/equity (%) (16.4) (14.3) (10.1) (9.4) (8.4) - - - - PV unit sales 705,121 999,379 1,128,797 1,384,176 1,574,869 421,592- 577,787- 501,598- 627,199- Source: Company data, CCBIS estimates
GAC (2238 HK) 13 August 2014
13
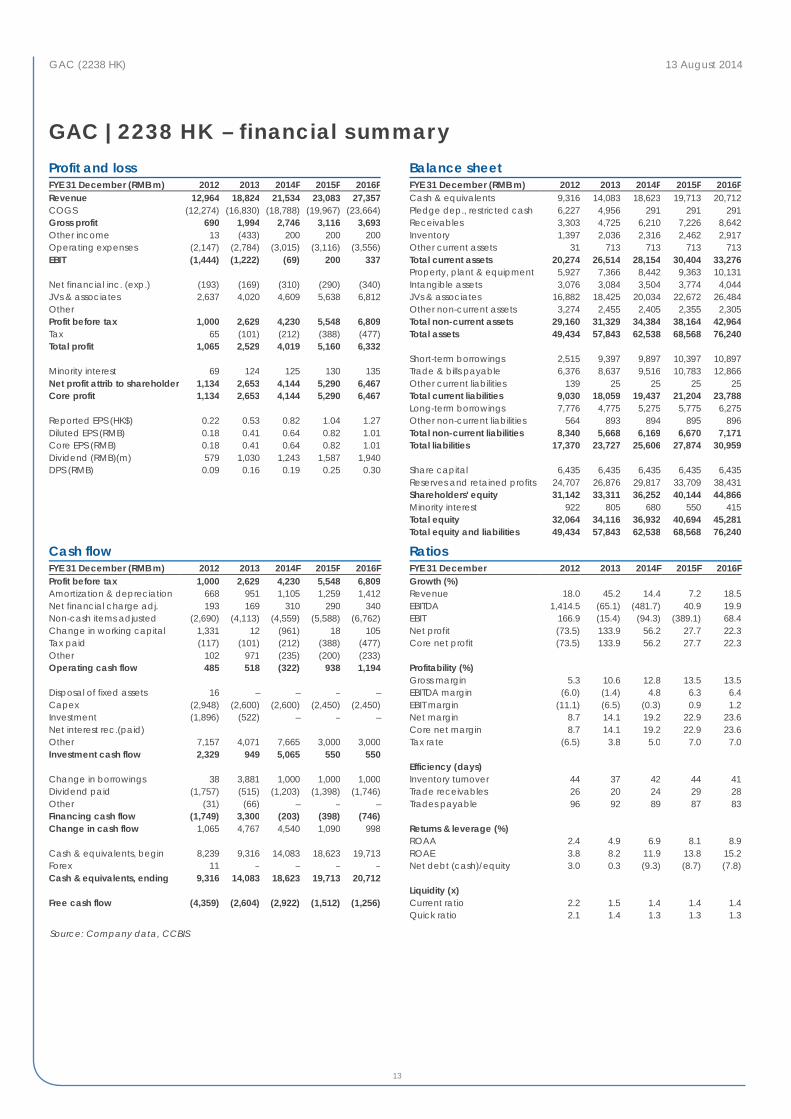
GAC | 2238 HK – financial summary Profit and loss FYE 31 December (RMB m) 2012 2013 2014F 2015F 2016F Revenue 12,964 18,824 21,534 23,083 27,357 COGS (12,274) (16,830) (18,788) (19,967) (23,664) Gross profit 690 1,994 2,746 3,116 3,693 Other income 13 (433) 200 200 200 Operating expenses (2,147) (2,784) (3,015) (3,116) (3,556) EBIT (1,444) (1,222) (69) 200 337 Net financial inc. (exp.) (193) (169) (310) (290) (340) JVs & associates 2,637 4,020 4,609 5,638 6,812 Other Profit before tax 1,000 2,629 4,230 5,548 6,809 Tax 65 (101) (212) (388) (477) Total profit 1,065 2,529 4,019 5,160 6,332 Minority interest 69 124 125 130 135 Net profit attrib to shareholder 1,134 2,653 4,144 5,290 6,467 Core profit 1,134 2,653 4,144 5,290 6,467 Reported EPS (HK$) 0.22 0.53 0.82 1.04 1.27 Diluted EPS (RMB) 0.18 0.41 0.64 0.82 1.01 Core EPS (RMB) 0.18 0.41 0.64 0.82 1.01 Dividend (RMB)(m) 579 1,030 1,243 1,587 1,940 DPS (RMB) 0.09 0.16 0.19 0.25 0.30
Balance sheet FYE 31 December (RMB m) 2012 2013 2014F 2015F 2016F Cash & equivalents 9,316 14,083 18,623 19,713 20,712 Pledge dep., restricted cash 6,227 4,956 291 291 291 Receivables 3,303 4,725 6,210 7,226 8,642 Inventory 1,397 2,036 2,316 2,462 2,917 Other current assets 31 713 713 713 713 Total current assets 20,274 26,514 28,154 30,404 33,276 Property, plant & equipment 5,927 7,366 8,442 9,363 10,131 Intangible assets 3,076 3,084 3,504 3,774 4,044 JVs & associates 16,882 18,425 20,034 22,672 26,484 Other non-current assets 3,274 2,455 2,405 2,355 2,305 Total non-current assets 29,160 31,329 34,384 38,164 42,964 Total assets 49,434 57,843 62,538 68,568 76,240 Short-term borrowings 2,515 9,397 9,897 10,397 10,897 Trade & bills payable 6,376 8,637 9,516 10,783 12,866 Other current liabilities 139 25 25 25 25 Total current liabilities 9,030 18,059 19,437 21,204 23,788 Long-term borrowings 7,776 4,775 5,275 5,775 6,275 Other non-current liabilities 564 893 894 895 896 Total non-current liabilities 8,340 5,668 6,169 6,670 7,171 Total liabilities 17,370 23,727 25,606 27,874 30,959 Share capital 6,435 6,435 6,435 6,435 6,435 Reserves and retained profits 24,707 26,876 29,817 33,709 38,431 Shareholders' equity 31,142 33,311 36,252 40,144 44,866 Minority interest 922 805 680 550 415 Total equity 32,064 34,116 36,932 40,694 45,281 Total equity and liabilities 49,434 57,843 62,538 68,568 76,240
Cash flow FYE 31 December (RMB m) 2012 2013 2014F 2015F 2016F Profit before tax 1,000 2,629 4,230 5,548 6,809 Amortization & depreciation 668 951 1,105 1,259 1,412 Net financial charge adj. 193 169 310 290 340 Non-cash items adjusted (2,690) (4,113) (4,559) (5,588) (6,762) Change in working capital 1,331 12 (961) 18 105 Tax paid (117) (101) (212) (388) (477) Other 102 971 (235) (200) (233) Operating cash flow 485 518 (322) 938 1,194 Disposal of fixed assets 16 – – – – Capex (2,948) (2,600) (2,600) (2,450) (2,450) Investment (1,896) (522) – – – Net interest rec.(paid) Other 7,157 4,071 7,665 3,000 3,000 Investment cash flow 2,329 949 5,065 550 550 Change in borrowings 38 3,881 1,000 1,000 1,000 Dividend paid (1,757) (515) (1,203) (1,398) (1,746) Other (31) (66) – – – Financing cash flow (1,749) 3,300 (203) (398) (746) Change in cash flow 1,065 4,767 4,540 1,090 998 Cash & equivalents, begin 8,239 9,316 14,083 18,623 19,713 Forex 11 – – – – Cash & equivalents, ending 9,316 14,083 18,623 19,713 20,712 Free cash flow (4,359) (2,604) (2,922) (1,512) (1,256)
Ratios FYE 31 December 2012 2013 2014F 2015F 2016F Growth (%) Revenue 18.0 45.2 14.4 7.2 18.5 EBITDA 1,414.5 (65.1) (481.7) 40.9 19.9 EBIT 166.9 (15.4) (94.3) (389.1) 68.4 Net profit (73.5) 133.9 56.2 27.7 22.3 Core net profit (73.5) 133.9 56.2 27.7 22.3 Profitability (%) Gross margin 5.3 10.6 12.8 13.5 13.5 EBITDA margin (6.0) (1.4) 4.8 6.3 6.4 EBIT margin (11.1) (6.5) (0.3) 0.9 1.2 Net margin 8.7 14.1 19.2 22.9 23.6 Core net margin 8.7 14.1 19.2 22.9 23.6 Tax rate (6.5) 3.8 5.0 7.0 7.0 Efficiency (days) Inventory turnover 44 37 42 44 41 Trade receivables 26 20 24 29 28 Trades payable 96 92 89 87 83 Returns & leverage (%) ROAA 2.4 4.9 6.9 8.1 8.9 ROAE 3.8 8.2 11.9 13.8 15.2 Net debt (cash)/equity 3.0 0.3 (9.3) (8.7) (7.8) Liquidity (x) Current ratio 2.2 1.5 1.4 1.4 1.4 Quick ratio 2.1 1.4 1.3 1.3 1.3
Source: Company data, CCBIS
Hong Kong / China – Auto 13 August 2014
14
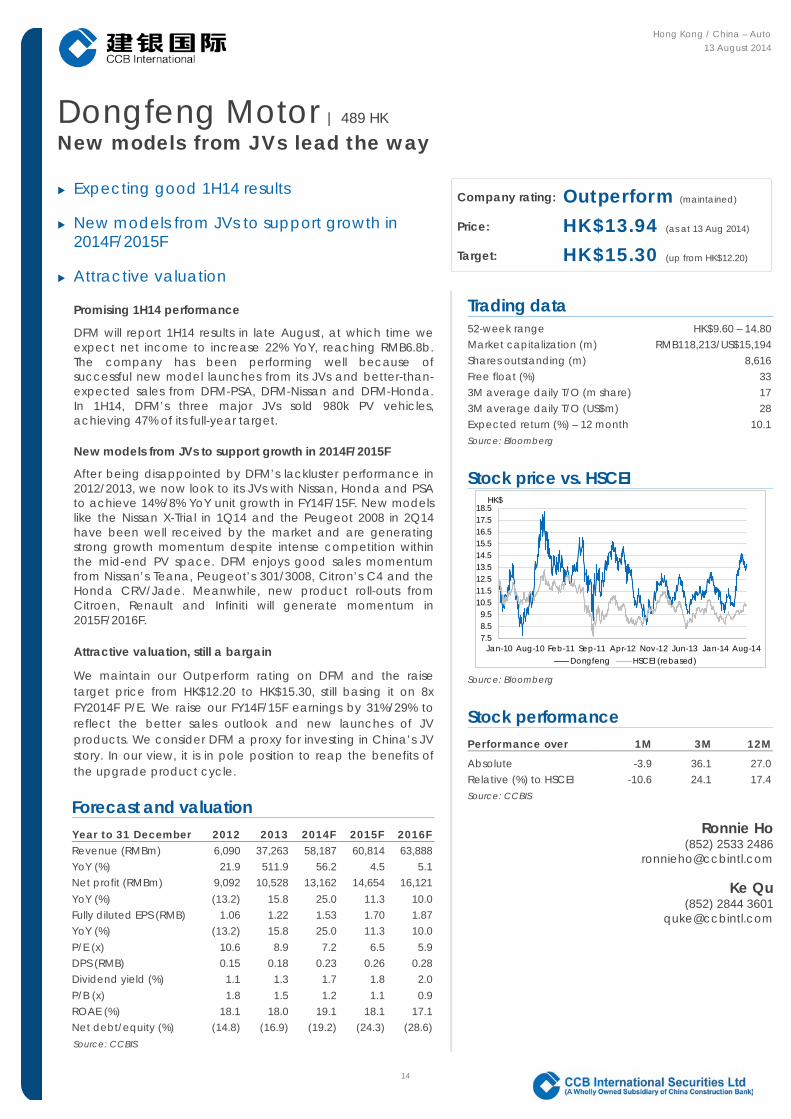
Dongfeng Motor | 489 HK New models from JVs lead the way
Expecting good 1H14 results
New models from JVs to support growth in 2014F/2015F
Attractive valuation
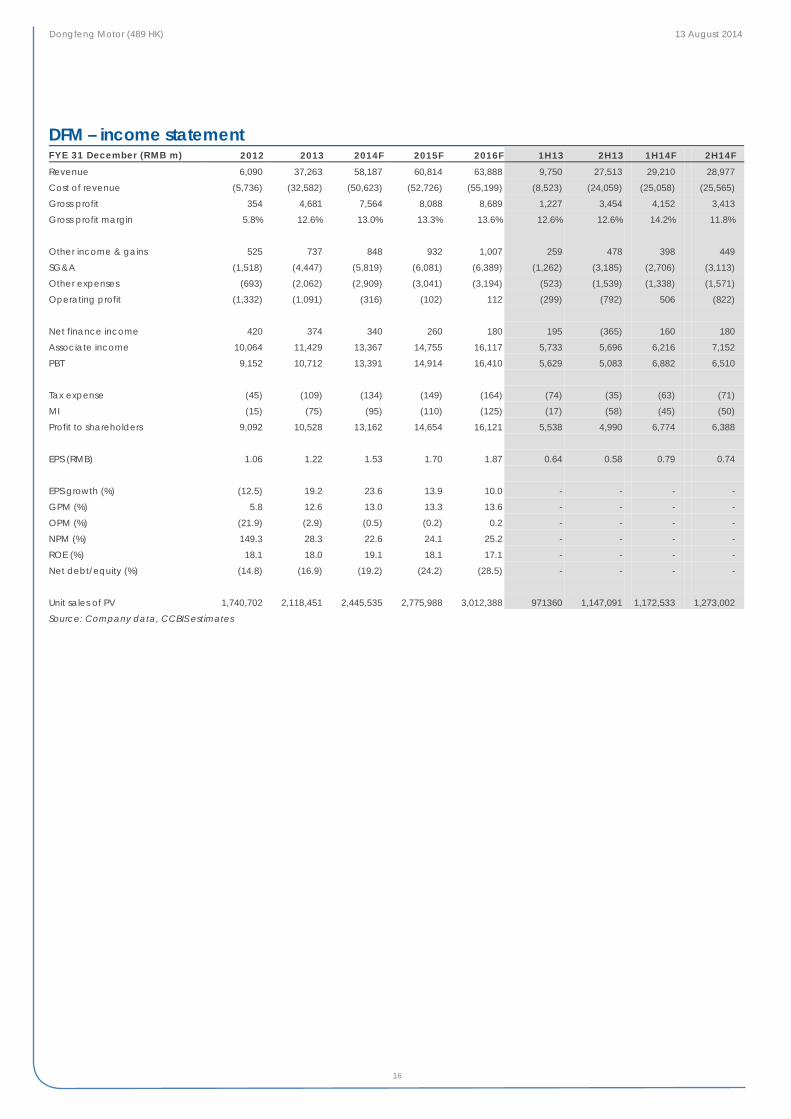
Promising 1H14 performance
DFM will report 1H14 results in late August, at which time we expect net income to increase 22% YoY, reaching RMB6.8b. The company has been performing well because of successful new model launches from its JVs and better-than-expected sales from DFM-PSA, DFM-Nissan and DFM-Honda. In 1H14, DFM’s three major JVs sold 980k PV vehicles, achieving 47% of its full-year target.
New models from JVs to support growth in 2014F/2015F
After being disappointed by DFM’s lackluster performance in 2012/2013, we now look to its JVs with Nissan, Honda and PSA to achieve 14%/8% YoY unit growth in FY14F/15F. New models like the Nissan X-Trial in 1Q14 and the Peugeot 2008 in 2Q14 have been well received by the market and are generating strong growth momentum despite intense competition within the mid-end PV space. DFM enjoys good sales momentum from Nissan’s Teana, Peugeot’s 301/3008, Citron’s C4 and the Honda CRV/Jade. Meanwhile, new product roll-outs from Citroen, Renault and Infiniti will generate momentum in 2015F/2016F.
Attractive valuation, still a bargain
We maintain our Outperform rating on DFM and the raise target price from HK$12.20 to HK$15.30, still basing it on 8x FY2014F P/E. We raise our FY14F/15F earnings by 31%/29% to reflect the better sales outlook and new launches of JV products. We consider DFM a proxy for investing in China’s JV story. In our view, it is in pole position to reap the benefits of the upgrade product cycle.
Company rating: Outperform (maintained)
Price: HK$13.94 (as at 13 Aug 2014)
Target: HK$15.30 (up from HK$12.20)
Trading data
52-week range HK$9.60 – 14.80 Market capitalization (m) RMB118,213/US$15,194 Shares outstanding (m) 8,616 Free float (%) 33 3M average daily T/O (m share) 17 3M average daily T/O (US$m) 28 Expected return (%) – 12 month 10.1 Source: Bloomberg
Stock price vs. HSCEI
Source: Bloomberg
Stock performance Performance over 1M 3M 12M
Absolute -3.9 36.1 27.0 Relative (%) to HSCEI -10.6 24.1 17.4 Source: CCBIS
Ronnie Ho (852) 2533 2486
Ke Qu (852) 2844 3601
Forecast and valuation Year to 31 December 2012 2013 2014F 2015F 2016F Revenue (RMBm) 6,090 37,263 58,187 60,814 63,888 YoY (%) 21.9 511.9 56.2 4.5 5.1 Net profit (RMBm) 9,092 10,528 13,162 14,654 16,121 YoY (%) (13.2) 15.8 25.0 11.3 10.0 Fully diluted EPS (RMB) 1.06 1.22 1.53 1.70 1.87 YoY (%) (13.2) 15.8 25.0 11.3 10.0 P/E (x) 10.6 8.9 7.2 6.5 5.9 DPS (RMB) 0.15 0.18 0.23 0.26 0.28 Dividend yield (%) 1.1 1.3 1.7 1.8 2.0 P/B (x) 1.8 1.5 1.2 1.1 0.9 ROAE (%) 18.1 18.0 19.1 18.1 17.1 Net debt/equity (%) (14.8) (16.9) (19.2) (24.3) (28.6) Source: CCBIS
7.58.59.5
10.511.512.513.514.515.516.517.518.5
Jan-10 Aug-10 Feb-11 Sep-11 Apr-12 Nov-12 Jun-13 Jan-14 Aug-14
HK$
Dongfeng HSCEI (rebased)
Dongfeng Motor (489 HK) 13 August 2014
15
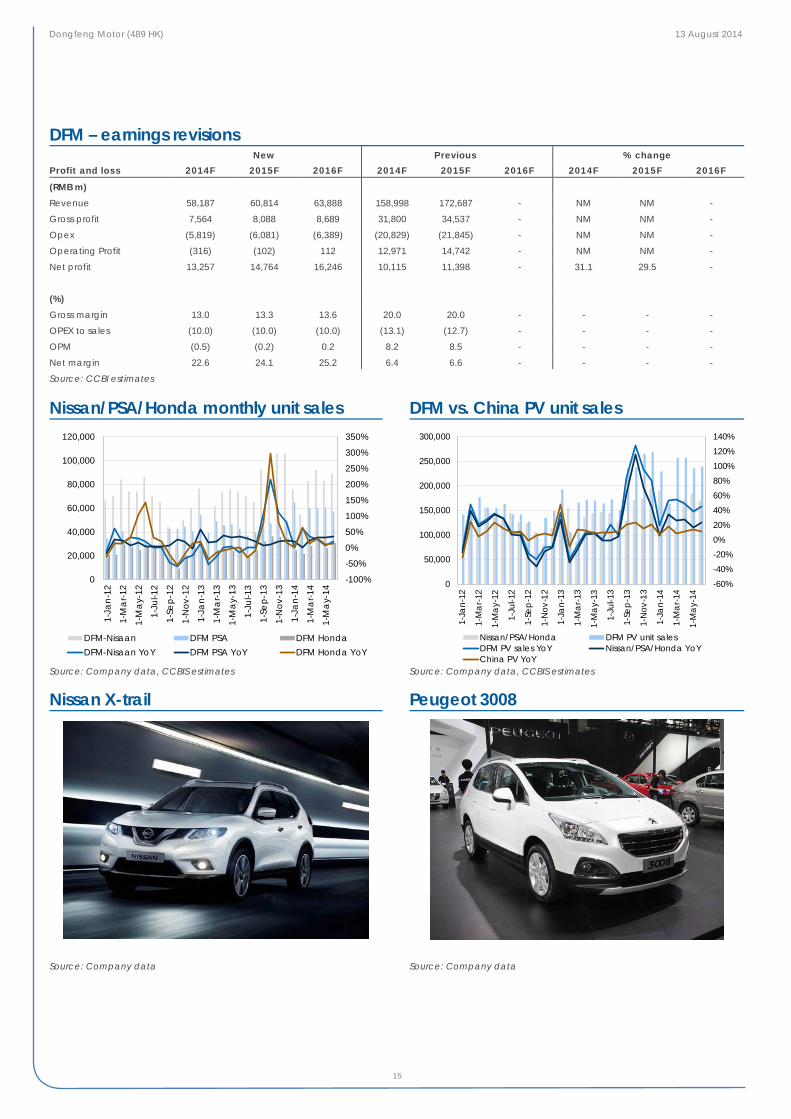
DFM – earnings revisions New Previous % change
Profit and loss 2014F 2015F 2016F 2014F 2015F 2016F 2014F 2015F 2016F
(RMB m)
Revenue 58,187 60,814 63,888 158,998 172,687 - NM NM -
Gross profit 7,564 8,088 8,689 31,800 34,537 - NM NM -
Opex (5,819) (6,081) (6,389) (20,829) (21,845) - NM NM -
Operating Profit (316) (102) 112 12,971 14,742 - NM NM -
Net profit 13,257 14,764 16,246 10,115 11,398 - 31.1 29.5 -
(%)
Gross margin 13.0 13.3 13.6 20.0 20.0 - - - -
OPEX to sales (10.0) (10.0) (10.0) (13.1) (12.7) - - - -
OPM (0.5) (0.2) 0.2 8.2 8.5 - - - -
Net margin 22.6 24.1 25.2 6.4 6.6 - - - -
Source: CCBI estimates
Nissan/PSA/Honda monthly unit sales DFM vs. China PV unit sales
Source: Company data, CCBIS estimates Source: Company data, CCBIS estimates
Nissan X-trail Peugeot 3008
Source: Company data Source: Company data
-100%
-50%
0%
50%
100%
150%
200%
250%
300%
350%
0
20,000
40,000
60,000
80,000
100,000
120,000
1-Ja
n-12
1-M
ar-1
2
1-M
ay-
12
1-Ju
l-12
1-Se
p-12
1-N
ov-1
2
1-Ja
n-13
1-M
ar-1
3
1-M
ay-
13
1-Ju
l-13
1-Se
p-13
1-N
ov-1
3
1-Ja
n-14
1-M
ar-1
4
1-M
ay-
14
DFM-Nisaan DFM PSA DFM HondaDFM-Nisaan YoY DFM PSA YoY DFM Honda YoY
-60%-40%-20%0%20%40%60%80%100%120%140%
0
50,000
100,000
150,000
200,000
250,000
300,000
1-Ja
n-12
1-M
ar-1
2
1-M
ay-1
2
1-Ju
l-12
1-Se
p-12
1-N
ov-1
2
1-Ja
n-13
1-M
ar-1
3
1-M
ay-1
3
1-Ju
l-13
1-Se
p-13
1-N
ov-1
3
1-Ja
n-14
1-M
ar-1
4
1-M
ay-1
4
Nissan/PSA/Honda DFM PV unit salesDFM PV sales YoY Nissan/PSA/Honda YoYChina PV YoY
Dongfeng Motor (489 HK) 13 August 2014
16
DFM – income statement FYE 31 December (RMB m) 2012 2013 2014F 2015F 2016F 1H13 2H13 1H14F 2H14F
Revenue 6,090 37,263 58,187 60,814 63,888 9,750 27,513 29,210 28,977
Cost of revenue (5,736) (32,582) (50,623) (52,726) (55,199) (8,523) (24,059) (25,058) (25,565)
Gross profit 354 4,681 7,564 8,088 8,689 1,227 3,454 4,152 3,413
Gross profit margin 5.8% 12.6% 13.0% 13.3% 13.6% 12.6% 12.6% 14.2% 11.8%
Other income & gains 525 737 848 932 1,007 259 478 398 449
SG&A (1,518) (4,447) (5,819) (6,081) (6,389) (1,262) (3,185) (2,706) (3,113)
Other expenses (693) (2,062) (2,909) (3,041) (3,194) (523) (1,539) (1,338) (1,571)
Operating profit (1,332) (1,091) (316) (102) 112 (299) (792) 506 (822)
Net finance income 420 374 340 260 180 195 (365) 160 180
Associate income 10,064 11,429 13,367 14,755 16,117 5,733 5,696 6,216 7,152
PBT 9,152 10,712 13,391 14,914 16,410 5,629 5,083 6,882 6,510
Tax expense (45) (109) (134) (149) (164) (74) (35) (63) (71)
MI (15) (75) (95) (110) (125) (17) (58) (45) (50)
Profit to shareholders 9,092 10,528 13,162 14,654 16,121 5,538 4,990 6,774 6,388
EPS (RMB) 1.06 1.22 1.53 1.70 1.87 0.64 0.58 0.79 0.74
EPS growth (%) (12.5) 19.2 23.6 13.9 10.0 - - - -
GPM (%) 5.8 12.6 13.0 13.3 13.6 - - - -
OPM (%) (21.9) (2.9) (0.5) (0.2) 0.2 - - - -
NPM (%) 149.3 28.3 22.6 24.1 25.2 - - - -
ROE (%) 18.1 18.0 19.1 18.1 17.1 - - - -
Net debt/equity (%) (14.8) (16.9) (19.2) (24.2) (28.5) - - - -
Unit sales of PV 1,740,702 2,118,451 2,445,535 2,775,988 3,012,388 971360 1,147,091 1,172,533 1,273,002
Source: Company data, CCBIS estimates
Dongfeng Motor (489 HK) 13 August 2014
17
Dongfeng Motor | 489 HK – financial summary Profit and loss FYE 31 December (RMB m) 2012 2013 2014F 2015F 2016F Revenue 6,090 37,263 58,187 60,814 63,888 COGS (5,736) (32,582) (50,623) (52,726) (55,199) Gross profit 354 4,681 7,564 8,088 8,689 Other income 525 737 848 932 1,007 Operating expenses (2,211) (6,509) (8,728) (9,122) (9,583) EBIT (1,332) (1,091) (316) (102) 112 Net financial inc. (exp.) 420 374 340 260 180 JVs & associates 10,064 11,429 13,367 14,755 16,117 Profit before tax 9,152 10,712 13,391 14,914 16,410 Tax (45) (109) (134) (149) (164) Total profit 9,107 10,603 13,257 14,764 16,246 Minority interest (15) (75) (95) (110) (125) Net profit attrib to shareholder 9,092 10,528 13,162 14,654 16,121 Core profit 9,092 10,528 13,162 14,654 16,121 Reported EPS (HK$) 1.31 1.57 1.93 2.15 2.37 Diluted EPS (RMB) 1.06 1.22 1.53 1.70 1.87 Core EPS (RMB) 1.06 1.22 1.53 1.70 1.87 Dividend (RMB)(m) 1,292 1,551 2,005 2,213 2,418 DPS (RMB) 0.15 0.18 0.23 0.26 0.28
Balance sheet FYE 31 December (RMB m) 2012 2013 2014F 2015F 2016F Cash & equivalents 10,288 16,670 21,451 24,371 32,210 Pledge dep., restricted cash 7,760 7,612 7,840 8,076 8,318 Receivables 7,339 25,266 34,814 37,761 41,169 Inventory 1,198 4,245 6,657 6,934 7,259 Other current assets 315 3,829 4,052 4,288 4,538 Total current assets 26,900 57,622 74,815 81,429 93,494 Property, plant & equipment 2,430 9,418 9,380 9,282 9,124 Intangible assets 202 2,432 2,847 3,212 3,527 JVs & associates 32,119 35,903 39,913 44,340 49,175 Other non-current assets 715 10,623 10,978 11,351 11,743 Total non-current assets 35,466 58,376 63,119 68,185 73,569 Total assets 62,366 115,998 137,933 149,614 167,063 Short-term borrowings 2,302 5,875 6,875 2,875 2,875 Trade & bills payable 3,943 34,750 43,877 46,688 49,981 Other current liabilities 2,012 8,064 8,165 8,277 8,400 Total current liabilities 8,257 48,689 58,918 57,840 61,256 Long-term borrowings Other non-current liabilities 106 3,275 3,275 3,275 3,275 Total non-current liabilities 106 3,275 3,275 3,275 3,275 Total liabilities 8,363 51,964 62,193 61,115 64,531 Share capital 8,616 8,616 8,616 8,616 8,616 Reserves and retained profits 45,302 54,519 66,130 78,780 92,687 Shareholders' equity 53,918 63,135 74,746 87,396 101,303 Minority interest 85 899 994 1,104 1,229 Total equity 54,003 64,034 75,740 88,500 102,532 Total equity and liabilities 62,366 115,998 137,933 149,614 167,063
Cash flow FYE 31 December (RMB m) 2012 2013 2014F 2015F 2016F Profit before tax 9,152 10,712 13,391 14,914 16,410 Amortization & depreciation 204 763 873 983 1,093 Net financial charge adjusted (420) (374) (340) (260) (180) Non-cash items adjusted (10,064) (11,429) (13,367) (14,755) (16,117) Change in working capital (2,830) 8,257 1,647 348 409 Tax paid (52) (206) (134) (149) (164) Other 1,254 (17,417) (4,771) (1,055) (1,147) Operating cash flow (2,756) (9,694) (2,701) 25 303 Disposal of fixed assets 27 272 – – – Capex (555) (1,332) (1,605) (1,623) (1,642) Investment (329) 8,341 – – – Net interest rec. (paid) 597 540 510 430 350 Other 5,029 10,161 9,129 10,093 11,040 Investment cash flow 4,769 17,982 8,033 8,900 9,748 Change in borrowings (1,186) 3,573 1,000 (4,000) – Dividend paid (1,551) (1,504) (1,551) (2,005) (2,213) Other (2,039) (3,975) – – – Financing cash flow (4,776) (1,906) (551) (6,005) (2,213) Change in cash flow (2,763) 6,382 4,781 2,920 7,838 Cash & equivalents, begin 13,051 10,288 16,670 21,451 24,371 Forex Cash & equivalents, ending 10,288 16,670 21,451 24,371 32,210 Free cash flow (3,640) (2,685) (4,306) (1,598) (1,338)
Ratios FYE 31 December 2012 2013 2014F 2015F 2016F Growth (%) Revenue 21.9 511.9 56.2 4.5 5.1 EBITDA 6.5 (70.9) (269.8) 58.3 36.8 EBIT 25.8 (18.1) (71.0) (67.9) (210.8) Net profit (13.2) 15.8 25.0 11.3 10.0 Core net profit (13.2) 15.8 25.0 11.3 10.0 Profitability (%) Gross margin 5.8 12.6 13.0 13.3 13.6 EBITDA margin (18.5) (0.9) 1.0 1.4 1.9 EBIT margin (21.9) (2.9) (0.5) (0.2) 0.2 Net margin 149.3 28.3 22.6 24.1 25.2 Core net margin 149.3 28.3 22.6 24.1 25.2 Tax rate 0.5 1.0 1.0 1.0 1.0 Efficiency (days) Inventory turnover 56 30 39 47 47 Trade receivables 131 88 104 117 125 Trades payable 156 154 209 238 247 Returns & leverage (%) ROAA 15.3 11.8 10.4 10.2 10.2 ROAE 18.1 18.0 19.1 18.1 17.1 Net debt (cash)/equity (14.8) (16.9) (19.2) (24.3) (28.6) Liquidity (x) Current ratio 3.3 1.2 1.3 1.4 1.5 Quick ratio 3.1 1.1 1.2 1.3 1.4
Source: Company data, CCBIS estimates
Hong Kong / China – Auto
13 August 2014
18
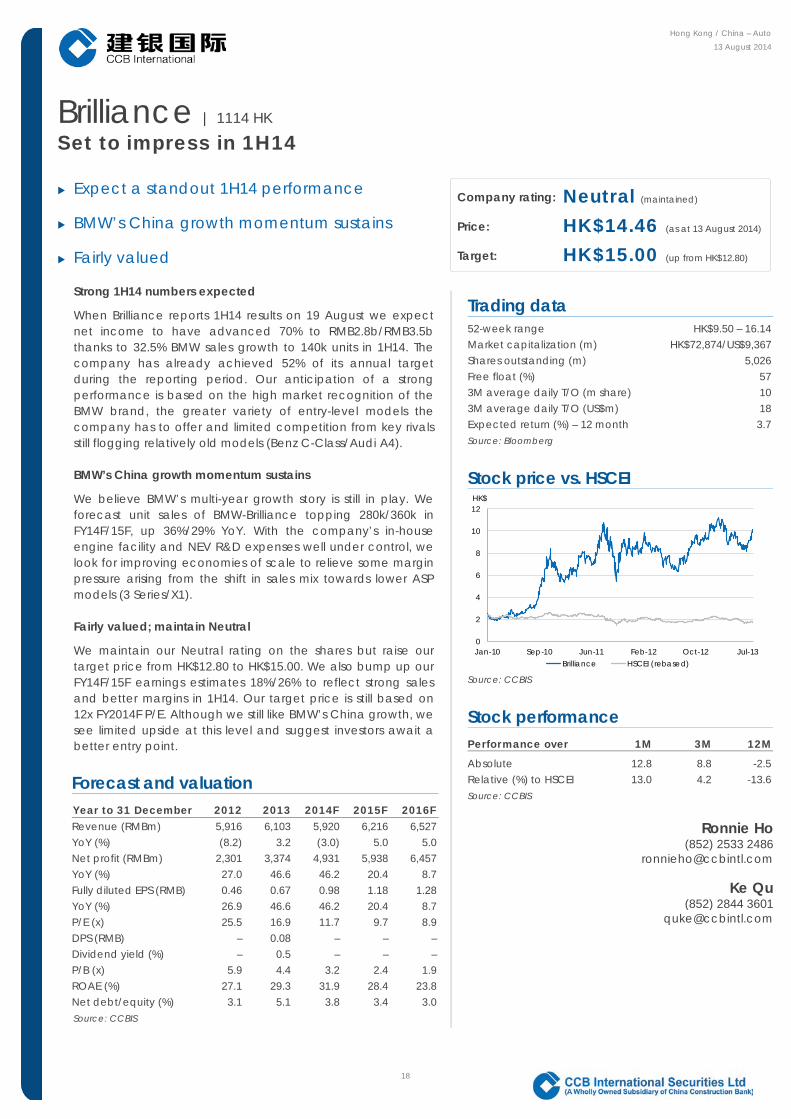
Brilliance | 1114 HK Set to impress in 1H14
Expect a standout 1H14 performance
BMW’s China growth momentum sustains
Fairly valued
Strong 1H14 numbers expected
When Brilliance reports 1H14 results on 19 August we expect net income to have advanced 70% to RMB2.8b/RMB3.5b thanks to 32.5% BMW sales growth to 140k units in 1H14. The company has already achieved 52% of its annual target during the reporting period. Our anticipation of a strong performance is based on the high market recognition of the BMW brand, the greater variety of entry-level models the company has to offer and limited competition from key rivals still flogging relatively old models (Benz C-Class/Audi A4).
BMW’s China growth momentum sustains
We believe BMW’s multi-year growth story is still in play. We forecast unit sales of BMW-Brilliance topping 280k/360k in FY14F/15F, up 36%/29% YoY. With the company’s in-house engine facility and NEV R&D expenses well under control, we look for improving economies of scale to relieve some margin pressure arising from the shift in sales mix towards lower ASP models (3 Series/X1).
Fairly valued; maintain Neutral
We maintain our Neutral rating on the shares but raise our target price from HK$12.80 to HK$15.00. We also bump up our FY14F/15F earnings estimates 18%/26% to reflect strong sales and better margins in 1H14. Our target price is still based on 12x FY2014F P/E. Although we still like BMW’s China growth, we see limited upside at this level and suggest investors await a better entry point.
Company rating: Neutral (maintained)
Price: HK$14.46 (as at 13 August 2014)
Target: HK$15.00 (up from HK$12.80)
Trading data
52-week range HK$9.50 – 16.14 Market capitalization (m) HK$72,874/US$9,367 Shares outstanding (m) 5,026 Free float (%) 57 3M average daily T/O (m share) 10 3M average daily T/O (US$m) 18 Expected return (%) – 12 month 3.7 Source: Bloomberg
Stock price vs. HSCEI
Source: CCBIS
Stock performance Performance over 1M 3M 12M
Absolute 12.8 8.8 -2.5 Relative (%) to HSCEI 13.0 4.2 -13.6 Source: CCBIS
Ronnie Ho (852) 2533 2486
Ke Qu (852) 2844 3601
Forecast and valuation Year to 31 December 2012 2013 2014F 2015F 2016F Revenue (RMBm) 5,916 6,103 5,920 6,216 6,527 YoY (%) (8.2) 3.2 (3.0) 5.0 5.0 Net profit (RMBm) 2,301 3,374 4,931 5,938 6,457 YoY (%) 27.0 46.6 46.2 20.4 8.7 Fully diluted EPS (RMB) 0.46 0.67 0.98 1.18 1.28 YoY (%) 26.9 46.6 46.2 20.4 8.7 P/E (x) 25.5 16.9 11.7 9.7 8.9 DPS (RMB) – 0.08 – – – Dividend yield (%) – 0.5 – – – P/B (x) 5.9 4.4 3.2 2.4 1.9 ROAE (%) 27.1 29.3 31.9 28.4 23.8 Net debt/equity (%) 3.1 5.1 3.8 3.4 3.0 Source: CCBIS
0
2
4
6
8
10
12
Jan-10 Sep-10 Jun-11 Feb-12 Oct-12 Jul-13
HK$
Brilliance HSCEI (rebased)
Brilliance (1114 HK) 13 August 2014
19
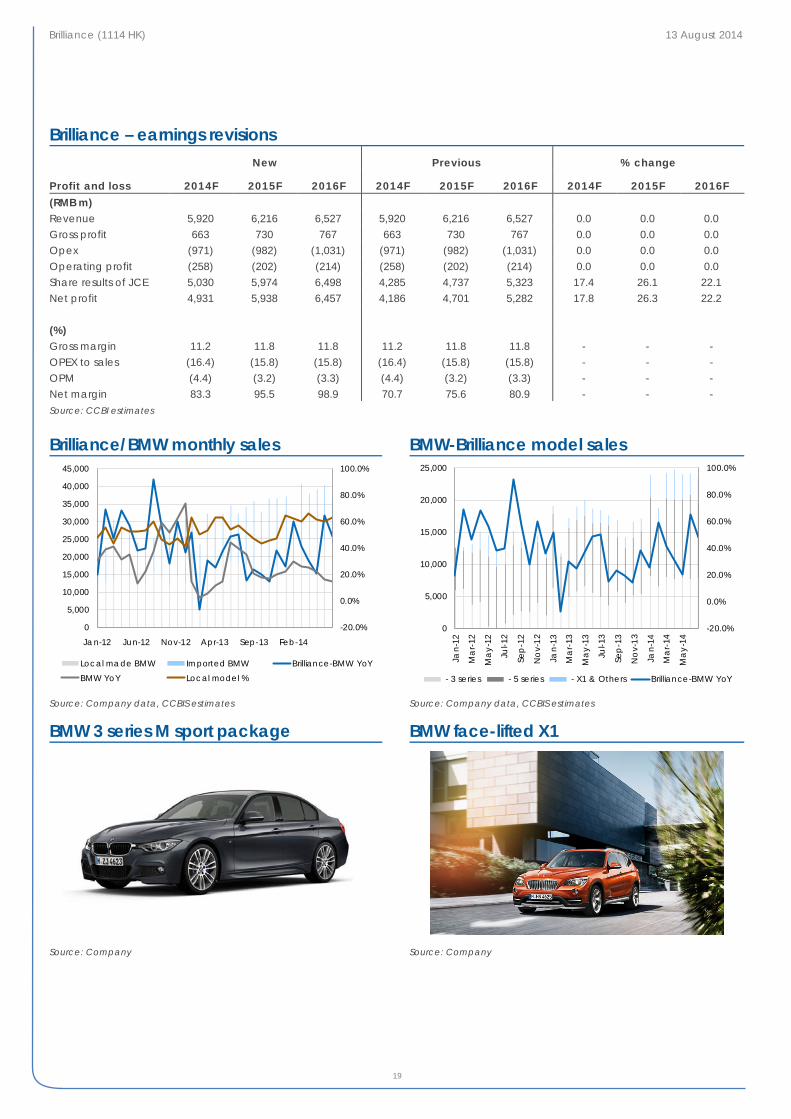
Brilliance – earnings revisions New Previous % change
Profit and loss 2014F 2015F 2016F 2014F 2015F 2016F 2014F 2015F 2016F (RMB m) Revenue 5,920 6,216 6,527 5,920 6,216 6,527 0.0 0.0 0.0 Gross profit 663 730 767 663 730 767 0.0 0.0 0.0 Opex (971) (982) (1,031) (971) (982) (1,031) 0.0 0.0 0.0 Operating profit (258) (202) (214) (258) (202) (214) 0.0 0.0 0.0 Share results of JCE 5,030 5,974 6,498 4,285 4,737 5,323 17.4 26.1 22.1 Net profit 4,931 5,938 6,457 4,186 4,701 5,282 17.8 26.3 22.2 (%) Gross margin 11.2 11.8 11.8 11.2 11.8 11.8 - - - OPEX to sales (16.4) (15.8) (15.8) (16.4) (15.8) (15.8) - - - OPM (4.4) (3.2) (3.3) (4.4) (3.2) (3.3) - - - Net margin 83.3 95.5 98.9 70.7 75.6 80.9 - - - Source: CCBI estimates
Brilliance/BMW monthly sales BMW-Brilliance model sales
Source: Company data, CCBIS estimates Source: Company data, CCBIS estimates
BMW 3 series M sport package BMW face-lifted X1
Source: Company Source: Company
-20.0%
0.0%
20.0%
40.0%
60.0%
80.0%
100.0%
0
5,000
10,000
15,000
20,000
25,000
30,000
35,000
40,000
45,000
Jan-12 Jun-12 Nov-12 Apr-13 Sep-13 Feb-14
Local made BMW Imported BMW Brilliance-BMW YoY
BMW YoY Local model %
-20.0%
0.0%
20.0%
40.0%
60.0%
80.0%
100.0%
0
5,000
10,000
15,000
20,000
25,000Ja
n-12
Ma
r-12
Ma
y-12
Jul-1
2
Sep
-12
No
v-12
Jan-
13
Ma
r-13
Ma
y-13
Jul-1
3
Sep
-13
No
v-13
Jan-
14
Ma
r-14
Ma
y-14
- 3 series - 5 series - X1 & Others Brilliance-BMW YoY
Brilliance (1114 HK) 13 August 2014
20
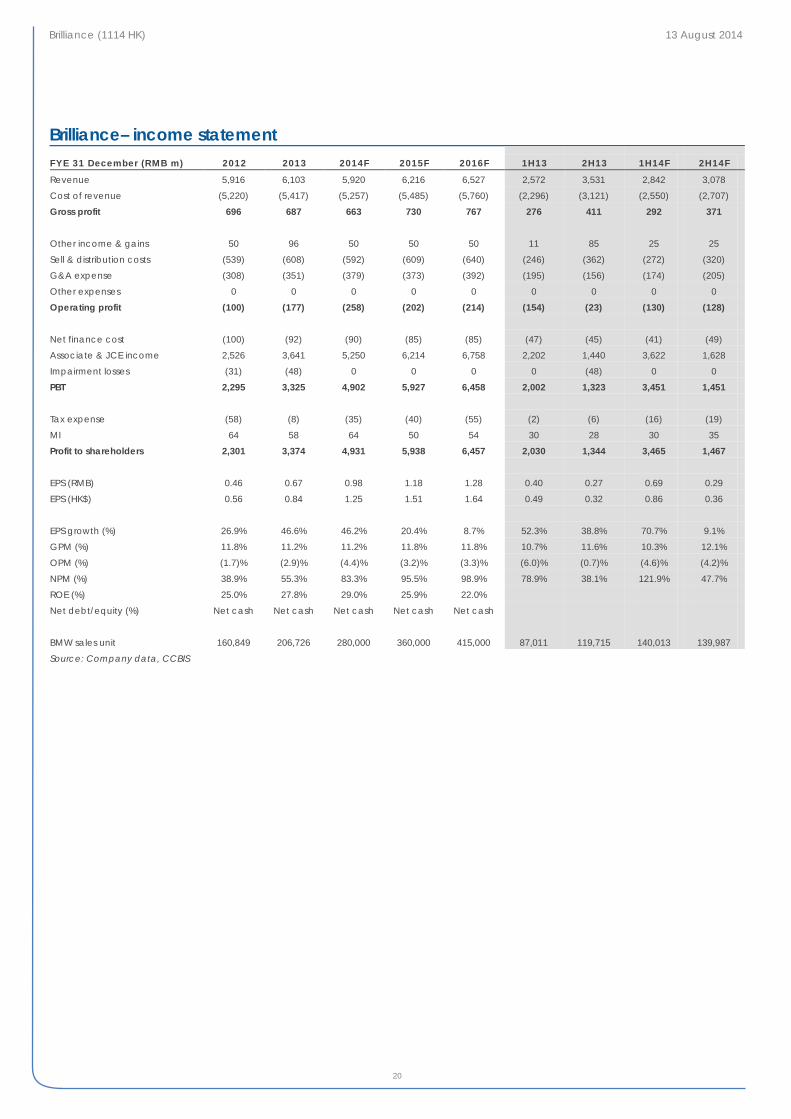
Brilliance– income statement FYE 31 December (RMB m) 2012 2013 2014F 2015F 2016F 1H13 2H13 1H14F 2H14F
Revenue 5,916 6,103 5,920 6,216 6,527 2,572 3,531 2,842 3,078
Cost of revenue (5,220) (5,417) (5,257) (5,485) (5,760) (2,296) (3,121) (2,550) (2,707)
Gross profit 696 687 663 730 767 276 411 292 371
Other income & gains 50 96 50 50 50 11 85 25 25
Sell & distribution costs (539) (608) (592) (609) (640) (246) (362) (272) (320)
G&A expense (308) (351) (379) (373) (392) (195) (156) (174) (205)
Other expenses 0 0 0 0 0 0 0 0 0
Operating profit (100) (177) (258) (202) (214) (154) (23) (130) (128)
Net finance cost (100) (92) (90) (85) (85) (47) (45) (41) (49)
Associate & JCE income 2,526 3,641 5,250 6,214 6,758 2,202 1,440 3,622 1,628
Impairment losses (31) (48) 0 0 0 0 (48) 0 0
PBT 2,295 3,325 4,902 5,927 6,458 2,002 1,323 3,451 1,451
Tax expense (58) (8) (35) (40) (55) (2) (6) (16) (19)
MI 64 58 64 50 54 30 28 30 35
Profit to shareholders 2,301 3,374 4,931 5,938 6,457 2,030 1,344 3,465 1,467
EPS (RMB) 0.46 0.67 0.98 1.18 1.28 0.40 0.27 0.69 0.29
EPS (HK$) 0.56 0.84 1.25 1.51 1.64 0.49 0.32 0.86 0.36
EPS growth (%) 26.9% 46.6% 46.2% 20.4% 8.7% 52.3% 38.8% 70.7% 9.1%
GPM (%) 11.8% 11.2% 11.2% 11.8% 11.8% 10.7% 11.6% 10.3% 12.1%
OPM (%) (1.7)% (2.9)% (4.4)% (3.2)% (3.3)% (6.0)% (0.7)% (4.6)% (4.2)%
NPM (%) 38.9% 55.3% 83.3% 95.5% 98.9% 78.9% 38.1% 121.9% 47.7%
ROE (%) 25.0% 27.8% 29.0% 25.9% 22.0%
Net debt/equity (%) Net cash Net cash Net cash Net cash Net cash
BMW sales unit 160,849 206,726 280,000 360,000 415,000 87,011 119,715 140,013 139,987
Source: Company data, CCBIS
Brilliance (1114 HK) 13 August 2014
21
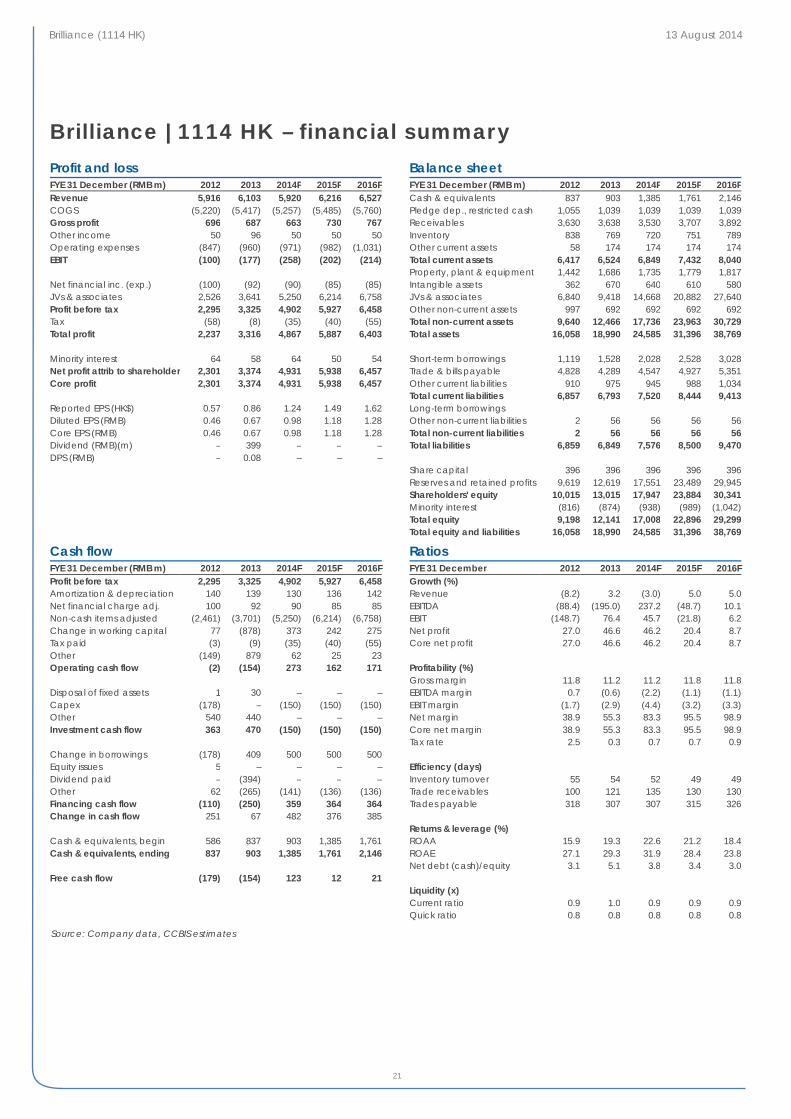
Brilliance | 1114 HK – financial summary Profit and loss FYE 31 December (RMB m) 2012 2013 2014F 2015F 2016F Revenue 5,916 6,103 5,920 6,216 6,527 COGS (5,220) (5,417) (5,257) (5,485) (5,760) Gross profit 696 687 663 730 767 Other income 50 96 50 50 50 Operating expenses (847) (960) (971) (982) (1,031) EBIT (100) (177) (258) (202) (214) Net financial inc. (exp.) (100) (92) (90) (85) (85) JVs & associates 2,526 3,641 5,250 6,214 6,758 Profit before tax 2,295 3,325 4,902 5,927 6,458 Tax (58) (8) (35) (40) (55) Total profit 2,237 3,316 4,867 5,887 6,403 Minority interest 64 58 64 50 54 Net profit attrib to shareholder 2,301 3,374 4,931 5,938 6,457 Core profit 2,301 3,374 4,931 5,938 6,457 Reported EPS (HK$) 0.57 0.86 1.24 1.49 1.62 Diluted EPS (RMB) 0.46 0.67 0.98 1.18 1.28 Core EPS (RMB) 0.46 0.67 0.98 1.18 1.28 Dividend (RMB)(m) – 399 – – – DPS (RMB) – 0.08 – – –
Balance sheet FYE 31 December (RMB m) 2012 2013 2014F 2015F 2016F Cash & equivalents 837 903 1,385 1,761 2,146 Pledge dep., restricted cash 1,055 1,039 1,039 1,039 1,039 Receivables 3,630 3,638 3,530 3,707 3,892 Inventory 838 769 720 751 789 Other current assets 58 174 174 174 174 Total current assets 6,417 6,524 6,849 7,432 8,040 Property, plant & equipment 1,442 1,686 1,735 1,779 1,817 Intangible assets 362 670 640 610 580 JVs & associates 6,840 9,418 14,668 20,882 27,640 Other non-current assets 997 692 692 692 692 Total non-current assets 9,640 12,466 17,736 23,963 30,729 Total assets 16,058 18,990 24,585 31,396 38,769 Short-term borrowings 1,119 1,528 2,028 2,528 3,028 Trade & bills payable 4,828 4,289 4,547 4,927 5,351 Other current liabilities 910 975 945 988 1,034 Total current liabilities 6,857 6,793 7,520 8,444 9,413 Long-term borrowings Other non-current liabilities 2 56 56 56 56 Total non-current liabilities 2 56 56 56 56 Total liabilities 6,859 6,849 7,576 8,500 9,470 Share capital 396 396 396 396 396 Reserves and retained profits 9,619 12,619 17,551 23,489 29,945 Shareholders' equity 10,015 13,015 17,947 23,884 30,341 Minority interest (816) (874) (938) (989) (1,042) Total equity 9,198 12,141 17,008 22,896 29,299 Total equity and liabilities 16,058 18,990 24,585 31,396 38,769
Cash flow FYE 31 December (RMB m) 2012 2013 2014F 2015F 2016F Profit before tax 2,295 3,325 4,902 5,927 6,458 Amortization & depreciation 140 139 130 136 142 Net financial charge adj. 100 92 90 85 85 Non-cash items adjusted (2,461) (3,701) (5,250) (6,214) (6,758) Change in working capital 77 (878) 373 242 275 Tax paid (3) (9) (35) (40) (55) Other (149) 879 62 25 23 Operating cash flow (2) (154) 273 162 171 Disposal of fixed assets 1 30 – – – Capex (178) – (150) (150) (150) Other 540 440 – – – Investment cash flow 363 470 (150) (150) (150) Change in borrowings (178) 409 500 500 500 Equity issues 5 – – – – Dividend paid – (394) – – – Other 62 (265) (141) (136) (136) Financing cash flow (110) (250) 359 364 364 Change in cash flow 251 67 482 376 385 Cash & equivalents, begin 586 837 903 1,385 1,761 Cash & equivalents, ending 837 903 1,385 1,761 2,146 Free cash flow (179) (154) 123 12 21
Ratios FYE 31 December 2012 2013 2014F 2015F 2016F Growth (%) Revenue (8.2) 3.2 (3.0) 5.0 5.0 EBITDA (88.4) (195.0) 237.2 (48.7) 10.1 EBIT (148.7) 76.4 45.7 (21.8) 6.2 Net profit 27.0 46.6 46.2 20.4 8.7 Core net profit 27.0 46.6 46.2 20.4 8.7 Profitability (%) Gross margin 11.8 11.2 11.2 11.8 11.8 EBITDA margin 0.7 (0.6) (2.2) (1.1) (1.1) EBIT margin (1.7) (2.9) (4.4) (3.2) (3.3) Net margin 38.9 55.3 83.3 95.5 98.9 Core net margin 38.9 55.3 83.3 95.5 98.9 Tax rate 2.5 0.3 0.7 0.7 0.9 Efficiency (days) Inventory turnover 55 54 52 49 49 Trade receivables 100 121 135 130 130 Trades payable 318 307 307 315 326 Returns & leverage (%) ROAA 15.9 19.3 22.6 21.2 18.4 ROAE 27.1 29.3 31.9 28.4 23.8 Net debt (cash)/equity 3.1 5.1 3.8 3.4 3.0 Liquidity (x) Current ratio 0.9 1.0 0.9 0.9 0.9 Quick ratio 0.8 0.8 0.8 0.8 0.8
Source: Company data, CCBIS estimates
China Auto Sector 13 August 2014
22
Rating definitions:
Outperform (O) – expected return > 10% over the next twelve months Neutral (N) – expected return between -10% and 10% over the next twelve months Underperform (U) – expected return < -10% over the next twelve months
Analyst certification:
The author(s) of this document, hereby declare that: (i) all of the views expressed in this document accurately reflect his personal views about any and all of the subject securities or issuers and were prepared in an independent manner; and (ii) no part of any of his compensation was, is, or will be directly or indirectly related to the specific recommendations or views expressed in this document; and (iii) he receives no insider information/non-public price-sensitive information in relation to the subject securities or issuers which may influence the recommendations made by him. The author(s) of this document further confirm that (i) neither he nor his respective associate(s) (as defined in the Code of Conduct for Persons Licensed by or Registered with the Securities and Futures Commission issued by the Hong Kong Securities and Futures Commission) has dealt in or traded in the securities covered in this document within 30 calendar days prior to the date of issue of this document or will so deal in or trade such securities within 3 business days (as defined in the Securities and Futures Ordinance (Chapter 571 of the Laws of Hong Kong) after the date of issue of this document; (ii) neither he nor his respective associate(s) serves as an officer of any of the companies covered in this document; and (iii) neither he nor his respective associate(s) has any financial interests in the securities covered in this document.
Disclaimers:
This document is prepared by CCB International Securities Limited. CCB International Securities Limited is a wholly-owned subsidiary of CCB International (Holdings) Limited (“CCBIH”) and China Construction Bank Corporation (“CCB”). Information herein has been obtained from sources believed to be reliable but CCB International Securities Limited, its affiliates and/or subsidiaries (collectively “CCBIS”) do not guarantee, represent and warrant (either express or implied) its completeness or accuracy or appropriateness for any purpose or any person whatsoever. Opinions and estimates constitute our judgment as of the date of this document and are subject to change without notice. CCBIS seeks to update its research as appropriate, but various regulations may prevent it from doing so. Besides certain industry reports published on a periodic basis, the large majority of reports are published at irregular intervals as appropriate according to the analyst's judgment. Forecasts, projections and valuations are inherently speculative in nature and may be based on a number of contingencies. Readers should not regard the inclusion of any forecasts, projections and valuations in this document as a representation or warranty by or on behalf of CCBIS that these forecasts, projections or valuations or their underlying assumptions will be achieved. Investment involves risk and past performance is not indicative of future results. Information in this document is not intended to constitute or be construed as legal, financial, accounting, business, investment, tax or any professional advice for any prospective investors and should not be relied upon in that regard. This document is for informational purposes only and should not be treated as an offer or solicitation for the purchase or sale of any products, investments, securities, trading strategies or financial instruments of any kind in any jurisdiction. CCBIS makes no representations on the availability of the securities covered in this document (or related investment) to the recipients. The securities described herein may not be eligible for sale in all jurisdictions or to certain categories of investors. Neither CCBIS nor any other persons accept any liability whatsoever for any loss or damages (whether direct, indirect, incidental, exemplary, compensatory, punitive, special or consequential) arising from any use of this document or its contents or otherwise arising in connection therewith. Securities, financial instruments or strategies mentioned herein may not be suitable for all investors. The opinions and recommendations herein do not take into account prospective investors’ financial circumstances, investment objectives, or particular needs and are not intended as recommendations of particular securities, financial instruments or strategies to any prospective investors. The recipients of this document should consider this document as only a single factor in marking their investment decision and shall be solely responsible for making their own independent investigation of the business, financial condition and prospects of companies referred to in this document. Readers are cautioned that (i) the price and value of securities referred to in this document and the income derived from them may fluctuate; (ii) past performance is not a guide to future performance; (iii) any analysis, ratings and recommendations made in this document are intended for long-term (at least for 12 months) and is not linked to a near-term assessment of the likely performance of the securities or companies in question. In any event, future actual results may differ materially from those set forth in any forward-looking statements herein; (iv) future returns are not guaranteed, and a loss of original capital may occur; and (v) fluctuations in exchange rates may adversely affect the value, price or income of any security or related instrument referred to in this document. It should be noted that this document covers only those securities or companies as specified herein and does not extend to any derivative instruments thereof, the value of which may be affected by many factors and may not correspond with the value of the underlying securities. Trading in these instruments is considered risky and are not suitable for all investors. While all reasonable care has been taken to ensure that the facts stated herein are accurate and that the forward-looking statements, opinions and expectations contained herein are based on fair and reasonable assumptions, CCBIS has not been able to verify independently such facts or assumptions and CCBIS shall not be liable for the accuracy, completeness or correctness thereof and no representation or warranty is made, express or implied, in this regard. All pricing referred to in this document is as of the close of local market for the securities discussed, unless otherwise stated and for information purposes only. There is no representation that any transaction can or could have been effected at those prices, and any prices do not necessarily reflect CCBIS’ internal books and records or theoretical model-based valuations and may be based on certain assumptions. Different assumptions could result in substantially different results. Any statements which may be contained herein attributed to a third- party represent CCBIS’ interpretation of the data, information and/or opinions provided by that third party either publicly or through a subscription service, and such use and interpretation have not been reviewed or endorsed by the third party. Reproduction and distribution of these third party contents in any form is prohibited except with the prior written consent of such third party. The recipients must make their own assessments of the relevance, accuracy and adequacy of the information contained in this document and
China Auto Sector 13 August 2014
23
make such independent investigation as they may consider necessary or appropriate for such purpose.
Recipients should seek independent legal, financial, accounting, business, investment and/or tax advice if they have any doubt about the contents of this document and satisfy themselves prior to making any investment decision that such investment is in line with their own investment objectives and horizons.
Use of hyperlinks to other internet sites or resources (if any) as referred to in this document is at users’ own risk. They are provided solely for the purpose of convenience and information and the content of these internet sites or resources does not in any way form part of this document. The contents, accuracy, opinion expressed, and other links provided at these sites are not investigated, verified, monitored, or endorsed by CCBIS. CCBIS expressly disclaims any responsibility for and does not guarantee, represent and warrant (either express or implied) the completeness, accuracy, appropriateness, availability or security of information found on these websites. Users of these websites are solely responsible for making all enquiries, investigation and risk assessment before proceeding with any online or offline access or transaction with any of these third parties. All activities conducted by users via or at these websites are at their own risk. CCBIS does not guarantee the security of any information users may forward or be requested to provide to any third parties via these websites. Users are deemed to have irrevocably waived any claims against CCBIS for any loss or damage suffered as a result of any access to or interaction with any of these websites.
Upon request CCBIS may provide specialized research products or services to certain customers focusing on the prospects for specific securities as compared with other covered securities over varying time horizons or under differing market conditions. While the views expressed in these situations may not always be directionally consistent with the long-term views expressed in the analyst's published research, CCBIS has procedures in place to prevent selective disclosure and will update the relevant readers when our views has changed. CCBIS also has procedures in place to identify and manage potential conflicts of interest that may arise in connection with its research business and services. Chinese Wall procedures are also in place to ensure that any confidential and/or price sensitive information is properly handled. CCBIS will use its best endeavors to comply with the relevant laws and regulations in this respect. Nevertheless, the recipients should be aware that CCB, CCBIS, their affiliates and/or their officers, directors and employees may do business with the issuer(s) of the securities covered in this document, including investment banking business or direct investment business or may hold interest in (and/or later add or dispose) such securities (or in any related investment) for themselves and/or on behalf of their clients from time to time. As a result, investors should be aware that CCBIS may have a conflict of interest that could affect the objectivity of this document and CCBIS will not assume any responsibility in respect thereof. Further, the information contained herein may differ or be contrary to opinions expressed by other associates of CCBIS or other members of the CCB or CCBIH group of companies.
This document is for the information of the institutional and professional customers of CCBIS only and should not be distributed to retail customers. This document is not directed at you if CCBIS is prohibited or restricted by any legislation or regulation in any jurisdiction from making it available to you. You should satisfy yourself before reading it that CCBIS is permitted to provide research material concerning investments to you and that you are permitted and entitled to receive and read the document under relevant legislation and regulations. In particular, this document is only distributed to certain US Persons to whom CCBIS is permitted to distribute according to US securities laws, but cannot otherwise be distributed or transmitted, whether directly or indirectly, into the US or to any other US person. This document also cannot be distributed or transmitted, whether directly or indirectly, into Japan and Canada and not to the general public in the People’s Republic of China (for the purpose of this document, excluding Hong Kong, Macau and Taiwan) unless under applicable laws.
Any unauthorized reproduction or redistribution by any means to any persons, in whole or in part of this document is strictly prohibited and CCBIS accepts no liability whatsoever for the actions of third parties in distributing this research report.
If this document has been distributed by electronic transmission, such as e-mail, then such transmission cannot be guaranteed to be secure or error-free as information could be intercepted, corrupted, lost, destroyed, arrive late or incomplete, or contain viruses. CCBIS therefore does not accept liability for any errors or omissions in the contents of this document, which may arise as a result of electronic transmission.
The disclosures contained in this document prepared by CCBIS shall be governed by and construed in accordance with the laws of Hong Kong.
Copyright 2014 CCBIS. The signs, logos and insignia used in this research report and the company name “CCB International Securities Limited” are the registered and unregistered trademarks of CCB, CCBIH and/or CCBIS. All rights are hereby reserved. All material presented in this document, unless indicated otherwise, is under copyright to CCBIS. This document or any portion hereof may not be reproduced, sold or redistributed without the written consent of CCBIS.
CCB International Securities Limited 12/F, CCB Tower, 3 Connaught Road, Central, Hong Kong Tel: (852) 2532 6100/Fax: (852) 2537 0097