Embed Size (px)
Citation preview
China and India in the Global
EconomyDevelopment Strategies, Economic Reforms and Responses to the
Global Economic Crisis and Recession
T.N. Srinivasan
Samuel C. Park Jr. Professor of Economics, Yale University
and Visiting Professor, Stanford Center of International
Development, Stanford University
Conference on Institutions and Economic Development, China Center for Economic Studies, Fudan University, Economic Growth Center, Yale University 11-12, August 2009, Shanghai, China
2
Overview
Introduction
Development Strategies: China (1949-1978), India (1947 –
mid 1980’s)
Reform era: China (1978 on), India (Mid 80’s on)
Economic Performance, Pre and Post Reform
Global Economic Crisis: Impact on and Responses of China
and India
Future Prospects
Conclusions
3
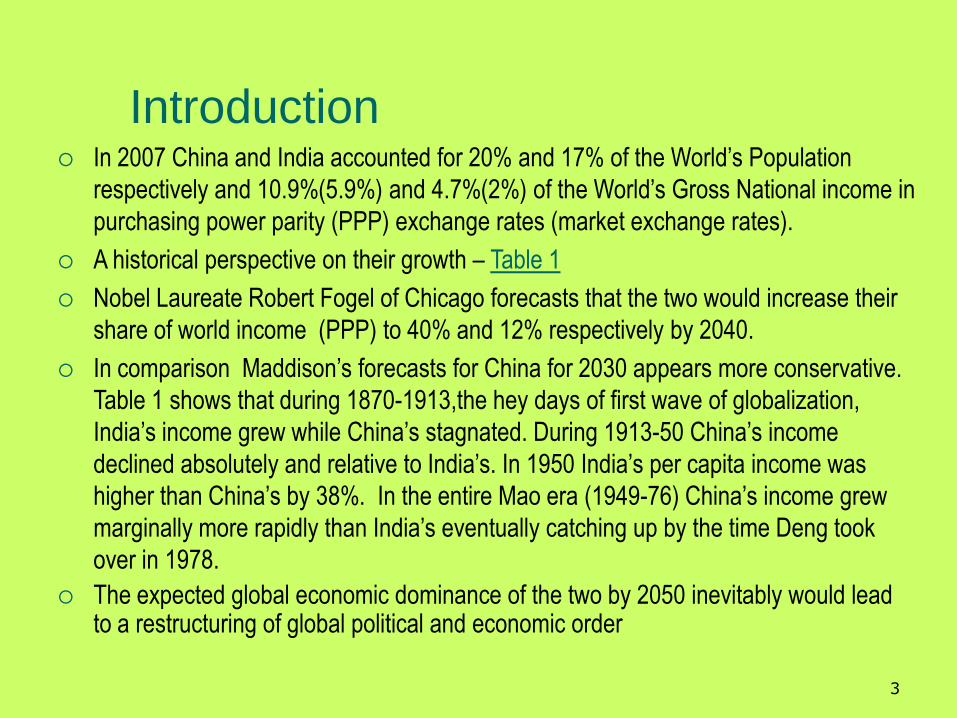
In 2007 China and India accounted for 20% and 17% of the World’s Population
respectively and 10.9%(5.9%) and 4.7%(2%) of the World’s Gross National income in
purchasing power parity (PPP) exchange rates (market exchange rates).
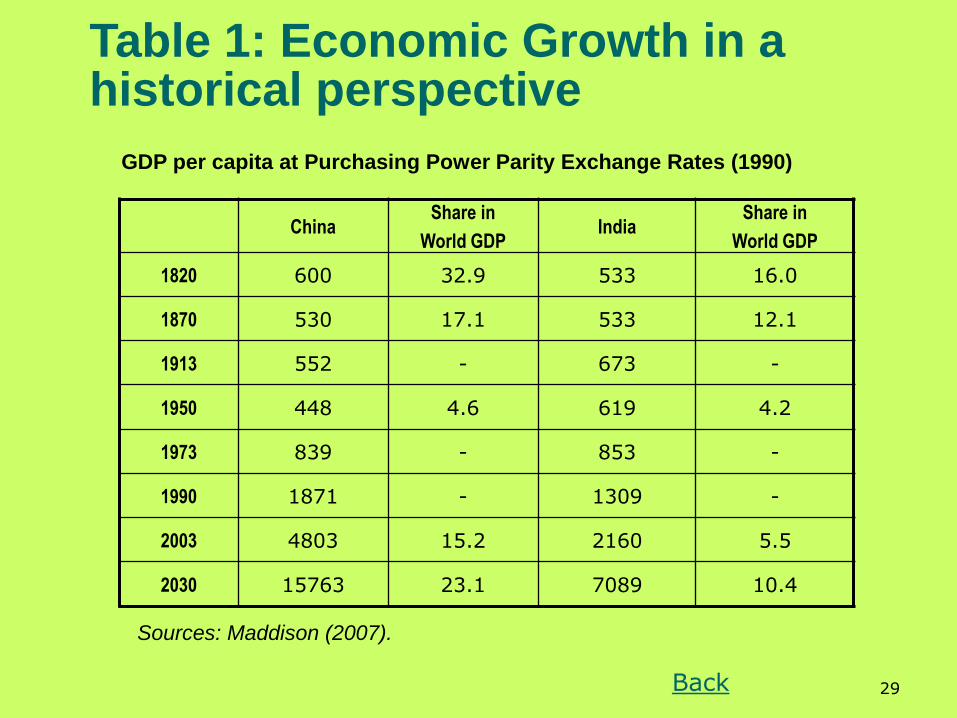
A historical perspective on their growth – Table 1
Nobel Laureate Robert Fogel of Chicago forecasts that the two would increase their
share of world income (PPP) to 40% and 12% respectively by 2040.
In comparison Maddison’s forecasts for China for 2030 appears more conservative.
Table 1 shows that during 1870-1913,the hey days of first wave of globalization,
India’s income grew while China’s stagnated. During 1913-50 China’s income
declined absolutely and relative to India’s. In 1950 India’s per capita income was
higher than China’s by 38%. In the entire Mao era (1949-76) China’s income grew
marginally more rapidly than India’s eventually catching up by the time Deng took
over in 1978.
The expected global economic dominance of the two by 2050 inevitably would lead to a restructuring of global political and economic order
Introduction
4
1. Introduction: Cont’d.
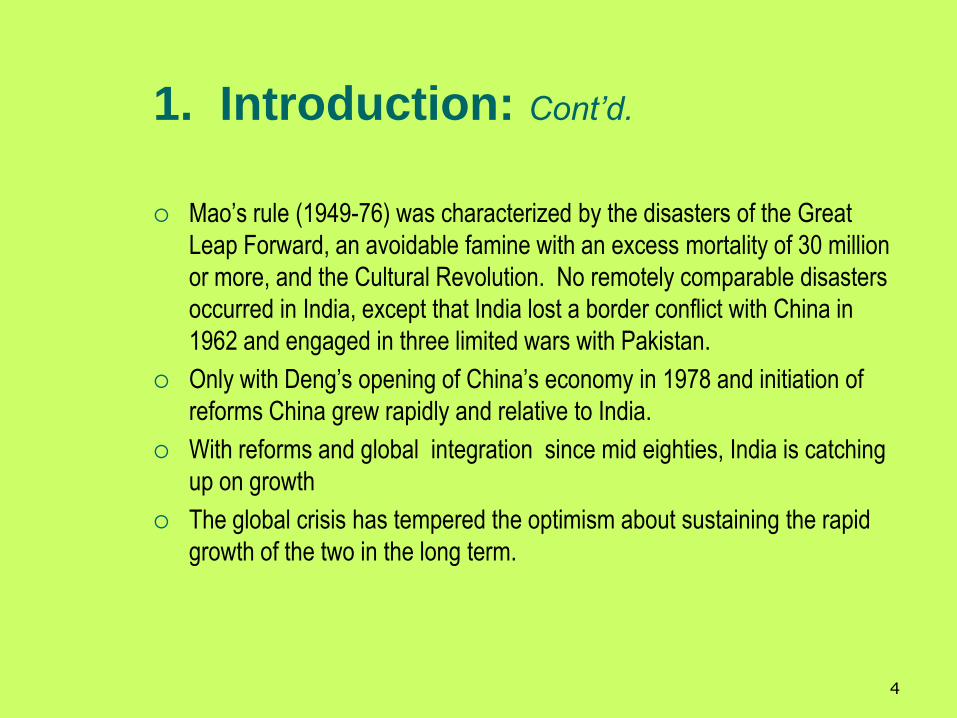
Mao’s rule (1949-76) was characterized by the disasters of the Great
Leap Forward, an avoidable famine with an excess mortality of 30 million
or more, and the Cultural Revolution. No remotely comparable disasters
occurred in India, except that India lost a border conflict with China in
1962 and engaged in three limited wars with Pakistan.
Only with Deng’s opening of China’s economy in 1978 and initiation of
reforms China grew rapidly and relative to India.
With reforms and global integration since mid eighties, India is catching
up on growth
The global crisis has tempered the optimism about sustaining the rapid
growth of the two in the long term.
5
2. Development Strategies:China (1949 – 1978) - India (1947 – mid 1980’s)
At Communist take-over in China in 1949 and at India’s Independence
from Great Britain in 1947, both had very low incomes, large and
overwhelmingly poor populations living in rural areas and heavily
dependent on agriculture
Both adopted a Soviet Style Centrally Planned Development Strategies,
focused on industrialization, with emphasis on capital intensive heavy
industry
Analytical foundation for India’s strategy in Mahalanobis (1956) –
Feldman (1928) Two-Sector Growth Model.
6
2. Development Strategies:Contd.
Both insulated their economies from the world economy – India’s by
choice and China’s by refusal with others to trade with her
China collectivized its agriculture while in India it was entirely private,
dominated by very small holdings.
China's economy was almost entirely state-owned and state-controlled.
India’s economy was state-controlled and directed, but mostly privately
owned except in industry, finance, transport and communication where
there was significant public ownership, in some cases a public monopoly.
7
2. Development Strategies:Contd.
China was (and is still to a large extent) a single-party controlled state
with no de-jure autonomy for provinces. De facto they have had
considerable discretion despite central direction.
India is formally a federal state with a constitutionally set assignment of
powers and responsibilities between the Central and state governments.
However, even the constitutional assignment and more so subsequent
practice have led India to become de facto more of a unitary state with
the Central government dominant in economic matters.
8
2. Development Strategies:Contd. India is a parliamentary democracy with a free press and media, and
China undoubtedly is not.
Did the substantial political differences between the two affect economic policies and performance ?
Policy formulation and implementation are time consuming and electoral competition pushes them towards myopia and populism in a democracy
One party rule makes both easier, less time consuming and less myopic
However contents and quality of policies could be good or bad for economic performance under democracy and one party rule so that the instrumental role of democracy and autocracy for economic performance could be benign or malign
Indian democracy and Chinese authoritarian rule have not undergone any fundamental change since 1950. Yet both countries performed poorly in the economic arena before reforms and much better after
Democracy is an intrinsic desideratum regardless of its instrumental role in helping or hurting economic performance. Exclusive focus on its instrumental role is utterly silly.
9
3. Reform EraChina (1978 on). India (Mid 1980s on)
China was ripe for reform in 1978 when Deng Xiao Ping took over after the overthrow of the gang of four.
Chinese population was exhausted by dislocation and disruption of the cultural revolution.
The economy had been shattered and was in dire straits
India – no pressure for systemic reform during 1950-80 – no disasters as in China.
1966 Macroeconomic Crisis and assistance from IMF and World Bank with conditionality of liberalization
A brief flirtation with liberalization was reversed within two years due to domestic political reasons and by the reneging of the World Bank on its promised assistance due to US pressure
10
3. Reform EraCont’d. Content of reforms and their time sequence differed substantially between
the two countries
China began with reform of its most distorted agricultural sector by introducing the household responsibility systems and gradually reducing compulsory deliveries to the state – thus yielding quick, spectacular and well-distributed gains.
Foreign sector reforms followed with the opening China to foreign trade and investment and the establishment of Special Economic Zones (SEZs) at Shenzhen and Xiamen and a few others.
SEZs were free of restrictions on enterprises in the rest of China: 100% foreign ownership was allowed with freedom to hire and fire workers; access to efficient and high quality infrastructure including power, water and telecommunications; and the size of each SEZ was sufficiently large for exploitation of economies of scale.
Encouragement of FDI in general and in export oriented labour intensive manufacturing in particular.
11
3. Reform Era:Cont’d.
SEZs were later expanded to coastal economic zones after Deng’s Southern Tour
One crucial area that was not (and is yet to be fully) reformed is the Hukou system of registration that handicapped labour movement away from rural areas and discriminated against migrant workers’ access to education and health services.
India began with piecemeal and hesitant reforms in the mid-1980’s that relaxed the rigors of its mindless import and investment licensing system and also allowed the real effective exchange rate to depreciate. The economy responded well to these change
A very severe macroeconomic and balance of payments crisis hit in 1991 following the first Gulf War
12
3. Reform Era:Cont’d.
India’s credit rating plummeted, foreign exchange reserves fell to less than two weeks’ worth of imports and gold reserves had to be pledged to avoid default on external debt and India had to go to the World Bank and the IMF for assistance that came with conditionality.
The rupee was devalued and tariff barriers were brought down from dizzy heights, but quantitative restrictions on imports remained until India was forced in 2001to remove them by an adverse ruling of the WTO.
Collapse of India’s model for central planning, the Soviet Union collapsed in 1991. India’s rival China had grown rapidly since its external opening and market oriented reforms in 1978. The two events made a return to the status quo ante before the crisis no longer desirable
Systemic and comprehensive reforms followed
13
3. Reform Era:Concluded.
Reforms have progressed and performed well on foreign trade, foreign investment, telecommunications, and financial sector, but have far to go or have lagged or not untouched in others. These include financial sector, labour and land markets, electricity and infrastructure.
14
4. Economic Performance: Before and After Reforms
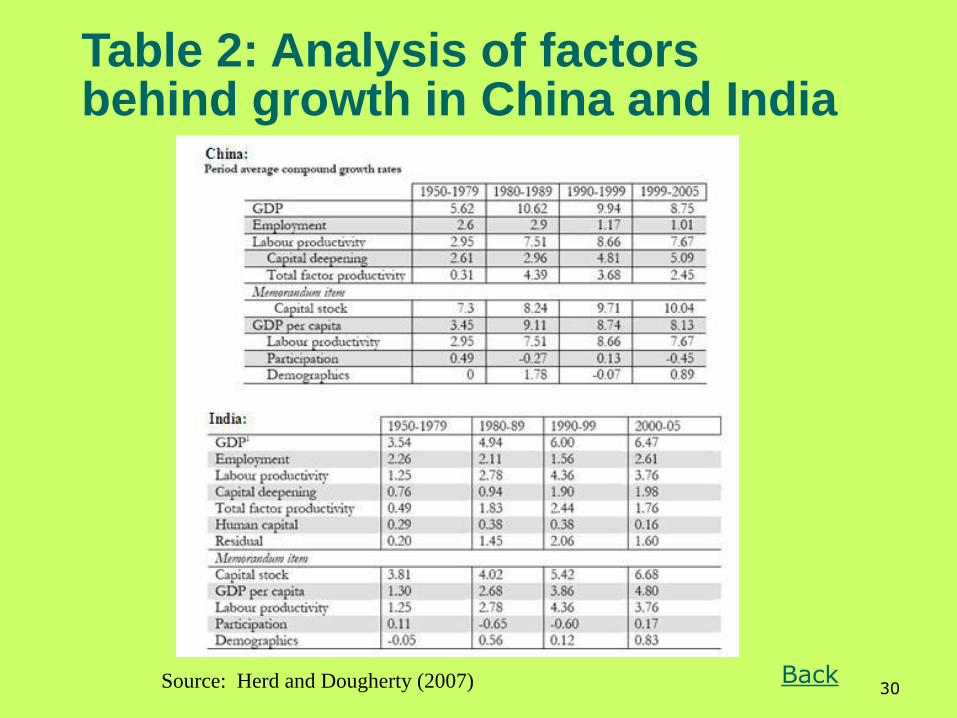
Importance of Total Factor Productivity growth for sustainability.
Herd and Dougherty (2007) – Table 2
TFP growth in both countries went up after reforms.
Until reforms the Stalinist Development Strategy of both economies emphasized capital intensive industry, had insulated the economy from world markets and virtually eliminated domestic and external competition.
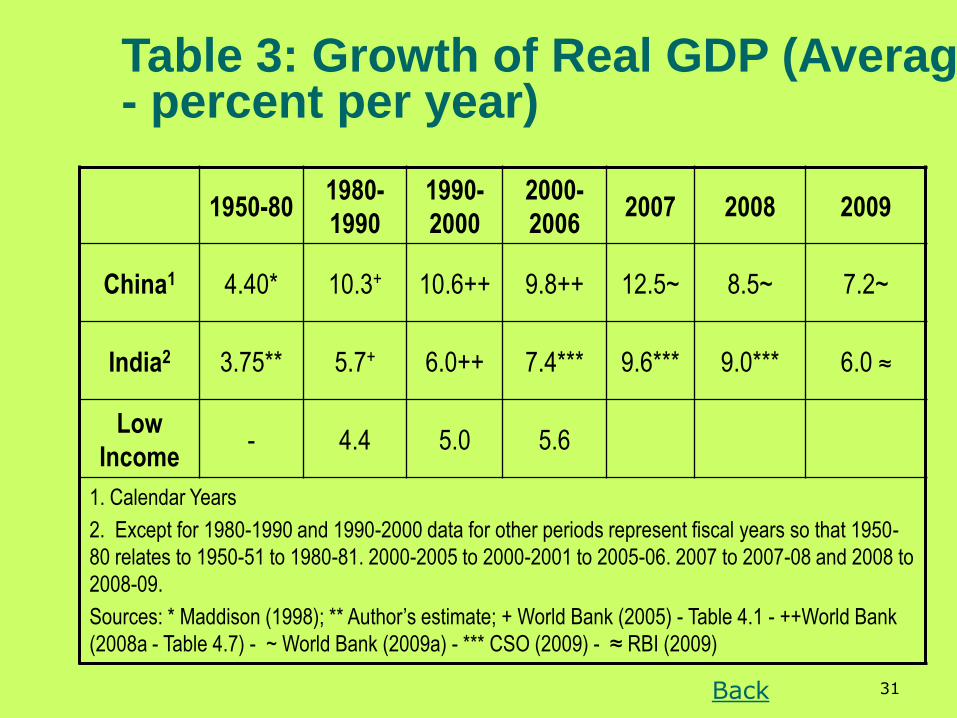
Growth until reforms was modest and accelerated only thereafter in both countries – Table 3
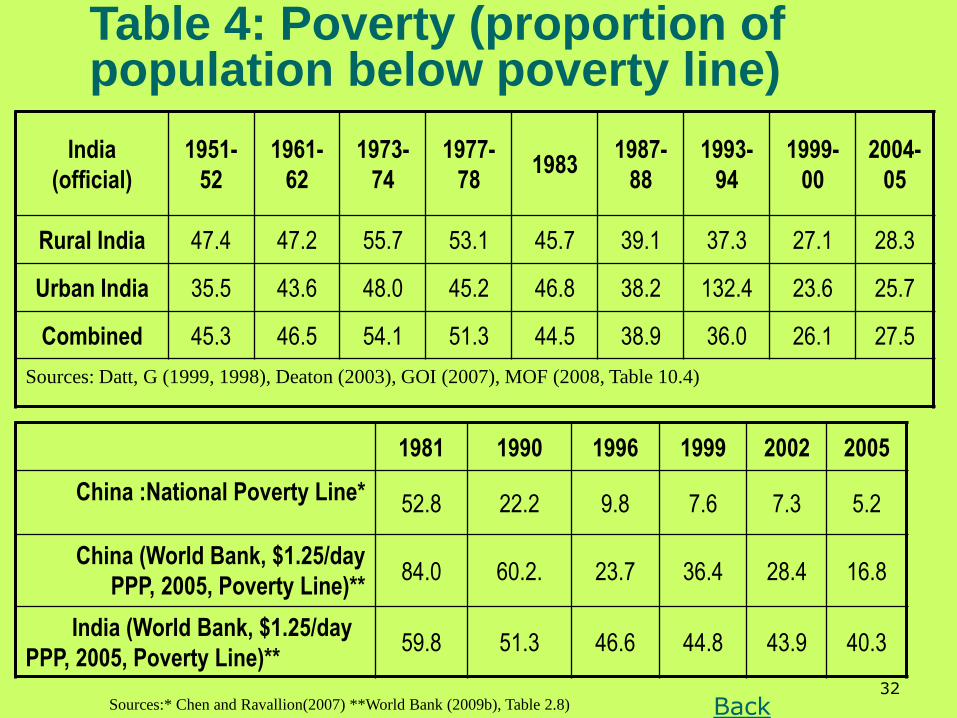
The same is true of poverty reduction – Table 4
15
4. Economic Performance: Before and After Reforms. Cont’d.
Economic performance of the two economies differed
significantly not only in growth but equally importantly in the
financing of growth (mostly domestic in both) extent of global
integration. structure of output, demand – Tables 5 - 7
Several conclusions emerge from these Tables:
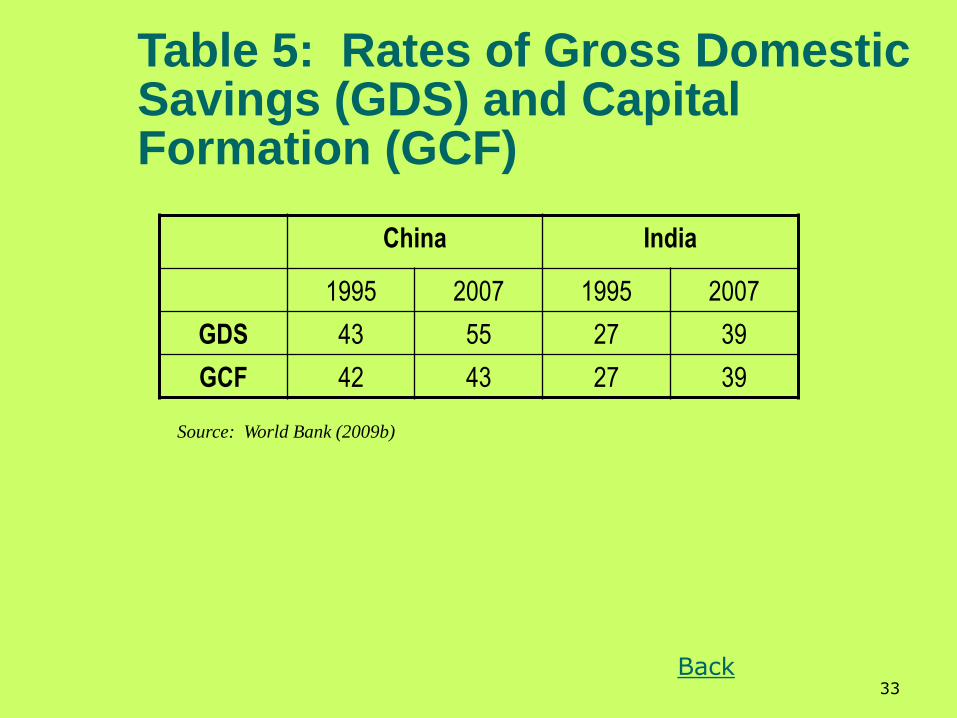
China and India depended almost entirely on domestic savings to
finance investment with India catching up with China in both. Table 5
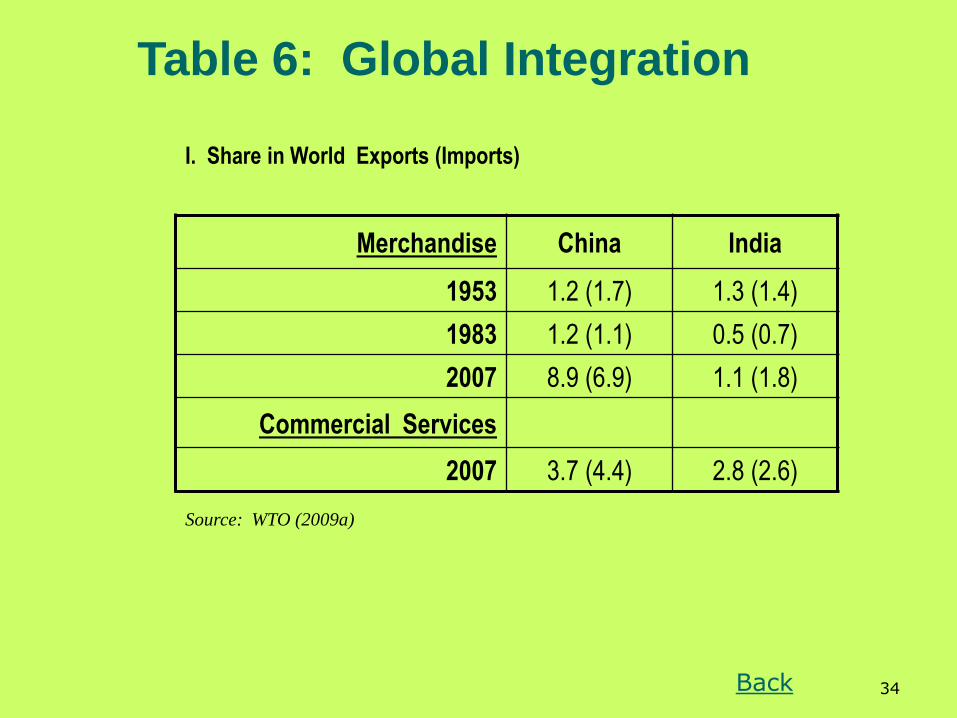
China increased its share of world merchandise trade far more than
India. The China-India gap in shares in world exports of commercial
services is much narrower. Table 6: I
16
4. Economic Performance: Before and After Reforms. Cont’d.
Several conclusions emerge from these Tables , contd.
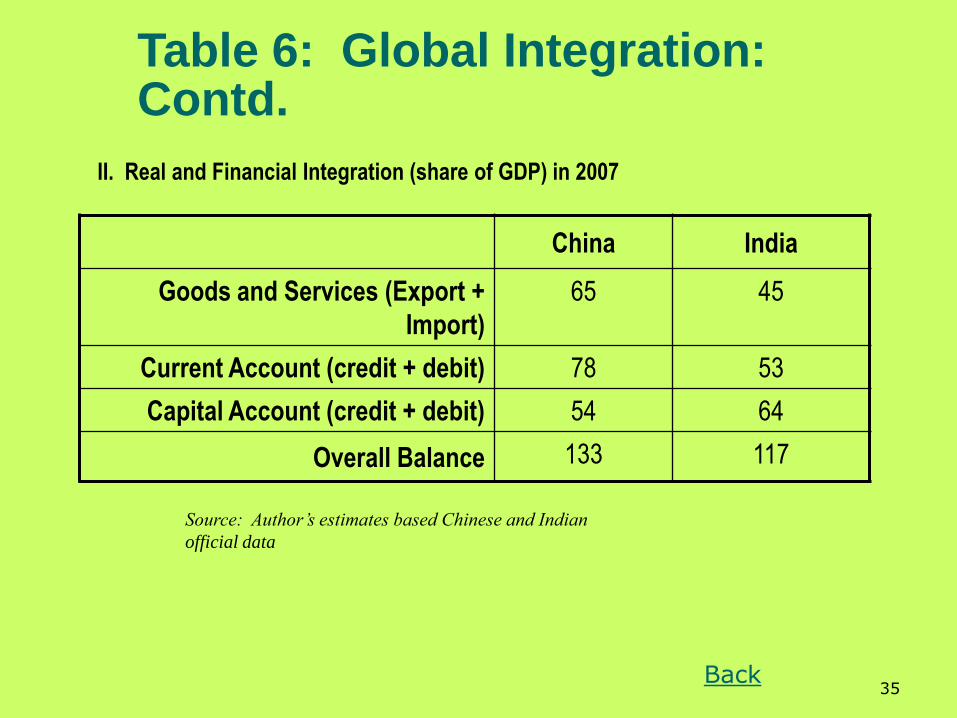
China is integrated with global markets to a much greater extent than
India both in markets for goods and services and financial markets
(except on capital account). Table 6: II
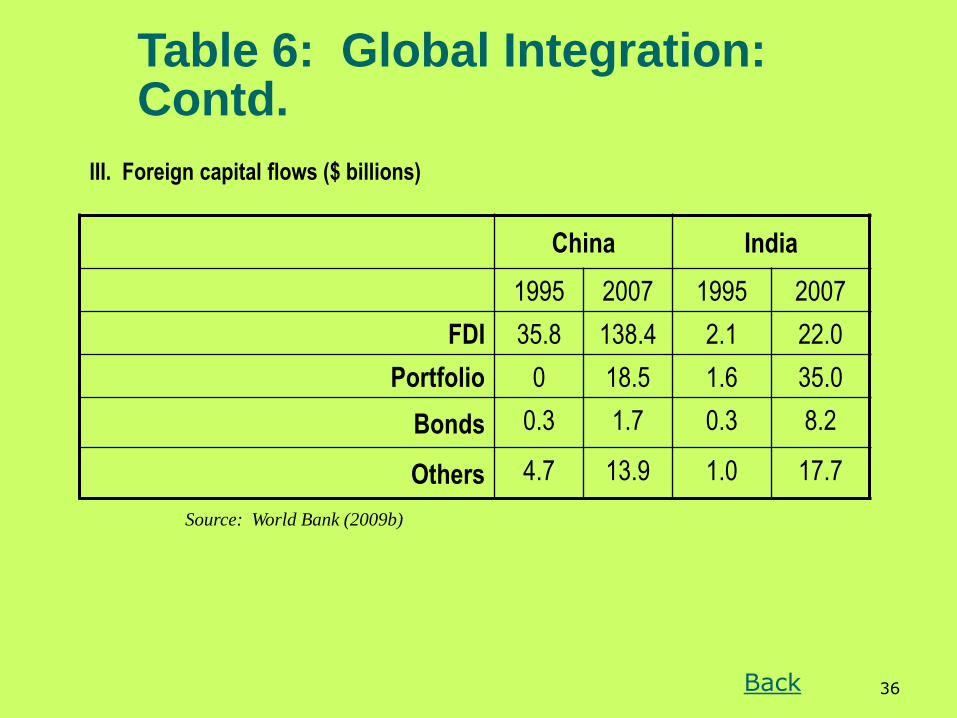
China continues to attract FDI flows to a much greater extent and
portfolio flows to a lesser extent than India. Table 6:III
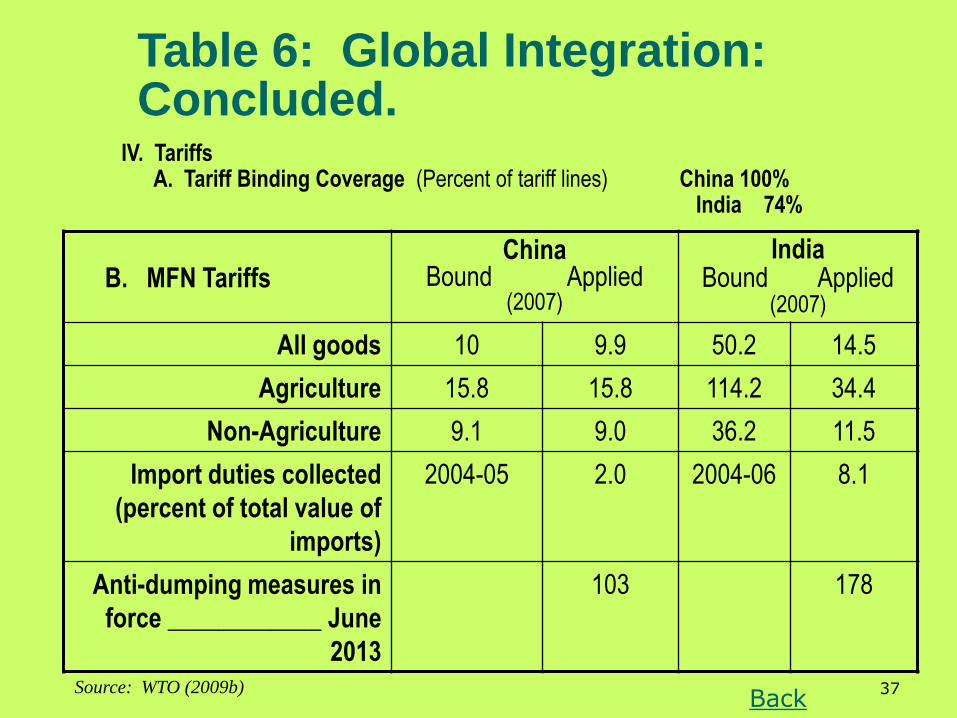
India continues to have much higher applied MFN tariff barriers than
China and its bound rates exceed its applied rates by a substantial
margin. Table 6:IV
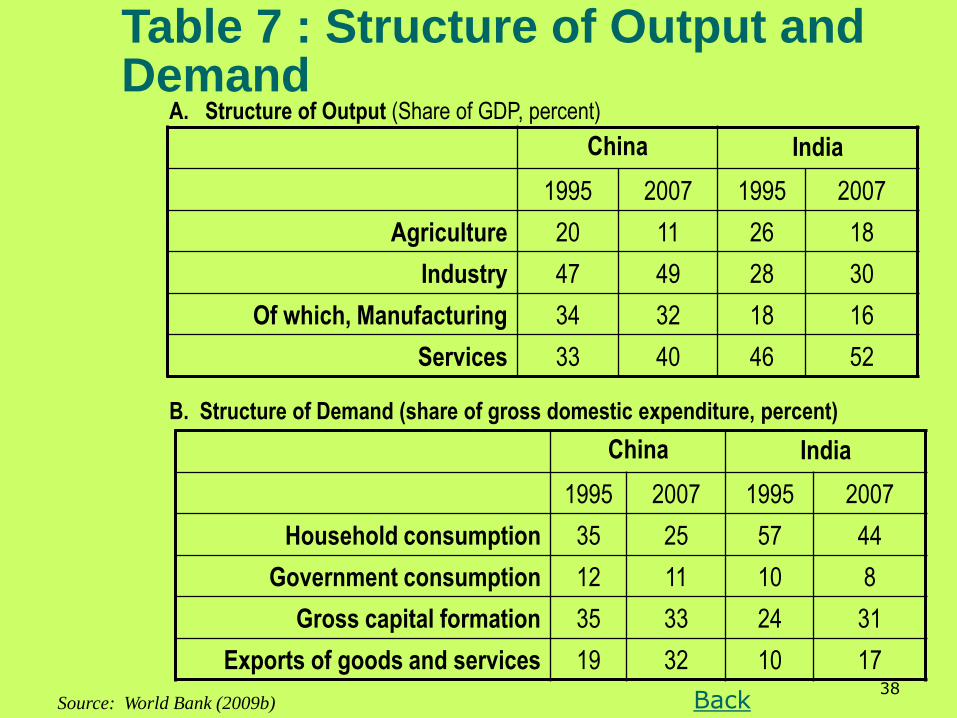
China’s structure of output is heavily tilted towards industry, particularly
manufacturing. Table 7
17
4. Economic Performance: Before and After Reforms. Cont’d.
Several conclusions emerge from these Tables, contd.
India’s export demand as a share of domestic expenditure at 17% is much less than China’s 32% - Table 7
Age structure of population – India’s population is younger with 33% below the age of 15 as compared to China’s 21.6% in 2005, a difference that will narrow but not be eliminated by 2050.
China’s population is not only older but also aging faster because its rate of growth of population is and will remain considerably slower. However, China’s working population is better educated and healthier than India’s.
India thus has a potential advantage both for reasons of its demography, and also because with a higher share of labour force in agriculture and other low productivity primary activities has a greater potential to accelerate its growth by shifting labour to higher productivity activities.
18
Several conclusions emerge from these Tables, concluded.
Success in realizing the potential depends heavily in completing reforms in health and education and eliminating constraints on labour allocation.
India has a considerable edge over China according to Huang (MIT) and Khanna (Harvard) for the following reasons:
India depends to a much greater extent its efficient the private sector for entrepreneurship and on markets for allocation of capital
India’s financial sector including banks, equity and public debt markets more efficient—China’s banks were technically insolvent until recently
India’s better governance in the private corporate sector with its entrepreneurial and innovation capabilities reduces the need for seek FDI to substitute for weak domestic markets and entrepreneurship as in China
4. Economic Performance: Before and After Reforms. Concluded.
19
5. Impact of Global Economic
Crisis and Response
Impact of crisis on India Perception in mid 2008-Speech of the then RBI Governor Reddy:
The impact was expected to be modest
Possible spread of crisis to India through the financial and real channels
Spread through financial channel not expected because:
Credit derivatives market was embryonic
RBI restriction on investment by residents on derivatives issued abroad
Prudential policies have ensured a sound financial system, particularly banks
Reddy did not mention spread through the real channel
The perception changed by October 2008
Speech of Rao, Reddy’s successor
20
5. Impact of Global Economic Crisis and Response: Cont’d.
Debunked ―De-coupling‖ fad
Reiterated Reddy’s main claim on the soundness of India’s financial system and banks
Reduction of portfolio flows affect equity markets and are affected by volatility in equity returns
Reduction of foreign credit to domestic corporations increases domestic credit demand and affects exchange rates
Impact on GDP growth from reduction in export growth relevant but expected to be quantitatively small because of relatively low share (less than 25 percent) of exports of goods and services in GDP
However the share of exports in manufacturing is much higher and thus fall in export growth affects growth of manufacturing significantly
Financial channel became more significant because of India’s faster integration in global financial, compared to real markets-- in 2007-08, credit plus debit on trade in goods and services was 45%, on current account 53%, on capital account 64% and on overall balance 117%
21
5. Impact of Global Economic Crisis and Response: Cont’d.
Impacts and Response Indian GDP growth in each quarter compared the corresponding quarter in
the year before declined from 9.3% (Q3) of 2007-08 to 5.8% (Q4) of 2008-09.
Export Growth declined from a healthy 28.9% in 2007-08 to 17.5% during April-December 2008 and to 12.8% for 2008-09 as a whole.
Growth of manufacturing declined even more rapidly than GDP during the same period, from 8.6% to a negative 1.4% for reasons mentioned earlier. This decline is similar to that experienced by China, Japan and East Asia with their much higher shares of exports in GDP
Fiscal deficit grew to 6.1% in 2008-09 compared to 2.7% in 2007-08 and is projected at 6.8% for 2009-10. It is likely to be much higher
Relatively small stimulus package properly measured
RBI measures including cuts in policy rates and expansion of liquidity.
Share of consumption and investment demand in expenditure is high (exceeding 75%), thus limiting the scope domestic demand stimulus to substitute for falling export growth. However corporate investment is declining due to fall in profits
22
5. Impact of Global Economic Crisis and Response: Cont’d.
Impacts of Crisis on China In China also GDP growth declined - from 13% in 2007, to 9 percent in 2008
and even further to a projected 7.2% in 2009 according to World Bank. Latest official data (7/16/2009) show a 7.1% increase in the first half of 2009.
Real export growth declined from 23.3% in 2006, to 8.8% in 2008. In 2009, the growth projected at a negative 10.1%. Latest official data show a decline of 21.8% in the first half of 2009
Fiscal balance worsened from 0.7$ of GDP in 2007 to a projected -4.9% in 2009
With domestic demand at 68% of gross domestic expenditure, much lower than India’s 83%, the scope for domestic demand expansion through stimulus packages is much greater in China. China’s stimulus packages have in fact been far larger in magnitude (second only to the U.S) as a proportion of GDP than India’s (a total of 4.4% for three years 2008-10 versus 0.5%). Although the packages have pushed China’ fiscal budget from a surplus of 0.6% on GDP in 2007, to a deficit of 0.4% in 2008 and a projected 4.9% in 2009, these deficits are far lower than India’s likely deficit of 10% or more in 2009-10, thus allowing China more fiscal room for further stimulus if needed (most unlikely)
23
5. Impact of Global Economic Crisis and Response: Cont’d.
Impacts of Crisis on China, Continued: However, with Chinese investment being comparatively inefficient, it would
be better to focus on expanding household’s consumption demand, which is only 25% as compared to India’s 44% of domestic expenditure. Unfortunately the investment component of the stimulus package has succeeded in boosting inefficient government-influenced investment and not so much the more efficient market based investment
China runs a substantial current account surplus- 11.3% of GDP in 2007, 9.8% in 2008 and a projected 8.0% in 2009 and its foreign currency reserves of $1.95 trillion in 2008 is projected at $2.17 trillion in 2009, already reached at the end of June. With most of reserves invested in U.S. Treasury bills and securities and doubts being raised about the credit rating of U.S. government debt, China is understandably concerned about the security and value of the reserves.
The governor of the Peoples’ Bank of China has defended China’s high domestic savings rates and expressed his support for a move away from the U.S. dollar as the major international reserve currency.
24
5. Impact of Global Economic Crisis and Response: Concluded.
Impacts of Crisis on China, Concluded:
On balance, given China’s extremely modest fiscal deficit, large scope for expanding domestic consumption and the availability of sizeable resources, China can comfortably adjust to the crisis and resume growth in the near future.
China has liberalized trade far more than India
India – still one of the most protected countries in the developing world by some measures
China’s embrace of openness and its purposive use in accelerating domestic reform process have been important as compared to continuing skepticism about the benefits of openness in India.
25
6. Future Prospects
India’s potential future prospects once the global crisis ends and growth resumes are bright. Realizing the potential requires that the following reform tasks are completed.
A credible commitment to complete the reform agenda is needed urgently. For example, India could announce its willingness to consider much more liberal commitment to reduce barriers to agricultural and nonagricultural trade in the Doha negotiations; the budget presented on July 6 unfortunately did not announce reductions in non-merit subsidies and handouts, revive and go further on labour law reform.
Constraints of infrastructure – physical and human to be addressed.
Reform of labour laws – their dysfunctionality and growth and equity costs has been known for a long time
Reform of bankruptcy laws – took a decade on average to close a business in June 2008
Rethinking SEZs along the lines of Chinese SEZs
26
6. Future Prospects: Cont’d.
Making India a true Common Market
Agricultural reforms
Addressing high costs of doing business – e.g. it took nearly 4 years and 46 procedures to enforce a contract in 2008
Pushing ahead with integrating India with the global economy—the current crisis is NOT an argument for retreat
China’s potential future prospects are also bright – the needed economic reform tasks to realize the potential are easier to accomplish then needed political reforms to be discussed in the concluding section.
The economic reforms tasks including unifying the labour market by abolishing the Hukou system and other restrictions
27
6. Future Prospects: Cont’d.
China’s investment at over 50% of GDP is inefficient – need to reduce the
share of investment and making it more efficient
Financial system is still inefficient and needs to be reformed.
The problems of rising dependence ratios and falling share of the
population in the working age group (unlike in India) need to be tackled
through pension reforms and shift of labour from rural areas and from
agriculture.
28
7. Conclusions Rising Inequalities: Regional and individual
India’s soft power versus China’s hard power
India: Democracy, free press and media act as safety valves although conflicts in Kashmir, Northeast region and in other states could still explode, in large part because of resort to repression by the central and state authorities
India’s recent election a ringing affirmation of the entrenchment of democratic values.
However its competitive electoral politics focused on local issues and populism is dysfunctional
China’s authoritarian system continues to depend on repression—the strong measures to quash any demonstration of remembrance on the 20th anniversary of the Tiananmen massacre of 1989 and the ethnic conflict between Uighurs and HAN western China are the most recent examples. The restrictions on internet access is another example. The conflict and repression in Tibet have continued since the founding of the Peoples Republic of China.
The bargain of delivering rapid growth and internal stability for one party rule may not last very long
Whether China can successfully and peacefully transform it’s polity into a vibrant pluralistic democracy with regular free and fair elections, as it has done so in transforming its moribund centrally planned state-controlled economy to a largely market economy, is an open question.
29
ChinaShare in
World GDPIndia
Share in
World GDP
1820 600 32.9 533 16.0
1870 530 17.1 533 12.1
1913 552 - 673 -
1950 448 4.6 619 4.2
1973 839 - 853 -
1990 1871 - 1309 -
2003 4803 15.2 2160 5.5
2030 15763 23.1 7089 10.4
GDP per capita at Purchasing Power Parity Exchange Rates (1990)
Table 1: Economic Growth in a historical perspective
Sources: Maddison (2007).
Back
30
Table 2: Analysis of factors behind growth in China and India
Source: Herd and Dougherty (2007) Back
31
1950-801980-
1990
1990-
2000
2000-
20062007 2008 2009
China1 4.40* 10.3+ 10.6++ 9.8++ 12.5~ 8.5~ 7.2~
India2 3.75** 5.7+ 6.0++ 7.4*** 9.6*** 9.0*** 6.0 ≈
Low
Income- 4.4 5.0 5.6
1. Calendar Years
2. Except for 1980-1990 and 1990-2000 data for other periods represent fiscal years so that 1950-
80 relates to 1950-51 to 1980-81. 2000-2005 to 2000-2001 to 2005-06. 2007 to 2007-08 and 2008 to
2008-09.
Sources: * Maddison (1998); ** Author’s estimate; + World Bank (2005) - Table 4.1 - ++World Bank
(2008a - Table 4.7) - ~ World Bank (2009a) - *** CSO (2009) - ≈ RBI (2009)
Table 3: Growth of Real GDP (Average - percent per year)
Back
32
Table 4: Poverty (proportion of population below poverty line)
India
(official)
1951-
52
1961-
62
1973-
74
1977-
781983
1987-
88
1993-
94
1999-
00
2004-
05
Rural India 47.4 47.2 55.7 53.1 45.7 39.1 37.3 27.1 28.3
Urban India 35.5 43.6 48.0 45.2 46.8 38.2 132.4 23.6 25.7
Combined 45.3 46.5 54.1 51.3 44.5 38.9 36.0 26.1 27.5
Sources: Datt, G (1999, 1998), Deaton (2003), GOI (2007), MOF (2008, Table 10.4)
1981 1990 1996 1999 2002 2005
China :National Poverty Line*52.8 22.2 9.8 7.6 7.3 5.2
China (World Bank, $1.25/day
PPP, 2005, Poverty Line)**84.0 60.2. 23.7 36.4 28.4 16.8
India (World Bank, $1.25/day
PPP, 2005, Poverty Line)**59.8 51.3 46.6 44.8 43.9 40.3
Sources:* Chen and Ravallion(2007) **World Bank (2009b), Table 2.8) Back
33
Table 5: Rates of Gross Domestic Savings (GDS) and Capital Formation (GCF)
China India
1995 2007 1995 2007
GDS 43 55 27 39
GCF 42 43 27 39
Source: World Bank (2009b)
Back
34
Table 6: Global Integration
Merchandise China India
1953 1.2 (1.7) 1.3 (1.4)
1983 1.2 (1.1) 0.5 (0.7)
2007 8.9 (6.9) 1.1 (1.8)
Commercial Services
2007 3.7 (4.4) 2.8 (2.6)
Source: WTO (2009a)
I. Share in World Exports (Imports)
Back
35
Table 6: Global Integration: Contd.
China India
Goods and Services (Export +
Import)
65 45
Current Account (credit + debit) 78 53
Capital Account (credit + debit) 54 64
Overall Balance 133 117
Source: Author’s estimates based Chinese and Indian
official data
II. Real and Financial Integration (share of GDP) in 2007
Back
36
Table 6: Global Integration: Contd.
China India
1995 2007 1995 2007
FDI 35.8 138.4 2.1 22.0
Portfolio 0 18.5 1.6 35.0
Bonds 0.3 1.7 0.3 8.2
Others 4.7 13.9 1.0 17.7
Source: World Bank (2009b)
III. Foreign capital flows ($ billions)
Back
37
Table 6: Global Integration: Concluded.
B. MFN TariffsChina
Bound Applied(2007)
IndiaBound Applied
(2007)
All goods 10 9.9 50.2 14.5
Agriculture 15.8 15.8 114.2 34.4
Non-Agriculture 9.1 9.0 36.2 11.5
Import duties collected
(percent of total value of
imports)
2004-05 2.0 2004-06 8.1
Anti-dumping measures in
force ____________ June
2013
103 178
Source: WTO (2009b)
IV. TariffsA. Tariff Binding Coverage (Percent of tariff lines) China 100%
India 74%
Back
38
Table 7 : Structure of Output and Demand
China India
1995 2007 1995 2007
Agriculture 20 11 26 18
Industry 47 49 28 30
Of which, Manufacturing 34 32 18 16
Services 33 40 46 52
Source: World Bank (2009b)
A. Structure of Output (Share of GDP, percent)
B. Structure of Demand (share of gross domestic expenditure, percent)
China India
1995 2007 1995 2007
Household consumption 35 25 57 44
Government consumption 12 11 10 8
Gross capital formation 35 33 24 31
Exports of goods and services 19 32 10 17
Back
39
References
Chen, Shaohua and Martin Ravallion (2007). ―China’s (uneven) progress Against Poverty,‖ Journal of
Development Economics, 32(1), 1-42.
Datt, Gaurav (1998). ―Poverty in India and Indian States: An Update,‖ Working Paper 47, Washington DC:
International Food Policy Research Institute.
Datt, Gauav (1999). ―Has Poverty in India Declined Since the Economic Reforms?‖ Washington DC: World Bank
(mimeo).
Deaton, Angus (2003). ―Adjusted India Poverty Estimates for 1999-2000,‖ Economic and Political Weekly,
January 25, 2003. 322-326.
Maddison, Angus (2007) Contours of the World Economy, London, Oxford University Press.
Maddison, Angus (1998). Chinese Economic Performance in the Long Run, Paris, Development Centre,
Organisation for Economic Co-operation and Development.
MOF (2008). Economic Survey, 2008-09. New Delhi, Ministry of Finance.
RBI (2009). ―Annual Policy Statement for 2009-10‖ Mumbai: Reserve Bank of India.
http://rbidocs.rbi.org.in/rdocs/notification/PDFs/APAPR09PRD.pdf
http://rbi.org.in/scripts/AnnualPublications.aspx?head=Macroeconomic%20and%20Monetary%20Developments
Srinivasan, T.N. (2004). ―Economic reforms and global integration, ― in Francine F. & Harry, H. (Eds), The India-
China relationship: What the United States needs to know. Washington, DC: Woodrow Wilson Center Press.
40
References
Rao, Subba (2009) ―Impact of the Global Financial crisis on India: Collateral Damage and Response,‖ ((
http://www.rbi.org.in/scripts/bs-viewspeeches.apx)
Rao, Subba (2008) ―Lessons from the Global Financial Crisis with special reference to Emerging Markets and
India‖
Reddy Venugopal (2008), ―Global Financial Turbulence and Financial Sector in India: A Practitioner’s
Perspective,‖ ( http://www.rbi.org.in/scripts/bs-viewspeeches.apx)
Tinbergen, Jan (1971). Towards a Better International Order. New York: United Nations Institute for Training and
Research, Lecture Series 2.
Wines ,M Brddsher.K and Mark Landler (2009)―China’s Leader says He is ―worried‖ over US Treasuries‖, New
York Times, March 14.
World Bank (2009a). China: Quality Update: June 2009 , Washington D.C., World Bank March.
World Bank (2009b). World Development Indicators, Washington, DC: World Bank.
World Bank (2005). World Development Indicators. Washington, DC: World Bank.
WTO (2009a). International Trade Statistics. Geneva: World Trade Organization.
WTO (2009b). World Tariff Profiles 2008, Geneva: World Trade Organization.