Embed Size (px)
Citation preview
Platinum Broking IMPORTANT DISCLOSURES ARE PROVIDED ON THE LAST PAGE OF THIS REPORT
China Airport Sector Update May 2014
Sources: Platinum Research, BCIA

China Airport Sector Update MAY 2014
Platinum Broking 2
TABLE OF CONTENTS
SECTION 1 Recent Developments ................................................ 3
1.1 Overview .......................................................................................... 3
1.2 Passenger traffic ................................................................................. 3
1.3 Cargo traffic ....................................................................................... 4
1.4 Airport expansion ................................................................................ 5
1.5 Traffic capacity ................................................................................... 5
SECTION 2 Company Focus .......................................................... 6
2.1 Overview .......................................................................................... 6
2.2 Operational comparison ......................................................................... 6
2.3 Financial comparison ............................................................................ 7
2.4 Other updates ..................................................................................... 9
SECTION 3 Stock Recommendation ........................................... 10
Appendix ........................................................................................ 18

China Airport Sector Update MAY 2014
Platinum Broking 3
SECTION 1 Recent Developments
1.1 Overview
China’s airport experienced a steady growth in 2013. According to figures from the Civil
Aviation Administration of China’s (“CAAC”), the total passenger traffic reached 354m in
2013, with YoY growth of 10.9%, and the growth further fastened to 12.6% YoY for the three
months ended March 2014 (“1Q14”). Cargo volume increased 2.3% YoY to 5.6m tones in
2013, 4.3ppts higher than in 2012, and 1Q14 the growth was 5.6% YoY.
Exhibition 1: China’s passenger traffic and YoY growth Exhibit 2: China’s cargo traffic and YoY growth
Sources: CAAC Sources: CAAC
In addition, 10 new airports became operational, adding to the total number of China’s airports
to 193. In terms of airports density (airport number/land area), China reached 20.1 airports
per million sq km by the end of 2013, 1.9ppts higher than by 2010, but it is still low compared
with US’ 56.4 or EU’s 175.2.
1.2 Passenger traffic
Passenger traffic grew steadily at 10.9% YoY for 2013 to 354.0m, 1.7ppts higher than 2012’s
growth, and 1Q14 growth fastened to 12.6% YoY. The growth was mainly driven by the
strong tourist demand, especially from outbound tourist.
According to National Tourist Administration (“NTA”), the total number of tourist grew by
11.2% YoY to 3.8b person-time in 2013. Among which, domestic tourist number (accounted
for 93.6% of total tourist) remained at 11.6% annual growth, whilst the outbound tourist,
boosted in the last five years with a CAGR of 19.7%, continued a double-digit growth of 17.8%
to 98m in 2013, and will continue to be the key passenger traffic growth driver for airports. In
contrast, the inbound tourist number further declined by 2.6% in 2013, mainly due to the
sluggish global economy and RMB appreciation.
Looking ahead, China’s national tourist growth is expected by NTA to be 8.4% in 2014. As
outbound tourist will remain to be a major contributor to total tourist growth, longer term
travelling means, especially by air, is expected to see faster growth. According to CAAC, the
total passenger traffic growth is estimated by CAAC to be at 10.5% in 2014.
Passenger traffic to
grow 10.5% in 2014

China Airport Sector Update MAY 2014
Platinum Broking 4
Exhibition 3: Monthly passenger traffic Exhibit 4: China’s tourist
Sources: CAAC Sources: NTA
1.3 Cargo traffic
In 2013, cargo volumes increased 2.3% YoY to 5.6m tons after two years declining (-1.1% and
-1.8% YoY in 2011-2012), and the growth further recovered in 1Q14 by 5.6% YoY (1Q13:
4.7%). The increase was backed by both foreign trade and courier business boost.
Exhibition 5: Cargo traffic
Sources: CAAC
Given a mild recovery of global economy, China's foreign trade picked up with a growth of
7.6% YoY in 2013, +1.4ppts from 2012. In addition, among all types of cross-border cargo
transportation supervised by the General Administration of Customs, aircrafts movements saw
the fastest growth at 10.2% in 2013 (1Q14: 9.1%), compared with train’s 6.9%, car’s 1.8% and
ship’s -0.7%. Besides, another supports to the cargo increase is from courier sector’s rapid
growth. Cross-province and Cross-border courier volume surged 57.8% YoY to 266.4m items
in 2013.
Giving the expectation of a steady recovery of China’s foreign trade and strong courier
demands ahead, the cargo volumes is expected by CAAC to grow by around 5.3% in 2014.
Cargo volume to
further rebound up
with 5.3% growth in
2014

China Airport Sector Update MAY 2014
Platinum Broking 5
Exhibition 6: China’s foreign trade Exhibit 7: Courier volume
Sources: General Administration of Customs Sources: State Post Bureau
1.4 Airport expansion
In 2013, China has 10 new airports completed, adding the total number of China’s airport to
193. All the new airports were located in lower tier cities. According to China’s 12th
Five-Year
Plan and The National Civil Airport Layout Plan, the total number of airports will reach over
230 by 2015 and to 244 by 2020, indicating 37 airports to be built in the next two years or 51
airports in next 7 years. Most of the to-be-built airports locate in middle and west parts of
China and are of low tier cities (except Beijing new airport) (Details please refer to Appendix).
No matter the airport number target can be achieved or not, CAAC is putting more focus on the
bottleneck problems of existing airports, e.g. improving their handling capacity by more
runway/terminal development, and reducing the flight latency by less aerospace restrictions.
1.5 Traffic capacity
China’s major airlines, namely Air China, China Eastern Airlines, and China Southern Airlines,
expanded their transportation capacity rapidly in 2013, with available seat kilometres (“ASK”)
and available tonne Kilometres (“ATK”) aggregately increased 21.0% YoY and 16.1%
respectively in 2013. Among the four players, Air China’s ASK and ATK increased the fastest
by 47.8% YoY, given more flights demand to overseas destinations especially North America
and Europe. As the base port of Air China, Beijing airport should be benefited from the
increases of both aircraft movement and passenger traffic.
Exhibit 8: Airlines traffic capacity comparison
Benchmarks (2013) Unit Air China China Eastern China Southern Hainan Total
Mkt cap (8 May 2014) RMB b 43.2 29.7 23.3 21.0
Aircrafts number 477 451 561 131 1,620
ASK mil passenger km 175,759 152,122 186,800 52,623 567,303
YoY Chg 47.8% 11.5% 10.1% 13.5% 20.4%
ATK mil ton km 24,507 21,787 24,951 5,791 77,037
YoY Chg 32.2% 10.5% 8.1% 3.7% 15.1%
Base port
Beijing Shanghai Guangzhou Haikou
Sources: Company Data, Platinum Research
10 new airports
completed in 2013.
ASK of major 3
airlines increased
21.2% YoY in 2013.
China Airport Sector Update MAY 2014
Platinum Broking 6
SECTION 2 Company Focus
2.1 Overview
There are six listed airports, including two listed on the Hong Kong exchange, namely Beijing
Capital International Airports (“BCIA”) and Hainan Meilan International Airport (“Meilan”),
and 4 listed in A-share market, namely Shanghai International Airport (“SHIA”, which operates
Pudong airport), Guangzhou Baiyun International Airport (“Baiyun”), Xiamen International
Airport (“Xiamen”), and Shenzhen Airport (“Shenzhen”).
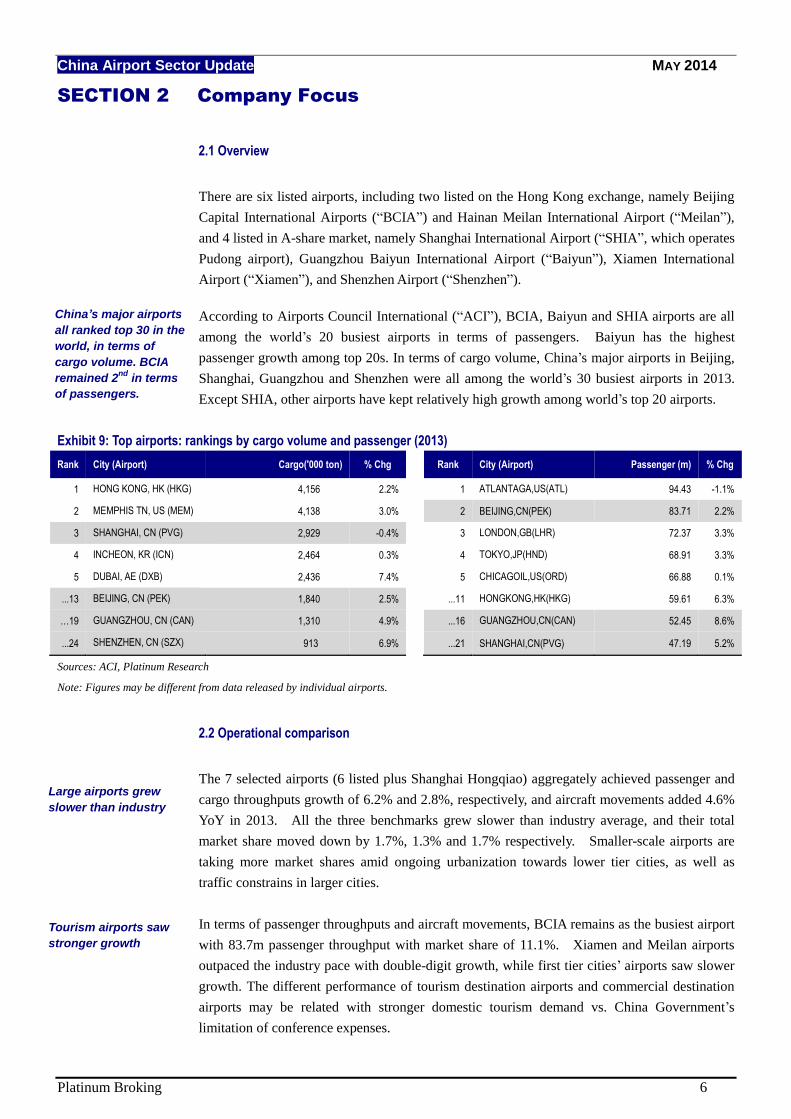
According to Airports Council International (“ACI”), BCIA, Baiyun and SHIA airports are all
among the world’s 20 busiest airports in terms of passengers. Baiyun has the highest
passenger growth among top 20s. In terms of cargo volume, China’s major airports in Beijing,
Shanghai, Guangzhou and Shenzhen were all among the world’s 30 busiest airports in 2013.
Except SHIA, other airports have kept relatively high growth among world’s top 20 airports.
Exhibit 9: Top airports: rankings by cargo volume and passenger (2013)
Rank City (Airport) Cargo('000 ton) % Chg Rank City (Airport) Passenger (m) % Chg
1 HONG KONG, HK (HKG) 4,156 2.2% 1 ATLANTAGA,US(ATL) 94.43 -1.1%
2 MEMPHIS TN, US (MEM) 4,138 3.0% 2 BEIJING,CN(PEK) 83.71 2.2%
3 SHANGHAI, CN (PVG) 2,929 -0.4% 3 LONDON,GB(LHR) 72.37 3.3%
4 INCHEON, KR (ICN) 2,464 0.3% 4 TOKYO,JP(HND) 68.91 3.3%
5 DUBAI, AE (DXB) 2,436 7.4% 5 CHICAGOIL,US(ORD) 66.88 0.1%
...13 BEIJING, CN (PEK) 1,840 2.5% ...11 HONGKONG,HK(HKG) 59.61 6.3%
…19 GUANGZHOU, CN (CAN) 1,310 4.9% ...16 GUANGZHOU,CN(CAN) 52.45 8.6%
...24 SHENZHEN, CN (SZX) 913 6.9% ...21 SHANGHAI,CN(PVG) 47.19 5.2%
Sources: ACI, Platinum Research
Note: Figures may be different from data released by individual airports.
2.2 Operational comparison
The 7 selected airports (6 listed plus Shanghai Hongqiao) aggregately achieved passenger and
cargo throughputs growth of 6.2% and 2.8%, respectively, and aircraft movements added 4.6%
YoY in 2013. All the three benchmarks grew slower than industry average, and their total
market share moved down by 1.7%, 1.3% and 1.7% respectively. Smaller-scale airports are
taking more market shares amid ongoing urbanization towards lower tier cities, as well as
traffic constrains in larger cities.
In terms of passenger throughputs and aircraft movements, BCIA remains as the busiest airport
with 83.7m passenger throughput with market share of 11.1%. Xiamen and Meilan airports
outpaced the industry pace with double-digit growth, while first tier cities’ airports saw slower
growth. The different performance of tourism destination airports and commercial destination
airports may be related with stronger domestic tourism demand vs. China Government’s
limitation of conference expenses.
China’s major airports
all ranked top 30 in the
world, in terms of
cargo volume. BCIA
remained 2nd
in terms
of passengers.
Large airports grew
slower than industry
Tourism airports saw
stronger growth

China Airport Sector Update MAY 2014
Platinum Broking 7
For cargo volume, SHIA was still the busiest with a market share of 23.3%, but it was also the
most affected by weak foreign trade especially to Japan (-5.1% YoY for China-Japan foreign
trade amount in 2013).
Meanwhile, we found the aircraft movements of nearly all the selected airport (except Xiamen)
grew slower than passenger throughput growth. This may be related with the trend that airlines
are using more wide-body aircraft so as to reduce unit cost. Airports can benefit from higher
charges on the wide-body aircraft.
Exhibit 10: Operational figures of selected airports
BCIA SHIA Baiyun Hongqiao Shenzhen Xiamen Meilan Sub-total Industry
Passenger throughput 83.7 47.2 52.7 35.6 32.3 19.8 11.9 283.2 754.3
(m persons) YoY Chg 2.2% 5.2% 9.1% 5.3% 9.1% 13.9% 11.6% 6.2% 11.0%
%/industry total 11.1% 6.3% 7.0% 4.7% 4.3% 2.6% 1.6% 37.5% 100.0%
Cargo throughput 1.84 2.93 1.30 0.44 0.91 0.30 0.20 7.92 12.59
(m ton) YoY Chg 2.5% -0.3% 5.1% 1.2% 7.0% 10.3% 11.9% 2.8% 4.9%
%/industry total 14.6% 23.3% 10.4% 3.5% 7.3% 2.4% 1.6% 62.9% 100.0%
Aircraft movements 568 371 392 244 254 167 89 2,085 7,315
YoY Chg 1.9% 2.6% 5.2% 3.8% 5.8% 14.1% 11.2% 4.6% 10.8%
%/industry total 7.8% 5.1% 5.4% 3.3% 3.5% 2.3% 1.2% 28.5% 100.0%
Sources: Company Data, CAAC, Platinum Research
Exhibit 11: Operational figures
Sources: Company Data, CAAC, Platinum Research
2.3 Financial comparison
In FY13, listed airports had revenue and earnings growth of 8.0% and 13.1%, respectively, on
average. Except for Shenzhen with high CAPEX given T3’s lunch, all other airports saw
earnings grew above 10% YoY, backed by
(1) Recovery in aeronautical revenue;
(2) 40% increased aeronautical charges on international flights paid by domestic airlines
(“IFbDA”) since 1 April, 2013. The IFbDA factor is estimated to have contributed to
earning increment by 1/3~1/2 for BCIA and SHIA, respectively, in FY13. And

China Airport Sector Update MAY 2014
Platinum Broking 8
(3) Cost saving from Value Added Tax (“VAT”) trial in the airport industry. Take BCIA for
instance, the tax on company’s aeronautical revenue decreased 91.0% to RMB 7.9m,
representing tax rate of 0.2% (vs. FY12’s 6.4%).
Notably, BCIA and SHIA’s turnover growth outpaced their traffic growth; to the contrary,
Baiyun and Shenzhen failed to achieve similar turnover growth with their traffic growth. We
think this is resulted from BCIA and SHIA’s stronger bargaining power to airlines, given their
strong presence in the located area.
Exhibit 12: Financial comparison
FY13 result BCIA SHIA Xiamen Meilan Baiyun Shenzhen
Turnover (RMB’m) 7,225 5,215 1,254 760 5,141 2,546
YoY chg (%) 5.3% 10.5% 12.1% 11.1% 10.0% 3.0%
Operating profit/(loss) (RMB m) 2,284 2,511 615 391 1,315 690
Operating margin 31.6% 48.1% 49.0% 51.5% 25.6% 27.1%
Net profit 1,329 2,023 440 347 951 509
YoY chg (%) 13.3% 17.7% 16.4% 14.4% 20.2% -13.2%
Net margin 18.4% 38.8% 35.1% 45.7% 18.5% 20.0%
Sources: Company data, Platinum Research
Non-aeronautical revenue accounted for 42.7% of listed airports’ revenues in FY13, 5.0 ppts
higher than FY12. In particular, contributions from retailing and restaurants segments’ revenues
increased steadily in FY13, which were helped by both increasing business area via the airport
expansions and increasing consumption demand from tourist as well.
Exhibit 13: Revenue breakdown (FY13)
Name Total Revenue Aeronautical
(RMBm) Revenue Total Advertising Rentals Retailing Restaurants &
food shops
Ground
handling
Others
BCIA 7,225 58.2% 41.8% 10.7% 11.3% 12.2% 1.7% 1.5% 4.5%
SHIA 5,215 54.3% 45.7% 1.1% 8.4% NA 6.0%
Baiy un 5,141 54.3% 45.7% 7.2% 4.4% 3.1% 3.0% 15.7% 12.5%
Shenzhen 2,546 56.3% 43.7% 7.3% NA NA NA 24.3% 12.1%
Xiamen 1,254 63.6% 36.4% NA 23.0% NA NA 2.1% 11.3%
Meilan 760 57.0% 43.0% NA 4.4% 20.9% NA 8.9% 8.7%
Average 57.3% 42.7%
Non-Aeronautical Revenue Component as % of Total Revenue
30.2%
Comparing with international listed airports, the contribution from non-aeronautical revenue
remained low. The average non-aero revenue contribution to revenue for the listed airports was
40.6%, as compared with 3 selected global airport’s (Sydney, Franport and Hongkong) 64.0%.
The per capita figure (non-aero revenue per passenger) in China was also low at RMB36.4,
which was 71% lower than international peers. Looking ahead, given improving retail
environment and increasing disposal income of Chinese, the average spending within the
airport, especially from retailing and restaurants, is expected to support non-aeronautical
revenue growth.
Non-aeronautical
revenue will be the
key revenue growth
driver in 2014.

China Airport Sector Update MAY 2014
Platinum Broking 9
Exhibit 14: Non-aero revenue contribution Exhibit 15: Non-aero revenue per passenger
Sources: Company data, Platinum research Sources: Company data, Platinum research
2.4 Other updates
After years of development, many of the major airports have experienced bottleneck of
handling capacity. For example, airports of BCIA, SHIA, Baiyun and Shenzhen have
approaching their designed runway capacity. Therefore, many of them have expansion plans in
the pipeline.
Exhibit 16: Listed airports’ expansion and other movements
Expansions Other issues
BCIA (694.HK) 1.2nd airport expected to complete in 2018. (by parent company)
2.Fourth runway is highly expected.
SHIA (600009.CH) 1. T1 renovation to be completed in 2014.
2. 4th runway completed in 2014.
1. Shanghai FTZ launched in Oct 2013.
2. Disneyland to be completed by end 2015.
Baiyun Airport (600004.SH) 1. 3rd runway to be completed in 2014.
2. T2 to be completed in 2016.
1. Possible FTZ within Guangdong.
Shenzhen Airport
(000089.SZ)
1. T3 commercialized in Nov 13.
2. Planned expansion of 3rd runway.
1. Possible FTZ within Guangdong.
Xiamen Airport (600897.CH) 1. T4 expected to be completed in mid-2014. 1. Possible FTZ.
Meilan (357.HK) 1. New international airport commercialized in August 2013.
2. Expansion of station complex.
Sources: Company data, various sources
From the above plans, BCIA is well positioned among the peers as the airport had finished its
expansion plans, thus lower CAPEX required in the short run and less pressures on BCIA’s
profitability. While Baiyun Airport is facing more CAPEX pressures in FY14, as the T2 and
3rd runway were under construction.
The Free Trade Zone (“FTZ”) topic is the main share price driver for airports in late 2013.
Given China (Shanghai) Pilot Free Trade Zone (“Shanghai FTZ”) getting approval on 22 Aug
2013, shares of SHIA moved up by 23.6% in two months. Besides Shanghai, Guangdong,
Fujian, Tianjing and other 16 provinces have submitted their FTZ plans as well. On the
expectation for more foreign trade activities in FTZ areas, related airports may benefit from
boosted passenger and cargo volume.

China Airport Sector Update MAY 2014
Platinum Broking 10
SECTION 3 Stock Recommendation
China’s airport sector is expected to see steady growth in passenger throughput and cargo
volume backed by macroeconomic stability and increasing tourist demand. The
non-aeronautical business is also expected to grow rapidly.
The share price performance of listed Chinese airports was mixed in 2013. Currently, the
airport sector is trading at an average FY14E PER of 13.1x and 11.5x for H-share and A-share
respectively, and FY14E PBR is 1.1x and 1.2x respectively.
Among the six listed airports, SHIA is our top pick among 4 A-share listed airports, whilst
BCIA is our top pick in Hong Kong Listed, given their:
(1) High exposure to international flight to meet the fast-growing demand from outbound
tourist;
(2) High non-aeronautical income contribution; and
(3) Strong bargaining power with airlines, so as to enjoy higher returns on traffic growth.
Exhibit 17: QT of listed airports
Name TickerMkt cap
(HK$m)
Closing
price
(HK$)
52-week
High/Lo
w (HK$)
6M
Volume
(m shrs)
FY13
PER (x)
FY14E
PER (x)
FY15E
PER (x)
FY13
PBR (x)
FY14E
PBR (x)
FY15E
PBR (x)
FY13
EV/EBITD
A (x)
FY14E
EV/EBITD
A (x)
FY15E
EV/EBITD
A (x)
HK listed
1 BCIA 694 HK 23,690 5.47 6.8 / 4.26 4.82 14.42 13.04 11.47 1.20 1.11 1.05 8.77 6.01 5.60
2 Meilan 357 HK 3,454 7.30 8.85 / 6.53 0.34 8.06 - - 1.04 - - 5.74 - -
Simple avg 11.24 13.04 11.47 1.12 1.11 1.05 7.25 6.01 5.60
Mkt cap wtd avg 13.61 13.04 11.47 1.18 1.11 1.05 8.38 6.01 5.60
China listed
1 SHIA 600009 CH 32,212 16.7221.67 / 14.07 7.82 17.88 11.99 10.63 1.97 1.39 1.27 10.44 6.86 6.20
2 Baiyun 600004 CH 9,934 8.64 9.55 / 7.41 4.82 10.88 7.96 7.52 1.29 0.95 0.87 4.68 3.48 3.24
3 Shenzhen 000089 CH 7,812 4.62 6.01 / 4.11 4.12 20.46 17.84 12.79 1.11 0.77 0.73 10.62 6.96 6.37
4 Xiamen 600897 CH 5,349 17.96 21 / 14.18 1.70 11.95 8.85 7.59 2.01 1.47 1.29 6.50 3.98 3.54
Simple avg 15.29 11.66 9.63 1.59 1.14 1.04 8.06 5.32 4.83
Mkt cap wtd avg 16.41 11.79 10.08 1.73 1.23 1.13 9.05 5.98 5.43
Global listed
1 Sydney Airport SYD AU 70,455 31.7931.79 / 23.72 8.38 1184.56 53.29 45.52 30.77 6.28 7.99 111.76 16.81 15.90
2 Airports Of Thailand PclAOT TB 64,790 45.3553.71 / 30.55 5.84 3.47 22.35 18.72 0.62 2.78 2.54 2.95 12.57 10.87
3 Malaysia Airports Hldgs BhdMAHB MK 26,420 19.2323.42 / 14.34 2.06 53.69 24.78 22.12 4.38 1.90 1.80 32.31 13.72 12.12
Simple avg 413.91 33.47 28.79 11.92 3.65 4.11 49.01 14.37 12.96
Mkt cap wtd avg 526.41 36.23 30.96 14.38 4.16 4.79 55.17 14.60 13.27
NameFY13 PSR
(x)
FY14E
PSR (x)
FY15E
PSR (x)
FY13
Yield (%)
FY14E
Yield (%)
FY15E
Yield (%)
FY13
ROA (%)
FY14E
ROA (%)
FY15E
ROA (%)
FY13
ROE (%)
FY14E
ROE (%)
FY15E
ROE (%)
FY16E
ROE (%)
FY13 Net
gearing
(%)
HK listed
1 BCIA 2.69 2.49 2.37 2.79 3.05 3.48 5.00 4.19 4.84 10.52 8.65 9.21 9.30 72.83
2 Meilan 3.72 - - 1.43 - - 8.93 - - 16.77 - - - (14.28)
Simple avg 3.20 2.49 2.37 2.11 3.05 3.48 6.97 4.19 4.84 13.65 8.65 9.21 9.30 29.27
Mkt cap wtd avg 2.82 2.49 2.37 2.62 3.05 3.48 5.50 4.19 4.84 11.32 8.65 9.21 9.30 -
China listed
1 SHIA 6.54 4.53 4.09 2.23 2.60 2.95 11.56 9.70 10.15 14.24 11.68 12.15 12.67 (24.69)
2 Baiyun 1.96 1.45 1.36 5.33 5.69 4.68 11.09 9.70 8.30 14.90 11.84 11.69 11.67 (22.21)
3 Shenzhen 3.45 2.09 1.90 0.94 0.54 1.43 5.62 2.10 4.30 8.27 3.69 5.73 6.60 17.79
4 Xiamen 4.16 2.92 2.47 3.12 3.12 3.81 19.02 14.30 13.90 22.90 17.76 17.53 - 0.00
Simple avg 4.03 2.75 2.46 2.91 2.99 3.22 11.82 8.95 9.16 15.08 11.24 11.78 10.31 (7.28)
Mkt cap wtd avg 5.05 3.48 3.13 2.69 2.91 3.13 11.36 9.07 9.35 14.35 11.17 11.68 11.52 -
Global listed
1 Sydney Airport 53.03 8.13 7.70 5.15 5.45 5.81 2.76 5.21 5.63 15.28 10.68 15.34 24.78 329.48
2 Airports Of Thailand Pcl 1.54 6.91 6.12 1.47 1.88 2.06 2.58 7.99 8.81 4.61 12.70 13.96 15.03 (2.98)
3 Malaysia Airports Hldgs Bhd4.97 3.24 3.08 1.47 1.94 2.25 9.34 3.52 3.76 20.00 7.90 8.08 8.90 78.27
Simple avg 19.85 6.10 5.63 2.70 3.09 3.38 4.89 5.57 6.07 13.30 10.43 12.46 16.24 134.92
Mkt cap wtd avg 24.54 6.84 6.31 3.07 3.44 3.73 3.76 6.05 6.60 11.78 11.03 13.60 18.28 -
Note:Price and market cap as of 7 May 2014
Sources: Bloomberg, Platinum Research
China Airport Sector Update MAY 2014
Platinum Broking 11
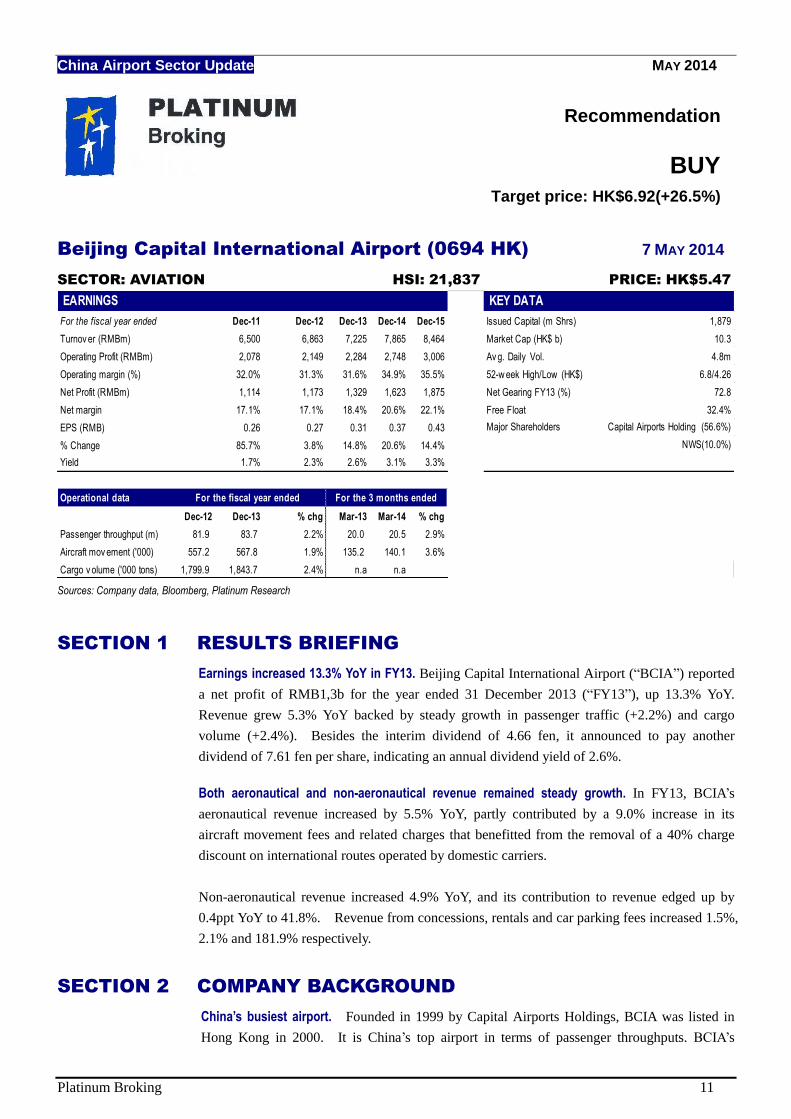
Recommendation
BUY
Target price: HK$6.92(+26.5%)
Beijing Capital International Airport (0694 HK) 7 MAY 2014
SECTOR: AVIATION HSI: 21,837 PRICE: HK$5.47
EARNINGS KEY DATA
For the fiscal year ended Dec-11 Dec-12 Dec-13 Dec-14 Dec-15 Issued Capital (m Shrs)
Turnov er (RMBm) 6,500 6,863 7,225 7,865 8,464 Market Cap (HK$ b)
Operating Profit (RMBm) 2,078 2,149 2,284 2,748 3,006 Av g. Daily Vol.
Operating margin (%) 32.0% 31.3% 31.6% 34.9% 35.5% 52-w eek High/Low (HK$)
Net Profit (RMBm) 1,114 1,173 1,329 1,623 1,875 Net Gearing FY13 (%)
Net margin 17.1% 17.1% 18.4% 20.6% 22.1% Free Float
EPS (RMB) 0.26 0.27 0.31 0.37 0.43
% Change 85.7% 3.8% 14.8% 20.6% 14.4%
Yield 1.7% 2.3% 2.6% 3.1% 3.3%
Operational data
Dec-12 Dec-13 % chg Mar-13 Mar-14 % chg
Passenger throughput (m) 81.9 83.7 2.2% 20.0 20.5 2.9%
Aircraft mov ement ('000) 557.2 567.8 1.9% 135.2 140.1 3.6%
Cargo v olume ('000 tons) 1,799.9 1,843.7 2.4% n.a n.a
10.3
For the fiscal year ended For the 3 months ended
1,879
4.8m
6.8/4.26
72.8
32.4%
Capital Airports Holding (56.6%)
NWS(10.0%)
Major Shareholders
Sources: Company data, Bloomberg, Platinum Research
SECTION 1 RESULTS BRIEFING
Earnings increased 13.3% YoY in FY13. Beijing Capital International Airport (“BCIA”) reported
a net profit of RMB1,3b for the year ended 31 December 2013 (“FY13”), up 13.3% YoY.
Revenue grew 5.3% YoY backed by steady growth in passenger traffic (+2.2%) and cargo
volume (+2.4%). Besides the interim dividend of 4.66 fen, it announced to pay another
dividend of 7.61 fen per share, indicating an annual dividend yield of 2.6%.
Both aeronautical and non-aeronautical revenue remained steady growth. In FY13, BCIA’s
aeronautical revenue increased by 5.5% YoY, partly contributed by a 9.0% increase in its
aircraft movement fees and related charges that benefitted from the removal of a 40% charge
discount on international routes operated by domestic carriers.
Non-aeronautical revenue increased 4.9% YoY, and its contribution to revenue edged up by
0.4ppt YoY to 41.8%. Revenue from concessions, rentals and car parking fees increased 1.5%,
2.1% and 181.9% respectively.
SECTION 2 COMPANY BACKGROUND
China’s busiest airport. Founded in 1999 by Capital Airports Holdings, BCIA was listed in
Hong Kong in 2000. It is China’s top airport in terms of passenger throughputs. BCIA’s

China Airport Sector Update MAY 2014
Platinum Broking 12
passenger throughput reached 83.7m in 2013, accounted for approximately 11.2% of the
national total. According to Airports Council Intentional (“ACI”), BCIA also ranked second in
the world in terms of passengers. There are about 1,400 flights of over 70 airlines connecting
Beijing with 191 cities globally. It currently has 3 terminals, 3 runways and 2 controlling
towers.
Exhibit 1: Corporate chart
NWS Holding Capital Airports Holding
BCIA (694.HK)
Civil Aviation Administration of China(CAAC)
Public investors
56.6%10.0% 32.9%
Sources: Company Data
SECTION 3 BUSINESS OUTLOOK
Stable growth in aeronautical activities. BCIA’s passenger throughput and aircraft movement
increased steadily at 2.2% YoY and 1.9% YoY respectively in 2013. In 2H13, the international
aircrafts movement showed a higher growth than the domestic’s, which was mainly driving by
the outbound tourist demand in Beijing. After boosted outbound tourist growth in 2012 (2.7m,
up 48.3% YoY), Beijing outbound tourists continued to increase 21.5% YoY to 3.7m in 2013
(3.5ppts higher than the national average), which became the key passenger throughput growth
driver for BCIA. Looking ahead, back by the higher disposal income, the tourist demand in
Beijing will continue to increase, especially for outbound travel. Also, it will be the key
aeronautical revenue growth driver within FY14.
Exhibit 2: Monthly passenger throughputs and YoY chg (m) Exhibit 3: Monthly aircraft movement and YoY chg
Sources: Company data Sources: Company data.
Outbound tourist to
help keep steady
aeronautical
income.
China Airport Sector Update MAY 2014
Platinum Broking 13
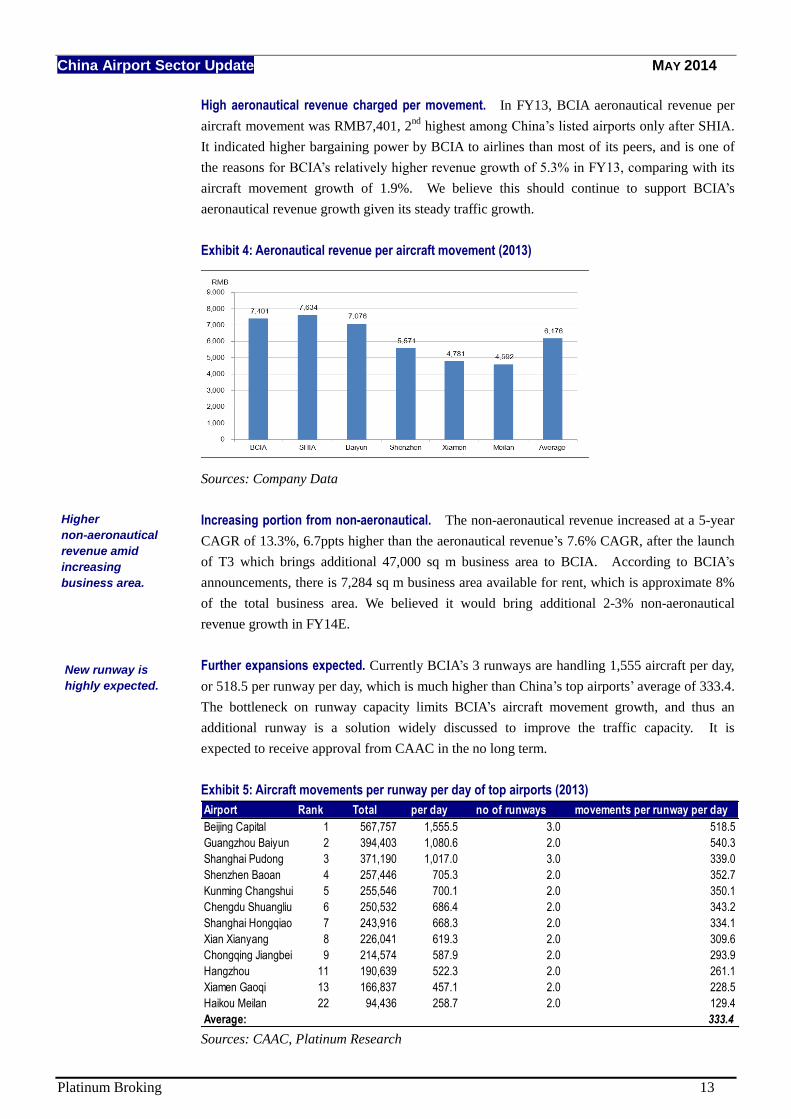
High aeronautical revenue charged per movement. In FY13, BCIA aeronautical revenue per
aircraft movement was RMB7,401, 2nd
highest among China’s listed airports only after SHIA.
It indicated higher bargaining power by BCIA to airlines than most of its peers, and is one of
the reasons for BCIA’s relatively higher revenue growth of 5.3% in FY13, comparing with its
aircraft movement growth of 1.9%. We believe this should continue to support BCIA’s
aeronautical revenue growth given its steady traffic growth.
Exhibit 4: Aeronautical revenue per aircraft movement (2013)
Sources: Company Data
Increasing portion from non-aeronautical. The non-aeronautical revenue increased at a 5-year
CAGR of 13.3%, 6.7ppts higher than the aeronautical revenue’s 7.6% CAGR, after the launch
of T3 which brings additional 47,000 sq m business area to BCIA. According to BCIA’s
announcements, there is 7,284 sq m business area available for rent, which is approximate 8%
of the total business area. We believed it would bring additional 2-3% non-aeronautical
revenue growth in FY14E.
Further expansions expected. Currently BCIA’s 3 runways are handling 1,555 aircraft per day,
or 518.5 per runway per day, which is much higher than China’s top airports’ average of 333.4.
The bottleneck on runway capacity limits BCIA’s aircraft movement growth, and thus an
additional runway is a solution widely discussed to improve the traffic capacity. It is
expected to receive approval from CAAC in the no long term.
Exhibit 5: Aircraft movements per runway per day of top airports (2013)
Airport Rank Total per day no of runways movements per runway per day
Beijing Capital 1 567,757 1,555.5 3.0 518.5
Guangzhou Baiyun 2 394,403 1,080.6 2.0 540.3
Shanghai Pudong 3 371,190 1,017.0 3.0 339.0
Shenzhen Baoan 4 257,446 705.3 2.0 352.7
Kunming Changshui 5 255,546 700.1 2.0 350.1
Chengdu Shuangliu 6 250,532 686.4 2.0 343.2
Shanghai Hongqiao 7 243,916 668.3 2.0 334.1
Xian Xianyang 8 226,041 619.3 2.0 309.6
Chongqing Jiangbei 9 214,574 587.9 2.0 293.9
Hangzhou 11 190,639 522.3 2.0 261.1
Xiamen Gaoqi 13 166,837 457.1 2.0 228.5
Haikou Meilan 22 94,436 258.7 2.0 129.4
Average: 333.4
Sources: CAAC, Platinum Research
New runway is
highly expected.
Higher
non-aeronautical
revenue amid
increasing
business area.

China Airport Sector Update MAY 2014
Platinum Broking 14
In addition, the State Council in 2012 approved the construction proposal of second airport of
Beijing in Daxing District (close to Hebei Province), with expectation to start operation in
2018. It is reported to start household relocation in Jan 2014. BCIA is not expected to be
involved with the construction, thus no CAPEX on this issue. We believed BCIA would be
the operator of the new airport after the completion, in certain terms of agreement with its
parent company, and can be benefitted from increasing capacities and business areas.
Exhibit 6: BCIA revenue breakdown Exhibition 7: Map of 2nd airport in Beijing
Sources: Company data Sources: Google
Exhibit 8: BCIA capacity
Aircraft movement Passenger throughput Cargo throughput
(m) (m tons)
1st airport (2013)(% YoY) 567,750 (+1.9%) 83.7 (+2.2%) 1.84 (+2.5%)
2nd airport (2018 target) 620,000 45 1.5
2nd airport (longer target) 840,000 100 2.4
Note *: As of 2013 figure.
Sources: BCIA, CARNOC, Platinum Research
Shareholder changed. NWS Holdings Limited (659.HK) purchased BCIA’s 8.8% stake from
GIC for a total consideration of HK$2.4b in December 2013. It indicated a price of HK$6.15
per share, which was only a small discount of 2.1% to the closing price before the
announcement. In addition, NWS further increased its shareholding in BCIA to 10.0% in
February 2014, reported by news. NWS’s experience in construction area is expected to help
BCIA or its parent group for the expansion of existing terminals and construction of the second
airport. Regarding to the GIC, we believed GIC is changing its portfolio strategy on China’s
airport, since GIC also sold its shareholding in SHIA in the A share market in 1H13.
Tianjin Hebei
Beijing 2nd
airport to
be completed in
2018.
New major
shareholder strong
at construction.

China Airport Sector Update MAY 2014
Platinum Broking 15
SECTION 5 VALUATION
Exhibition 9: Relative valuation of listed airports
Name TickerMkt cap
(HK$m)
Closing
price
(HK$)
52-week
High/Lo
w (HK$)
6M
Volume
(m shrs)
FY13
PER (x)
FY14E
PER (x)
FY15E
PER (x)
FY13
PBR (x)
FY14E
PBR (x)
FY15E
PBR (x)
FY13
EV/EBITD
A (x)
FY14E
EV/EBITD
A (x)
FY15E
EV/EBITD
A (x)
HK listed
1 BCIA 694 HK 23,690 5.47 6.8 / 4.26 4.82 14.42 13.04 11.47 1.20 1.11 1.05 8.77 6.01 5.60
2 Meilan 357 HK 3,454 7.30 8.85 / 6.53 0.34 8.06 - - 1.04 - - 5.74 - -
Simple avg 11.24 13.04 11.47 1.12 1.11 1.05 7.25 6.01 5.60
Mkt cap wtd avg 13.61 13.04 11.47 1.18 1.11 1.05 8.38 6.01 5.60
China listed
1 SHIA 600009 CH 32,212 16.7221.67 / 14.07 7.82 17.88 11.99 10.63 1.97 1.39 1.27 10.44 6.86 6.20
2 Baiyun 600004 CH 9,934 8.64 9.55 / 7.41 4.82 10.88 7.96 7.52 1.29 0.95 0.87 4.68 3.48 3.24
3 Shenzhen 000089 CH 7,812 4.62 6.01 / 4.11 4.12 20.46 17.84 12.79 1.11 0.77 0.73 10.62 6.96 6.37
4 Xiamen 600897 CH 5,349 17.96 21 / 14.18 1.70 11.95 8.85 7.59 2.01 1.47 1.29 6.50 3.98 3.54
Simple avg 15.29 11.66 9.63 1.59 1.14 1.04 8.06 5.32 4.83
Mkt cap wtd avg 16.41 11.79 10.08 1.73 1.23 1.13 9.05 5.98 5.43
Global listed
1 Sydney Airport SYD AU 70,455 31.7931.79 / 23.72 8.38 1184.56 53.29 45.52 30.77 6.28 7.99 111.76 16.81 15.90
2 Airports Of Thailand PclAOT TB 64,790 45.3553.71 / 30.55 5.84 3.47 22.35 18.72 0.62 2.78 2.54 2.95 12.57 10.87
3 Malaysia Airports Hldgs BhdMAHB MK 26,420 19.2323.42 / 14.34 2.06 53.69 24.78 22.12 4.38 1.90 1.80 32.31 13.72 12.12
Simple avg 413.91 33.47 28.79 11.92 3.65 4.11 49.01 14.37 12.96
Mkt cap wtd avg 526.41 36.23 30.96 14.38 4.16 4.79 55.17 14.60 13.27
NameFY13 PSR
(x)
FY14E
PSR (x)
FY15E
PSR (x)
FY13
Yield (%)
FY14E
Yield (%)
FY15E
Yield (%)
FY13
ROA (%)
FY14E
ROA (%)
FY15E
ROA (%)
FY13
ROE (%)
FY14E
ROE (%)
FY15E
ROE (%)
FY16E
ROE (%)
FY13 Net
gearing
(%)
HK listed
1 BCIA 2.69 2.49 2.37 2.79 3.05 3.48 5.00 4.19 4.84 10.52 8.65 9.21 9.30 72.83
2 Meilan 3.72 - - 1.43 - - 8.93 - - 16.77 - - - (14.28)
Simple avg 3.20 2.49 2.37 2.11 3.05 3.48 6.97 4.19 4.84 13.65 8.65 9.21 9.30 29.27
Mkt cap wtd avg 2.82 2.49 2.37 2.62 3.05 3.48 5.50 4.19 4.84 11.32 8.65 9.21 9.30 -
China listed
1 SHIA 6.54 4.53 4.09 2.23 2.60 2.95 11.56 9.70 10.15 14.24 11.68 12.15 12.67 (24.69)
2 Baiyun 1.96 1.45 1.36 5.33 5.69 4.68 11.09 9.70 8.30 14.90 11.84 11.69 11.67 (22.21)
3 Shenzhen 3.45 2.09 1.90 0.94 0.54 1.43 5.62 2.10 4.30 8.27 3.69 5.73 6.60 17.79
4 Xiamen 4.16 2.92 2.47 3.12 3.12 3.81 19.02 14.30 13.90 22.90 17.76 17.53 - 0.00
Simple avg 4.03 2.75 2.46 2.91 2.99 3.22 11.82 8.95 9.16 15.08 11.24 11.78 10.31 (7.28)
Mkt cap wtd avg 5.05 3.48 3.13 2.69 2.91 3.13 11.36 9.07 9.35 14.35 11.17 11.68 11.52 -
Global listed
1 Sydney Airport 53.03 8.13 7.70 5.15 5.45 5.81 2.76 5.21 5.63 15.28 10.68 15.34 24.78 329.48
2 Airports Of Thailand Pcl 1.54 6.91 6.12 1.47 1.88 2.06 2.58 7.99 8.81 4.61 12.70 13.96 15.03 (2.98)
3 Malaysia Airports Hldgs Bhd4.97 3.24 3.08 1.47 1.94 2.25 9.34 3.52 3.76 20.00 7.90 8.08 8.90 78.27
Simple avg 19.85 6.10 5.63 2.70 3.09 3.38 4.89 5.57 6.07 13.30 10.43 12.46 16.24 134.92
Mkt cap wtd avg 24.54 6.84 6.31 3.07 3.44 3.73 3.76 6.05 6.60 11.78 11.03 13.60 18.28 -
Note:Price and market cap as of 7 May 2014
Sources: Bloomberg
BCIA is currently traded at a FY14E PER of 13.0x, which is at a premium of 10.6% compared
to the A-share listed peers average of 11.8x, but 64.0% discount to Asia-Pacific listed peers.
We preferred BCIA as (1) strong aeronautical revenue growth backed by the boosted outbound
tourist demand in China, (2) high aeronautical revenue per aircraft movement, (3) stable
non-aeronautical revenue driven by the additional business area, (4) possible expansion of the
4th runway to increase traffic capacity, and (5) relatively low valuation to Asia-Pacific peers.
Therefore, we value BCIA at 15x FY14E PER, middle end of the historical PER or 58.6%
discount to Asia-Pacific peers. We have a target price for BCIA at HK$6.92, an upside
potential of 26.5%. BUY .

China Airport Sector Update MAY 2014
Platinum Broking 16
Exhibition 10: BCIA 2-year Price Chart
Sources: Reuters
China Airport Sector Update MAY 2014
Platinum Broking 17
Appendix
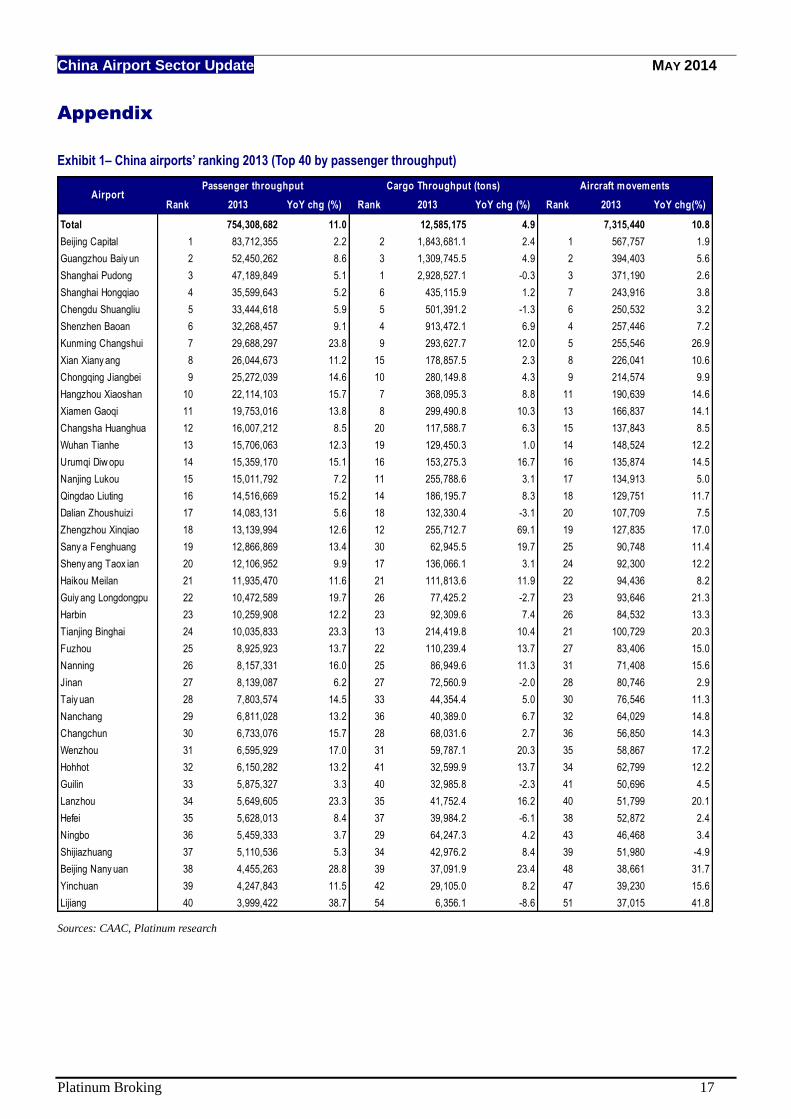
Exhibit 1– China airports’ ranking 2013 (Top 40 by passenger throughput)
Rank 2013 YoY chg (%) Rank 2013 YoY chg (%) Rank 2013 YoY chg(%)
Total 754,308,682 11.0 12,585,175 4.9 7,315,440 10.8
Beijing Capital 1 83,712,355 2.2 2 1,843,681.1 2.4 1 567,757 1.9
Guangzhou Baiy un 2 52,450,262 8.6 3 1,309,745.5 4.9 2 394,403 5.6
Shanghai Pudong 3 47,189,849 5.1 1 2,928,527.1 -0.3 3 371,190 2.6
Shanghai Hongqiao 4 35,599,643 5.2 6 435,115.9 1.2 7 243,916 3.8
Chengdu Shuangliu 5 33,444,618 5.9 5 501,391.2 -1.3 6 250,532 3.2
Shenzhen Baoan 6 32,268,457 9.1 4 913,472.1 6.9 4 257,446 7.2
Kunming Changshui 7 29,688,297 23.8 9 293,627.7 12.0 5 255,546 26.9
Xian Xiany ang 8 26,044,673 11.2 15 178,857.5 2.3 8 226,041 10.6
Chongqing Jiangbei 9 25,272,039 14.6 10 280,149.8 4.3 9 214,574 9.9
Hangzhou Xiaoshan 10 22,114,103 15.7 7 368,095.3 8.8 11 190,639 14.6
Xiamen Gaoqi 11 19,753,016 13.8 8 299,490.8 10.3 13 166,837 14.1
Changsha Huanghua 12 16,007,212 8.5 20 117,588.7 6.3 15 137,843 8.5
Wuhan Tianhe 13 15,706,063 12.3 19 129,450.3 1.0 14 148,524 12.2
Urumqi Diw opu 14 15,359,170 15.1 16 153,275.3 16.7 16 135,874 14.5
Nanjing Lukou 15 15,011,792 7.2 11 255,788.6 3.1 17 134,913 5.0
Qingdao Liuting 16 14,516,669 15.2 14 186,195.7 8.3 18 129,751 11.7
Dalian Zhoushuizi 17 14,083,131 5.6 18 132,330.4 -3.1 20 107,709 7.5
Zhengzhou Xinqiao 18 13,139,994 12.6 12 255,712.7 69.1 19 127,835 17.0
Sany a Fenghuang 19 12,866,869 13.4 30 62,945.5 19.7 25 90,748 11.4
Sheny ang Taox ian 20 12,106,952 9.9 17 136,066.1 3.1 24 92,300 12.2
Haikou Meilan 21 11,935,470 11.6 21 111,813.6 11.9 22 94,436 8.2
Guiy ang Longdongpu 22 10,472,589 19.7 26 77,425.2 -2.7 23 93,646 21.3
Harbin 23 10,259,908 12.2 23 92,309.6 7.4 26 84,532 13.3
Tianjing Binghai 24 10,035,833 23.3 13 214,419.8 10.4 21 100,729 20.3
Fuzhou 25 8,925,923 13.7 22 110,239.4 13.7 27 83,406 15.0
Nanning 26 8,157,331 16.0 25 86,949.6 11.3 31 71,408 15.6
Jinan 27 8,139,087 6.2 27 72,560.9 -2.0 28 80,746 2.9
Taiy uan 28 7,803,574 14.5 33 44,354.4 5.0 30 76,546 11.3
Nanchang 29 6,811,028 13.2 36 40,389.0 6.7 32 64,029 14.8
Changchun 30 6,733,076 15.7 28 68,031.6 2.7 36 56,850 14.3
Wenzhou 31 6,595,929 17.0 31 59,787.1 20.3 35 58,867 17.2
Hohhot 32 6,150,282 13.2 41 32,599.9 13.7 34 62,799 12.2
Guilin 33 5,875,327 3.3 40 32,985.8 -2.3 41 50,696 4.5
Lanzhou 34 5,649,605 23.3 35 41,752.4 16.2 40 51,799 20.1
Hefei 35 5,628,013 8.4 37 39,984.2 -6.1 38 52,872 2.4
Ningbo 36 5,459,333 3.7 29 64,247.3 4.2 43 46,468 3.4
Shijiazhuang 37 5,110,536 5.3 34 42,976.2 8.4 39 51,980 -4.9
Beijing Nany uan 38 4,455,263 28.8 39 37,091.9 23.4 48 38,661 31.7
Yinchuan 39 4,247,843 11.5 42 29,105.0 8.2 47 39,230 15.6
Lijiang 40 3,999,422 38.7 54 6,356.1 -8.6 51 37,015 41.8
AirportPassenger throughput Cargo Throughput (tons) Aircraft movements
Sources: CAAC, Platinum research

China Airport Sector Update MAY 2014
Platinum Broking 18
Appendix
Exhibit 2– China’s airports location
Sources: CAAC, Platinum research

China Airport Sector Update MAY 2014
Platinum Broking 19
This page has been intentionally left blank

China Airport Sector Update MAY 2014
Platinum Broking 20
IMPORTANT HONG KONG REGULATORY DISCLOSURES ON HONG KONG LISTED COMPANIES OF
WHICH WE HAVE COMMENTED ON. Research Certification. No part of the compensation of the analyst(s)’ who are primarily responsible for
producing this report was, is, or will be directly or indirectly related to the specific recommendations or views
expressed by the analyst(s)’ in this research.
Market Making. This firm does not make a market in securities of the companies covered in this report.
Conflicts of Interest. This firm does not own 1% or more of the common class of securities of the companies
covered in this report. The analysts involved in the preparation of this report do not have financial interests in the
common class of securities of the companies covered in this report.
Investment Banking. Within the past 12 months a company controlled by the holding company of this firm has
not provided investment banking services to, and received compensation from, one of the companies covered in this
report.
Relevant relationships. This firm and individuals employed by or associated with the firm are not officers of the
companies covered in this report.
GENERAL DISCLOSURES.
This report is for distribution only under such circumstances and in such jurisdictions as may be permitted by applicable law. This report is not intended to offer or solicit purchase or sale of any financial instrument in any jurisdiction where such an offer or solicitation would be illegal, including but not limited to the United States of America and the United Kingdom and the rest of Europe. It does not take into account the specific investment objectives, financial situation or needs of any specific recipient. While reasonable effort has been made to ensure the information contained herein is not untrue or misleading at the time of publication, its correctness and completeness are not guaranteed, and they are subject to change without notice. Neither Platinum Broking Company Limited, nor any of its holding or affiliated companies, nor any of its or their directors or employees, represent or warrant the accuracy or completeness of the information contained herein or as to the existence of other facts which may be significant, and will not accept any responsibility or liability whatsoever for any use of or reliance upon this publication or any of the contents thereof. Use of any information herein shall be at the sole discretion and risk of the user. Investors are expected to make their own investment decisions without relying on this publication.
This report is produced by Platinum Broking Company Limited
Hong Kong Office: 21/F LHT Tower, 31 Queen’s Road Central, Hong Kong Telephone: 852-2841-7000 Fax: 852-2522-3500 www.Platinum-Asia.com
Shanghai Office: Platinum Holdings Company Ltd (Shanghai Representative Office), 11B Jin Ming Building,
Block 2, 8 South Zun Yi Road, Shanghai 200336 Tel: 8621-6208-5511 Fax: 8621-6270-1871
Singapore Office: Platinum Securities Company Ltd, 1 Scotts Road, #24-14 Shaw Centre, Singapore 228208
Tel: 65-6220-5955 Fax: 65-6220-7737 © 2014 Platinum Broking Company Limited. All rights reserved. This publication may not be reproduced, distributed or published by any person for any purpose without the prior express consent of Platinum Broking Company Limited.