Embed Size (px)
Citation preview
Chilled water Meyrin consolidation Study1st Part
Many thanks for their contribution to:Pasquale Alemanno, Fortunato Candito, Alexander Putzu
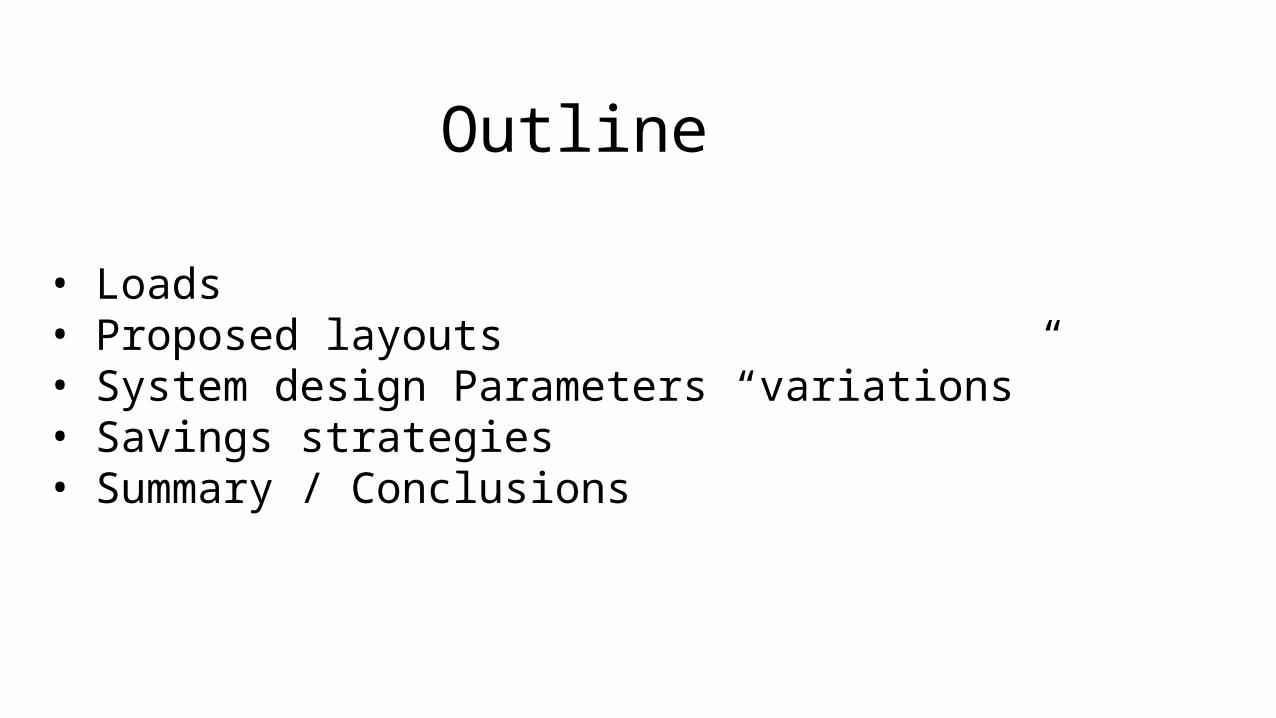
Outline
• Loads• Proposed layouts• System design Parameters “variations”• Savings strategies• Summary / Conclusions
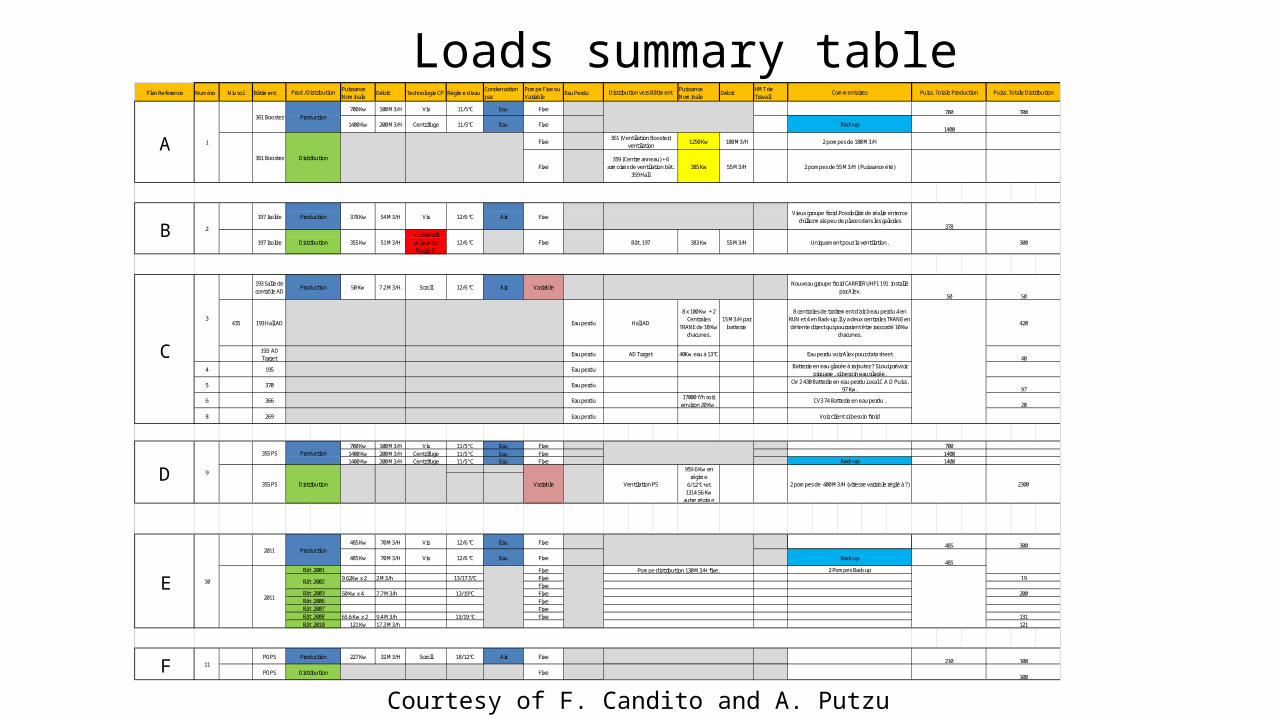
Plan Reference Numéro Niv sol BâtimentPuissance Nominale
Débit Technologie CP Régime d'eauCondensation par
Pompe Fixe ou Variable
Eau PerduPuissance Nominale
DébitHMT de Travail
700 Kw 100 M3/H Vis 11/5°C Eau Fixe
1400 Kw 200 M3/H Centrifuge 11/5°C Eau Fixe
Fixe 1250 Kw 180 M3/H
Fixe 385 Kw 55 M3/H
700 Kw 100 M3/H Vis 11/5° C Eau Fixe1400 Kw 200 M3/H Centrifuge 11/5° C Eau Fixe1400 Kw 200 M3/H Centrifuge 11/5° C Eau Fixe
485 Kw 70 M3/H Vis 12/6 °C Eau Fixe
485 Kw 70 M3/H Vis 12/6 °C Eau Fixe
Fixe9.62Kw x 2 2 M3/h 13/17.5°C Fixe
Fixe50 Kw x 4 7.7 M3/h 13/19°C Fixe
FixeFixe
65.6 Kw x 2 9.4 M3/h 13/19 °C Fixe121 Kw 17.3 M3/h
Prod./Distribution
435
Production
Production
361 Booster Distribution
Puiss. Totale Production
100
50
Puiss. Totale Distribution
700
1400
700
378
300
420
40
97
20
A
B
C
D
E
F
9
8
6
11
1
10
POPS Production
12/6 °C
Scroll
193 Hall AD
193 Salle de contrôle AD
50
12/6 °C51 M3/H355 Kw
2 Pompes Back up
POPS Distribution
18/12°C Air227 Kw 32 M3/H
55 M3/H Uniquement pour la ventilation.
Eau perdu voir Alex pour data sheet
Ventilation PSVariable
Voir client si besoin froid
Batterie en eau glacée à rajouter ? Si oui prévoir piquage , si besoin eau glacée.
CW2 430 Batterie en eau perdu.Local C.A.O Puiss. 97 Kw.
CV3 74 Batterie en eau perdu .
2 pompes de 400 M3/H (vitesse variable réglé à ?)
Air
Air
959.6 Kw en régime
6/12°C+et 1314.56 Kw
autre régime
Nouveau groupe froid CARRIER UHF1 191 installé par Alex.
8 centrales de traitement d'air à eau perdu.4 en RUN et 4 en Back-up.Il y a deux centrales TRANE en détente direct qui pourraient être raccordé 10 Kw
chacunes.
Hall AD
8 x 100 Kw + 2 Centrales
TRANE de 10 Kw chacunes.
50 Kw Scroll
355 PS Distribution
193 AD Target
AD Target
195
2011
Back-up
3
4
5
40Kw eau à 13°C
197 Isolde Distribution Bât. 197
355 PS ProductionBack-up
7.2 M3/H.
2 pompes de 180 M3/H
2 pompes de 55 M3/H ( Puissance été)
361 Booster
15 M3/H par batterie
7001400
197 Isolde Production
383 Kw
378 Kw 54 M3/H
370
17000 f/h soit environ 20 Kw.
269
366
2300
121131
300
100
210
19
200
1400
485
485
Fixe
Fixe
Eau perdu
Eau perdu
Eau perdu
Eau perdu
Eau perdu
Eau perdu
2011
Bât .2010
Bât .2002
Bât .2008
Bât .2006Bât .2007
Bât .2003
Bât .2001 Pompe distribution 130 M3/H fixe.
ProductionBack-up
Distribution vers Bâtiment Commentaires
12/6 °C
361 (Ventilation Booster) ventilation
359 (Centre anneau) + 6 armoires de ventilation bât.
359 Hall
2
Vieux groupe froid.Possibilité de réalimenter ce chiller mais peu de places dans les galeries
Vis
Voir détail puissance Foglio 3.
Fixe
Fixe
Variable
Loads summary table
Courtesy of F. Candito and A. Putzu
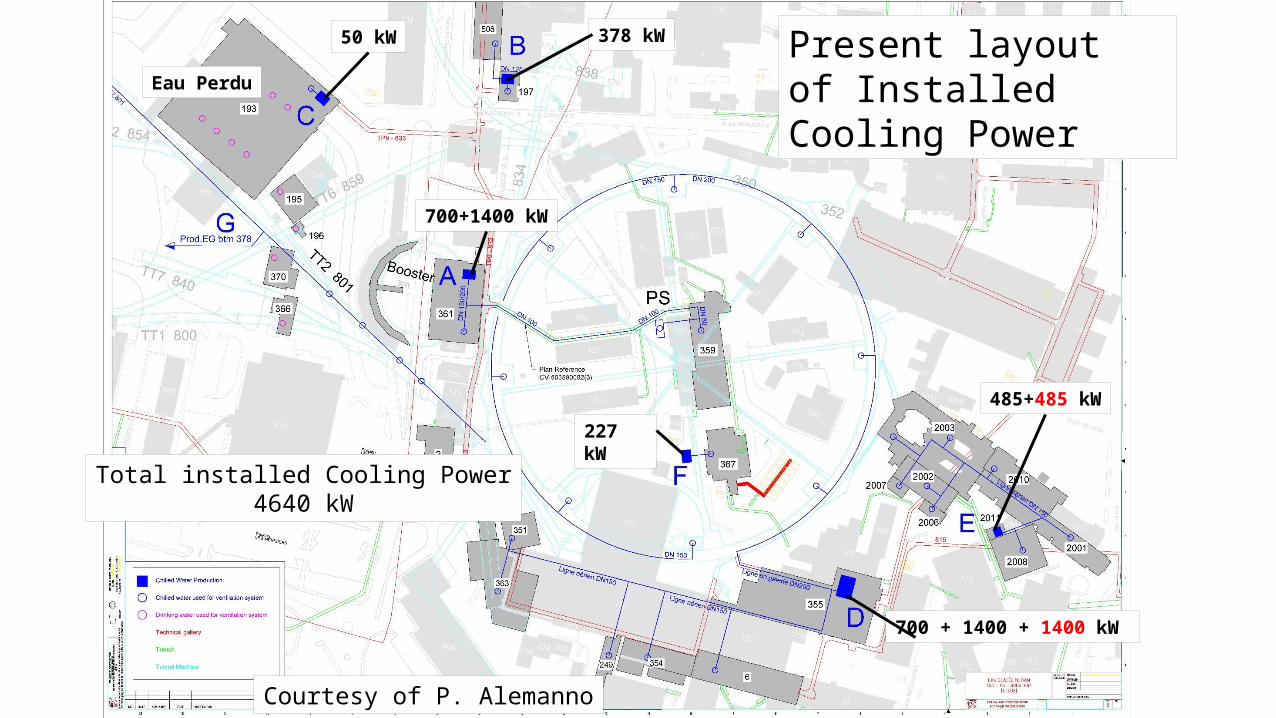
Present layout of Installed Cooling Power
378 kW
700+1400 kW
227 kW
485+485 kW
700 + 1400 + 1400 kW
50 kW
Eau Perdu
Total installed Cooling Power4640 kW
Courtesy of P. Alemanno
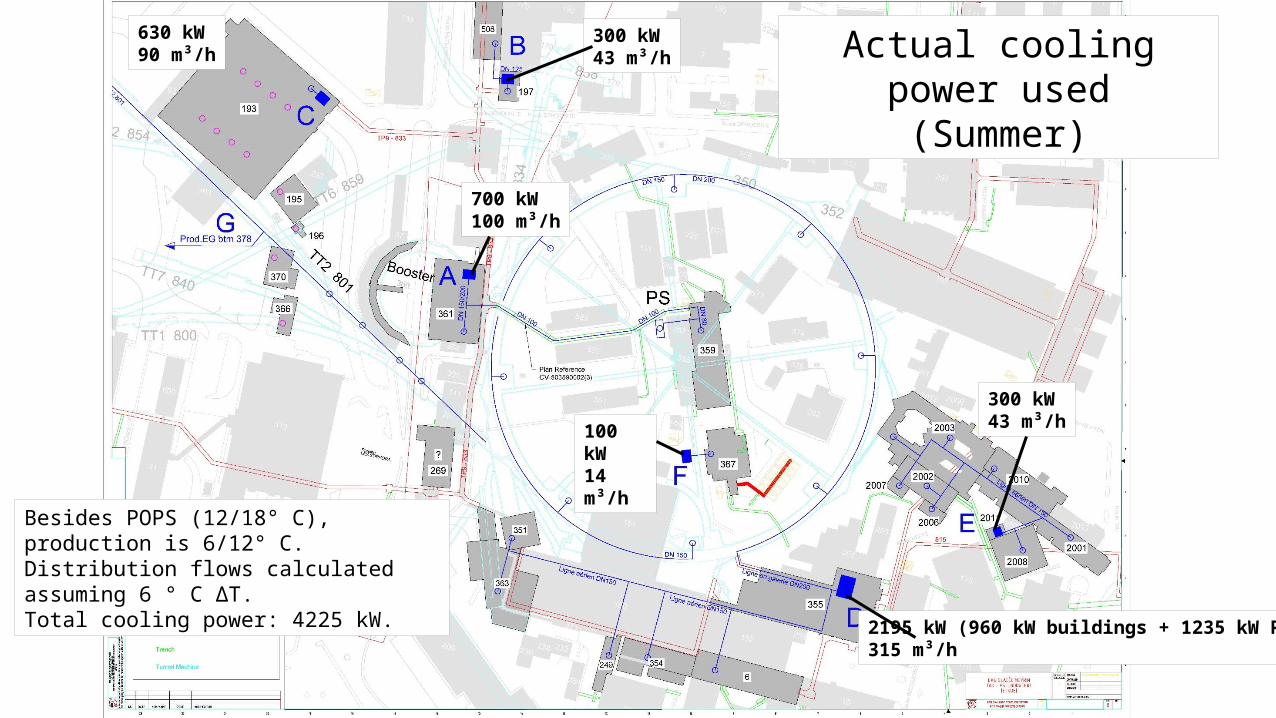
Actual cooling power used (Summer)
300 kW43 m³/h
630 kW90 m³/h
700 kW100 m³/h
100 kW14 m³/h
300 kW43 m³/h
2195 kW (960 kW buildings + 1235 kW PS) 315 m³/h
Besides POPS (12/18° C), production is 6/12° C.Distribution flows calculated assuming 6 ° C ΔT.Total cooling power: 4225 kW.
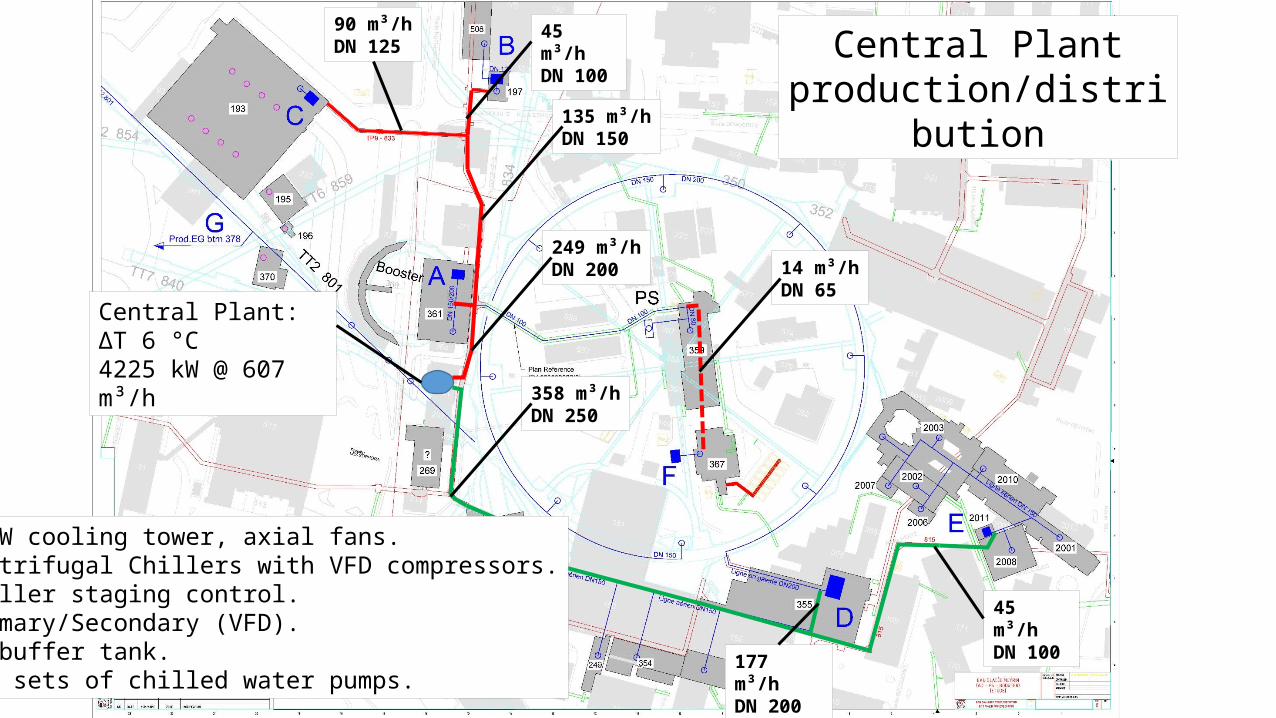
Central Plant production/distribution
Central Plant: ΔT 6 °C4225 kW @ 607 m³/h
249 m³/hDN 200
135 m³/hDN 150
90 m³/hDN 125
45 m³/hDN 100
358 m³/hDN 250
177 m³/hDN 200
45 m³/hDN 100
14 m³/hDN 65
• 5 MW cooling tower, axial fans.• Centrifugal Chillers with VFD compressors.• Chiller staging control.• Primary/Secondary (VFD).• No buffer tank.• Two sets of chilled water pumps.
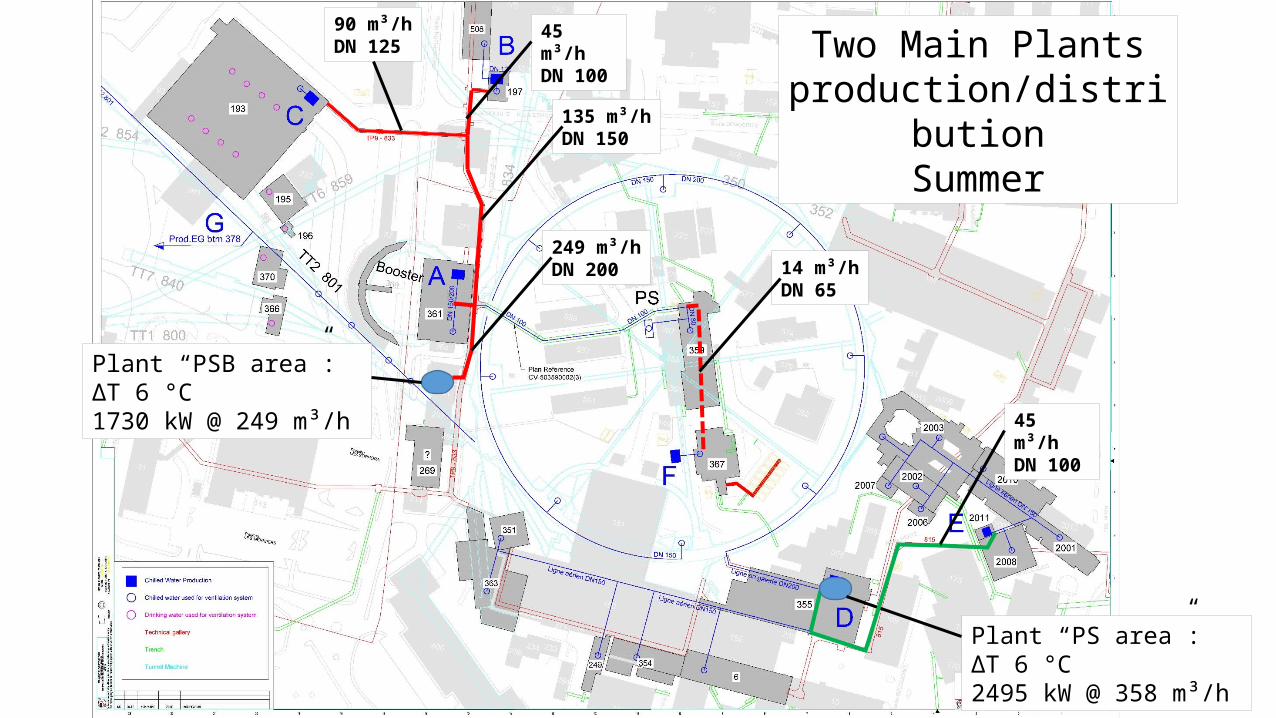
Two Main Plants production/distribution
Summer
Plant “PSB area”: ΔT 6 °C1730 kW @ 249 m³/h
249 m³/hDN 200
135 m³/hDN 150
90 m³/hDN 125
45 m³/hDN 100
45 m³/hDN 100
14 m³/hDN 65
Plant “PS area”: ΔT 6 °C2495 kW @ 358 m³/h
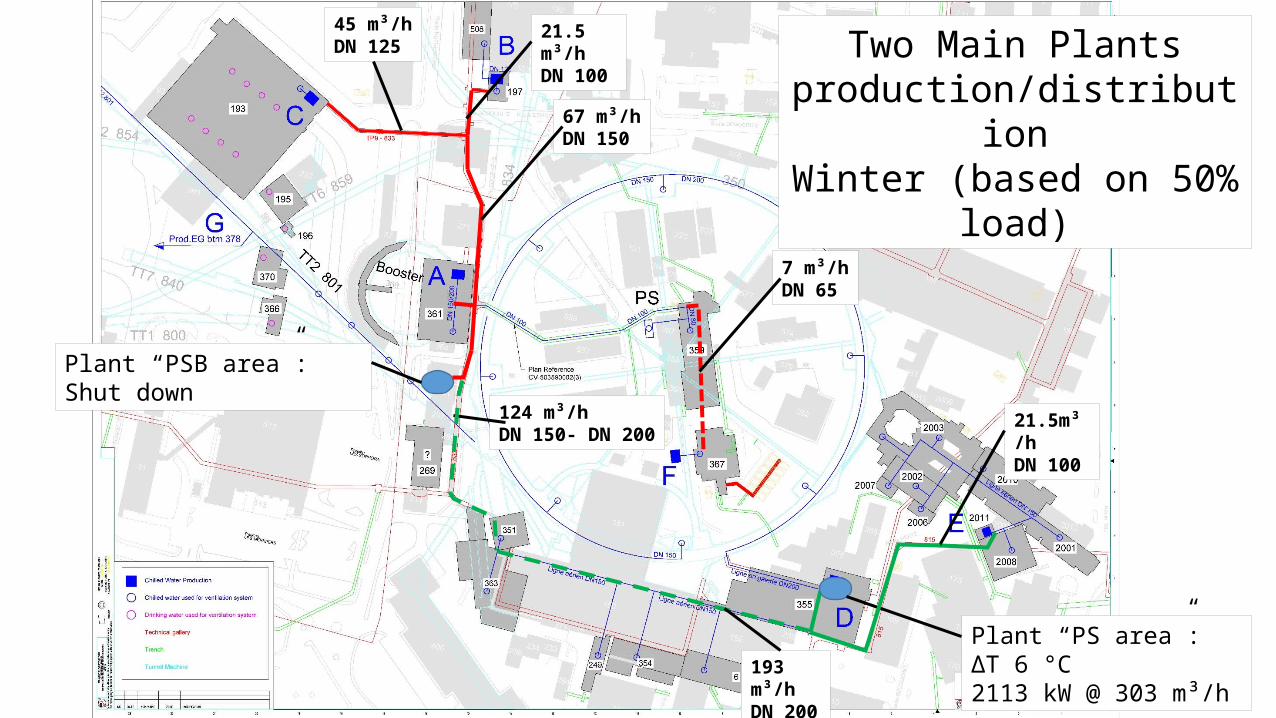
Two Main Plants production/distribution
Winter (based on 50% load)
Plant “PSB area”: Shut down
124 m³/hDN 150- DN 200
67 m³/hDN 150
45 m³/hDN 125
21.5 m³/hDN 100
21.5m³/hDN 100
7 m³/hDN 65
Plant “PS area”: ΔT 6 °C2113 kW @ 303 m³/h193 m³/h
DN 200
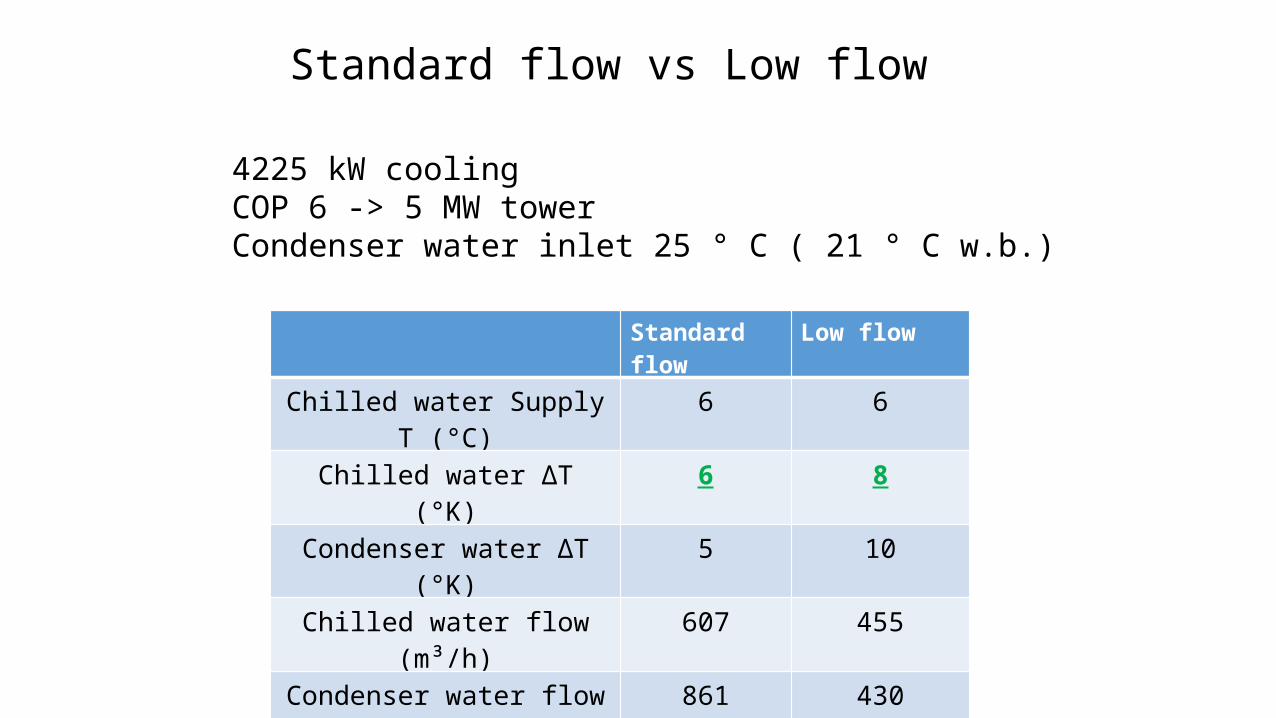
Standard flow vs Low flow
4225 kW coolingCOP 6 -> 5 MW towerCondenser water inlet 25 ° C ( 21 ° C w.b.)
Standard flow Low flow
Chilled water Supply T (°C) 6 6
Chilled water ΔT (°K) 6 8
Condenser water ΔT (°K) 5 10
Chilled water flow (m³/h) 607 455
Condenser water flow (m³/h) 861 430
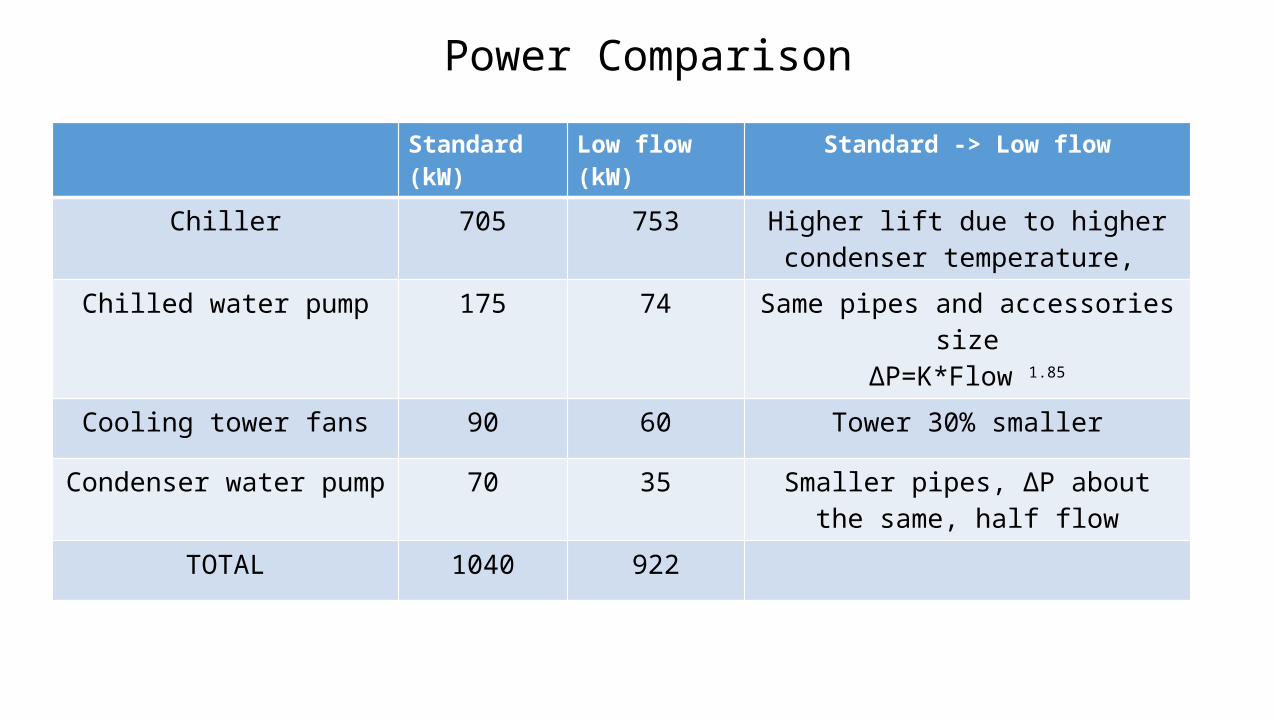
Standard (kW) Low flow (kW) Standard -> Low flow
Chiller 705 753 Higher lift due to higher condenser temperature,
Chilled water pump 175 74 Same pipes and accessories sizeΔP=K*Flow 1.85
Cooling tower fans 90 60 Tower 30% smaller
Condenser water pump 70 35 Smaller pipes, ΔP about the same, half flow
TOTAL 1040 922
Power Comparison
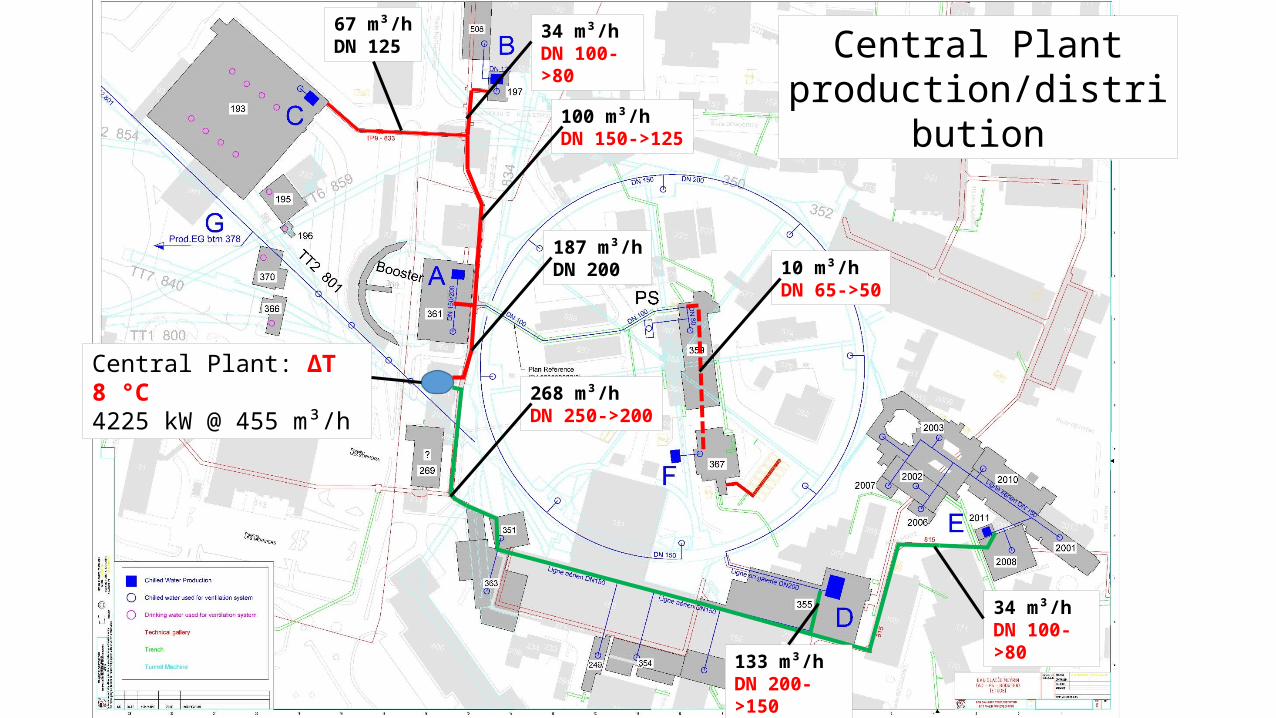
Central Plant production/distribution
Central Plant: ΔT 8 °C4225 kW @ 455 m³/h
187 m³/hDN 200
100 m³/hDN 150->125
67 m³/hDN 125
34 m³/hDN 100->80
268 m³/hDN 250->200
133 m³/hDN 200->150
34 m³/hDN 100->80
10 m³/hDN 65->50
Further analysis:Impact on AHUs (fan power with bigger batteries and/or different control valves).
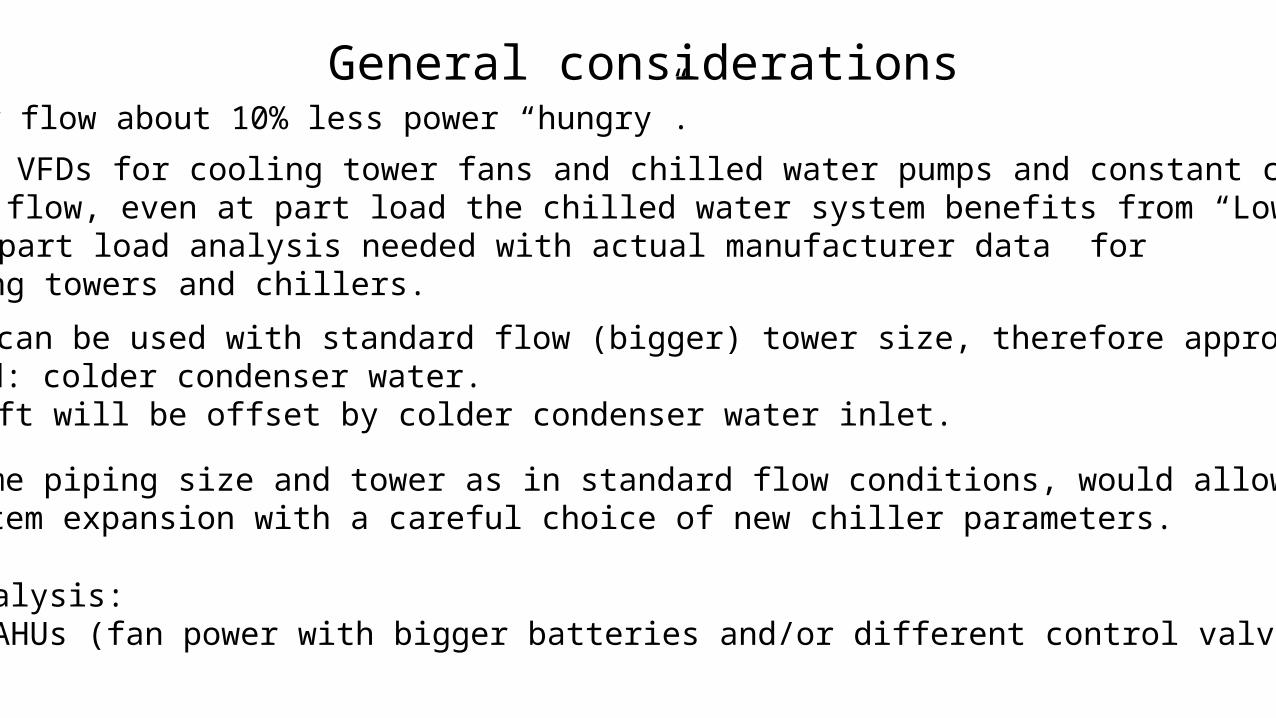
General considerationsLow flow about 10% less power “hungry”.
• Assuming VFDs for cooling tower fans and chilled water pumps and constant condenser water flow, even at part load the chilled water system benefits from “Low flow”.• Anyway, part load analysis needed with actual manufacturer data for cooling towers and chillers. • Low flow can be used with standard flow (bigger) tower size, therefore approach can be reduced: colder condenser water.• Higher lift will be offset by colder condenser water inlet.
Keeping same piping size and tower as in standard flow conditions, would allow for future system expansion with a careful choice of new chiller parameters.
Further savings strategies
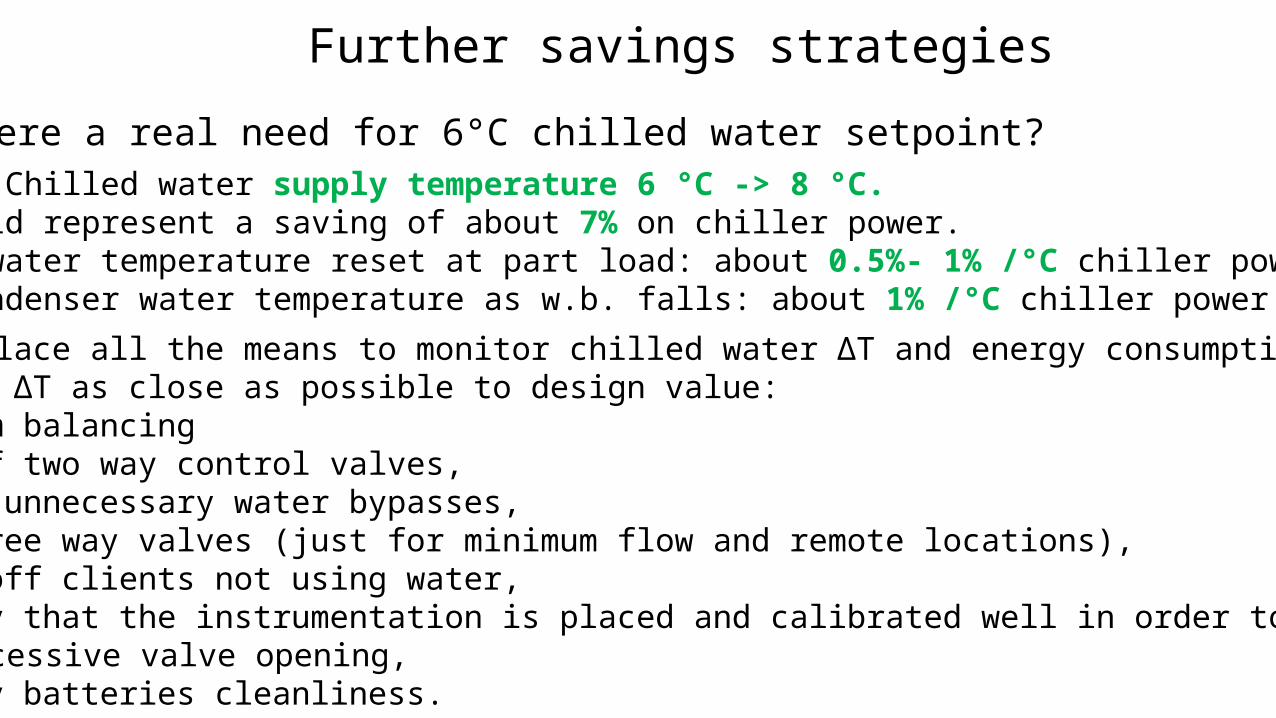
• Increase Chilled water supply temperature 6 °C -> 8 °C.• This would represent a saving of about 7% on chiller power.• Chilled water temperature reset at part load: about 0.5%- 1% /°C chiller power reduction.• Reset condenser water temperature as w.b. falls: about 1% /°C chiller power reduction.
Is there a real need for 6°C chilled water setpoint?
• Put in place all the means to monitor chilled water ΔT and energy consumption.• Keep the ΔT as close as possible to design value:• system balancing• use of two way control valves,• avoid unnecessary water bypasses, • no three way valves (just for minimum flow and remote locations),• shut off clients not using water,• verify that the instrumentation is placed and calibrated well in order to avoid excessive valve opening, • verify batteries cleanliness.
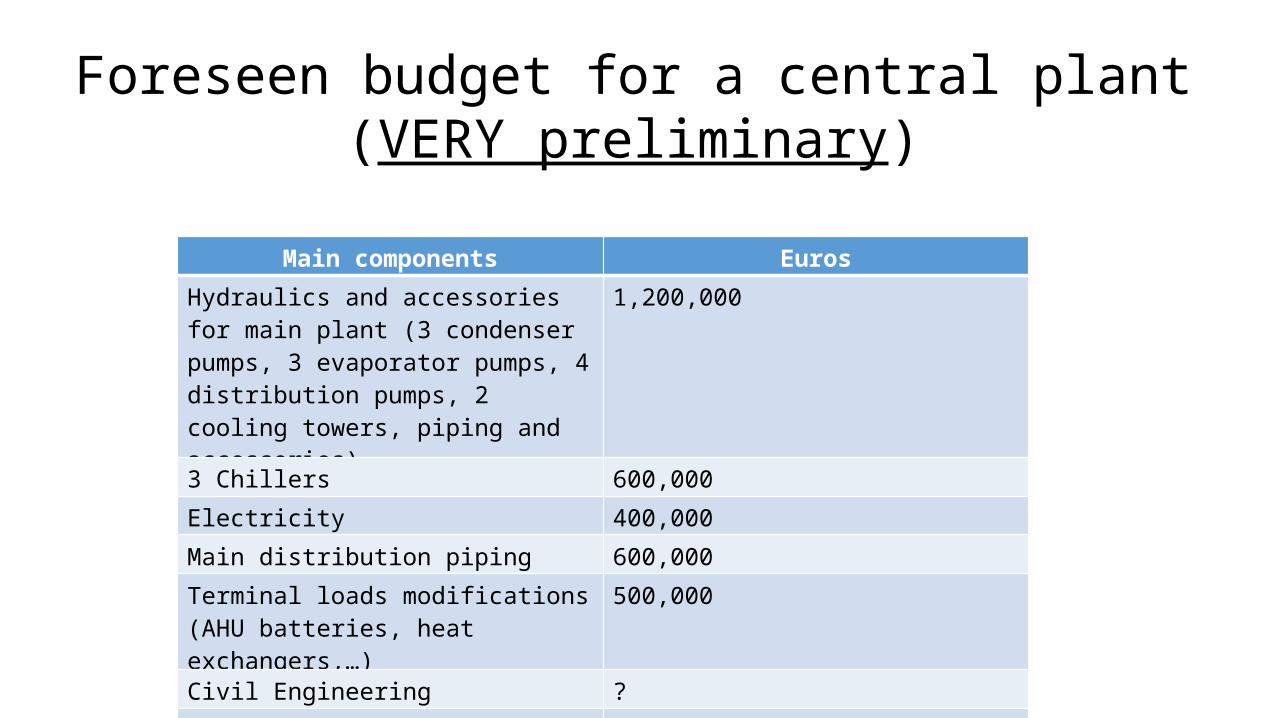
Foreseen budget for a central plant(VERY preliminary)
Main components Euros
Hydraulics and accessories for main plant (3 condenser pumps, 3 evaporator pumps, 4 distribution pumps, 2 cooling towers, piping and accessories)
1,200,000
3 Chillers 600,000
Electricity 400,000
Main distribution piping 600,000
Terminal loads modifications (AHU batteries, heat exchangers,…)
500,000
Civil Engineering ?
Total 3,300,000 + ?
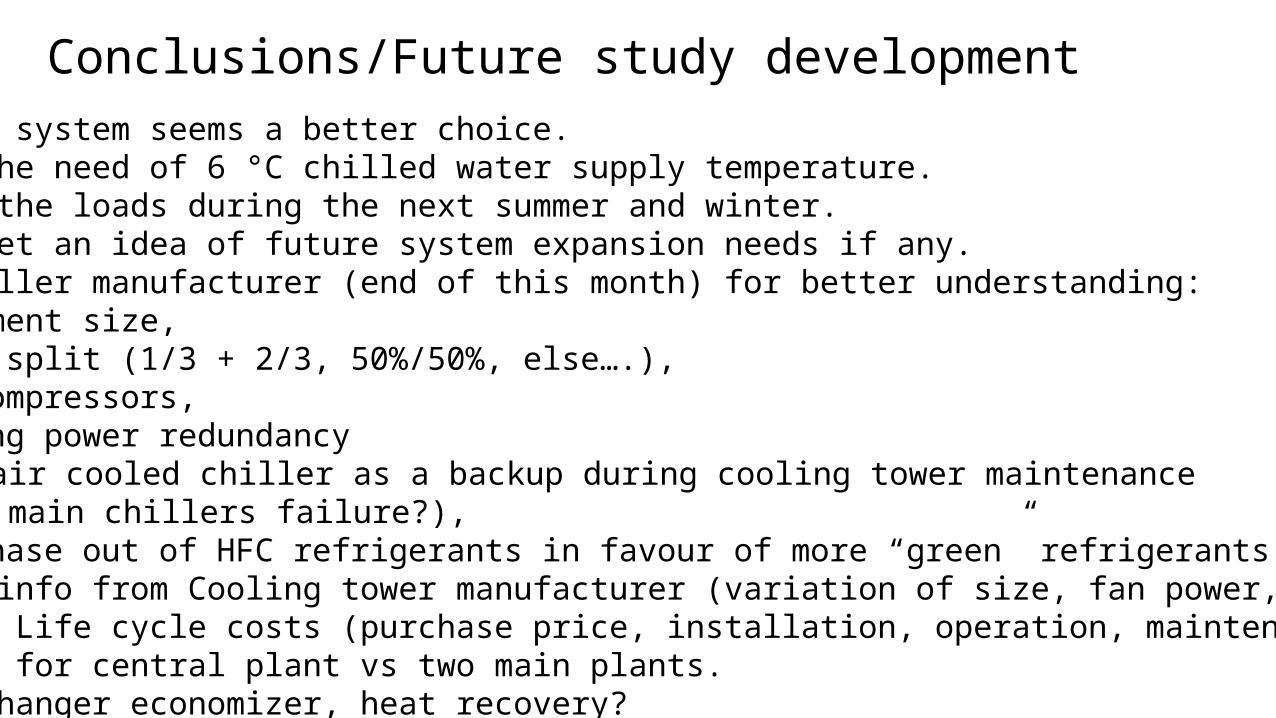
Conclusions/Future study development• Low flow system seems a better choice.• Review the need of 6 °C chilled water supply temperature.• Monitor the loads during the next summer and winter.• Try to get an idea of future system expansion needs if any.• Meet Chiller manufacturer (end of this month) for better understanding:• equipment size,• load split (1/3 + 2/3, 50%/50%, else….), • VFD compressors,• Cooling power redundancy (1 air cooled chiller as a backup during cooling tower maintenance or main chillers failure?),• the phase out of HFC refrigerants in favour of more “green” refrigerants like HFO.
• Collect info from Cooling tower manufacturer (variation of size, fan power, approach…).• Identify Life cycle costs (purchase price, installation, operation, maintenance,..)• CE study for central plant vs two main plants.• Heat exchanger economizer, heat recovery?