Embed Size (px)
Citation preview
Chile CTF-IDB Concentrated Solar Power Project
IDB Private Sector CTF Proposal for Submission to the CTF Trust-Fund Committee
PUBLIC INFORMATION DOCUMENT
Inter-American Development Bank
Chile CTF-IDB Concentrated Solar Power Project p. 2
Chile CTF-IDB Concentrated Solar Power Project
IDB Private Sector CTF Proposal
for Submission to the CTF Trust-Fund Committee
TABLE OF CONTENTS
Chile CTF-IDB Concentrated Solar Power Project 2
Executive Summary ................................................................................................................................................ 3
List of Abbreviations ............................................................................................................................................... 4
Sector and Country Context ................................................................................................................................... 5 Power Supply and Demand in the North of Chile ................................................................................................ 5 Electricity Market Structure in Chile .................................................................................................................... 7 Renewable Energy Policy in Chile ..................................................................................................................... 10 Renewable Energy Technologies in the North of Chile ...................................................................................... 11 Global Context for Concentrated Solar Power ................................................................................................... 13
Problem and Project Description ......................................................................................................................... 15 Problem Description ........................................................................................................................................... 15 Previous and Ongoing Activities ........................................................................................................................ 16 Project Description ............................................................................................................................................. 17 Knowledge Management and Capacity Building Component ............................................................................ 18 Financial Instruments .......................................................................................................................................... 19 Additional Support .............................................................................................................................................. 20
Financing Table ..................................................................................................................................................... 20
Fit with CTF Investment Criteria ........................................................................................................................ 21 Transformational Strategy .................................................................................................................................. 21 Fit with Chile’s Investment Plan ........................................................................................................................ 22 Potential GHG Emission Reductions .................................................................................................................. 22 Cost-Effectiveness .............................................................................................................................................. 23 Demonstration Potential at Scale ........................................................................................................................ 23 Development Impact ........................................................................................................................................... 23 Implementation Potential .................................................................................................................................... 24 Additional Costs and Risk Premium ................................................................................................................... 24 Financial Sustainability....................................................................................................................................... 25 Effective Utilization of Concessional Finance .................................................................................................... 26 Mitigation of Market Distortions ........................................................................................................................ 26 Risks and Risk Mitigation................................................................................................................................... 27 Performance Indicators ....................................................................................................................................... 28
Annex I. Provisional Implementation and Supervision Budget Error! Bookmark not defined.
Chile CTF-IDB Concentrated Solar Power Project p. 3
Name of Project or Program Chile CTF-IDB Concentrated Solar Power Project
CTF amount requested USD 66,120,000 loan for Project loan
USD 600,000 grant for IDB-executed knowledge management and
technical cooperation activities
USD 250,000 fees for implementation and supervision
USD 30,000 fees for TA/KM component
TOTAL: USD 67,000,000
Country targeted Chile
Indicate if proposal is a
Project or Program Private Sector Project
EXECUTIVE SUMMARY
1. Chile is highly dependent on imported fossil fuels, and this dependency is exacerbated in the North,
which lacks hydropower resources, and where demand is rapidly growing, driven by the expansion of the
mining sector. The northern power grid (SING) has the highest greenhouse gas emission of all the major
Latin American electricity grids. Due to its technological characteristics, Concentrated Solar Power (CSP)
with Thermal Energy Storage (TES) bears promise as the most appropriate renewable energy technology
to reduce fossil fuel dependency in this region, while contributing to the mitigation of climate change.
This is why the Government of Chile (GoC) has decided that this is its top priority within the CTF
Investment Plan.
2. Developing CSP in Chile presents an almost unparalleled opportunity due to several factors. Some of
the highest rates of solar radiation in the world increase the potential performance of CSP technology,
making it potentially much more profitable than in other areas. Demand for CSP electricity is likely to be
strong because of the off-takers’ increasing projected need for power, their increased willingness to sign
power purchase agreements (PPAs) for a CSP project over another renewable energy due to a relatively
better technical match of CSP plants with their demand profile, and other attractive factors like corporate
social responsibility concerns and energy security. Demand is further supported by a renewable portfolio
standard and open grid access regulations. CSP is a proven, commercially available technology that is
experiencing rapid growth worldwide, and this first project in South America would have tremendous
value in terms of reducing barriers for its implementation.
3. Despite favorable conditions, a price gap remains between CSP costs and the amount that off-takers
are willing to pay for renewable energy power, making short-term public support necessary. Since scale is
of utmost importance due to economies of scale and other considerations, a diversity of sources of finance
and other sorts of support have been convened by the GoC in order to make this Project feasible. This
includes a government grant and concessional and market-based loans from other sources. The GoC is
organizing a competitive tendering process to determine access to its grant, and additional sources of
financing would be made available to the winner. The competitive process, combined with open access to
information about the concessional resources available, will ensure efficient use of resources and
minimum concessionality.
4. The support of the CTF would be paramount for the development of the first solar CSP plant in the
country and in South America. It will help offset the high capital investment required by solar CSP
projects and will allow the Project to sign a long-term, fixed-price PPA with an off-taker at a competitive
price. Complementary technical assistance and knowledge management activities will support financial
sustainability and scaling up through facilitating learning in the market.
Chile CTF-IDB Concentrated Solar Power Project p. 4
LIST OF ABBREVIATIONS
a year
AChEE Agencia Chilena de Eficiencia
Energética (Chilean Energy Efficiency
Agency)
BIPV building-integrated PV
BNEF Bloomberg New Energy Finance
CAPEX capital expenditure
CCGT combined cycle gas turbine
CDEC Centro de Despacho Económico de
Carga (Center for Economic Load
Dispatch)
CDM Clean Development Mechanism
CNE Comisión Nacional de Energía (National
Energy Commission)
CO2 carbon dioxide
CO2e carbon dioxide equivalent
COMA costos de operación, mantenimiento y
administración (operation, maintenance
and administration costs)
CORFO Corporación de Fomento de la
Producción de Chile (Production
Development Corporation)
cPV concentrated PV
CSI crystalline silicon
CSP concentrated solar power
CSPP CSP Project
CTF Clean Technology Fund
DNI direct normal irradiation
EE energy efficiency
ENE Estrategia Nacional de Energía (Chilean
National Energy Strategy)
EUR Euros
GEF Global Environment Facility
GDP gross domestic product
GHG greenhouse gases
GHI global horizontal irradiation
GIZ Gesellschaft für Internationale
Zusammenarbeit (German technical
cooperation agency)
GoC Government of Chile
GW gigawatt
GWh gigawatt hour
IDB Inter-American Development Bank
IEA International Energy Agency
IFC International Finance Corporation
IP Investment Plan
IPCC Intergovernmental Panel on Climate
Change
IRENA International Renewable Energy Agency
IRR internal rate of return
ISE Fraunhofer Institute for Solar Energy
Systems
KfW Kreditanstalt für Wiederaufbau (German
development bank)
KM knowledge management
LAC Latin America and the Caribbean
LCOE levelized cost of energy
LFI local financial institutions
LNG liquefied natural gas
LSPVP large-scale photo-voltaic program
M million
MDBs multilateral development banks
MENA Middle East and North Africa
MW megawatt
MWh megawatt hour
NCRE non-conventional renewable energy
NREL National Renewable Energy Laboratory
(USA)
OPEX operational expenditure
PPA power purchase agreement
PV photo-voltaic
R&D research and development
RE renewable energy
RESSEE renewable energy self-supply and energy
efficiency
RPS renewable portfolio standard
SEC Superintendencia de Electricidad y
Combustibles (Bureau of Electricity and
Fuels)
SIC Sistema Interconectado Central (Central
Interconnected System)
SING Sistema Integrado del Norte Grande
(Northern Interconnected System)
STEG solar thermal electricity generation
t metric ton
TC technical cooperation
TES thermal energy storage
TWh terawatt hour
UNDP United Nations Development Program
UNFCCC United Nations Framework Convention
on Climate Change
USA United States of America
USD United States Dollars
UTM unidad tributaria mensual (inflation-
adjusted monetary unit)
VAD valor agregado de distribución (added
distribution value)
Chile CTF-IDB Concentrated Solar Power Project p. 5
SECTOR AND COUNTRY CONTEXT
Power Supply and Demand in the North of Chile
5. While Chile relies on fossil fuels for 74% of the country’s primary energy supply, its domestic
supplies are extremely limited. As a result Chile must import around 75% of its energy, and does so
mainly in the form of oil gas and coal.1 These products represent more than 23% of the total value of
Chilean imports. Chile is the second least self-sufficient country in the LAC region in terms of energy,
after Panama.2
6. Due to this situation, energy security and its links with environmental issues are of supreme
importance for Chile. Hydropower was historically Chile’s single largest power source. However
droughts have periodically reduced hydropower production causing supply shortfalls and blackouts and
revealing hydro facilities to be an uncertain supply of power. Climate change is expected to aggravate this
uncertainty even more in the future. In the 1990s, Chile began to diversify its energy mix by investing in
natural gas power generation infrastructure. By 2004 up to 40% of power generation ran on gas imported
from Argentina. However in that year exports were suspended resulting in widespread blackouts in Chile,
and deliveries have not been re-instituted. As a consequence the country, and especially the Northern
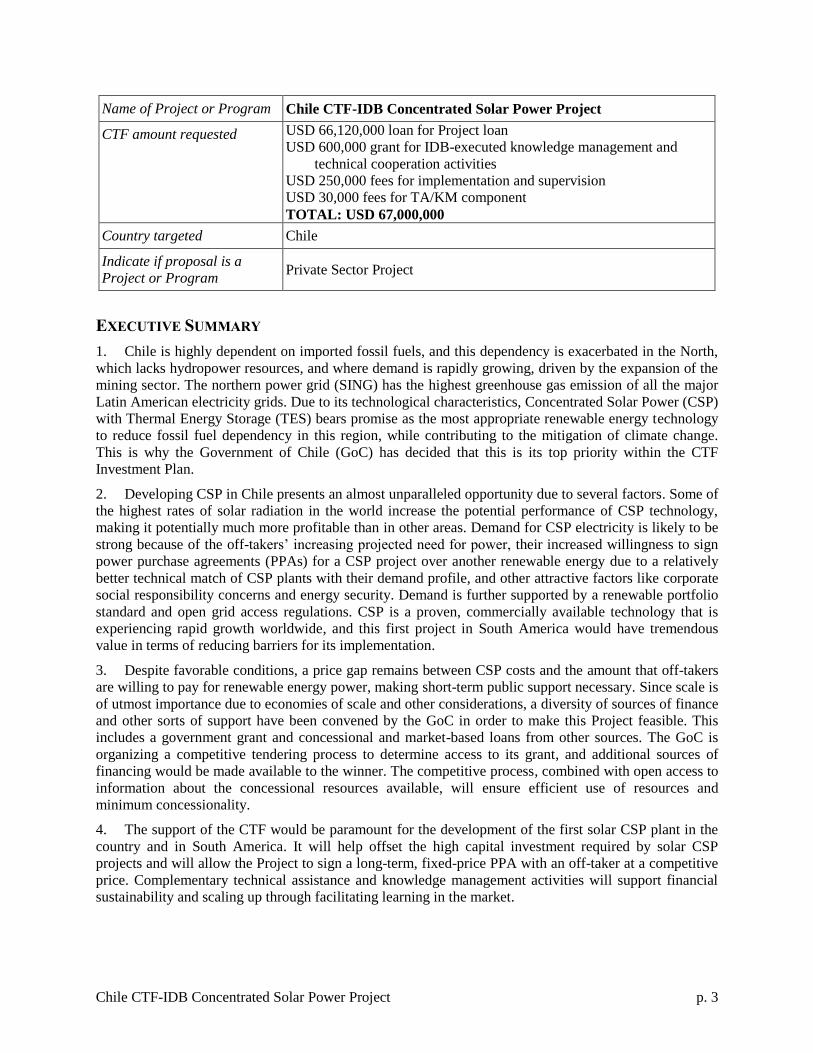
Interconnected System (SING), now has an increased reliance on coal-based generation (see Figure 1).
Figure 1. Generation by Fuel Type in the SING, 1999-2011 (GWh)
Source: CNE, modified from IEA data (Chile Energy Policy Review 2009, bit.ly/Chile_IEA2009, p. 138)
7. Chile’s northern region’s economic activity is characterized by copper mining industry and more
than 2/3 of its mines are located on the SING system, which is not connected to the Central
Interconnected System (SIC). In 2011 SING installed capacity was 3,964 MW producing 15,881 GWh of
electricity, of which 90% was consumed by unregulated costumers (mining and industry). Electricity
production is 99% fossil based (69.6% coal, 25.8% gas, 2.1% diesel, 1.4% fuel, 1.1% others),3 resulting in
a 2011 greenhouse gas (GHG) emission factor of 0.725 t CO2e/MWh,4 the highest of any of the major
Latin American electricity grids. Generation capacity is concentrated mainly on the coast due to the need
to have access to water for the steam cycle in thermal power plants.5 There are currently 10 generating
1 Figures for 2010. International Energy Agency; www.iea.org.
2 Renewable Energy Country Profiles; IRENA; 2012.
3 Source: http://www.cne.cl/estadisticas/energia/electricidad.
4 Ministerio de Energía. Reportes de Emisión para el SING (bit.ly/Chile_huellaCO2_SING).
5 Although, to note, none of the facilities are equipped with protective infrastructure against tsunamis.
-
2,000
4,000
6,000
8,000
10,000
12,000
14,000
16,000
18,000
1999 2000 2001 2002 2003 2004 2005 2006 2007 2008 2009 2010 2011
Gas Coal Oil
Chile CTF-IDB Concentrated Solar Power Project p. 6
companies in the SING, with six of them (E-CL, Electroandina, Gasatacama, Celta, Norgener, and AES
Gener) covering over 99% of installed capacity.
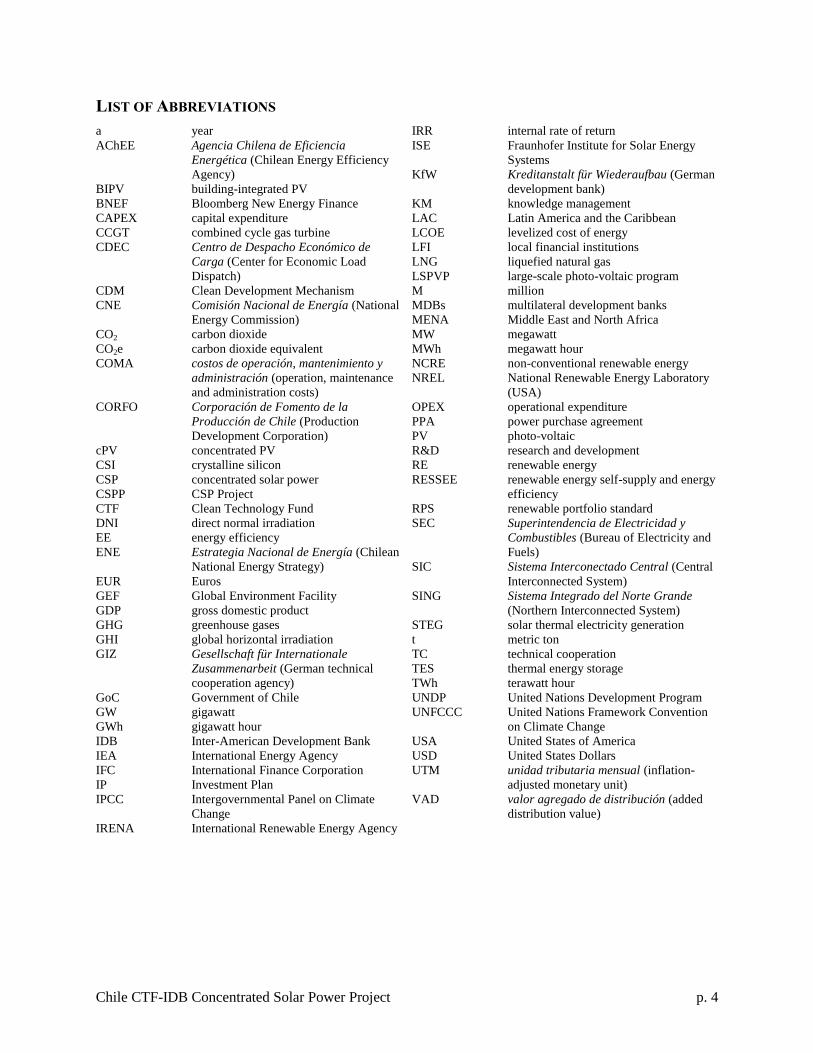
8. Chile’s economy has been growing at a fast pace and electricity production has steadily increased by
5% per year on average (see Figure 2). GDP is expected to grow at 4% until 2030, 6
resulting in a
sustained expansion of energy demand. In the case of Northern Chile, an even higher growth, driven by
the rapid expansion of the mining sector, is foreseen, and almost 800 additional MW of generation
capacity per year are foreseen (totaling 4 GW by 2016). If the business as usual scenario persists, most of
this new capacity installed will be coal-fired technology. Diesel-fired supply is also expected to increase,
especially in the SING.
Figure 2. Historic Electricity Production, SING
Source: CNE, www.cne.cl
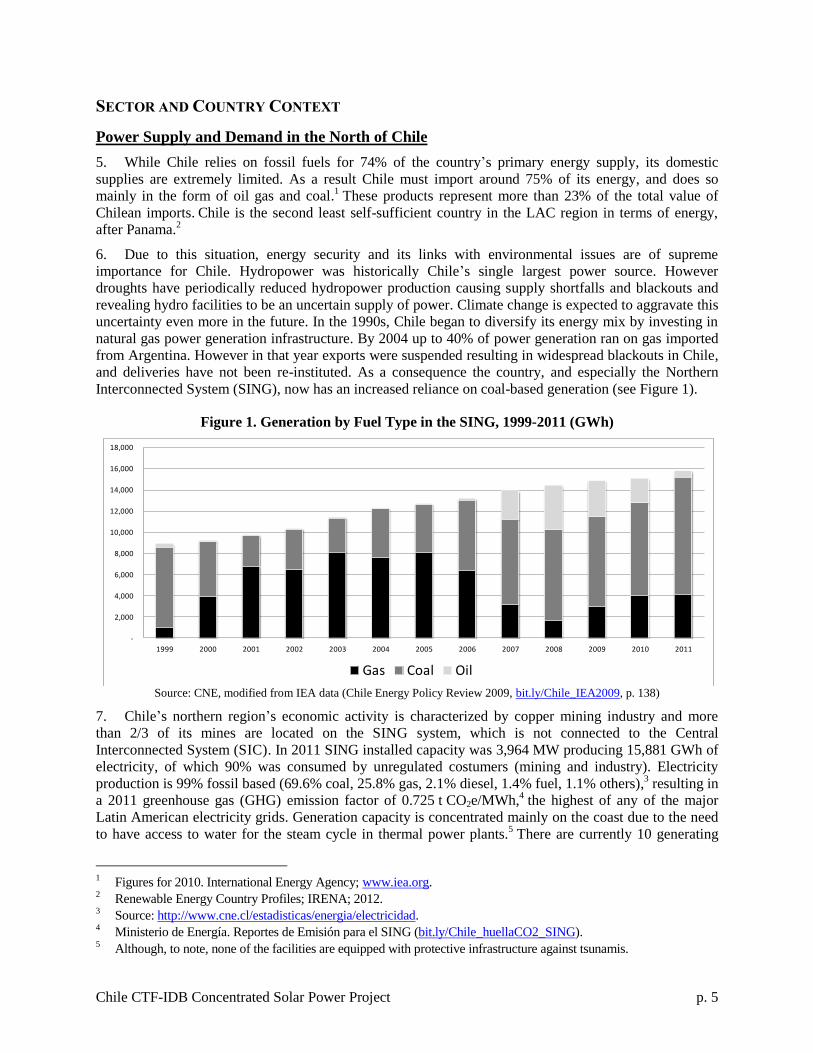
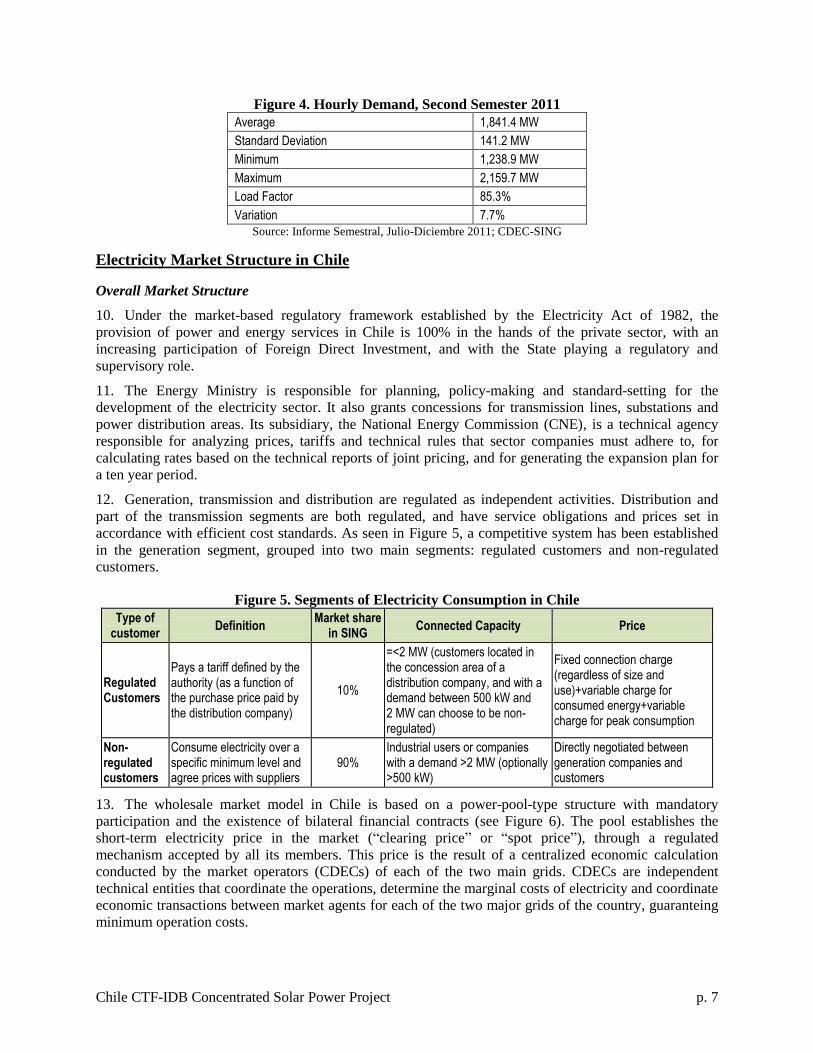
9. The active capacity curve of a typical day shows a very flat profile (Figure 3). This is due to the
predominance of the mining industry in SING (90% of overall consumption), which is characterized by a
nearly constant demand. In the second semester of 2011 active capacity demanded in the SING was
1,841.4 MW on average, with a variation of only 7.7% (see Figure 4)
Figure 3. SING’s Active Capacity, 24 Hours, July 2012
Source: CDEC-SING; http://bit.ly/CEDEC_SING
6 Economist Intelligence Unit. Chile Summary (bit.ly/economist Chile).
650
750
850
950
1,050
1,150
1,250
1,350
1,450
1,550
J…
J…
J…
J…
J…
J…
J…
J…
J…
J…
J…
J…
J…
J…
J…
J…
J…
J…
J…
J…
J…
J…
J…
J…
J…
J…
J…
GW
h
Chile CTF-IDB Concentrated Solar Power Project p. 7
Figure 4. Hourly Demand, Second Semester 2011
Average 1,841.4 MW
Standard Deviation 141.2 MW
Minimum 1,238.9 MW
Maximum 2,159.7 MW
Load Factor 85.3%
Variation 7.7%
Source: Informe Semestral, Julio-Diciembre 2011; CDEC-SING
Electricity Market Structure in Chile
Overall Market Structure
10. Under the market-based regulatory framework established by the Electricity Act of 1982, the
provision of power and energy services in Chile is 100% in the hands of the private sector, with an
increasing participation of Foreign Direct Investment, and with the State playing a regulatory and
supervisory role.
11. The Energy Ministry is responsible for planning, policy-making and standard-setting for the
development of the electricity sector. It also grants concessions for transmission lines, substations and
power distribution areas. Its subsidiary, the National Energy Commission (CNE), is a technical agency
responsible for analyzing prices, tariffs and technical rules that sector companies must adhere to, for
calculating rates based on the technical reports of joint pricing, and for generating the expansion plan for
a ten year period.
12. Generation, transmission and distribution are regulated as independent activities. Distribution and
part of the transmission segments are both regulated, and have service obligations and prices set in
accordance with efficient cost standards. As seen in Figure 5, a competitive system has been established
in the generation segment, grouped into two main segments: regulated customers and non-regulated
customers.
Figure 5. Segments of Electricity Consumption in Chile
Type of customer
Definition Market share
in SING Connected Capacity Price
Regulated Customers
Pays a tariff defined by the authority (as a function of the purchase price paid by the distribution company)
10%
=<2 MW (customers located in the concession area of a distribution company, and with a demand between 500 kW and 2 MW can choose to be non-regulated)
Fixed connection charge (regardless of size and use)+variable charge for consumed energy+variable charge for peak consumption
Non-regulated customers
Consume electricity over a specific minimum level and agree prices with suppliers
90% Industrial users or companies with a demand >2 MW (optionally >500 kW)
Directly negotiated between generation companies and customers
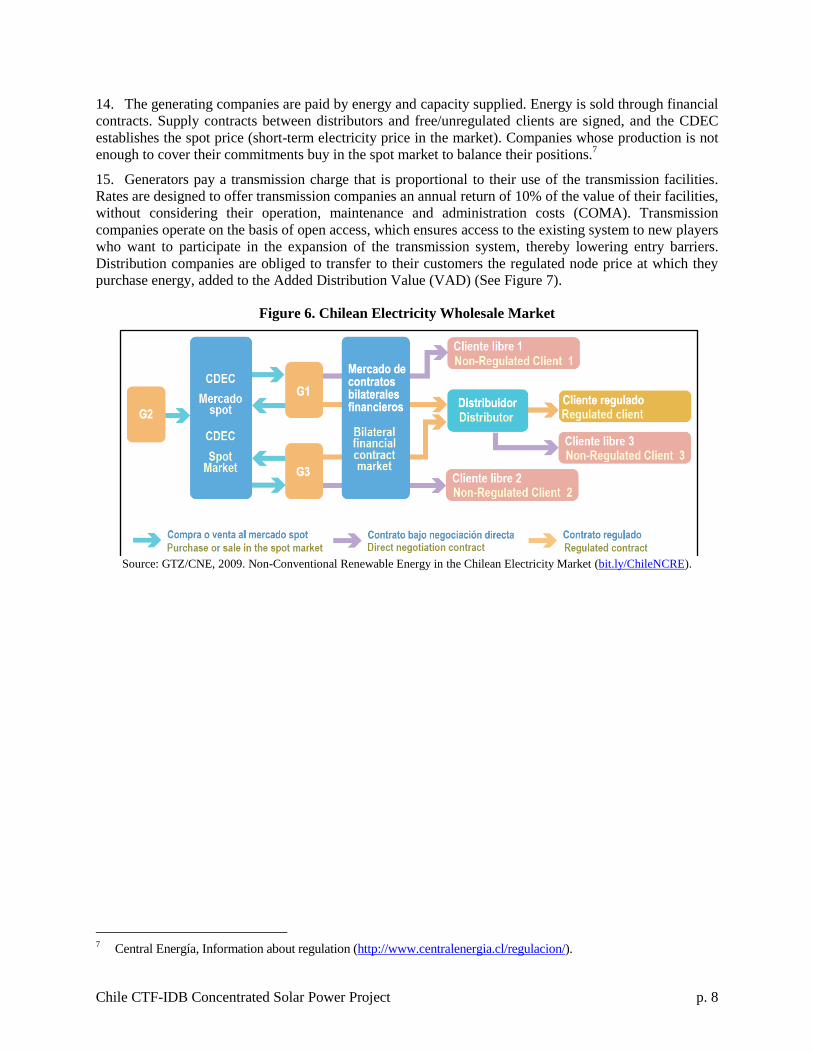
13. The wholesale market model in Chile is based on a power-pool-type structure with mandatory
participation and the existence of bilateral financial contracts (see Figure 6). The pool establishes the
short-term electricity price in the market (“clearing price” or “spot price”), through a regulated
mechanism accepted by all its members. This price is the result of a centralized economic calculation
conducted by the market operators (CDECs) of each of the two main grids. CDECs are independent
technical entities that coordinate the operations, determine the marginal costs of electricity and coordinate
economic transactions between market agents for each of the two major grids of the country, guaranteing
minimum operation costs.
Chile CTF-IDB Concentrated Solar Power Project p. 8
14. The generating companies are paid by energy and capacity supplied. Energy is sold through financial
contracts. Supply contracts between distributors and free/unregulated clients are signed, and the CDEC
establishes the spot price (short-term electricity price in the market). Companies whose production is not
enough to cover their commitments buy in the spot market to balance their positions.7
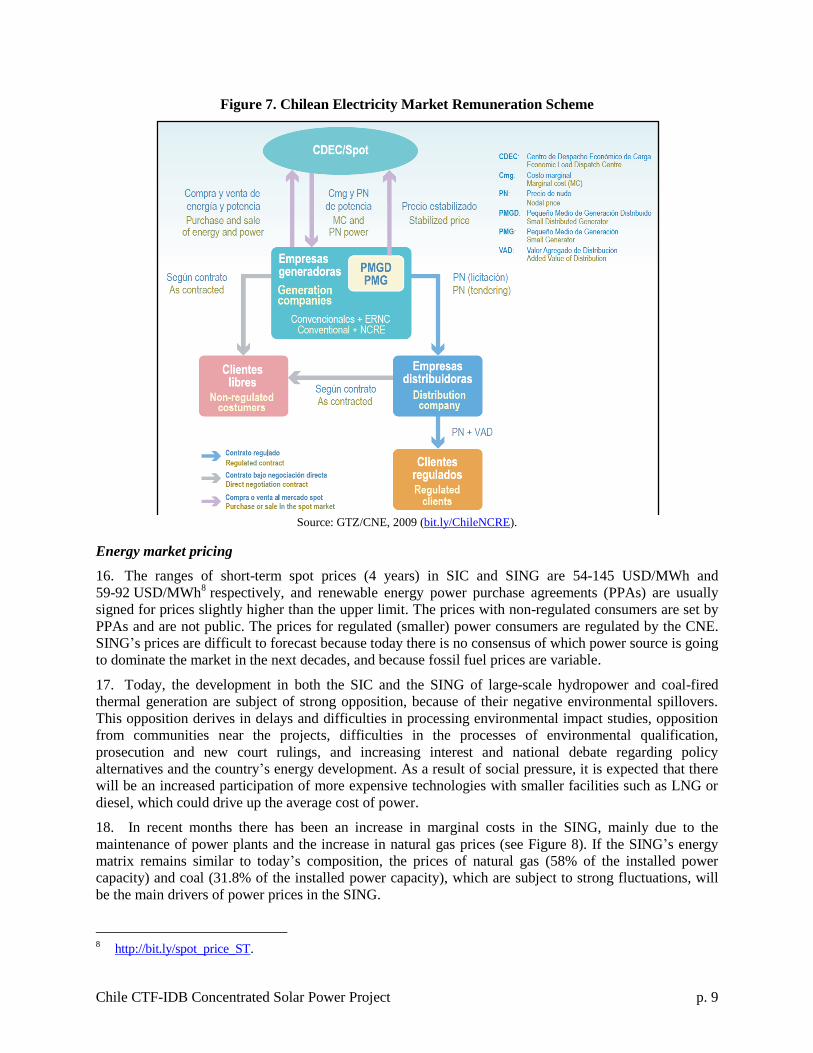
15. Generators pay a transmission charge that is proportional to their use of the transmission facilities.
Rates are designed to offer transmission companies an annual return of 10% of the value of their facilities,
without considering their operation, maintenance and administration costs (COMA). Transmission
companies operate on the basis of open access, which ensures access to the existing system to new players
who want to participate in the expansion of the transmission system, thereby lowering entry barriers.
Distribution companies are obliged to transfer to their customers the regulated node price at which they
purchase energy, added to the Added Distribution Value (VAD) (See Figure 7).
Figure 6. Chilean Electricity Wholesale Market
Source: GTZ/CNE, 2009. Non-Conventional Renewable Energy in the Chilean Electricity Market (bit.ly/ChileNCRE).
7 Central Energía, Information about regulation (http://www.centralenergia.cl/regulacion/).
Chile CTF-IDB Concentrated Solar Power Project p. 9
Figure 7. Chilean Electricity Market Remuneration Scheme
Source: GTZ/CNE, 2009 (bit.ly/ChileNCRE).
Energy market pricing
16. The ranges of short-term spot prices (4 years) in SIC and SING are 54-145 USD/MWh and
59-92 USD/MWh8 respectively, and renewable energy power purchase agreements (PPAs) are usually
signed for prices slightly higher than the upper limit. The prices with non-regulated consumers are set by
PPAs and are not public. The prices for regulated (smaller) power consumers are regulated by the CNE.
SING’s prices are difficult to forecast because today there is no consensus of which power source is going
to dominate the market in the next decades, and because fossil fuel prices are variable.
17. Today, the development in both the SIC and the SING of large-scale hydropower and coal-fired
thermal generation are subject of strong opposition, because of their negative environmental spillovers.
This opposition derives in delays and difficulties in processing environmental impact studies, opposition
from communities near the projects, difficulties in the processes of environmental qualification,
prosecution and new court rulings, and increasing interest and national debate regarding policy
alternatives and the country’s energy development. As a result of social pressure, it is expected that there
will be an increased participation of more expensive technologies with smaller facilities such as LNG or
diesel, which could drive up the average cost of power.
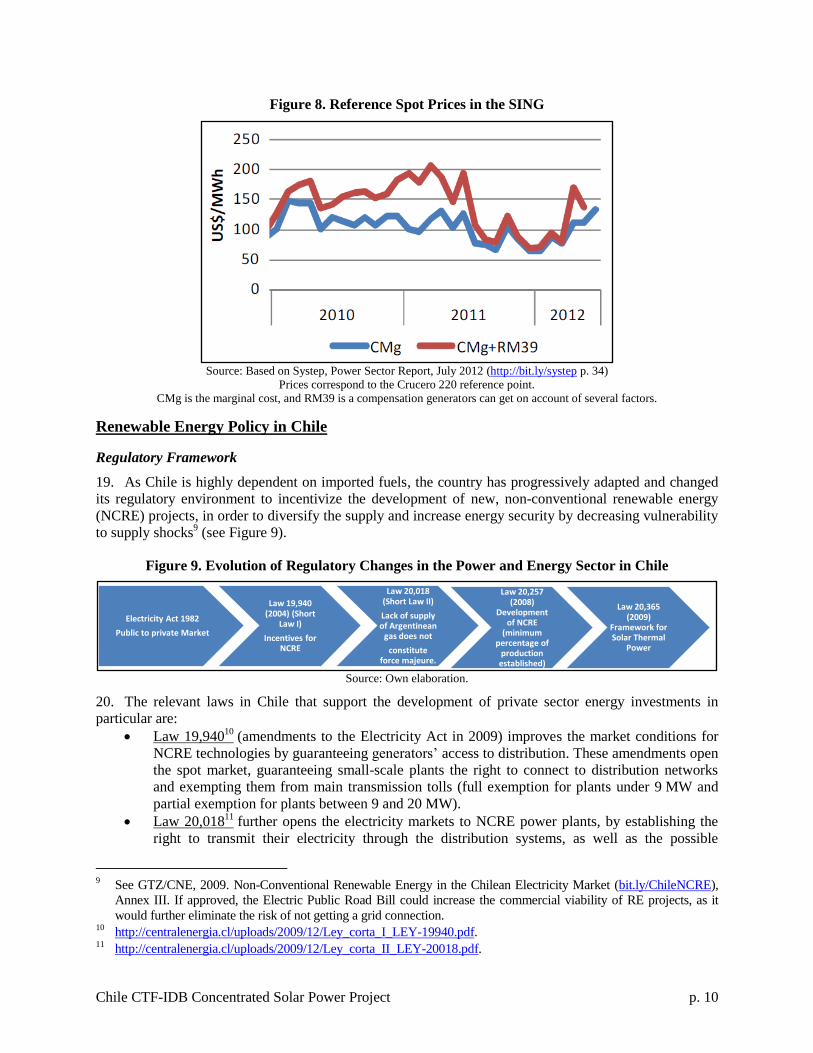
18. In recent months there has been an increase in marginal costs in the SING, mainly due to the
maintenance of power plants and the increase in natural gas prices (see Figure 8). If the SING’s energy
matrix remains similar to today’s composition, the prices of natural gas (58% of the installed power
capacity) and coal (31.8% of the installed power capacity), which are subject to strong fluctuations, will
be the main drivers of power prices in the SING.
8 http://bit.ly/spot_price_ST.
Chile CTF-IDB Concentrated Solar Power Project p. 10
Figure 8. Reference Spot Prices in the SING
Source: Based on Systep, Power Sector Report, July 2012 (http://bit.ly/systep p. 34)
Prices correspond to the Crucero 220 reference point.
CMg is the marginal cost, and RM39 is a compensation generators can get on account of several factors.
Renewable Energy Policy in Chile
Regulatory Framework
19. As Chile is highly dependent on imported fuels, the country has progressively adapted and changed
its regulatory environment to incentivize the development of new, non-conventional renewable energy
(NCRE) projects, in order to diversify the supply and increase energy security by decreasing vulnerability
to supply shocks9 (see Figure 9).
Figure 9. Evolution of Regulatory Changes in the Power and Energy Sector in Chile
Source: Own elaboration.
20. The relevant laws in Chile that support the development of private sector energy investments in
particular are:
Law 19,94010
(amendments to the Electricity Act in 2009) improves the market conditions for
NCRE technologies by guaranteeing generators’ access to distribution. These amendments open
the spot market, guaranteeing small-scale plants the right to connect to distribution networks
and exempting them from main transmission tolls (full exemption for plants under 9 MW and
partial exemption for plants between 9 and 20 MW).
Law 20,01811
further opens the electricity markets to NCRE power plants, by establishing the
right to transmit their electricity through the distribution systems, as well as the possible
9 See GTZ/CNE, 2009. Non-Conventional Renewable Energy in the Chilean Electricity Market (bit.ly/ChileNCRE),
Annex III. If approved, the Electric Public Road Bill could increase the commercial viability of RE projects, as it
would further eliminate the risk of not getting a grid connection. 10
http://centralenergia.cl/uploads/2009/12/Ley_corta_I_LEY-19940.pdf. 11
http://centralenergia.cl/uploads/2009/12/Ley_corta_II_LEY-20018.pdf.
Electricity Act 1982
Public to private Market
Law 19,940 (2004) (Short
Law I)
Incentives for NCRE
Law 20,018 (Short Law II)
Lack of supply of Argentinean
gas does not
constitute force majeure.
Law 20,365 (2009)
Framework for Solar Thermal
Power
Law 20,257 (2008)
Development of NCRE
(minimum percentage of
production established)
Chile CTF-IDB Concentrated Solar Power Project p. 11
exemption of charges for the use of the main transmission system. Additionally, it allows the
tendering of long-term contracts by distribution companies at prices above the nodal price.
Law 20.25712
(approved in April 2008) establishes a renewable portfolio standard (RPS). It
creates the obligation for generators13
to incorporate 5% of NCRE electricity into their energy
mix. This percentage will increase gradually to 10% by 2024. Companies who do not comply
with this request have to pay a penalty.14
A market of tradable RE certificates (atributos) has
been created, and generators can comply with the RPS by buying these certificates from others.
The grid operators have to report the compliance with the Law and the auditing is a
responsibility of the Bureau of Electricity and Fuels (SEC) (regulated by Law 18.410).
Renewable Energy in the National Energy Strategy
21. In 2012 Chile developed a National Energy Strategy (ENE) based on fundamental principles such as
energy independence and security; environmental protection; market competitiveness, and technology
innovation. ENE developed six pillars of which one in particular supports the development of the energy
private sector. The second pillar of the Strategy, the “scale-up of NCRE resources”, seeks to more than
double, in the next decade, the current contribution of NCRE in Chile’s energy matrix. In order to achieve
this, it outlines the following lines of action to unlock the NCRE market:
Project bidding mechanisms to incentivize the development of NCRE. In order to attract more
NCRE investors, the tenders will be issued for blocks of NCRE. Each block could have a
specific incentive from the GoC, depending on the market spread needed to reach grid parity.
Geographic Information System (GIS) – Economic potential for NCRE. To enable the decision
making of NCRE investors, an information system, GIS, would be created to integrate, store,
and display geographic information regarding energy demand, energy resources, available
government land, and environmental protection zones, among others.
Promoting and Financing. With the aim of unlocking the financial barriers of NCRE projects,
new financial instruments will be designed to offer risk mitigation, credit lines and access to
credit in the international markets.
Technology-specific strategies. With the collaboration of the public and private sectors,
researchers, and citizen representatives, a strategy would be designed by type of NCRE -solar,
wind, bioenergy, biomass, geothermal, mini-hydro, and tidal. Additionally, subsidy and
incentive plans will be implemented for those pilot projects that contribute to scale-up NCRE.
Renewable Energy Technologies in the North of Chile
RE Resources
22. In terms of its natural resource base, Chile presents almost unparalleled opportunities for RE
generation. Chile has significant renewable energy (RE) endowments with potential estimated resources
of wind energy at 40 GW,15
geothermal energy at 16 GW,16
small hydropower at 3.6 GW, and a vast
potential of solar energy.
12
http://centralenergia.cl/uploads/2009/12/Ley_ERNC_LEY-20257.pdf. 13
The obligation is for anyone making withdrawals from the grid. Since in Chile the generators not only provide power
to the grid, but also withdraw it to hand it over to the distributors or unregulated clients, they are the ones who are
required to comply with the regulation. Only generators with a capacity above 200 MW are required to comply. 14
An electricity company that does not comply with the obligation by the following March 1 of the respective calendar
year, shall pay a charge of 0.4 UTM20 (inflation-adjusted monetary unit) for each MWh by which it falls short of its
obligation. If within the following three years, the company again fails to comply with the obligation, the charge will
be 0.6 UTM for each MWh of deficit. 15
Chilean Energy Ministry. 16
University of Chile.
Chile CTF-IDB Concentrated Solar Power Project p. 12
23. Chile’s northern region, served by the SING grid, is characterized by a very dry and arid climate.
The predominant renewable resource, especially in the Atacama Desert, is solar energy, with a global
horizontal irradiation (GHI) of 3,300 kWh/m²/a, and a direct normal irradiation (DNI) of 3,000 kWh/m²/a,
around 3,000 hours of sun per year, and large areas of flat land, placing it among the world’s best regions
for large-scale solar energy applications.
Technical Considerations for Meeting Demand
24. As noted in Figure 4, the demanded active capacity in the SING is very flat, with a variation factor of
only 7.7%. In order to keep up with this flat demand curve, generators or big consumers partly relying on
variable sources like solar PV or wind have to access the spot market to comply with their contracts or
internal demand when the wind is not blowing or the sun is not shining. Also since the SING is not
interconnected its technical capacity to absorb variable sources is more limited. This technical mismatch
is a barrier to RE development on the SING.
25. However, variability of RE resources can be addressed through energy storage, which can allow
dispatch during hours when the sun is not shining, and therefore enable the energy output of the power
plant to match the industrial demand. This storage can be provided by concentrated solar power (CSP)
technology with thermal energy storage (TES). CSP with TES can store energy during availability of
solar irradiance and dispatch it when not available (during cloud coverage and at night). Higher storage
capacity increases the plant capacity factor, meaning that more energy can be dispatched in a given year
for a given capacity of the plant. CSP plants with storage also have a similar or lower levelized cost of
energy (LCOE) and lower O&M costs per kWh than those without.17
In particular, CSP power tower
technology using molten salt energy storage is a compelling match for Northern Chile’s high DNI and
temperatures, due to the potential for cost reduction, higher efficiency of the steam cycle, higher capacity
factor, expanded and lower-cost storage opportunities, and firm output capability. Molten salt energy
storage also allows for falling LCOE as plant capacities increase in the future, and provides greater
employment opportunities.18
Taking into consideration local resource availability and the SING demand
profile, CSP with TES represents the most technically ideal opportunity to implement RE in that area.
Fit of CSP in Chile’s North
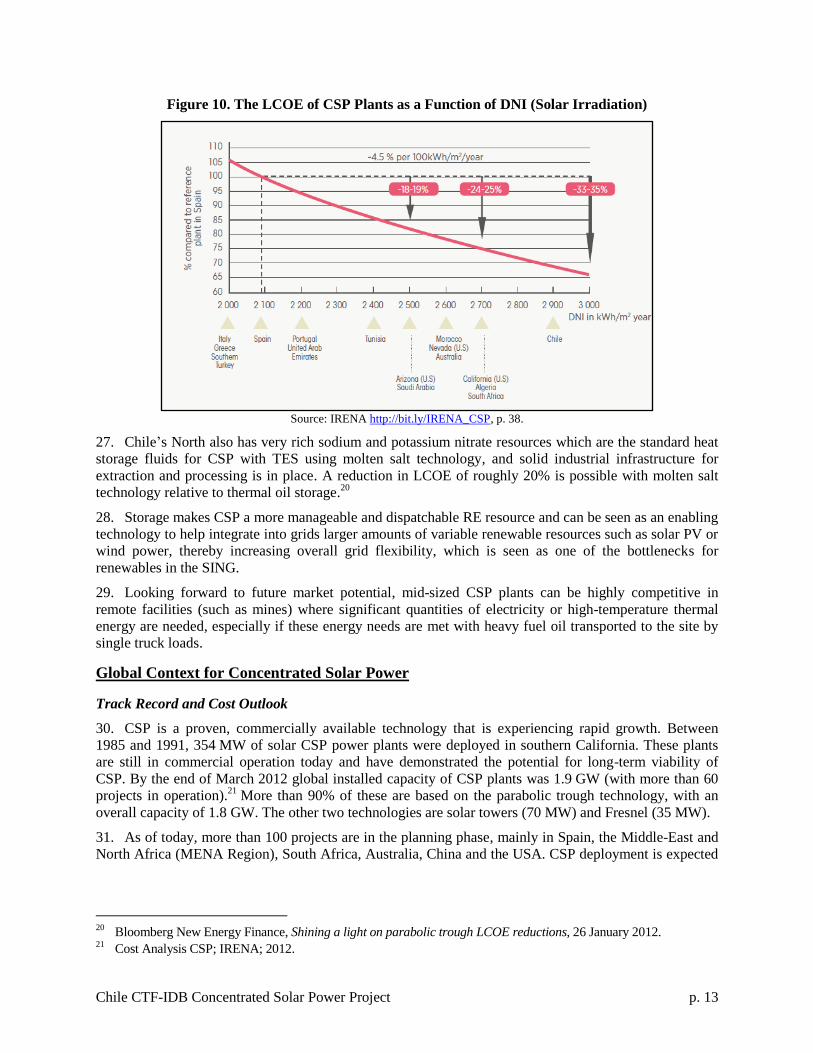
26. CSP requires a minimum DNI of 1,800-1,900 kWh/m²/a to be feasible. The higher the DNI the more
electricity can be produced, resulting in a lower levelized cost of energy (LCOE) (see Figure 10). Chile’s
North has some of the best conditions for CSP in the world, with DNI levels of up to 3,000 kWh/m²/a and
a high number of sunny days. Compared to Spain, which is generally used as a reference case, the LCOE
in northern Chile could be 33-35% lower.19
17
http://bit.ly/IRENA_CSP, p. 14. 18
Ernst & Young Fraunhofer, 2010. 19
http://bit.ly/IRENA_CSP, p. 31.
Chile CTF-IDB Concentrated Solar Power Project p. 13
Figure 10. The LCOE of CSP Plants as a Function of DNI (Solar Irradiation)
Source: IRENA http://bit.ly/IRENA_CSP, p. 38.
27. Chile’s North also has very rich sodium and potassium nitrate resources which are the standard heat
storage fluids for CSP with TES using molten salt technology, and solid industrial infrastructure for
extraction and processing is in place. A reduction in LCOE of roughly 20% is possible with molten salt
technology relative to thermal oil storage.20
28. Storage makes CSP a more manageable and dispatchable RE resource and can be seen as an enabling
technology to help integrate into grids larger amounts of variable renewable resources such as solar PV or
wind power, thereby increasing overall grid flexibility, which is seen as one of the bottlenecks for
renewables in the SING.
29. Looking forward to future market potential, mid-sized CSP plants can be highly competitive in
remote facilities (such as mines) where significant quantities of electricity or high-temperature thermal
energy are needed, especially if these energy needs are met with heavy fuel oil transported to the site by
single truck loads.
Global Context for Concentrated Solar Power
Track Record and Cost Outlook
30. CSP is a proven, commercially available technology that is experiencing rapid growth. Between
1985 and 1991, 354 MW of solar CSP power plants were deployed in southern California. These plants
are still in commercial operation today and have demonstrated the potential for long-term viability of
CSP. By the end of March 2012 global installed capacity of CSP plants was 1.9 GW (with more than 60
projects in operation).21
More than 90% of these are based on the parabolic trough technology, with an
overall capacity of 1.8 GW. The other two technologies are solar towers (70 MW) and Fresnel (35 MW).
31. As of today, more than 100 projects are in the planning phase, mainly in Spain, the Middle-East and
North Africa (MENA Region), South Africa, Australia, China and the USA. CSP deployment is expected
20
Bloomberg New Energy Finance, Shining a light on parabolic trough LCOE reductions, 26 January 2012. 21
Cost Analysis CSP; IRENA; 2012.
Chile CTF-IDB Concentrated Solar Power Project p. 14
to reach an installed capacity of 148 GW (340 TWh) in 2020, 337 GW (970 TWh) in 2030, and
1,089 GW (4,050 TWh) in 2050.22
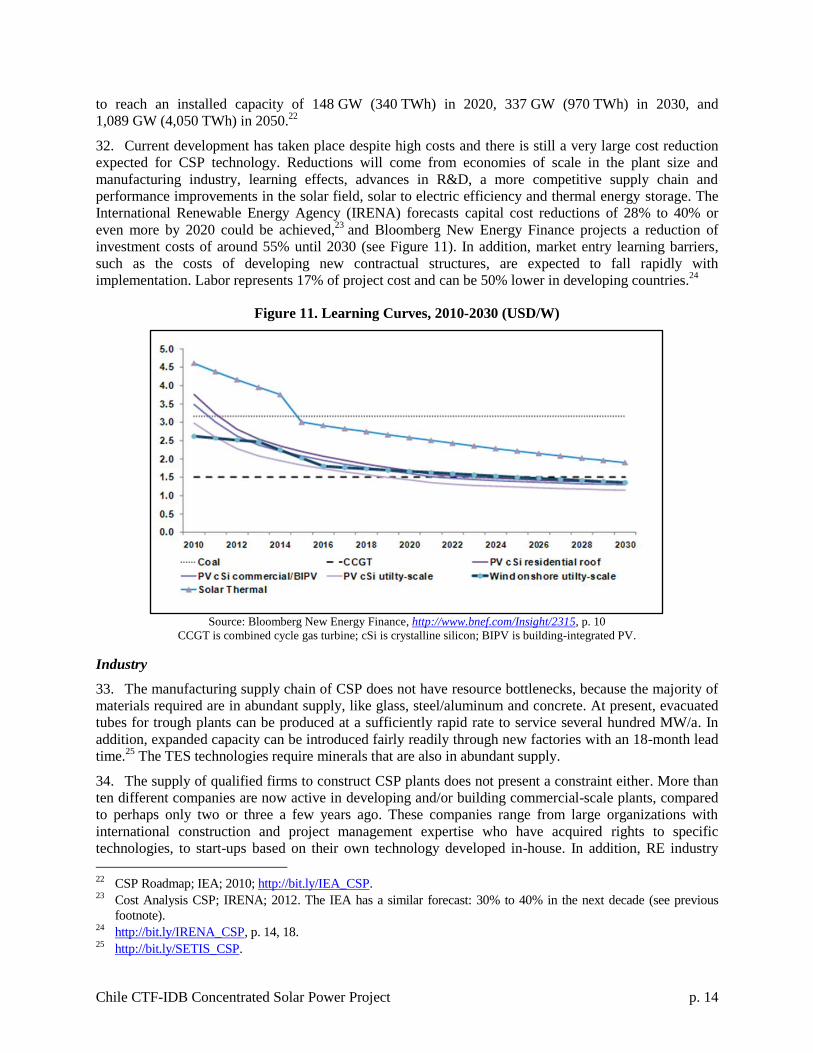
32. Current development has taken place despite high costs and there is still a very large cost reduction
expected for CSP technology. Reductions will come from economies of scale in the plant size and
manufacturing industry, learning effects, advances in R&D, a more competitive supply chain and
performance improvements in the solar field, solar to electric efficiency and thermal energy storage. The
International Renewable Energy Agency (IRENA) forecasts capital cost reductions of 28% to 40% or
even more by 2020 could be achieved,23
and Bloomberg New Energy Finance projects a reduction of
investment costs of around 55% until 2030 (see Figure 11). In addition, market entry learning barriers,
such as the costs of developing new contractual structures, are expected to fall rapidly with
implementation. Labor represents 17% of project cost and can be 50% lower in developing countries.24
Figure 11. Learning Curves, 2010-2030 (USD/W)
Source: Bloomberg New Energy Finance, http://www.bnef.com/Insight/2315, p. 10
CCGT is combined cycle gas turbine; cSi is crystalline silicon; BIPV is building-integrated PV.
Industry
33. The manufacturing supply chain of CSP does not have resource bottlenecks, because the majority of
materials required are in abundant supply, like glass, steel/aluminum and concrete. At present, evacuated
tubes for trough plants can be produced at a sufficiently rapid rate to service several hundred MW/a. In
addition, expanded capacity can be introduced fairly readily through new factories with an 18-month lead
time.25
The TES technologies require minerals that are also in abundant supply.
34. The supply of qualified firms to construct CSP plants does not present a constraint either. More than
ten different companies are now active in developing and/or building commercial-scale plants, compared
to perhaps only two or three a few years ago. These companies range from large organizations with
international construction and project management expertise who have acquired rights to specific
technologies, to start-ups based on their own technology developed in-house. In addition, RE industry
22
CSP Roadmap; IEA; 2010; http://bit.ly/IEA_CSP. 23
Cost Analysis CSP; IRENA; 2012. The IEA has a similar forecast: 30% to 40% in the next decade (see previous
footnote). 24
http://bit.ly/IRENA_CSP, p. 14, 18. 25
http://bit.ly/SETIS_CSP.
Chile CTF-IDB Concentrated Solar Power Project p. 15
majors (independent power producers such as Acciona and utilities such as Iberdrola and Florida Power
& Light) also have an important role in this rapidly growing market.26
PROBLEM AND PROJECT DESCRIPTION
Problem Description
35. Despite the favorable regulatory framework and cost reductions, RE needs to compete in the Chilean
electricity market with conventional technologies. Solar power technologies still face a price gap between
their production costs and the price off-takers can pay (see Figure 12). A number of factors contribute
today to narrowing this gap by either increasing the price that potential off-takers would be willing to pay
for RE-based electricity (vis-à-vis fossil fuel-based electricity), or reducing the production costs.
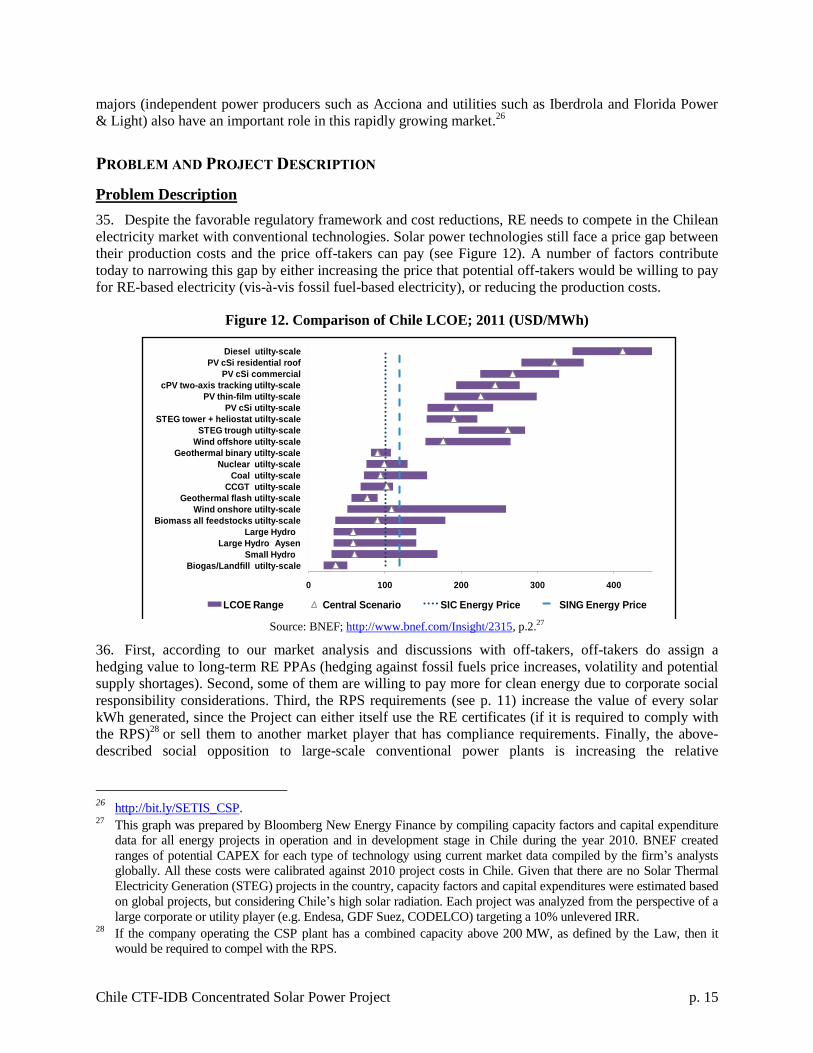
Figure 12. Comparison of Chile LCOE; 2011 (USD/MWh)
Source: BNEF; http://www.bnef.com/Insight/2315, p.2.27
36. First, according to our market analysis and discussions with off-takers, off-takers do assign a
hedging value to long-term RE PPAs (hedging against fossil fuels price increases, volatility and potential
supply shortages). Second, some of them are willing to pay more for clean energy due to corporate social
responsibility considerations. Third, the RPS requirements (see p. 11) increase the value of every solar
kWh generated, since the Project can either itself use the RE certificates (if it is required to comply with
the RPS)28
or sell them to another market player that has compliance requirements. Finally, the above-
described social opposition to large-scale conventional power plants is increasing the relative
26
http://bit.ly/SETIS_CSP. 27
This graph was prepared by Bloomberg New Energy Finance by compiling capacity factors and capital expenditure
data for all energy projects in operation and in development stage in Chile during the year 2010. BNEF created
ranges of potential CAPEX for each type of technology using current market data compiled by the firm’s analysts
globally. All these costs were calibrated against 2010 project costs in Chile. Given that there are no Solar Thermal
Electricity Generation (STEG) projects in the country, capacity factors and capital expenditures were estimated based
on global projects, but considering Chile’s high solar radiation. Each project was analyzed from the perspective of a
large corporate or utility player (e.g. Endesa, GDF Suez, CODELCO) targeting a 10% unlevered IRR. 28
If the company operating the CSP plant has a combined capacity above 200 MW, as defined by the Law, then it
would be required to compel with the RPS.
0 100 200 300 400
Biogas/Landfill utilty-scale
Small Hydro
Large Hydro Aysen
Large Hydro
Biomass all feedstocks utilty-scale
Wind onshore utilty-scale
Geothermal flash utilty-scale
CCGT utilty-scale
Coal utilty-scale
Nuclear utilty-scale
Geothermal binary utilty-scale
Wind offshore utilty-scale
STEG trough utilty-scale
STEG tower + heliostat utilty-scale
PV cSi utilty-scale
PV thin-film utilty-scale
cPV two-axis tracking utilty-scale
PV cSi commercial
PV cSi residential roof
Diesel utilty-scale
LCOE Range Central Scenario SIC Energy Price SING Energy Price
Chile CTF-IDB Concentrated Solar Power Project p. 16
attractiveness of other technologies including solar. By virtue of some of these factors, two solar PV
power projects have been completed in the North of the country, with a total capacity of 1.3 MW.29
37. Despite these factors that contribute to bridging the price gap, and despite the technical virtues of
CSP with TES, this technology still faces considerable cost and risk barriers, and thus requires short term
public support. As in other country contexts, in the immediate term this technology will need subsidies to
lower its LCOE into an affordable range, until it becomes less expensive in the medium term.
38. Unlike fossil fuel-fired plants, the LCOE of CSP is dominated by initial investment cost, including
financing. CSP technology has relatively high capital expenses. Technology costs cannot be lowered in
the immediate term, but they are expected to fall in the medium term with enough deployment, economies
of scale, learning and R&D, thus making a clear case for a temporary subsidy. Financial costs also make
up a large share of total CSP costs, and these are risk-related. Because of the newness of this technology
for the country, both financial institutions and equity providers are reluctant to provide financing because
they assess the project as relatively more risky. While CSP is internationally proven, there is no track
record in the country, and therefore there is no verified technology performance data for national
conditions, which increases perceived financial risk. In addition, it is clear that without government
support and subsidies, the project would not be profitable, which deters financing.
39. High perceptions of risk and not enough subsidies will result in no financing provided to the project,
or financing provided at unaffordable rates, which drives up the LCOE. If subsidies and concessional
finance are provided by a few public actors to this project, as well as by the multilateral development
banks (MDBs), lowered LCOE will make the remainder of finance possible from the financial markets, as
well as make the next project more feasible at closer to market rates due to reduced perceived risk, better
data, learning, and lowered technology costs over time. In order to close the cost gap, it will be necessary
to seek the most preferential possible terms from each of the public actors that are providing support to
this Project. In addition, providing as much inexpensive financing as possible will allow the plant to reach
a larger size and thus significantly reduce LCOE. For instance, specific costs of a parabolic trough CSP
plant can be reduced by 20% if it increases from 50MW to 200MW in size.30
Previous and Ongoing Activities
40. Several national and international organizations have been collaborating with the Energy Ministry in
different activities related to the development of solar power. Since June 2011, the IDB has supported the
ATACAMATEC technical cooperation activity, which includes several studies connected with solar and
marine power in Chile. The Energy Ministry has also been working hand in hand with GIZ since 2006 on
different fields related to the solar energy industry. Among the main elements of this collaboration is the
support to the creation of an online wind and solar explorer by the Geophysics Department of the
University of Chile and the Energy Ministry. This tool provides valuable information on wind velocity as
well as solar radiation by location around the country (http://ernc.dgf.uchile.cl/Explorador/Solar2/). This
data is an essential input in the assessment of potential solar energy projects and bolsters the development
of such projects. In addition, representatives of the Energy Ministry and others from different entities
closely related to the energy industry travelled to Spain to learn about solar CSP projects currently in
operation and the applicability of the technology in Chile. Finally the Energy Ministry and CORFO are
jointly preparing an international tender to install a center for excellence in solar power in Chile. High-
level authorities will be meeting a series of key global partners to promote this center. Finally, the
Promotion and Development of Local Solar Technologies in Chile project, funded by the Global
Environment Facility (GEF), and scheduled for IDB Board approval in 2012, will focus on technology
transfer activities (including CSP) to foster the national solar energy market.
29
Other projects are in scoping phases but have not advanced yet. 30
http://bit.ly/IRENA_CSP, p. 23.
Chile CTF-IDB Concentrated Solar Power Project p. 17
Project Description
41. The goal of the CSP Project (or “the Project”) is to enable the construction of the first solar CSP
power plant with TES in South America. In the case of CSP technology (unlike PV) scale is of utmost
importance, not only because of the significant economies of scale, but also because a large-scale project
can attract the interest of both global industry leaders and local large-scale off-takers, whose participation
is key in this Project. CSP is still very expensive but its cost per MWh can become affordable if a large
scale is reached.
42. This is why the GoC has been convening a number of sources of concessional finance,
complemented with some sources of market-based finance, in order to target a Project with reasonable
economies of scale, which would effectively help Chile to reach its objective of keeping pace with
economic growth, while reducing its high dependence on fossil fuels.
43. The following sources of assistance are expected to support the CSP Project with TES:
a USD 66M concessional loan from the CTF;
a market-based loan from IDB of at least the same amount;
a market-based loan from IFC or a commercial lending institution;
a grant from the GoC of an amount to be defined;
the use of a prime plot of land with some of the studies required to get the environmental
permits, to be made available by the GoC (note that, in Northern Chile, regardless of
technology, land availability is a very important element in determining the success of a
generation project, due to the existence of mining concessions in around 90% of the land);
a potential USD 30M loan from the IDB-managed Canadian Climate Fund for the Private
Sector in the Americas, which will have a concessional interest rate and be subordinated with
respect to the senior debt;
KfW, on behalf of the German government, has shown interest in providing a EUR 100M loan
with a concessional interest rate, to be channeled through Corporación de Fomento de la
Producción de Chile (CORFO)31
to local banks collaborating with the Project; currently the
GoC and KfW are analyzing the KfW loan alternative;
and finally, if this loan materializes, KfW and IDB are considering applying for a EUR 15M
grant from the European Union’s Latin-American Investment Facility (LAIF).
44. The different sources of support will be combined as follows: The Ministry will launch a competitive
bidding process for the government grant, which would be managed by CORFO. The winner of the
bidding process will have to subsequently meet IDB and CTF financial, legal, environmental and other
requirements to receive access to the CTF concessional funds and IDB market-based financing. IFC may
also provide a loan to the Project. To the extent they are approved, the other concessional resources just
mentioned would also be made available to the winner of the bidding process. These sources of financing
would be combined to bring down the cost of the Project and allow it to have significant scale.
45. With the support of ATACAMATEC, the GoC is in the process of designing the competitive
tendering process, following best practice in the power and energy markets and tailored to the Chilean
legal, regulatory and industry context. The tendering process is designed to minimize any potential market
distortions, and ensure the most efficient use of public resources.
46. Through this selection process the GoC guarantees that the project proposal receiving the
concessional and public funds is the most solidly structured project among the bidders. Finally, from a
political perspective, the design of the tendering mechanism is aligned with Chile’s National Energy
Strategy: “with the aim of attracting investors interested in developing NCRE projects, open tender
31
CORFO is an executing agency of government policies in the field of entrepreneurship and innovation, through tools
and instruments compatible with the main guidelines of a social market economy.
Chile CTF-IDB Concentrated Solar Power Project p. 18
processes will be conducted by NCRE blocks, in which participating generators may be awarded a State
subsidy to improve the conditions of energy sales which will be defined according to the bids submitted.
This will diminish the risks to which such projects are currently exposed. Through this measure, we will
support those new technologies that are not currently competitive enough to develop”.
47. The Project financing package will be completed by an equity contribution by a private party, as well
as possibly market-priced debt financing, most likely from commercial banks to be negotiated once the
GoC competitive tender is awarded. This would provide an opportunity for domestic banks to gain
valuable experience and likely reduce their risk perception of CSP technology. Participation of domestic
commercial banks would be facilitated through the KfW-CORFO line, which would enable them to
procure financing for their loan operations cheaply. The blended IDB financing package will include a
senior loan of up to 25 percent of the total cost of the Project, together with the CTF’s USD 66M.
Financing will be structured considering all sources of concessional funds and with the intent to provide
minimum necessary financial return to each source but provide as much concessionality as is necessary
for the Project. Because of the still-large pricing gap between CSP and the existing conventional
technologies in Northern Chile (i.e. coal and natural gas), it is likely that maximum possible
concessionality will be needed from each concessional source.
48. As explained above, the GoC is seeking to assemble as many sources of concessional finance as
possible, in order to reach the desired Project scale. However, to date, there is still uncertainty with
regards to the sources that will be available (including CTF). During the competitive process, information
about the concessional sources available will be communicated to the participants, and they will be
allowed to make their proposals under the assumption that such financing will be available. This will
ensure that the available sources are fully optimized: the greater the amount of concessional finance
available, the larger the project (and its economies of scale) will be and the more likely that a developer
can secure a PPA that is affordable for the off-taker. Furthermore, the competitive process with open
information will optimize the use of concessional resources and permit that the minimum concessionality
principle is followed.
49. It is worth noting that IDB and, if possible, IFC will provide a significant part of the senior debt for
this Project. IDB and IFC have successfully co-financed several CIF investments under the CTF, allowing
the leveraging of much-needed finance to higher risk emission-abating investments and allowing the
program to take advantage of each MDB’s ample financial structuring experience, best practices, and
financial syndication abilities. These amounts are noted in the CSP Financing Plan table (Figure 14).
Knowledge Management and Capacity Building Component
50. As the first CSP project, this effort can have a greater transformational effect in the market if
knowledge creation and management systems are designed. Some elements of this will be structured into
the Government’s CSP subsidy tender document, which will include mechanisms that ensure that
knowledge creation will be spread across the market.
51. The GEF/IDB project (see § 40) will also fund activities aimed at fostering the local markets for
solar technologies, including CSP.
52. In addition, a budget of USD 600,000 is allocated in this proposal for the development of knowledge
management (complementing the proposed activities of the winning developer) and technical cooperation
activities. This assistance program will in particular:
Support the generation and dissemination of information about the performance, lessons
learned, and impacts (in terms of substitution of fossil fuels, GHG emission reductions, benefits
to the local economy, etc.) of the solar projects in Chile.
Support other solar power-related activities, including the creation of a clearinghouse on solar
micro-systems in the context of the net metering regulations.
Chile CTF-IDB Concentrated Solar Power Project p. 19
Support the effective transfer of solar energy knowledge, experiences and technologies for the
training of human capital and for the development of local supply chains.
Assist the GoC in managing the tender and knowledge management processes.
53. In addition the GoC through the Energy Ministry is currently providing financing to support the
establishment of a center of excellence on solar power, which will promote applied research activities and
foster the establishment of a local supply chain.
Financial Instruments
54. As noted at the beginning of this document, this Project will be a private sector-focused effort, which
draws upon the minimum public subsidies necessary. Our preparatory analysis has centered on
developing a package of financing that will likely support a viable project, but the price of power sold had
to be estimated because there is no public off-taker and price will be determined in the market. The
competitive tender described earlier is designed to ensure the most efficient use of resources.
55. The Chile CTF Investment Plan (IP) proposed a budget from the CTF of USD 100M for this CSP
Project (and USD 100M for other projects). When USD 68M were made available to Chile as part of the
first tranche of resources to Phase II countries, the GoC decided to move ahead with this Project despite
the limited resources. This calls for maximizing the catalytic potential of the CTF funds and also for
ensuring that they leverage support from a number of other sources.
56. The analysis of the Project’s need for subsidized financing is based on the results of the pre-
feasibility study carried out during the ATACAMATEC technical cooperation, as well as internal
expertise and consultations, consultation with the GoC and consultations with stakeholders performed
during the project preparation process. Calculations assumed a 50 MW capacity plant, 60% capacity
factor and an installed cost of USD 8.5M per MW, judged to be appropriate based on information
provided by experienced providers of CSP technology. This model was utilized to examine various
financing scenarios. It was also used to derive recommended terms and conditions for the CTF loan that
represent the minimal level of subsidization, which, when combined with the remainder of the Project’s
financing, result in a PPA price that makes the Project financially viable and is acceptable to off-takers
(the “Required PPA Price”). A similar analysis is conducted for the other potential concessional sources
of financing.
57. This modeling exercise, utilizing with the assumptions noted above, was used to develop a Base
Case scenario examining how the CTF could best be utilized. The real aspects of the final project are
certain to be different, but this exercise was utilized to determine a reasonable and effective range of
conditions to be requested for the funds. We found that it was possible to make the project viable with
only partial subordination of CTF, pari-passu with the Canadian Climate Fund, and concessional pricing
from three sources. It was necessary to use highly concessional pricing. In this model scenario, a
USD 20M subordinated CTF loan ranks pari-passu with a USD 20M loan from the Canadian Climate
Fund,32
in order to form the subordinated tranche. Senior lending includes another USD 46M CTF senior
loan ranking pari-passu with an additional USD 10M from the Canada Climate Fund, and other senior
tranches from IDB, IFC, and commercial banks (including those funded by KfW). Of these, CTF, Canada
Climate Fund and KfW would be concessionally priced, with CTF at 1% fixed in this model case.33
This
32
Under the subordination structure proposed, payment of debt service of the subordinated portion of the Canadian
Climate Fund loan and the subordinated portion of the CTF loan (up to 50% of the total CTF loan) would be deferred
if necessary to accommodate potential resource volatility and unforeseen technical problems that the Project may
face. However subordination will only be on payment schedule as it is expected that the CTF Subordinated Loan and
the Canadian Climate Change Fund will share all the security of the Project (including pledge of all assets) together
with senior Lenders. 33
The LAIF grant mentioned above is not considered in these calculations. If available, it could have a significant
beneficial impact in terms of achieving higher capacity, and therefore even better economies of scale.
Chile CTF-IDB Concentrated Solar Power Project p. 20
base case scenario is an important exercise to demonstrate a feasible financing package, but of course the
actual financing would be determined prior to financial closing, taking into account the needs and
technical specifications of the Project, principles of minimum concessionality, and in consideration of
other sources available.
58. It should be stressed that the competitive process on which this Project is based will ensure the
compliance with the minimum concessionality principle that applies to the use of CTF resources for
private sector operations. It should also be noted again that in terms of the overall financing package,
USD 600,000 are requested in grant funding from CTF in order to maximize the learning, supply chain,
scaling-up and technology transfer benefits of the Project, which together will increase the technical and
knowledge capacity of the sector and the financial sustainability of the intervention.
59. The results of our calculations demonstrate the impact of public concessional finance on the
Required PPA Price, according to the model Base Case scenario just described. All of the sources of
financing are necessary, but the CTF tranche makes the most impact on the Project and is crucial to bring
the Project into the range of possible pricing. This tranche would be truly catalytic, leveraging between
USD 340 and 380M in other financing.
60. As noted, the previous passages are based on a model scenario, but actual conditions will differ.
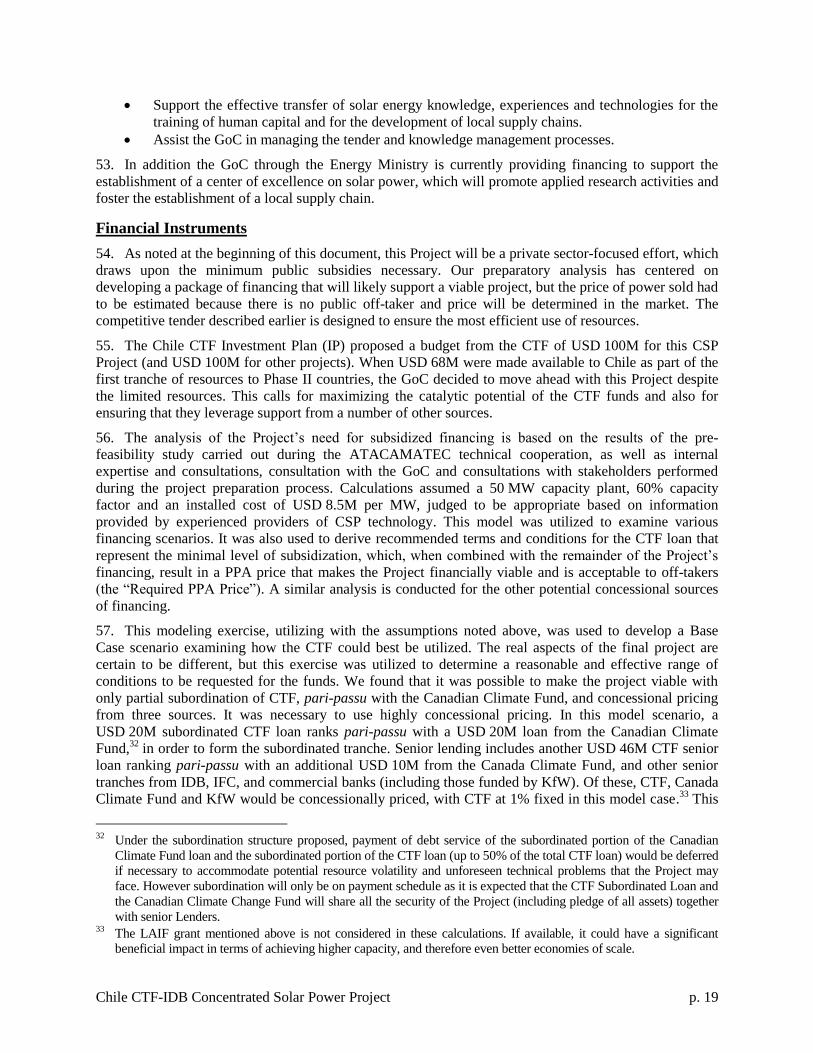
Therefore a range of terms is requested for this intervention, which is expected to be sufficiently flexible
to allow for catalytic support to the Project. A summary of the proposed investment terms for the present
Program is shown in Figure 13 below.
Figure 13. Summary of CTF Investment Terms
Estimated project size USD 400 to 450M
Financial Instrument Loan
Size of loan USD 66M
Tenor Up to 20 years
Seniority / security Senior and subordinated tranches, with up to 50% of total CTF resources subordinated
on payment. Both tranches sharing full security with senior lenders.
Pricing 50 – 200 bps
Additional Support
61. As noted above, in addition to the CTF concessional funds and the GoC grant, the Project is expected
to have access to additional funds from other multilateral and bilateral development agencies. These funds
would join the CTF in closing the gap that exists between CSP LCOE and the price that an off-taker
would be willing to pay, given the availability of other cheaper sources of fossil-fueled power.
FINANCING TABLE
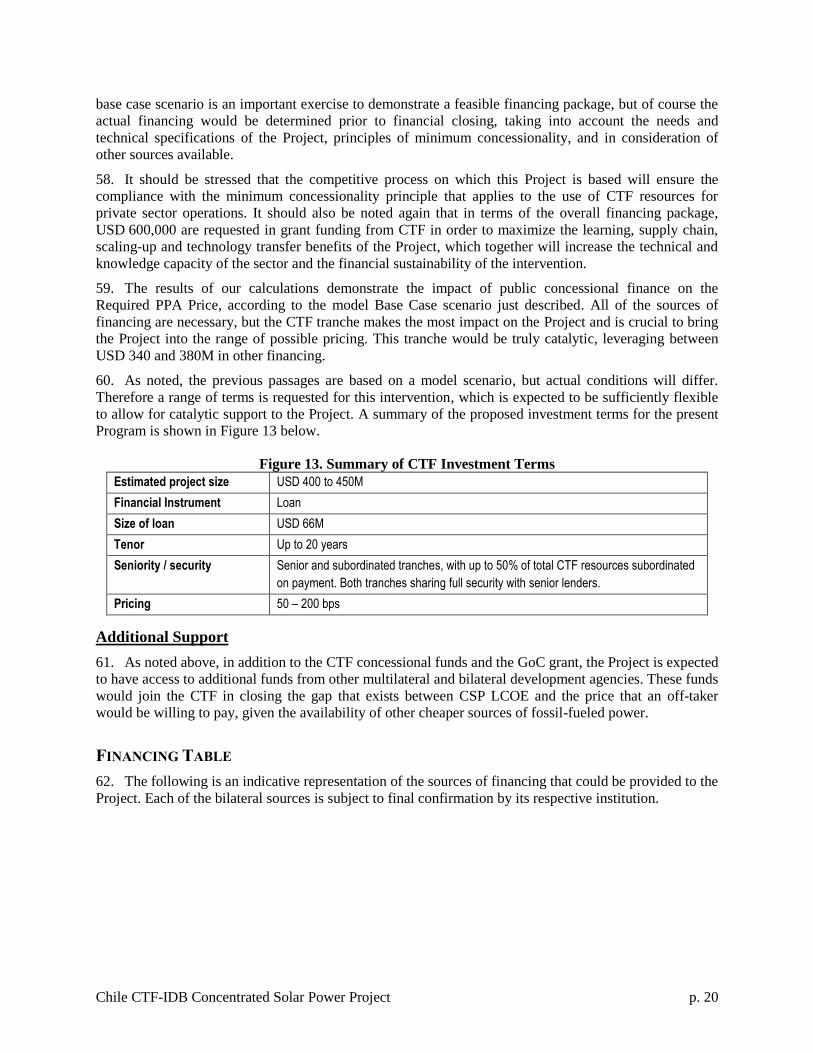
62. The following is an indicative representation of the sources of financing that could be provided to the
Project. Each of the bilateral sources is subject to final confirmation by its respective institution.
Chile CTF-IDB Concentrated Solar Power Project p. 21
Figure 14. Indicative CSP Financing Package (USD M)
Source Type USDM
Debt
CTF loan Sr. Loan 20
IDB Loan Sr. Loan TBD
IFC or Private Bank Loan Sr. Loan TBD
Canada Climate Fund Sr. Loan 10
KfW Sr. Loan 113
CTF loan Sub. Loan 46
Canada Climate Fund Sub. Loan 20
Equity/Grant
Shareholder's Equity Equity 64
Gov. of Chile Grant TBD
Total 400 to 450
63. The following table summarizes the resources available for technical cooperation and knowledge
management activities.
Figure 15. Indicative Technical Cooperation and Knowledge Management Budget (USD M)
Source USDM
GEF grant 0.5
CTF grant 0.6
IDB grant 0.7
Total 1.8
The IDB grant includes the CSP-related activities of the
ATACAMATEC project, as well as other planned activities.
FIT WITH CTF INVESTMENT CRITERIA
Transformational Strategy
64. As noted in the Chile CTF IP, this Project is part of a comprehensive transformational strategy to
lower risk and cost barriers and catalyze RE development in Northern Chile. Specifically, the GoC has
targeted solar energy for support because it is on the verge of commercial uptake but still experiencing
significant barriers, and because the vast solar resources of Chile present compelling potential for
development. The CTF IP includes one component to support financing of solar PV (a technology that is
more imminently scalable) and the present Project, which seeks to lower barriers specific to CSP because
of its desirable technical aspects. CTF efforts will join other policy and financial contributions facilitated
or executed by the Chilean government and discussed in detail earlier in this proposal and in the IP.
65. This first CSP Project aims to shift the energy matrix of Northern Chile to a lower-carbon path and
will transform the market by helping to improve risk-return imbalances and cost barriers faced by the first
entrant. Moreover, it will serve as a valuable benchmark for the financing and technology assessment of
future CSP projects in Chile and elsewhere in Latin America. As a result, it is expected to create a
copycat effect, whereby a successful project can catalyze investments in further CSP projects as risks are
effectively lowered, and technology costs improve over time. It will also facilitate the creation of further
bankable PPAs for future CSP projects.
66. This Project seeks to reduce temporary cost barriers for a proven technology. Barriers are expected
to fall in the medium term through learning, technology improvements, economies of scale, and an
Chile CTF-IDB Concentrated Solar Power Project p. 22
improved track record. The Project also addresses risk. Perceived risk by developers, off-takers and
banks stems in part from the simple lack of any demonstration project in the region, and therefore lack of
data and experience in implementation. As this Project will be the first solar CSP project to be built and
financed in South America, it will definitely serve as a valuable benchmark for the financing of future
similar projects and will bolster the necessary experience to the financial industry for future project
assessment. Once the financing of this Project is closed, it will be a benchmark for future CSP projects in
the region, allowing financial institutions and off-takers to better assess the benefits of the technology as
it has already happened in Europe and the USA. Moreover, the business model (i.e. PPA structure) agreed
between the Project and the off-taker will serve as a precedent not only for solar CSP projects but for
other RE projects.
Fit with Chile’s Investment Plan
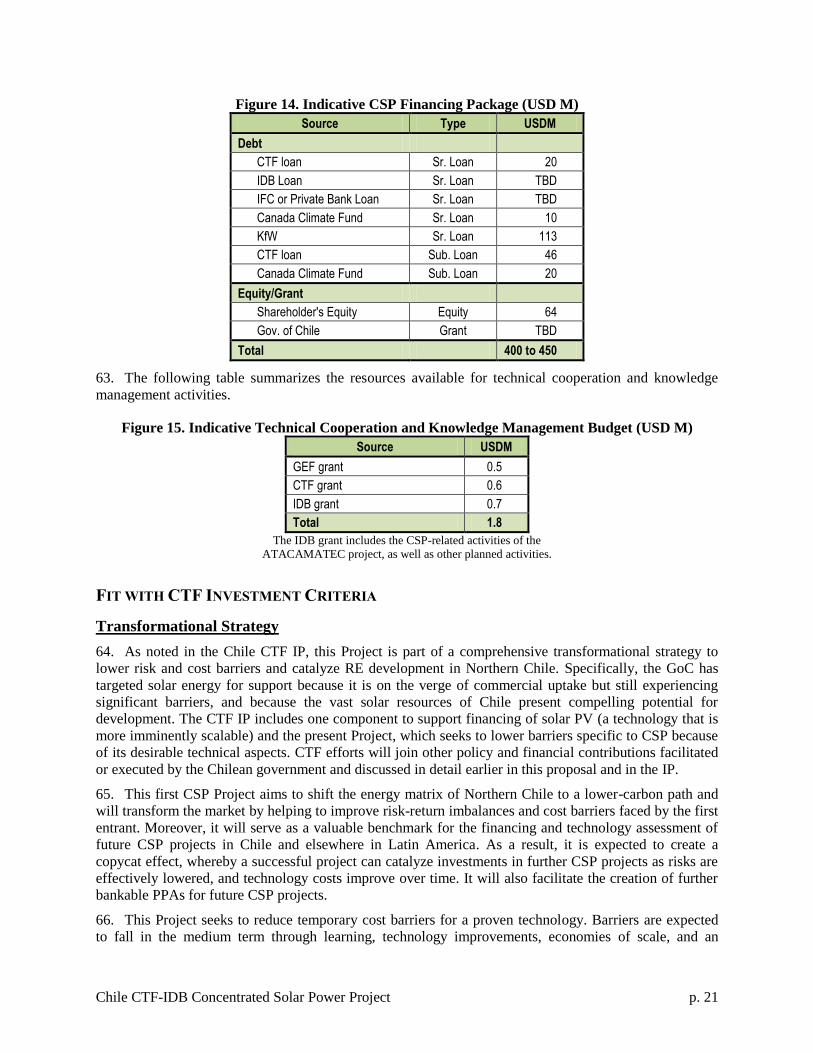
67. There are three components selected for CTF co-financing intervention in the Chile CTF IP, which
requested a total of USD 200M. Component 1: a concentrated solar power project (CSPP), component 2:
a large-scale grid-connected solar PV program (LSPVP) and component 3: a renewable energy self-
supply and energy efficiency program (RESSEE).
68. On May 3rd, 2012 the Trust Fund Committee endorsed the IP as a basis for the further development
of activities for CTF funding, and on August 17th it approved the allocation of USD 68M for Chile, as part
of a first tranche of finance for Phase II countries. The GoC requested to use USD 1M of CTF financing
for the RESSEE preparation grant and USD 67 million for the CSPP.
Figure 16. CTF Investment Plan Components
Potential GHG Emission Reductions
69. The emission reductions of this Project over its lifetime are 5.7 Mt CO2e. The following values were
assumed:
Capacity factor: 60%34
Capacity: 50MW
SING emission factor: 0.725 Ton CO2e/MWh
Lifetime: 30 years35
70. The Project would ultimately result in much more reductions due to its catalytic impact on the
market.
34
We have used a standard 60% CSP capacity factor, but this could vary from 40% to 75%, resulting in CO2e-
equivalent emissions between 3.8 and 7.1 Mt. 35
While our project financing calculations are based on a PPA spanning 20 years, it is likely that the project could go
on generating for 10 more years.
CTF Investment Plan
USD 200M
Concentrated Solar Power
Project (CSPP)
USD 100M
Large-scalegrid-connected
PV Program (LSPVP)
USD 50M
RESSEE program
USD 50M
Chile CTF-IDB Concentrated Solar Power Project p. 23
Cost-Effectiveness
71. The GHG mitigation cost-effectiveness for a CTF investment of USD 67M and a GHG emission
reduction of 5.7 Mt CO2e is 11.7 USD per ton abated.36
As noted in the previous section, this immediate
Project could have a catalytic effect on the RE market, ultimately resulting in greater emission reductions
as the CAPEX of CSP technology falls, learning and risk reduction take place, and more capacity gets
installed. Cost effectiveness would therefore increase for future investments.
Demonstration Potential at Scale
72. Chile’s 2006 GHG emissions of the energy industry37
were 20.7 Mt CO2e. As explained above, an
additional 800 MW of generation capacity will be needed per year (totaling 4 GW by 2016) and under a
BAU scenario, most of this new annual capacity installed will be fossil based (coal-and diesel). GHG
emissions are therefore expected to increase between 3-5% annually.
73. Expected reductions resulting directly from the CTF intervention and implementation of this Project
are estimated at 194,000 t/a, for a total of 5.8 Mt CO2e over 30 years. While it is impossible to be certain
what projects may follow, it would not be unreasonable to think that 10 similar projects could come on
line in Chile within the following 15 years, resulting in an additional 58 Mt CO2e of emissions abated.
Falling technology costs will also set in motion a virtuous cycle as larger plant sizes lead to lower LCOE.
Development Impact
74. As in many countries, energy is tightly intertwined with economic and social development in Chile.
Chile is an export-oriented economy with the mining sector being its most important contributor,
responsible for more than 50% in overall value of exports. The sector is also expected to create around
200,000 new jobs in the next decade.38
Mining activities, concentrated in the North, rely heavily on
energy inputs and have a high impact on the country’s energy consumption. As noted, mining and
industry on the SING are highly carbon-intensive and dependent on fossil imports.
75. In recent years Chilean citizens have taken a strong position against large energy projects which
resulted in cancellation of several coal plants in the North like Barracones (2010), Castilla (2011) and
Punto Alcalde (2012), amongst others, and there is growing environmental concerns about this
technology.
76. Scaling-up CSP technology in the northern regions, would therefore help increase energy security
through diversification of its energy supply, reduce imports of fuels with volatile prices and increase and
reduce its carbon intensity. This will improve the resiliency of the Chilean economy to price shocks. CSP
development in this region with competitive natural resources could also drive the development of a new
value chain.
77. The impact expected of a 50 MW CSP project on the local economy in terms of direct and indirect
jobs produced, both at the construction and the operation stages, is 1,125 during the construction period
and 64 annual jobs during operating years. This forecast is based on the JEDI tool (“Jobs and Economics
Development Impact Model”) of NREL, which determines the number of jobs by type and by stage as
well as the income they receive both workers and the local economy.39
As noted elsewhere, this positive
impact would be replicated as the successful Project makes following CSP projects more viable.
36
Depending on the plant factor the cost effectiveness can vary between 9.4 USD/t (75% plant factor) and 17.6 USD/t
(40% plant factor). 37
The energy industry (including de production of electricity and heat, oil and gas refining, and transformation of solid
fuels among others) has the highest GHG contribution (36%) among the energy sector. 38
Fuerza Laboral en la Gran Minera de Chile; Fundación Chile; 2012. 39
Hentzschel F. García R, Escobar R. Impact of investment tax credits in the development of a CSP industry in Chile.
Chile CTF-IDB Concentrated Solar Power Project p. 24
78. In addition, as stated on the IP, the GoC will launch coordinated efforts toward promoting jobs for
women in the RE industry, in line with its Plan for Equal Opportunities, which aims to increase the
participation of women in the labor market and eliminate discrimination.
Implementation Potential
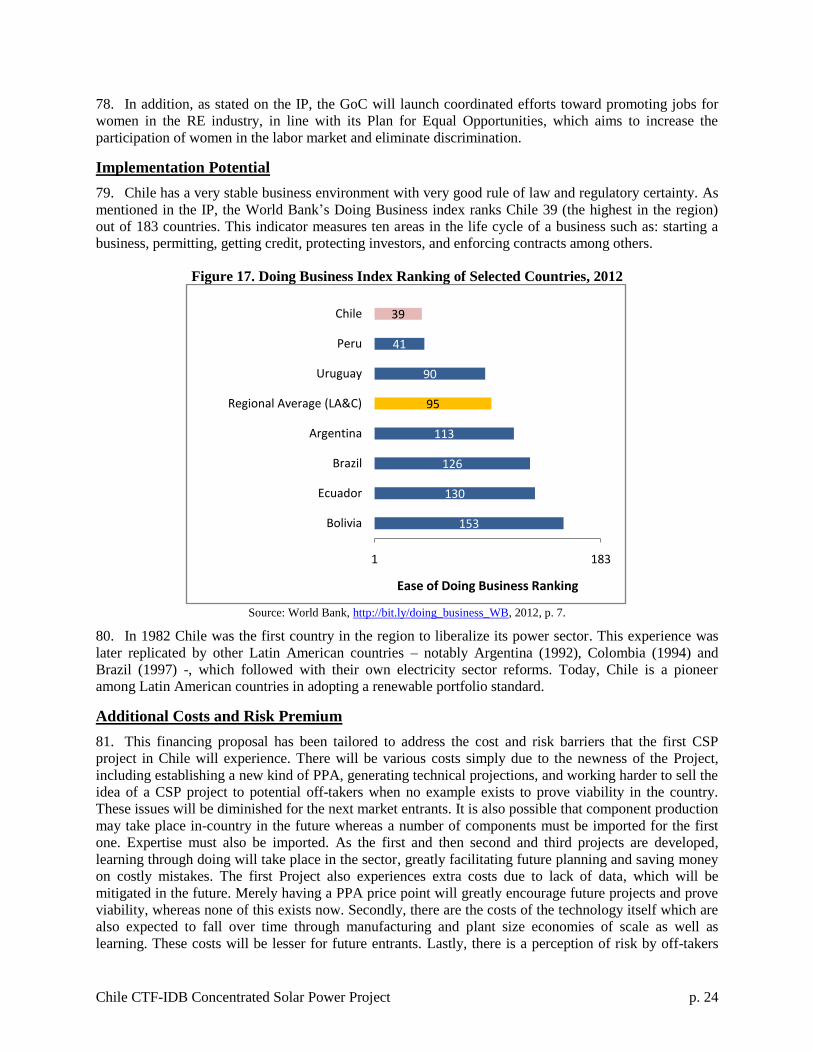
79. Chile has a very stable business environment with very good rule of law and regulatory certainty. As
mentioned in the IP, the World Bank’s Doing Business index ranks Chile 39 (the highest in the region)
out of 183 countries. This indicator measures ten areas in the life cycle of a business such as: starting a
business, permitting, getting credit, protecting investors, and enforcing contracts among others.
Figure 17. Doing Business Index Ranking of Selected Countries, 2012
Source: World Bank, http://bit.ly/doing_business_WB, 2012, p. 7.
80. In 1982 Chile was the first country in the region to liberalize its power sector. This experience was
later replicated by other Latin American countries – notably Argentina (1992), Colombia (1994) and
Brazil (1997) -, which followed with their own electricity sector reforms. Today, Chile is a pioneer
among Latin American countries in adopting a renewable portfolio standard.
Additional Costs and Risk Premium
81. This financing proposal has been tailored to address the cost and risk barriers that the first CSP
project in Chile will experience. There will be various costs simply due to the newness of the Project,
including establishing a new kind of PPA, generating technical projections, and working harder to sell the
idea of a CSP project to potential off-takers when no example exists to prove viability in the country.
These issues will be diminished for the next market entrants. It is also possible that component production
may take place in-country in the future whereas a number of components must be imported for the first
one. Expertise must also be imported. As the first and then second and third projects are developed,
learning through doing will take place in the sector, greatly facilitating future planning and saving money
on costly mistakes. The first Project also experiences extra costs due to lack of data, which will be
mitigated in the future. Merely having a PPA price point will greatly encourage future projects and prove
viability, whereas none of this exists now. Secondly, there are the costs of the technology itself which are
also expected to fall over time through manufacturing and plant size economies of scale as well as
learning. These costs will be lesser for future entrants. Lastly, there is a perception of risk by off-takers
153
130
126
113
95
90
41
39
1 183
Bolivia
Ecuador
Brazil
Argentina
Regional Average (LA&C)
Uruguay
Peru
Chile
Ease of Doing Business Ranking
Chile CTF-IDB Concentrated Solar Power Project p. 25
and banks surrounding unfamiliar CSP technology. For a conservative bank which has no proof that the
technology is viable in Chile, the perceived risk in financing an unproven technology is not offset by the
interest rate that they could charge, although according to consultations the real concern of banks is the
financial viability of the Project, which is linked to costs. Also, as demonstrated earlier, due to the
expense of this technology and various barriers for new entrants, the return on equity is simply too low to
offset the risks that the investor would take and entice them to provide financing. Again this essentially
boils down to primarily a cost problem.
82. All of these costs and risks will be decreased after the implementation of the first CSP Project, due to
changes in the market or global changes in the cost of technology over time. As discussed above, various
sources of financing are being sought to together bring down the LCOE of the Project. Through financial
and market modeling, we found that the most impactful use of the CTF funds was a partial use of
subordination, because this would possibly allow for a reduction of the amount of equity required and
therefore avoid the additional costs of equity. This use of funds was more effective than the simple use of
concessional interest rates on a senior loan.
83. Limited subordination of CTF funds in this Program is designed to take on more of the risk of the
Project but not receive the commensurate returns that a typical investor would, thereby alleviating the
costs of the Project. This will make the Project financials much more viable, attract other cooperative
sources of financing, and allow IDB and possibly IFC or another bank to provide senior tranches without
jeopardizing their own credit ratings. By providing subordinated and concessional financing, CTF reduces
the overall risk of the Project and also reduces costs. Our request for a maximum of 50% subordination is
meant to make the most impactful use of the limited funds available, but not over-subsidize.
84. Offering a lower-than-market interest rate to the Project is proposed to directly offset its higher costs.
Plans to coordinate CTF financing with other sources of subsidy and concessional finance are meant to
both provide for the minimum use of CTF subsidy necessary and also address the large gap in CAPEX
and other costs. The competitive process ensures compliance with the principle of minimum
concessionality.
85. The grant elements in this Project are meant to ensure replication and potential for scale-up, as well
as financial sustainability in the market. They have been sized to help the developer execute the technical
assistance requirements of the GoC grant, as well as to ensure the maximum long-term impact of the CTF
funds.
Financial Sustainability
86. As described in Chile’s IP, the energy sector is 100% privatized in Chile so the CTF will provide
direct support to the private sector. This is with the intent the market will be enabled to provide low-
carbon energy services in the future with increased financial sustainability and much lowered need for
subsidies - and eventually without them. The lack of demand so far for CSP and other clean RE
technologies with substantial public benefits represents a market failure, and so it is considered that public
support is appropriate in order to facilitate a transition to widespread commercial implementation of the
technology, and mitigate the market entry costs that first developers face. Public sources of financing will
be used in this Program to “de-risk” this proven technology for the Chilean market and reduce its costs,
currently high due to its limited deployment so far.
87. Since Chile enjoys a stable investment environment and vibrant private investment community, it is
anticipated that this assistance will be readily absorbed and leveraged by private actors. According to
Bloomberg New Energy Finance, CSP projects in Chile could reach grid parity by around 202040
and
therefore no longer need public support. In addition, it is expected that building a new CSP plant in the
next two to five years will fast-track the timing of additional projects, because investors will have more
40
Bloomberg New Energy Finance, Chile’s challenge: is 20% clean energy by 2020 possible?, 10 May 2010. p 8.
Chile CTF-IDB Concentrated Solar Power Project p. 26
rapid access to market information, more capacity built, and first-mover entry barriers of risk and cost
would be lowered. While it is unlikely for this technology to reach grid parity in the short term, it is
anticipated that global deployment will drive costs down and reduce the need for public support.
Successful implementation of this first-of-its-kind project in South America will provide information and
proof of viability in a new market, allowing second-movers to enter the market with lowered perceived
risks and therefore a lower cost of capital. As this technology falls in cost globally in the medium term
through increased deployment and design/production improvements, the Chilean market will be better
equipped to match it to ample technical opportunities and resources.
88. The deployment of a CSP project, coupled with the knowledge management activities to be funded
with CTF grant resources, would allow organizations in the Chilean industry to learn and gain capacity in
producing and executing CSP technologies, so that they can be scaled up more rapidly in the future.
89. Although we do not expect CSP to reach economic viability without the need for some kind of
subsidy in the short term, we do expect it to reach it in the medium term as different CSP projects
currently under construction or to be constructed in several countries (i.e. USA, Spain, India, South
Africa, Morocco, Saudi Arabia etc.) will decrease costs. In addition, this Project would form part of a
global effort to implement and bring down the cost of this high-potential technology, which, through its
complementarity with energy storage, offers highly desirable technical aspects in terms of flexibility and
overcoming the limitations of solar generation by delivering power on a more constant basis.
Effective Utilization of Concessional Finance
90. Concessional finance for this Project is necessary to reduce its high capital cost compared to
conventional energy sources available in Northern Chile (i.e. coal and natural gas). Because of that, it is
essential for this first CSP project in the country to have access to several sources of concessional
funding. Low cost of financing will allow the Project to reduce its LCOE and be competitive vis-à-vis
conventional energy sources. The availability of concessional funding to finance part of the CSP Project
costs would allow it to significantly reduce the price of energy to be offered to the potential off-taker,
making the Project feasible from a price and market perspective.
91. From an investors point of view a CSP plant without concessional financing would only reach an
IRR of around 7% which is too low, considering this would be the first project of its kind in Chile.
Including grant and concessional financing resources would gradually increase the IRR to around 12%,
which is the estimated minimum return private project sponsors would seek.
92. The competitive process that will be carried out for the allocation of the GoC grant, and of the
concessional loans, including the CTF loan, coupled with a transparent access to information about the
concessional finance available, will allow the concessionality to be maximized. Namely, this scheme will
ensure that the level of concessionality to be offered to the tender winner will be the minimum their
proposal requires.
Mitigation of Market Distortions
93. This Project will not distort the CSP market, because a CSP market does not exist in Chile. This will
be a market-creating financing. Furthermore, it could be said that there is a crowding-in effect because
private agents such as banks and project developers will be interested in investing in CSP in Chile
because of the Project. Without CTF intervention they would not participate because the project would
not be economically feasible. The Project is expected to catalyze and fast-track future projects.
94. The Project has been designed nonetheless to promote the most efficient possible use of public
funds, and reduce the possibility of over-subsidizing the project developer. The tendering process reflects
the idea that the subsidy included in concessional financing should be no greater than necessary to induce
the intended investment. Given that the planned subsidies will not decrease the PPA prices below a
conventional range of market prices, the subsidy will increase the chance that off-takers pay a premium
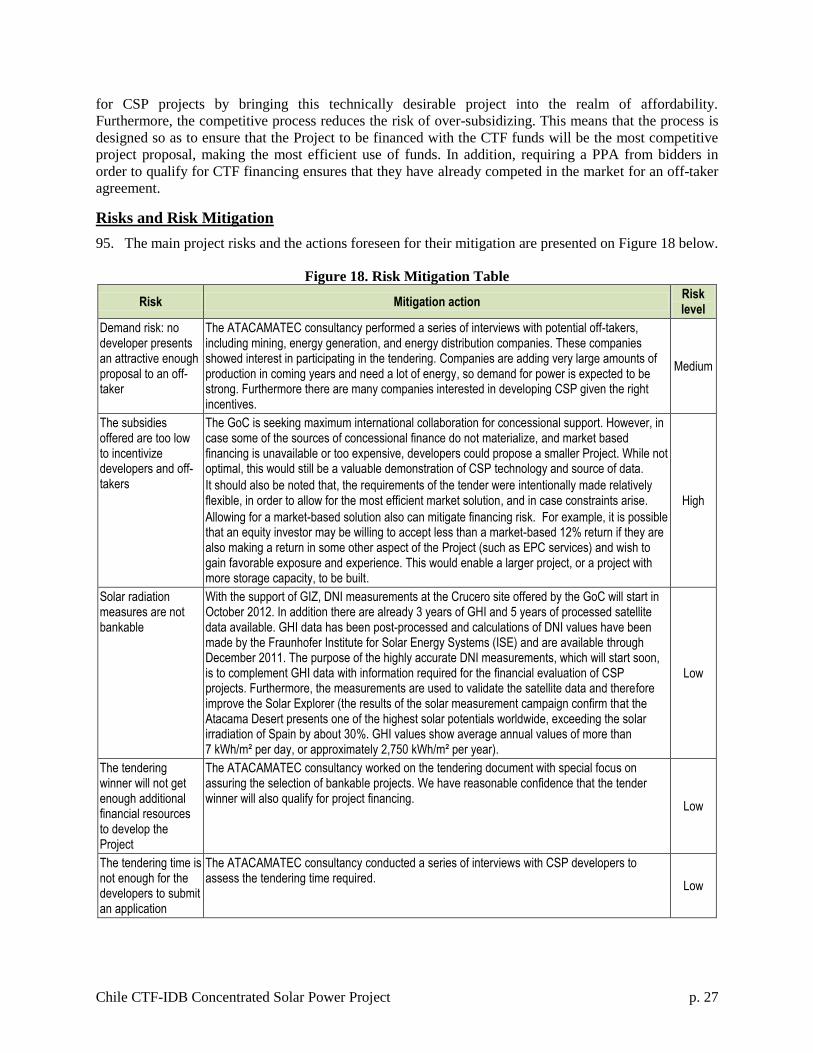
Chile CTF-IDB Concentrated Solar Power Project p. 27
for CSP projects by bringing this technically desirable project into the realm of affordability.
Furthermore, the competitive process reduces the risk of over-subsidizing. This means that the process is
designed so as to ensure that the Project to be financed with the CTF funds will be the most competitive
project proposal, making the most efficient use of funds. In addition, requiring a PPA from bidders in
order to qualify for CTF financing ensures that they have already competed in the market for an off-taker
agreement.
Risks and Risk Mitigation
95. The main project risks and the actions foreseen for their mitigation are presented on Figure 18 below.
Figure 18. Risk Mitigation Table
Risk Mitigation action Risk level
Demand risk: no developer presents an attractive enough proposal to an off-taker
The ATACAMATEC consultancy performed a series of interviews with potential off-takers, including mining, energy generation, and energy distribution companies. These companies showed interest in participating in the tendering. Companies are adding very large amounts of production in coming years and need a lot of energy, so demand for power is expected to be strong. Furthermore there are many companies interested in developing CSP given the right incentives.
Medium
The subsidies offered are too low to incentivize developers and off-takers
The GoC is seeking maximum international collaboration for concessional support. However, in case some of the sources of concessional finance do not materialize, and market based financing is unavailable or too expensive, developers could propose a smaller Project. While not optimal, this would still be a valuable demonstration of CSP technology and source of data.
It should also be noted that, the requirements of the tender were intentionally made relatively flexible, in order to allow for the most efficient market solution, and in case constraints arise.
Allowing for a market-based solution also can mitigate financing risk. For example, it is possible that an equity investor may be willing to accept less than a market-based 12% return if they are also making a return in some other aspect of the Project (such as EPC services) and wish to gain favorable exposure and experience. This would enable a larger project, or a project with more storage capacity, to be built.
High
Solar radiation measures are not bankable
With the support of GIZ, DNI measurements at the Crucero site offered by the GoC will start in October 2012. In addition there are already 3 years of GHI and 5 years of processed satellite data available. GHI data has been post-processed and calculations of DNI values have been made by the Fraunhofer Institute for Solar Energy Systems (ISE) and are available through December 2011. The purpose of the highly accurate DNI measurements, which will start soon, is to complement GHI data with information required for the financial evaluation of CSP projects. Furthermore, the measurements are used to validate the satellite data and therefore improve the Solar Explorer (the results of the solar measurement campaign confirm that the Atacama Desert presents one of the highest solar potentials worldwide, exceeding the solar irradiation of Spain by about 30%. GHI values show average annual values of more than 7 kWh/m² per day, or approximately 2,750 kWh/m² per year).
Low
The tendering winner will not get enough additional financial resources to develop the Project
The ATACAMATEC consultancy worked on the tendering document with special focus on assuring the selection of bankable projects. We have reasonable confidence that the tender winner will also qualify for project financing.
Low
The tendering time is not enough for the developers to submit an application
The ATACAMATEC consultancy conducted a series of interviews with CSP developers to assess the tendering time required.
Low
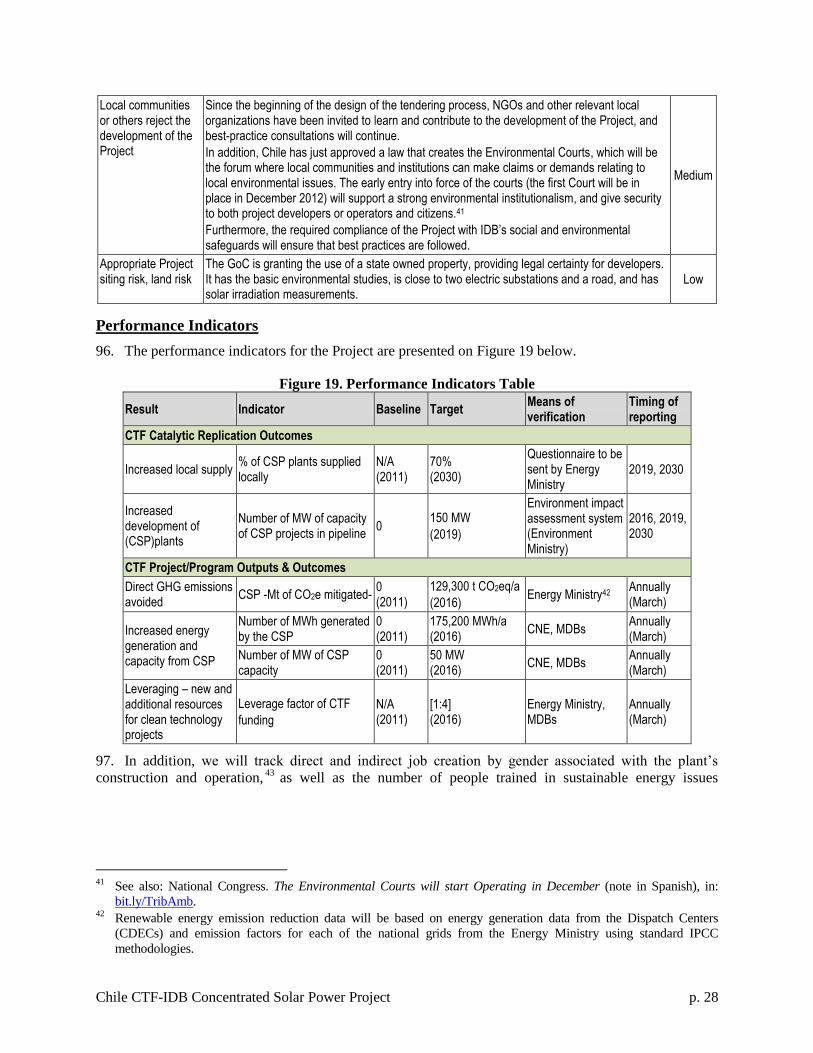
Chile CTF-IDB Concentrated Solar Power Project p. 28
Local communities or others reject the development of the Project
Since the beginning of the design of the tendering process, NGOs and other relevant local organizations have been invited to learn and contribute to the development of the Project, and best-practice consultations will continue.
In addition, Chile has just approved a law that creates the Environmental Courts, which will be the forum where local communities and institutions can make claims or demands relating to local environmental issues. The early entry into force of the courts (the first Court will be in place in December 2012) will support a strong environmental institutionalism, and give security to both project developers or operators and citizens.41
Furthermore, the required compliance of the Project with IDB’s social and environmental safeguards will ensure that best practices are followed.
Medium
Appropriate Project siting risk, land risk
The GoC is granting the use of a state owned property, providing legal certainty for developers. It has the basic environmental studies, is close to two electric substations and a road, and has solar irradiation measurements.
Low
Performance Indicators
96. The performance indicators for the Project are presented on Figure 19 below.
Figure 19. Performance Indicators Table
Result Indicator Baseline Target Means of verification
Timing of reporting
CTF Catalytic Replication Outcomes
Increased local supply % of CSP plants supplied locally
N/A (2011)
70% (2030)
Questionnaire to be sent by Energy Ministry
2019, 2030
Increased development of (CSP)plants
Number of MW of capacity of CSP projects in pipeline
0 150 MW
(2019)
Environment impact assessment system (Environment Ministry)
2016, 2019, 2030
CTF Project/Program Outputs & Outcomes
Direct GHG emissions avoided
CSP -Mt of CO2e mitigated- 0 (2011)
129,300 t CO2eq/a
(2016) Energy Ministry42
Annually (March)
Increased energy generation and capacity from CSP
Number of MWh generated by the CSP
0 (2011)
175,200 MWh/a (2016)
CNE, MDBs Annually (March)
Number of MW of CSP capacity
0 (2011)
50 MW (2016)
CNE, MDBs Annually (March)
Leveraging – new and additional resources for clean technology projects
Leverage factor of CTF
funding
N/A (2011)
[1:4] (2016)
Energy Ministry, MDBs
Annually (March)
97. In addition, we will track direct and indirect job creation by gender associated with the plant’s
construction and operation,43
as well as the number of people trained in sustainable energy issues
41
See also: National Congress. The Environmental Courts will start Operating in December (note in Spanish), in:
bit.ly/TribAmb. 42
Renewable energy emission reduction data will be based on energy generation data from the Dispatch Centers
(CDECs) and emission factors for each of the national grids from the Energy Ministry using standard IPCC
methodologies.
Chile CTF-IDB Concentrated Solar Power Project p. 29
(including gender-disaggregated data), and the creation of sustainable energy companies (these two
indicators will be measured at Investment Plan level).
43
Black & Veatch (Stoddard et al., Economic, Energy, and Environmental Benefits of Concentrating Solar Power in
California, NREL) used the Regional Input-Output Modeling System (RIMS II) developed and maintained by the
US Bureau of Economic Analysis. This analysis showed that, in the California context, each 100 MW of CSP
resulted in 94 permanent operations and maintenance jobs compared to 56 and 13 for combined cycle and simple
cycle combustion turbine plants, respectively. In terms of economic return, for each 100 MW of installed capacity,
the CSP plant was estimated to create about $628 million in impact to gross state output compared to an impact of
about $64 million for the combined cycle plant and $47 million for the simple cycle plant. The higher CSP state
economic impacts are due, in part, to the greater capital and operating costs of CSP plants. However, irrespective of
plant cost, it should be noted that a greater percentage of each CSP investment dollar was returned in economic
benefits. For each dollar spent on the installation of CSP plants, there is a total impact (direct plus indirect impacts) of
about $1.40 to gross state output for each dollar invested compared to roughly $0.90 to $1.00 for each dollar invested
in natural gas fueled generation.