Embed Size (px)
Citation preview
©2014 International Monetary Fund
IMF Country Report No. 14/218
CHILE 2014 ARTICLE IV CONSULTATION - STAFF REPORT; PRESS RELEASE; AND STATEMENT BY THE EXECUTIVE DIRECTOR FOR CHILE
Under Article IV of the IMF’s Articles of Agreement, the IMF holds bilateral discussions with members, usually every year. In the context of the 2014 Article IV consultation with Chile, the following documents have been released and are included in this package: The Staff Report prepared by a staff team of the IMF for the Executive Board’s
consideration on June 27, 2014, following discussions that ended on May 9, 2014, with the officials of Chile on economic developments and policies. Based on information available at the time of these discussions, the staff report was completed on June 11, 2014.
An Informational Annex prepared by the IMF.
A Press Release summarizing the views of the Executive Board as expressed during its June 27, 2014 consideration of the staff report that concluded the Article IV consultation with Chile.
A Statement by the Executive Director for Chile.
The following document has been or will be separately released. Selected Issues Paper
The publication policy for staff reports and other documents allows for the deletion of market-sensitive information.
Copies of this report are available to the public from
International Monetary Fund Publication Services PO Box 92780 Washington, D.C. 20090
Telephone: (202) 623-7430 Fax: (202) 623-7201 E-mail: [email protected] Web: http://www.imf.org
Price: $18.00 per printed copy
International Monetary Fund Washington, D.C.
July 2014
CHILE
STAFF REPORT FOR THE 2014 ARTICLE IV CONSULTATION
KEY ISSUES
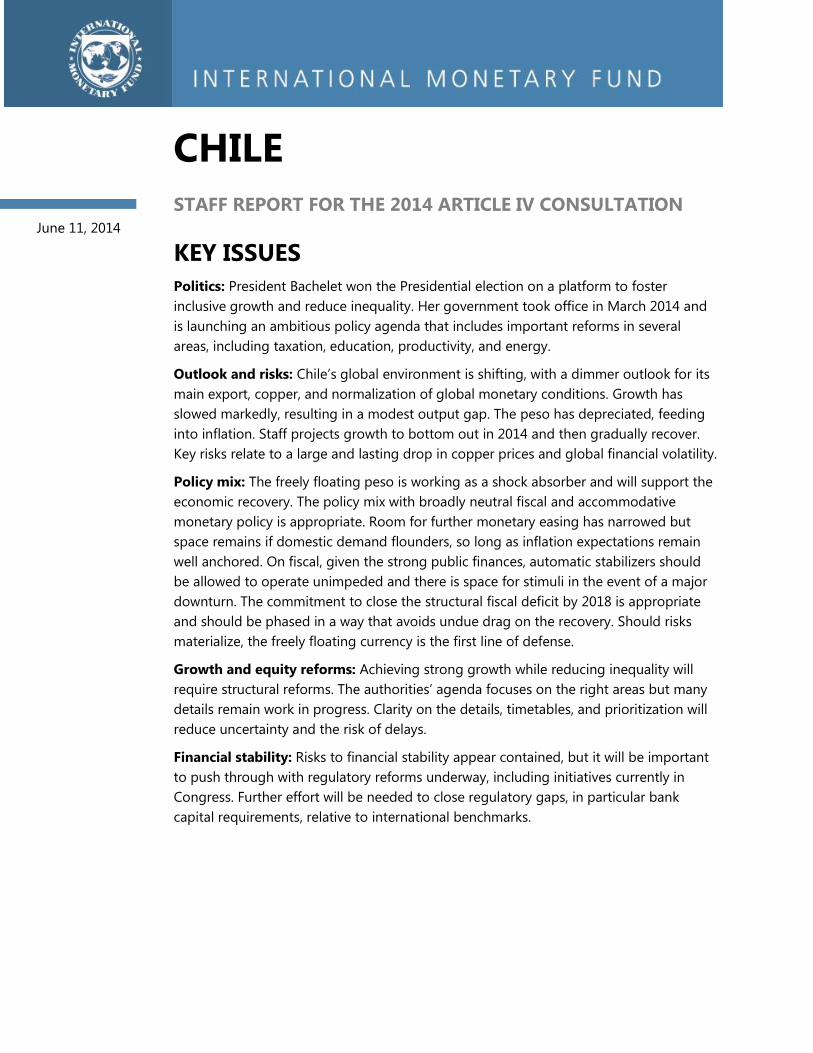
Politics: President Bachelet won the Presidential election on a platform to foster
inclusive growth and reduce inequality. Her government took office in March 2014 and
is launching an ambitious policy agenda that includes important reforms in several
areas, including taxation, education, productivity, and energy.
Outlook and risks: Chile’s global environment is shifting, with a dimmer outlook for its
main export, copper, and normalization of global monetary conditions. Growth has
slowed markedly, resulting in a modest output gap. The peso has depreciated, feeding
into inflation. Staff projects growth to bottom out in 2014 and then gradually recover.
Key risks relate to a large and lasting drop in copper prices and global financial volatility.
Policy mix: The freely floating peso is working as a shock absorber and will support the
economic recovery. The policy mix with broadly neutral fiscal and accommodative
monetary policy is appropriate. Room for further monetary easing has narrowed but
space remains if domestic demand flounders, so long as inflation expectations remain
well anchored. On fiscal, given the strong public finances, automatic stabilizers should
be allowed to operate unimpeded and there is space for stimuli in the event of a major
downturn. The commitment to close the structural fiscal deficit by 2018 is appropriate
and should be phased in a way that avoids undue drag on the recovery. Should risks
materialize, the freely floating currency is the first line of defense.
Growth and equity reforms: Achieving strong growth while reducing inequality will
require structural reforms. The authorities’ agenda focuses on the right areas but many
details remain work in progress. Clarity on the details, timetables, and prioritization will
reduce uncertainty and the risk of delays.
Financial stability: Risks to financial stability appear contained, but it will be important
to push through with regulatory reforms underway, including initiatives currently in
Congress. Further effort will be needed to close regulatory gaps, in particular bank
capital requirements, relative to international benchmarks.
June 11, 2014
CHILE
2 INTERNATIONAL MONETARY FUND
Approved By
Charles Kramer and
Tamim Bayoumi
Discussions were held in Santiago during April 28–May 9. The staff
comprised Mr. Erickson von Allmen (head), Ms. Petrova, Mr. Rodriguez-
Delgado, Ms. Ture (all WHD), and Mr. Arregui (MCM) with research
assistance from Mr. Tawfik and editorial support from Ms. Addo and
Mr. Moreno. Mr. Schatan (FAD) provided support from headquarters.
Mr. Rojas-Olmedo (Executive Director, OEDAG) and Mr. Carrière-
Swallow (Advisor, OEDAG) attended selected meetings. The mission
met with Central Bank Governor Vergara and Ministers Arenas
(Finance), Céspedes (Economy), Eyzaguirre (Education), Pacheco
(Energy), and Blanco (Labor), and other senior officials, think tanks,
academics, representatives from the financial and business community,
and international organizations.
CONTENTS
CONTEXT_________________________________________________________________________________________ 4
CURRENT CONDITIONS _________________________________________________________________________ 4
OUTLOOK AND RISKS ___________________________________________________________________________ 7
POLICY IMPLICATIONS __________________________________________________________________________ 8
A. Policy mix ______________________________________________________________________________________ 8
B. Fostering strong and inclusive growth _________________________________________________________ 9
C. Reinforcing financial stability __________________________________________________________________ 12
D. Enhancing the fiscal framework _______________________________________________________________ 16
STAFF APPRAISAL _____________________________________________________________________________ 16
BOXES
1. Spillover Transmission Channels and Effects___________________________________________________ 18
2. Tax Reform ____________________________________________________________________________________ 19
3. Electricity Sector in Chile ______________________________________________________________________ 20
FIGURES
1. Past Growth Performance and Challenges Ahead _____________________________________________ 21
2. Financial Market Developments _______________________________________________________________ 22
3. Cyclical Position _______________________________________________________________________________ 23
4. Monetary Policy and Inflation _________________________________________________________________ 24
CHILE
INTERNATIONAL MONETARY FUND 3
5. Fiscal Policy and Public Finances ______________________________________________________________ 25
6. External Stability _______________________________________________________________________________ 26
7. Macro-Financial Stability ______________________________________________________________________ 27
8. Real Estate Devlopments ______________________________________________________________________ 28
9. Spillovers and Exposures ______________________________________________________________________ 28
TABLES
1. Selected Social and Economic Indicators ______________________________________________________ 30
2. Summary Operations of the Central Government _____________________________________________ 31
3. Summary Operations of the Public Sector _____________________________________________________ 32
4. Balance of Payments __________________________________________________________________________ 33
5. Monetary Survey ______________________________________________________________________________ 34
6. Medium-Term Framework _____________________________________________________________________ 35
7. Indicators of External Vulnerability ____________________________________________________________ 36
ANNEXES
I. Past Fund Advice _______________________________________________________________________________ 37
II. A Closer Look at Investment ___________________________________________________________________ 38
III. Recent Developments in Corporate Debt _____________________________________________________ 43
IV. Risk Assessment Matrix _______________________________________________________________________ 48
V. 2011 FSAP Update: Status of Main Recommendations ________________________________________ 49
VI. Debt Sustainability Analysis __________________________________________________________________ 53
CHILE
4 INTERNATIONAL MONETARY FUND
CONTEXT
1. Chile is confronting a changing external environment. As the world’s leading copper
exporter and with a large, internationally integrated financial sector, Chile profited greatly from
recent years’ global copper boom and easy international financial conditions (Figure 1). Chile
achieved a substantial increase in per capita income, a fall in poverty, and an improvement, if more
modest, in its skewed income distribution.1 Growth tailwinds are now reversing as the Fed has
started to normalize policy (“tapering”) and the commodity boom is petering out. Although Chile is
in a strong position to cope with these changes and associated turbulence thanks to its freely
floating currency, credible monetary policy framework, robust public finances, and a track-record of
macro-financial stability, the changing environment poses challenges for macroeconomic policy and,
in particular, for the prospects for strong and more inclusive growth.
2. A new government has taken office. Former President Michelle Bachelet won the
November 2013 elections and assumed office on March 11, 2014 for a four year term. Her coalition
also won majority in both chambers in Congress. President Bachelet was elected on a platform to
improve equity through major tax and education reforms. The platform also includes energy, labor,
and productivity reforms, and a clear commitment to prudent fiscal policy. Annex I summarizes past
Fund advice.
CURRENT CONDITIONS
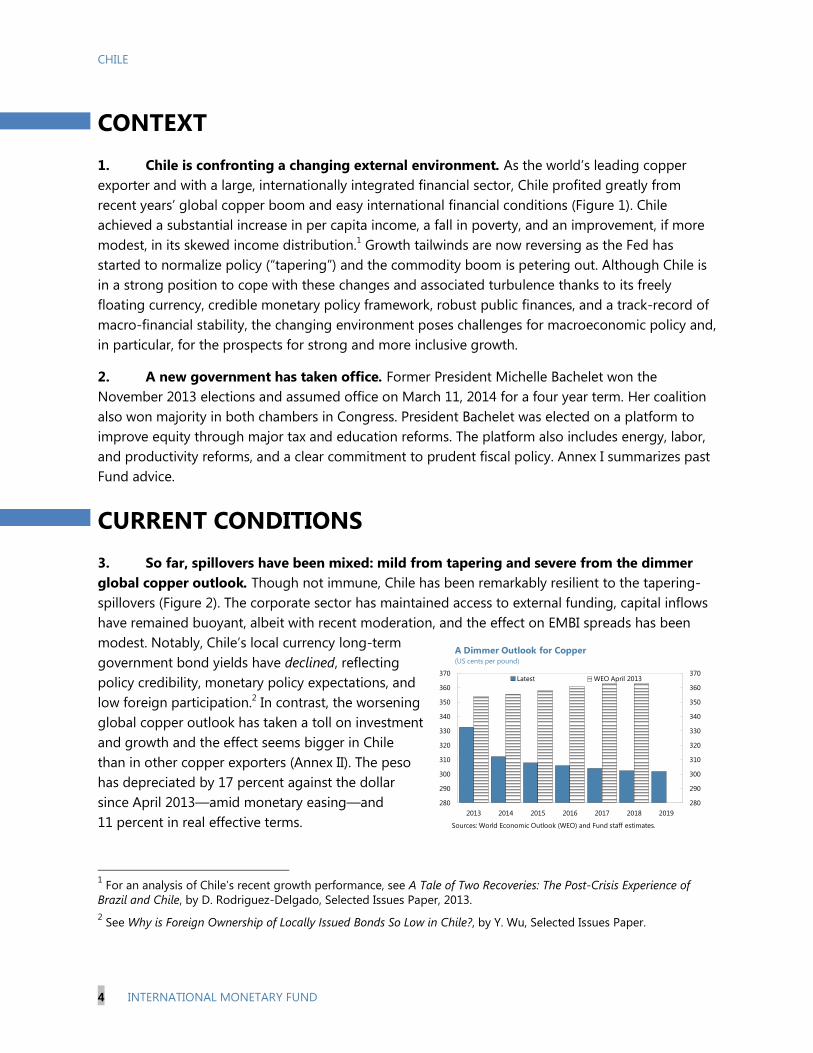
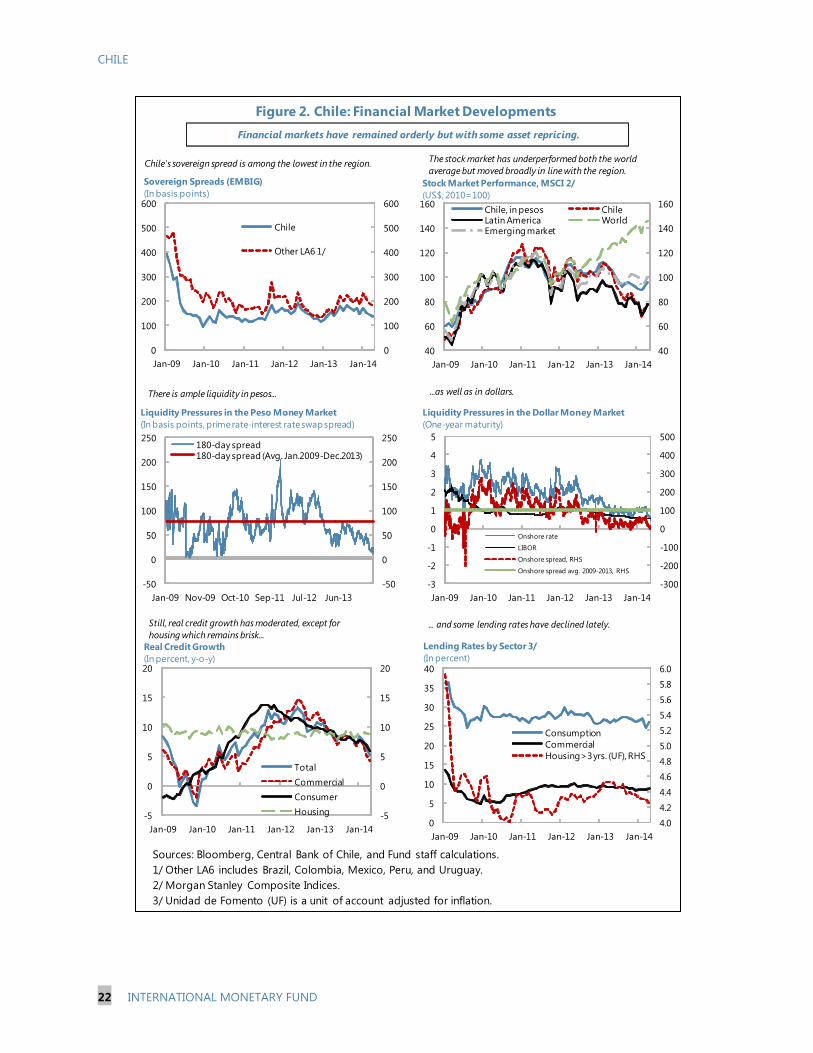
3. So far, spillovers have been mixed: mild from tapering and severe from the dimmer
global copper outlook. Though not immune, Chile has been remarkably resilient to the tapering-
spillovers (Figure 2). The corporate sector has maintained access to external funding, capital inflows
have remained buoyant, albeit with recent moderation, and the effect on EMBI spreads has been
modest. Notably, Chile’s local currency long-term
government bond yields have declined, reflecting
policy credibility, monetary policy expectations, and
low foreign participation.2 In contrast, the worsening
global copper outlook has taken a toll on investment
and growth and the effect seems bigger in Chile
than in other copper exporters (Annex II). The peso
has depreciated by 17 percent against the dollar
since April 2013—amid monetary easing—and
11 percent in real effective terms.
1 For an analysis of Chile’s recent growth performance, see A Tale of Two Recoveries: The Post-Crisis Experience of
Brazil and Chile, by D. Rodriguez-Delgado, Selected Issues Paper, 2013.
2 See Why is Foreign Ownership of Locally Issued Bonds So Low in Chile?, by Y. Wu, Selected Issues Paper.
280
290
300
310
320
330
340
350
360
370
280
290
300
310
320
330
340
350
360
370
2013 2014 2015 2016 2017 2018 2019
Latest WEO April 2013
A Dimmer Outlook for Copper(US cents per pound)
Sources: World Economic Outlook (WEO) and Fund staff estimates.
CHILE
INTERNATIONAL MONETARY FUND 5
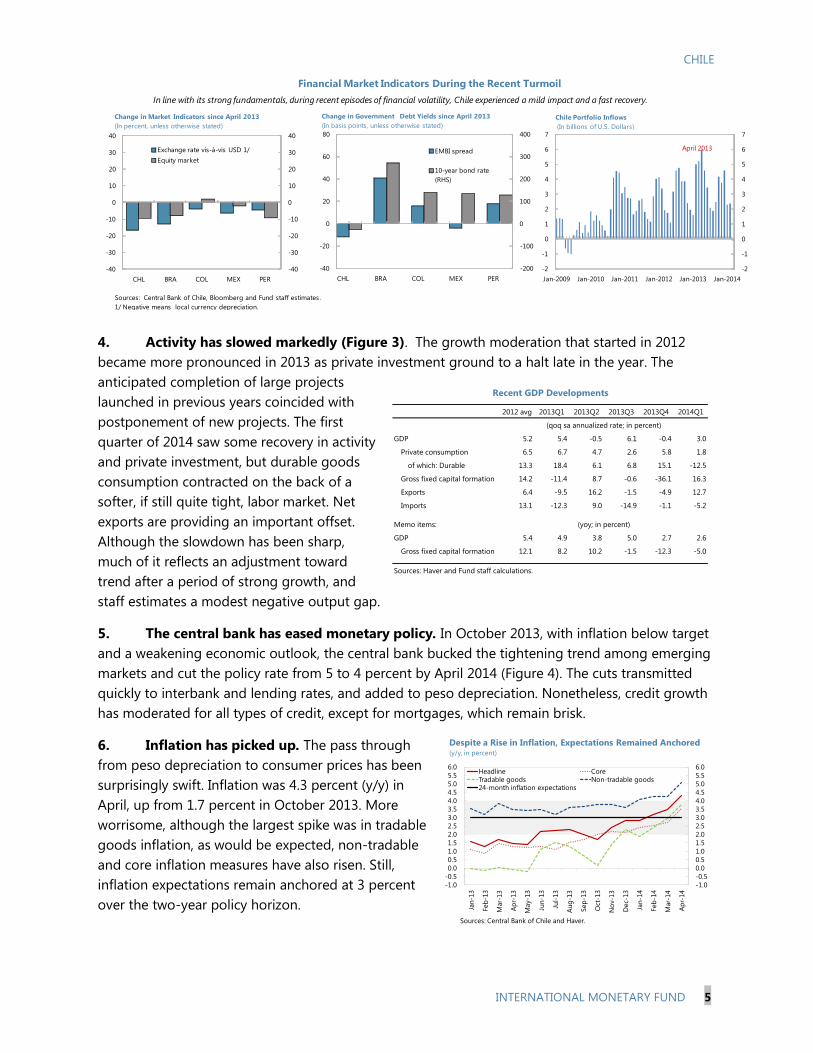
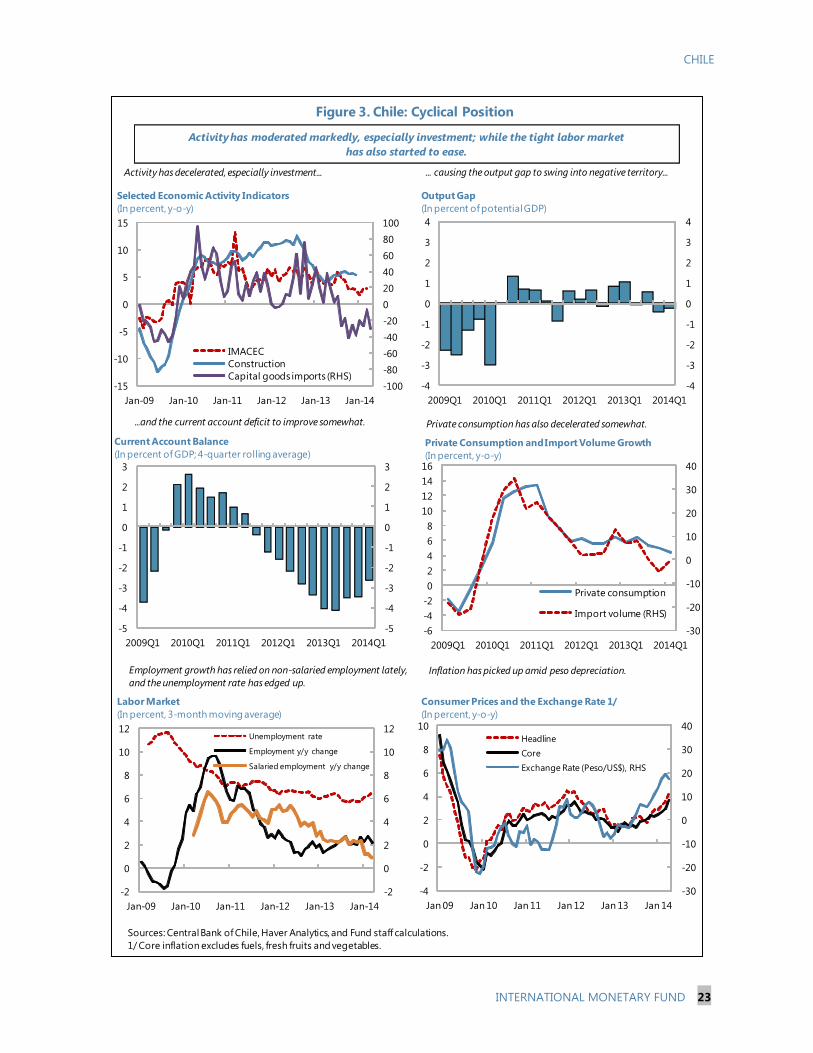
4. Activity has slowed markedly (Figure 3). The growth moderation that started in 2012
became more pronounced in 2013 as private investment ground to a halt late in the year. The
anticipated completion of large projects
launched in previous years coincided with
postponement of new projects. The first
quarter of 2014 saw some recovery in activity
and private investment, but durable goods
consumption contracted on the back of a
softer, if still quite tight, labor market. Net
exports are providing an important offset.
Although the slowdown has been sharp,
much of it reflects an adjustment toward
trend after a period of strong growth, and
staff estimates a modest negative output gap.
5. The central bank has eased monetary policy. In October 2013, with inflation below target
and a weakening economic outlook, the central bank bucked the tightening trend among emerging
markets and cut the policy rate from 5 to 4 percent by April 2014 (Figure 4). The cuts transmitted
quickly to interbank and lending rates, and added to peso depreciation. Nonetheless, credit growth
has moderated for all types of credit, except for mortgages, which remain brisk.
6. Inflation has picked up. The pass through
from peso depreciation to consumer prices has been
surprisingly swift. Inflation was 4.3 percent (y/y) in
April, up from 1.7 percent in October 2013. More
worrisome, although the largest spike was in tradable
goods inflation, as would be expected, non-tradable
and core inflation measures have also risen. Still,
inflation expectations remain anchored at 3 percent
over the two-year policy horizon.
FUT
FUT
Financial Market Indicators During the Recent Turmoil
-40
-30
-20
-10
0
10
20
30
40
-40
-30
-20
-10
0
10
20
30
40
CHL BRA COL MEX PER
Exchange rate vis-à-vis USD 1/
Equity market
Change in Market Indicators since April 2013
(In percent, unless otherwise stated)
Sources: Central Bank of Chile, Bloomberg and Fund staff estimates.
1/ Negative means local currency depreciation.
-200
-100
0
100
200
300
400
-40
-20
0
20
40
60
80
CHL BRA COL MEX PER
EMBI spread
10-year bond rate
(RHS)
Change in Government Debt Yields since April 2013
(In basis points, unless otherwise stated)
-2
-1
0
1
2
3
4
5
6
7
-2
-1
0
1
2
3
4
5
6
7
Jan-2009 Jan-2010 Jan-2011 Jan-2012 Jan-2013 Jan-2014
Chile Portfolio Inflows
(In billions of U.S. Dollars)
April 2013
In line with its strong fundamentals, during recent episodes of financial volatility, Chile experienced a mild impact and a fast recovery.
2012 avg 2013Q1 2013Q2 2013Q3 2013Q4 2014Q1
GDP 5.2 5.4 -0.5 6.1 -0.4 3.0
Private consumption 6.5 6.7 4.7 2.6 5.8 1.8
of which: Durable 13.3 18.4 6.1 6.8 15.1 -12.5
Gross fixed capital formation 14.2 -11.4 8.7 -0.6 -36.1 16.3
Exports 6.4 -9.5 16.2 -1.5 -4.9 12.7
Imports 13.1 -12.3 9.0 -14.9 -1.1 -5.2
Memo items:
GDP 5.4 4.9 3.8 5.0 2.7 2.6
Gross fixed capital formation 12.1 8.2 10.2 -1.5 -12.3 -5.0
Sources: Haver and Fund staff calculations.
(qoq sa annualized rate; in percent)
Recent GDP Developments
(yoy; in percent)
-1.0
-0.5
0.0
0.5
1.0
1.5
2.0
2.5
3.0
3.5
4.0
4.5
5.0
5.5
6.0
-1.0
-0.5
0.0
0.5
1.0
1.5
2.0
2.5
3.0
3.5
4.0
4.5
5.0
5.5
6.0
Jan
-13
Feb
-13
Mar-
13
Ap
r-13
May-1
3
Jun
-13
Jul-
13
Au
g-1
3
Sep
-13
Oct
-13
No
v-13
Dec-
13
Jan
-14
Feb
-14
Mar-
14
Ap
r-14
Headline CoreTradable goods Non-tradable goods24-month inflation expectations
Despite a Rise in Inflation, Expectations Remained Anchored(y/y, in percent)
Sources: Central Bank of Chile and Haver.
CHILE
6 INTERNATIONAL MONETARY FUND
7. Fiscal policy has stayed broadly neutral (Figure 5). The structural deficit in 2013 was
0.8 percent of GDP (staff estimate), roughly unchanged from 2012 net of a one-off capital gains tax
windfall (equal to 0.4 percent of GDP). The fiscal stance, measured by staff as the change in the non-
mining primary structural balance, was broadly neutral. The fall in copper revenue shifted the
headline balance to a deficit of 0.6 percent of GDP from a surplus of equal size in 2012, but central
government net assets remained at 6.7 percent of GDP helped by valuation gains.
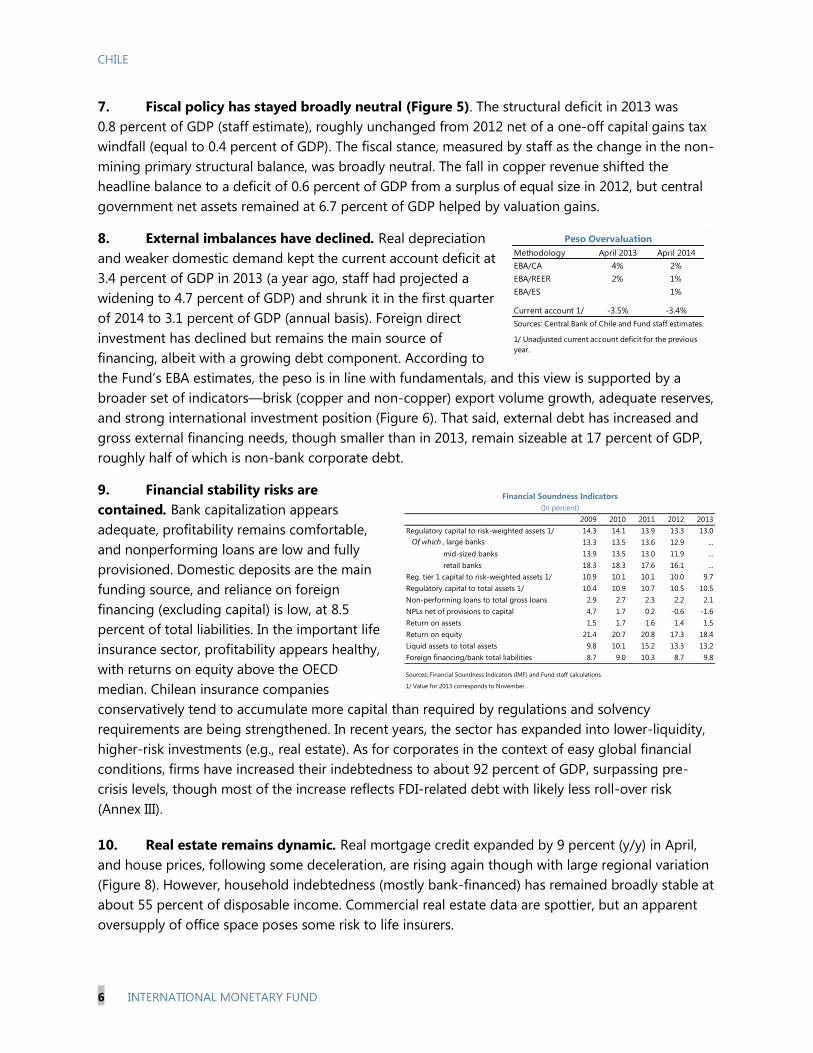
8. External imbalances have declined. Real depreciation
and weaker domestic demand kept the current account deficit at
3.4 percent of GDP in 2013 (a year ago, staff had projected a
widening to 4.7 percent of GDP) and shrunk it in the first quarter
of 2014 to 3.1 percent of GDP (annual basis). Foreign direct
investment has declined but remains the main source of
financing, albeit with a growing debt component. According to
the Fund’s EBA estimates, the peso is in line with fundamentals, and this view is supported by a
broader set of indicators—brisk (copper and non-copper) export volume growth, adequate reserves,
and strong international investment position (Figure 6). That said, external debt has increased and
gross external financing needs, though smaller than in 2013, remain sizeable at 17 percent of GDP,
roughly half of which is non-bank corporate debt.
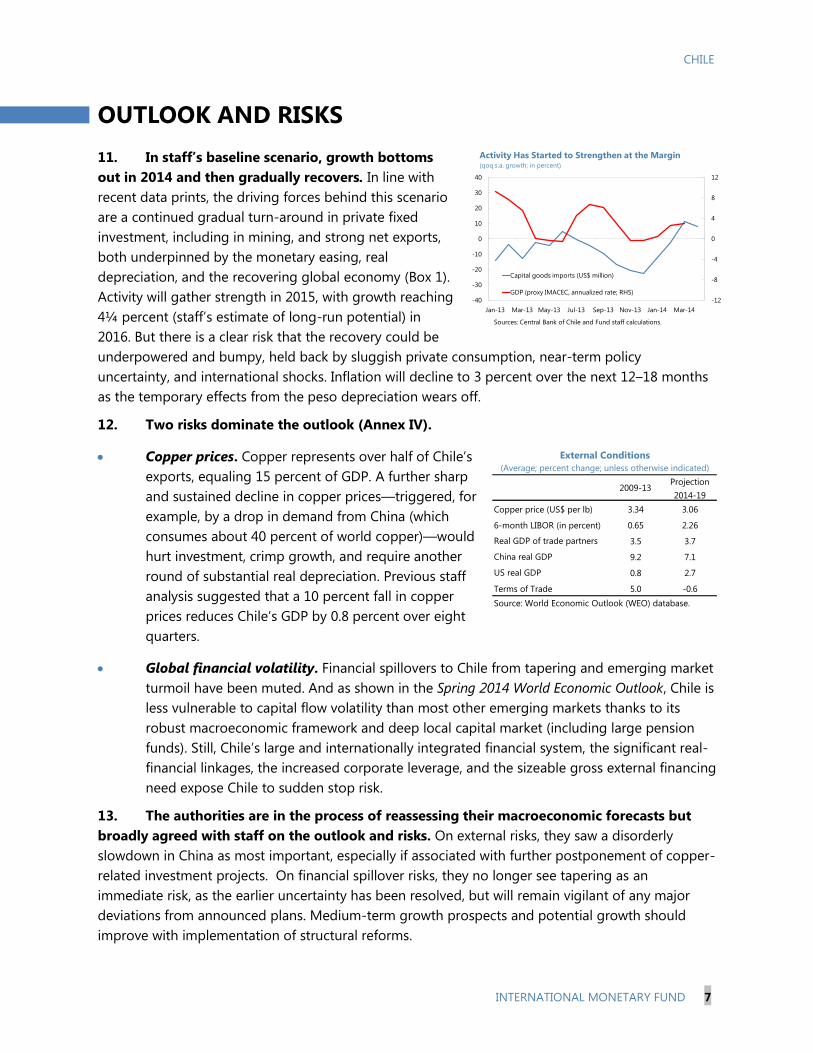
9. Financial stability risks are
contained. Bank capitalization appears
adequate, profitability remains comfortable,
and nonperforming loans are low and fully
provisioned. Domestic deposits are the main
funding source, and reliance on foreign
financing (excluding capital) is low, at 8.5
percent of total liabilities. In the important life
insurance sector, profitability appears healthy,
with returns on equity above the OECD
median. Chilean insurance companies
conservatively tend to accumulate more capital than required by regulations and solvency
requirements are being strengthened. In recent years, the sector has expanded into lower-liquidity,
higher-risk investments (e.g., real estate). As for corporates in the context of easy global financial
conditions, firms have increased their indebtedness to about 92 percent of GDP, surpassing pre-
crisis levels, though most of the increase reflects FDI-related debt with likely less roll-over risk
(Annex III).
10. Real estate remains dynamic. Real mortgage credit expanded by 9 percent (y/y) in April,
and house prices, following some deceleration, are rising again though with large regional variation
(Figure 8). However, household indebtedness (mostly bank-financed) has remained broadly stable at
about 55 percent of disposable income. Commercial real estate data are spottier, but an apparent
oversupply of office space poses some risk to life insurers.
Methodology
EBA/CA 4% 2%
EBA/REER 2% 1%
EBA/ES 1%
Current account 1/ -3.5% -3.4%
Sources: Central Bank of Chile and Fund staff estimates.
1/ Unadjusted current account deficit for the previous
year.
April 2013 April 2014
Peso Overvaluation
2009 2010 2011 2012 2013
Regulatory capital to risk-weighted assets 1/ 14.3 14.1 13.9 13.3 13.0
Of which , large banks 13.3 13.5 13.6 12.9 ...
mid-sized banks 13.9 13.5 13.0 11.9 ...
retail banks 18.3 18.3 17.6 16.1 ...
Reg. tier 1 capital to risk-weighted assets 1/ 10.9 10.1 10.1 10.0 9.7
Regulatory capital to total assets 1/ 10.4 10.9 10.7 10.5 10.5
Non-performing loans to total gross loans 2.9 2.7 2.3 2.2 2.1
NPLs net of provisions to capital 4.7 1.7 0.2 -0.6 -1.6
Return on assets 1.5 1.7 1.6 1.4 1.5
Return on equity 21.4 20.7 20.8 17.3 18.4
Liquid assets to total assets 9.8 10.1 15.2 13.3 13.2
Foreign financing/bank total liabilities 8.7 9.0 10.3 8.7 9.8
Sources: Financial Soundness Indicators (IMF) and Fund staff calculations.
1/ Value for 2013 corresponds to November.
Financial Soundness Indicators
(In percent)
CHILE
INTERNATIONAL MONETARY FUND 7
OUTLOOK AND RISKS
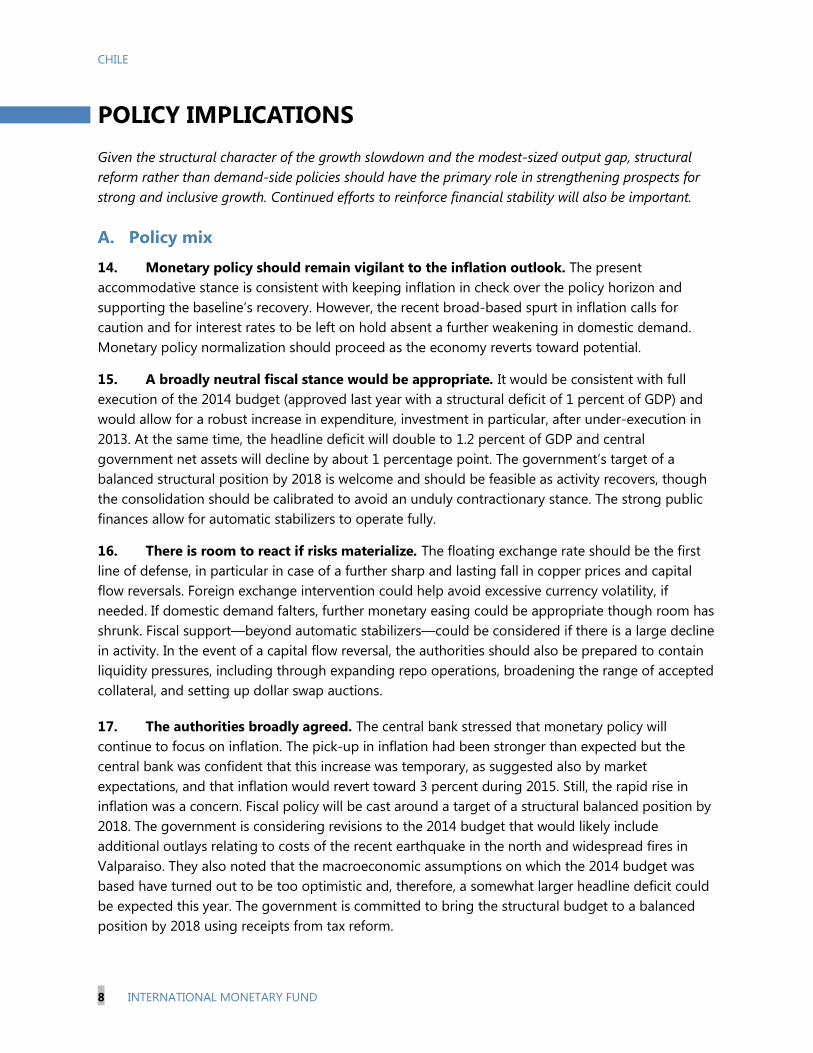
11. In staff’s baseline scenario, growth bottoms
out in 2014 and then gradually recovers. In line with
recent data prints, the driving forces behind this scenario
are a continued gradual turn-around in private fixed
investment, including in mining, and strong net exports,
both underpinned by the monetary easing, real
depreciation, and the recovering global economy (Box 1).
Activity will gather strength in 2015, with growth reaching
4¼ percent (staff’s estimate of long-run potential) in
2016. But there is a clear risk that the recovery could be
underpowered and bumpy, held back by sluggish private consumption, near-term policy
uncertainty, and international shocks. Inflation will decline to 3 percent over the next 12–18 months
as the temporary effects from the peso depreciation wears off.
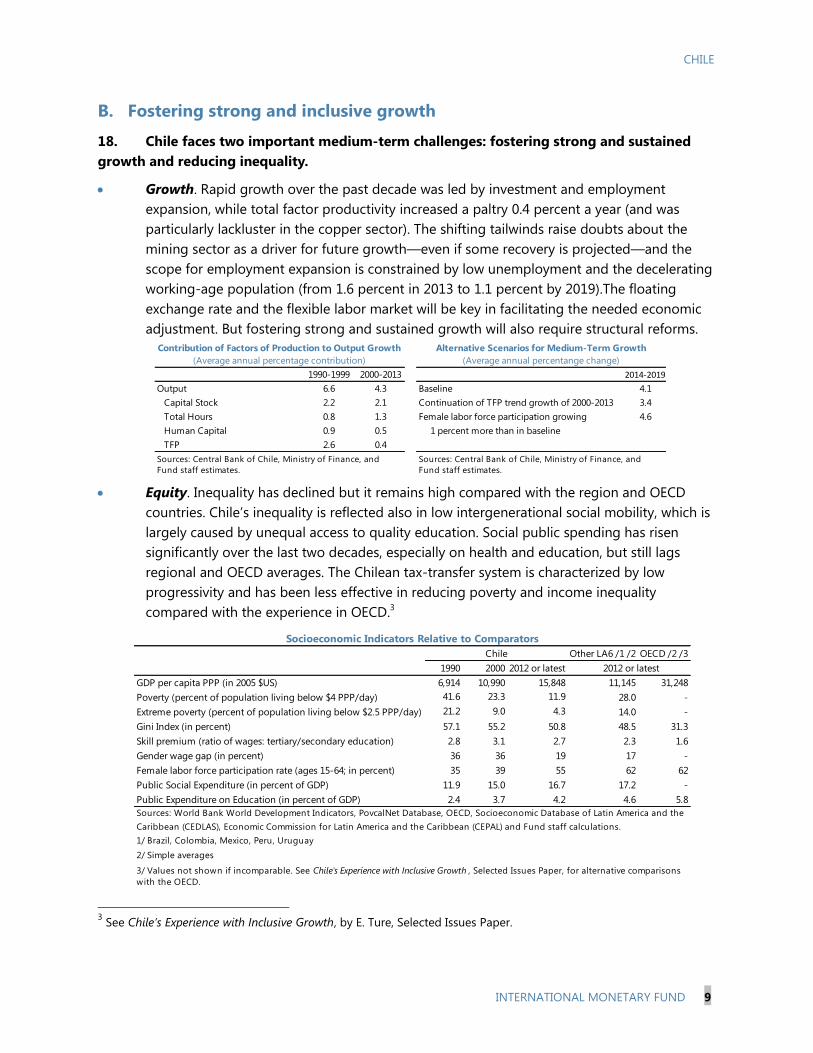
12. Two risks dominate the outlook (Annex IV).
Copper prices. Copper represents over half of Chile’s
exports, equaling 15 percent of GDP. A further sharp
and sustained decline in copper prices—triggered, for
example, by a drop in demand from China (which
consumes about 40 percent of world copper)—would
hurt investment, crimp growth, and require another
round of substantial real depreciation. Previous staff
analysis suggested that a 10 percent fall in copper
prices reduces Chile’s GDP by 0.8 percent over eight
quarters.
Global financial volatility. Financial spillovers to Chile from tapering and emerging market
turmoil have been muted. And as shown in the Spring 2014 World Economic Outlook, Chile is
less vulnerable to capital flow volatility than most other emerging markets thanks to its
robust macroeconomic framework and deep local capital market (including large pension
funds). Still, Chile’s large and internationally integrated financial system, the significant real-
financial linkages, the increased corporate leverage, and the sizeable gross external financing
need expose Chile to sudden stop risk.
13. The authorities are in the process of reassessing their macroeconomic forecasts but
broadly agreed with staff on the outlook and risks. On external risks, they saw a disorderly
slowdown in China as most important, especially if associated with further postponement of copper-
related investment projects. On financial spillover risks, they no longer see tapering as an
immediate risk, as the earlier uncertainty has been resolved, but will remain vigilant of any major
deviations from announced plans. Medium-term growth prospects and potential growth should
improve with implementation of structural reforms.
-12
-8
-4
0
4
8
12
-40
-30
-20
-10
0
10
20
30
40
Jan-13 Mar-13 May-13 Jul-13 Sep-13 Nov-13 Jan-14 Mar-14
Capital goods imports (US$ million)
GDP (proxy IMACEC, annualized rate; RHS)
Activity Has Started to Strengthen at the Margin (qoq s.a. growth; in percent)
Sources: Central Bank of Chile and Fund staff calculations.
2009-13Projection
2014-19
Copper price (US$ per lb) 3.34 3.06
6-month LIBOR (in percent) 0.65 2.26
Real GDP of trade partners 3.5 3.7
China real GDP 9.2 7.1
US real GDP 0.8 2.7
Terms of Trade 5.0 -0.6
Source: World Economic Outlook (WEO) database.
External Conditions
(Average; percent change; unless otherwise indicated)
CHILE
8 INTERNATIONAL MONETARY FUND
POLICY IMPLICATIONS
Given the structural character of the growth slowdown and the modest-sized output gap, structural
reform rather than demand-side policies should have the primary role in strengthening prospects for
strong and inclusive growth. Continued efforts to reinforce financial stability will also be important.
A. Policy mix
14. Monetary policy should remain vigilant to the inflation outlook. The present
accommodative stance is consistent with keeping inflation in check over the policy horizon and
supporting the baseline’s recovery. However, the recent broad-based spurt in inflation calls for
caution and for interest rates to be left on hold absent a further weakening in domestic demand.
Monetary policy normalization should proceed as the economy reverts toward potential.
15. A broadly neutral fiscal stance would be appropriate. It would be consistent with full
execution of the 2014 budget (approved last year with a structural deficit of 1 percent of GDP) and
would allow for a robust increase in expenditure, investment in particular, after under-execution in
2013. At the same time, the headline deficit will double to 1.2 percent of GDP and central
government net assets will decline by about 1 percentage point. The government’s target of a
balanced structural position by 2018 is welcome and should be feasible as activity recovers, though
the consolidation should be calibrated to avoid an unduly contractionary stance. The strong public
finances allow for automatic stabilizers to operate fully.
16. There is room to react if risks materialize. The floating exchange rate should be the first
line of defense, in particular in case of a further sharp and lasting fall in copper prices and capital
flow reversals. Foreign exchange intervention could help avoid excessive currency volatility, if
needed. If domestic demand falters, further monetary easing could be appropriate though room has
shrunk. Fiscal support—beyond automatic stabilizers—could be considered if there is a large decline
in activity. In the event of a capital flow reversal, the authorities should also be prepared to contain
liquidity pressures, including through expanding repo operations, broadening the range of accepted
collateral, and setting up dollar swap auctions.
17. The authorities broadly agreed. The central bank stressed that monetary policy will
continue to focus on inflation. The pick-up in inflation had been stronger than expected but the
central bank was confident that this increase was temporary, as suggested also by market
expectations, and that inflation would revert toward 3 percent during 2015. Still, the rapid rise in
inflation was a concern. Fiscal policy will be cast around a target of a structural balanced position by
2018. The government is considering revisions to the 2014 budget that would likely include
additional outlays relating to costs of the recent earthquake in the north and widespread fires in
Valparaiso. They also noted that the macroeconomic assumptions on which the 2014 budget was
based have turned out to be too optimistic and, therefore, a somewhat larger headline deficit could
be expected this year. The government is committed to bring the structural budget to a balanced
position by 2018 using receipts from tax reform.
CHILE
INTERNATIONAL MONETARY FUND 9
B. Fostering strong and inclusive growth
18. Chile faces two important medium-term challenges: fostering strong and sustained
growth and reducing inequality.
Growth. Rapid growth over the past decade was led by investment and employment
expansion, while total factor productivity increased a paltry 0.4 percent a year (and was
particularly lackluster in the copper sector). The shifting tailwinds raise doubts about the
mining sector as a driver for future growth—even if some recovery is projected—and the
scope for employment expansion is constrained by low unemployment and the decelerating
working-age population (from 1.6 percent in 2013 to 1.1 percent by 2019).The floating
exchange rate and the flexible labor market will be key in facilitating the needed economic
adjustment. But fostering strong and sustained growth will also require structural reforms.
Equity. Inequality has declined but it remains high compared with the region and OECD
countries. Chile’s inequality is reflected also in low intergenerational social mobility, which is
largely caused by unequal access to quality education. Social public spending has risen
significantly over the last two decades, especially on health and education, but still lags
regional and OECD averages. The Chilean tax-transfer system is characterized by low
progressivity and has been less effective in reducing poverty and income inequality
compared with the experience in OECD.3
3 See Chile’s Experience with Inclusive Growth, by E. Ture, Selected Issues Paper.
Other LA6 /1 /2 OECD /2 /3
1990 2000 2012 or latest
GDP per capita PPP (in 2005 $US) 6,914 10,990 15,848 11,145 31,248
Poverty (percent of population living below $4 PPP/day) 41.6 23.3 11.9 28.0 -
Extreme poverty (percent of population living below $2.5 PPP/day) 21.2 9.0 4.3 14.0 -
Gini Index (in percent) 57.1 55.2 50.8 48.5 31.3
Skill premium (ratio of wages: tertiary/secondary education) 2.8 3.1 2.7 2.3 1.6
Gender wage gap (in percent) 36 36 19 17 -
Female labor force participation rate (ages 15-64; in percent) 35 39 55 62 62
Public Social Expenditure (in percent of GDP) 11.9 15.0 16.7 17.2 -
Public Expenditure on Education (in percent of GDP) 2.4 3.7 4.2 4.6 5.8
1/ Brazil, Colombia, Mexico, Peru, Uruguay
2/ Simple averages
Socioeconomic Indicators Relative to Comparators
Chile
2012 or latest
Sources: World Bank World Development Indicators, PovcalNet Database, OECD, Socioeconomic Database of Latin America and the
Caribbean (CEDLAS), Economic Commission for Latin America and the Caribbean (CEPAL) and Fund staff calculations.
3/ Values not shown if incomparable. See Chile's Experience with Inclusive Growth , Selected Issues Paper, for alternative comparisons
with the OECD.
1990-1999 2000-2013
Output 6.6 4.3 Baseline
Capital Stock 2.2 2.1 Continuation of TFP trend growth of 2000-2013
Total Hours 0.8 1.3 Female labor force participation growing
Human Capital 0.9 0.5
TFP 2.6 0.4
Sources: Central Bank of Chile, Ministry of Finance, and
Fund staff estimates.
Sources: Central Bank of Chile, Ministry of Finance, and
Fund staff estimates.
4.6
1 percent more than in baseline
Contribution of Factors of Production to Output Growth
(Average annual percentage contribution)
Alternative Scenarios for Medium-Term Growth
(Average annual percentange change)
2014-2019
4.1
3.4
CHILE
10 INTERNATIONAL MONETARY FUND
19. The government is launching an ambitious policy agenda that could galvanize strong
and inclusive growth, while preserving Chile’s record of prudent macroeconomic policy. The
plans, most of which are under development, focus on the following areas:
Education and tax reforms. The government has proposed a major tax reform to reduce
regressivity and raise 3 percent of GDP by 2018 in revenue to fund education reform,
increase outlays on health, and raise public savings (see Box 2). The mission supported these
objectives. The proposal prudently matches new spending with permanent revenue.
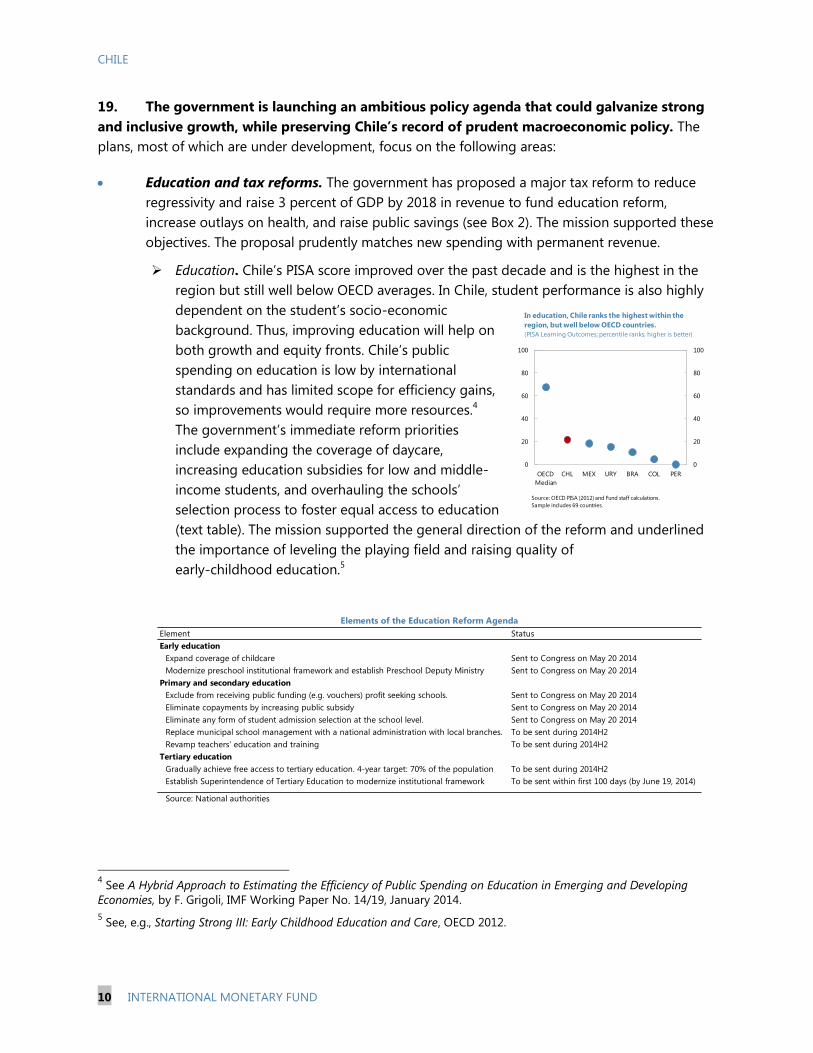
Education. Chile’s PISA score improved over the past decade and is the highest in the
region but still well below OECD averages. In Chile, student performance is also highly
dependent on the student’s socio-economic
background. Thus, improving education will help on
both growth and equity fronts. Chile’s public
spending on education is low by international
standards and has limited scope for efficiency gains,
so improvements would require more resources.4
The government’s immediate reform priorities
include expanding the coverage of daycare,
increasing education subsidies for low and middle-
income students, and overhauling the schools’
selection process to foster equal access to education
(text table). The mission supported the general direction of the reform and underlined
the importance of leveling the playing field and raising quality of
early-childhood education.5
4 See A Hybrid Approach to Estimating the Efficiency of Public Spending on Education in Emerging and Developing
Economies, by F. Grigoli, IMF Working Paper No. 14/19, January 2014.
5 See, e.g., Starting Strong III: Early Childhood Education and Care, OECD 2012.
Element Status
Early education
Expand coverage of childcare Sent to Congress on May 20 2014
Modernize preschool institutional framework and establish Preschool Deputy Ministry Sent to Congress on May 20 2014
Primary and secondary education
Exclude from receiving public funding (e.g. vouchers) profit seeking schools. Sent to Congress on May 20 2014
Eliminate copayments by increasing public subsidy Sent to Congress on May 20 2014
Eliminate any form of student admission selection at the school level. Sent to Congress on May 20 2014
Replace municipal school management with a national administration with local branches. To be sent during 2014H2
Revamp teachers' education and training To be sent during 2014H2
Tertiary education
Gradually achieve free access to tertiary education. 4-year target: 70% of the population To be sent during 2014H2
Establish Superintendence of Tertiary Education to modernize institutional framework To be sent within first 100 days (by June 19, 2014)
Source: National authorities
Elements of the Education Reform Agenda
0
20
40
60
80
100
0
20
40
60
80
100
OECD
Median
CHL MEX URY BRA COL PER
Source: OECD PISA (2012) and Fund staff calculations.
Sample includes 69 countries.
In education, Chile ranks the highest within the
region, but well below OECD countries.
(PISA Learning Outcomes; percentile ranks; higher is better)
CHILE
INTERNATIONAL MONETARY FUND 11
Tax reform (Box 2). The reform involves several changes to Chile’s integrated tax
regime.6 The current system of tax deferral for undistributed earnings (in place since
1984) has become a source of significant tax planning and evasion—mainly benefitting
those with higher incomes—and challenging to administer. The tax reform (expected to
be approved in September 2014) is tilted toward taxing the upper-income brackets,
including through its focus on capital income and closing loopholes, and should reduce
the regressivity of the current tax system. Given the size and complexity of the reform
there is some uncertainty over its expected revenue yield and economic impact. Further,
there is not much international experience to draw on for the proposed new
profit/dividend tax regime but higher taxation of corporate profits and capital income
would likely dampen investment and, in particular, corporate savings, while instant
depreciation and higher public savings would provide some offset. Strengthening the
tax authority will help support the expected revenue yield; and the planned gradual
implementation is welcome and would allow fine-tuning if needed.
Energy (Box 3). While demand for electricity has risen steadily (and will continue to rise),
investment in the sector, including in generation, has stalled. Energy reform is a top concern
for the business sector and a priority for the government. The mission commended the
government’s plan to promote energy investment and efficiency, and to facilitate entry and
the use of new, clean technologies.
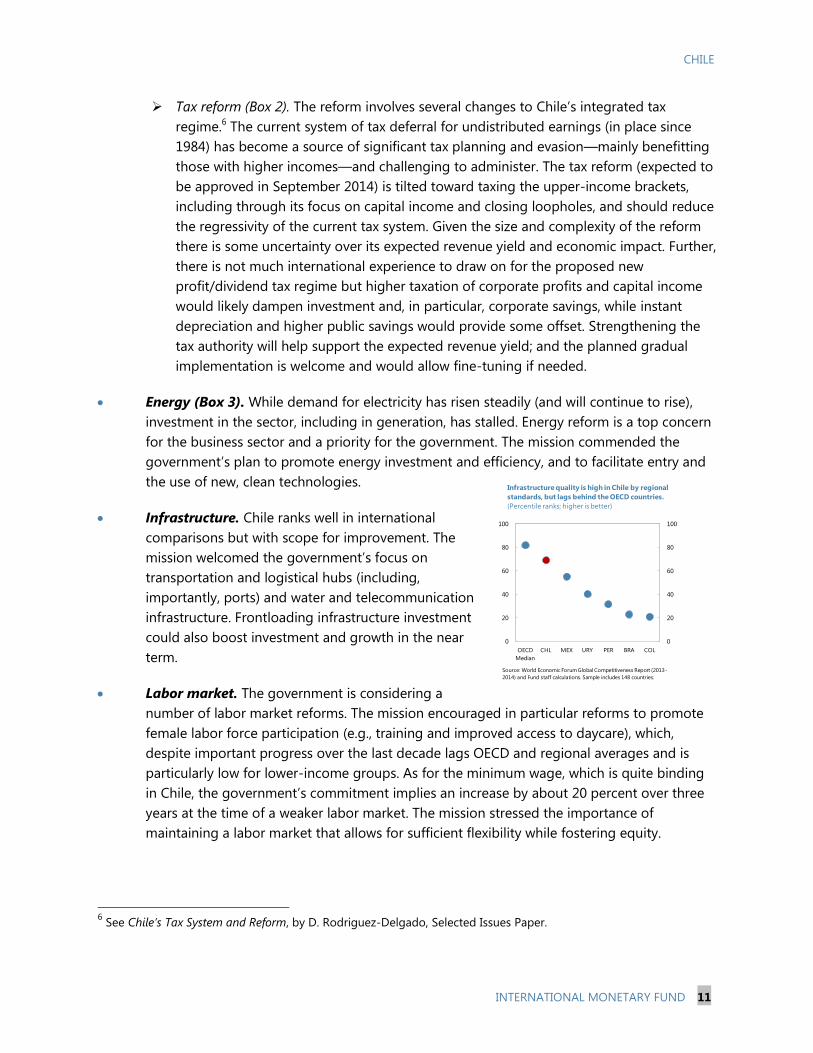
Infrastructure. Chile ranks well in international
comparisons but with scope for improvement. The
mission welcomed the government’s focus on
transportation and logistical hubs (including,
importantly, ports) and water and telecommunication
infrastructure. Frontloading infrastructure investment
could also boost investment and growth in the near
term.
Labor market. The government is considering a
number of labor market reforms. The mission encouraged in particular reforms to promote
female labor force participation (e.g., training and improved access to daycare), which,
despite important progress over the last decade lags OECD and regional averages and is
particularly low for lower-income groups. As for the minimum wage, which is quite binding
in Chile, the government’s commitment implies an increase by about 20 percent over three
years at the time of a weaker labor market. The mission stressed the importance of
maintaining a labor market that allows for sufficient flexibility while fostering equity.
6 See Chile’s Tax System and Reform, by D. Rodriguez-Delgado, Selected Issues Paper.
0
20
40
60
80
100
0
20
40
60
80
100
OECD
Median
CHL MEX URY PER BRA COL
Source: World Economic Forum Global Competitiveness Report (2013-
2014) and Fund staff calculations. Sample includes 148 countries.
Infrastructure quality is high in Chile by regional
standards, but lags behind the OECD countries.
(Percentile ranks; higher is better)
CHILE
12 INTERNATIONAL MONETARY FUND
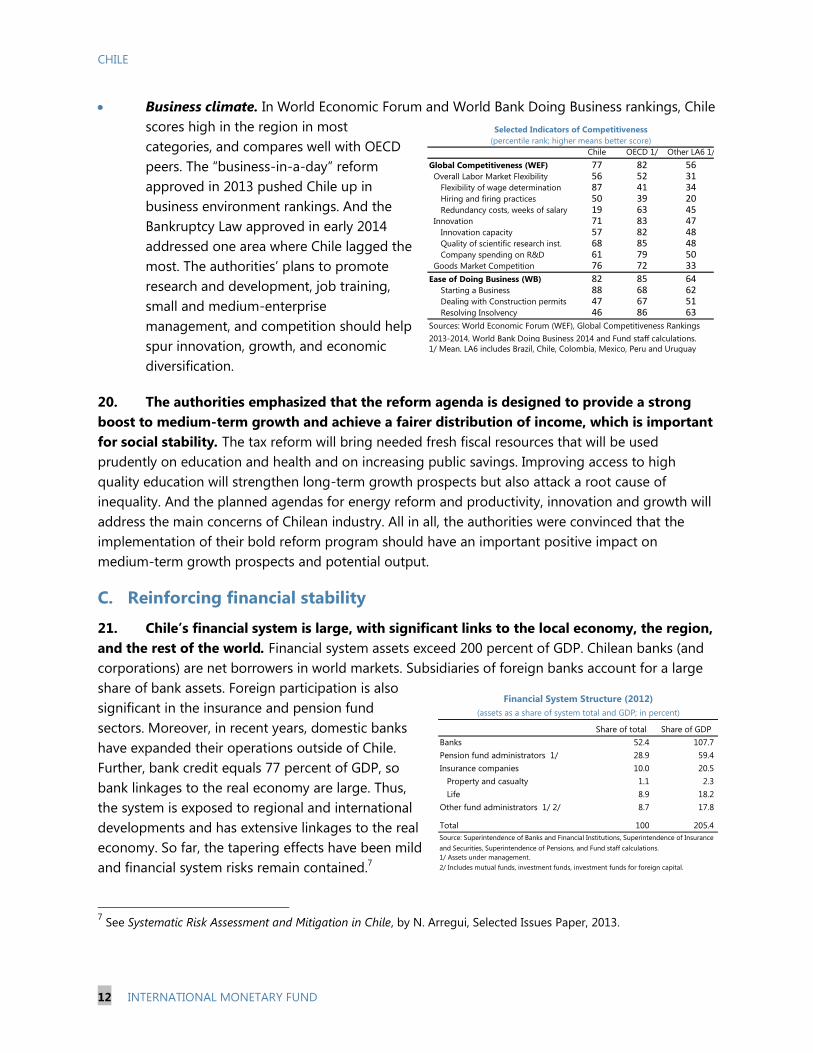
Chile OECD 1/ Other LA6 1/
Global Competitiveness (WEF) 77 82 56 Overall Labor Market Flexibility 56 52 31 Flexibility of wage determination 87 41 34 Hiring and firing practices 50 39 20 Redundancy costs, weeks of salary 19 63 45 Innovation 71 83 47 Innovation capacity 57 82 48 Quality of scientific research inst. 68 85 48 Company spending on R&D 61 79 50 Goods Market Competition 76 72 33
Ease of Doing Business (WB) 82 85 64 Starting a Business 88 68 62 Dealing with Construction permits 47 67 51 Resolving Insolvency 46 86 63
Selected Indicators of Competitiveness
Sources: World Economic Forum (WEF), Global Competitiveness Rankings
2013-2014, World Bank Doing Business 2014 and Fund staff calculations.
(percentile rank; higher means better score)
1/ Mean. LA6 includes Brazil, Chile, Colombia, Mexico, Peru and Uruguay
Business climate. In World Economic Forum and World Bank Doing Business rankings, Chile
scores high in the region in most
categories, and compares well with OECD
peers. The “business-in-a-day” reform
approved in 2013 pushed Chile up in
business environment rankings. And the
Bankruptcy Law approved in early 2014
addressed one area where Chile lagged the
most. The authorities’ plans to promote
research and development, job training,
small and medium-enterprise
management, and competition should help
spur innovation, growth, and economic
diversification.
20. The authorities emphasized that the reform agenda is designed to provide a strong
boost to medium-term growth and achieve a fairer distribution of income, which is important
for social stability. The tax reform will bring needed fresh fiscal resources that will be used
prudently on education and health and on increasing public savings. Improving access to high
quality education will strengthen long-term growth prospects but also attack a root cause of
inequality. And the planned agendas for energy reform and productivity, innovation and growth will
address the main concerns of Chilean industry. All in all, the authorities were convinced that the
implementation of their bold reform program should have an important positive impact on
medium-term growth prospects and potential output.
C. Reinforcing financial stability
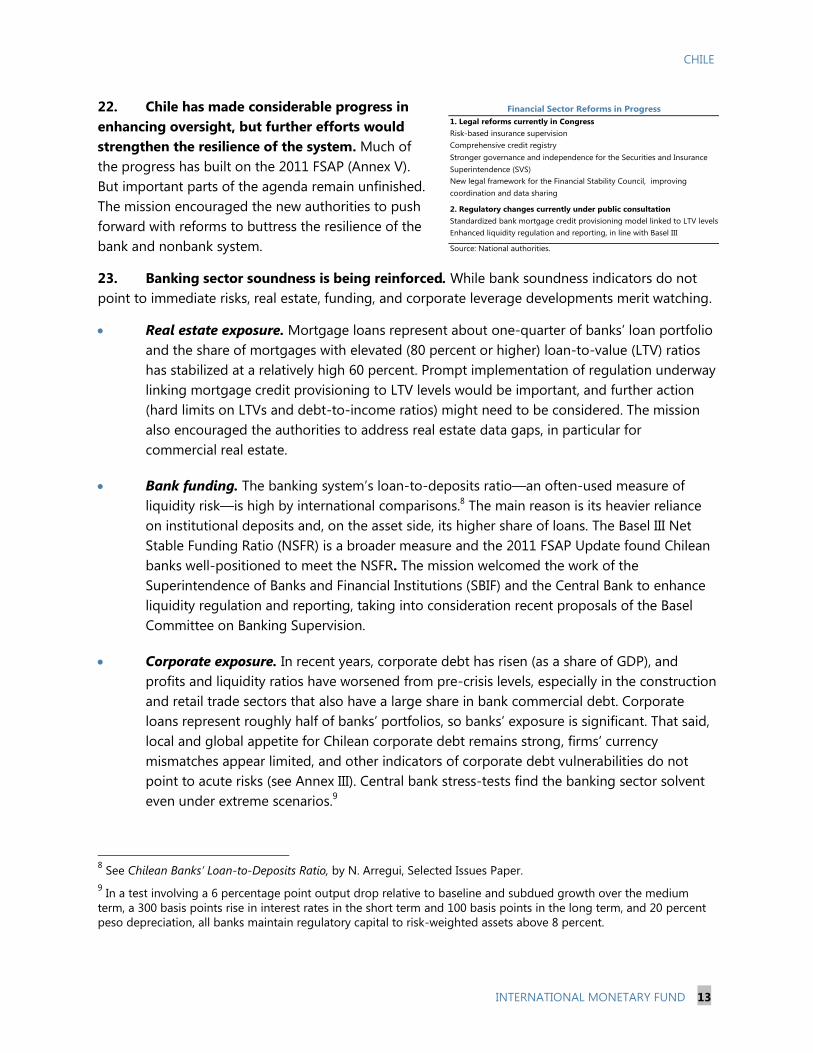
21. Chile’s financial system is large, with significant links to the local economy, the region,
and the rest of the world. Financial system assets exceed 200 percent of GDP. Chilean banks (and
corporations) are net borrowers in world markets. Subsidiaries of foreign banks account for a large
share of bank assets. Foreign participation is also
significant in the insurance and pension fund
sectors. Moreover, in recent years, domestic banks
have expanded their operations outside of Chile.
Further, bank credit equals 77 percent of GDP, so
bank linkages to the real economy are large. Thus,
the system is exposed to regional and international
developments and has extensive linkages to the real
economy. So far, the tapering effects have been mild
and financial system risks remain contained.7
7 See Systematic Risk Assessment and Mitigation in Chile, by N. Arregui, Selected Issues Paper, 2013.
Share of total Share of GDP
Banks 52.4 107.7
Pension fund administrators 1/ 28.9 59.4
Insurance companies 10.0 20.5
Property and casualty 1.1 2.3
Life 8.9 18.2
Other fund administrators 1/ 2/ 8.7 17.8
Total 100 205.4
2/ Includes mutual funds, investment funds, investment funds for foreign capital.
Financial System Structure (2012)
(assets as a share of system total and GDP; in percent)
Source: Superintendence of Banks and Financial Institutions, Superintendence of Insurance
and Securities, Superintendence of Pensions, and Fund staff calculations.
1/ Assets under management.
CHILE
INTERNATIONAL MONETARY FUND 13
22. Chile has made considerable progress in
enhancing oversight, but further efforts would
strengthen the resilience of the system. Much of
the progress has built on the 2011 FSAP (Annex V).
But important parts of the agenda remain unfinished.
The mission encouraged the new authorities to push
forward with reforms to buttress the resilience of the
bank and nonbank system.
23. Banking sector soundness is being reinforced. While bank soundness indicators do not
point to immediate risks, real estate, funding, and corporate leverage developments merit watching.
Real estate exposure. Mortgage loans represent about one-quarter of banks’ loan portfolio
and the share of mortgages with elevated (80 percent or higher) loan-to-value (LTV) ratios
has stabilized at a relatively high 60 percent. Prompt implementation of regulation underway
linking mortgage credit provisioning to LTV levels would be important, and further action
(hard limits on LTVs and debt-to-income ratios) might need to be considered. The mission
also encouraged the authorities to address real estate data gaps, in particular for
commercial real estate.
Bank funding. The banking system’s loan-to-deposits ratio—an often-used measure of
liquidity risk—is high by international comparisons.8 The main reason is its heavier reliance
on institutional deposits and, on the asset side, its higher share of loans. The Basel III Net
Stable Funding Ratio (NSFR) is a broader measure and the 2011 FSAP Update found Chilean
banks well-positioned to meet the NSFR. The mission welcomed the work of the
Superintendence of Banks and Financial Institutions (SBIF) and the Central Bank to enhance
liquidity regulation and reporting, taking into consideration recent proposals of the Basel
Committee on Banking Supervision.
Corporate exposure. In recent years, corporate debt has risen (as a share of GDP), and
profits and liquidity ratios have worsened from pre-crisis levels, especially in the construction
and retail trade sectors that also have a large share in bank commercial debt. Corporate
loans represent roughly half of banks’ portfolios, so banks’ exposure is significant. That said,
local and global appetite for Chilean corporate debt remains strong, firms’ currency
mismatches appear limited, and other indicators of corporate debt vulnerabilities do not
point to acute risks (see Annex III). Central bank stress-tests find the banking sector solvent
even under extreme scenarios.9
8 See Chilean Banks’ Loan-to-Deposits Ratio, by N. Arregui, Selected Issues Paper.
9 In a test involving a 6 percentage point output drop relative to baseline and subdued growth over the medium
term, a 300 basis points rise in interest rates in the short term and 100 basis points in the long term, and 20 percent
peso depreciation, all banks maintain regulatory capital to risk-weighted assets above 8 percent.
Financial Sector Reforms in Progress
1. Legal reforms currently in Congress
Risk-based insurance supervision
Comprehensive credit registry
Stronger governance and independence for the Securities and Insurance
Superintendence (SVS)
New legal framework for the Financial Stability Council, improving
coordination and data sharing
2. Regulatory changes currently under public consultation
Standardized bank mortgage credit provisioning model linked to LTV levels
Enhanced liquidity regulation and reporting, in line with Basel III
Source: National authorities.
CHILE
14 INTERNATIONAL MONETARY FUND
Non-Bank Financial Institutions
50
70
90
110
130
150
170
190
-25
-20
-15
-10
-5
0
5
10
15
20
25
2005 2006 2007 2008 2009 2010 2011 2012 2013
Pension Fund Value (RHS, in billions of US dollars)
Real Return
Real Return Average 81-05
Pension Funds Size and Returns 1/
(In percent, unless otherwise stated)
-10
-5
0
5
10
15
20
25
30
-10
-5
0
5
10
15
20
25
30
Po
lan
d
Icela
nd
Est
on
ia
Mexi
co
Au
stra
lia
Ch
ile 2
012
Tu
rkey
Sw
itze
rlan
d
Ch
ile 1
0-1
2
Fin
lan
d
No
rway
Cze
ch R
ep
.
Den
mark
Germ
an
y
Ko
rea
US
Po
rtu
gal
Belg
ium
Can
ad
a
UK
Lu
xem
bo
urg
Fra
nce
Slo
vak R
ep
.
Italy
Irela
nd
Gre
ece
Hu
ng
ary
Average 2010-12
OECD Median
Life Insurance - Return on Equity
(In percent)
0
5
10
15
20
25
30
35
40
45
0
5
10
15
20
25
30
35
40
45
2001 2003 2005 2007 2009 2011 2013
Mutual Funds - Assets Under Managament
(In billion s of US dollars)
Sources: Superintendence of Banks and Financial Institutions, Superintendence of Insurance and Securities, Superintendence of Pensions, OECD and the Chile'sMutual Funds Association. 1/ Returns are showed for Pension Funds type C, out of pension funds type A to E (ranked from more to less risk appetite).
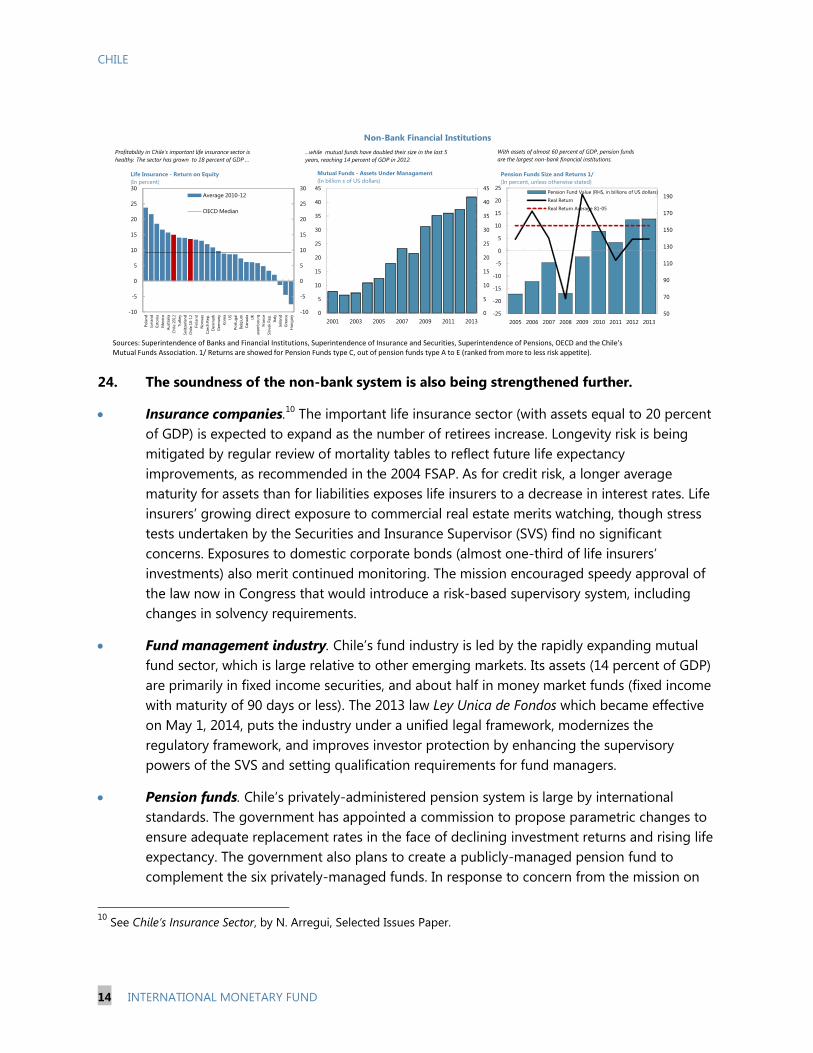
Profitability in Chile's important life insurance sector is
healthy. The sector has grown to 18 percent of GDP ...
...while mutual funds have doubled their size in the last 5
years, reaching 14 percent of GDP in 2012.
With assets of almost 60 percent of GDP, pension funds
are the largest non-bank financial institutions.
24. The soundness of the non-bank system is also being strengthened further.
Insurance companies.10
The important life insurance sector (with assets equal to 20 percent
of GDP) is expected to expand as the number of retirees increase. Longevity risk is being
mitigated by regular review of mortality tables to reflect future life expectancy
improvements, as recommended in the 2004 FSAP. As for credit risk, a longer average
maturity for assets than for liabilities exposes life insurers to a decrease in interest rates. Life
insurers’ growing direct exposure to commercial real estate merits watching, though stress
tests undertaken by the Securities and Insurance Supervisor (SVS) find no significant
concerns. Exposures to domestic corporate bonds (almost one-third of life insurers’
investments) also merit continued monitoring. The mission encouraged speedy approval of
the law now in Congress that would introduce a risk-based supervisory system, including
changes in solvency requirements.
Fund management industry. Chile’s fund industry is led by the rapidly expanding mutual
fund sector, which is large relative to other emerging markets. Its assets (14 percent of GDP)
are primarily in fixed income securities, and about half in money market funds (fixed income
with maturity of 90 days or less). The 2013 law Ley Unica de Fondos which became effective
on May 1, 2014, puts the industry under a unified legal framework, modernizes the
regulatory framework, and improves investor protection by enhancing the supervisory
powers of the SVS and setting qualification requirements for fund managers.
Pension funds. Chile’s privately-administered pension system is large by international
standards. The government has appointed a commission to propose parametric changes to
ensure adequate replacement rates in the face of declining investment returns and rising life
expectancy. The government also plans to create a publicly-managed pension fund to
complement the six privately-managed funds. In response to concern from the mission on
10
See Chile’s Insurance Sector, by N. Arregui, Selected Issues Paper.
CHILE
INTERNATIONAL MONETARY FUND 15
how this might affect the industry, the authorities stressed that the new fund manager
would operate under the same legal and regulatory framework as the others and that it
would focus on enrolling workers not currently picked up by private funds (e.g. self-
employed, rural).
25. Multiple agencies provide close and active financial oversight but the framework and
governance could be strengthened. The financial industry is regulated by the Central Bank, and
supervised by SBIF, SVS, and the Superintendence of Pensions. The Financial Stability Council,
chaired by the Minister of Finance, facilitates coordination and data sharing. Two laws currently in
Congress, which will provide a legal framework to the Financial Stability Council and strengthen the
operational independence of SVS, should be implemented promptly once approved. But it will also
be important to strengthen the independence of the banking supervisor (SBIF).
26. Conglomerates pose a challenge for supervision and a consolidated approach would
be more effective. Most financial institutions in Chile are part of conglomerates, which tend to be
large, complex, and prone to regulatory arbitrage and intra-group contagion. Chile’s financial
oversight structure relies on a silo approach, based on sectoral supervision and built-in firewalls
(such as related-party exposure limits). The authorities have strengthened oversight of
conglomerates within the current legal framework, including by advancing risk identification based
on case studies, tightening related-party exposure limits for banks, and improving the coordination
and information exchange mechanisms among supervisors. When approved, the Financial Stability
Council law will remove data sharing constraints among supervisory bodies that have hampered
effective supervision. While these advances are important, a more comprehensive approach (as
suggested by the 2011 FSAP) would be more effective. This would require a clear allocation of
powers and responsibilities for continuous consolidated supervision, prudential regulation at
conglomerate level, and corrective actions to address compliance with the framework.
27. Implementation of other initiatives would strengthen financial resilience further. The
mission encouraged prompt congressional approval of legislation expanding the credit registry with
comprehensive credit history from banks and nonbanks. Furthermore, the revision of the General
Banking Law mentioned in last year’s staff report remains unfinished, and the mission recommended
that the authorities give it a new push, focusing on incorporating Basel III capital standards,
improving the legal framework for bank resolution, and strengthening the SBIF’s independence.
28. The authorities explained that they are committed to push ahead with financial sector
reforms. They are committed to ensuring prompt approval of the legislative initiatives already in
Congress. They are also committed to pushing forward with other financial sector reforms, including
revising the General Banking Law to complete the adoption of Basel bank capital standards,
strengthen SBIF’s independence, and modernize the banking resolution, though the timing of these
reforms would require careful consideration given the broader policy agenda. In the shorter run, the
Central Bank has already put in consultation the new proposed regulation for the sound
management of banks’ liquidity risk.
CHILE
16 INTERNATIONAL MONETARY FUND
D. Enhancing the fiscal framework
29. There is scope to refine Chile’s fiscal framework. Chile has a well-earned track record of
prudent fiscal policy, formalized, since 2001, in a fiscal rule that has become a model for other
countries. The rule was strengthened with the creation in 2013 (by ministerial decree) of a Fiscal
Council to oversee its implementation. Though there is no urgent need for changes to the
framework, the mission suggested consideration of some modifications.
The rule/target. The rule is simple and understood by the public and markets, and has
shielded the budget from the business cycle and changes in copper prices, while allowing
for a flexible response when warranted. The structural target is set by each administration for
its four-year term and can be changed mid-stream. To provide more predictability and a
stronger anchor for fiscal policy, especially after deviations, clearer guidance on medium-
term objectives (e.g., structural balance or net assets) could be embedded in the rule itself.
When the rule was created the authorities set a structural surplus target of 1 percent of GDP.
While circumstances are now different (e.g., the government net asset position) and this
target may not be appropriate, a small structural surplus for “steady state” would help
preserve the government net asset position. Further, an explicit escape clause to allow
discretionary policy in the event of large, clearly defined shocks would enhance clarity while
preserving flexibility.
The Council. A law now in Congress will give the Council a stronger legal basis and will
hopefully be approved soon. The authorities could also consider strengthening the Council’s
autonomy and broadening its mandate (e.g., to include assessing outturns against targets).
30. The authorities appreciated the recommendations but did not see, given the already
heavy agenda, revisions to the fiscal framework or the Council’s mandate as immediate
priorities. They also noted that the appropriate medium-run fiscal target is a topic that will need
further consideration and public discussion.
STAFF APPRAISAL
31. Chile is confronting a challenging macroeconomic environment. Activity has slowed
markedly, mostly reflecting an adjustment toward trend after a period of rapid growth. There are
signs of a budding recovery but it is subject to considerable uncertainty and risk. And looking ahead,
Chile’s growth prospects are affected by waning, even reversing, tailwinds to growth as global
monetary policy begins to normalize and the copper price boom peters out. Chile also faces the
headwind of a slowing working-age population.
32. Strengthening the prospects for strong and inclusive growth will require structural
reforms. Chile is ahead of the curve in terms of building strong and credible policy institutions,
flexible markets, and achieving macroeconomic stability. There is no single bottleneck to growth
that stands out. Rather a comprehensive reform effort will be needed to rekindle productivity, spur
investment, and boost human capital.
CHILE
INTERNATIONAL MONETARY FUND 17
33. The government’s reform focuses on the right areas. The tax reform stands to achieve a
welcome reduction in regressivity, close loopholes, and raise permanent revenue to fund education
reform and additional health spending, and raise public savings. While the tax reform would likely
dampen investment and, in particular, corporate savings, other key elements of the reform agenda
could boost medium and long-run growth prospects. In particular, a well-designed education
reform that focuses on improving access and quality at all levels of schooling, especially at younger
ages, would be a win-win for growth and equity. Likewise with reforms that boost female labor force
participation. Labor market reforms should make sure the market remains flexible to support a
dynamic economy and the needed adjustments, while fostering equity. Reforms to upgrade key
infrastructure and spur innovation would help boost productivity growth and investment. Greater
clarity on details, timetables, and priorities—followed by rigorous implementation—will be critical to
reduce uncertainty and risk of delays.
34. The current macroeconomic policy mix is broadly appropriate. The freely floating
exchange rate is acting as a shock absorber, facilitating adjustment, and supporting the recovery.
Monetary policy can remain accommodative so long as inflation expectations remain anchored.
Fiscal policy should remain broadly neutral and with full operation of automatic stabilizers. The
authorities’ commitment to achieve a balanced structural fiscal position by 2018 is appropriate—and
the path should calibrated to avoid excessive drag that could scupper the recovery—and the
resulting increase in public savings is welcome.
35. Enhancing the fiscal framework would help preserve fiscal space. Providing clearer
guidance on medium-term fiscal objectives in the framework itself would provide a stronger anchor
for fiscal policy, especially after deviations. A small structural surplus target over the cycle would
help preserve strong fiscal buffers. An escape clause for discretionary policy in the event of shocks
could enhance clarity further while preserving flexibility. The authorities’ plan to put the Fiscal
Council on a more solid legal basis is an important step, but strengthened autonomy and a broader
mandate would improve its effectiveness.
36. Chile should build on the progress achieved in recent years in enhancing financial
oversight. Chile has made significant progress, building on the 2011 FSAP, but important parts of
the agenda remain unfinished. It will be important to complete the initiatives now in Congress
relating to risk-based insurance supervision, a comprehensive credit registry, stronger governance
and independence of the Securities and Insurance Supervisor, and a new legal framework to the
Financial Stability Council. It will also be important to follow up with reforms to align capital
standards with Basel III, and provide greater independence to the Supervisor of Banks and Financial
Institutions. As the economy is adjusting, corporate sector financial health and leverage, as well as
the developments in the still dynamic real-estate sector should be monitored closely. Finally, given
their dominant role in the financial system, the ongoing strengthening of supervision of financial
conglomerates is important and welcome. Building on the progress achieved, consideration should
be given to a more consolidated approach to oversight of conglomerates.
37. Staff proposes to hold the next Article IV consultation on the standard 12-month
cycle.
CHILE
18 INTERNATIONAL MONETARY FUND
Box 1. Spillover Transmission Channels and Effects
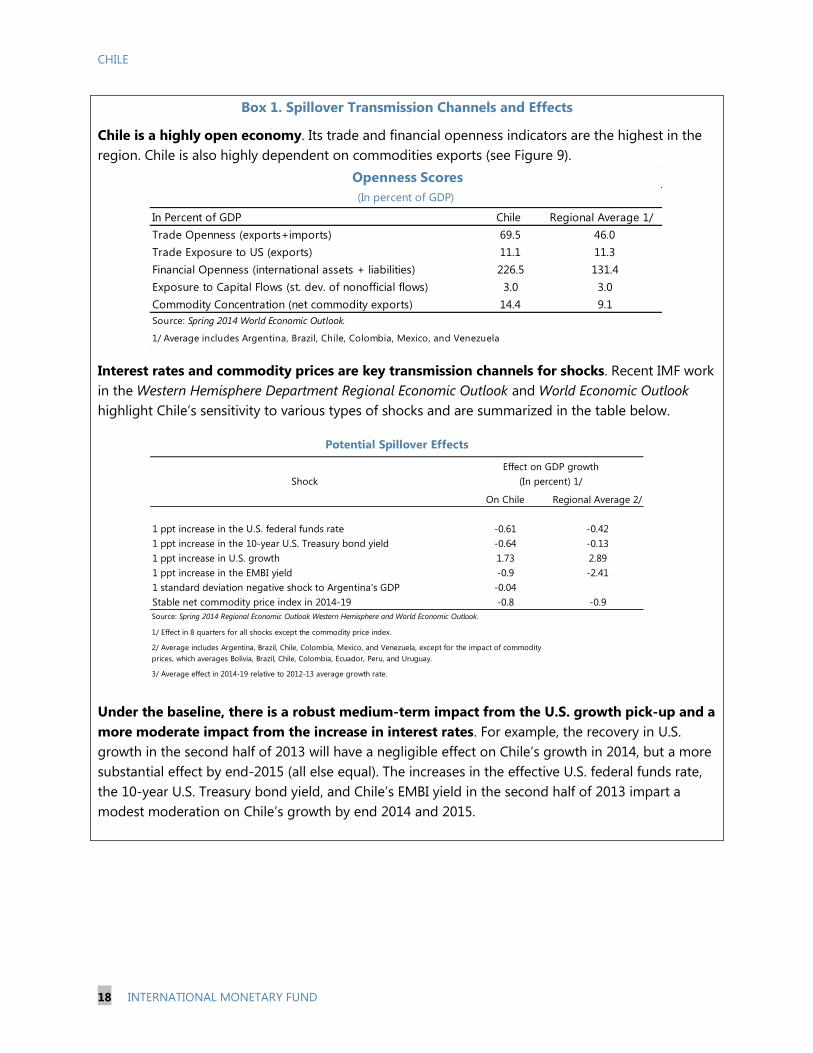
Chile is a highly open economy. Its trade and financial openness indicators are the highest in the
region. Chile is also highly dependent on commodities exports (see Figure 9).
Interest rates and commodity prices are key transmission channels for shocks. Recent IMF work
in the Western Hemisphere Department Regional Economic Outlook and World Economic Outlook
highlight Chile’s sensitivity to various types of shocks and are summarized in the table below.
Under the baseline, there is a robust medium-term impact from the U.S. growth pick-up and a
more moderate impact from the increase in interest rates. For example, the recovery in U.S.
growth in the second half of 2013 will have a negligible effect on Chile’s growth in 2014, but a more
substantial effect by end-2015 (all else equal). The increases in the effective U.S. federal funds rate,
the 10-year U.S. Treasury bond yield, and Chile’s EMBI yield in the second half of 2013 impart a
modest moderation on Chile’s growth by end 2014 and 2015.
In Percent of GDP Chile Regional Average 1/
Trade Openness (exports+imports) 69.5 46.0
Trade Exposure to US (exports) 11.1 11.3
Financial Openness (international assets + liabilities) 226.5 131.4
Exposure to Capital Flows (st. dev. of nonofficial flows) 3.0 3.0
Commodity Concentration (net commodity exports) 14.4 9.1
Source: Spring 2014 World Economic Outlook.
1/ Average includes Argentina, Brazil, Chile, Colombia, Mexico, and Venezuela
Openness Scores
(In percent of GDP)
On Chile Regional Average 2/
1 ppt increase in the U.S. federal funds rate -0.61 -0.42
1 ppt increase in the 10-year U.S. Treasury bond yield -0.64 -0.13
1 ppt increase in U.S. growth 1.73 2.89
1 ppt increase in the EMBI yield -0.9 -2.41
1 standard deviation negative shock to Argentina's GDP -0.04
Stable net commodity price index in 2014-19 -0.8 -0.9
Source: Spring 2014 Regional Economic Outlook Western Hemisphere and World Economic Outlook.
1/ Effect in 8 quarters for all shocks except the commodity price index.
3/ Average effect in 2014-19 relative to 2012-13 average growth rate.
Shock
2/ Average includes Argentina, Brazil, Chile, Colombia, Mexico, and Venezuela, except for the impact of commodity
prices, which averages Bolivia, Brazil, Chile, Colombia, Ecuador, Peru, and Uruguay.
Effect on GDP growth
(In percent) 1/
Potential Spillover Effects
CHILE
INTERNATIONAL MONETARY FUND 19
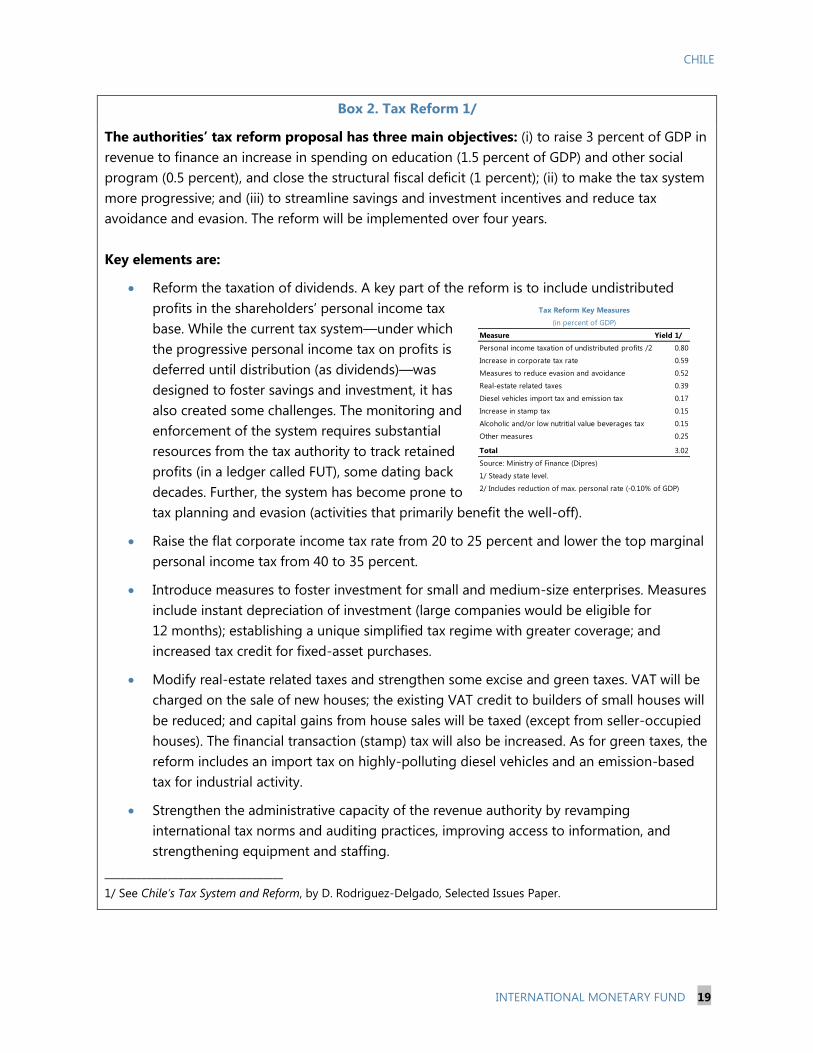
Box 2. Tax Reform 1/
The authorities’ tax reform proposal has three main objectives: (i) to raise 3 percent of GDP in
revenue to finance an increase in spending on education (1.5 percent of GDP) and other social
program (0.5 percent), and close the structural fiscal deficit (1 percent); (ii) to make the tax system
more progressive; and (iii) to streamline savings and investment incentives and reduce tax
avoidance and evasion. The reform will be implemented over four years.
Key elements are:
Reform the taxation of dividends. A key part of the reform is to include undistributed
profits in the shareholders’ personal income tax
base. While the current tax system—under which
the progressive personal income tax on profits is
deferred until distribution (as dividends)—was
designed to foster savings and investment, it has
also created some challenges. The monitoring and
enforcement of the system requires substantial
resources from the tax authority to track retained
profits (in a ledger called FUT), some dating back
decades. Further, the system has become prone to
tax planning and evasion (activities that primarily benefit the well-off).
Raise the flat corporate income tax rate from 20 to 25 percent and lower the top marginal
personal income tax from 40 to 35 percent.
Introduce measures to foster investment for small and medium-size enterprises. Measures
include instant depreciation of investment (large companies would be eligible for
12 months); establishing a unique simplified tax regime with greater coverage; and
increased tax credit for fixed-asset purchases.
Modify real-estate related taxes and strengthen some excise and green taxes. VAT will be
charged on the sale of new houses; the existing VAT credit to builders of small houses will
be reduced; and capital gains from house sales will be taxed (except from seller-occupied
houses). The financial transaction (stamp) tax will also be increased. As for green taxes, the
reform includes an import tax on highly-polluting diesel vehicles and an emission-based
tax for industrial activity.
Strengthen the administrative capacity of the revenue authority by revamping
international tax norms and auditing practices, improving access to information, and
strengthening equipment and staffing.
__________________________________
1/ See Chile’s Tax System and Reform, by D. Rodriguez-Delgado, Selected Issues Paper.
Measure Yield 1/
Personal income taxation of undistributed profits /2 0.80
Increase in corporate tax rate 0.59
Measures to reduce evasion and avoidance 0.52
Real-estate related taxes 0.39
Diesel vehicles import tax and emission tax 0.17
Increase in stamp tax 0.15
Alcoholic and/or low nutritial value beverages tax 0.15
Other measures 0.25
Total 3.02
Source: Ministry of Finance (Dipres)
1/ Steady state level.
2/ Includes reduction of max. personal rate (-0.10% of GDP)
Tax Reform Key Measures
(in percent of GDP)
CHILE
20 INTERNATIONAL MONETARY FUND
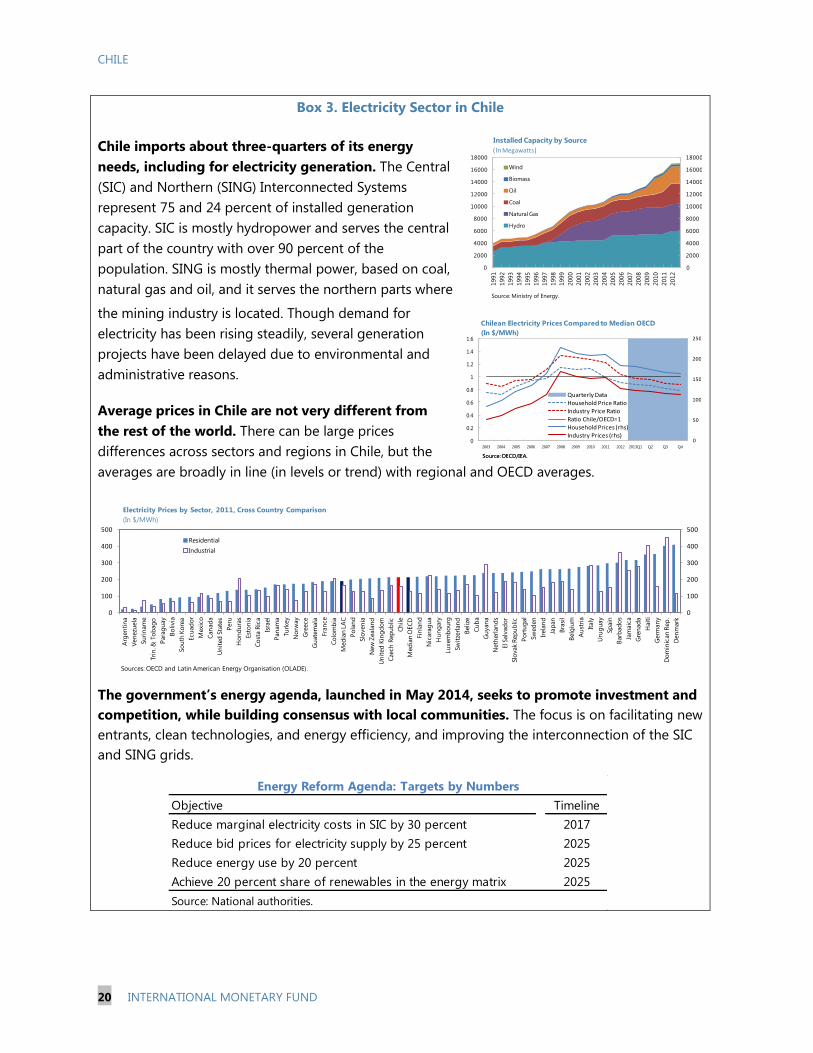
Objective Timeline
Reduce marginal electricity costs in SIC by 30 percent 2017
Reduce bid prices for electricity supply by 25 percent 2025
Reduce energy use by 20 percent 2025
Achieve 20 percent share of renewables in the energy matrix 2025
Source: National authorities.
Energy Reform Agenda: Targets by Numbers
Box 3. Electricity Sector in Chile
Chile imports about three-quarters of its energy
needs, including for electricity generation. The Central
(SIC) and Northern (SING) Interconnected Systems
represent 75 and 24 percent of installed generation
capacity. SIC is mostly hydropower and serves the central
part of the country with over 90 percent of the
population. SING is mostly thermal power, based on coal,
natural gas and oil, and it serves the northern parts where
the mining industry is located. Though demand for
electricity has been rising steadily, several generation
projects have been delayed due to environmental and
administrative reasons.
Average prices in Chile are not very different from
the rest of the world. There can be large prices
differences across sectors and regions in Chile, but the
averages are broadly in line (in levels or trend) with regional and OECD averages.
The government’s energy agenda, launched in May 2014, seeks to promote investment and
competition, while building consensus with local communities. The focus is on facilitating new
entrants, clean technologies, and energy efficiency, and improving the interconnection of the SIC
and SING grids.
0
100
200
300
400
500
0
100
200
300
400
500
Arg
en
tin
a
Ven
ezu
ela
Su
rin
am
e
Tri
n. &
To
bag
o
Para
gu
ay
Bo
livia
So
uth
Ko
rea
Ecu
ad
or
Mexic
o
Can
ad
a
Un
ited
Sta
tes
Peru
Ho
nd
ura
s
Est
on
ia
Co
sta R
ica
Isra
el
Pan
am
a
Tu
rkey
No
rway
Gre
ece
Gu
ate
mala
Fra
nce
Co
lom
bia
Med
ian
LA
C
Po
lan
d
Slo
ven
ia
New
Zeala
nd
Un
ited
Kin
gd
om
Cze
ch
Rep
ub
lic
Ch
ile
Med
ian
OEC
D
Fin
lan
d
Nic
ara
gu
a
Hu
ng
ary
Lu
xem
bo
urg
Sw
itze
rlan
d
Belize
Cu
ba
Gu
yan
a
Neth
erl
an
ds
El S
alv
ad
or
Slo
vak R
ep
ub
lic
Po
rtu
gal
Sw
ed
en
Irela
nd
Jap
an
Bra
sil
Belg
ium
Au
stri
a
Italy
Uru
gu
ay
Sp
ain
Barb
ad
os
Jam
aic
a
Gre
nad
a
Hait
i
Germ
an
y
Do
min
ican
Rep
.
Den
mark
Electricity Prices by Sector, 2011, Cross Country Comparison
(In $/MWh)
Residential
Industrial
Sources: OECD and Latin American Energy Organisation (OLADE).
0
2000
4000
6000
8000
10000
12000
14000
16000
18000
0
2000
4000
6000
8000
10000
12000
14000
16000
18000
1991
1992
1993
1994
1995
1996
1997
1998
1999
2000
2001
2002
2003
2004
2005
2006
2007
2008
2009
2010
2011
2012
Installed Capacity by Source
Wind
Biomass
Oil
Coal
Natural Gas
Hydro
Source: Ministry of Energy.
(In Megawatts)
0
50
100
150
200
250
0
0.2
0.4
0.6
0.8
1
1.2
1.4
1.6
2003 2004 2005 2006 2007 2008 2009 2010 2011 2012 2013Q1 Q2 Q3 Q4
Chilean Electricity Prices Compared to Median OECD
(In $/MWh)
Quarterly DataHousehold Price RatioIndustry Price RatioRatio Chile/OECD=1Household Prices (rhs)Industry Prices (rhs)
Source: OECD/IEA.Source: OECD/IEA.
CHILE
INTERNATIONAL MONETARY FUND 21
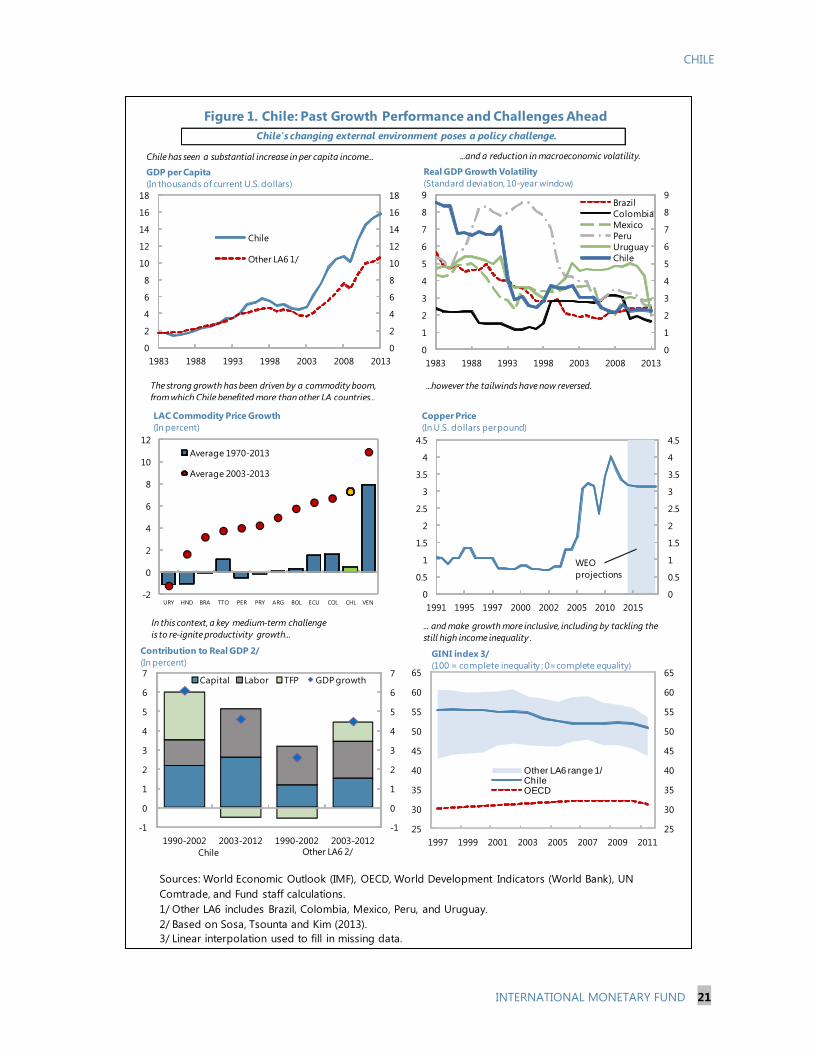
Figure 1. Chile: Past Growth Performance and Challenges Ahead
Sources: World Economic Outlook (IMF), OECD, World Development Indicators (World Bank), UN
Comtrade, and Fund staff calculations.
1/ Other LA6 includes Brazil, Colombia, Mexico, Peru, and Uruguay.
2/ Based on Sosa, Tsounta and Kim (2013).
3/ Linear interpolation used to fill in missing data.
0
2
4
6
8
10
12
14
16
18
0
2
4
6
8
10
12
14
16
18
1983 1988 1993 1998 2003 2008 2013
Chile
Other LA6 1/
GDP per Capita
(In thousands of current U.S. dollars)
0
1
2
3
4
5
6
7
8
9
0
1
2
3
4
5
6
7
8
9
1983 1988 1993 1998 2003 2008 2013
Brazil
Colombia
Mexico
Peru
Uruguay
Chile
Real GDP Growth Volatility
(Standard deviation, 10-year window)
25
30
35
40
45
50
55
60
65
25
30
35
40
45
50
55
60
65
1997 1999 2001 2003 2005 2007 2009 2011
Other LA6 range 1/ChileOECD
GINI index 3/
(100 = complete inequality ; 0=complete equality)
Chile has seen a substantial increase in per capita income... ...and a reduction in macroeconomic volatility.
... and make growth more inclusive, including by tackling the
still high income inequality .
Chile's changing external environment poses a policy challenge.
0
0.5
1
1.5
2
2.5
3
3.5
4
4.5
0
0.5
1
1.5
2
2.5
3
3.5
4
4.5
1991 1995 1997 2000 2002 2005 2010 2015
WEO
projections
Copper Price
(In U.S. dollars per pound)
...however the tailwinds have now reversed.The strong growth has been driven by a commodity boom,
from which Chile benefited more than other LA countries...
In this context, a key medium-term challenge
is to re-ignite productivity growth...
-1
0
1
2
3
4
5
6
7
-1
0
1
2
3
4
5
6
7
1990-2002 2003-2012 1990-2002 2003-2012
Capital Labor TFP GDP growth
Chile Other LA6 2/
Contribution to Real GDP 2/
(In percent)
-2
0
2
4
6
8
10
12
URY HND BRA TTO PER PRY ARG BOL ECU COL CHL VEN
LAC Commodity Price Growth
(In percent)
Average 1970-2013
Average 2003-2013
CHILE
22 INTERNATIONAL MONETARY FUND
0
100
200
300
400
500
600
0
100
200
300
400
500
600
Jan-09 Jan-10 Jan-11 Jan-12 Jan-13 Jan-14
Chile
Other LA6 1/
Sovereign Spreads (EMBIG)
(In basis points)
-50
0
50
100
150
200
250
-50
0
50
100
150
200
250
Jan-09 Nov-09 Oct-10 Sep-11 Jul-12 Jun-13
180-day spread180-day spread (Avg. Jan.2009-Dec.2013)
Liquidity Pressures in the Peso Money Market
(In basis points, prime rate-interest rate swap spread)
-5
0
5
10
15
20
-5
0
5
10
15
20
Jan-09 Jan-10 Jan-11 Jan-12 Jan-13 Jan-14
Total
Commercial
Consumer
Housing
Real Credit Growth
(In percent, y-o-y)
4.0
4.2
4.4
4.6
4.8
5.0
5.2
5.4
5.6
5.8
6.0
0
5
10
15
20
25
30
35
40
Jan-09 Jan-10 Jan-11 Jan-12 Jan-13 Jan-14
Consumption
Commercial
Housing>3 yrs. (UF), RHS
Lending Rates by Sector 3/
(In percent)
Sources: Bloomberg, Central Bank of Chile, and Fund staff calculations.
1/ Other LA6 includes Brazil, Colombia, Mexico, Peru, and Uruguay.
2/ Morgan Stanley Composite Indices.
3/ Unidad de Fomento (UF) is a unit of account adjusted for inflation.
Figure 2. Chile: Financial Market Developments
Chile's sovereign spread is among the lowest in the region.The stock market has underperformed both the world
average but moved broadly in line with the region.
There is ample liquidity in pesos... ...as well as in dollars.
Still, real credit growth has moderated, except for
housing which remains brisk...... and some lending rates have declined lately.
40
60
80
100
120
140
160
40
60
80
100
120
140
160
Jan-09 Jan-10 Jan-11 Jan-12 Jan-13 Jan-14
Chile, in pesos ChileLatin America WorldEmerging market
Stock Market Performance, MSCI 2/
(US$; 2010=100)
-300
-200
-100
0
100
200
300
400
500
-3
-2
-1
0
1
2
3
4
5
Jan-09 Jan-10 Jan-11 Jan-12 Jan-13 Jan-14
Onshore rate
LIBOR
Onshore spread, RHS
Onshore spread avg. 2009-2013, RHS
Liquidity Pressures in the Dollar Money Market
(One-year maturity)
Financial markets have remained orderly but with some asset repricing.
CHILE
INTERNATIONAL MONETARY FUND 23
N228HWAT@EMERGELA
Figure 3. Chile: Cyclical Position
Sources: Central Bank of Chile, Haver Analytics, and Fund staff calculations.
1/ Core inflation excludes fuels, fresh fruits and vegetables.
-30
-20
-10
0
10
20
30
40
-4
-2
0
2
4
6
8
10
Jan 09 Jan 10 Jan 11 Jan 12 Jan 13 Jan 14
Headline
Core
Exchange Rate (Peso/US$), RHS
Consumer Prices and the Exchange Rate 1/
(In percent, y-o-y)
-4
-3
-2
-1
0
1
2
3
4
2009Q1 2010Q1 2011Q1 2012Q1 2013Q1 2014Q1
-4
-3
-2
-1
0
1
2
3
4
Output Gap
(In percent of potential GDP)
-30
-20
-10
0
10
20
30
40
-6
-4
-2
0
2
4
6
8
10
12
14
16
2009Q1 2010Q1 2011Q1 2012Q1 2013Q1 2014Q1
Private consumption
Import volume (RHS)
Private Consumption and Import Volume Growth
(In percent, y-o-y)
-2
0
2
4
6
8
10
12
-2
0
2
4
6
8
10
12
Jan-09 Jan-10 Jan-11 Jan-12 Jan-13 Jan-14
Unemployment rate
Employment y/y change
Salaried employment y/y change
Labor Market
(In percent, 3-month moving average)
... causing the output gap to swing into negative territory...Activity has decelerated, especially investment...
Employment growth has relied on non-salaried employment lately,
and the unemployment rate has edged up.
...and the current account deficit to improve somewhat.
Inflation has picked up amid peso depreciation.
Private consumption has also decelerated somewhat.
-5
-4
-3
-2
-1
0
1
2
3
-5
-4
-3
-2
-1
0
1
2
3
2009Q1 2010Q1 2011Q1 2012Q1 2013Q1 2014Q1
Current Account Balance
(In percent of GDP; 4-quarter rolling average)
Activity has moderated markedly, especially investment; while the tight labor market
has also started to ease.
-100
-80
-60
-40
-20
0
20
40
60
80
100
-15
-10
-5
0
5
10
15
Jan-09 Jan-10 Jan-11 Jan-12 Jan-13 Jan-14
IMACEC
Construction
Capital goods imports (RHS)
Selected Economic Activity Indicators
(In percent, y-o-y)
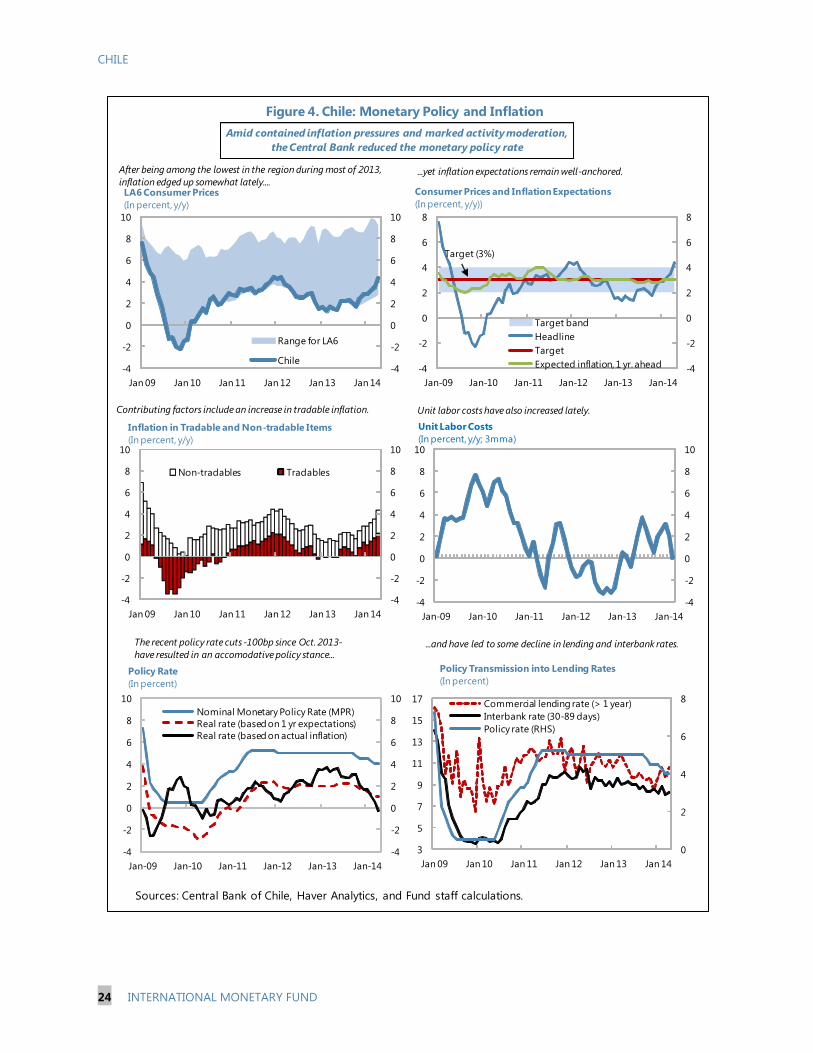
CHILE
24 INTERNATIONAL MONETARY FUND
Figure 4. Chile: Monetary Policy and Inflation
Sources: Central Bank of Chile, Haver Analytics, and Fund staff calculations.
-4
-2
0
2
4
6
8
10
-4
-2
0
2
4
6
8
10
Jan-09 Jan-10 Jan-11 Jan-12 Jan-13 Jan-14
Nominal Monetary Policy Rate (MPR)
Real rate (based on 1 yr expectations)
Real rate (based on actual inflation)
Policy Rate
(In percent)
-4
-2
0
2
4
6
8
10
-4
-2
0
2
4
6
8
10
Jan 09 Jan 10 Jan 11 Jan 12 Jan 13 Jan 14
Range for LA6
Chile
LA6 Consumer Prices
(In percent, y/y)
-4
-2
0
2
4
6
8
-4
-2
0
2
4
6
8
Jan-09 Jan-10 Jan-11 Jan-12 Jan-13 Jan-14
Target band
Headline
Target
Expected inflation, 1 yr. ahead
Target (3%)
Consumer Prices and Inflation Expectations
(In percent, y/y))
-4
-2
0
2
4
6
8
10
-4
-2
0
2
4
6
8
10
Jan 09 Jan 10 Jan 11 Jan 12 Jan 13 Jan 14
Non-tradables Tradables
Inflation in Tradable and Non-tradable Items
(In percent, y/y)
...yet inflation expectations remain well-anchored.After being among the lowest in the region during most of 2013,
inflation edged up somewhat lately....
Contributing factors include an increase in tradable inflation. Unit labor costs have also increased lately.
The recent policy rate cuts-100bp since Oct. 2013-
have resulted in an accomodative policy stance......and have led to some decline in lending and interbank rates.
Amid contained inflation pressures and marked activity moderation,
the Central Bank reduced the monetary policy rate
-4
-2
0
2
4
6
8
10
-4
-2
0
2
4
6
8
10
Jan-09 Jan-10 Jan-11 Jan-12 Jan-13 Jan-14
Unit Labor Costs
(In percent, y/y; 3mma)
0
2
4
6
8
3
5
7
9
11
13
15
17
Jan 09 Jan 10 Jan 11 Jan 12 Jan 13 Jan 14
Commercial lending rate (> 1 year)
Interbank rate (30-89 days)
Policy rate (RHS)
Policy Transmission into Lending Rates
(In percent)
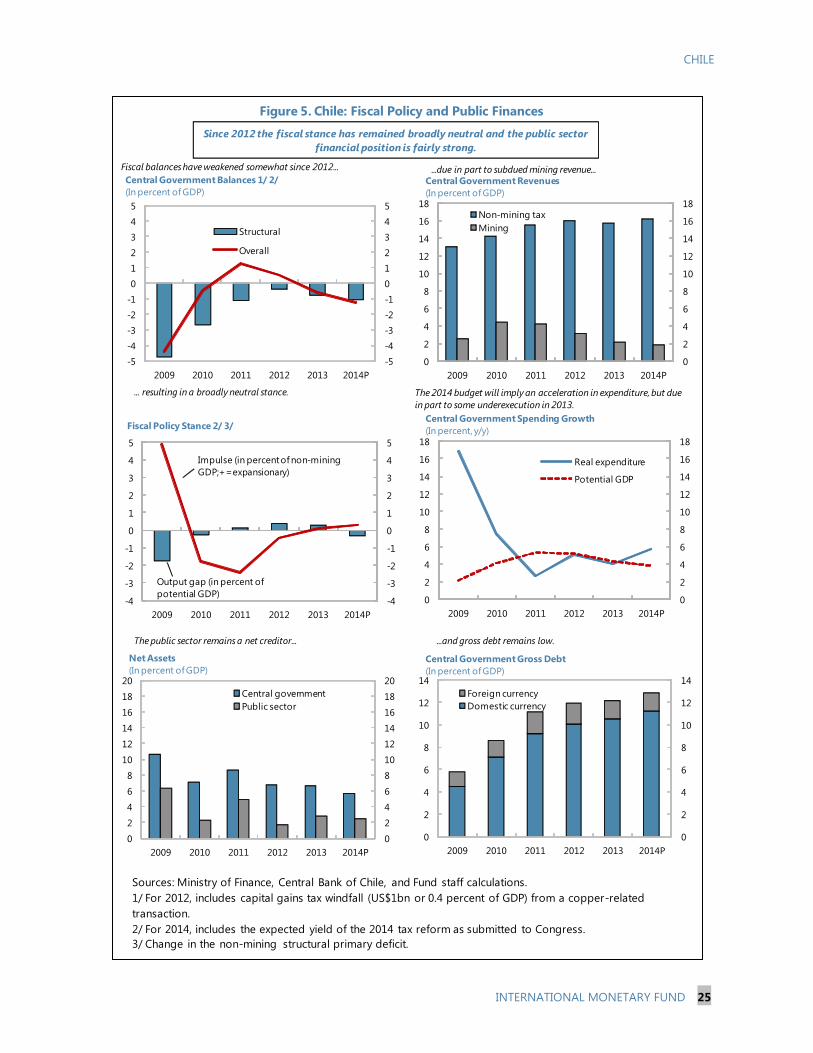
CHILE
INTERNATIONAL MONETARY FUND 25
Figure 5. Chile: Fiscal Policy and Public Finances
Sources: Ministry of Finance, Central Bank of Chile, and Fund staff calculations.
1/ For 2012, includes capital gains tax windfall (US$1bn or 0.4 percent of GDP) from a copper-related
transaction.
2/ For 2014, includes the expected yield of the 2014 tax reform as submitted to Congress.
3/ Change in the non-mining structural primary deficit.
-5
-4
-3
-2
-1
0
1
2
3
4
5
-5
-4
-3
-2
-1
0
1
2
3
4
5
2009 2010 2011 2012 2013 2014P
Structural
Overall
Central Government Balances 1/ 2/
(In percent of GDP)
-4
-3
-2
-1
0
1
2
3
4
5
-4
-3
-2
-1
0
1
2
3
4
5
2009 2010 2011 2012 2013 2014P
Fiscal Policy Stance 2/ 3/
Output gap (in percent of
potential GDP)
Impulse (in percent of non-mining
GDP;+=expansionary)
0
2
4
6
8
10
12
14
16
18
20
0
2
4
6
8
10
12
14
16
18
20
2009 2010 2011 2012 2013 2014P
Central government
Public sector
Net Assets
(In percent of GDP)
0
2
4
6
8
10
12
14
0
2
4
6
8
10
12
14
2009 2010 2011 2012 2013 2014P
Foreign currency
Domestic currency
Central Government Gross Debt
(In percent of GDP)
0
2
4
6
8
10
12
14
16
18
0
2
4
6
8
10
12
14
16
18
2009 2010 2011 2012 2013 2014P
Real expenditure
Potential GDP
Central Government Spending Growth
(In percent, y/y)
0
2
4
6
8
10
12
14
16
18
0
2
4
6
8
10
12
14
16
18
2009 2010 2011 2012 2013 2014P
Non-mining tax
Mining
Central Government Revenues
(In percent of GDP)
Fiscal balanceshave weakened somewhat since 2012... ...due in part to subdued mining revenue...
... resulting in a broadly neutral stance. The 2014 budget will imply an acceleration in expenditure, but due
in part to some underexecution in 2013.
The public sector remains a net creditor... ...and gross debt remains low.
Since 2012 the fiscal stance has remained broadly neutral and the public sector
financial position is fairly strong.
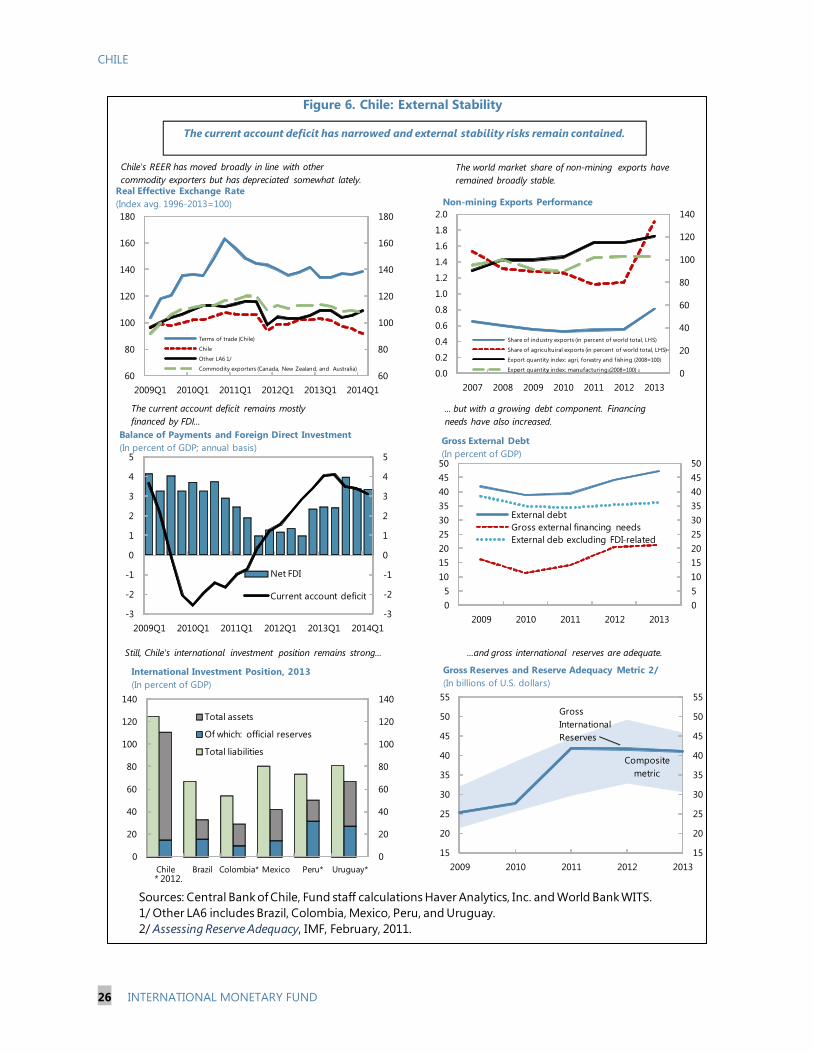
CHILE
26 INTERNATIONAL MONETARY FUND
Figure 6. Chile: External Stability
Sources: Central Bank of Chile, Fund staff calculations Haver Analytics, Inc. and World Bank WITS.
1/ Other LA6 includes Brazil, Colombia, Mexico, Peru, and Uruguay.
2/ Assessing Reserve Adequacy, IMF, February, 2011.
60
80
100
120
140
160
180
60
80
100
120
140
160
180
2009Q1 2010Q1 2011Q1 2012Q1 2013Q1 2014Q1
Terms of trade (Chile)
Chile
Other LA6 1/
Commodity exporters (Canada, New Zealand, and Australia)
Real Effective Exchange Rate
(Index avg. 1996-2013=100)
-3
-2
-1
0
1
2
3
4
5
-3
-2
-1
0
1
2
3
4
5
2009Q1 2010Q1 2011Q1 2012Q1 2013Q1 2014Q1
Net FDI
Current account deficit
Balance of Payments and Foreign Direct Investment
(In percent of GDP; annual basis)
15
20
25
30
35
40
45
50
55
15
20
25
30
35
40
45
50
55
2009 2010 2011 2012 2013
Gross Reserves and Reserve Adequacy Metric 2/
(In billions of U.S. dollars)
Composite
metric
Gross
International
Reserves
Chile's REER has moved broadly in line with other
commodity exporters but has depreciated somewhat lately.
The current account deficit remains mostly
financed by FDI...
The world market share of non-mining exports have
remained broadly stable.
... but with a growing debt component. Financing
needs have also increased.
Still, Chile's international investment position remains strong... ...and gross international reserves are adequate.
0
20
40
60
80
100
120
140
0
20
40
60
80
100
120
140
Chile Brazil Colombia* Mexico Peru* Uruguay*
Total assets
Of which: official reserves
Total liabilities
International Investment Position, 2013
(In percent of GDP)
* 2012.
The current account deficit has narrowed and external stability risks remain contained.
0
5
10
15
20
25
30
35
40
45
50
0
5
10
15
20
25
30
35
40
45
50
2009 2010 2011 2012 2013
External debt
Gross external financing needs
External deb excluding FDI-related
Gross External Debt
(In percent of GDP)
0
20
40
60
80
100
120
140
0.0
0.2
0.4
0.6
0.8
1.0
1.2
1.4
1.6
1.8
2.0
2007 2008 2009 2010 2011 2012 2013
Non-mining Exports Performance
Share of industry exports (in percent of world total, LHS)
Share of agricultuiral exports (in percent of world total, LHS)
Export quantity index: agri, forestry and fishing (2008=100)
Export quantity index: manufacturing (2008=100)
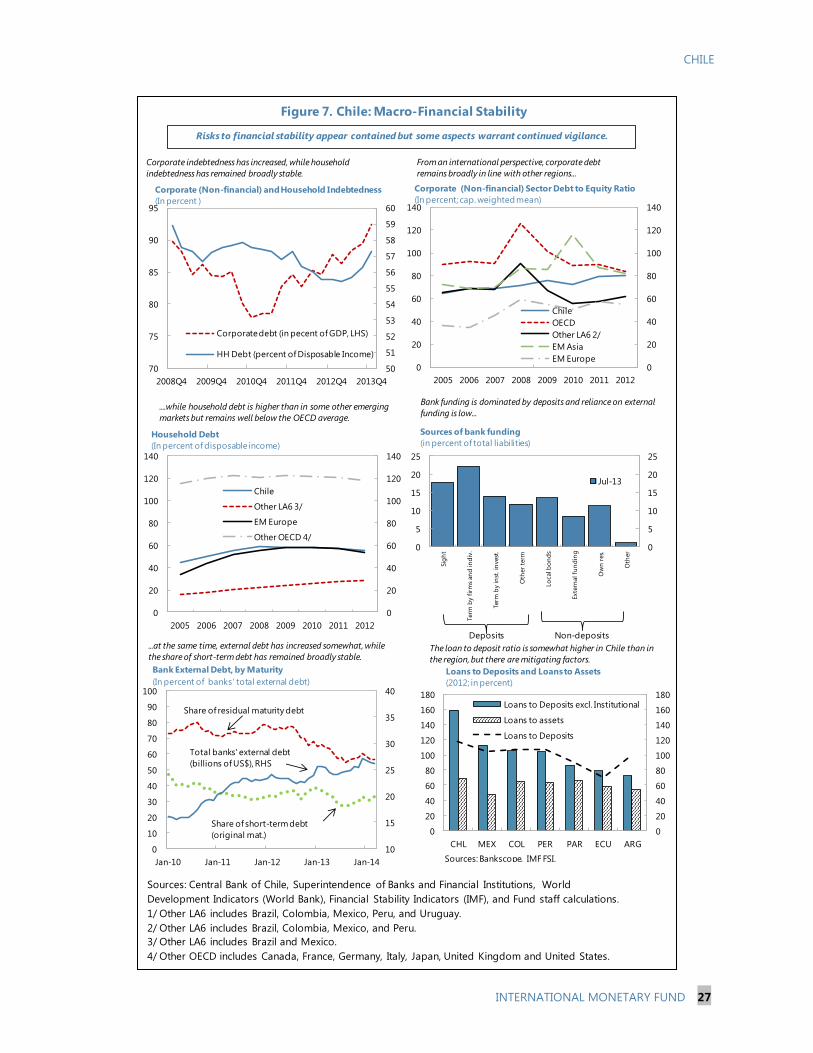
CHILE
INTERNATIONAL MONETARY FUND 27
Risks to financial stability appear contained but some aspects warrant continued vigilance.
Figure 7. Chile: Macro-Financial Stability
Sources: Central Bank of Chile, Superintendence of Banks and Financial Institutions, World
Development Indicators (World Bank), Financial Stability Indicators (IMF), and Fund staff calculations.
1/ Other LA6 includes Brazil, Colombia, Mexico, Peru, and Uruguay.
2/ Other LA6 includes Brazil, Colombia, Mexico, and Peru.
3/ Other LA6 includes Brazil and Mexico.
4/ Other OECD includes Canada, France, Germany, Italy, Japan, United Kingdom and United States.
50
51
52
53
54
55
56
57
58
59
60
70
75
80
85
90
95
2008Q4 2009Q4 2010Q4 2011Q4 2012Q4 2013Q4
Corporate debt (in pecent of GDP, LHS)
HH Debt (percent of Disposable Income)
Corporate (Non-financial) and Household Indebtedness
(In percent )
Bank funding is dominated by deposits and reliance on external
funding is low...
...at the same time, external debt has increased somewhat, while
the share of short-term debt has remained broadly stable.
Corporate indebtedness has increased, while household
indebtedness has remained broadly stable.
....while household debt is higher than in some other emerging
markets but remains well below the OECD average.
0
20
40
60
80
100
120
140
0
20
40
60
80
100
120
140
2005 2006 2007 2008 2009 2010 2011 2012
Chile
Other LA6 3/
EM Europe
Other OECD 4/
Household Debt
(In percent of disposable income)
0
20
40
60
80
100
120
140
0
20
40
60
80
100
120
140
2005 2006 2007 2008 2009 2010 2011 2012
Chile
OECD
Other LA6 2/
EM Asia
EM Europe
Corporate (Non-financial) Sector Debt to Equity Ratio
(In percent; cap. weighted mean)
From an international perspective, corporate debt
remains broadly in line with other regions...
10
15
20
25
30
35
40
0
10
20
30
40
50
60
70
80
90
100
Jan-10 Jan-11 Jan-12 Jan-13 Jan-14
Bank External Debt, by Maturity
(In percent of banks' total external debt)
Total banks' external debt
(billions of US$), RHS
Share of short-term debt
(original mat.)
Share of residual maturity debt
0
5
10
15
20
25
0
5
10
15
20
25
Sig
ht
Term
by f
irm
s an
d in
div
.
Term
by in
st. in
vest
.
Oth
er
term
Lo
cal b
on
ds
Exte
rnal fu
nd
ing
Ow
n r
es.
Oth
er
Jul-13
Sources of bank funding
(in percent of total liabilities)
Deposits Non-deposits
0
20
40
60
80
100
120
140
160
180
0
20
40
60
80
100
120
140
160
180
CHL MEX COL PER PAR ECU ARG
Loans to Deposits excl. Institutional
Loans to assets
Loans to Deposits
Loans to Deposits and Loans to Assets
(2012; in percent)
Sources: Bankscope, IMF FSI.
The loan to deposit ratio is somewhat higher in Chile than in
the region, but there are mitigating factors.
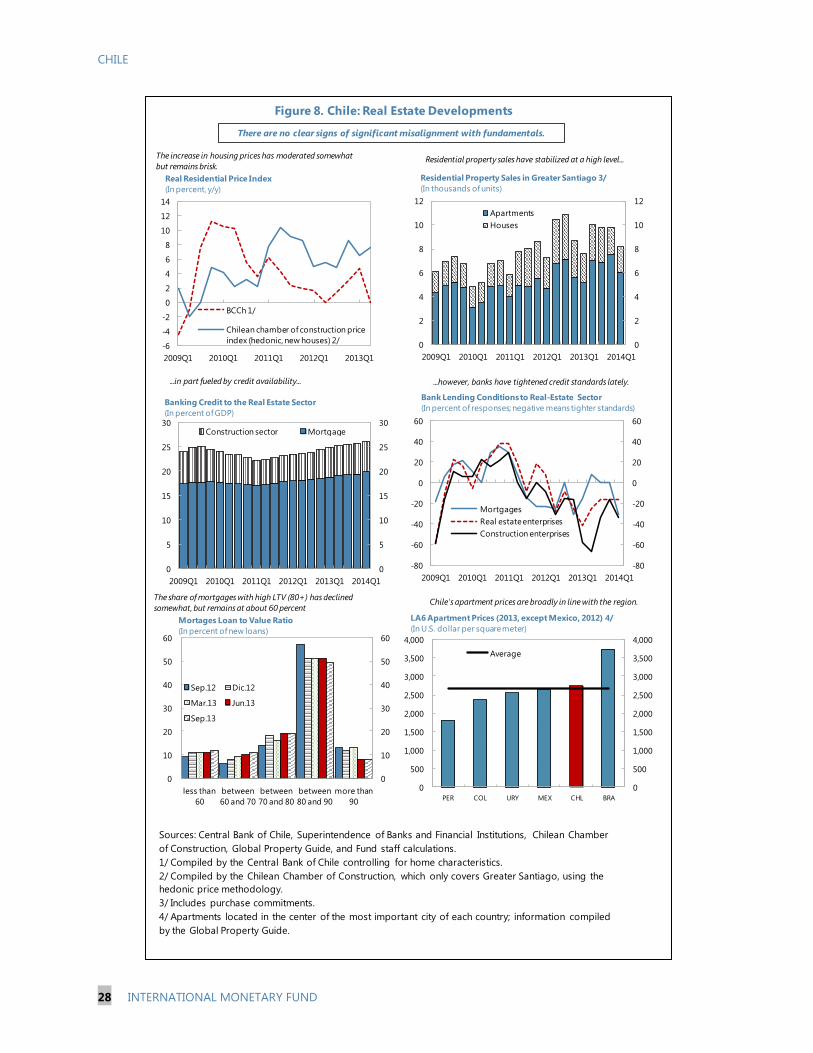
CHILE
28 INTERNATIONAL MONETARY FUND
Figure 8. Chile: Real Estate Developments
Sources: Central Bank of Chile, Superintendence of Banks and Financial Institutions, Chilean Chamber
of Construction, Global Property Guide, and Fund staff calculations.
1/ Compiled by the Central Bank of Chile controlling for home characteristics.
2/ Compiled by the Chilean Chamber of Construction, which only covers Greater Santiago, using the
hedonic price methodology.
3/ Includes purchase commitments.
4/ Apartments located in the center of the most important city of each country; information compiled
by the Global Property Guide.
0
2
4
6
8
10
12
0
2
4
6
8
10
12
2009Q1 2010Q1 2011Q1 2012Q1 2013Q1 2014Q1
Apartments
Houses
Residential Property Sales in Greater Santiago 3/
(In thousands of units)
0
500
1,000
1,500
2,000
2,500
3,000
3,500
4,000
0
500
1,000
1,500
2,000
2,500
3,000
3,500
4,000
PER COL URY MEX CHL BRA
Average
LA6 Apartment Prices (2013, except Mexico, 2012) 4/
(In U.S. dollar per square meter)
0
5
10
15
20
25
30
0
5
10
15
20
25
30
2009Q1 2010Q1 2011Q1 2012Q1 2013Q1 2014Q1
Construction sector Mortgage
Banking Credit to the Real Estate Sector
(In percent of GDP)
The increase in housing prices has moderated somewhat
but remains brisk. Residential property sales have stabilized at a high level...
...in part fueled by credit availability...
The share of mortgages with high LTV (80+) has declined
somewhat, but remains at about 60 percentChile's apartment prices are broadly in line with the region.
There are no clear signs of significant misalignment with fundamentals.
-6
-4
-2
0
2
4
6
8
10
12
14
2009Q1 2010Q1 2011Q1 2012Q1 2013Q1
BCCh 1/
Chilean chamber of construction price
index (hedonic, new houses) 2/
Real Residential Price Index
(In percent, y/y)
-80
-60
-40
-20
0
20
40
60
-80
-60
-40
-20
0
20
40
60
2009Q1 2010Q1 2011Q1 2012Q1 2013Q1 2014Q1
Mortgages
Real estate enterprises
Construction enterprises
Bank Lending Conditions to Real-Estate Sector
(In percent of responses; negative means tighter standards)
...however, banks have tightened credit standards lately.
0
10
20
30
40
50
60
0
10
20
30
40
50
60
less than
60
between
60 and 70
between
70 and 80
between
80 and 90
more than
90
Sep.12 Dic.12
Mar.13 Jun.13
Sep.13
Mortages Loan to Value Ratio
(In percent of new loans)
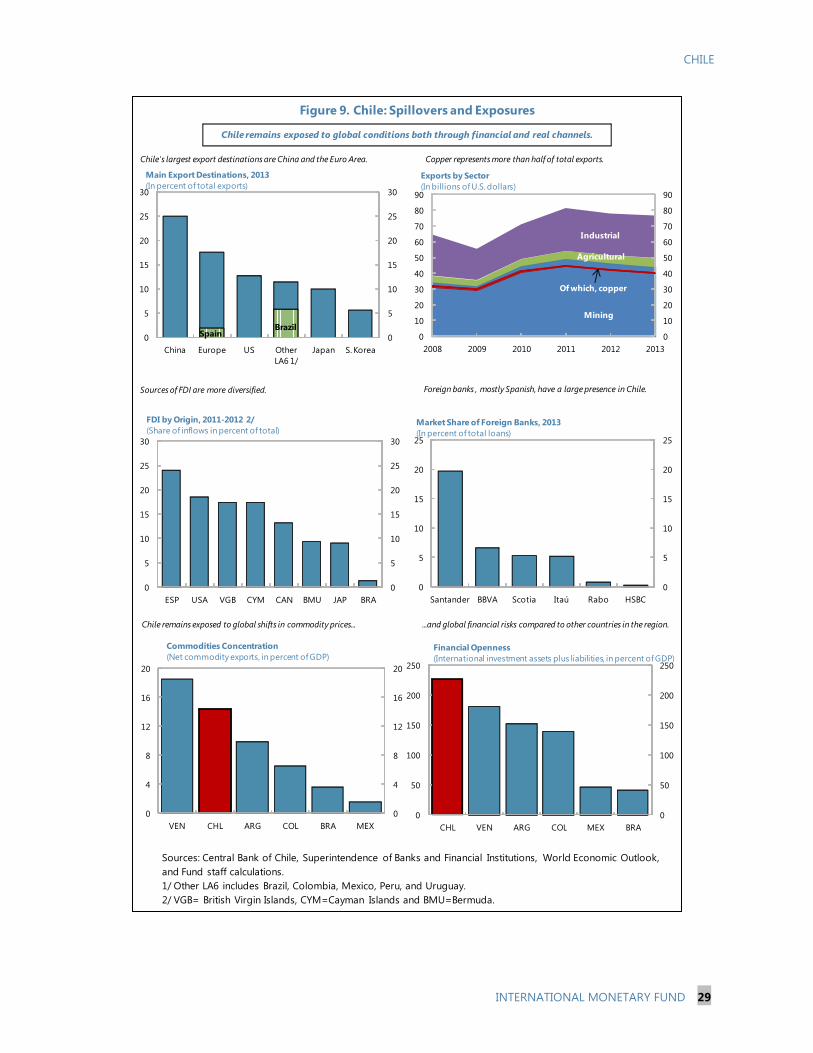
CHILE
INTERNATIONAL MONETARY FUND 29
#
Figure 9. Chile: Spillovers and Exposures
Sources: Central Bank of Chile, Superintendence of Banks and Financial Institutions, World Economic Outlook,
and Fund staff calculations.
1/ Other LA6 includes Brazil, Colombia, Mexico, Peru, and Uruguay.
2/ VGB= British Virgin Islands, CYM=Cayman Islands and BMU=Bermuda.
0
5
10
15
20
25
0
5
10
15
20
25
Santander BBVA Scotia Itaú Rabo HSBC
Market Share of Foreign Banks, 2013
(In percent of total loans)
0
5
10
15
20
25
30
0
5
10
15
20
25
30
China Europe US Other
LA6 1/
Japan S. Korea
Main Export Destinations, 2013
(In percent of total exports)
SpainBrazil
0
10
20
30
40
50
60
70
80
90
0
10
20
30
40
50
60
70
80
90
2008 2009 2010 2011 2012 2013
Exports by Sector
(In billions of U.S. dollars)
Industrial
Agricultural
Mining
Of which, copper
0
5
10
15
20
25
30
0
5
10
15
20
25
30
ESP USA VGB CYM CAN BMU JAP BRA
FDI by Origin, 2011-2012 2/
(Share of inflows in percent of total)
Chile's largest export destinations are China and the Euro Area. Copper represents more than half of total exports.
Sources of FDI are more diversified. Foreign banks , mostly Spanish, have a large presence in Chile.
Chile remains exposed to global shifts in commodity prices... ...and global financial risks compared to other countries in the region.
Chile remains exposed to global conditions both through financial and real channels.
0
50
100
150
200
250
0
50
100
150
200
250
CHL VEN ARG COL MEX BRA
Financial Openness
(International investment assets plus liabilities, in percent of GDP)
0
4
8
12
16
20
0
4
8
12
16
20
VEN CHL ARG COL BRA MEX
Commodities Concentration
(Net commodity exports, in percent of GDP)
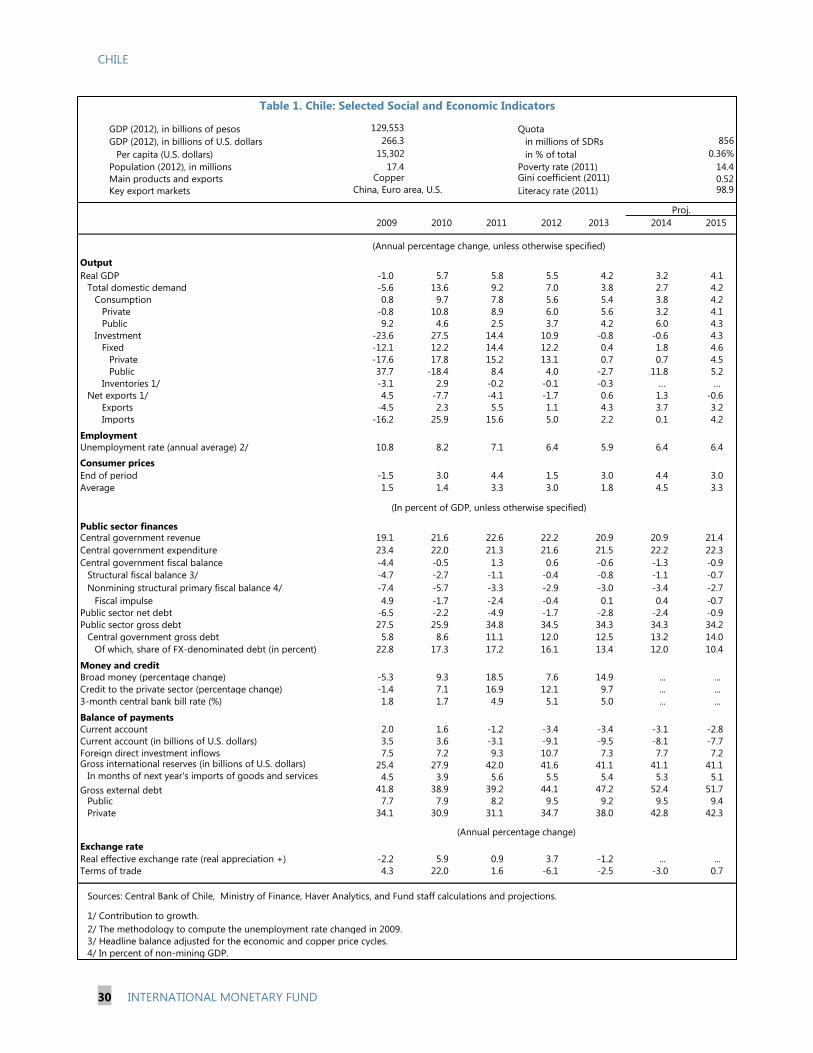
CHILE
30 INTERNATIONAL MONETARY FUND
GDP (2012), in billions of pesos 129,553 Quota
GDP (2012), in billions of U.S. dollars 266.3 in millions of SDRs 856
Per capita (U.S. dollars) 15,302 in % of total 0.36%
Population (2012), in millions 17.4 Poverty rate (2011) 14.4
Main products and exports Copper Gini coefficient (2011) 0.52
Key export markets China, Euro area, U.S. Literacy rate (2011) 98.9
2009 2010 2011 2012 2013 2014 2015
Output
Real GDP -1.0 5.7 5.8 5.5 4.2 3.2 4.1
Total domestic demand -5.6 13.6 9.2 7.0 3.8 2.7 4.2
Consumption 0.8 9.7 7.8 5.6 5.4 3.8 4.2
Private -0.8 10.8 8.9 6.0 5.6 3.2 4.1
Public 9.2 4.6 2.5 3.7 4.2 6.0 4.3
Investment -23.6 27.5 14.4 10.9 -0.8 -0.6 4.3
Fixed -12.1 12.2 14.4 12.2 0.4 1.8 4.6
Private -17.6 17.8 15.2 13.1 0.7 0.7 4.5
Public 37.7 -18.4 8.4 4.0 -2.7 11.8 5.2
Inventories 1/ -3.1 2.9 -0.2 -0.1 -0.3 … …
Net exports 1/ 4.5 -7.7 -4.1 -1.7 0.6 1.3 -0.6
Exports -4.5 2.3 5.5 1.1 4.3 3.7 3.2
Imports -16.2 25.9 15.6 5.0 2.2 0.1 4.2
Employment
Unemployment rate (annual average) 2/ 10.8 8.2 7.1 6.4 5.9 6.4 6.4
Consumer prices
End of period -1.5 3.0 4.4 1.5 3.0 4.4 3.0
Average 1.5 1.4 3.3 3.0 1.8 4.5 3.3
Public sector finances
Central government revenue 19.1 21.6 22.6 22.2 20.9 20.9 21.4
Central government expenditure 23.4 22.0 21.3 21.6 21.5 22.2 22.3
Central government fiscal balance -4.4 -0.5 1.3 0.6 -0.6 -1.3 -0.9
Structural fiscal balance 3/ -4.7 -2.7 -1.1 -0.4 -0.8 -1.1 -0.7
Nonmining structural primary fiscal balance 4/ -7.4 -5.7 -3.3 -2.9 -3.0 -3.4 -2.7
Fiscal impulse 4.9 -1.7 -2.4 -0.4 0.1 0.4 -0.7
Public sector net debt -6.5 -2.2 -4.9 -1.7 -2.8 -2.4 -0.9
Public sector gross debt 27.5 25.9 34.8 34.5 34.3 34.3 34.2
Central government gross debt 5.8 8.6 11.1 12.0 12.5 13.2 14.0
Of which, share of FX-denominated debt (in percent) 22.8 17.3 17.2 16.1 13.4 12.0 10.4
Money and credit
Broad money (percentage change) -5.3 9.3 18.5 7.6 14.9 ... ...
Credit to the private sector (percentage change) -1.4 7.1 16.9 12.1 9.7 ... ...
3-month central bank bill rate (%) 1.8 1.7 4.9 5.1 5.0 ... ...
Balance of payments
Current account 2.0 1.6 -1.2 -3.4 -3.4 -3.1 -2.8
Current account (in billions of U.S. dollars) 3.5 3.6 -3.1 -9.1 -9.5 -8.1 -7.7
Foreign direct investment inflows 7.5 7.2 9.3 10.7 7.3 7.7 7.2 Gross international reserves (in billions of U.S. dollars) 25.4 27.9 42.0 41.6 41.1 41.1 41.1
In months of next year's imports of goods and services 4.5 3.9 5.6 5.5 5.4 5.3 5.1
Gross external debt 41.8 38.9 39.2 44.1 47.2 52.4 51.7
Public 7.7 7.9 8.2 9.5 9.2 9.5 9.4
Private 34.1 30.9 31.1 34.7 38.0 42.8 42.3
Exchange rate
Real effective exchange rate (real appreciation +) -2.2 5.9 0.9 3.7 -1.2 ... ...
Terms of trade 4.3 22.0 1.6 -6.1 -2.5 -3.0 0.7
Sources: Central Bank of Chile, Ministry of Finance, Haver Analytics, and Fund staff calculations and projections.
1/ Contribution to growth.
2/ The methodology to compute the unemployment rate changed in 2009.
3/ Headline balance adjusted for the economic and copper price cycles.
4/ In percent of non-mining GDP.
(Annual percentage change)
Proj.
(Annual percentage change, unless otherwise specified)
(In percent of GDP, unless otherwise specified)
Table 1. Chile: Selected Social and Economic Indicators
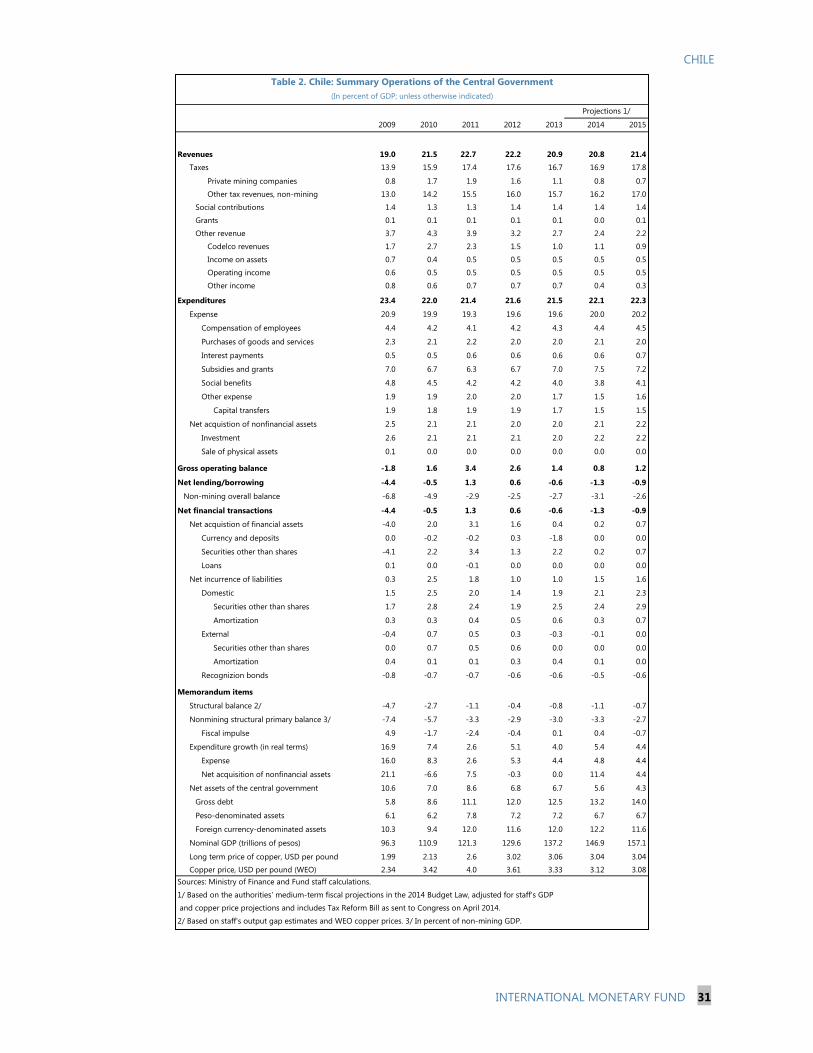
CHILE
INTERNATIONAL MONETARY FUND 31
2009 2010 2011 2012 2013 2014 2015
Revenues 19.0 21.5 22.7 22.2 20.9 20.8 21.4
Taxes 13.9 15.9 17.4 17.6 16.7 16.9 17.8
Private mining companies 0.8 1.7 1.9 1.6 1.1 0.8 0.7
Other tax revenues, non-mining 13.0 14.2 15.5 16.0 15.7 16.2 17.0
Social contributions 1.4 1.3 1.3 1.4 1.4 1.4 1.4
Grants 0.1 0.1 0.1 0.1 0.1 0.0 0.1
Other revenue 3.7 4.3 3.9 3.2 2.7 2.4 2.2
Codelco revenues 1.7 2.7 2.3 1.5 1.0 1.1 0.9
Income on assets 0.7 0.4 0.5 0.5 0.5 0.5 0.5
Operating income 0.6 0.5 0.5 0.5 0.5 0.5 0.5
Other income 0.8 0.6 0.7 0.7 0.7 0.4 0.3
Expenditures 23.4 22.0 21.4 21.6 21.5 22.1 22.3
Expense 20.9 19.9 19.3 19.6 19.6 20.0 20.2
Compensation of employees 4.4 4.2 4.1 4.2 4.3 4.4 4.5
Purchases of goods and services 2.3 2.1 2.2 2.0 2.0 2.1 2.0
Interest payments 0.5 0.5 0.6 0.6 0.6 0.6 0.7
Subsidies and grants 7.0 6.7 6.3 6.7 7.0 7.5 7.2
Social benefits 4.8 4.5 4.2 4.2 4.0 3.8 4.1
Other expense 1.9 1.9 2.0 2.0 1.7 1.5 1.6
Capital transfers 1.9 1.8 1.9 1.9 1.7 1.5 1.5
Net acquistion of nonfinancial assets 2.5 2.1 2.1 2.0 2.0 2.1 2.2
Investment 2.6 2.1 2.1 2.1 2.0 2.2 2.2
Sale of physical assets 0.1 0.0 0.0 0.0 0.0 0.0 0.0
Gross operating balance -1.8 1.6 3.4 2.6 1.4 0.8 1.2
Net lending/borrowing -4.4 -0.5 1.3 0.6 -0.6 -1.3 -0.9
Non-mining overall balance -6.8 -4.9 -2.9 -2.5 -2.7 -3.1 -2.6
Net financial transactions -4.4 -0.5 1.3 0.6 -0.6 -1.3 -0.9
Net acquistion of financial assets -4.0 2.0 3.1 1.6 0.4 0.2 0.7
Currency and deposits 0.0 -0.2 -0.2 0.3 -1.8 0.0 0.0
Securities other than shares -4.1 2.2 3.4 1.3 2.2 0.2 0.7
Loans 0.1 0.0 -0.1 0.0 0.0 0.0 0.0
Net incurrence of liabilities 0.3 2.5 1.8 1.0 1.0 1.5 1.6
Domestic 1.5 2.5 2.0 1.4 1.9 2.1 2.3
Securities other than shares 1.7 2.8 2.4 1.9 2.5 2.4 2.9
Amortization 0.3 0.3 0.4 0.5 0.6 0.3 0.7
External -0.4 0.7 0.5 0.3 -0.3 -0.1 0.0
Securities other than shares 0.0 0.7 0.5 0.6 0.0 0.0 0.0
Amortization 0.4 0.1 0.1 0.3 0.4 0.1 0.0
Recognizion bonds -0.8 -0.7 -0.7 -0.6 -0.6 -0.5 -0.6
Memorandum items
Structural balance 2/ -4.7 -2.7 -1.1 -0.4 -0.8 -1.1 -0.7
Nonmining structural primary balance 3/ -7.4 -5.7 -3.3 -2.9 -3.0 -3.3 -2.7
Fiscal impulse 4.9 -1.7 -2.4 -0.4 0.1 0.4 -0.7
Expenditure growth (in real terms) 16.9 7.4 2.6 5.1 4.0 5.4 4.4
Expense 16.0 8.3 2.6 5.3 4.4 4.8 4.4
Net acquisition of nonfinancial assets 21.1 -6.6 7.5 -0.3 0.0 11.4 4.4
Net assets of the central government 10.6 7.0 8.6 6.8 6.7 5.6 4.3
Gross debt 5.8 8.6 11.1 12.0 12.5 13.2 14.0
Peso-denominated assets 6.1 6.2 7.8 7.2 7.2 6.7 6.7
Foreign currency-denominated assets 10.3 9.4 12.0 11.6 12.0 12.2 11.6
Nominal GDP (trillions of pesos) 96.3 110.9 121.3 129.6 137.2 146.9 157.1
Long term price of copper, USD per pound 1.99 2.13 2.6 3.02 3.06 3.04 3.04
Copper price, USD per pound (WEO) 2.34 3.42 4.0 3.61 3.33 3.12 3.08
Sources: Ministry of Finance and Fund staff calculations.
1/ Based on the authorities' medium-term fiscal projections in the 2014 Budget Law, adjusted for staff's GDP
and copper price projections and includes Tax Reform Bill as sent to Congress on April 2014.
2/ Based on staff's output gap estimates and WEO copper prices. 3/ In percent of non-mining GDP.
Projections 1/
Table 2. Chile: Summary Operations of the Central Government
(In percent of GDP; unless otherwise indicated)
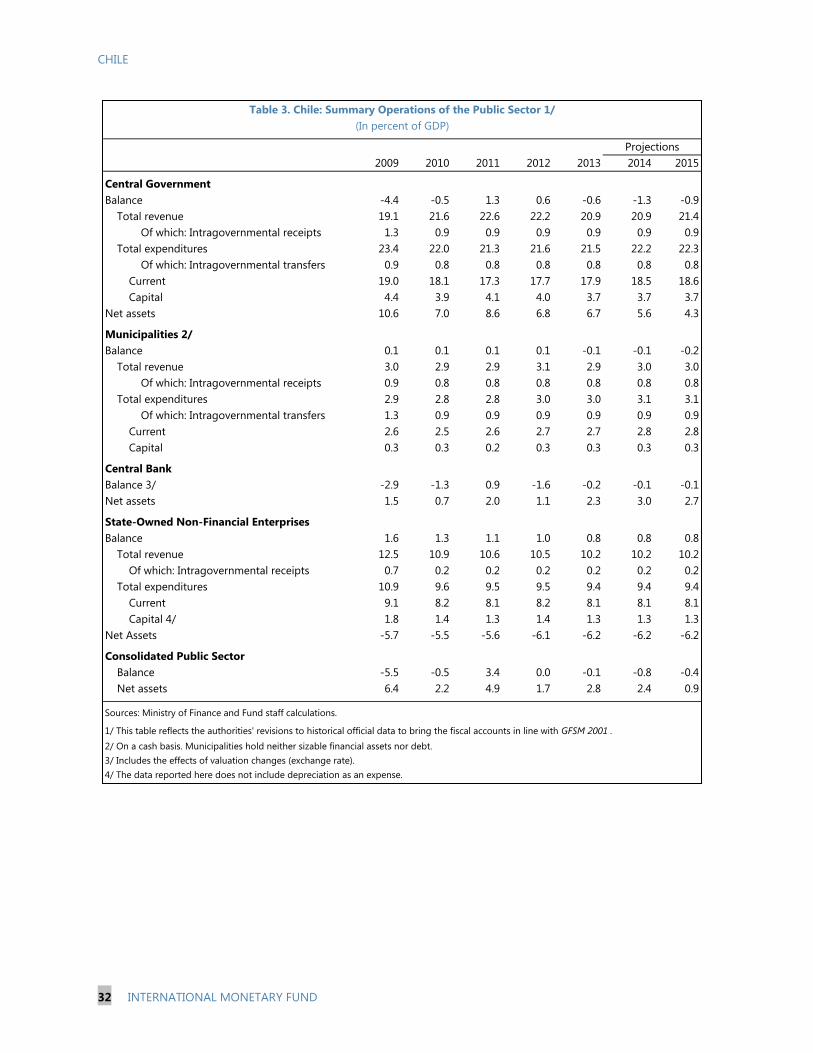
CHILE
32 INTERNATIONAL MONETARY FUND
Descriptor 2009 2010 2011 2012 2013 2014 2015
Central Government
Balance -4.4 -0.5 1.3 0.6 -0.6 -1.3 -0.9
Total revenue 19.1 21.6 22.6 22.2 20.9 20.9 21.4
Of which: Intragovernmental receipts 1.3 0.9 0.9 0.9 0.9 0.9 0.9
Total expenditures 23.4 22.0 21.3 21.6 21.5 22.2 22.3
Of which: Intragovernmental transfers 0.9 0.8 0.8 0.8 0.8 0.8 0.8
Current 19.0 18.1 17.3 17.7 17.9 18.5 18.6
Capital 4.4 3.9 4.1 4.0 3.7 3.7 3.7
Net assets 10.6 7.0 8.6 6.8 6.7 5.6 4.3
Municipalities 2/
Balance 0.1 0.1 0.1 0.1 -0.1 -0.1 -0.2
Total revenue 3.0 2.9 2.9 3.1 2.9 3.0 3.0
Of which: Intragovernmental receipts 0.9 0.8 0.8 0.8 0.8 0.8 0.8
Total expenditures 2.9 2.8 2.8 3.0 3.0 3.1 3.1
Of which: Intragovernmental transfers 1.3 0.9 0.9 0.9 0.9 0.9 0.9
Current 2.6 2.5 2.6 2.7 2.7 2.8 2.8
Capital 0.3 0.3 0.2 0.3 0.3 0.3 0.3
Central Bank
Balance 3/ -2.9 -1.3 0.9 -1.6 -0.2 -0.1 -0.1
Net assets 1.5 0.7 2.0 1.1 2.3 3.0 2.7
State-Owned Non-Financial Enterprises
Balance 1.6 1.3 1.1 1.0 0.8 0.8 0.8
Total revenue 12.5 10.9 10.6 10.5 10.2 10.2 10.2
Of which: Intragovernmental receipts 0.7 0.2 0.2 0.2 0.2 0.2 0.2
Total expenditures 10.9 9.6 9.5 9.5 9.4 9.4 9.4
Current 9.1 8.2 8.1 8.2 8.1 8.1 8.1
Capital 4/ 1.8 1.4 1.3 1.4 1.3 1.3 1.3
Net Assets -5.7 -5.5 -5.6 -6.1 -6.2 -6.2 -6.2
Consolidated Public Sector
Balance -5.5 -0.5 3.4 0.0 -0.1 -0.8 -0.4
Net assets 6.4 2.2 4.9 1.7 2.8 2.4 0.9
Sources: Ministry of Finance and Fund staff calculations.
1/ This table reflects the authorities' revisions to historical official data to bring the fiscal accounts in line with GFSM 2001 .
2/ On a cash basis. Municipalities hold neither sizable financial assets nor debt.
3/ Includes the effects of valuation changes (exchange rate).
4/ The data reported here does not include depreciation as an expense.
Table 3. Chile: Summary Operations of the Public Sector 1/
(In percent of GDP)
Projections
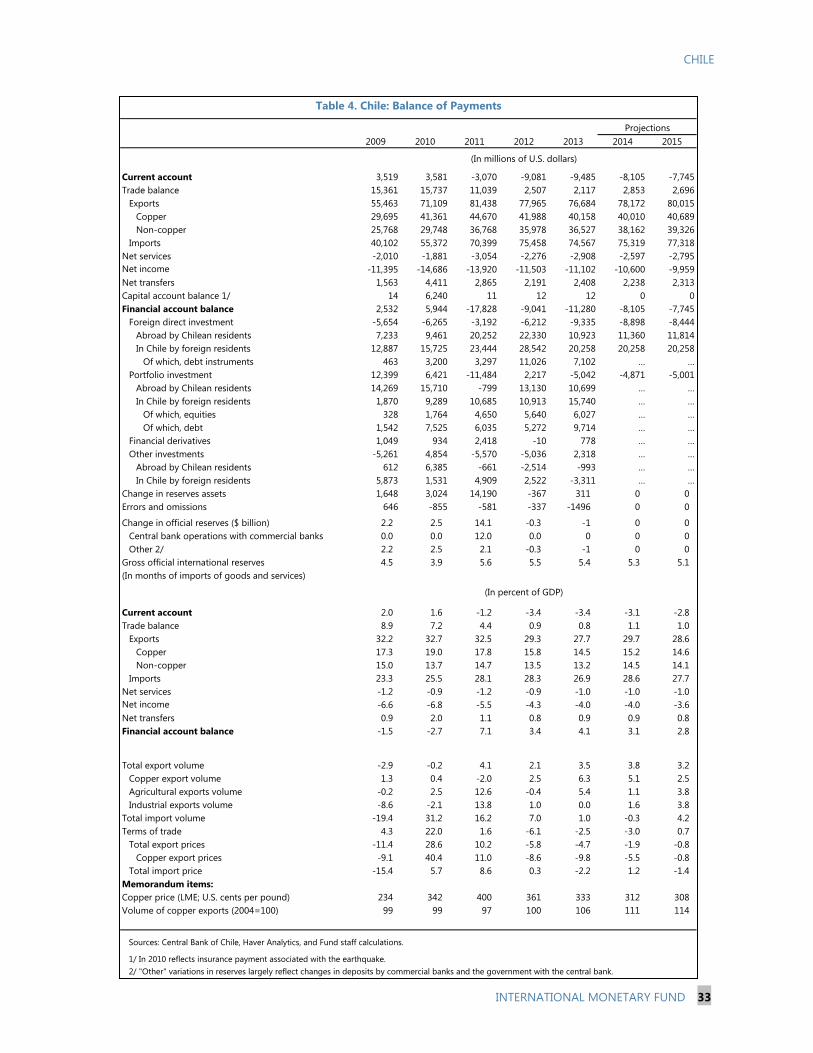
CHILE
INTERNATIONAL MONETARY FUND 33
2009 2010 2011 2012 2013 2014 2015
Current account 3,519 3,581 -3,070 -9,081 -9,485 -8,105 -7,745
Trade balance 15,361 15,737 11,039 2,507 2,117 2,853 2,696
Exports 55,463 71,109 81,438 77,965 76,684 78,172 80,015
Copper 29,695 41,361 44,670 41,988 40,158 40,010 40,689
Non-copper 25,768 29,748 36,768 35,978 36,527 38,162 39,326
Imports 40,102 55,372 70,399 75,458 74,567 75,319 77,318
Net services -2,010 -1,881 -3,054 -2,276 -2,908 -2,597 -2,795
Net income -11,395 -14,686 -13,920 -11,503 -11,102 -10,600 -9,959
Net transfers 1,563 4,411 2,865 2,191 2,408 2,238 2,313
Capital account balance 1/ 14 6,240 11 12 12 0 0
Financial account balance 2,532 5,944 -17,828 -9,041 -11,280 -8,105 -7,745
Foreign direct investment -5,654 -6,265 -3,192 -6,212 -9,335 -8,898 -8,444
Abroad by Chilean residents 7,233 9,461 20,252 22,330 10,923 11,360 11,814
In Chile by foreign residents 12,887 15,725 23,444 28,542 20,258 20,258 20,258
Of which, debt instruments 463 3,200 3,297 11,026 7,102 … …
Portfolio investment 12,399 6,421 -11,484 2,217 -5,042 -4,871 -5,001
Abroad by Chilean residents 14,269 15,710 -799 13,130 10,699 … …
In Chile by foreign residents 1,870 9,289 10,685 10,913 15,740 … …
Of which, equities 328 1,764 4,650 5,640 6,027 … …
Of which, debt 1,542 7,525 6,035 5,272 9,714 … …
Financial derivatives 1,049 934 2,418 -10 778 … …
Other investments -5,261 4,854 -5,570 -5,036 2,318 … …
Abroad by Chilean residents 612 6,385 -661 -2,514 -993 … …
In Chile by foreign residents 5,873 1,531 4,909 2,522 -3,311 … …
Change in reserves assets 1,648 3,024 14,190 -367 311 0 0
Errors and omissions 646 -855 -581 -337 -1496 0 0
Change in official reserves ($ billion) 2.2 2.5 14.1 -0.3 -1 0 0
Central bank operations with commercial banks 0.0 0.0 12.0 0.0 0 0 0
Other 2/ 2.2 2.5 2.1 -0.3 -1 0 0
Gross official international reserves 4.5 3.9 5.6 5.5 5.4 5.3 5.1
(In months of imports of goods and services)
Current account 2.0 1.6 -1.2 -3.4 -3.4 -3.1 -2.8
Trade balance 8.9 7.2 4.4 0.9 0.8 1.1 1.0
Exports 32.2 32.7 32.5 29.3 27.7 29.7 28.6
Copper 17.3 19.0 17.8 15.8 14.5 15.2 14.6
Non-copper 15.0 13.7 14.7 13.5 13.2 14.5 14.1
Imports 23.3 25.5 28.1 28.3 26.9 28.6 27.7
Net services -1.2 -0.9 -1.2 -0.9 -1.0 -1.0 -1.0
Net income -6.6 -6.8 -5.5 -4.3 -4.0 -4.0 -3.6
Net transfers 0.9 2.0 1.1 0.8 0.9 0.9 0.8
Financial account balance -1.5 -2.7 7.1 3.4 4.1 3.1 2.8
Total export volume -2.9 -0.2 4.1 2.1 3.5 3.8 3.2
Copper export volume 1.3 0.4 -2.0 2.5 6.3 5.1 2.5
Agricultural exports volume -0.2 2.5 12.6 -0.4 5.4 1.1 3.8
Industrial exports volume -8.6 -2.1 13.8 1.0 0.0 1.6 3.8
Total import volume -19.4 31.2 16.2 7.0 1.0 -0.3 4.2
Terms of trade 4.3 22.0 1.6 -6.1 -2.5 -3.0 0.7
Total export prices -11.4 28.6 10.2 -5.8 -4.7 -1.9 -0.8
Copper export prices -9.1 40.4 11.0 -8.6 -9.8 -5.5 -0.8
Total import price -15.4 5.7 8.6 0.3 -2.2 1.2 -1.4
Memorandum items:
Copper price (LME; U.S. cents per pound) 234 342 400 361 333 312 308
Volume of copper exports (2004=100) 99 99 97 100 106 111 114
Sources: Central Bank of Chile, Haver Analytics, and Fund staff calculations.
1/ In 2010 reflects insurance payment associated with the earthquake.
2/ "Other" variations in reserves largely reflect changes in deposits by commercial banks and the government with the central bank.
Projections
Table 4. Chile: Balance of Payments
(In millions of U.S. dollars)
(In percent of GDP)
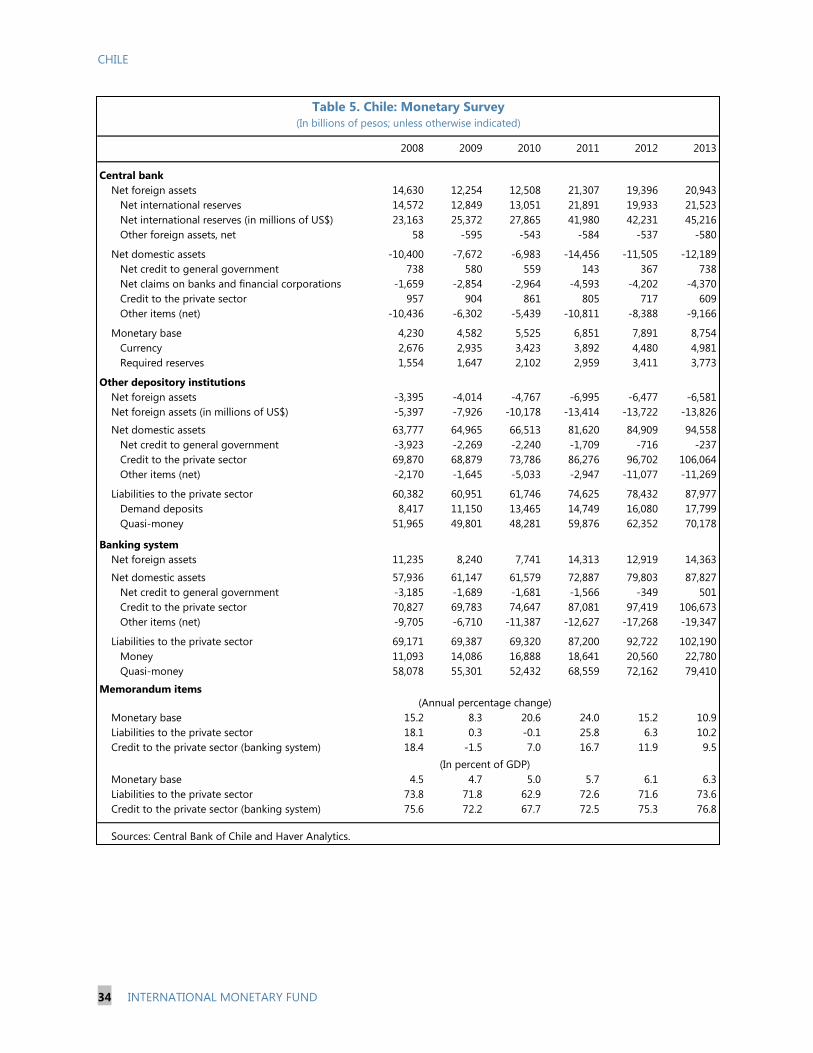
CHILE
34 INTERNATIONAL MONETARY FUND
2008 2009 2010 2011 2012 2013
Central bank
Net foreign assets 14,630 12,254 12,508 21,307 19,396 20,943
Net international reserves 14,572 12,849 13,051 21,891 19,933 21,523
Net international reserves (in millions of US$) 23,163 25,372 27,865 41,980 42,231 45,216
Other foreign assets, net 58 -595 -543 -584 -537 -580
Net domestic assets -10,400 -7,672 -6,983 -14,456 -11,505 -12,189
Net credit to general government 738 580 559 143 367 738
Net claims on banks and financial corporations -1,659 -2,854 -2,964 -4,593 -4,202 -4,370
Credit to the private sector 957 904 861 805 717 609
Other items (net) -10,436 -6,302 -5,439 -10,811 -8,388 -9,166
Monetary base 4,230 4,582 5,525 6,851 7,891 8,754
Currency 2,676 2,935 3,423 3,892 4,480 4,981
Required reserves 1,554 1,647 2,102 2,959 3,411 3,773
Other depository institutions
Net foreign assets -3,395 -4,014 -4,767 -6,995 -6,477 -6,581
Net foreign assets (in millions of US$) -5,397 -7,926 -10,178 -13,414 -13,722 -13,826… …
Net domestic assets 63,777 64,965 66,513 81,620 84,909 94,558
Net credit to general government -3,923 -2,269 -2,240 -1,709 -716 -237
Credit to the private sector 69,870 68,879 73,786 86,276 96,702 106,064
Other items (net) -2,170 -1,645 -5,033 -2,947 -11,077 -11,269
Liabilities to the private sector 60,382 60,951 61,746 74,625 78,432 87,977
Demand deposits 8,417 11,150 13,465 14,749 16,080 17,799
Quasi-money 51,965 49,801 48,281 59,876 62,352 70,178
Banking system
Net foreign assets 11,235 8,240 7,741 14,313 12,919 14,363… …
Net domestic assets 57,936 61,147 61,579 72,887 79,803 87,827
Net credit to general government -3,185 -1,689 -1,681 -1,566 -349 501
Credit to the private sector 70,827 69,783 74,647 87,081 97,419 106,673
Other items (net) -9,705 -6,710 -11,387 -12,627 -17,268 -19,347
Liabilities to the private sector 69,171 69,387 69,320 87,200 92,722 102,190
Money 11,093 14,086 16,888 18,641 20,560 22,780
Quasi-money 58,078 55,301 52,432 68,559 72,162 79,410
Memorandum items
Monetary base 15.2 8.3 20.6 24.0 15.2 10.9
Liabilities to the private sector 18.1 0.3 -0.1 25.8 6.3 10.2
Credit to the private sector (banking system) 18.4 -1.5 7.0 16.7 11.9 9.5
Monetary base 4.5 4.7 5.0 5.7 6.1 6.3
Liabilities to the private sector 73.8 71.8 62.9 72.6 71.6 73.6
Credit to the private sector (banking system) 75.6 72.2 67.7 72.5 75.3 76.8
Sources: Central Bank of Chile and Haver Analytics.
(Annual percentage change)
(In percent of GDP)
Table 5. Chile: Monetary Survey
(In billions of pesos; unless otherwise indicated)
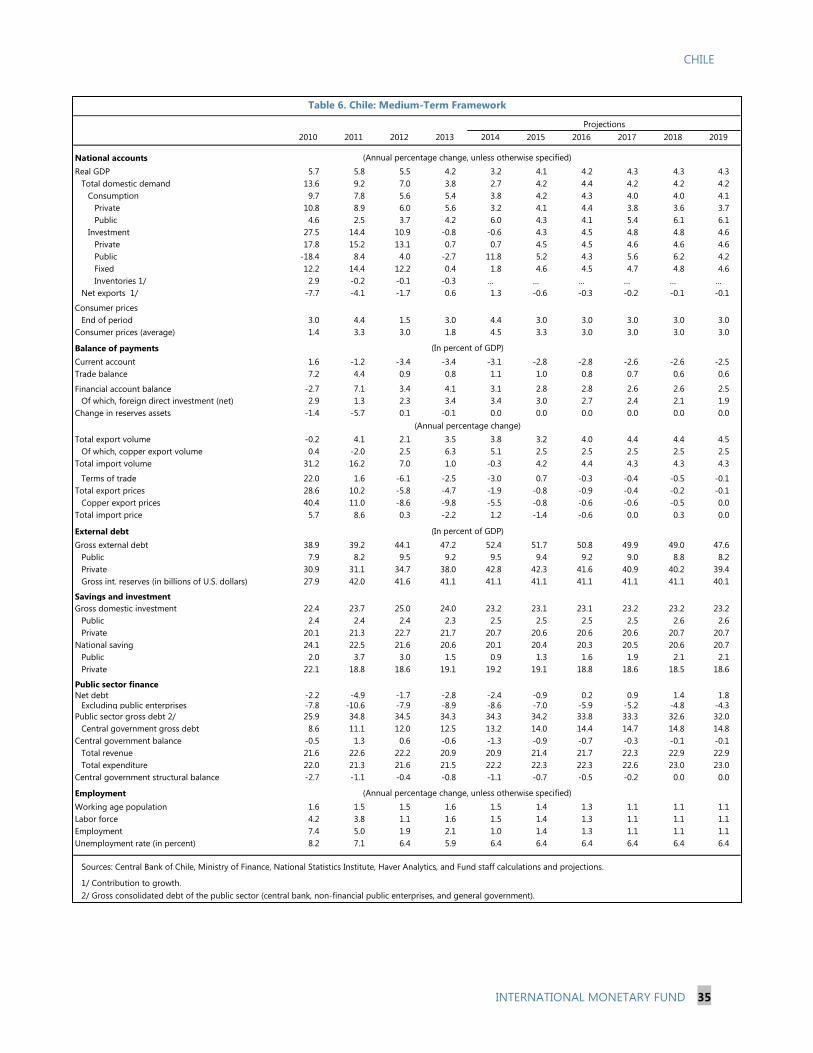
CHILE
INTERNATIONAL MONETARY FUND 35
2010 2011 2012 2013 2014 2015 2016 2017 2018 2019
National accounts
Real GDP 5.7 5.8 5.5 4.2 3.2 4.1 4.2 4.3 4.3 4.3
Total domestic demand 13.6 9.2 7.0 3.8 2.7 4.2 4.4 4.2 4.2 4.2
Consumption 9.7 7.8 5.6 5.4 3.8 4.2 4.3 4.0 4.0 4.1
Private 10.8 8.9 6.0 5.6 3.2 4.1 4.4 3.8 3.6 3.7
Public 4.6 2.5 3.7 4.2 6.0 4.3 4.1 5.4 6.1 6.1
Investment 27.5 14.4 10.9 -0.8 -0.6 4.3 4.5 4.8 4.8 4.6
Private 17.8 15.2 13.1 0.7 0.7 4.5 4.5 4.6 4.6 4.6
Public -18.4 8.4 4.0 -2.7 11.8 5.2 4.3 5.6 6.2 4.2
Fixed 12.2 14.4 12.2 0.4 1.8 4.6 4.5 4.7 4.8 4.6
Inventories 1/ 2.9 -0.2 -0.1 -0.3 … … … … … …
Net exports 1/ -7.7 -4.1 -1.7 0.6 1.3 -0.6 -0.3 -0.2 -0.1 -0.1
Consumer prices
End of period 3.0 4.4 1.5 3.0 4.4 3.0 3.0 3.0 3.0 3.0
Consumer prices (average) 1.4 3.3 3.0 1.8 4.5 3.3 3.0 3.0 3.0 3.0
Balance of payments
Current account 1.6 -1.2 -3.4 -3.4 -3.1 -2.8 -2.8 -2.6 -2.6 -2.5
Trade balance 7.2 4.4 0.9 0.8 1.1 1.0 0.8 0.7 0.6 0.6
Financial account balance -2.7 7.1 3.4 4.1 3.1 2.8 2.8 2.6 2.6 2.5
Of which, foreign direct investment (net) 2.9 1.3 2.3 3.4 3.4 3.0 2.7 2.4 2.1 1.9
Change in reserves assets -1.4 -5.7 0.1 -0.1 0.0 0.0 0.0 0.0 0.0 0.0
Total export volume -0.2 4.1 2.1 3.5 3.8 3.2 4.0 4.4 4.4 4.5
Of which, copper export volume 0.4 -2.0 2.5 6.3 5.1 2.5 2.5 2.5 2.5 2.5
Total import volume 31.2 16.2 7.0 1.0 -0.3 4.2 4.4 4.3 4.3 4.3
Terms of trade 22.0 1.6 -6.1 -2.5 -3.0 0.7 -0.3 -0.4 -0.5 -0.1
Total export prices 28.6 10.2 -5.8 -4.7 -1.9 -0.8 -0.9 -0.4 -0.2 -0.1
Copper export prices 40.4 11.0 -8.6 -9.8 -5.5 -0.8 -0.6 -0.6 -0.5 0.0
Total import price 5.7 8.6 0.3 -2.2 1.2 -1.4 -0.6 0.0 0.3 0.0
External debt
Gross external debt 38.9 39.2 44.1 47.2 52.4 51.7 50.8 49.9 49.0 47.6
Public 7.9 8.2 9.5 9.2 9.5 9.4 9.2 9.0 8.8 8.2
Private 30.9 31.1 34.7 38.0 42.8 42.3 41.6 40.9 40.2 39.4
Gross int. reserves (in billions of U.S. dollars) 27.9 42.0 41.6 41.1 41.1 41.1 41.1 41.1 41.1 40.1
Savings and investment
Gross domestic investment 22.4 23.7 25.0 24.0 23.2 23.1 23.1 23.2 23.2 23.2
Public 2.4 2.4 2.4 2.3 2.5 2.5 2.5 2.5 2.6 2.6
Private 20.1 21.3 22.7 21.7 20.7 20.6 20.6 20.6 20.7 20.7
National saving 24.1 22.5 21.6 20.6 20.1 20.4 20.3 20.5 20.6 20.7
Public 2.0 3.7 3.0 1.5 0.9 1.3 1.6 1.9 2.1 2.1
Private 22.1 18.8 18.6 19.1 19.2 19.1 18.8 18.6 18.5 18.6
Public sector finance
Net debt -2.2 -4.9 -1.7 -2.8 -2.4 -0.9 0.2 0.9 1.4 1.8
Excluding public enterprises -7.8 -10.6 -7.9 -8.9 -8.6 -7.0 -5.9 -5.2 -4.8 -4.3
Public sector gross debt 2/ 25.9 34.8 34.5 34.3 34.3 34.2 33.8 33.3 32.6 32.0
Central government gross debt 8.6 11.1 12.0 12.5 13.2 14.0 14.4 14.7 14.8 14.8
Central government balance -0.5 1.3 0.6 -0.6 -1.3 -0.9 -0.7 -0.3 -0.1 -0.1
Total revenue 21.6 22.6 22.2 20.9 20.9 21.4 21.7 22.3 22.9 22.9
Total expenditure 22.0 21.3 21.6 21.5 22.2 22.3 22.3 22.6 23.0 23.0
Central government structural balance -2.7 -1.1 -0.4 -0.8 -1.1 -0.7 -0.5 -0.2 0.0 0.0
Employment
Working age population 1.6 1.5 1.5 1.6 1.5 1.4 1.3 1.1 1.1 1.1
Labor force 4.2 3.8 1.1 1.6 1.5 1.4 1.3 1.1 1.1 1.1
Employment 7.4 5.0 1.9 2.1 1.0 1.4 1.3 1.1 1.1 1.1
Unemployment rate (in percent) 8.2 7.1 6.4 5.9 6.4 6.4 6.4 6.4 6.4 6.4
Sources: Central Bank of Chile, Ministry of Finance, National Statistics Institute, Haver Analytics, and Fund staff calculations and projections.
1/ Contribution to growth.
2/ Gross consolidated debt of the public sector (central bank, non-financial public enterprises, and general government).
(Annual percentage change)
(Annual percentage change, unless otherwise specified)
(In percent of GDP)
Table 6. Chile: Medium-Term Framework
Projections
(In percent of GDP)
(Annual percentage change, unless otherwise specified)
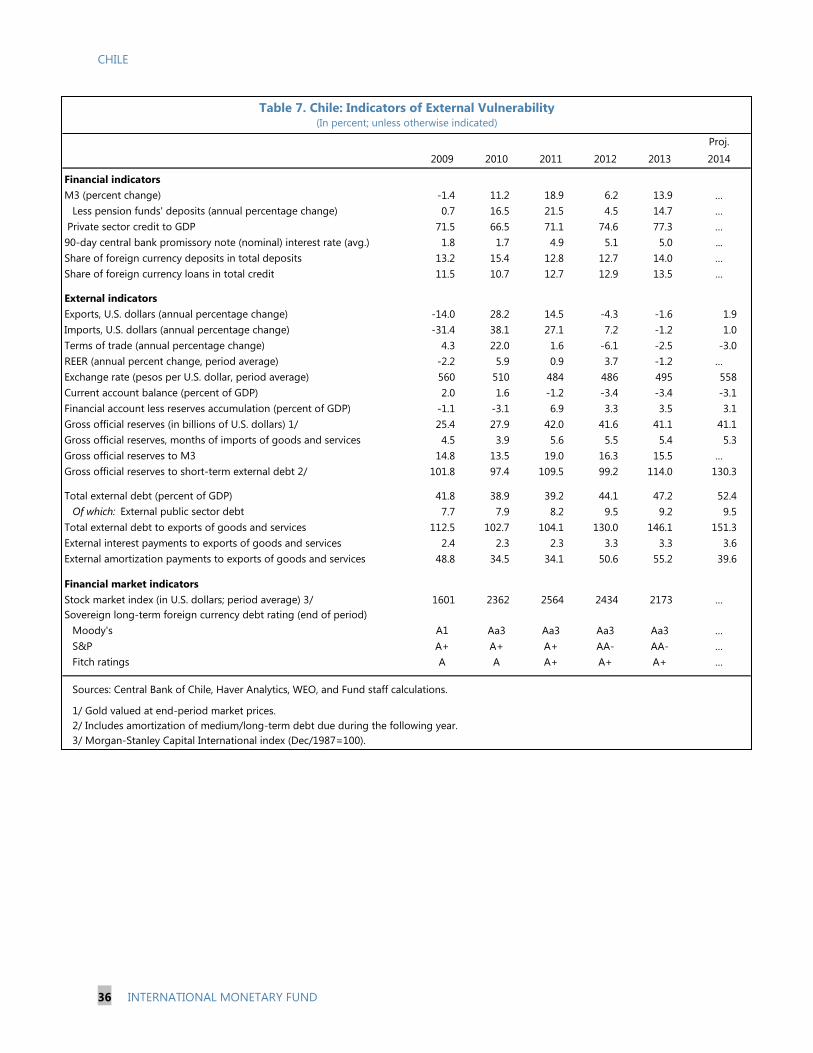
CHILE
36 INTERNATIONAL MONETARY FUND
Proj.
2009 2010 2011 2012 2013 2014
Financial indicators
M3 (percent change) -1.4 11.2 18.9 6.2 13.9 …
Less pension funds' deposits (annual percentage change) 0.7 16.5 21.5 4.5 14.7 …
Private sector credit to GDP 71.5 66.5 71.1 74.6 77.3 …
90-day central bank promissory note (nominal) interest rate (avg.) 1.8 1.7 4.9 5.1 5.0 ...
Share of foreign currency deposits in total deposits 13.2 15.4 12.8 12.7 14.0 …
Share of foreign currency loans in total credit 11.5 10.7 12.7 12.9 13.5 …
External indicators
Exports, U.S. dollars (annual percentage change) -14.0 28.2 14.5 -4.3 -1.6 1.9
Imports, U.S. dollars (annual percentage change) -31.4 38.1 27.1 7.2 -1.2 1.0
Terms of trade (annual percentage change) 4.3 22.0 1.6 -6.1 -2.5 -3.0
REER (annual percent change, period average) -2.2 5.9 0.9 3.7 -1.2 …
Exchange rate (pesos per U.S. dollar, period average) 560 510 484 486 495 558
Current account balance (percent of GDP) 2.0 1.6 -1.2 -3.4 -3.4 -3.1
Financial account less reserves accumulation (percent of GDP) -1.1 -3.1 6.9 3.3 3.5 3.1
Gross official reserves (in billions of U.S. dollars) 1/ 25.4 27.9 42.0 41.6 41.1 41.1
Gross official reserves, months of imports of goods and services 4.5 3.9 5.6 5.5 5.4 5.3
Gross official reserves to M3 14.8 13.5 19.0 16.3 15.5 …
Gross official reserves to short-term external debt 2/ 101.8 97.4 109.5 99.2 114.0 130.3
Total external debt (percent of GDP) 41.8 38.9 39.2 44.1 47.2 52.4
Of which: External public sector debt 7.7 7.9 8.2 9.5 9.2 9.5
Total external debt to exports of goods and services 112.5 102.7 104.1 130.0 146.1 151.3
External interest payments to exports of goods and services 2.4 2.3 2.3 3.3 3.3 3.6
External amortization payments to exports of goods and services 48.8 34.5 34.1 50.6 55.2 39.6
Financial market indicators
Stock market index (in U.S. dollars; period average) 3/ 1601 2362 2564 2434 2173 …
Sovereign long-term foreign currency debt rating (end of period)
Moody's A1 Aa3 Aa3 Aa3 Aa3 …
S&P A+ A+ A+ AA- AA- …
Fitch ratings A A A+ A+ A+ …
Sources: Central Bank of Chile, Haver Analytics, WEO, and Fund staff calculations.
1/ Gold valued at end-period market prices.
2/ Includes amortization of medium/long-term debt due during the following year.
3/ Morgan-Stanley Capital International index (Dec/1987=100).
Table 7. Chile: Indicators of External Vulnerability(In percent; unless otherwise indicated)
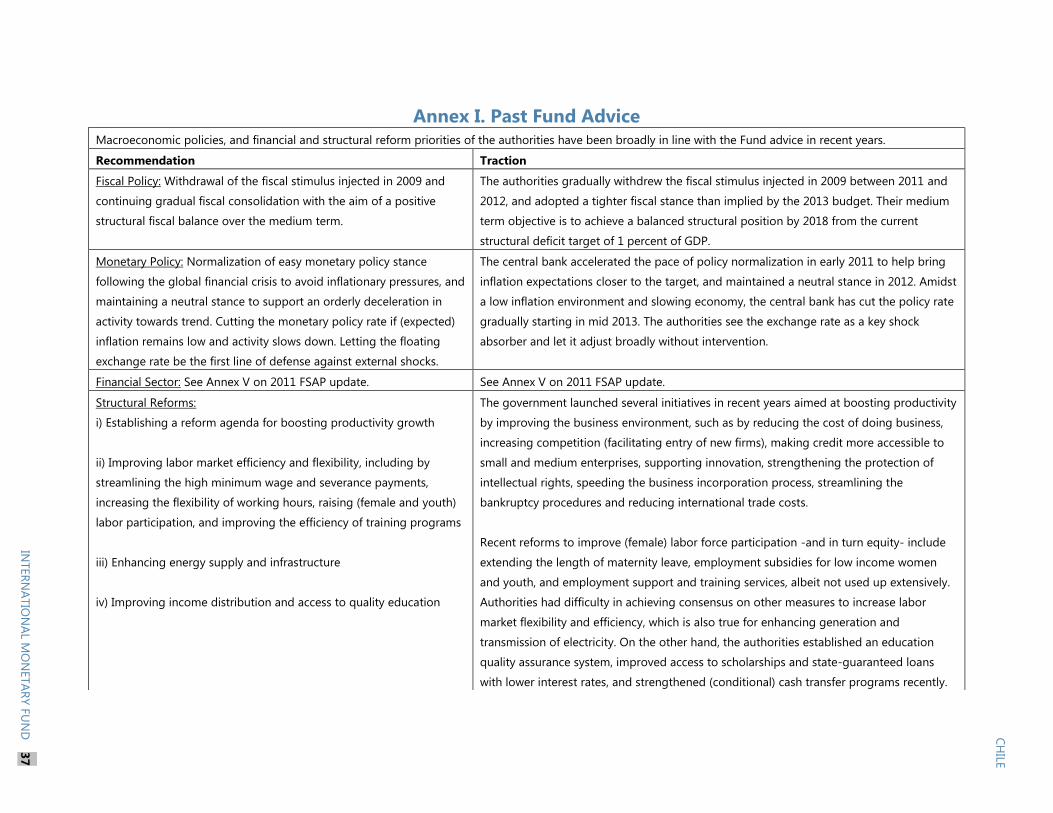
Annex I. Past Fund Advice Macroeconomic policies, and financial and structural reform priorities of the authorities have been broadly in line with the Fund advice in recent years.
Recommendation Traction
Fiscal Policy: Withdrawal of the fiscal stimulus injected in 2009 and
continuing gradual fiscal consolidation with the aim of a positive
structural fiscal balance over the medium term.
The authorities gradually withdrew the fiscal stimulus injected in 2009 between 2011 and
2012, and adopted a tighter fiscal stance than implied by the 2013 budget. Their medium
term objective is to achieve a balanced structural position by 2018 from the current
structural deficit target of 1 percent of GDP.
Monetary Policy: Normalization of easy monetary policy stance
following the global financial crisis to avoid inflationary pressures, and
maintaining a neutral stance to support an orderly deceleration in
activity towards trend. Cutting the monetary policy rate if (expected)
inflation remains low and activity slows down. Letting the floating
exchange rate be the first line of defense against external shocks.
The central bank accelerated the pace of policy normalization in early 2011 to help bring
inflation expectations closer to the target, and maintained a neutral stance in 2012. Amidst
a low inflation environment and slowing economy, the central bank has cut the policy rate
gradually starting in mid 2013. The authorities see the exchange rate as a key shock
absorber and let it adjust broadly without intervention.
Financial Sector: See Annex V on 2011 FSAP update. See Annex V on 2011 FSAP update.
Structural Reforms:
i) Establishing a reform agenda for boosting productivity growth
ii) Improving labor market efficiency and flexibility, including by
streamlining the high minimum wage and severance payments,
increasing the flexibility of working hours, raising (female and youth)
labor participation, and improving the efficiency of training programs
iii) Enhancing energy supply and infrastructure
iv) Improving income distribution and access to quality education
The government launched several initiatives in recent years aimed at boosting productivity
by improving the business environment, such as by reducing the cost of doing business,
increasing competition (facilitating entry of new firms), making credit more accessible to
small and medium enterprises, supporting innovation, strengthening the protection of
intellectual rights, speeding the business incorporation process, streamlining the
bankruptcy procedures and reducing international trade costs.
Recent reforms to improve (female) labor force participation -and in turn equity- include
extending the length of maternity leave, employment subsidies for low income women
and youth, and employment support and training services, albeit not used up extensively.
Authorities had difficulty in achieving consensus on other measures to increase labor
market flexibility and efficiency, which is also true for enhancing generation and
transmission of electricity. On the other hand, the authorities established an education
quality assurance system, improved access to scholarships and state-guaranteed loans
with lower interest rates, and strengthened (conditional) cash transfer programs recently.
CH
ILE
INTER
NA
TIO
NA
L MO
NETA
RY F
UN
D
37
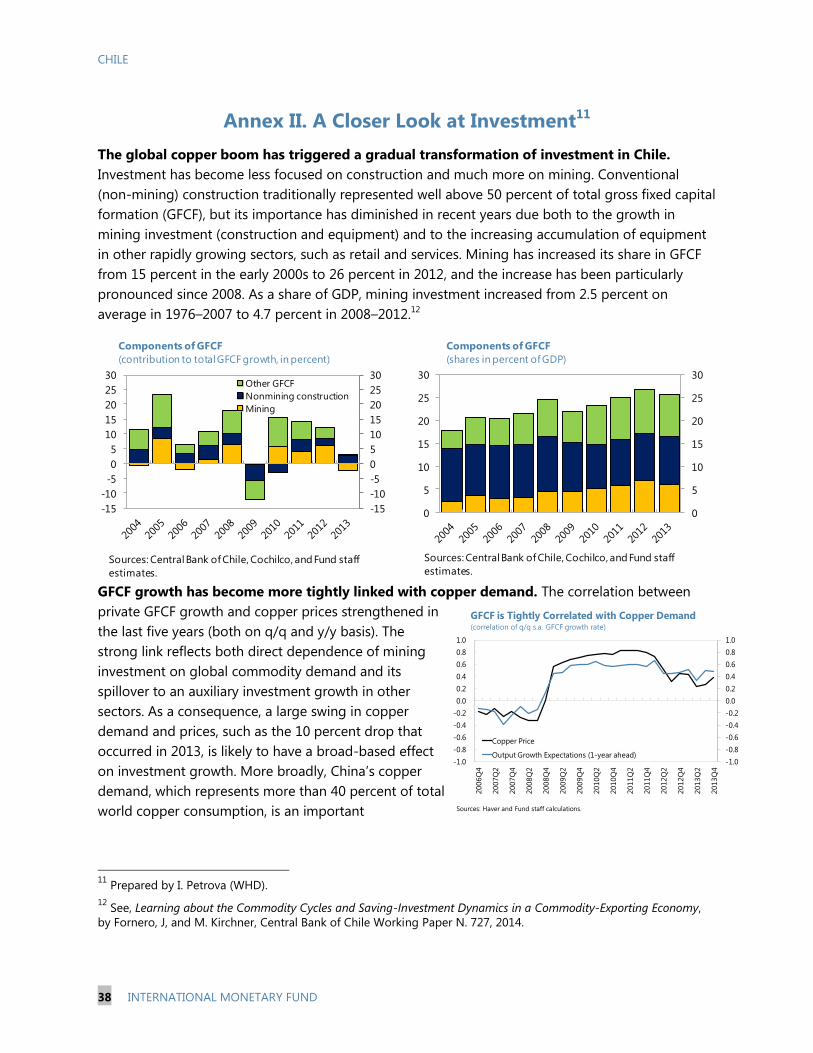
CHILE
38 INTERNATIONAL MONETARY FUND
-1.0
-0.8
-0.6
-0.4
-0.2
0.0
0.2
0.4
0.6
0.8
1.0
-1.0
-0.8
-0.6
-0.4
-0.2
0.0
0.2
0.4
0.6
0.8
1.0
2006Q
4
2007Q
2
2007Q
4
2008Q
2
2008Q
4
2009Q
2
2009Q
4
2010Q
2
2010Q
4
2011Q
2
2011Q
4
2012Q
2
2012Q
4
2013Q
2
2013Q
4
GFCF is Tightly Correlated with Copper Demand(correlation of q/q s.a. GFCF growth rate)
Copper Price
Output Growth Expectations (1-year ahead)
Sources: Haver and Fund staff calculations.
Annex II. A Closer Look at Investment11
The global copper boom has triggered a gradual transformation of investment in Chile.
Investment has become less focused on construction and much more on mining. Conventional
(non-mining) construction traditionally represented well above 50 percent of total gross fixed capital
formation (GFCF), but its importance has diminished in recent years due both to the growth in
mining investment (construction and equipment) and to the increasing accumulation of equipment
in other rapidly growing sectors, such as retail and services. Mining has increased its share in GFCF
from 15 percent in the early 2000s to 26 percent in 2012, and the increase has been particularly
pronounced since 2008. As a share of GDP, mining investment increased from 2.5 percent on
average in 1976–2007 to 4.7 percent in 2008–2012.12
GFCF growth has become more tightly linked with copper demand. The correlation between
private GFCF growth and copper prices strengthened in
the last five years (both on q/q and y/y basis). The
strong link reflects both direct dependence of mining
investment on global commodity demand and its
spillover to an auxiliary investment growth in other
sectors. As a consequence, a large swing in copper
demand and prices, such as the 10 percent drop that
occurred in 2013, is likely to have a broad-based effect
on investment growth. More broadly, China’s copper
demand, which represents more than 40 percent of total
world copper consumption, is an important
11
Prepared by I. Petrova (WHD).
12 See, Learning about the Commodity Cycles and Saving-Investment Dynamics in a Commodity-Exporting Economy,
by Fornero, J, and M. Kirchner, Central Bank of Chile Working Paper N. 727, 2014.
-15
-10
-5
0
5
10
15
20
25
30
-15
-10
-5
0
5
10
15
20
25
30Other GFCF
Nonmining construction
Mining
Components of GFCF
(contribution to total GFCF growth, in percent)
Sources: Central Bank of Chile, Cochilco, and Fund staff
estimates.
0
5
10
15
20
25
30
0
5
10
15
20
25
30
Components of GFCF
(shares in percent of GDP)
Sources: Central Bank of Chile, Cochilco, and Fund staff
estimates.
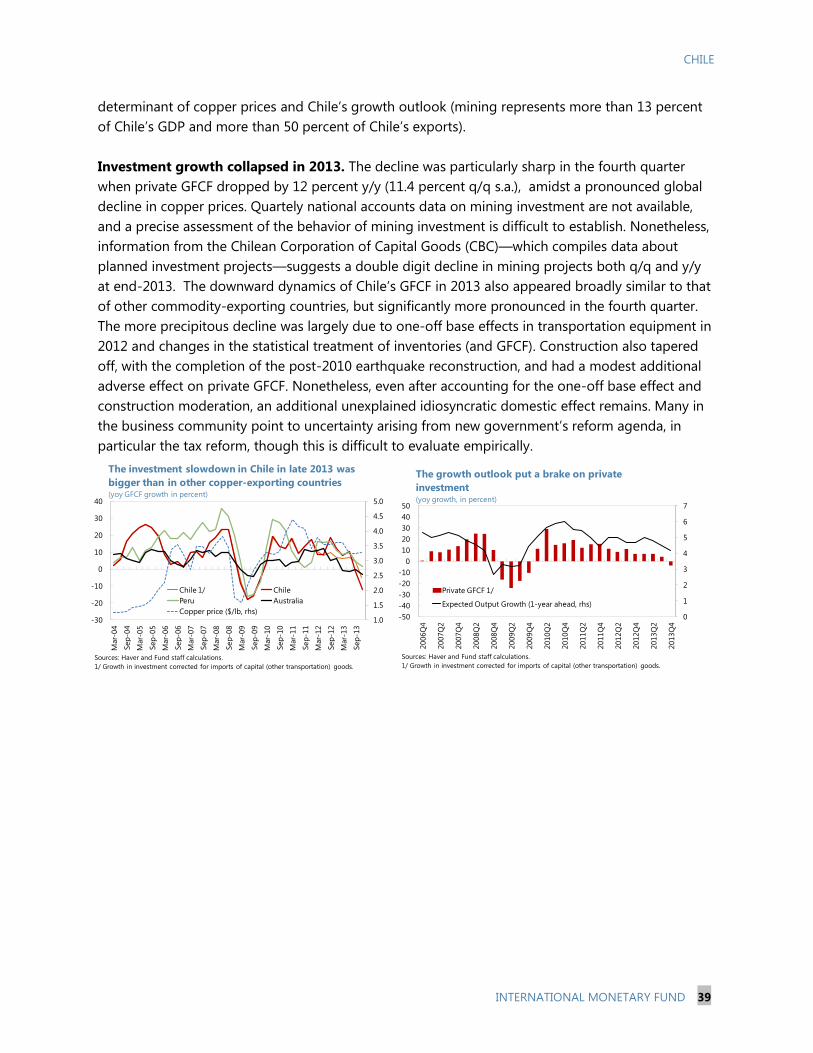
CHILE
INTERNATIONAL MONETARY FUND 39
determinant of copper prices and Chile’s growth outlook (mining represents more than 13 percent
of Chile’s GDP and more than 50 percent of Chile’s exports).
Investment growth collapsed in 2013. The decline was particularly sharp in the fourth quarter
when private GFCF dropped by 12 percent y/y (11.4 percent q/q s.a.), amidst a pronounced global
decline in copper prices. Quartely national accounts data on mining investment are not available,
and a precise assessment of the behavior of mining investment is difficult to establish. Nonetheless,
information from the Chilean Corporation of Capital Goods (CBC)—which compiles data about
planned investment projects—suggests a double digit decline in mining projects both q/q and y/y
at end-2013. The downward dynamics of Chile’s GFCF in 2013 also appeared broadly similar to that
of other commodity-exporting countries, but significantly more pronounced in the fourth quarter.
The more precipitous decline was largely due to one-off base effects in transportation equipment in
2012 and changes in the statistical treatment of inventories (and GFCF). Construction also tapered
off, with the completion of the post-2010 earthquake reconstruction, and had a modest additional
adverse effect on private GFCF. Nonetheless, even after accounting for the one-off base effect and
construction moderation, an additional unexplained idiosyncratic domestic effect remains. Many in
the business community point to uncertainty arising from new government’s reform agenda, in
particular the tax reform, though this is difficult to evaluate empirically.
1.0
1.5
2.0
2.5
3.0
3.5
4.0
4.5
5.0
-30
-20
-10
0
10
20
30
40
Mar-
04
Sep
-04
Mar-
05
Sep
-05
Mar-
06
Sep
-06
Mar-
07
Sep
-07
Mar-
08
Sep
-08
Mar-
09
Sep
-09
Mar-
10
Sep
-10
Mar-
11
Sep
-11
Mar-
12
Sep
-12
Mar-
13
Sep
-13
Chile 1/ Chile
Peru Australia
Copper price ($/lb, rhs)
The investment slowdown in Chile in late 2013 was
bigger than in other copper-exporting countries(yoy GFCF growth in percent)
Sources: Haver and Fund staff calculations.
1/ Growth in investment corrected for imports of capital (other transportation) goods.
0
1
2
3
4
5
6
7
-50
-40
-30
-20
-10
0
10
20
30
40
50
2006Q
4
2007Q
2
2007Q
4
2008Q
2
2008Q
4
2009Q
2
2009Q
4
2010Q
2
2010Q
4
2011Q
2
2011Q
4
2012Q
2
2012Q
4
2013Q
2
2013Q
4
The growth outlook put a brake on private
investment(yoy growth, in percent)
Private GFCF 1/
Expected Output Growth (1-year ahead, rhs)
Sources: Haver and Fund staff calculations.
1/ Growth in investment corrected for imports of capital (other transportation) goods.
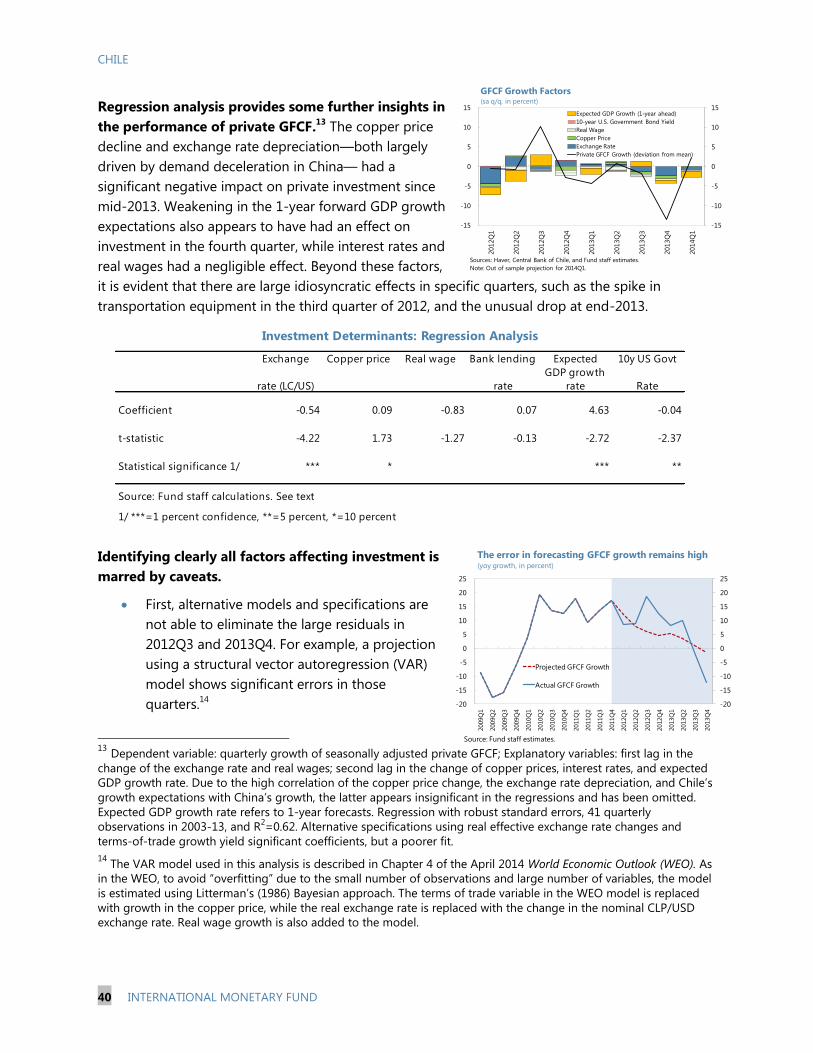
CHILE
40 INTERNATIONAL MONETARY FUND
Regression analysis provides some further insights in
the performance of private GFCF.13
The copper price
decline and exchange rate depreciation—both largely
driven by demand deceleration in China— had a
significant negative impact on private investment since
mid-2013. Weakening in the 1-year forward GDP growth
expectations also appears to have had an effect on
investment in the fourth quarter, while interest rates and
real wages had a negligible effect. Beyond these factors,
it is evident that there are large idiosyncratic effects in specific quarters, such as the spike in
transportation equipment in the third quarter of 2012, and the unusual drop at end-2013.
Identifying clearly all factors affecting investment is
marred by caveats.
First, alternative models and specifications are
not able to eliminate the large residuals in
2012Q3 and 2013Q4. For example, a projection
using a structural vector autoregression (VAR)
model shows significant errors in those
quarters.14
13
Dependent variable: quarterly growth of seasonally adjusted private GFCF; Explanatory variables: first lag in the
change of the exchange rate and real wages; second lag in the change of copper prices, interest rates, and expected
GDP growth rate. Due to the high correlation of the copper price change, the exchange rate depreciation, and Chile’s
growth expectations with China’s growth, the latter appears insignificant in the regressions and has been omitted.
Expected GDP growth rate refers to 1-year forecasts. Regression with robust standard errors, 41 quarterly
observations in 2003-13, and R2=0.62. Alternative specifications using real effective exchange rate changes and
terms-of-trade growth yield significant coefficients, but a poorer fit. 14
The VAR model used in this analysis is described in Chapter 4 of the April 2014 World Economic Outlook (WEO). As
in the WEO, to avoid “overfitting” due to the small number of observations and large number of variables, the model
is estimated using Litterman’s (1986) Bayesian approach. The terms of trade variable in the WEO model is replaced
with growth in the copper price, while the real exchange rate is replaced with the change in the nominal CLP/USD
exchange rate. Real wage growth is also added to the model.
-15
-10
-5
0
5
10
15
-15
-10
-5
0
5
10
15
2012Q
1
2012Q
2
2012Q
3
2012Q
4
2013Q
1
2013Q
2
2013Q
3
2013Q
4
2014Q
1
Expected GDP Growth (1-year ahead)
10-year U.S. Government Bond Yield
Real Wage
Copper Price
Exchange Rate
Private GFCF Growth (deviation from mean)
GFCF Growth Factors(sa q/q, in percent)
Sources: Haver, Central Bank of Chile, and Fund staff estimates.
Note: Out of sample projection for 2014Q1.
-20
-15
-10
-5
0
5
10
15
20
25
-20
-15
-10
-5
0
5
10
15
20
25
2009Q
1
2009Q
2
2009Q
3
2009Q
4
2010Q
1
2010Q
2
2010Q
3
2010Q
4
2011Q
1
2011Q
2
2011Q
3
2011Q
4
2012Q
1
2012Q
2
2012Q
3
2012Q
4
2013Q
1
2013Q
2
2013Q
3
2013Q
4
Projected GFCF Growth
Actual GFCF Growth
The error in forecasting GFCF growth remains high (yoy growth, in percent)
Source: Fund staff estimates.
Exchange
rate (LC/US)
Copper price Real wage Bank lending
rate
Expected
GDP growth
rate
10y US Govt
Rate
Coefficient -0.54 0.09 -0.83 0.07 4.63 -0.04
t-statistic -4.22 1.73 -1.27 -0.13 -2.72 -2.37
Statistical significance 1/ *** * *** **
Source: Fund staff calculations. See text
1/ ***=1 percent confidence, **=5 percent, *=10 percent
Investment Determinants: Regression Analysis
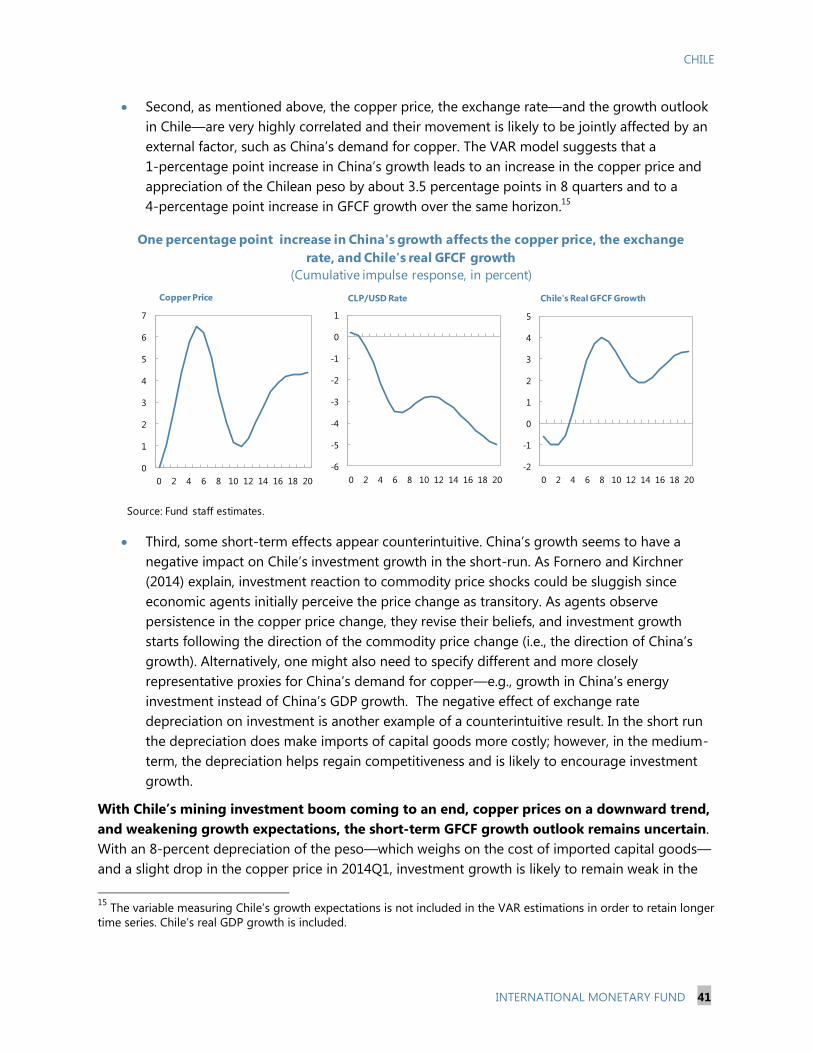
CHILE
INTERNATIONAL MONETARY FUND 41
Second, as mentioned above, the copper price, the exchange rate—and the growth outlook
in Chile—are very highly correlated and their movement is likely to be jointly affected by an
external factor, such as China’s demand for copper. The VAR model suggests that a
1-percentage point increase in China’s growth leads to an increase in the copper price and
appreciation of the Chilean peso by about 3.5 percentage points in 8 quarters and to a
4-percentage point increase in GFCF growth over the same horizon.15
Third, some short-term effects appear counterintuitive. China’s growth seems to have a
negative impact on Chile’s investment growth in the short-run. As Fornero and Kirchner
(2014) explain, investment reaction to commodity price shocks could be sluggish since
economic agents initially perceive the price change as transitory. As agents observe
persistence in the copper price change, they revise their beliefs, and investment growth
starts following the direction of the commodity price change (i.e., the direction of China’s
growth). Alternatively, one might also need to specify different and more closely
representative proxies for China’s demand for copper—e.g., growth in China’s energy
investment instead of China’s GDP growth. The negative effect of exchange rate
depreciation on investment is another example of a counterintuitive result. In the short run
the depreciation does make imports of capital goods more costly; however, in the medium-
term, the depreciation helps regain competitiveness and is likely to encourage investment
growth.
With Chile’s mining investment boom coming to an end, copper prices on a downward trend,
and weakening growth expectations, the short-term GFCF growth outlook remains uncertain.
With an 8-percent depreciation of the peso—which weighs on the cost of imported capital goods—
and a slight drop in the copper price in 2014Q1, investment growth is likely to remain weak in the
15
The variable measuring Chile’s growth expectations is not included in the VAR estimations in order to retain longer
time series. Chile’s real GDP growth is included.
One percentage point increase in China's growth affects the copper price, the exchange
rate, and Chile's real GFCF growth
(Cumulative impulse response, in percent)
0
1
2
3
4
5
6
7
0 2 4 6 8 10 12 14 16 18 20
Copper Price
-6
-5
-4
-3
-2
-1
0
1
0 2 4 6 8 10 12 14 16 18 20
CLP/USD Rate
-2
-1
0
1
2
3
4
5
0 2 4 6 8 10 12 14 16 18 20
Chile's Real GFCF Growth
Source: Fund staff estimates.
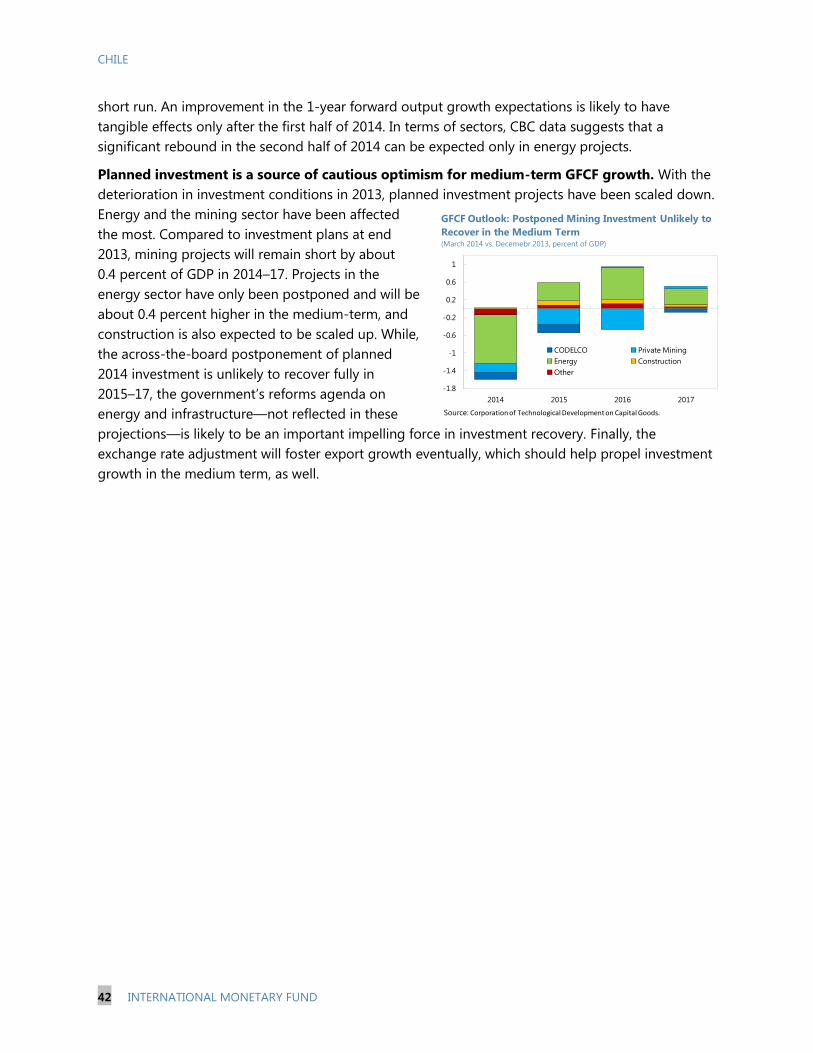
CHILE
42 INTERNATIONAL MONETARY FUND
short run. An improvement in the 1-year forward output growth expectations is likely to have
tangible effects only after the first half of 2014. In terms of sectors, CBC data suggests that a
significant rebound in the second half of 2014 can be expected only in energy projects.
Planned investment is a source of cautious optimism for medium-term GFCF growth. With the
deterioration in investment conditions in 2013, planned investment projects have been scaled down.
Energy and the mining sector have been affected
the most. Compared to investment plans at end
2013, mining projects will remain short by about
0.4 percent of GDP in 2014–17. Projects in the
energy sector have only been postponed and will be
about 0.4 percent higher in the medium-term, and
construction is also expected to be scaled up. While,
the across-the-board postponement of planned
2014 investment is unlikely to recover fully in
2015–17, the government’s reforms agenda on
energy and infrastructure—not reflected in these
projections—is likely to be an important impelling force in investment recovery. Finally, the
exchange rate adjustment will foster export growth eventually, which should help propel investment
growth in the medium term, as well.
-1.8
-1.4
-1
-0.6
-0.2
0.2
0.6
1
2014 2015 2016 2017
CODELCO Private Mining
Energy Construction
Other
GFCF Outlook: Postponed Mining Investment Unlikely to
Recover in the Medium Term(March 2014 vs. Decemebr 2013, percent of GDP)
Source: Corporation of Technological Development on Capital Goods.
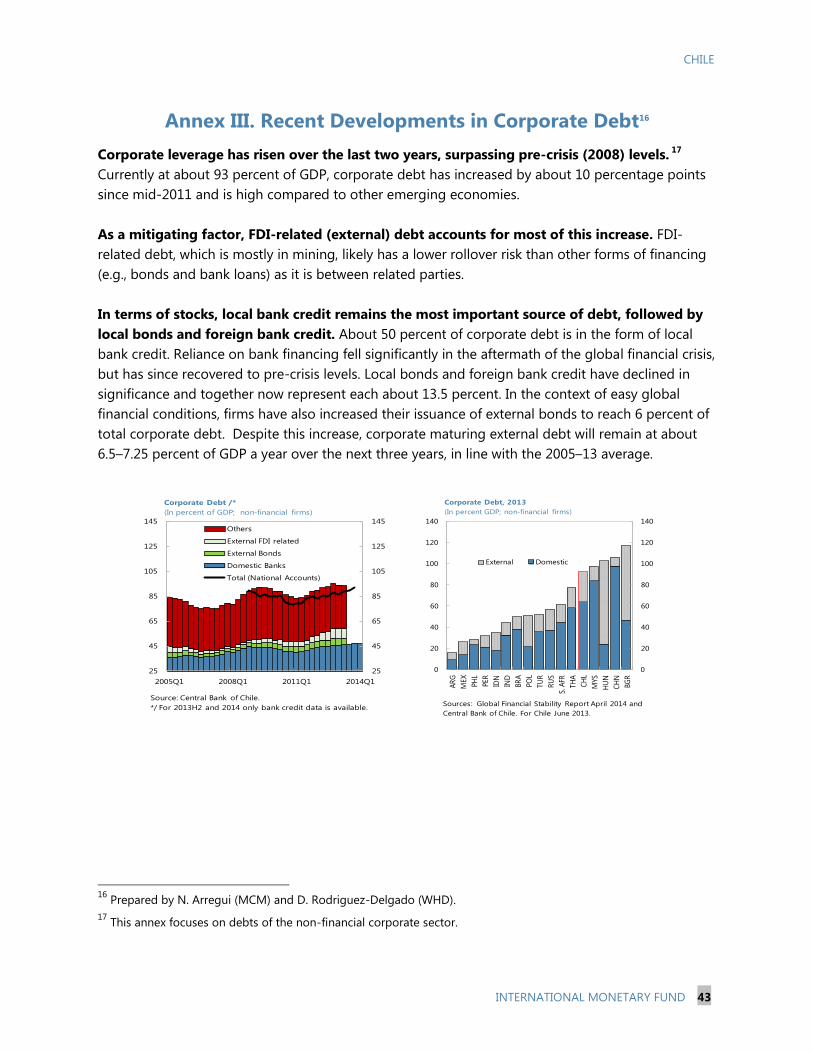
CHILE
INTERNATIONAL MONETARY FUND 43
Annex III. Recent Developments in Corporate Debt16
Corporate leverage has risen over the last two years, surpassing pre-crisis (2008) levels. 17
Currently at about 93 percent of GDP, corporate debt has increased by about 10 percentage points
since mid-2011 and is high compared to other emerging economies.
As a mitigating factor, FDI-related (external) debt accounts for most of this increase. FDI-
related debt, which is mostly in mining, likely has a lower rollover risk than other forms of financing
(e.g., bonds and bank loans) as it is between related parties.
In terms of stocks, local bank credit remains the most important source of debt, followed by
local bonds and foreign bank credit. About 50 percent of corporate debt is in the form of local
bank credit. Reliance on bank financing fell significantly in the aftermath of the global financial crisis,
but has since recovered to pre-crisis levels. Local bonds and foreign bank credit have declined in
significance and together now represent each about 13.5 percent. In the context of easy global
financial conditions, firms have also increased their issuance of external bonds to reach 6 percent of
total corporate debt. Despite this increase, corporate maturing external debt will remain at about
6.5–7.25 percent of GDP a year over the next three years, in line with the 2005–13 average.
16
Prepared by N. Arregui (MCM) and D. Rodriguez-Delgado (WHD).
17 This annex focuses on debts of the non-financial corporate sector.
25
45
65
85
105
125
145
25
45
65
85
105
125
145
2005Q1 2008Q1 2011Q1 2014Q1
Others
External FDI related
External Bonds
Domestic Banks
Total (National Accounts)
Corporate Debt /*
(In percent of GDP; non-financial firms)
Source: Central Bank of Chile.
*/ For 2013H2 and 2014 only bank credit data is available.
0
20
40
60
80
100
120
140
0
20
40
60
80
100
120
140
AR
G
MEX
PH
L
PER
IDN
IND
BR
A
PO
L
TU
R
RU
S
S. A
FR
TH
A
CH
L
MYS
HU
N
CH
N
BG
R
External Domestic
Corporate Debt, 2013
(In percent GDP; non-financial firms)
Sources: Global Financial Stability Report April 2014 and
Central Bank of Chile. For Chile June 2013.
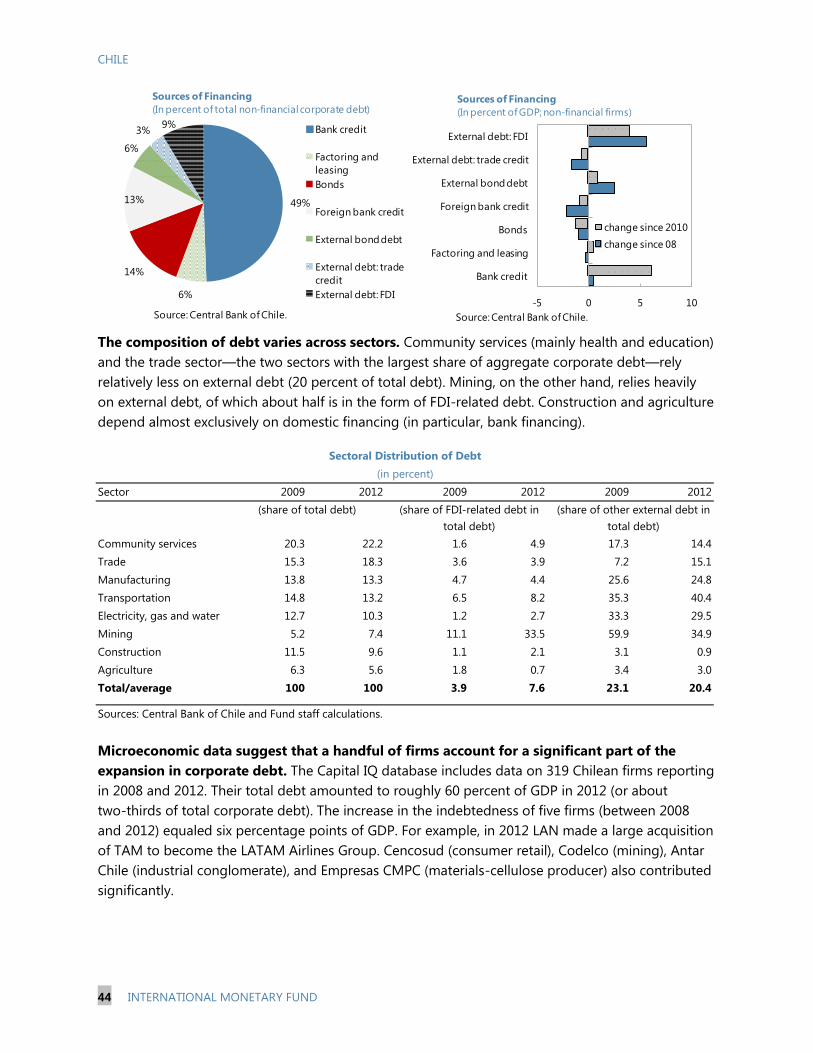
CHILE
44 INTERNATIONAL MONETARY FUND
The composition of debt varies across sectors. Community services (mainly health and education)
and the trade sector—the two sectors with the largest share of aggregate corporate debt—rely
relatively less on external debt (20 percent of total debt). Mining, on the other hand, relies heavily
on external debt, of which about half is in the form of FDI-related debt. Construction and agriculture
depend almost exclusively on domestic financing (in particular, bank financing).
Microeconomic data suggest that a handful of firms account for a significant part of the
expansion in corporate debt. The Capital IQ database includes data on 319 Chilean firms reporting
in 2008 and 2012. Their total debt amounted to roughly 60 percent of GDP in 2012 (or about
two-thirds of total corporate debt). The increase in the indebtedness of five firms (between 2008
and 2012) equaled six percentage points of GDP. For example, in 2012 LAN made a large acquisition
of TAM to become the LATAM Airlines Group. Cencosud (consumer retail), Codelco (mining), Antar
Chile (industrial conglomerate), and Empresas CMPC (materials-cellulose producer) also contributed
significantly.
-5 0 5 10
Bank credit
Factoring and leasing
Bonds
Foreign bank credit
External bond debt
External debt: trade credit
External debt: FDI
change since 2010
change since 08
Sources of Financing
(In percent of GDP; non-financial firms)
Source: Central Bank of Chile.
49%
6%
14%
13%
6%
3%9%
Bank credit
Factoring and
leasing
Bonds
Foreign bank credit
External bond debt
External debt: trade
credit
External debt: FDI
Sources of Financing
(In percent of total non-financial corporate debt)
Source: Central Bank of Chile.
Sector 2009 2012 2009 2012 2009 2012
Community services 20.3 22.2 1.6 4.9 17.3 14.4
Trade 15.3 18.3 3.6 3.9 7.2 15.1
Manufacturing 13.8 13.3 4.7 4.4 25.6 24.8
Transportation 14.8 13.2 6.5 8.2 35.3 40.4
Electricity, gas and water 12.7 10.3 1.2 2.7 33.3 29.5
Mining 5.2 7.4 11.1 33.5 59.9 34.9
Construction 11.5 9.6 1.1 2.1 3.1 0.9
Agriculture 6.3 5.6 1.8 0.7 3.4 3.0
Total/average 100 100 3.9 7.6 23.1 20.4
Sources: Central Bank of Chile and Fund staff calculations.
(share of total debt) (share of FDI-related debt in
total debt)
Sectoral Distribution of Debt
(in percent)
(share of other external debt in
total debt)
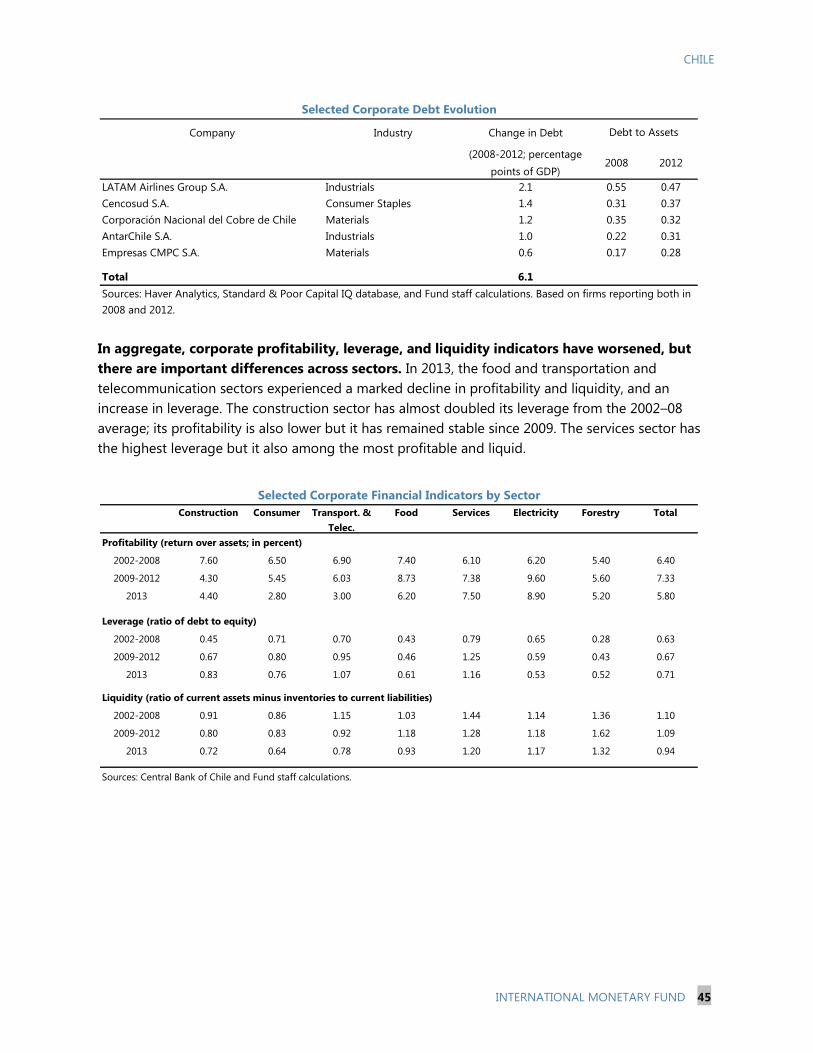
CHILE
INTERNATIONAL MONETARY FUND 45
In aggregate, corporate profitability, leverage, and liquidity indicators have worsened, but
there are important differences across sectors. In 2013, the food and transportation and
telecommunication sectors experienced a marked decline in profitability and liquidity, and an
increase in leverage. The construction sector has almost doubled its leverage from the 2002–08
average; its profitability is also lower but it has remained stable since 2009. The services sector has
the highest leverage but it also among the most profitable and liquid.
Company Industry Change in Debt
(2008-2012; percentage
points of GDP)2008 2012
LATAM Airlines Group S.A. Industrials 2.1 0.55 0.47
Cencosud S.A. Consumer Staples 1.4 0.31 0.37
Corporación Nacional del Cobre de Chile Materials 1.2 0.35 0.32
AntarChile S.A. Industrials 1.0 0.22 0.31
Empresas CMPC S.A. Materials 0.6 0.17 0.28
Total 6.1
Debt to Assets
Selected Corporate Debt Evolution
Sources: Haver Analytics, Standard & Poor Capital IQ database, and Fund staff calculations. Based on firms reporting both in
2008 and 2012.
Construction Consumer Transport. &
Telec.
Food Services Electricity Forestry Total
Profitability (return over assets; in percent)
2002-2008 7.60 6.50 6.90 7.40 6.10 6.20 5.40 6.40
2009-2012 4.30 5.45 6.03 8.73 7.38 9.60 5.60 7.33
2013 4.40 2.80 3.00 6.20 7.50 8.90 5.20 5.80
Leverage (ratio of debt to equity)
2002-2008 0.45 0.71 0.70 0.43 0.79 0.65 0.28 0.63
2009-2012 0.67 0.80 0.95 0.46 1.25 0.59 0.43 0.67
2013 0.83 0.76 1.07 0.61 1.16 0.53 0.52 0.71
Liquidity (ratio of current assets minus inventories to current liabilities)
2002-2008 0.91 0.86 1.15 1.03 1.44 1.14 1.36 1.10
2009-2012 0.80 0.83 0.92 1.18 1.28 1.18 1.62 1.09
2013 0.72 0.64 0.78 0.93 1.20 1.17 1.32 0.94
Sources: Central Bank of Chile and Fund staff calculations.
Selected Corporate Financial Indicators by Sector
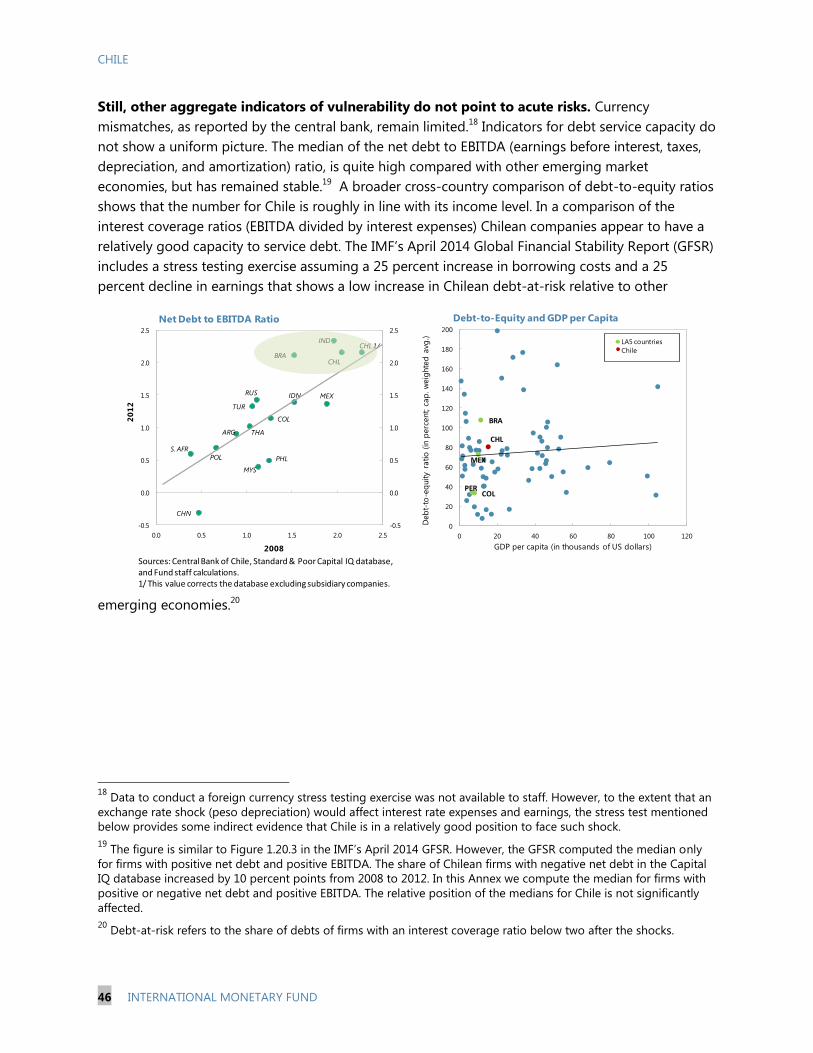
CHILE
46 INTERNATIONAL MONETARY FUND
Still, other aggregate indicators of vulnerability do not point to acute risks. Currency
mismatches, as reported by the central bank, remain limited.18
Indicators for debt service capacity do
not show a uniform picture. The median of the net debt to EBITDA (earnings before interest, taxes,
depreciation, and amortization) ratio, is quite high compared with other emerging market
economies, but has remained stable.19
A broader cross-country comparison of debt-to-equity ratios
shows that the number for Chile is roughly in line with its income level. In a comparison of the
interest coverage ratios (EBITDA divided by interest expenses) Chilean companies appear to have a
relatively good capacity to service debt. The IMF’s April 2014 Global Financial Stability Report (GFSR)
includes a stress testing exercise assuming a 25 percent increase in borrowing costs and a 25
percent decline in earnings that shows a low increase in Chilean debt-at-risk relative to other
emerging economies.20
18
Data to conduct a foreign currency stress testing exercise was not available to staff. However, to the extent that an
exchange rate shock (peso depreciation) would affect interest rate expenses and earnings, the stress test mentioned
below provides some indirect evidence that Chile is in a relatively good position to face such shock.
19 The figure is similar to Figure 1.20.3 in the IMF’s April 2014 GFSR. However, the GFSR computed the median only
for firms with positive net debt and positive EBITDA. The share of Chilean firms with negative net debt in the Capital
IQ database increased by 10 percent points from 2008 to 2012. In this Annex we compute the median for firms with
positive or negative net debt and positive EBITDA. The relative position of the medians for Chile is not significantly
affected.
20 Debt-at-risk refers to the share of debts of firms with an interest coverage ratio below two after the shocks.
CHN
IND
IDN
PHL
MYS
THAARG
BRACHL
COL
CHL 1/
MEX
POL
RUS
TUR
S. AFR
-0.5
0.0
0.5
1.0
1.5
2.0
2.5
-0.5
0.0
0.5
1.0
1.5
2.0
2.5
0.0 0.5 1.0 1.5 2.0 2.5
20
12
2008
Net Debt to EBITDA Ratio
BRA
CHL
COL
MEX
PER
0
20
40
60
80
100
120
140
160
180
200
0 20 40 60 80 100 120
Deb
t-to
-eq
uity
ratio
(in
perc
ent; c
ap
. w
eig
hte
d a
vg.)
GDP per capita (in thousands of US dollars)
Debt-to-Equity and GDP per Capita
LA5 countries
Chile
Sources: Central Bank of Chile, Standard & Poor Capital IQ database,and Fund staff calculations.1/ This value corrects the database excluding subsidiary companies.
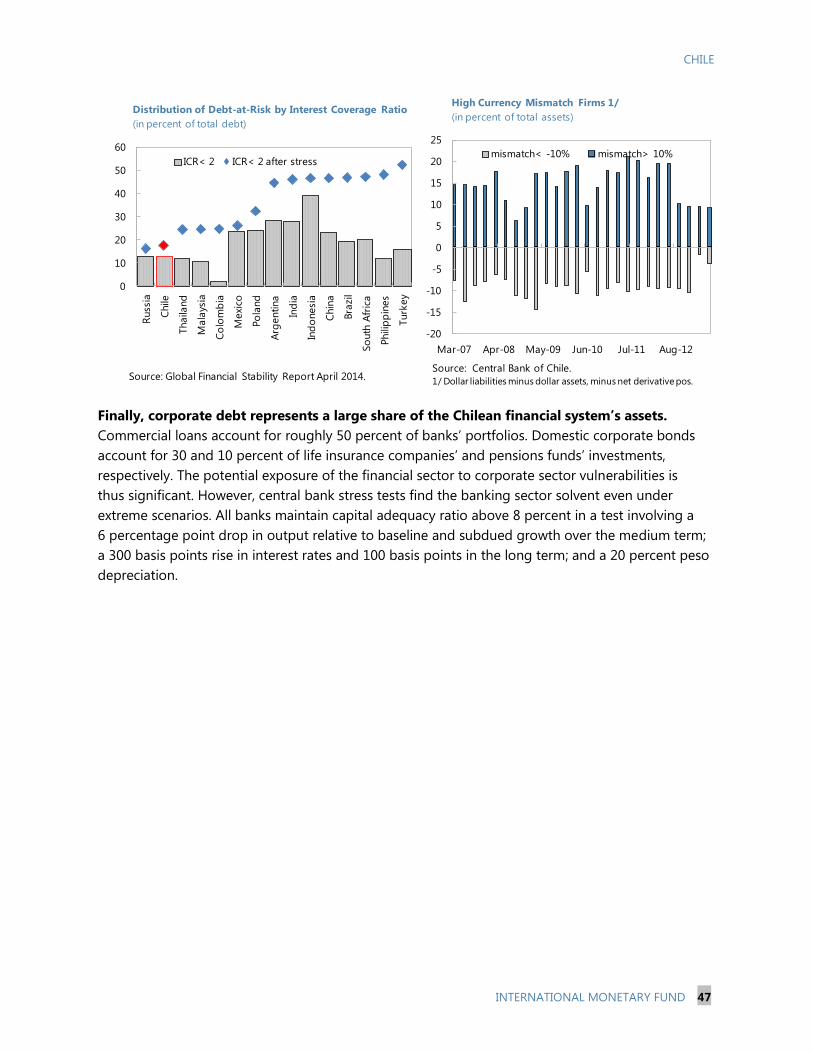
CHILE
INTERNATIONAL MONETARY FUND 47
Finally, corporate debt represents a large share of the Chilean financial system’s assets.
Commercial loans account for roughly 50 percent of banks’ portfolios. Domestic corporate bonds
account for 30 and 10 percent of life insurance companies’ and pensions funds’ investments,
respectively. The potential exposure of the financial sector to corporate sector vulnerabilities is
thus significant. However, central bank stress tests find the banking sector solvent even under
extreme scenarios. All banks maintain capital adequacy ratio above 8 percent in a test involving a
6 percentage point drop in output relative to baseline and subdued growth over the medium term;
a 300 basis points rise in interest rates and 100 basis points in the long term; and a 20 percent peso
depreciation.
0
10
20
30
40
50
60R
uss
ia
Chile
Thaila
nd
Mala
ysia
Co
lom
bia
Mexi
co
Po
land
Arg
entina
Ind
ia
Ind
onesi
a
Chin
a
Bra
zil
So
uth
Afr
ica
Phili
pp
ines
Turk
ey
ICR< 2 ICR< 2 after stress
Distribution of Debt-at-Risk by Interest Coverage Ratio
(in percent of total debt)
Source: Global Financial Stability Report April 2014.
-20
-15
-10
-5
0
5
10
15
20
25
Mar-07 Apr-08 May-09 Jun-10 Jul-11 Aug-12
mismatch< -10% mismatch> 10%
High Currency Mismatch Firms 1/
(in percent of total assets)
Source: Central Bank of Chile.
1/ Dollar liabilities minus dollar assets, minus net derivative pos.
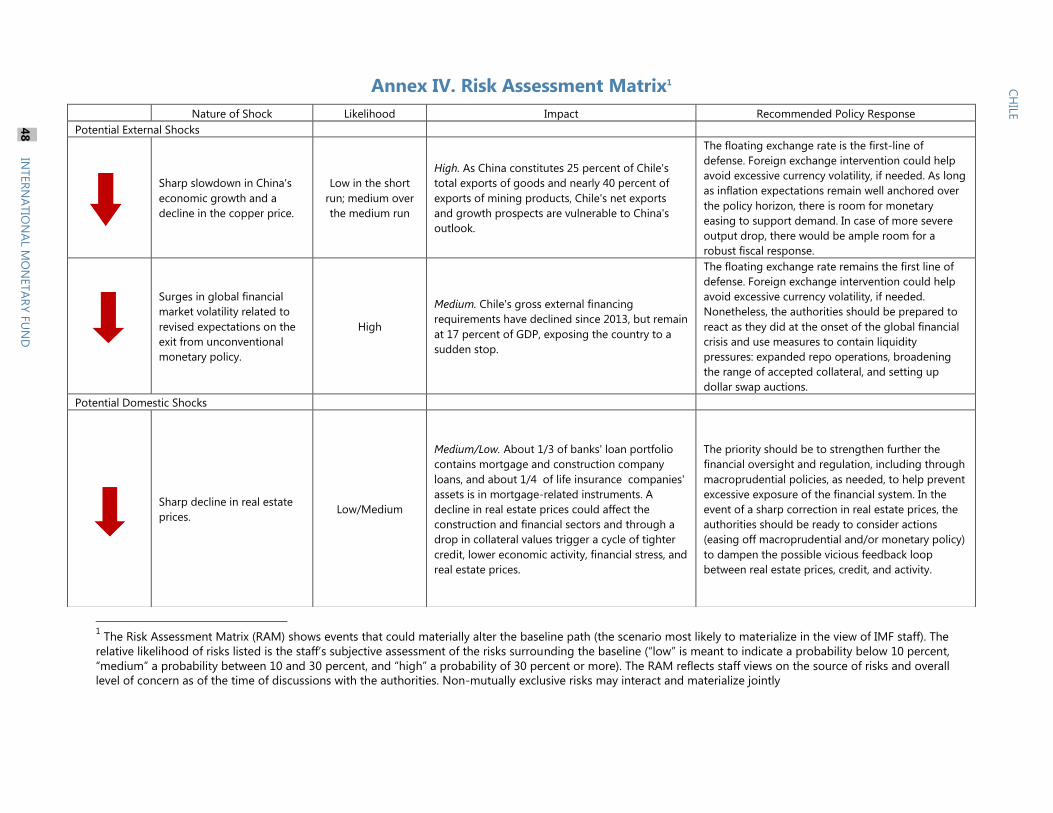
1 The Risk Assessment Matrix (RAM) shows events that could materially alter the baseline path (the scenario most likely to materialize in the view of IMF staff). The
relative likelihood of risks listed is the staff’s subjective assessment of the risks surrounding the baseline (“low” is meant to indicate a probability below 10 percent,
“medium” a probability between 10 and 30 percent, and “high” a probability of 30 percent or more). The RAM reflects staff views on the source of risks and overall
level of concern as of the time of discussions with the authorities. Non-mutually exclusive risks may interact and materialize jointly
Annex IV. Risk Assessment Matrix1
Nature of Shock Likelihood Impact Recommended Policy Response
Potential External Shocks
Sharp slowdown in China's
economic growth and a
decline in the copper price.
Low in the short
run; medium over
the medium run
High. As China constitutes 25 percent of Chile's
total exports of goods and nearly 40 percent of
exports of mining products, Chile's net exports
and growth prospects are vulnerable to China's
outlook.
The floating exchange rate is the first-line of
defense. Foreign exchange intervention could help
avoid excessive currency volatility, if needed. As long
as inflation expectations remain well anchored over
the policy horizon, there is room for monetary
easing to support demand. In case of more severe
output drop, there would be ample room for a
robust fiscal response.
Surges in global financial
market volatility related to
revised expectations on the
exit from unconventional
monetary policy.
High
Medium. Chile's gross external financing
requirements have declined since 2013, but remain
at 17 percent of GDP, exposing the country to a
sudden stop.
The floating exchange rate remains the first line of
defense. Foreign exchange intervention could help
avoid excessive currency volatility, if needed.
Nonetheless, the authorities should be prepared to
react as they did at the onset of the global financial
crisis and use measures to contain liquidity
pressures: expanded repo operations, broadening
the range of accepted collateral, and setting up
dollar swap auctions.
Potential Domestic Shocks
Sharp decline in real estate
prices. Low/Medium
Medium/Low. About 1/3 of banks' loan portfolio
contains mortgage and construction company
loans, and about 1/4 of life insurance companies'
assets is in mortgage-related instruments. A
decline in real estate prices could affect the
construction and financial sectors and through a
drop in collateral values trigger a cycle of tighter
credit, lower economic activity, financial stress, and
real estate prices.
The priority should be to strengthen further the
financial oversight and regulation, including through
macroprudential policies, as needed, to help prevent
excessive exposure of the financial system. In the
event of a sharp correction in real estate prices, the
authorities should be ready to consider actions
(easing off macroprudential and/or monetary policy)
to dampen the possible vicious feedback loop
between real estate prices, credit, and activity.
CH
ILE
48
IN
TER
NA
TIO
NA
L MO
NETA
RY F
UN
D
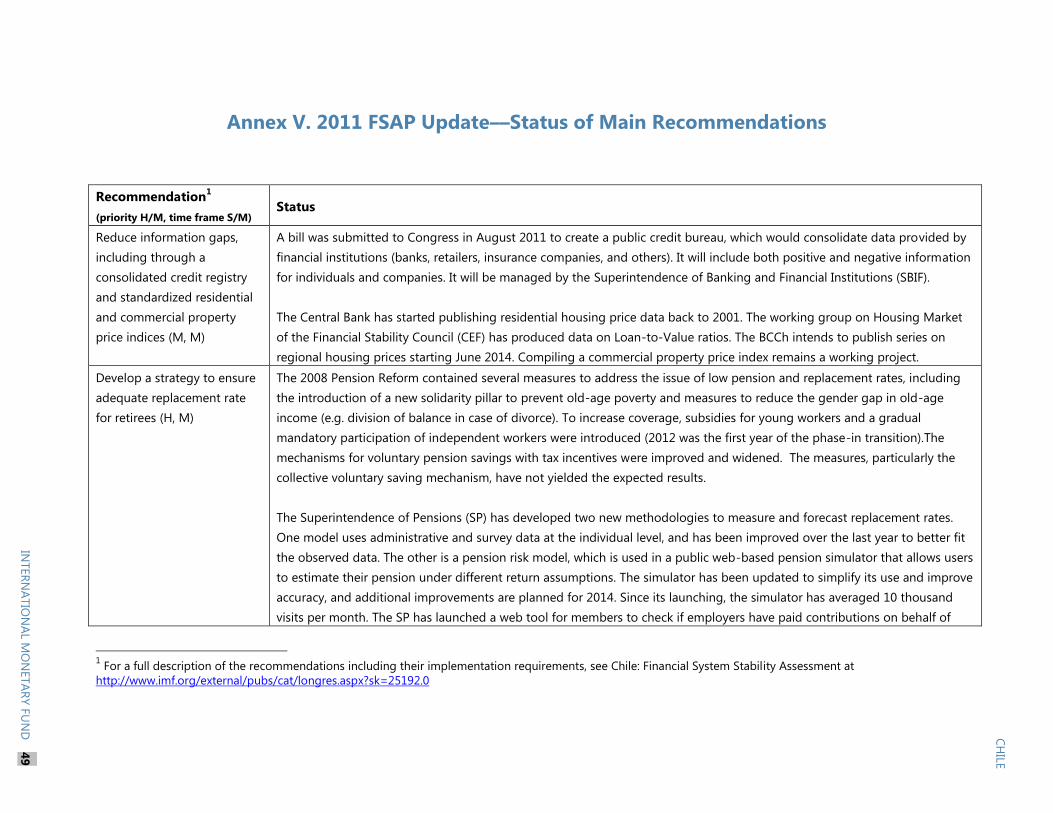
Annex V. 2011 FSAP Update––Status of Main Recommendations
Recommendation1
(priority H/M, time frame S/M) Status
Reduce information gaps,
including through a
consolidated credit registry
and standardized residential
and commercial property
price indices (M, M)
A bill was submitted to Congress in August 2011 to create a public credit bureau, which would consolidate data provided by
financial institutions (banks, retailers, insurance companies, and others). It will include both positive and negative information
for individuals and companies. It will be managed by the Superintendence of Banking and Financial Institutions (SBIF).
The Central Bank has started publishing residential housing price data back to 2001. The working group on Housing Market
of the Financial Stability Council (CEF) has produced data on Loan-to-Value ratios. The BCCh intends to publish series on
regional housing prices starting June 2014. Compiling a commercial property price index remains a working project.
Develop a strategy to ensure
adequate replacement rate
for retirees (H, M)
The 2008 Pension Reform contained several measures to address the issue of low pension and replacement rates, including
the introduction of a new solidarity pillar to prevent old-age poverty and measures to reduce the gender gap in old-age
income (e.g. division of balance in case of divorce). To increase coverage, subsidies for young workers and a gradual
mandatory participation of independent workers were introduced (2012 was the first year of the phase-in transition).The
mechanisms for voluntary pension savings with tax incentives were improved and widened. The measures, particularly the
collective voluntary saving mechanism, have not yielded the expected results.
The Superintendence of Pensions (SP) has developed two new methodologies to measure and forecast replacement rates.
One model uses administrative and survey data at the individual level, and has been improved over the last year to better fit
the observed data. The other is a pension risk model, which is used in a public web-based pension simulator that allows users
to estimate their pension under different return assumptions. The simulator has been updated to simplify its use and improve
accuracy, and additional improvements are planned for 2014. Since its launching, the simulator has averaged 10 thousand
visits per month. The SP has launched a web tool for members to check if employers have paid contributions on behalf of
1 For a full description of the recommendations including their implementation requirements, see Chile: Financial System Stability Assessment at
http://www.imf.org/external/pubs/cat/longres.aspx?sk=25192.0
49
IN
TER
NA
TIO
NA
L MO
NETA
RY F
UN
D
CH
ILE
INTER
NA
TIO
NA
L MO
NETA
RY F
UN
D
49
CH
ILE
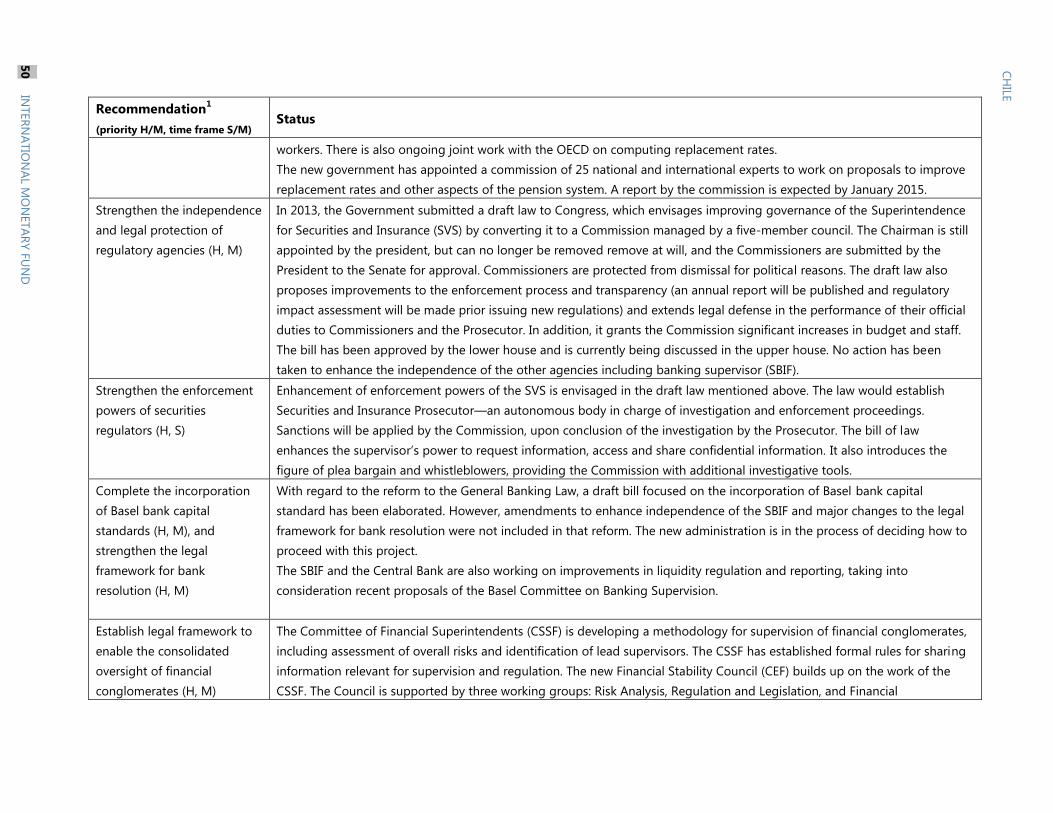
Recommendation1
(priority H/M, time frame S/M) Status
workers. There is also ongoing joint work with the OECD on computing replacement rates.
The new government has appointed a commission of 25 national and international experts to work on proposals to improve
replacement rates and other aspects of the pension system. A report by the commission is expected by January 2015.
Strengthen the independence
and legal protection of
regulatory agencies (H, M)
In 2013, the Government submitted a draft law to Congress, which envisages improving governance of the Superintendence
for Securities and Insurance (SVS) by converting it to a Commission managed by a five-member council. The Chairman is still
appointed by the president, but can no longer be removed remove at will, and the Commissioners are submitted by the
President to the Senate for approval. Commissioners are protected from dismissal for political reasons. The draft law also
proposes improvements to the enforcement process and transparency (an annual report will be published and regulatory
impact assessment will be made prior issuing new regulations) and extends legal defense in the performance of their official
duties to Commissioners and the Prosecutor. In addition, it grants the Commission significant increases in budget and staff.
The bill has been approved by the lower house and is currently being discussed in the upper house. No action has been
taken to enhance the independence of the other agencies including banking supervisor (SBIF).
Strengthen the enforcement
powers of securities
regulators (H, S)
Enhancement of enforcement powers of the SVS is envisaged in the draft law mentioned above. The law would establish
Securities and Insurance Prosecutor—an autonomous body in charge of investigation and enforcement proceedings.
Sanctions will be applied by the Commission, upon conclusion of the investigation by the Prosecutor. The bill of law
enhances the supervisor’s power to request information, access and share confidential information. It also introduces the
figure of plea bargain and whistleblowers, providing the Commission with additional investigative tools.
Complete the incorporation
of Basel bank capital
standards (H, M), and
strengthen the legal
framework for bank
resolution (H, M)
With regard to the reform to the General Banking Law, a draft bill focused on the incorporation of Basel bank capital
standard has been elaborated. However, amendments to enhance independence of the SBIF and major changes to the legal
framework for bank resolution were not included in that reform. The new administration is in the process of deciding how to
proceed with this project.
The SBIF and the Central Bank are also working on improvements in liquidity regulation and reporting, taking into
consideration recent proposals of the Basel Committee on Banking Supervision.
Establish legal framework to
enable the consolidated
oversight of financial
conglomerates (H, M)
The Committee of Financial Superintendents (CSSF) is developing a methodology for supervision of financial conglomerates,
including assessment of overall risks and identification of lead supervisors. The CSSF has established formal rules for sharing
information relevant for supervision and regulation. The new Financial Stability Council (CEF) builds up on the work of the
CSSF. The Council is supported by three working groups: Risk Analysis, Regulation and Legislation, and Financial
CH
ILE
INTER
NA
TIO
NA
L MO
NETA
RY F
UN
D
50
50
IN
TER
NA
TIO
NA
L MO
NETA
RY F
UN
D
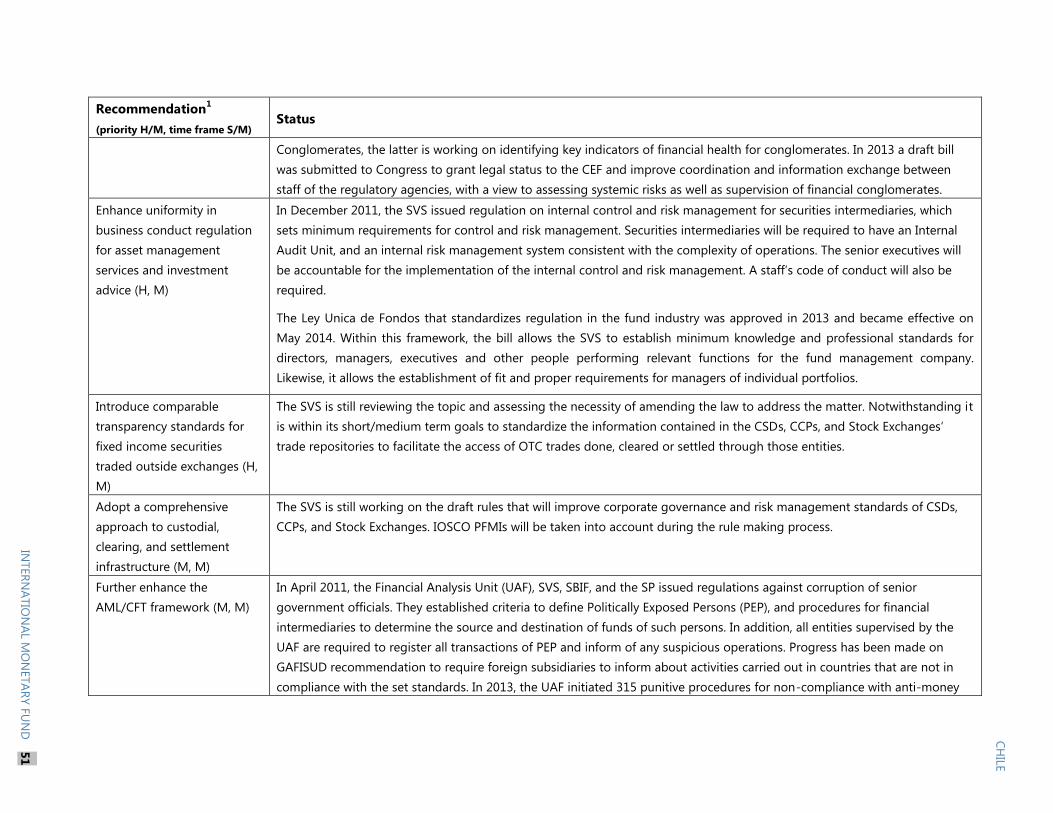
Recommendation1
(priority H/M, time frame S/M) Status
Conglomerates, the latter is working on identifying key indicators of financial health for conglomerates. In 2013 a draft bill
was submitted to Congress to grant legal status to the CEF and improve coordination and information exchange between
staff of the regulatory agencies, with a view to assessing systemic risks as well as supervision of financial conglomerates.
Enhance uniformity in
business conduct regulation
for asset management
services and investment
advice (H, M)
In December 2011, the SVS issued regulation on internal control and risk management for securities intermediaries, which
sets minimum requirements for control and risk management. Securities intermediaries will be required to have an Internal
Audit Unit, and an internal risk management system consistent with the complexity of operations. The senior executives will
be accountable for the implementation of the internal control and risk management. A staff’s code of conduct will also be
required.
The Ley Unica de Fondos that standardizes regulation in the fund industry was approved in 2013 and became effective on
May 2014. Within this framework, the bill allows the SVS to establish minimum knowledge and professional standards for
directors, managers, executives and other people performing relevant functions for the fund management company.
Likewise, it allows the establishment of fit and proper requirements for managers of individual portfolios.
Introduce comparable
transparency standards for
fixed income securities
traded outside exchanges (H,
M)
The SVS is still reviewing the topic and assessing the necessity of amending the law to address the matter. Notwithstanding it
is within its short/medium term goals to standardize the information contained in the CSDs, CCPs, and Stock Exchanges’
trade repositories to facilitate the access of OTC trades done, cleared or settled through those entities.
Adopt a comprehensive
approach to custodial,
clearing, and settlement
infrastructure (M, M)
The SVS is still working on the draft rules that will improve corporate governance and risk management standards of CSDs,
CCPs, and Stock Exchanges. IOSCO PFMIs will be taken into account during the rule making process.
Further enhance the
AML/CFT framework (M, M)
In April 2011, the Financial Analysis Unit (UAF), SVS, SBIF, and the SP issued regulations against corruption of senior
government officials. They established criteria to define Politically Exposed Persons (PEP), and procedures for financial
intermediaries to determine the source and destination of funds of such persons. In addition, all entities supervised by the
UAF are required to register all transactions of PEP and inform of any suspicious operations. Progress has been made on
GAFISUD recommendation to require foreign subsidiaries to inform about activities carried out in countries that are not in
compliance with the set standards. In 2013, the UAF initiated 315 punitive procedures for non-compliance with anti-money
CH
ILE
INTER
NA
TIO
NA
L MO
NETA
RY F
UN
D
51
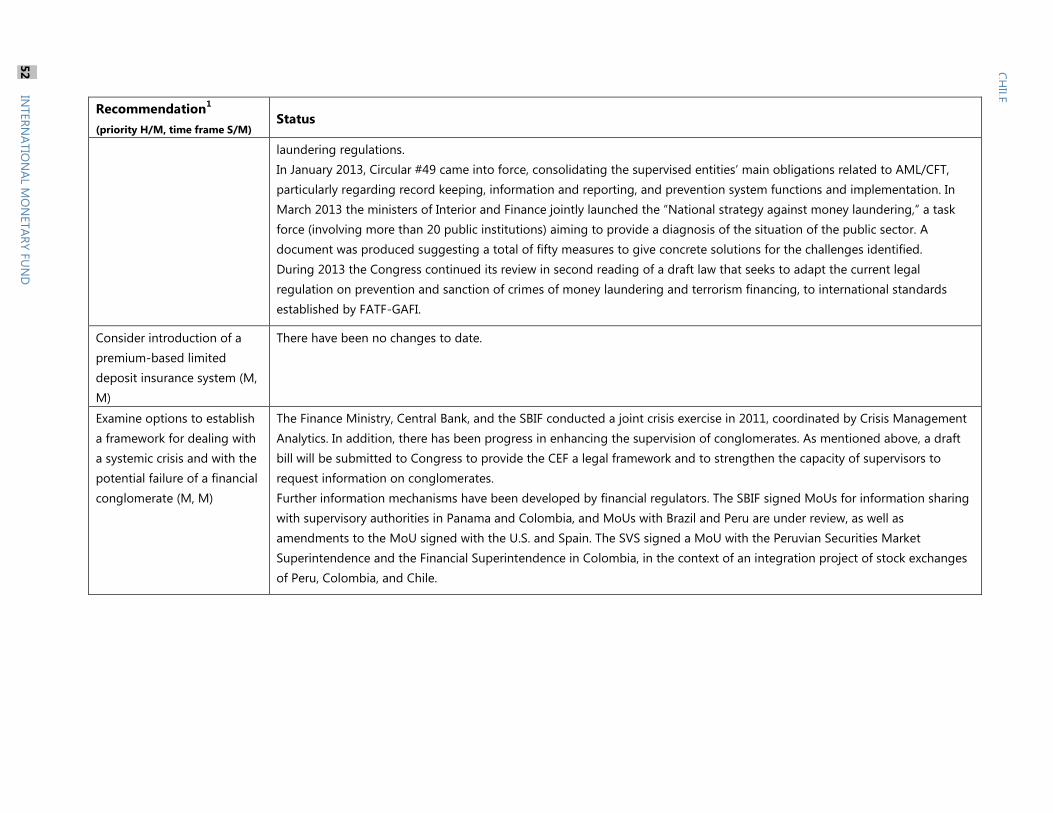
Recommendation1
(priority H/M, time frame S/M) Status
laundering regulations.
In January 2013, Circular #49 came into force, consolidating the supervised entities’ main obligations related to AML/CFT,
particularly regarding record keeping, information and reporting, and prevention system functions and implementation. In
March 2013 the ministers of Interior and Finance jointly launched the “National strategy against money laundering,” a task
force (involving more than 20 public institutions) aiming to provide a diagnosis of the situation of the public sector. A
document was produced suggesting a total of fifty measures to give concrete solutions for the challenges identified.
During 2013 the Congress continued its review in second reading of a draft law that seeks to adapt the current legal
regulation on prevention and sanction of crimes of money laundering and terrorism financing, to international standards
established by FATF-GAFI.
Consider introduction of a
premium-based limited
deposit insurance system (M,
M)
There have been no changes to date.
Examine options to establish
a framework for dealing with
a systemic crisis and with the
potential failure of a financial
conglomerate (M, M)
The Finance Ministry, Central Bank, and the SBIF conducted a joint crisis exercise in 2011, coordinated by Crisis Management
Analytics. In addition, there has been progress in enhancing the supervision of conglomerates. As mentioned above, a draft
bill will be submitted to Congress to provide the CEF a legal framework and to strengthen the capacity of supervisors to
request information on conglomerates.
Further information mechanisms have been developed by financial regulators. The SBIF signed MoUs for information sharing
with supervisory authorities in Panama and Colombia, and MoUs with Brazil and Peru are under review, as well as
amendments to the MoU signed with the U.S. and Spain. The SVS signed a MoU with the Peruvian Securities Market
Superintendence and the Financial Superintendence in Colombia, in the context of an integration project of stock exchanges
of Peru, Colombia, and Chile.
52
IN
TER
NA
TIO
NA
L MO
NETA
RY F
UN
D
CH
ILE
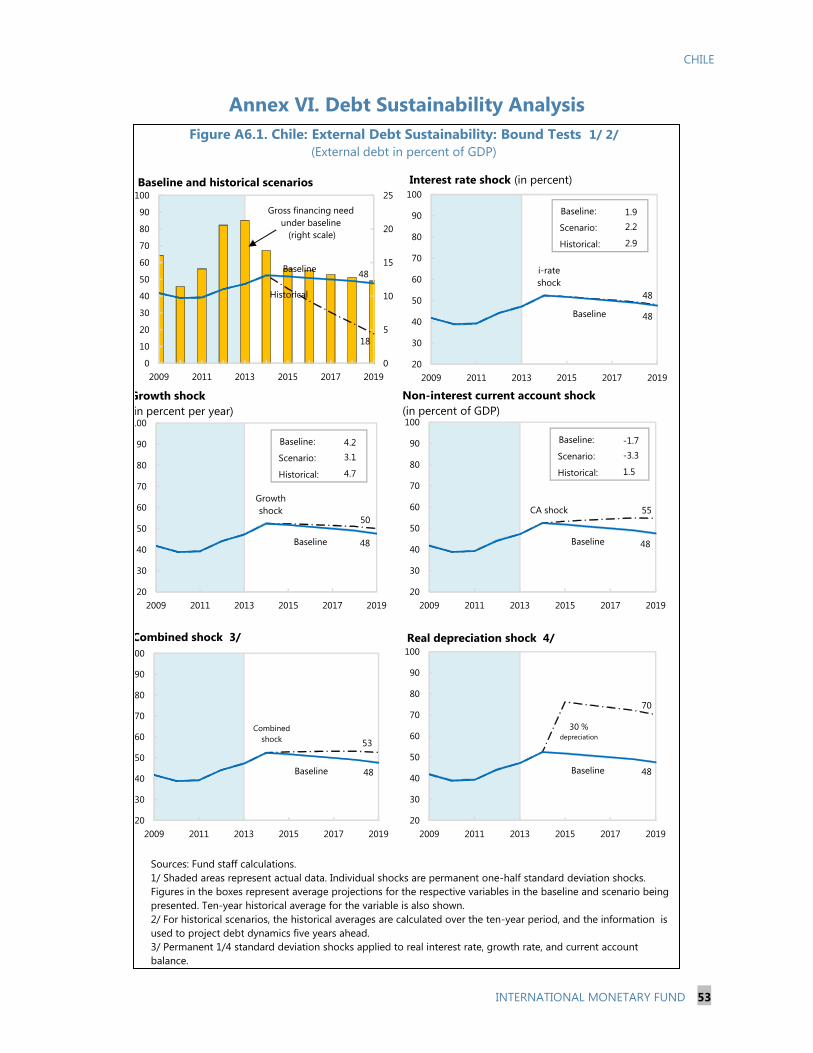
CHILE
INTERNATIONAL MONETARY FUND 53
Annex VI. Debt Sustainability Analysis
i-rate
shock
48
Baseline 48
20
30
40
50
60
70
80
90
100
2009 2011 2013 2015 2017 2019
Interest rate shock (in percent)
Figure A6.1. Chile: External Debt Sustainability: Bound Tests 1/ 2/
(External debt in percent of GDP)
Sources: Fund staff calculations.
1/ Shaded areas represent actual data. Individual shocks are permanent one-half standard deviation shocks.
Figures in the boxes represent average projections for the respective variables in the baseline and scenario being
presented. Ten-year historical average for the variable is also shown.
2/ For historical scenarios, the historical averages are calculated over the ten-year period, and the information is
used to project debt dynamics five years ahead.
3/ Permanent 1/4 standard deviation shocks applied to real interest rate, growth rate, and current account
balance.
4/ One-time real depreciation of 30 percent occurs in 2015.
Historical
18
Baseline48
0
5
10
15
20
25
0
10
20
30
40
50
60
70
80
90
100
2009 2011 2013 2015 2017 2019
Baseline and historical scenarios
CA shock 55
Baseline 48
20
30
40
50
60
70
80
90
100
2009 2011 2013 2015 2017 2019
Combined
shock 53
Baseline 48
20
30
40
50
60
70
80
90
100
2009 2011 2013 2015 2017 2019
Combined shock 3/
30 % depreciation
70
Baseline 48
20
30
40
50
60
70
80
90
100
2009 2011 2013 2015 2017 2019
Real depreciation shock 4/
Gross financing need
under baseline
(right scale)
Non-interest current account shock
(in percent of GDP)
Growth
shock 50
Baseline 48
20
30
40
50
60
70
80
90
100
2009 2011 2013 2015 2017 2019
Baseline:
Scenario:
Historical:
1.9
2.2
2.9
Baseline:
Scenario:
Historical:
4.2
3.1
4.7
Baseline:
Scenario:
Historical:
-1.7
-3.3
1.5
Growth shock
(in percent per year)
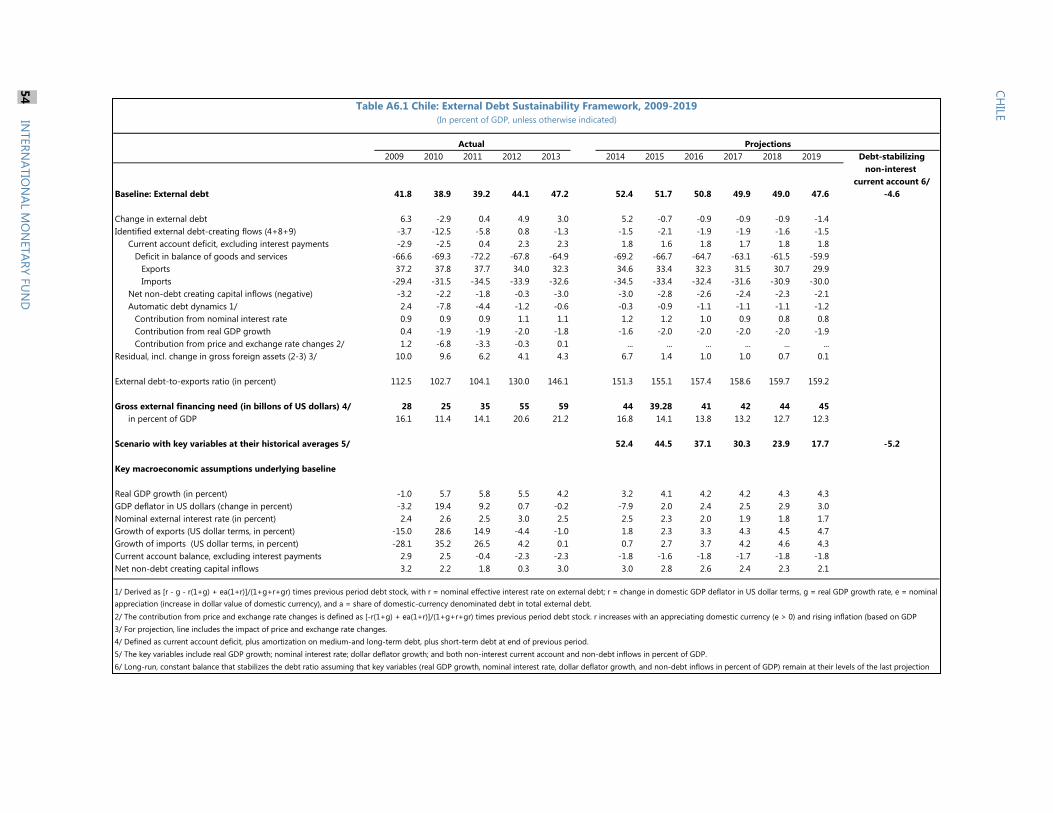
54
IN
TER
NA
TIO
NA
L MO
NETA
RY F
UN
D
CH
ILE
Projections
2009 2010 2011 2012 2013 2014 2015 2016 2017 2018 2019 Debt-stabilizing
non-interest
current account 6/
Baseline: External debt 41.8 38.9 39.2 44.1 47.2 52.4 51.7 50.8 49.9 49.0 47.6 -4.6
Change in external debt 6.3 -2.9 0.4 4.9 3.0 5.2 -0.7 -0.9 -0.9 -0.9 -1.4
Identified external debt-creating flows (4+8+9) -3.7 -12.5 -5.8 0.8 -1.3 -1.5 -2.1 -1.9 -1.9 -1.6 -1.5
Current account deficit, excluding interest payments -2.9 -2.5 0.4 2.3 2.3 1.8 1.6 1.8 1.7 1.8 1.8
Deficit in balance of goods and services -66.6 -69.3 -72.2 -67.8 -64.9 -69.2 -66.7 -64.7 -63.1 -61.5 -59.9
Exports 37.2 37.8 37.7 34.0 32.3 34.6 33.4 32.3 31.5 30.7 29.9
Imports -29.4 -31.5 -34.5 -33.9 -32.6 -34.5 -33.4 -32.4 -31.6 -30.9 -30.0
Net non-debt creating capital inflows (negative) -3.2 -2.2 -1.8 -0.3 -3.0 -3.0 -2.8 -2.6 -2.4 -2.3 -2.1
Automatic debt dynamics 1/ 2.4 -7.8 -4.4 -1.2 -0.6 -0.3 -0.9 -1.1 -1.1 -1.1 -1.2
Contribution from nominal interest rate 0.9 0.9 0.9 1.1 1.1 1.2 1.2 1.0 0.9 0.8 0.8
Contribution from real GDP growth 0.4 -1.9 -1.9 -2.0 -1.8 -1.6 -2.0 -2.0 -2.0 -2.0 -1.9
Contribution from price and exchange rate changes 2/ 1.2 -6.8 -3.3 -0.3 0.1 ... ... ... ... ... ...
Residual, incl. change in gross foreign assets (2-3) 3/ 10.0 9.6 6.2 4.1 4.3 6.7 1.4 1.0 1.0 0.7 0.1
External debt-to-exports ratio (in percent) 112.5 102.7 104.1 130.0 146.1 151.3 155.1 157.4 158.6 159.7 159.2
Gross external financing need (in billons of US dollars) 4/ 28 25 35 55 59 44 39.28 41 42 44 45
in percent of GDP 16.1 11.4 14.1 20.6 21.2 16.8 14.1 13.8 13.2 12.7 12.3
Scenario with key variables at their historical averages 5/ 52.4 44.5 37.1 30.3 23.9 17.7 -5.2
Key macroeconomic assumptions underlying baseline
Real GDP growth (in percent) -1.0 5.7 5.8 5.5 4.2 3.2 4.1 4.2 4.2 4.3 4.3
GDP deflator in US dollars (change in percent) -3.2 19.4 9.2 0.7 -0.2 -7.9 2.0 2.4 2.5 2.9 3.0
Nominal external interest rate (in percent) 2.4 2.6 2.5 3.0 2.5 2.5 2.3 2.0 1.9 1.8 1.7
Growth of exports (US dollar terms, in percent) -15.0 28.6 14.9 -4.4 -1.0 1.8 2.3 3.3 4.3 4.5 4.7
Growth of imports (US dollar terms, in percent) -28.1 35.2 26.5 4.2 0.1 0.7 2.7 3.7 4.2 4.6 4.3
Current account balance, excluding interest payments 2.9 2.5 -0.4 -2.3 -2.3 -1.8 -1.6 -1.8 -1.7 -1.8 -1.8
Net non-debt creating capital inflows 3.2 2.2 1.8 0.3 3.0 3.0 2.8 2.6 2.4 2.3 2.1
3/ For projection, line includes the impact of price and exchange rate changes.
4/ Defined as current account deficit, plus amortization on medium-and long-term debt, plus short-term debt at end of previous period.
5/ The key variables include real GDP growth; nominal interest rate; dollar deflator growth; and both non-interest current account and non-debt inflows in percent of GDP.
6/ Long-run, constant balance that stabilizes the debt ratio assuming that key variables (real GDP growth, nominal interest rate, dollar deflator growth, and non-debt inflows in percent of GDP) remain at their levels of the last projection
2/ The contribution from price and exchange rate changes is defined as [-r(1+g) + ea(1+r)]/(1+g+r+gr) times previous period debt stock. r increases with an appreciating domestic currency (e > 0) and rising inflation (based on GDP
Actual
Table A6.1 Chile: External Debt Sustainability Framework, 2009-2019
(In percent of GDP, unless otherwise indicated)
1/ Derived as [r - g - r(1+g) + ea(1+r)]/(1+g+r+gr) times previous period debt stock, with r = nominal effective interest rate on external debt; r = change in domestic GDP deflator in US dollar terms, g = real GDP growth rate, e = nominal
appreciation (increase in dollar value of domestic currency), and a = share of domestic-currency denominated debt in total external debt.
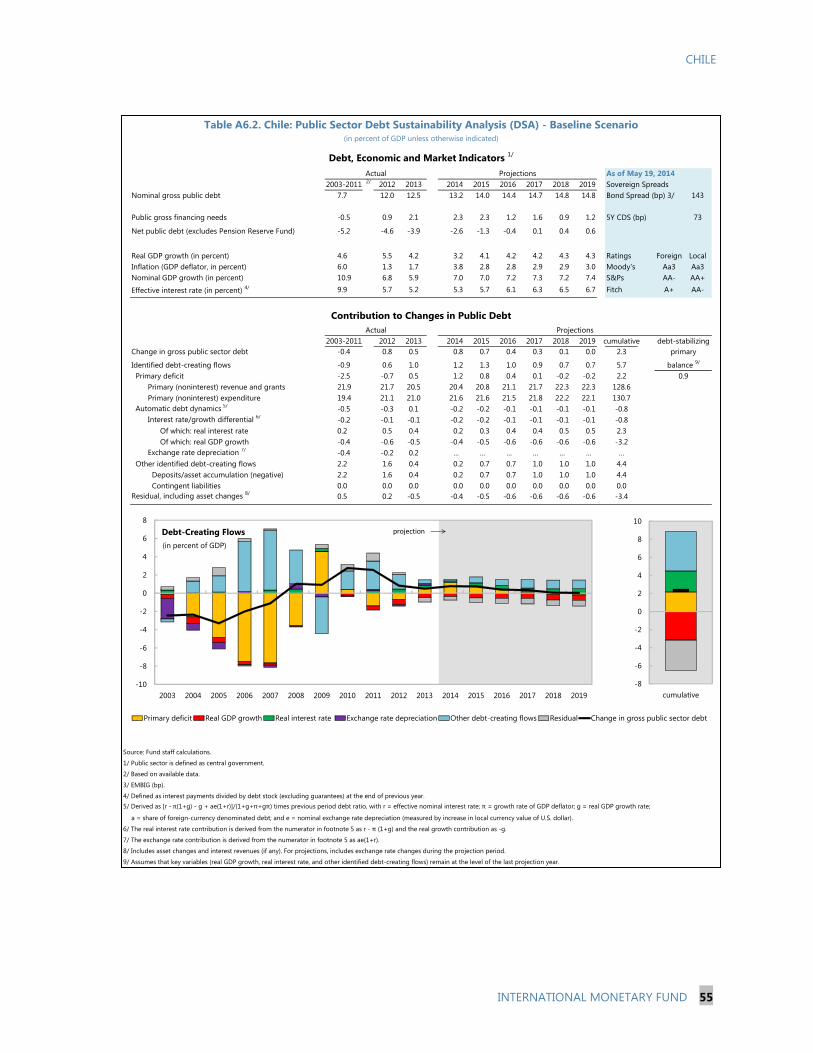
CHILE
INTERNATIONAL MONETARY FUND 55
As of May 19, 20142/
2012 2013 2014 2015 2016 2017 2018 2019 Sovereign Spreads
Nominal gross public debt 7.7 12.0 12.5 13.2 14.0 14.4 14.7 14.8 14.8 Bond Spread (bp) 3/ 143
Public gross financing needs -0.5 0.9 2.1 2.3 2.3 1.2 1.6 0.9 1.2 5Y CDS (bp) 73
Net public debt (excludes Pension Reserve Fund) -5.2 -4.6 -3.9 -2.6 -1.3 -0.4 0.1 0.4 0.6
Real GDP growth (in percent) 4.6 5.5 4.2 3.2 4.1 4.2 4.2 4.3 4.3 Ratings Foreign Local
Inflation (GDP deflator, in percent) 6.0 1.3 1.7 3.8 2.8 2.8 2.9 2.9 3.0 Moody's Aa3 Aa3
Nominal GDP growth (in percent) 10.9 6.8 5.9 7.0 7.0 7.2 7.3 7.2 7.4 S&Ps AA- AA+
Effective interest rate (in percent) 4/ 9.9 5.7 5.2 5.3 5.7 6.1 6.3 6.5 6.7 Fitch A+ AA-
2012 2013 2014 2015 2016 2017 2018 2019 cumulative
Change in gross public sector debt -0.4 0.8 0.5 0.8 0.7 0.4 0.3 0.1 0.0 2.3
Identified debt-creating flows -0.9 0.6 1.0 1.2 1.3 1.0 0.9 0.7 0.7 5.7
Primary deficit -2.5 -0.7 0.5 1.2 0.8 0.4 0.1 -0.2 -0.2 2.2
Primary (noninterest) revenue and grants 21.9 21.7 20.5 20.4 20.8 21.1 21.7 22.3 22.3 128.6
Primary (noninterest) expenditure 19.4 21.1 21.0 21.6 21.6 21.5 21.8 22.2 22.1 130.7
Automatic debt dynamics 5/
-0.5 -0.3 0.1 -0.2 -0.2 -0.1 -0.1 -0.1 -0.1 -0.8
Interest rate/growth differential 6/
-0.2 -0.1 -0.1 -0.2 -0.2 -0.1 -0.1 -0.1 -0.1 -0.8
Of which: real interest rate 0.2 0.5 0.4 0.2 0.3 0.4 0.4 0.5 0.5 2.3
Of which: real GDP growth -0.4 -0.6 -0.5 -0.4 -0.5 -0.6 -0.6 -0.6 -0.6 -3.2
Exchange rate depreciation 7/
-0.4 -0.2 0.2 … … … … … … …
Other identified debt-creating flows 2.2 1.6 0.4 0.2 0.7 0.7 1.0 1.0 1.0 4.4
Deposits/asset accumulation (negative) 2.2 1.6 0.4 0.2 0.7 0.7 1.0 1.0 1.0 4.4
Contingent liabilities 0.0 0.0 0.0 0.0 0.0 0.0 0.0 0.0 0.0 0.0
Residual, including asset changes 8/
0.5 0.2 -0.5 -0.4 -0.5 -0.6 -0.6 -0.6 -0.6 -3.4
Source: Fund staff calculations.
1/ Public sector is defined as central government.
2/ Based on available data.
3/ EMBIG (bp).
4/ Defined as interest payments divided by debt stock (excluding guarantees) at the end of previous year.
5/ Derived as [r - π(1+g) - g + ae(1+r)]/(1+g+π+gπ) times previous period debt ratio, with r = effective nominal interest rate; π = growth rate of GDP deflator; g = real GDP growth rate;
a = share of foreign-currency denominated debt; and e = nominal exchange rate depreciation (measured by increase in local currency value of U.S. dollar).
6/ The real interest rate contribution is derived from the numerator in footnote 5 as r - π (1+g) and the real growth contribution as -g.
7/ The exchange rate contribution is derived from the numerator in footnote 5 as ae(1+r).
8/ Includes asset changes and interest revenues (if any). For projections, includes exchange rate changes during the projection period.
9/ Assumes that key variables (real GDP growth, real interest rate, and other identified debt-creating flows) remain at the level of the last projection year.
Table A6.2. Chile: Public Sector Debt Sustainability Analysis (DSA) - Baseline Scenario
0.9
balance 9/
primary
(in percent of GDP unless otherwise indicated)
Debt, Economic and Market Indicators 1/
2003-2011
Actual
Projections
Contribution to Changes in Public Debt
Projections
2003-2011
Actual
debt-stabilizing
-10
-8
-6
-4
-2
0
2
4
6
8
2003 2004 2005 2006 2007 2008 2009 2010 2011 2012 2013 2014 2015 2016 2017 2018 2019
Debt-Creating Flows
Primary deficit Real GDP growth Real interest rate Exchange rate depreciation Other debt-creating flows Residual Change in gross public sector debt
projection
(in percent of GDP)
-8
-6
-4
-2
0
2
4
6
8
10
cumulative
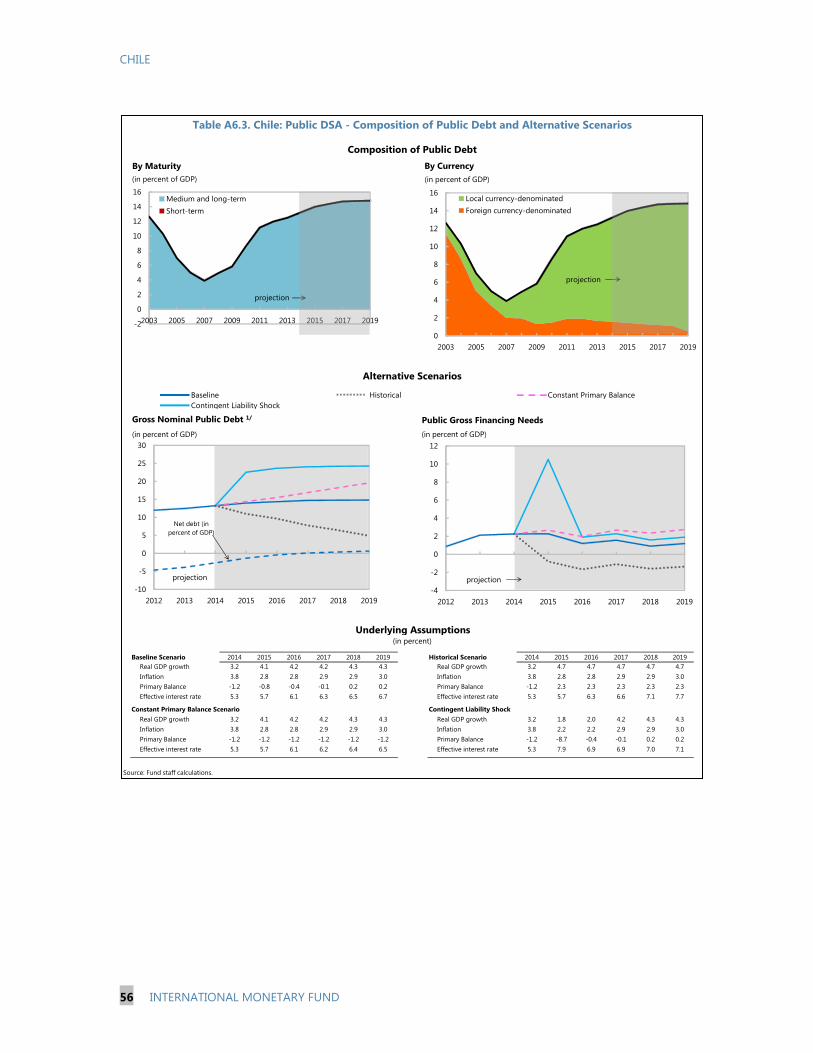
CHILE
56 INTERNATIONAL MONETARY FUND
Baseline Scenario 2014 2015 2016 2017 2018 2019 Historical Scenario 2014 2015 2016 2017 2018 2019
Real GDP growth 3.2 4.1 4.2 4.2 4.3 4.3 Real GDP growth 3.2 4.7 4.7 4.7 4.7 4.7
Inflation 3.8 2.8 2.8 2.9 2.9 3.0 Inflation 3.8 2.8 2.8 2.9 2.9 3.0
Primary Balance -1.2 -0.8 -0.4 -0.1 0.2 0.2 Primary Balance -1.2 2.3 2.3 2.3 2.3 2.3
Effective interest rate 5.3 5.7 6.1 6.3 6.5 6.7 Effective interest rate 5.3 5.7 6.3 6.6 7.1 7.7
Constant Primary Balance Scenario Contingent Liability Shock
Real GDP growth 3.2 4.1 4.2 4.2 4.3 4.3 Real GDP growth 3.2 1.8 2.0 4.2 4.3 4.3
Inflation 3.8 2.8 2.8 2.9 2.9 3.0 Inflation 3.8 2.2 2.2 2.9 2.9 3.0
Primary Balance -1.2 -1.2 -1.2 -1.2 -1.2 -1.2 Primary Balance -1.2 -8.7 -0.4 -0.1 0.2 0.2
Effective interest rate 5.3 5.7 6.1 6.2 6.4 6.5 Effective interest rate 5.3 7.9 6.9 6.9 7.0 7.1
Source: Fund staff calculations.
Underlying Assumptions(in percent)
Table A6.3. Chile: Public DSA - Composition of Public Debt and Alternative Scenarios
Alternative Scenarios
Composition of Public Debt
Contingent Liability Shock
Baseline Historical Constant Primary Balance
Net debt (in
percent of GDP)
-10
-5
0
5
10
15
20
25
30
2012 2013 2014 2015 2016 2017 2018 2019
Gross Nominal Public Debt 1/
(in percent of GDP)
projection
-4
-2
0
2
4
6
8
10
12
2012 2013 2014 2015 2016 2017 2018 2019
Public Gross Financing Needs
(in percent of GDP)
projection
-2
0
2
4
6
8
10
12
14
16
2003 2005 2007 2009 2011 2013 2015 2017 2019
By Maturity
Medium and long-term
Short-term
projection
(in percent of GDP)
0
2
4
6
8
10
12
14
16
2003 2005 2007 2009 2011 2013 2015 2017 2019
By Currency
Local currency-denominated
Foreign currency-denominated
projection
(in percent of GDP)
CHILE
STAFF REPORT FOR THE 2014 ARTICLE IV
CONSULTATION—INFORMATIONAL ANNEX
Prepared By
The Western Hemisphere Department
FUND RELATIONS _______________________________________________________________________ 2
STATISTICAL ISSUES ____________________________________________________________________ 3
WORLD BANK—FUND COUNTRY-LEVEL WORK PROGRAM UNDER JMAP ___________ 5
CONTENTS
June 11, 2014
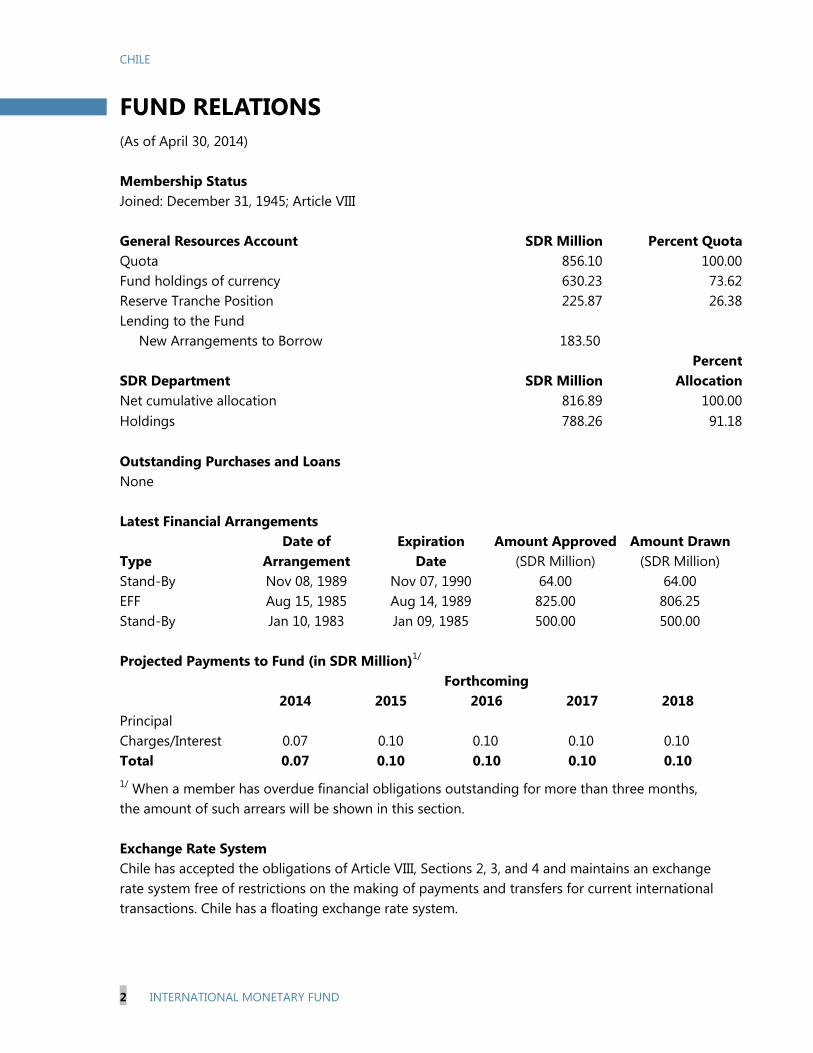
CHILE
2 INTERNATIONAL MONETARY FUND
FUND RELATIONS
(As of April 30, 2014)
Membership Status
Joined: December 31, 1945; Article VIII
General Resources Account SDR Million Percent Quota
Quota 856.10 100.00
Fund holdings of currency 630.23 73.62
Reserve Tranche Position 225.87 26.38
Lending to the Fund
New Arrangements to Borrow 183.50
Percent
SDR Department SDR Million Allocation
Net cumulative allocation 816.89 100.00
Holdings 788.26 91.18
Outstanding Purchases and Loans
None
Latest Financial Arrangements
Date of Expiration Amount Approved Amount Drawn
Type Arrangement Date (SDR Million) (SDR Million)
Stand-By Nov 08, 1989 Nov 07, 1990 64.00 64.00
EFF Aug 15, 1985 Aug 14, 1989 825.00 806.25
Stand-By Jan 10, 1983 Jan 09, 1985 500.00 500.00
Projected Payments to Fund (in SDR Million)1/
Forthcoming
2014 2015 2016 2017 2018
Principal
Charges/Interest 0.07 0.10 0.10 0.10 0.10
Total 0.07 0.10 0.10 0.10 0.10
1/ When a member has overdue financial obligations outstanding for more than three months,
the amount of such arrears will be shown in this section.
Exchange Rate System
Chile has accepted the obligations of Article VIII, Sections 2, 3, and 4 and maintains an exchange
rate system free of restrictions on the making of payments and transfers for current international
transactions. Chile has a floating exchange rate system.
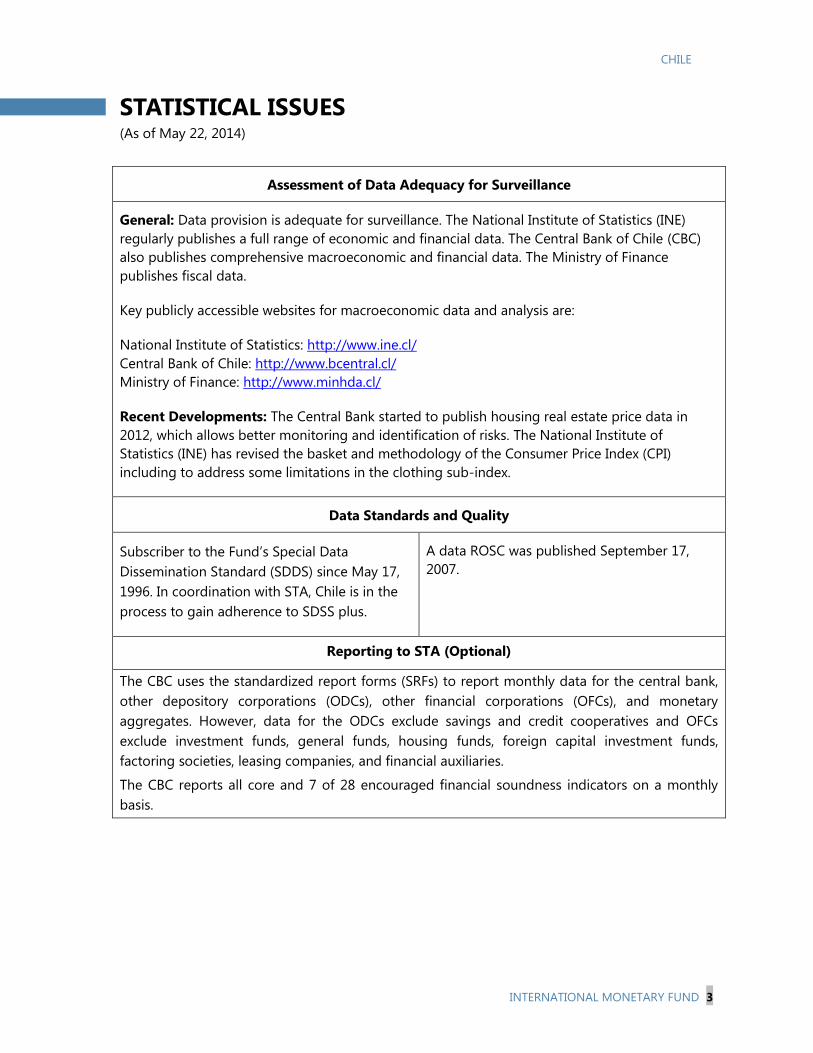
CHILE
INTERNATIONAL MONETARY FUND 3
STATISTICAL ISSUES (As of May 22, 2014)
Assessment of Data Adequacy for Surveillance
General: Data provision is adequate for surveillance. The National Institute of Statistics (INE)
regularly publishes a full range of economic and financial data. The Central Bank of Chile (CBC)
also publishes comprehensive macroeconomic and financial data. The Ministry of Finance
publishes fiscal data.
Key publicly accessible websites for macroeconomic data and analysis are:
National Institute of Statistics: http://www.ine.cl/
Central Bank of Chile: http://www.bcentral.cl/
Ministry of Finance: http://www.minhda.cl/
Recent Developments: The Central Bank started to publish housing real estate price data in
2012, which allows better monitoring and identification of risks. The National Institute of
Statistics (INE) has revised the basket and methodology of the Consumer Price Index (CPI)
including to address some limitations in the clothing sub-index.
Data Standards and Quality
Subscriber to the Fund’s Special Data
Dissemination Standard (SDDS) since May 17,
1996. In coordination with STA, Chile is in the
process to gain adherence to SDSS plus.
A data ROSC was published September 17,
2007.
Reporting to STA (Optional)
The CBC uses the standardized report forms (SRFs) to report monthly data for the central bank,
other depository corporations (ODCs), other financial corporations (OFCs), and monetary
aggregates. However, data for the ODCs exclude savings and credit cooperatives and OFCs
exclude investment funds, general funds, housing funds, foreign capital investment funds,
factoring societies, leasing companies, and financial auxiliaries.
The CBC reports all core and 7 of 28 encouraged financial soundness indicators on a monthly
basis.
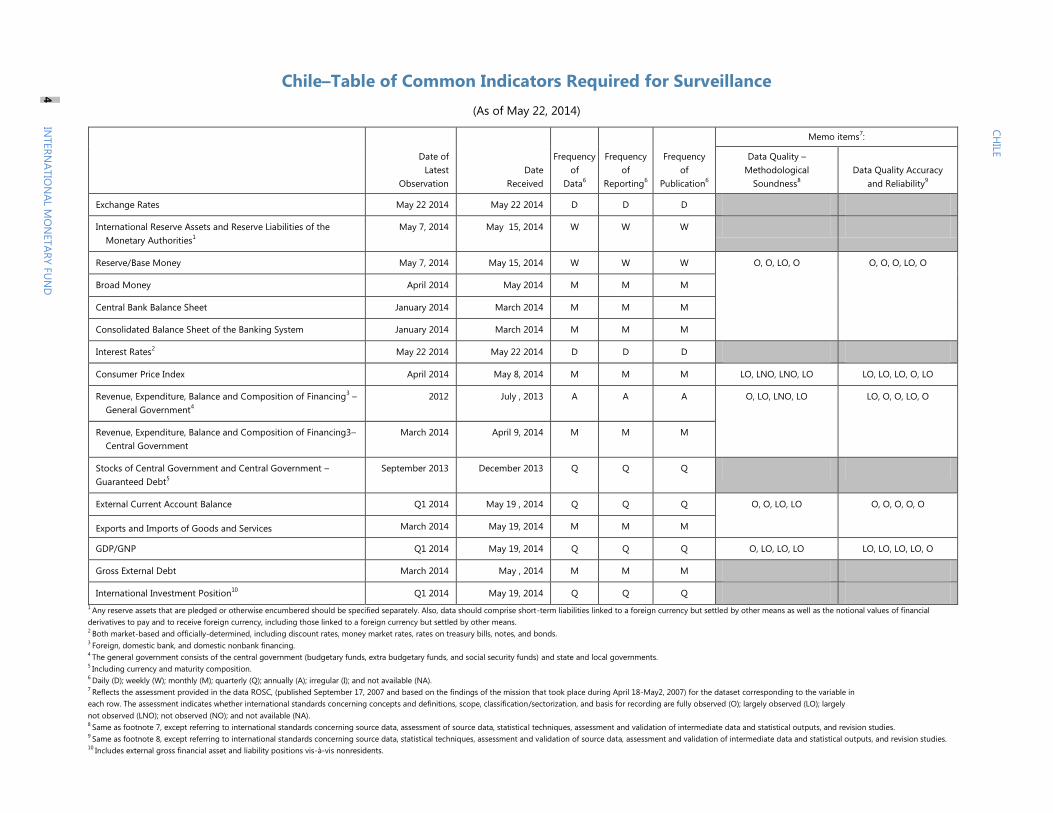
C
HILE
Chile–Table of Common Indicators Required for Surveillance
(As of May 22, 2014)
Date of
Latest
Observation
Date
Received
Frequency
of
Data6
Frequency
of
Reporting6
Frequency
of
Publication6
Memo items7:
Data Quality –
Methodological
Soundness8
Data Quality Accuracy
and Reliability9
Exchange Rates May 22 2014 May 22 2014 D D D
International Reserve Assets and Reserve Liabilities of the
Monetary Authorities1
May 7, 2014 May 15, 2014 W W W
Reserve/Base Money May 7, 2014 May 15, 2014 W W W O, O, LO, O O, O, O, LO, O
Broad Money April 2014 May 2014 M M M
Central Bank Balance Sheet January 2014 March 2014 M M M
Consolidated Balance Sheet of the Banking System January 2014 March 2014 M M M
Interest Rates2
May 22 2014 May 22 2014 D D D
Consumer Price Index April 2014 May 8, 2014 M M M LO, LNO, LNO, LO LO, LO, LO, O, LO
Revenue, Expenditure, Balance and Composition of Financing3 –
General Government4
2012 July , 2013 A A A O, LO, LNO, LO LO, O, O, LO, O
Revenue, Expenditure, Balance and Composition of Financing3–
Central Government
March 2014 April 9, 2014 M M M
Stocks of Central Government and Central Government –
Guaranteed Debt5
September 2013 December 2013 Q Q Q
External Current Account Balance Q1 2014 May 19 , 2014 Q Q Q O, O, LO, LO O, O, O, O, O
Exports and Imports of Goods and Services March 2014 May 19, 2014 M M M
GDP/GNP Q1 2014 May 19, 2014 Q Q Q O, LO, LO, LO LO, LO, LO, LO, O
Gross External Debt
March 2014 May , 2014 M M M
International Investment Position10
Q1 2014 May 19, 2014 Q Q Q
1 Any reserve assets that are pledged or otherwise encumbered should be specified separately. Also, data should comprise short-term liabilities linked to a foreign currency but settled by other means as well as the notional values of financial
derivatives to pay and to receive foreign currency, including those linked to a foreign currency but settled by other means.
2 Both market-based and officially-determined, including discount rates, money market rates, rates on treasury bills, notes, and bonds.
3 Foreign, domestic bank, and domestic nonbank financing.
4 The general government consists of the central government (budgetary funds, extra budgetary funds, and social security funds) and state and local governments.
5 Including currency and maturity composition.
6 Daily (D); weekly (W); monthly (M); quarterly (Q); annually (A); irregular (I); and not available (NA).
7 Reflects the assessment provided in the data ROSC, (published September 17, 2007 and based on the findings of the mission that took place during April 18-May2, 2007) for the dataset corresponding to the variable in
each row. The assessment indicates whether international standards concerning concepts and definitions, scope, classification/sectorization, and basis for recording are fully observed (O); largely observed (LO); largely
not observed (LNO); not observed (NO); and not available (NA). 8 Same as footnote 7, except referring to international standards concerning source data, assessment of source data, statistical techniques, assessment and validation of intermediate data and statistical outputs, and revision studies.
9 Same as footnote 8, except referring to international standards concerning source data, statistical techniques, assessment and validation of source data, assessment and validation of intermediate data and statistical outputs, and revision studies.
10 Includes external gross financial asset and liability positions vis-à-vis nonresidents.
4
INTER
NA
TIO
NA
L M
ON
ETA
RY
FU
ND
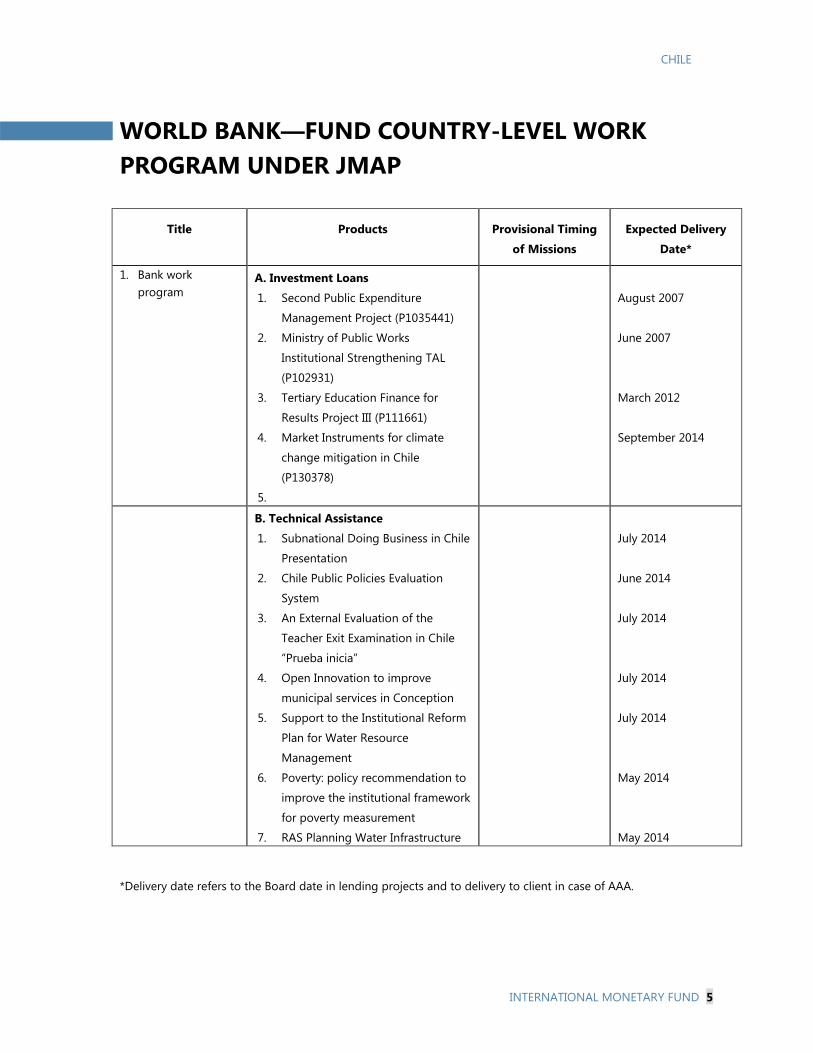
CHILE
INTERNATIONAL MONETARY FUND 5
WORLD BANK—FUND COUNTRY-LEVEL WORK
PROGRAM UNDER JMAP
Title Products Provisional Timing
of Missions
Expected Delivery
Date*
1. Bank work
program
A. Investment Loans
1. Second Public Expenditure
Management Project (P1035441)
2. Ministry of Public Works
Institutional Strengthening TAL
(P102931)
3. Tertiary Education Finance for
Results Project III (P111661)
4. Market Instruments for climate
change mitigation in Chile
(P130378)
5.
August 2007
June 2007
March 2012
September 2014
B. Technical Assistance
1. Subnational Doing Business in Chile
Presentation
2. Chile Public Policies Evaluation
System
3. An External Evaluation of the
Teacher Exit Examination in Chile
“Prueba inicia”
4. Open Innovation to improve
municipal services in Conception
5. Support to the Institutional Reform
Plan for Water Resource
Management
6. Poverty: policy recommendation to
improve the institutional framework
for poverty measurement
7. RAS Planning Water Infrastructure
July 2014
June 2014
July 2014
July 2014
July 2014
May 2014
May 2014
*Delivery date refers to the Board date in lending projects and to delivery to client in case of AAA.
Press Release No. 14/357
FOR IMMEDIATE RELEASE
July 22, 2014
IMF Executive Board Concludes 2014 Article IV Consultation with Chile
On June, 27, 2014, the Executive Board of the International Monetary Fund (IMF) concluded the
Article IV consultation1 with Chile.
Chile is confronting a challenging macroeconomic environment. After several years of strong
economic performance, Chile’s investment has weakened and growth slowed markedly due in
part to a weaker copper price outlook, with the economy performing slightly below potential. At
the same time, the depreciation of the peso has fed into higher inflation, but medium-term
expectations remain anchored around the Central Bank’s target. The current account deficit has
narrowed rapidly to 3.1 percent of GDP in the first quarter of 2014, but gross external financing
needs, though smaller than in 2013, remain high at 17 percent of GDP. The labor market—albeit
still tight—has softened.
Monetary policy has eased; fiscal policy has stayed broadly neutral. The central bank reduced the
policy rate from 5 to 4 percent between October 2013 and April 2014 amid a weakening
economic outlook and inflation below target. The cuts have been transmitted to interbank and
lending rates and contributed to peso depreciation. Nonetheless, credit growth has moderated for
all types of credit, except for mortgage credit, which remains brisk. The 2013 structural deficit
was 0.8 percent of GDP (staff estimate). The fall in copper revenue shifted the headline balance
to a deficit of 0.6 percent of GDP from a surplus of equal size in 2012. However, central
government net assets remained at 6.7 percent of GDP.
Growth is expected to bottom out in 2014 and gradually return to trend. Growth will reach 3.2
percent in 2014 and recover to its potential level by 2016, supported by monetary easing, the
peso depreciation, and recovery in the global economy. Key risks to the outlook stem from the
potential of further declines in copper prices and global financial volatility. Although there are
signs that investment is stabilizing and could pick up later in the year, consumption of durable
1 Under Article IV of the IMF's Articles of Agreement, the IMF holds bilateral discussions with members, usually
every year. A staff team visits the country, collects economic and financial information, and discusses with officials
the country's economic developments and policies. On return to headquarters, the staff prepares a report, which
forms the basis for discussion by the Executive Board.
International Monetary Fund
700 19th
Street, NW
Washington, D. C. 20431 USA
2
goods has declined and further weakening cannot be ruled out. Net exports should continue to
provide a boost to the recovery.
The government has launched an ambitious policy agenda to bolster long-term growth and
reduce inequality. It includes important reforms in taxation, education, productivity, and energy.
The authorities’ tax reform aims to create a more progressive tax structure and raise 3 percent of
GDP in revenue to fund greater spending on education and health, while raising public savings.
The education reform focuses on early childhood education, and fostering equal access and
improving quality and accountability in education. The energy agenda aims to promote
investment and efficiency and facilitate the use of clean technologies. The authorities’ plans to
bolster competitiveness include improving infrastructure, promoting research and development
and job training, and providing new services for small and medium-enterprises.
The financial sector is large, but risks are contained. Financial system assets exceed 200 percent
of GDP. Bank capitalization appears adequate, profitability remains comfortable, and
nonperforming loans are low and fully provisioned. Life insurers’ growing exposure to
commercial real estate merits watching, but stress tests do not show significant concerns.
Investment returns of the private pension system have declined, and the government has
appointed a commission to propose parametric changes to ensure adequate replacement rates.
The authorities have sent to congress legislation that establishes risk-based insurance supervision
and a comprehensive credit registry, and strengthens the legal framework of the Securities and
Insurance Supervisor and the Financial Stability Council.
Executive Board Assessment2
Executive Directors commended the authorities for their sound macroeconomic management,
which has contributed to Chile’s robust economic performance in recent years. At the same time,
Directors noted that the end of the copper price boom and the normalization of global monetary
conditions pose challenges to the growth outlook. They acknowledged, however, that Chile, with
its strong fundamentals and policy frameworks, including a floating exchange rate, is well placed
to cope with these challenges.
Directors agreed that the current macroeconomic policy mix is broadly appropriate. They
concurred that, with inflation expectations well anchored and some remaining slack in the
economy, monetary policy can remain accommodative although continued vigilance is needed in
light of recent inflation developments. Directors supported a broadly neutral stance of fiscal
policy, with full operation of automatic stabilizers. They welcomed the authorities’ commitment
to move toward a balanced structural fiscal position by 2018 while minimizing the drag on the
recovery.
2 At the conclusion of the discussion, the Managing Director, as Chairman of the Board, summarizes the views of
Executive Directors, and this summary is transmitted to the country's authorities. An explanation of any qualifiers
used in summings up can be found here: http://www.imf.org/external/np/sec/misc/qualifiers.htm.
3
Directors emphasized the need for structural reforms to strengthen prospects for strong and
inclusive growth. They agreed with the authorities’ focus on improving education, fostering
female labor force participation, upgrading key infrastructure, and promoting energy efficiency.
Directors also supported the tax reform’s objectives of increasing progressivity and generating
permanent revenue to finance additional social spending, while maintaining incentives for
private investment.
Directors commended the authorities for their track record of fiscal prudence, anchored in a
credible fiscal rule. They welcomed the plan to strengthen the legal framework for the Fiscal
Council, noting that consideration could be given in the medium term to increase its autonomy
and broaden its mandate. In due course, further refinements to the rule-based fiscal framework
could also be considered. Directors saw the benefits of setting a small structural surplus target
over the cycle in preserving adequate buffers.
Directors recognized the progress in enhancing financial sector oversight and the resilience of
the financial system, and looked forward to full implementation of the recommendations from
the Financial Sector Assessment Program. They underscored the importance of focusing efforts
on completing legislative initiatives, aligning capital standards with Basel III, and strengthening
the independence of the Supervisor of Banks and Financial Institutions. The dominant role of
financial conglomerates in the financial system also calls for a more consolidated approach to
their oversight. Directors encouraged close monitoring of corporate leverage, the real estate
sector, and the growing exposure of insurance companies to commercial real estate.
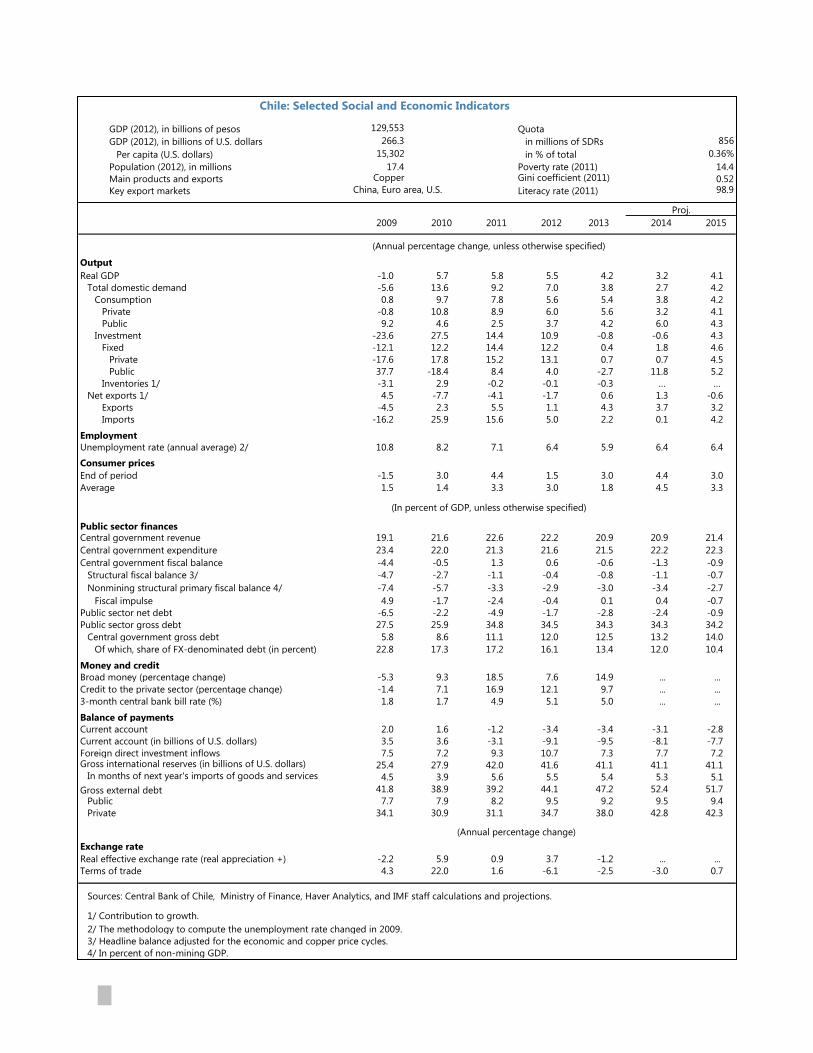
GDP (2012), in billions of pesos 129,553 Quota
GDP (2012), in billions of U.S. dollars 266.3 in millions of SDRs 856
Per capita (U.S. dollars) 15,302 in % of total 0.36%
Population (2012), in millions 17.4 Poverty rate (2011) 14.4
Main products and exports Copper Gini coefficient (2011) 0.52
Key export markets China, Euro area, U.S. Literacy rate (2011) 98.9
2009 2010 2011 2012 2013 2014 2015
Output
Real GDP -1.0 5.7 5.8 5.5 4.2 3.2 4.1
Total domestic demand -5.6 13.6 9.2 7.0 3.8 2.7 4.2
Consumption 0.8 9.7 7.8 5.6 5.4 3.8 4.2
Private -0.8 10.8 8.9 6.0 5.6 3.2 4.1
Public 9.2 4.6 2.5 3.7 4.2 6.0 4.3
Investment -23.6 27.5 14.4 10.9 -0.8 -0.6 4.3
Fixed -12.1 12.2 14.4 12.2 0.4 1.8 4.6
Private -17.6 17.8 15.2 13.1 0.7 0.7 4.5
Public 37.7 -18.4 8.4 4.0 -2.7 11.8 5.2
Inventories 1/ -3.1 2.9 -0.2 -0.1 -0.3 … …
Net exports 1/ 4.5 -7.7 -4.1 -1.7 0.6 1.3 -0.6
Exports -4.5 2.3 5.5 1.1 4.3 3.7 3.2
Imports -16.2 25.9 15.6 5.0 2.2 0.1 4.2
Employment
Unemployment rate (annual average) 2/ 10.8 8.2 7.1 6.4 5.9 6.4 6.4
Consumer prices
End of period -1.5 3.0 4.4 1.5 3.0 4.4 3.0
Average 1.5 1.4 3.3 3.0 1.8 4.5 3.3
Public sector finances
Central government revenue 19.1 21.6 22.6 22.2 20.9 20.9 21.4
Central government expenditure 23.4 22.0 21.3 21.6 21.5 22.2 22.3
Central government fiscal balance -4.4 -0.5 1.3 0.6 -0.6 -1.3 -0.9
Structural fiscal balance 3/ -4.7 -2.7 -1.1 -0.4 -0.8 -1.1 -0.7
Nonmining structural primary fiscal balance 4/ -7.4 -5.7 -3.3 -2.9 -3.0 -3.4 -2.7
Fiscal impulse 4.9 -1.7 -2.4 -0.4 0.1 0.4 -0.7
Public sector net debt -6.5 -2.2 -4.9 -1.7 -2.8 -2.4 -0.9
Public sector gross debt 27.5 25.9 34.8 34.5 34.3 34.3 34.2
Central government gross debt 5.8 8.6 11.1 12.0 12.5 13.2 14.0
Of which, share of FX-denominated debt (in percent) 22.8 17.3 17.2 16.1 13.4 12.0 10.4
Money and credit
Broad money (percentage change) -5.3 9.3 18.5 7.6 14.9 ... ...
Credit to the private sector (percentage change) -1.4 7.1 16.9 12.1 9.7 ... ...
3-month central bank bill rate (%) 1.8 1.7 4.9 5.1 5.0 ... ...
Balance of payments
Current account 2.0 1.6 -1.2 -3.4 -3.4 -3.1 -2.8
Current account (in billions of U.S. dollars) 3.5 3.6 -3.1 -9.1 -9.5 -8.1 -7.7
Foreign direct investment inflows 7.5 7.2 9.3 10.7 7.3 7.7 7.2 Gross international reserves (in billions of U.S. dollars) 25.4 27.9 42.0 41.6 41.1 41.1 41.1
In months of next year's imports of goods and services 4.5 3.9 5.6 5.5 5.4 5.3 5.1
Gross external debt 41.8 38.9 39.2 44.1 47.2 52.4 51.7
Public 7.7 7.9 8.2 9.5 9.2 9.5 9.4
Private 34.1 30.9 31.1 34.7 38.0 42.8 42.3
Exchange rate
Real effective exchange rate (real appreciation +) -2.2 5.9 0.9 3.7 -1.2 ... ...
Terms of trade 4.3 22.0 1.6 -6.1 -2.5 -3.0 0.7
Sources: Central Bank of Chile, Ministry of Finance, Haver Analytics, and IMF staff calculations and projections.
1/ Contribution to growth.
2/ The methodology to compute the unemployment rate changed in 2009.
3/ Headline balance adjusted for the economic and copper price cycles.
4/ In percent of non-mining GDP.
(Annual percentage change)
Proj.
(Annual percentage change, unless otherwise specified)
(In percent of GDP, unless otherwise specified)
Chile: Selected Social and Economic Indicators
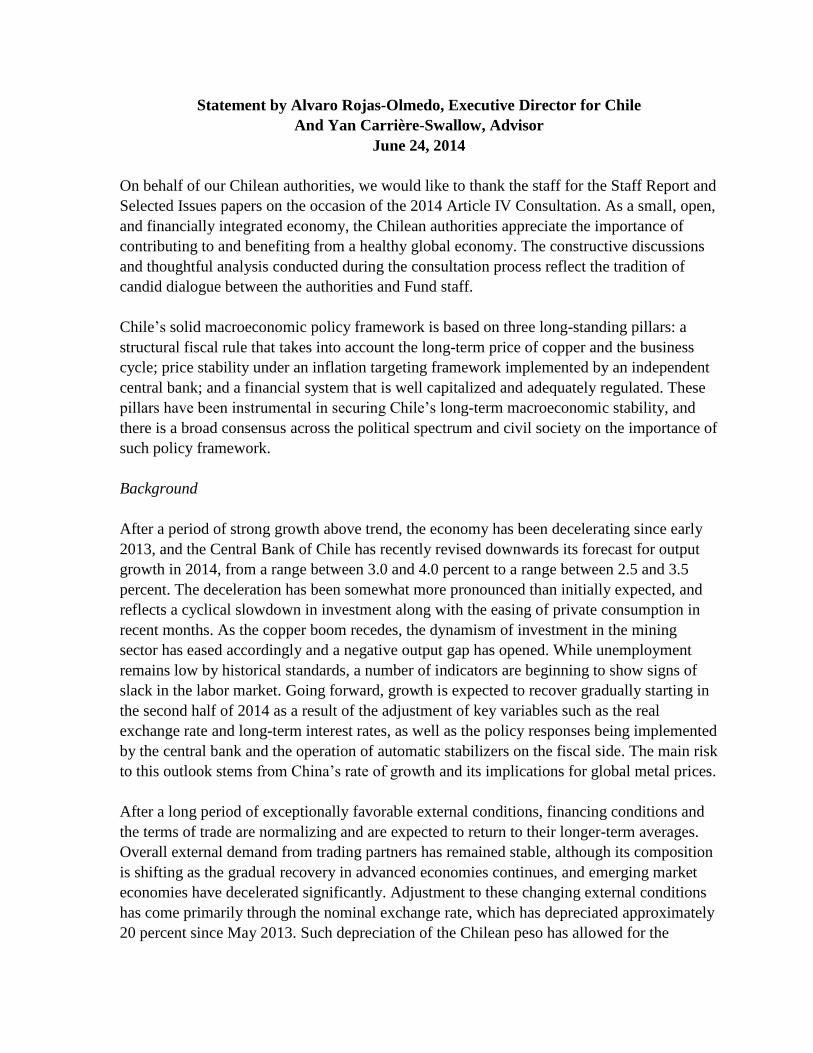
Statement by Alvaro Rojas-Olmedo, Executive Director for Chile
And Yan Carrière-Swallow, Advisor
June 24, 2014
On behalf of our Chilean authorities, we would like to thank the staff for the Staff Report and
Selected Issues papers on the occasion of the 2014 Article IV Consultation. As a small, open,
and financially integrated economy, the Chilean authorities appreciate the importance of
contributing to and benefiting from a healthy global economy. The constructive discussions
and thoughtful analysis conducted during the consultation process reflect the tradition of
candid dialogue between the authorities and Fund staff.
Chile’s solid macroeconomic policy framework is based on three long-standing pillars: a
structural fiscal rule that takes into account the long-term price of copper and the business
cycle; price stability under an inflation targeting framework implemented by an independent
central bank; and a financial system that is well capitalized and adequately regulated. These
pillars have been instrumental in securing Chile’s long-term macroeconomic stability, and
there is a broad consensus across the political spectrum and civil society on the importance of
such policy framework.
Background
After a period of strong growth above trend, the economy has been decelerating since early
2013, and the Central Bank of Chile has recently revised downwards its forecast for output
growth in 2014, from a range between 3.0 and 4.0 percent to a range between 2.5 and 3.5
percent. The deceleration has been somewhat more pronounced than initially expected, and
reflects a cyclical slowdown in investment along with the easing of private consumption in
recent months. As the copper boom recedes, the dynamism of investment in the mining
sector has eased accordingly and a negative output gap has opened. While unemployment
remains low by historical standards, a number of indicators are beginning to show signs of
slack in the labor market. Going forward, growth is expected to recover gradually starting in
the second half of 2014 as a result of the adjustment of key variables such as the real
exchange rate and long-term interest rates, as well as the policy responses being implemented
by the central bank and the operation of automatic stabilizers on the fiscal side. The main risk
to this outlook stems from China’s rate of growth and its implications for global metal prices.
After a long period of exceptionally favorable external conditions, financing conditions and
the terms of trade are normalizing and are expected to return to their longer-term averages.
Overall external demand from trading partners has remained stable, although its composition
is shifting as the gradual recovery in advanced economies continues, and emerging market
economies have decelerated significantly. Adjustment to these changing external conditions
has come primarily through the nominal exchange rate, which has depreciated approximately
20 percent since May 2013. Such depreciation of the Chilean peso has allowed for the
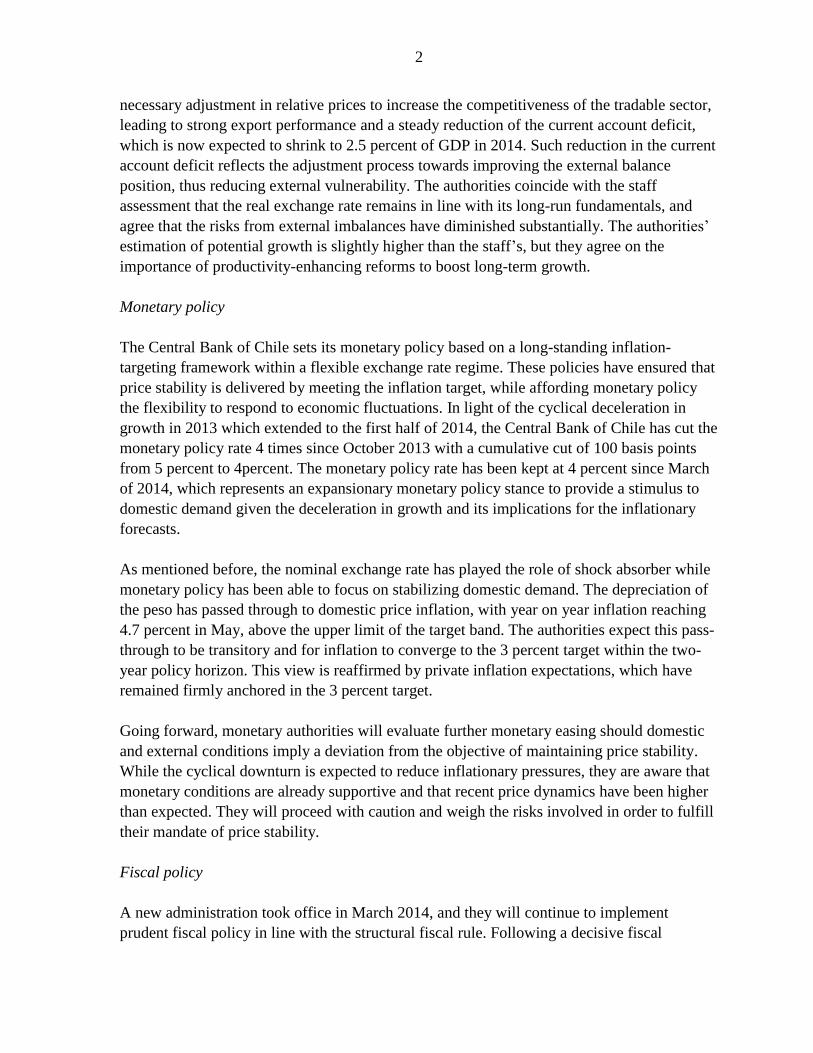
2
necessary adjustment in relative prices to increase the competitiveness of the tradable sector,
leading to strong export performance and a steady reduction of the current account deficit,
which is now expected to shrink to 2.5 percent of GDP in 2014. Such reduction in the current
account deficit reflects the adjustment process towards improving the external balance
position, thus reducing external vulnerability. The authorities coincide with the staff
assessment that the real exchange rate remains in line with its long-run fundamentals, and
agree that the risks from external imbalances have diminished substantially. The authorities’
estimation of potential growth is slightly higher than the staff’s, but they agree on the
importance of productivity-enhancing reforms to boost long-term growth.
Monetary policy
The Central Bank of Chile sets its monetary policy based on a long-standing inflation-
targeting framework within a flexible exchange rate regime. These policies have ensured that
price stability is delivered by meeting the inflation target, while affording monetary policy
the flexibility to respond to economic fluctuations. In light of the cyclical deceleration in
growth in 2013 which extended to the first half of 2014, the Central Bank of Chile has cut the
monetary policy rate 4 times since October 2013 with a cumulative cut of 100 basis points
from 5 percent to 4percent. The monetary policy rate has been kept at 4 percent since March
of 2014, which represents an expansionary monetary policy stance to provide a stimulus to
domestic demand given the deceleration in growth and its implications for the inflationary
forecasts.
As mentioned before, the nominal exchange rate has played the role of shock absorber while
monetary policy has been able to focus on stabilizing domestic demand. The depreciation of
the peso has passed through to domestic price inflation, with year on year inflation reaching
4.7 percent in May, above the upper limit of the target band. The authorities expect this pass-
through to be transitory and for inflation to converge to the 3 percent target within the two-
year policy horizon. This view is reaffirmed by private inflation expectations, which have
remained firmly anchored in the 3 percent target.
Going forward, monetary authorities will evaluate further monetary easing should domestic
and external conditions imply a deviation from the objective of maintaining price stability.
While the cyclical downturn is expected to reduce inflationary pressures, they are aware that
monetary conditions are already supportive and that recent price dynamics have been higher
than expected. They will proceed with caution and weigh the risks involved in order to fulfill
their mandate of price stability.
Fiscal policy
A new administration took office in March 2014, and they will continue to implement
prudent fiscal policy in line with the structural fiscal rule. Following a decisive fiscal
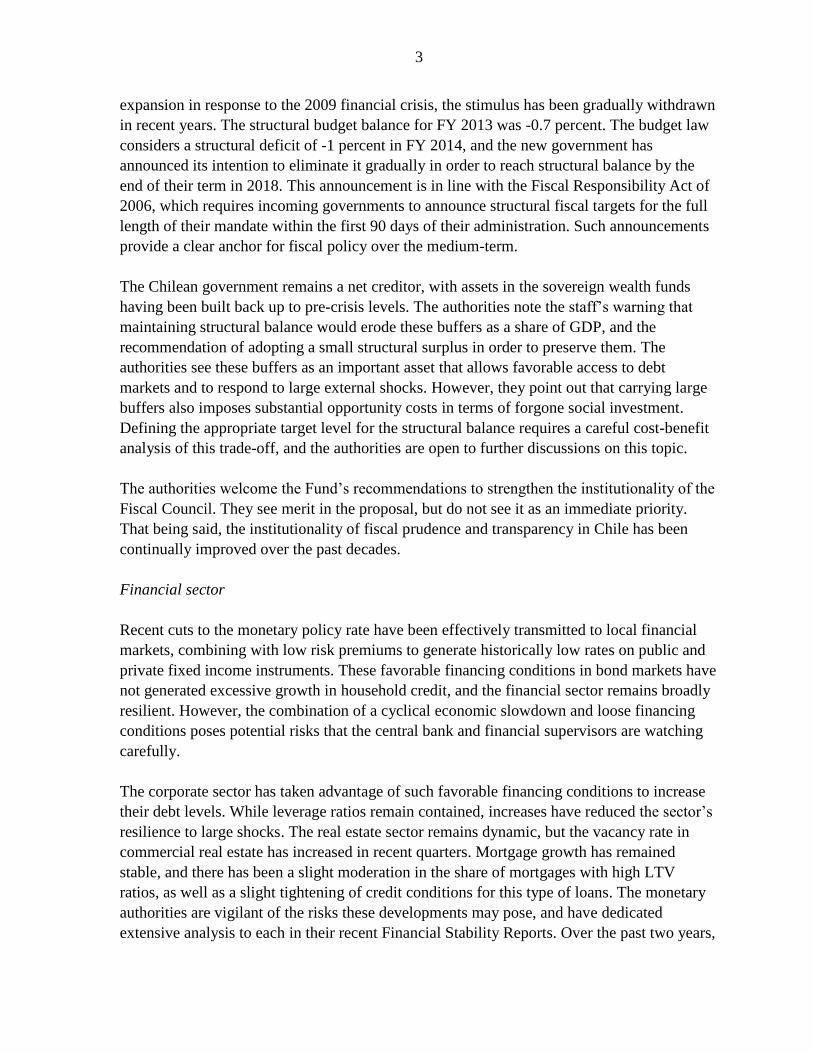
3
expansion in response to the 2009 financial crisis, the stimulus has been gradually withdrawn
in recent years. The structural budget balance for FY 2013 was -0.7 percent. The budget law
considers a structural deficit of -1 percent in FY 2014, and the new government has
announced its intention to eliminate it gradually in order to reach structural balance by the
end of their term in 2018. This announcement is in line with the Fiscal Responsibility Act of
2006, which requires incoming governments to announce structural fiscal targets for the full
length of their mandate within the first 90 days of their administration. Such announcements
provide a clear anchor for fiscal policy over the medium-term.
The Chilean government remains a net creditor, with assets in the sovereign wealth funds
having been built back up to pre-crisis levels. The authorities note the staff’s warning that
maintaining structural balance would erode these buffers as a share of GDP, and the
recommendation of adopting a small structural surplus in order to preserve them. The
authorities see these buffers as an important asset that allows favorable access to debt
markets and to respond to large external shocks. However, they point out that carrying large
buffers also imposes substantial opportunity costs in terms of forgone social investment.
Defining the appropriate target level for the structural balance requires a careful cost-benefit
analysis of this trade-off, and the authorities are open to further discussions on this topic.
The authorities welcome the Fund’s recommendations to strengthen the institutionality of the
Fiscal Council. They see merit in the proposal, but do not see it as an immediate priority.
That being said, the institutionality of fiscal prudence and transparency in Chile has been
continually improved over the past decades.
Financial sector
Recent cuts to the monetary policy rate have been effectively transmitted to local financial
markets, combining with low risk premiums to generate historically low rates on public and
private fixed income instruments. These favorable financing conditions in bond markets have
not generated excessive growth in household credit, and the financial sector remains broadly
resilient. However, the combination of a cyclical economic slowdown and loose financing
conditions poses potential risks that the central bank and financial supervisors are watching
carefully.
The corporate sector has taken advantage of such favorable financing conditions to increase
their debt levels. While leverage ratios remain contained, increases have reduced the sector’s
resilience to large shocks. The real estate sector remains dynamic, but the vacancy rate in
commercial real estate has increased in recent quarters. Mortgage growth has remained
stable, and there has been a slight moderation in the share of mortgages with high LTV
ratios, as well as a slight tightening of credit conditions for this type of loans. The monetary
authorities are vigilant of the risks these developments may pose, and have dedicated
extensive analysis to each in their recent Financial Stability Reports. Over the past two years,
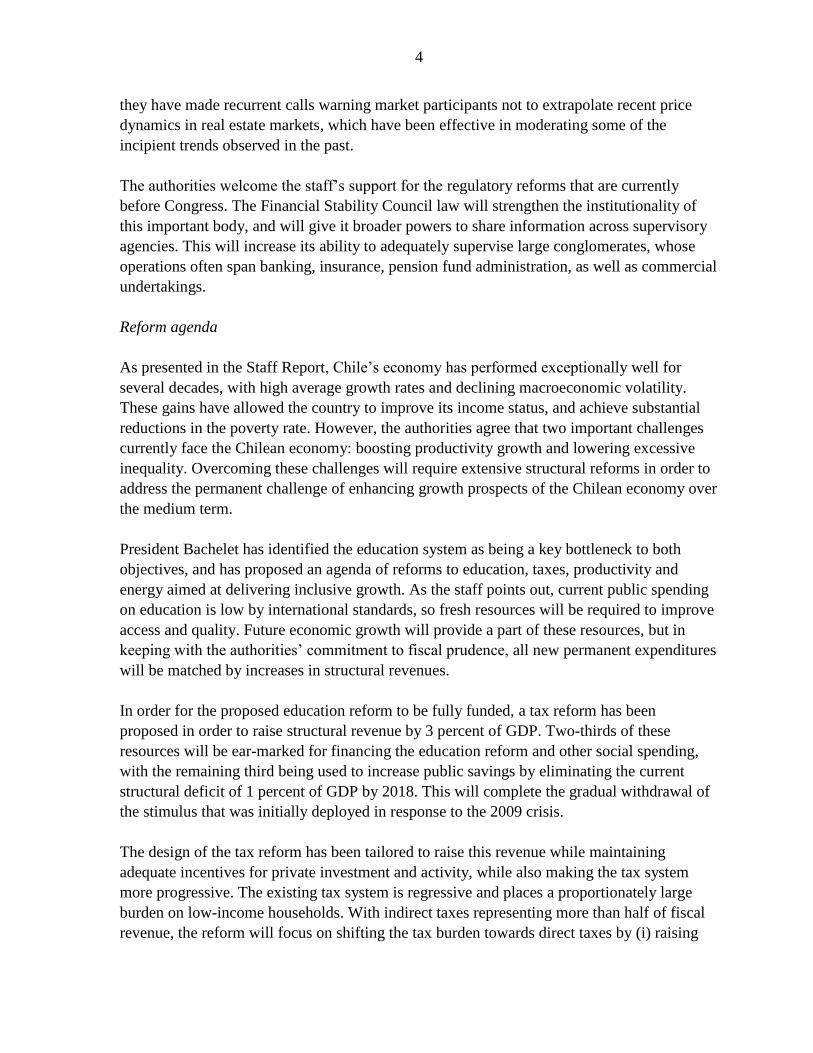
4
they have made recurrent calls warning market participants not to extrapolate recent price
dynamics in real estate markets, which have been effective in moderating some of the
incipient trends observed in the past.
The authorities welcome the staff’s support for the regulatory reforms that are currently
before Congress. The Financial Stability Council law will strengthen the institutionality of
this important body, and will give it broader powers to share information across supervisory
agencies. This will increase its ability to adequately supervise large conglomerates, whose
operations often span banking, insurance, pension fund administration, as well as commercial
undertakings.
Reform agenda
As presented in the Staff Report, Chile’s economy has performed exceptionally well for
several decades, with high average growth rates and declining macroeconomic volatility.
These gains have allowed the country to improve its income status, and achieve substantial
reductions in the poverty rate. However, the authorities agree that two important challenges
currently face the Chilean economy: boosting productivity growth and lowering excessive
inequality. Overcoming these challenges will require extensive structural reforms in order to
address the permanent challenge of enhancing growth prospects of the Chilean economy over
the medium term.
President Bachelet has identified the education system as being a key bottleneck to both
objectives, and has proposed an agenda of reforms to education, taxes, productivity and
energy aimed at delivering inclusive growth. As the staff points out, current public spending
on education is low by international standards, so fresh resources will be required to improve
access and quality. Future economic growth will provide a part of these resources, but in
keeping with the authorities’ commitment to fiscal prudence, all new permanent expenditures
will be matched by increases in structural revenues.
In order for the proposed education reform to be fully funded, a tax reform has been
proposed in order to raise structural revenue by 3 percent of GDP. Two-thirds of these
resources will be ear-marked for financing the education reform and other social spending,
with the remaining third being used to increase public savings by eliminating the current
structural deficit of 1 percent of GDP by 2018. This will complete the gradual withdrawal of
the stimulus that was initially deployed in response to the 2009 crisis.
The design of the tax reform has been tailored to raise this revenue while maintaining
adequate incentives for private investment and activity, while also making the tax system
more progressive. The existing tax system is regressive and places a proportionately large
burden on low-income households. With indirect taxes representing more than half of fiscal
revenue, the reform will focus on shifting the tax burden towards direct taxes by (i) raising
5
the corporate income tax and (ii) closing an existing benefit that allows firms to defer
payment of taxes on undistributed profits, which has been used extensively for tax evasion.
The top personal income tax bracket will also be lowered in order to reduce the gap between
the Personal Income Tax (PIT) and Corporate Income Tax (CIT) rates, and thus the incentive
to elude payment through the creation of shell companies. In view of the size of the changes
being proposed, they will be implemented gradually over the coming years.
The authorities agree that passing the legislation quickly is important in order to avoid
creating uncertainty, but point out that a reform of this size must be given sufficient time to
be debated within the legislative process. That being said, the main aspects of the proposal
have not changed since their initial presentation during the Presidential campaign almost one
year ago, and have already been approved by an ample majority in the lower house. As part
of the ongoing legislative process, the authorities will discuss additional measures intended
to increase corporate savings and investment, while maintaining the objectives and main
aspects of the reform.
Finally, we take the opportunity to welcome the Fund’s decision to co-host the upcoming
High-Level Conference on “Inclusiveness and Growth in Latin America” with the
Government of Chile in Santiago later this year within the events scheduled as part of the
Road to Lima 2015. This event will consider the longer-term challenges faced by Latin
American countries as they reach middle-income status. We see the Fund as being well-
placed to offer broad international experience that can help members achieve their
development goals.