Embed Size (px)
Citation preview
Responsible Statistician: Adam King, [email protected]
Published on: 13 August 2015. Next publication: July 2016. 1 | P a g e
Official statistics
The data presented here on inspections of local authority children’s services, cover those inspections published by 30 June 2015, and are provisional.
The data presented here on inspections of regulated, and other services, cover those inspections published by 1 May 2015, and are provisional.
Key Points1
Almost a quarter of local authorities, so far, were judged to be good for Overall effectiveness for the single inspection framework for inspecting services for children in need of help and protection, children looked after and care leavers (SIF).
Almost a quarter (14) were judged to be good whereas just over one half (31) require improvement to be good.
One quarter of local authorities, so far, were judged to be inadequate for the SIF.
Fourteen local authorities were judged to be inadequate.
The proportion of children's homes run by local authorities continues to decline.
Under one quarter of children’s homes (23% or 459) were run by local authorities as at 31 March 2015, a fall of three percentage points from the previous year.2
1 For a definition of any terms used in this document, please refer to the glossary at the end of the document. 2 Excluding secure children’s homes and residential special schools registered as children’s homes.
Children’s social care data in England
This release contains:
Inspection outcomes for local authority children’s services inspections, from November 2013
Inspection outcomes for all regulated, and other, children’s social care provision, 1 April 2014 to 31 March 2015
Inspection outcome of most recent inspection, for all regulated, and other, children’s social care provision, as at 31 March 2015
Information about the providers of children’s social care, including the
numbers of providers and places, as at 31 March 2015
Responsible Statistician: Adam King, [email protected]
Published on: 13 August 2015. Next publication: July 2016. 2 | P a g e
Official statistics
Key Points (continued)
One third of local authorities do not run any children’s homes.
Fifty four local authorities do not run any children’s homes, excluding short-break only children’s homes.
The performance of local authority-run children's homes continues to be better than private or voluntary-run homes in 2014-15.
A higher proportion of local authority-run homes (70%) received a good or better Overall effectiveness judgement than private and voluntary-run homes, at 62% and 64% respectively.3
3 Excluding secure children’s homes and residential special schools registered as children’s homes.
Responsible Statistician: Adam King, [email protected]
Published on: 13 August 2015. Next publication: July 2016. 3 | P a g e
Official statistics
Contents
Introduction 5
Key findings 8
Inspection of local authority children’s services ................................................... 8
Overall effectiveness from November 2013 to June 2015 .................................. 8
Key judgements from November 2013 to June 2015 ........................................ 9
Sub-judgements from November 2013 to June 2015 ...................................... 11
Regional outcomes for Overall effectiveness from November 2013 to June 2015
.................................................................................................................. 12
Inspections of local authorities: some comparisons ........................................ 15
Reviews of Local Safeguarding Children Boards ................................................ 18
Overall effectiveness from November 2013 to June 2015 ................................ 18
Regional outcomes for Overall effectiveness from November 2013 to June 2015
.................................................................................................................. 19
All children’s homes ........................................................................................ 20
Providers and Places as at 31 March 2015 ..................................................... 20
Children’s homes ......................................................................................... 22
Residential special schools registered as children’s homes .............................. 27
Secure children’s homes ............................................................................... 27
Overall effectiveness for all children’s homes 2014-15 .................................... 28
Overall effectiveness for all children’s homes – change since last inspection .... 29
Regional outcomes for all children’s homes 2014-15 ...................................... 30
Regional outcomes for all children’s homes – change since last inspection ....... 31
Sector data for all children’s homes 2014-15 ................................................. 33
Interim inspections for all children’s homes 2014-15 ...................................... 36
Children’s homes Overall effectiveness: the picture for all children’s homes as at
31 March 2015 ............................................................................................ 37
Other social care providers .............................................................................. 39
Residential Family Centres ............................................................................ 39
Responsible Statistician: Adam King, [email protected]
Published on: 13 August 2015. Next publication: July 2016. 4 | P a g e
Official statistics
Independent Fostering Agencies ................................................................... 40
Voluntary Adoption Agencies ........................................................................ 41
Adoption Support Agencies ........................................................................... 42
Residential Special Schools ........................................................................... 43
Boarding Schools ......................................................................................... 45
Further Education (FE) Colleges with Residential Accommodation ................... 46
Residential Holiday Schemes for Disabled Children ......................................... 47
Secure Training Centres ............................................................................... 47
List of charts 48
List of tables 49
List of maps 49
Notes 52
Glossary 53
Acknowledgements
Thanks to the following for their contribution to this statistical release: Marc McGreavy, Kat Kaal, Ed Jones, Matt Watts and Rich Jones.
Responsible Statistician: Adam King, [email protected]
Published on: 13 August 2015. Next publication: July 2016. 5 | P a g e
Official statistics
Introduction
This statistical release is the combination of four previous separate statistical releases. Following a consultation with providers and stakeholders, the decision was made to combine them into one and change the frequency of publication, to annual for all provision types and six monthly for children’s homes and local authorities (LA). These changes make for a more comprehensive data set.
Feedback to the consultation indicated that a full set of inspection outcomes as at 31 March would be preferred and more comprehensive. Therefore in addition to the annual statistics, the release now includes data on the latest inspection judgement for each non-LA provision as at the 31 March. These additional data include all active providers, not just those inspected during the year.
The Excel part of this new release now has more interactive elements, allowing the user to select from a range of drop down options to see the data they require. When the user selects a local authority in one table this will also select the same authority in the other tables allowing easy access to the data they require. It also now includes direct links to the provider pages which contain the inspection reports.
Previously published data regarding LA inspections, children’s social care inspections and providers and places can be found at the following links on GOV.UK https://www.gov.uk/government/collections/childrens-social-care-statistics and in the National Archives http://webarchive.nationalarchives.gov.uk/20141124154759/http:/www.ofsted.gov.uk/resources/statistics. These pages also contain data on adoption, fostering, children looked after placements and serious incident notifications which the reader may find relevant.
There were 2,7874,5 providers of children’s social care and providers of residential accommodation for children in boarding schools & further education colleges in England, as at the end of March 2015.
Most of these providers are registered and regulated by Ofsted, and inspected, in the main, by Regulatory Inspectors.
These comprise the following regulated provider types:
children’s homes (including secure children’s homes and residential special schools dual registered as children’s homes) – receive a full and an interim
4 This figure includes six residential holiday schemes for disabled children and four secure training centres, which are not included in the main tables in the accompanying Excel document. They are not in the Excel tables due to the data not being part of the database where the Excel data were taken from. The 10 provisions and their inspections, where applicable, have been manually added to the underlying data in the Excel document. 5 Each provider type has its own section in this document that talks about the number of numbers of providers and where applicable the number of places. A table showing these figures for all provider types can be found in annex 1.
Responsible Statistician: Adam King, [email protected]
Published on: 13 August 2015. Next publication: July 2016. 6 | P a g e
Official statistics
inspection on an annual cycle and may receive additional concern driven inspections
residential family centres – receive an inspection in every three year cycle and may receive additional concern driven inspections
independent fostering agencies – receive an inspection in every three year cycle and may receive additional concern driven inspections
voluntary adoption agencies – receive an inspection in every three year cycle and may receive additional concern driven inspections
adoption support agencies – receive an inspection in every three year cycle and may receive additional concern driven inspections
residential holiday schemes for disabled children – receive an inspection on an annual cycle and may receive additional concern driven inspections
They also comprise the following registered, but not regulated, provider types:
residential special schools – receive an inspection on an annual cycle and may receive additional concern driven inspections
boarding schools – receive an inspection in every three year cycle and may receive additional concern driven inspections
further education colleges with residential accommodation – receive an inspection in every three year cycle and may receive additional concern driven inspections
secure training centres – receive an inspection on an annual cycle and may receive additional concern driven inspections
In addition to the 2,787 social care providers and providers of residential accommodation for children in boarding schools & further education colleges, there are 152 local authorities responsible for ensuring and overseeing the effective delivery of social care services for children.
Her Majesty’s Inspectors (HMI) conduct the inspection of local authority services for children who need help and protection, children looked after, and care leavers, under the single inspection framework (SIF), which will conclude in the spring of 2017.
Responsible Statistician: Adam King, [email protected]
Published on: 13 August 2015. Next publication: July 2016. 7 | P a g e
Official statistics
In addition to the SIF, at the same time, HMI conduct reviews of the Local Safeguarding Children Boards (LSCBs) that are responsible for safeguarding, and promoting the welfare, of children.6
6 Department for Education (DfE) guidance, Working together to safeguard children, March 2015 https://www.gov.uk/government/publications/working-together-to-safeguard-children--2
Responsible Statistician: Adam King, [email protected]
Published on: 13 August 2015. Next publication: July 2016. 8 | P a g e
Official statistics
Key findings
Inspection of local authority children’s services
Ofsted inspects local authority services for children who need help and protection, children looked after, and care leavers under the single inspection framework, introduced in November 2013.
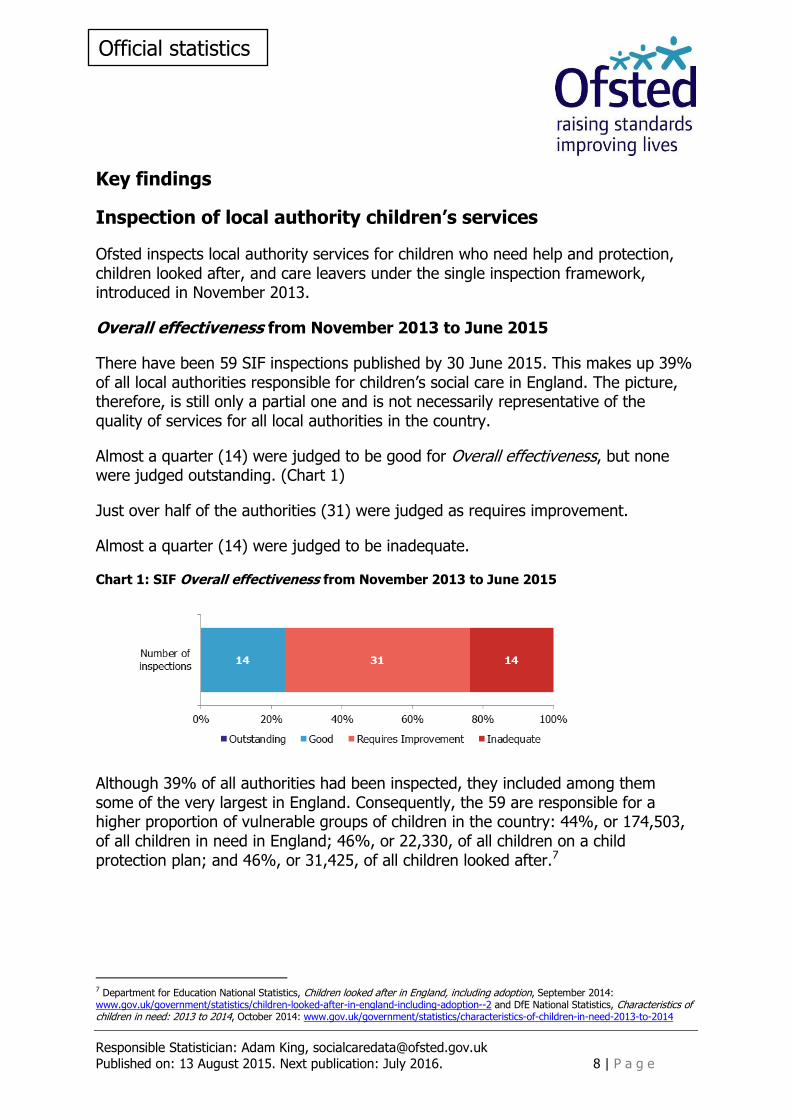
Overall effectiveness from November 2013 to June 2015
There have been 59 SIF inspections published by 30 June 2015. This makes up 39% of all local authorities responsible for children’s social care in England. The picture, therefore, is still only a partial one and is not necessarily representative of the quality of services for all local authorities in the country.
Almost a quarter (14) were judged to be good for Overall effectiveness, but none were judged outstanding. (Chart 1)
Just over half of the authorities (31) were judged as requires improvement.
Almost a quarter (14) were judged to be inadequate.
Chart 1: SIF Overall effectiveness from November 2013 to June 2015
Although 39% of all authorities had been inspected, they included among them some of the very largest in England. Consequently, the 59 are responsible for a higher proportion of vulnerable groups of children in the country: 44%, or 174,503, of all children in need in England; 46%, or 22,330, of all children on a child protection plan; and 46%, or 31,425, of all children looked after.7
7 Department for Education National Statistics, Children looked after in England, including adoption, September 2014: www.gov.uk/government/statistics/children-looked-after-in-england-including-adoption--2 and DfE National Statistics, Characteristics of children in need: 2013 to 2014, October 2014: www.gov.uk/government/statistics/characteristics-of-children-in-need-2013-to-2014
Responsible Statistician: Adam King, [email protected]
Published on: 13 August 2015. Next publication: July 2016. 9 | P a g e
Official statistics
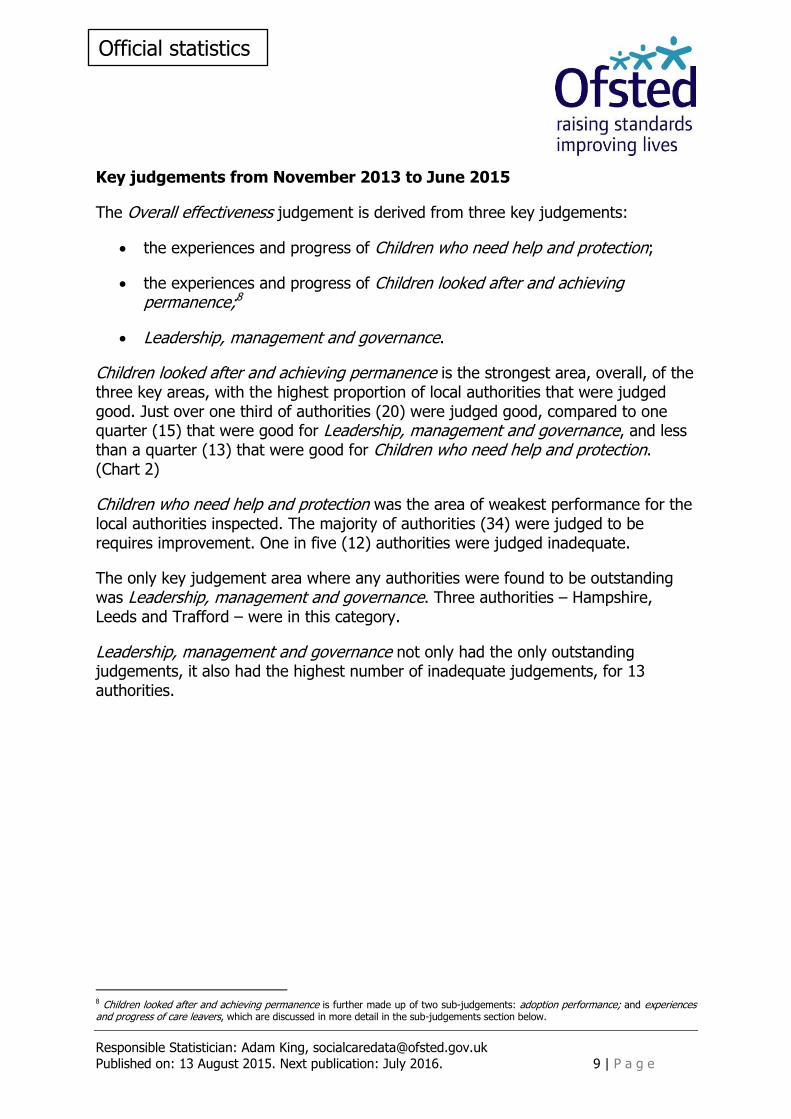
Key judgements from November 2013 to June 2015
The Overall effectiveness judgement is derived from three key judgements:
the experiences and progress of Children who need help and protection;
the experiences and progress of Children looked after and achieving permanence;8
Leadership, management and governance.
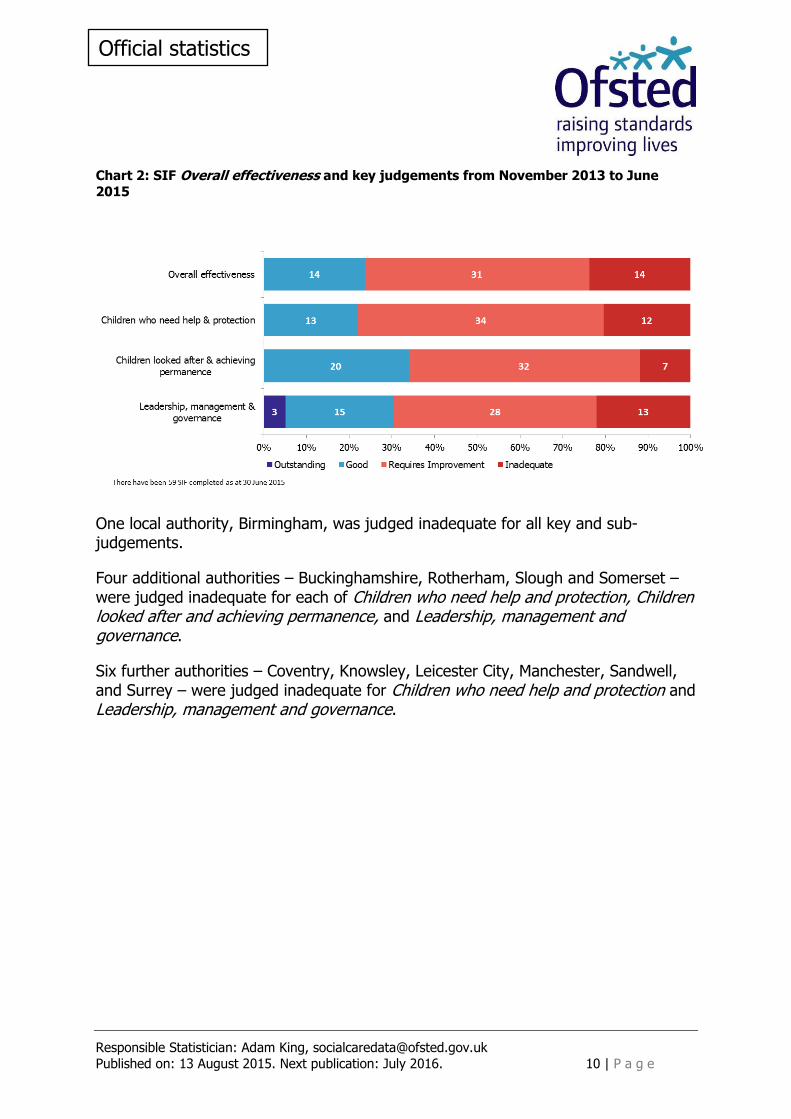
Children looked after and achieving permanence is the strongest area, overall, of the three key areas, with the highest proportion of local authorities that were judged good. Just over one third of authorities (20) were judged good, compared to one quarter (15) that were good for Leadership, management and governance, and less than a quarter (13) that were good for Children who need help and protection. (Chart 2)
Children who need help and protection was the area of weakest performance for the local authorities inspected. The majority of authorities (34) were judged to be requires improvement. One in five (12) authorities were judged inadequate.
The only key judgement area where any authorities were found to be outstanding was Leadership, management and governance. Three authorities – Hampshire, Leeds and Trafford – were in this category.
Leadership, management and governance not only had the only outstanding judgements, it also had the highest number of inadequate judgements, for 13 authorities.
8 Children looked after and achieving permanence is further made up of two sub-judgements: adoption performance; and experiences and progress of care leavers, which are discussed in more detail in the sub-judgements section below.
Responsible Statistician: Adam King, [email protected]
Published on: 13 August 2015. Next publication: July 2016. 10 | P a g e
Official statistics
Chart 2: SIF Overall effectiveness and key judgements from November 2013 to June
2015
One local authority, Birmingham, was judged inadequate for all key and sub-judgements.
Four additional authorities – Buckinghamshire, Rotherham, Slough and Somerset – were judged inadequate for each of Children who need help and protection, Children looked after and achieving permanence, and Leadership, management and governance.
Six further authorities – Coventry, Knowsley, Leicester City, Manchester, Sandwell, and Surrey – were judged inadequate for Children who need help and protection and Leadership, management and governance.
Responsible Statistician: Adam King, [email protected]
Published on: 13 August 2015. Next publication: July 2016. 11 | P a g e
Official statistics
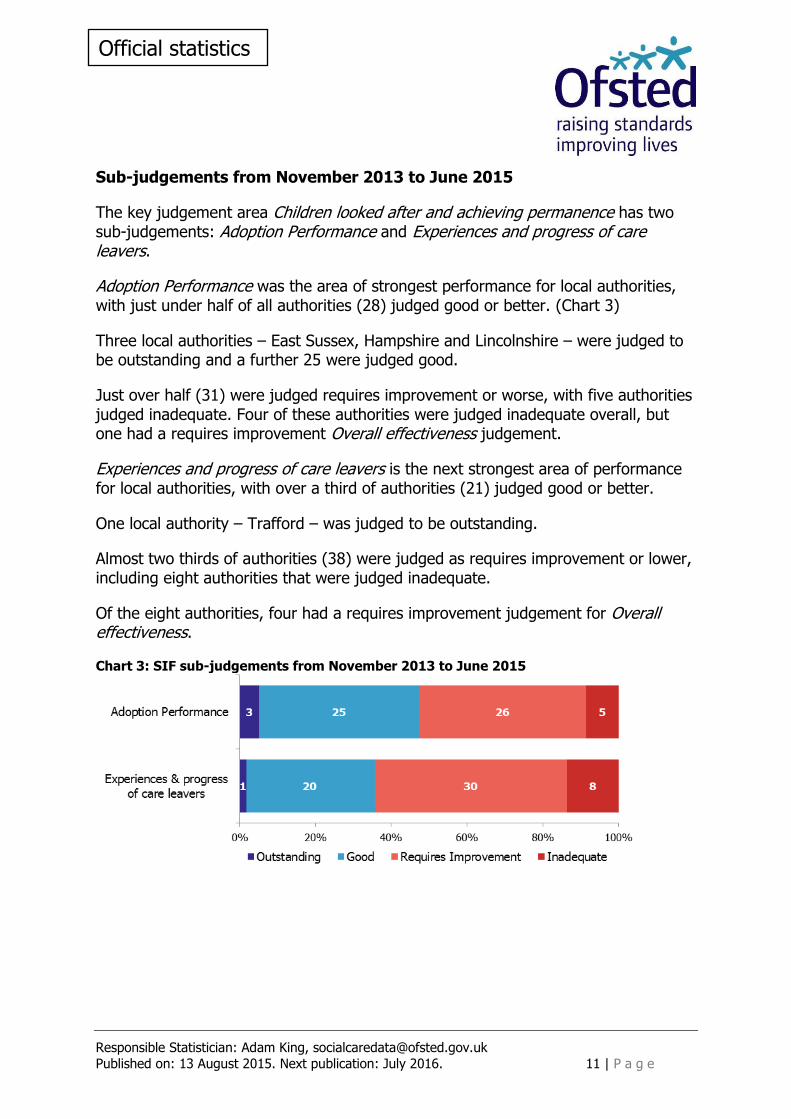
Sub-judgements from November 2013 to June 2015
The key judgement area Children looked after and achieving permanence has two sub-judgements: Adoption Performance and Experiences and progress of care leavers.
Adoption Performance was the area of strongest performance for local authorities, with just under half of all authorities (28) judged good or better. (Chart 3)
Three local authorities – East Sussex, Hampshire and Lincolnshire – were judged to be outstanding and a further 25 were judged good.
Just over half (31) were judged requires improvement or worse, with five authorities judged inadequate. Four of these authorities were judged inadequate overall, but one had a requires improvement Overall effectiveness judgement.
Experiences and progress of care leavers is the next strongest area of performance for local authorities, with over a third of authorities (21) judged good or better.
One local authority – Trafford – was judged to be outstanding.
Almost two thirds of authorities (38) were judged as requires improvement or lower, including eight authorities that were judged inadequate.
Of the eight authorities, four had a requires improvement judgement for Overall effectiveness.
Chart 3: SIF sub-judgements from November 2013 to June 2015
Responsible Statistician: Adam King, [email protected]
Published on: 13 August 2015. Next publication: July 2016. 12 | P a g e
Official statistics
Regional outcomes for Overall effectiveness from November 2013 to June 2015
Each region in England varies in terms of size and the number of local authorities within it. Not all regions have been inspected proportionate to the number of authorities within it. The regional picture is, therefore, one contingent on those inspections already completed. It is not necessarily, therefore, yet an accurate reflection of the overall picture of the region, which may improve or worsen over time, and the current data need to be considered in that light.
The 14 authorities that were judged good for Overall effectiveness were spread across seven regions, as were the authorities judged inadequate. (Chart 4) The two smallest regions, East of England and East Midlands regions, had the fewest SIF inspections, albeit that almost half of the latter’s authorities have been visited compared to a smaller proportion of the former’s. Both had two authorities judged good for Overall effectiveness.
Of the regions that had five or more SIF inspections, proportionally the North East, Yorkshire and the Humber region had the most authorities judged good for Overall effectiveness: a third of the authorities that were inspected. The next highest proportion was in the South East region, where a quarter of authorities were judged good.
The regions with the greatest number of inadequates judgements were the South East, the West Midlands, and the North West.
In the South West, six authorities have been inspected and all were judged as requiring improvement or lower.
Responsible Statistician: Adam King, [email protected]
Published on: 13 August 2015. Next publication: July 2016. 13 | P a g e
Official statistics
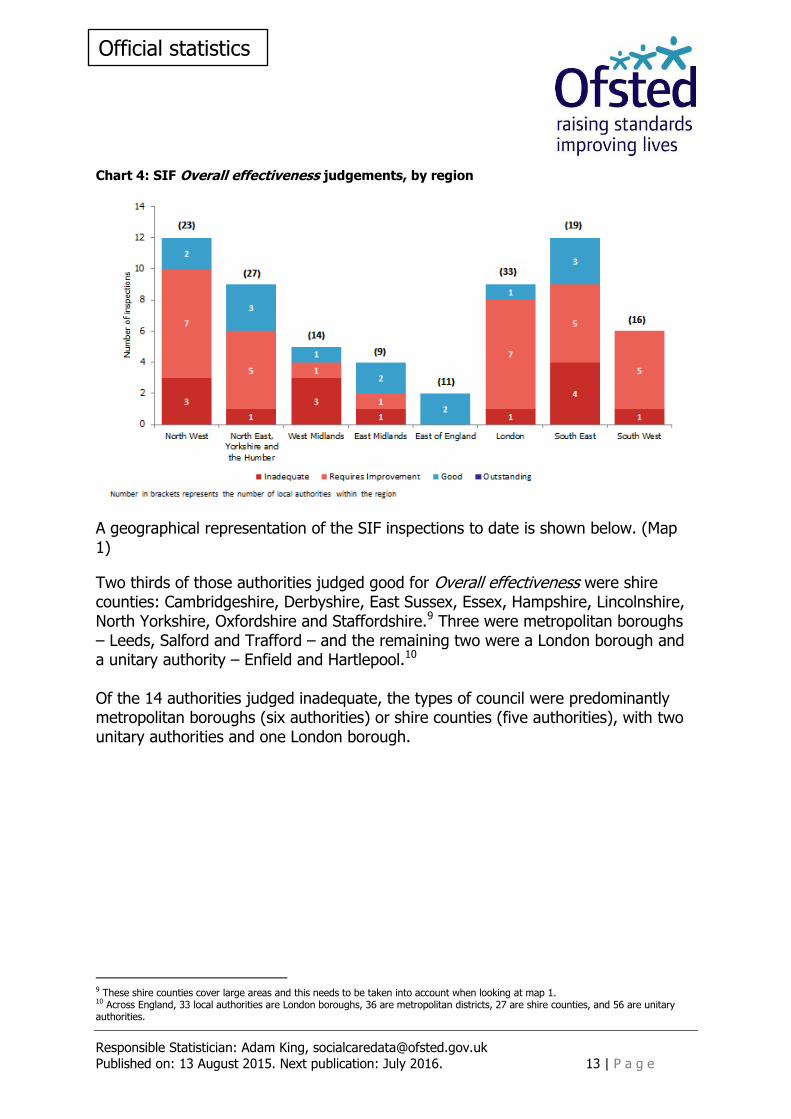
Chart 4: SIF Overall effectiveness judgements, by region
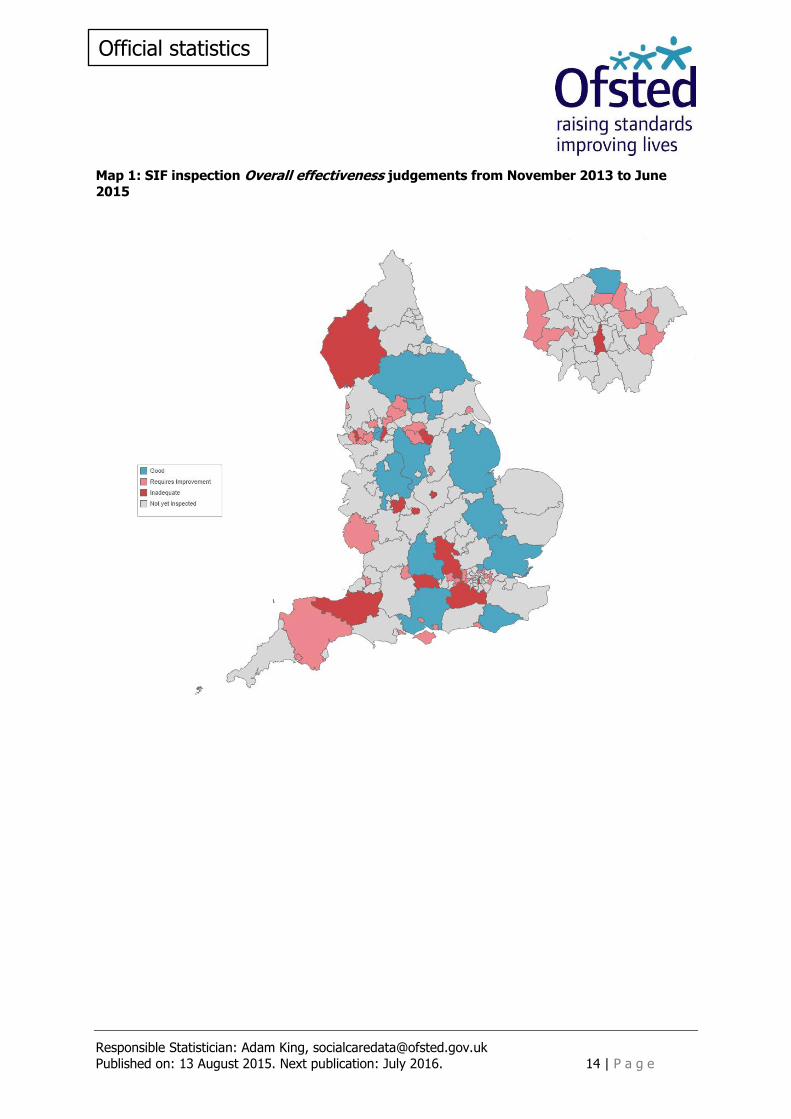
A geographical representation of the SIF inspections to date is shown below. (Map 1)
Two thirds of those authorities judged good for Overall effectiveness were shire counties: Cambridgeshire, Derbyshire, East Sussex, Essex, Hampshire, Lincolnshire, North Yorkshire, Oxfordshire and Staffordshire.9 Three were metropolitan boroughs – Leeds, Salford and Trafford – and the remaining two were a London borough and a unitary authority – Enfield and Hartlepool.10 Of the 14 authorities judged inadequate, the types of council were predominantly metropolitan boroughs (six authorities) or shire counties (five authorities), with two unitary authorities and one London borough.
9 These shire counties cover large areas and this needs to be taken into account when looking at map 1. 10 Across England, 33 local authorities are London boroughs, 36 are metropolitan districts, 27 are shire counties, and 56 are unitary authorities.
Responsible Statistician: Adam King, [email protected]
Published on: 13 August 2015. Next publication: July 2016. 14 | P a g e
Official statistics
Map 1: SIF inspection Overall effectiveness judgements from November 2013 to June
2015
Responsible Statistician: Adam King, [email protected]
Published on: 13 August 2015. Next publication: July 2016. 15 | P a g e
Official statistics
Inspections of local authorities: some comparisons
Because of the different frameworks used to inspect local authorities since 2009, it is difficult to adequately compare the SIF Overall effectiveness judgement with those from previous inspection frameworks. It is particularly important to note the change in terminology from adequate judgements prior to 2009 to requires improvement judgements from 2009 onwards in the SIF.
There are two key judgements in the SIF inspections, though, where it is possible to draw some comparisons to a previous inspection judgement:
Children who need help and protection with the Safeguarding or Child Protection inspection outcomes.11
Children looked after and achieving permanence with Looked After Children.12
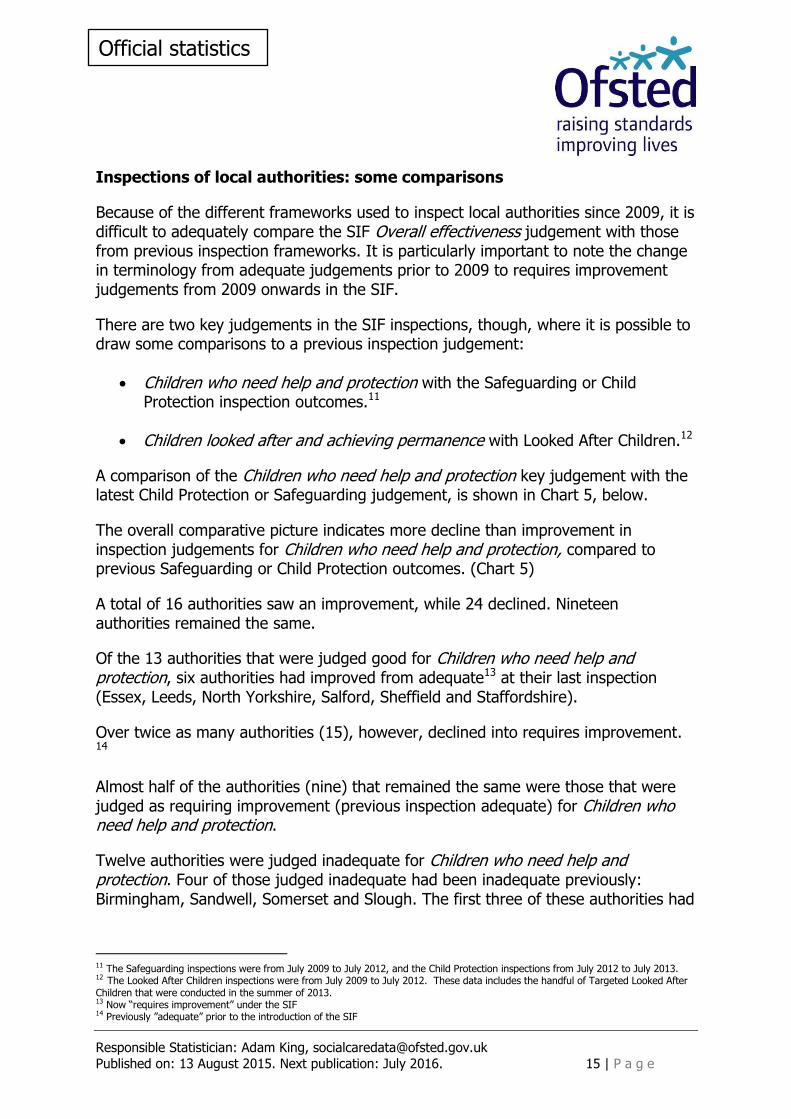
A comparison of the Children who need help and protection key judgement with the latest Child Protection or Safeguarding judgement, is shown in Chart 5, below.
The overall comparative picture indicates more decline than improvement in inspection judgements for Children who need help and protection, compared to previous Safeguarding or Child Protection outcomes. (Chart 5)
A total of 16 authorities saw an improvement, while 24 declined. Nineteen authorities remained the same.
Of the 13 authorities that were judged good for Children who need help and protection, six authorities had improved from adequate13 at their last inspection (Essex, Leeds, North Yorkshire, Salford, Sheffield and Staffordshire).
Over twice as many authorities (15), however, declined into requires improvement. 14
Almost half of the authorities (nine) that remained the same were those that were judged as requiring improvement (previous inspection adequate) for Children who need help and protection.
Twelve authorities were judged inadequate for Children who need help and protection. Four of those judged inadequate had been inadequate previously: Birmingham, Sandwell, Somerset and Slough. The first three of these authorities had
11 The Safeguarding inspections were from July 2009 to July 2012, and the Child Protection inspections from July 2012 to July 2013. 12 The Looked After Children inspections were from July 2009 to July 2012. These data includes the handful of Targeted Looked After Children that were conducted in the summer of 2013. 13 Now “requires improvement” under the SIF 14 Previously ”adequate” prior to the introduction of the SIF
Responsible Statistician: Adam King, [email protected]
Published on: 13 August 2015. Next publication: July 2016. 16 | P a g e
Official statistics
been inadequate in their Child Protection inspection in 2012-13; the last authority had been inadequate in its Safeguarding inspection.
A total of eight authorities declined to inadequate. Three that had been previously judged adequate (Leicester City, Manchester, West Berkshire) and three that had previously been judged good (Buckinghamshire, Coventry, and Knowsley) in their Safeguarding inspection. Two authorities (Rotherham and Surrey) had been previously judged adequate in their Child Protection inspection.
Chart 5: Children who need help and protection judgements, change from previous
inspection judgement
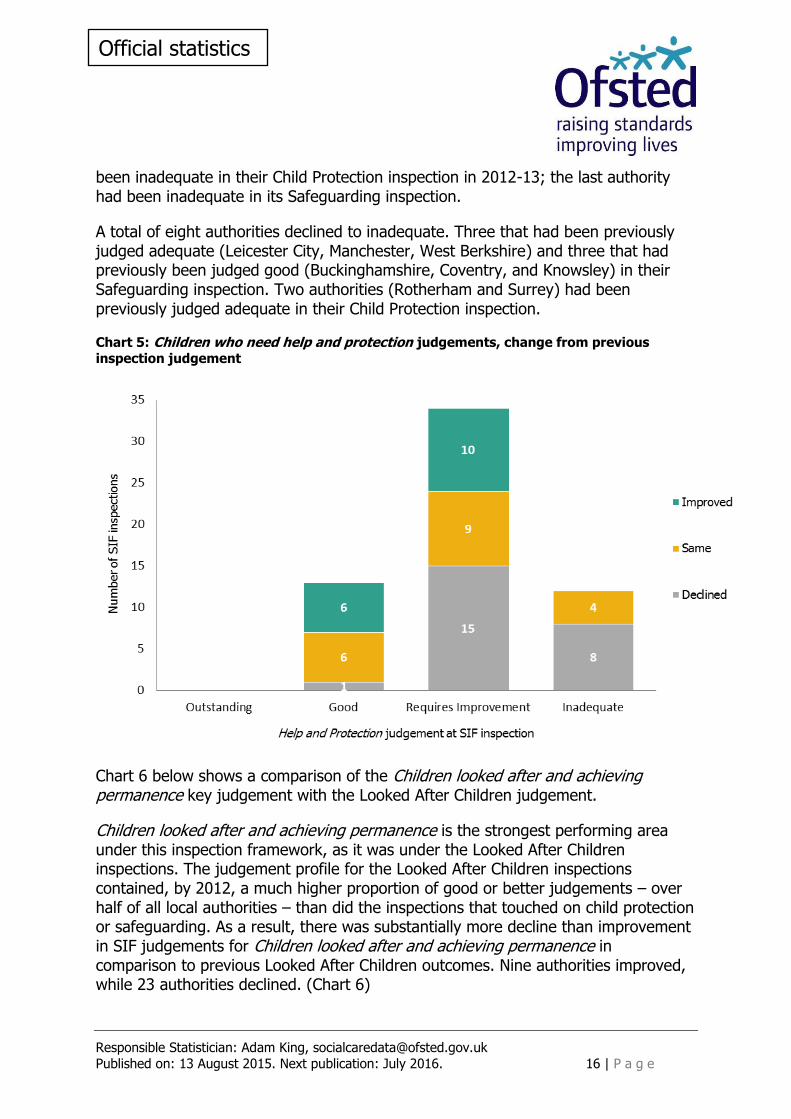
Chart 6 below shows a comparison of the Children looked after and achieving permanence key judgement with the Looked After Children judgement.
Children looked after and achieving permanence is the strongest performing area under this inspection framework, as it was under the Looked After Children inspections. The judgement profile for the Looked After Children inspections contained, by 2012, a much higher proportion of good or better judgements – over half of all local authorities – than did the inspections that touched on child protection or safeguarding. As a result, there was substantially more decline than improvement in SIF judgements for Children looked after and achieving permanence in comparison to previous Looked After Children outcomes. Nine authorities improved, while 23 authorities declined. (Chart 6)
Responsible Statistician: Adam King, [email protected]
Published on: 13 August 2015. Next publication: July 2016. 17 | P a g e
Official statistics
Almost half (46%) of inspected authorities, however, remained the same in their judgement for Children looked after and achieving permanence compared to their previous Looked after children judgement.
Seven authorities that were judged good for Children looked after and achieving permanence had improved since their last inspection. Brighton & Hove, Cambridgeshire, Essex, Leeds, Salford, Staffordshire, and Warrington had previously been judged adequate and are now judged good. A further 13 authorities remained good.
Half of the authorities that were judged as requiring improvement for Children looked after and achieving permanence had declined since their last inspection. Previously judged good for Looked after children, 16 authorities had declined and were judged as requiring improvement.
Two authorities improved from inadequate to requires improvement (Sandwell and Waltham Forest).
All seven authorities that were judged inadequate for Children looked after and achieving permanence had declined since their last inspection. None of the authorities that had been judged inadequate in their last inspection remained inadequate in their SIF inspection; all had improved.
Chart 6: Children looked after and achieving permanence judgements, change from
previous inspection judgement
Responsible Statistician: Adam King, [email protected]
Published on: 13 August 2015. Next publication: July 2016. 18 | P a g e
Official statistics
Reviews of Local Safeguarding Children Boards
Ofsted conducts reviews of Local Safeguarding Children Boards (LSCBs) alongside the SIF inspections of local authority children’s services. Their inspection Overall effectiveness judgement is not however directly comparable to the SIF Overall effectiveness judgement. This inspection arrangement has been in place since November 2013.
Overall effectiveness from November 2013 to June 2015
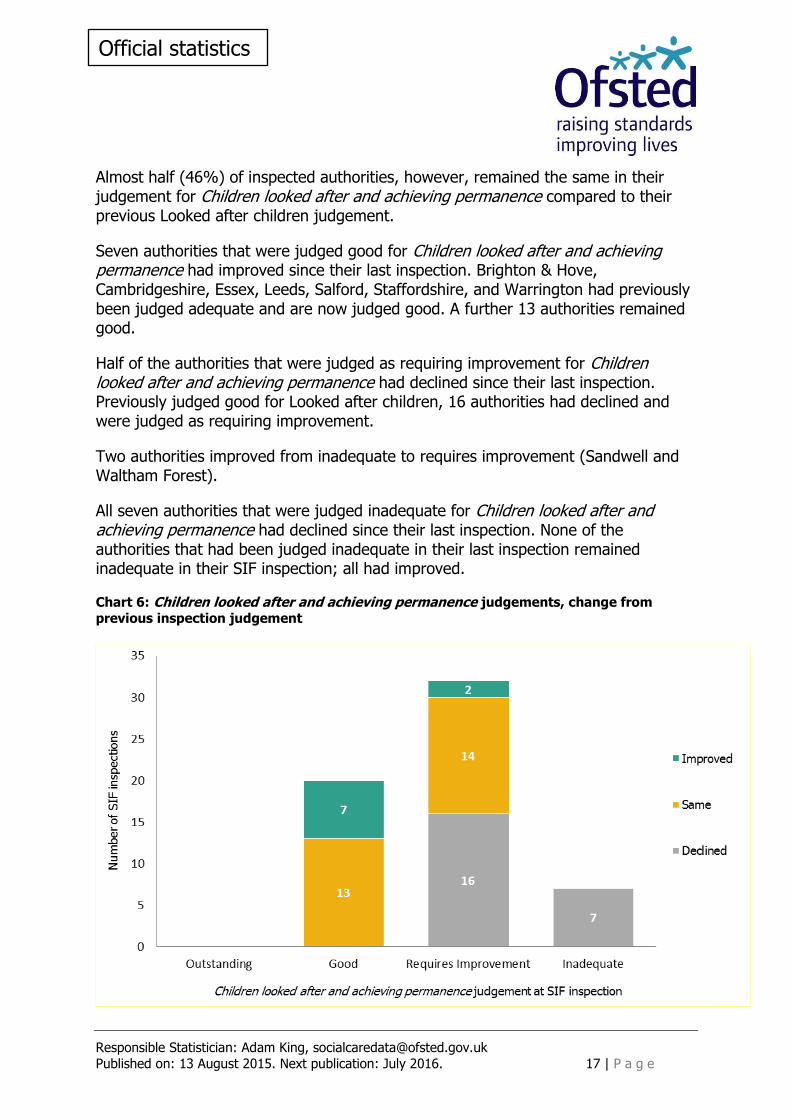
There have been 58 reviews of LSCBs published by 30 June 2015.15 As with the SIFs, the picture is still only a partial one and is not necessarily representative of the quality of all LSCBs in the country.
Around one third (19) were judged to be good for Overall effectiveness, and none were judged outstanding. (Chart 7)
Just under half (26) were judged requires improvement.
Over one fifth (13) of LSCBs were judged inadequate.
Chart 7: Overall effectiveness judgements for LSCB reviews from November 2013 to June
2015
The pattern of outcomes for LSCBs is similar to that for local authorities, but not identical and is slightly less evenly distributed, with the judgement of good featuring slightly more frequently in this profile.
Of the 19 judged to be good, 11 also had a SIF judgement of good for Overall effectiveness and the remaining eight a judgement of requires improvement.
Of the 26 judged requires improvement, most had the identical SIF judgement, but three authorities had a good judgement and two an inadequate one.
Eleven of the thirteen also had a judgement of inadequate for Overall effectiveness.
15 One of these reviews was conducted under Section 20 of the Children Act 1989. One LSCB has been re-reviewed and the outcome is not yet published.
Responsible Statistician: Adam King, [email protected]
Published on: 13 August 2015. Next publication: July 2016. 19 | P a g e
Official statistics
Regional outcomes for Overall effectiveness from November 2013 to June 2015
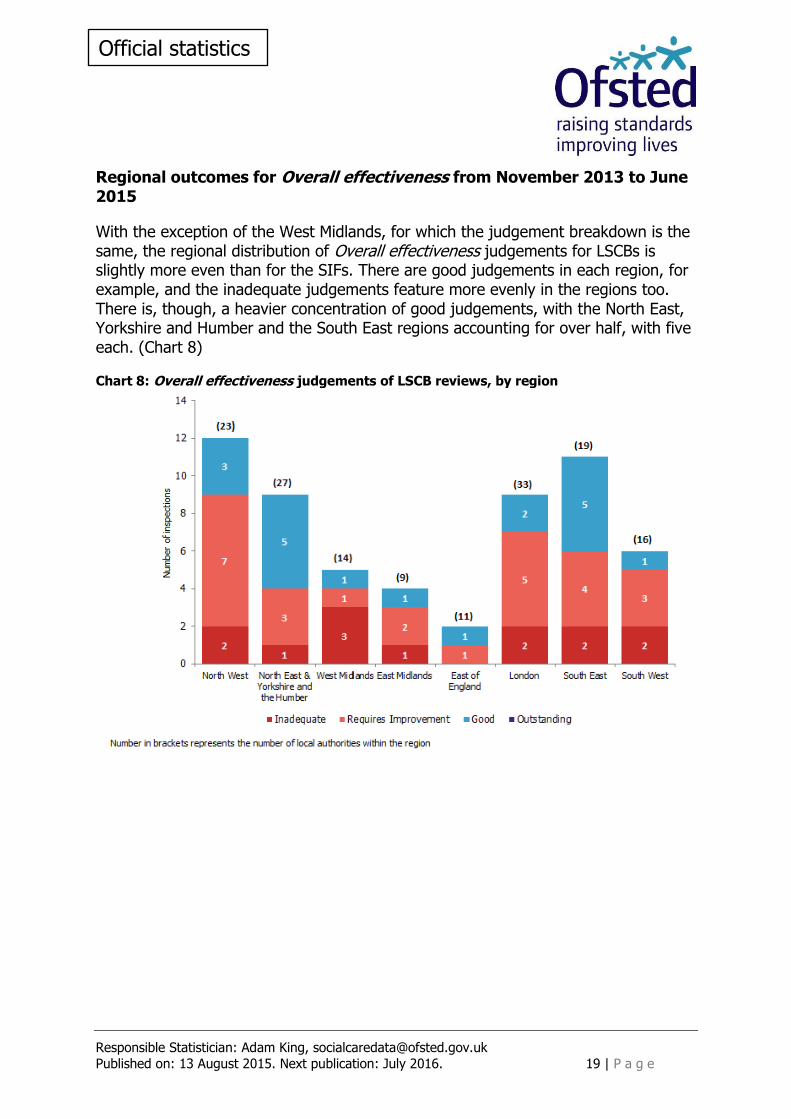
With the exception of the West Midlands, for which the judgement breakdown is the same, the regional distribution of Overall effectiveness judgements for LSCBs is slightly more even than for the SIFs. There are good judgements in each region, for example, and the inadequate judgements feature more evenly in the regions too. There is, though, a heavier concentration of good judgements, with the North East, Yorkshire and Humber and the South East regions accounting for over half, with five each. (Chart 8)
Chart 8: Overall effectiveness judgements of LSCB reviews, by region
Responsible Statistician: Adam King, [email protected]
Published on: 13 August 2015. Next publication: July 2016. 20 | P a g e
Official statistics
All children’s homes
Providers and Places as at 31 March 2015
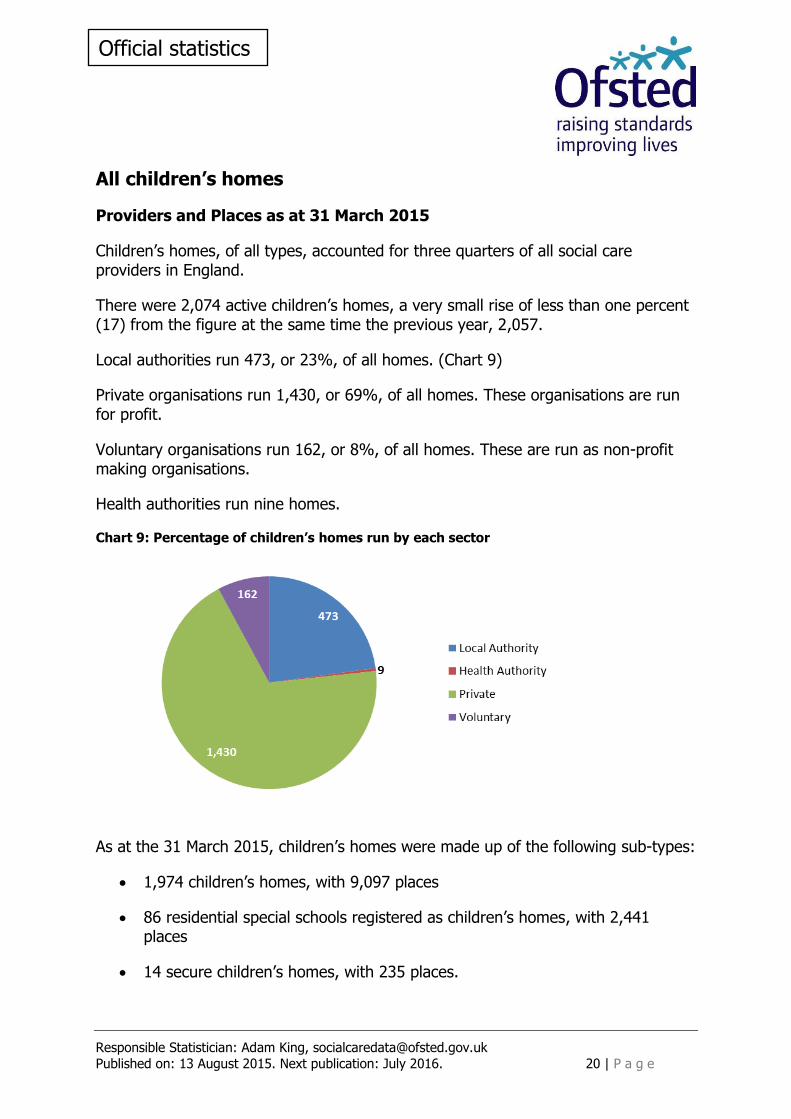
Children’s homes, of all types, accounted for three quarters of all social care providers in England.
There were 2,074 active children’s homes, a very small rise of less than one percent (17) from the figure at the same time the previous year, 2,057.
Local authorities run 473, or 23%, of all homes. (Chart 9)
Private organisations run 1,430, or 69%, of all homes. These organisations are run for profit.
Voluntary organisations run 162, or 8%, of all homes. These are run as non-profit making organisations.
Health authorities run nine homes.
Chart 9: Percentage of children’s homes run by each sector
As at the 31 March 2015, children’s homes were made up of the following sub-types:
1,974 children’s homes, with 9,097 places
86 residential special schools registered as children’s homes, with 2,441 places
14 secure children’s homes, with 235 places.
Responsible Statistician: Adam King, [email protected]
Published on: 13 August 2015. Next publication: July 2016. 21 | P a g e
Official statistics
There were small decreases in the numbers of residential special schools registered as children’s homes and secure homes compared to the previous year and a small rise in the number of children’s homes.16
There were 11,773 registered places in all children’s homes, an increase of just over one percent (179), from the figure at the same time the previous year, 11,594.
In the period 1 April 2014 to 31 March 2015, although the overall numbers of homes and places increased very slightly, this apparent mostly static picture masks some change during the year.
Looking at all categories of children’s homes, 230 children’s homes registered and began to operate and offered 1,330 places.
In the same period, 214 children’s homes, with 1,221 places, were de-registered via voluntary cancellations and Ofsted-initiated cancellations.
Of the 230 homes that were registered during 2014-15, 99 were re-registrations.
The details of each of these sub-types of children’s home will be discussed below.
16 It is not always possible to easily distinguish residential special schools registered as children's homes from children's homes and as such changes in the numbers of these are sometimes the result of updated information rather than new registrations or de-registrations.
Responsible Statistician: Adam King, [email protected]
Published on: 13 August 2015. Next publication: July 2016. 22 | P a g e
Official statistics
Children’s homes
Children’s homes cater for the very large majority of children looked after who are in residential care. They provide care that meets the various, diverse needs of children looked after. Some specialise in a particular set of needs, such as children on the autistic spectrum or children with behavioural difficulties. They are inspected on an annual cycle.
There were 1,974 children’s homes in March 2015, an increase of one per cent (21) from 1,953 in March 2014.
There were 9,097 places in March 2015, an increase of just over one per cent (106) from 8,991 in March 2014.
There were 222 children’s homes which registered in the year, with 1,098 places.
There were 204 children’s homes that de-registered in the year, with 1,062 places.
Children’s homes other than secure homes and residential special schools registered as homes accounted for 96 of the 99 children’s homes re-registrations. Most (79) were re-registrations of children’s homes that de-registered earlier in 2014-15. Of the 79 homes: two moved site but stayed under the same ownership; 11 changed ownership; and 66 were the result of a change in legal status, but kept at least one member of the same ownership group.
Eight children’s homes were re-registrations of homes that had closed in 2013-14 and seven were re-registrations of children’s homes that had closed prior to April 2013.
Two were re-registrations of homes that did not actually close.17
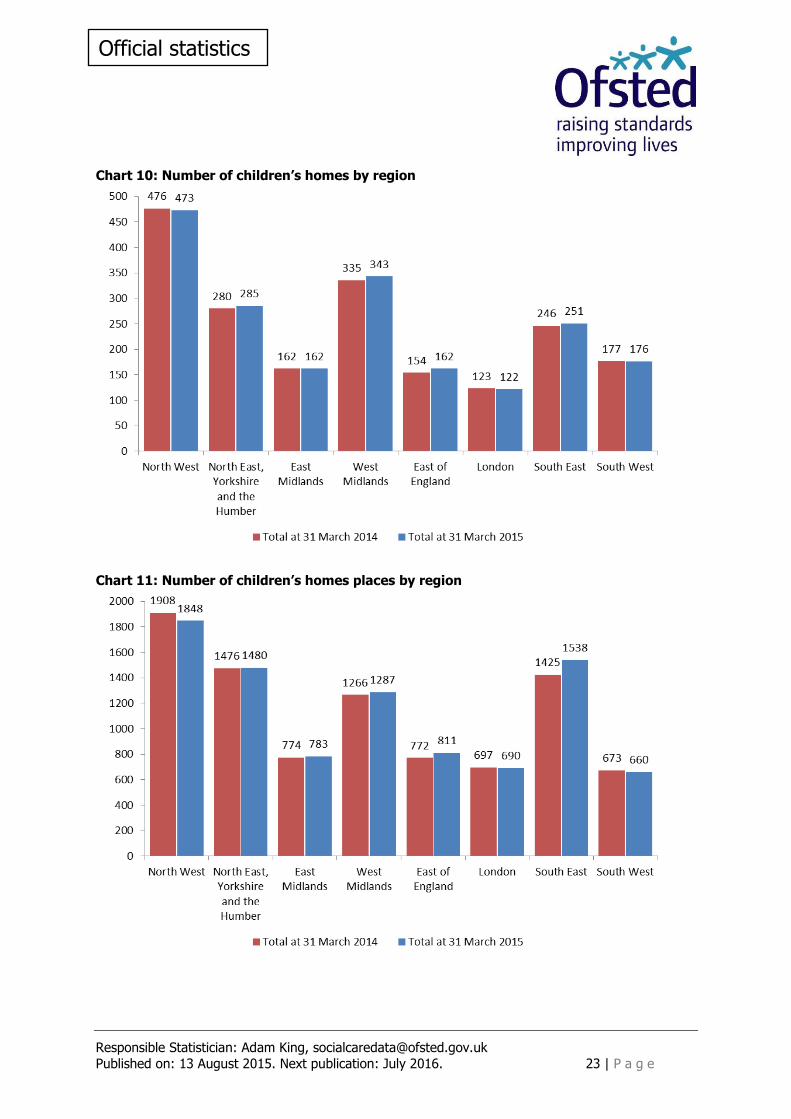
The regional picture of where children’s homes are located has remained largely unchanged since the previous March, with some very small net increases for half the regions. (Chart 10)
17 For example, one was a children’s home already registered with Ofsted which split into two separate children’s homes, with one retaining the current registration and the other obtained a new registration with Ofsted.
Responsible Statistician: Adam King, [email protected]
Published on: 13 August 2015. Next publication: July 2016. 23 | P a g e
Official statistics
Chart 10: Number of children’s homes by region
Chart 11: Number of children’s homes places by region
Responsible Statistician: Adam King, [email protected]
Published on: 13 August 2015. Next publication: July 2016. 24 | P a g e
Official statistics
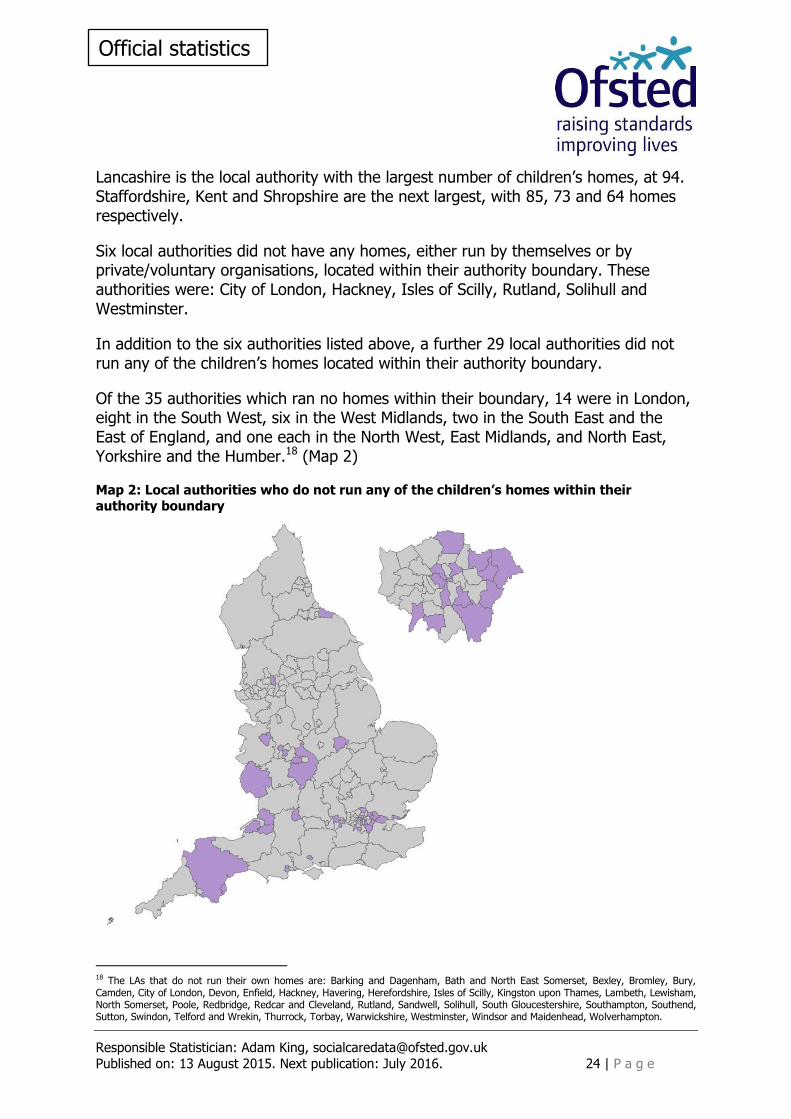
Lancashire is the local authority with the largest number of children’s homes, at 94. Staffordshire, Kent and Shropshire are the next largest, with 85, 73 and 64 homes respectively.
Six local authorities did not have any homes, either run by themselves or by private/voluntary organisations, located within their authority boundary. These authorities were: City of London, Hackney, Isles of Scilly, Rutland, Solihull and Westminster.
In addition to the six authorities listed above, a further 29 local authorities did not run any of the children’s homes located within their authority boundary.
Of the 35 authorities which ran no homes within their boundary, 14 were in London, eight in the South West, six in the West Midlands, two in the South East and the East of England, and one each in the North West, East Midlands, and North East, Yorkshire and the Humber.18 (Map 2)
Map 2: Local authorities who do not run any of the children’s homes within their authority boundary
18 The LAs that do not run their own homes are: Barking and Dagenham, Bath and North East Somerset, Bexley, Bromley, Bury, Camden, City of London, Devon, Enfield, Hackney, Havering, Herefordshire, Isles of Scilly, Kingston upon Thames, Lambeth, Lewisham, North Somerset, Poole, Redbridge, Redcar and Cleveland, Rutland, Sandwell, Solihull, South Gloucestershire, Southampton, Southend, Sutton, Swindon, Telford and Wrekin, Thurrock, Torbay, Warwickshire, Westminster, Windsor and Maidenhead, Wolverhampton.
Responsible Statistician: Adam King, [email protected]
Published on: 13 August 2015. Next publication: July 2016. 25 | P a g e
Official statistics
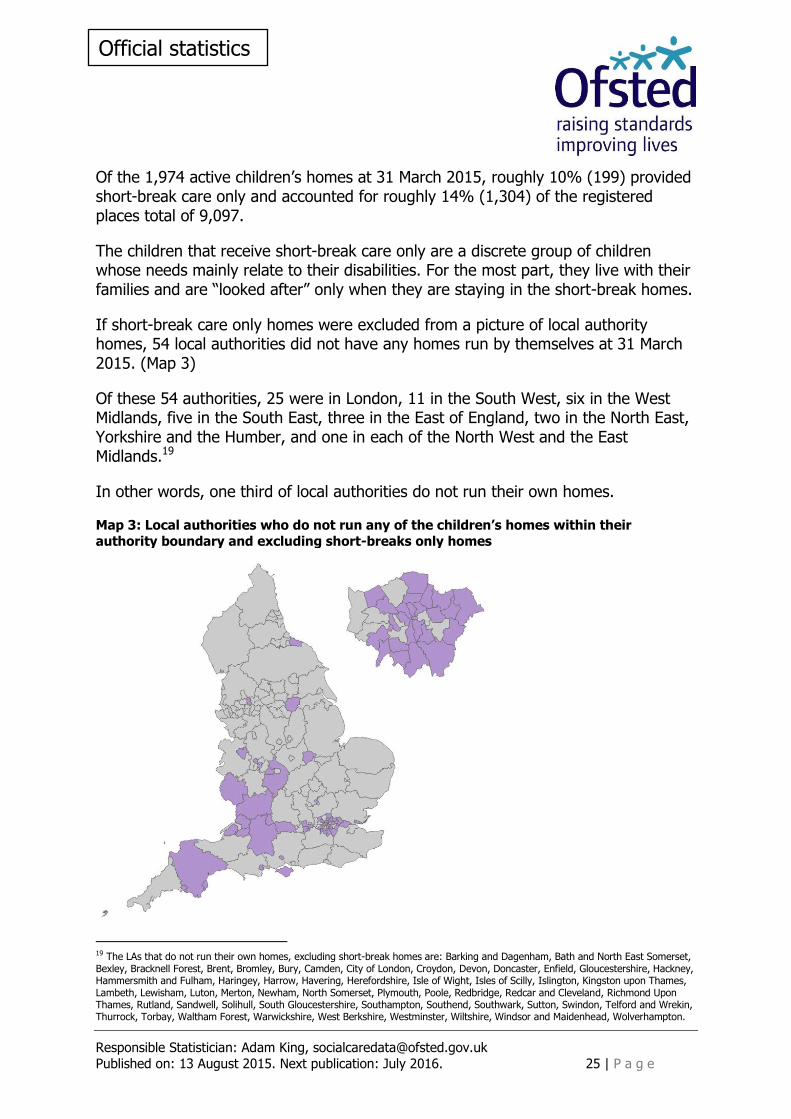
Of the 1,974 active children’s homes at 31 March 2015, roughly 10% (199) provided short-break care only and accounted for roughly 14% (1,304) of the registered places total of 9,097.
The children that receive short-break care only are a discrete group of children whose needs mainly relate to their disabilities. For the most part, they live with their families and are “looked after” only when they are staying in the short-break homes.
If short-break care only homes were excluded from a picture of local authority homes, 54 local authorities did not have any homes run by themselves at 31 March 2015. (Map 3)
Of these 54 authorities, 25 were in London, 11 in the South West, six in the West Midlands, five in the South East, three in the East of England, two in the North East, Yorkshire and the Humber, and one in each of the North West and the East Midlands.19
In other words, one third of local authorities do not run their own homes.
Map 3: Local authorities who do not run any of the children’s homes within their
authority boundary and excluding short-breaks only homes
19 The LAs that do not run their own homes, excluding short-break homes are: Barking and Dagenham, Bath and North East Somerset, Bexley, Bracknell Forest, Brent, Bromley, Bury, Camden, City of London, Croydon, Devon, Doncaster, Enfield, Gloucestershire, Hackney, Hammersmith and Fulham, Haringey, Harrow, Havering, Herefordshire, Isle of Wight, Isles of Scilly, Islington, Kingston upon Thames, Lambeth, Lewisham, Luton, Merton, Newham, North Somerset, Plymouth, Poole, Redbridge, Redcar and Cleveland, Richmond Upon Thames, Rutland, Sandwell, Solihull, South Gloucestershire, Southampton, Southend, Southwark, Sutton, Swindon, Telford and Wrekin, Thurrock, Torbay, Waltham Forest, Warwickshire, West Berkshire, Westminster, Wiltshire, Windsor and Maidenhead, Wolverhampton.
Responsible Statistician: Adam King, [email protected]
Published on: 13 August 2015. Next publication: July 2016. 26 | P a g e
Official statistics
The pattern of short-break care only homes most affects the London region, where 20% (25) of the 122 homes, and 24% (168) of the 690 places, were within short-break only homes. The region with the largest children looked after population has, therefore, by far the fewest homes, and when these short-break homes are excluded, even fewer. This continues to have an impact of the commissioning for the London boroughs.20
Other regions where short-break only homes impacted on the number of providers and places were the South West, the East of England, the South East and the North East, Yorkshire and the Humber. For these regions, between 12% and 14% of homes were short-break only, and accounted for between 16% and 21% of places in these regions.
The pattern of how homes are distributed regionally and places are distributed regionally are not identical.
In England, the large majority of children’s homes were run by either private or voluntary providers. Private providers ran 1,374 homes (70%) and voluntary organisations ran 132 homes (7%).
This represented an increase of 5% (65) in the number of privately-run homes from the previous year. The number of voluntary-run homes reduced by 9% (13).
Less than one quarter of children’s homes (23% or 459) were run by local authorities. The number of homes run by local authorities reduced by 8% (40).
As at 31 March 2015, of the 1,974 active children’s homes (excluding residential special schools registered as children’s homes and secure homes), just under a fifth (351) of these were small (1 to 2 bed) homes.
The regions with the highest number of 1 to 2 bed homes were the North West (135, or 38% of all homes), the West Midlands (91, or 26%) and the South West (56, or 16%). The very large majority (90%) of 1 to 2 bed homes were privately-run homes.
Larger children’s homes, with 10 or more beds, made up 4% (74) of children’s homes, excluding residential special schools registered as children’s homes. Just under half (34) of those homes were local authority-run.
The South East had the highest number of children’s homes that had 10 or more beds, at 21 homes (28% of all homes with 10 or more places).
20 See Ofsted (2015) Children looked after placements by English local authorities p15-18 for further details; https://www.gov.uk/government/statistics/children-looked-after-placements-as-at-31-march-2014
Responsible Statistician: Adam King, [email protected]
Published on: 13 August 2015. Next publication: July 2016. 27 | P a g e
Official statistics
Residential special schools registered as children’s homes
Residential special schools registered as children’s homes are an important sub-group of children’s homes. These homes specialise in educational provision for very vulnerable children, including children looked after.
There were 86 residential special schools registered as children’s homes as at 31 March 2015, two fewer than at the same time the previous year.
There were 2,441 registered places, compared to 2,331 the previous year.
Despite the similarity in the total number of homes, there was, in fact, much change in the period. Eight homes, three of which used to be residential special schools, registered with 232 places. The same number de-registered, with 114 places.21
These homes, which are large, tend to be in more rural areas. As with last year, they are in the more rural authorities of the South East, the South West and the East and West Midlands.
All but one of these homes is private or voluntary-run. The private sector ran 65% (56) of these homes.
Secure children’s homes
Secure children’s homes provide services to young people who have placed themselves, or others, at risk of harm and meets their needs within a secure environment, including residential care, educational facilities and healthcare provision.
As at the 31 March 2015, there were 14 secure children’s homes in England, two fewer than the same time the previous year.
There were 235 places within these homes, compared to 272 places the previous year, a large fall of 14% (37).
All but one of these homes are local authority-run; the sole exception is voluntary-run.
21 The overall fall in the number of homes by two from March 2014, was accounted for by two homes previously identified as residential special schools registered as children’s homes, being re-designated as children’s homes.
Responsible Statistician: Adam King, [email protected]
Published on: 13 August 2015. Next publication: July 2016. 28 | P a g e
Official statistics
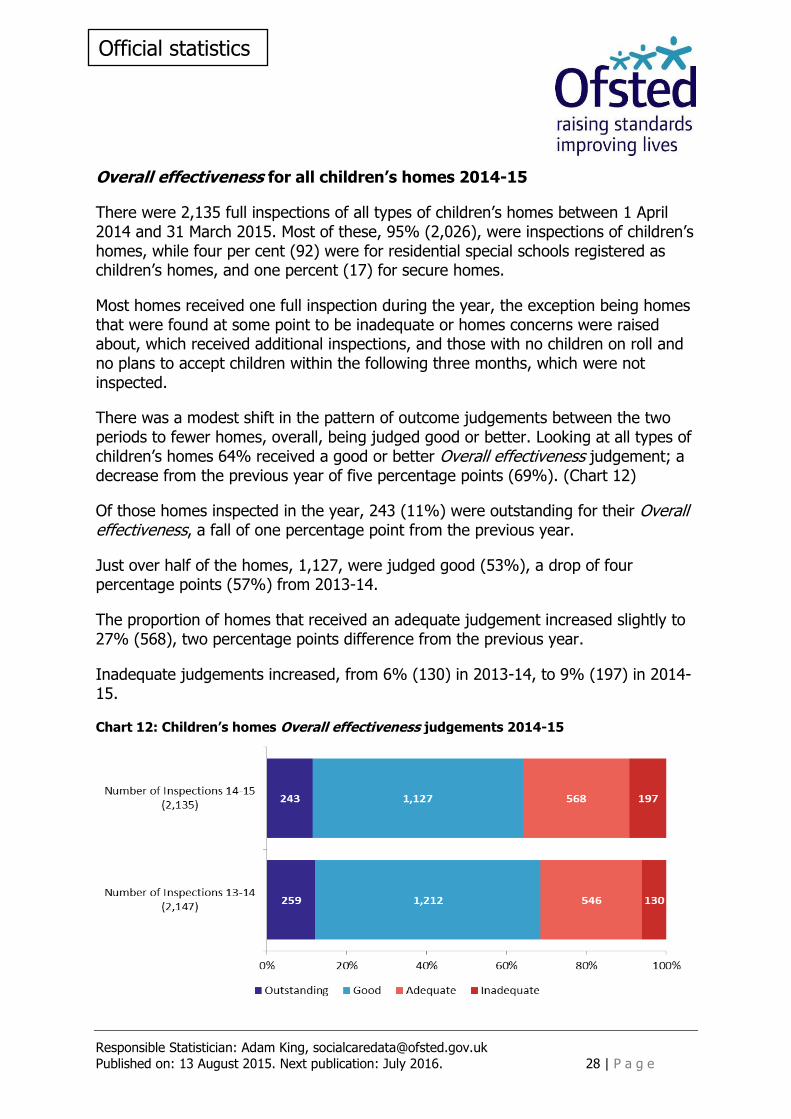
Overall effectiveness for all children’s homes 2014-15
There were 2,135 full inspections of all types of children’s homes between 1 April 2014 and 31 March 2015. Most of these, 95% (2,026), were inspections of children’s homes, while four per cent (92) were for residential special schools registered as children’s homes, and one percent (17) for secure homes.
Most homes received one full inspection during the year, the exception being homes that were found at some point to be inadequate or homes concerns were raised about, which received additional inspections, and those with no children on roll and no plans to accept children within the following three months, which were not inspected.
There was a modest shift in the pattern of outcome judgements between the two periods to fewer homes, overall, being judged good or better. Looking at all types of children’s homes 64% received a good or better Overall effectiveness judgement; a decrease from the previous year of five percentage points (69%). (Chart 12)
Of those homes inspected in the year, 243 (11%) were outstanding for their Overall effectiveness, a fall of one percentage point from the previous year.
Just over half of the homes, 1,127, were judged good (53%), a drop of four percentage points (57%) from 2013-14.
The proportion of homes that received an adequate judgement increased slightly to 27% (568), two percentage points difference from the previous year.
Inadequate judgements increased, from 6% (130) in 2013-14, to 9% (197) in 2014-15.
Chart 12: Children’s homes Overall effectiveness judgements 2014-15
Responsible Statistician: Adam King, [email protected]
Published on: 13 August 2015. Next publication: July 2016. 29 | P a g e
Official statistics
One hundred and seventy three homes were judged inadequate at some point in the year. A few of these homes (nine) were residential special schools registered as children’s homes, but most (164) were children’s homes.
A quarter of the homes found to be inadequate (44) were judged inadequate at their first full inspection of the 2014-15 inspection cycle. A further 129 were originally found to be either adequate or good at their first full inspection of the cycle, but concerns with the relevant homes necessitated a re-inspection.
Three homes, two local authority-run and one privately-run, were found inadequate three consecutive times in the year. A further 18 were found to be inadequate in two consecutive inspections, of which 15 were privately-run, two voluntary-run and one local authority-run.
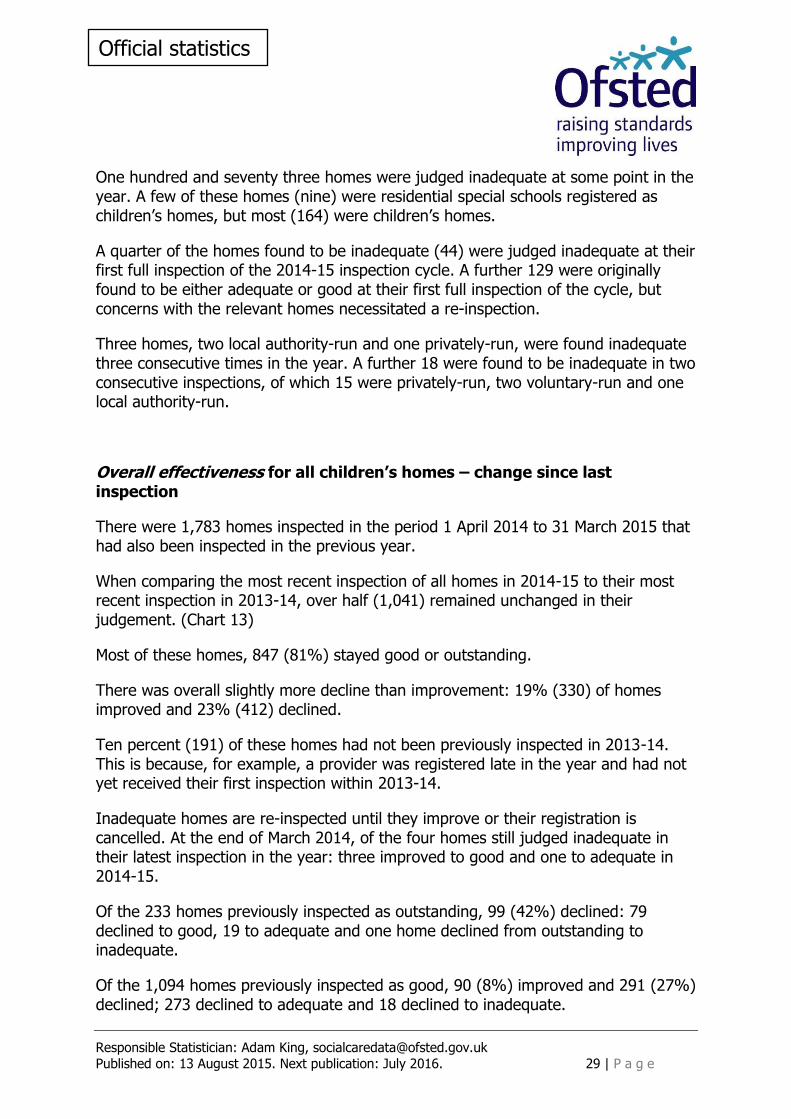
Overall effectiveness for all children’s homes – change since last inspection
There were 1,783 homes inspected in the period 1 April 2014 to 31 March 2015 that had also been inspected in the previous year.
When comparing the most recent inspection of all homes in 2014-15 to their most recent inspection in 2013-14, over half (1,041) remained unchanged in their judgement. (Chart 13)
Most of these homes, 847 (81%) stayed good or outstanding.
There was overall slightly more decline than improvement: 19% (330) of homes improved and 23% (412) declined.
Ten percent (191) of these homes had not been previously inspected in 2013-14. This is because, for example, a provider was registered late in the year and had not yet received their first inspection within 2013-14.
Inadequate homes are re-inspected until they improve or their registration is cancelled. At the end of March 2014, of the four homes still judged inadequate in their latest inspection in the year: three improved to good and one to adequate in 2014-15.
Of the 233 homes previously inspected as outstanding, 99 (42%) declined: 79 declined to good, 19 to adequate and one home declined from outstanding to inadequate.
Of the 1,094 homes previously inspected as good, 90 (8%) improved and 291 (27%) declined; 273 declined to adequate and 18 declined to inadequate.
Responsible Statistician: Adam King, [email protected]
Published on: 13 August 2015. Next publication: July 2016. 30 | P a g e
Official statistics
Over half (236) of the 452 homes that were previously judged as adequate had improved, whereas only 5% (22) declined.
There were 19 homes that were judged inadequate in 2014-15 for Overall effectiveness, that had been judged good or better at their latest inspection in 2013-14; one of the 19 had declined from outstanding.
Chart 13: Change to Overall effectiveness judgement compared to previous inspection
Regional outcomes for all children’s homes 2014-15
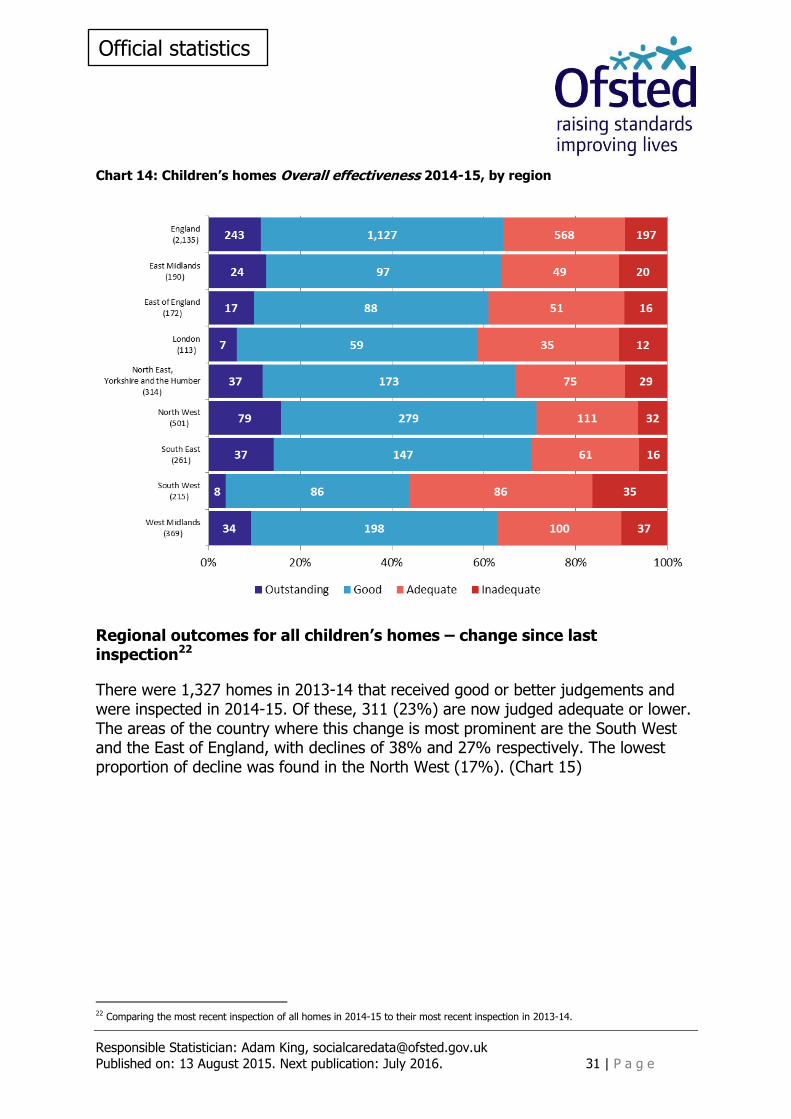
The regions with the highest percentage of good or better homes between 1 April 2014 and 31 March 2015 were the North West (71%), the South East (70%), and the North East, Yorkshire and the Humber (67%). (Chart 14)
The regions with the lowest percentage of homes judged good or better were the South West (44%), London (58%), and the East of England (61%). The national proportion of good or better homes was 64%.
Responsible Statistician: Adam King, [email protected]
Published on: 13 August 2015. Next publication: July 2016. 31 | P a g e
Official statistics
Chart 14: Children’s homes Overall effectiveness 2014-15, by region
Regional outcomes for all children’s homes – change since last inspection22
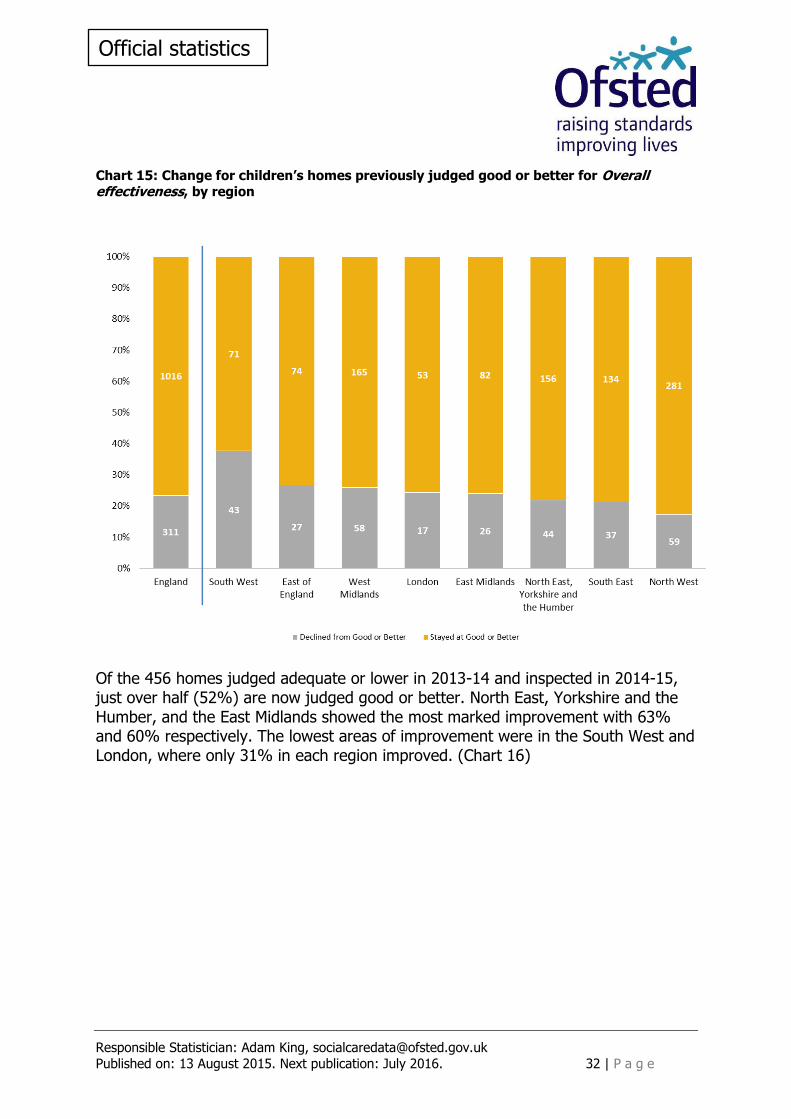
There were 1,327 homes in 2013-14 that received good or better judgements and were inspected in 2014-15. Of these, 311 (23%) are now judged adequate or lower. The areas of the country where this change is most prominent are the South West and the East of England, with declines of 38% and 27% respectively. The lowest proportion of decline was found in the North West (17%). (Chart 15)
22 Comparing the most recent inspection of all homes in 2014-15 to their most recent inspection in 2013-14.
Responsible Statistician: Adam King, [email protected]
Published on: 13 August 2015. Next publication: July 2016. 32 | P a g e
Official statistics
Chart 15: Change for children’s homes previously judged good or better for Overall effectiveness, by region
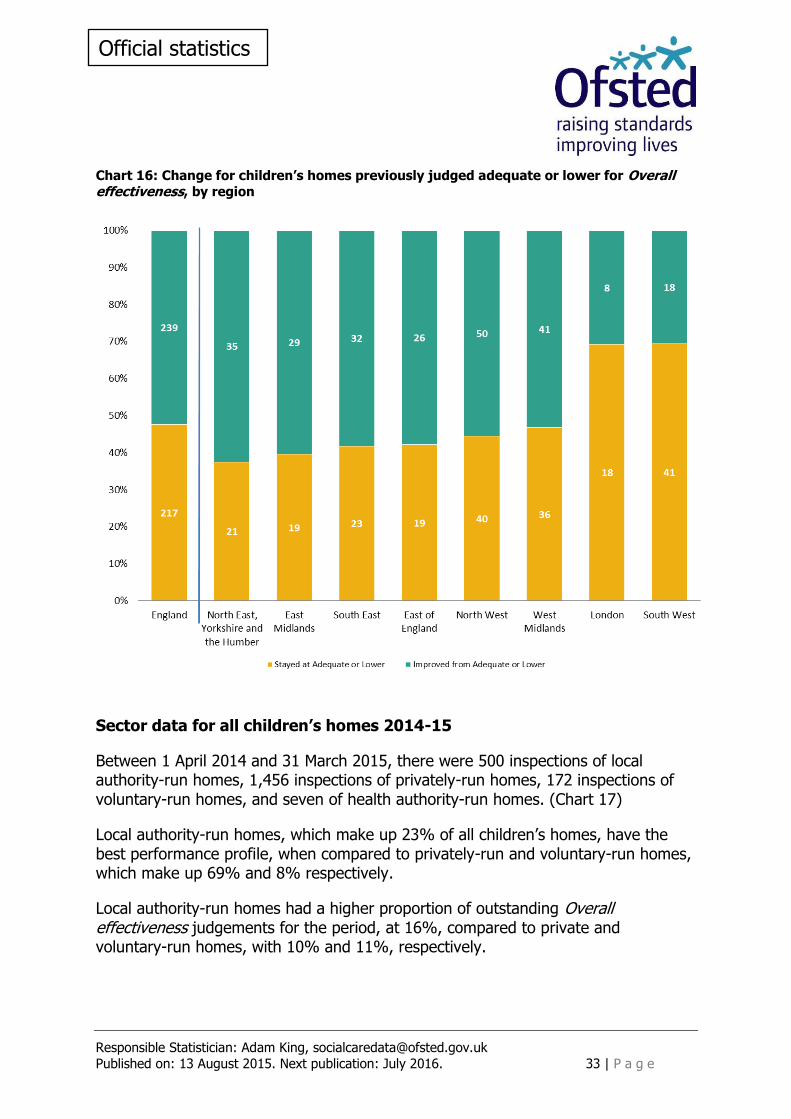
Of the 456 homes judged adequate or lower in 2013-14 and inspected in 2014-15, just over half (52%) are now judged good or better. North East, Yorkshire and the Humber, and the East Midlands showed the most marked improvement with 63% and 60% respectively. The lowest areas of improvement were in the South West and London, where only 31% in each region improved. (Chart 16)
Responsible Statistician: Adam King, [email protected]
Published on: 13 August 2015. Next publication: July 2016. 33 | P a g e
Official statistics
Chart 16: Change for children’s homes previously judged adequate or lower for Overall effectiveness, by region
Sector data for all children’s homes 2014-15
Between 1 April 2014 and 31 March 2015, there were 500 inspections of local authority-run homes, 1,456 inspections of privately-run homes, 172 inspections of voluntary-run homes, and seven of health authority-run homes. (Chart 17)
Local authority-run homes, which make up 23% of all children’s homes, have the best performance profile, when compared to privately-run and voluntary-run homes, which make up 69% and 8% respectively.
Local authority-run homes had a higher proportion of outstanding Overall effectiveness judgements for the period, at 16%, compared to private and voluntary-run homes, with 10% and 11%, respectively.
Responsible Statistician: Adam King, [email protected]
Published on: 13 August 2015. Next publication: July 2016. 34 | P a g e
Official statistics
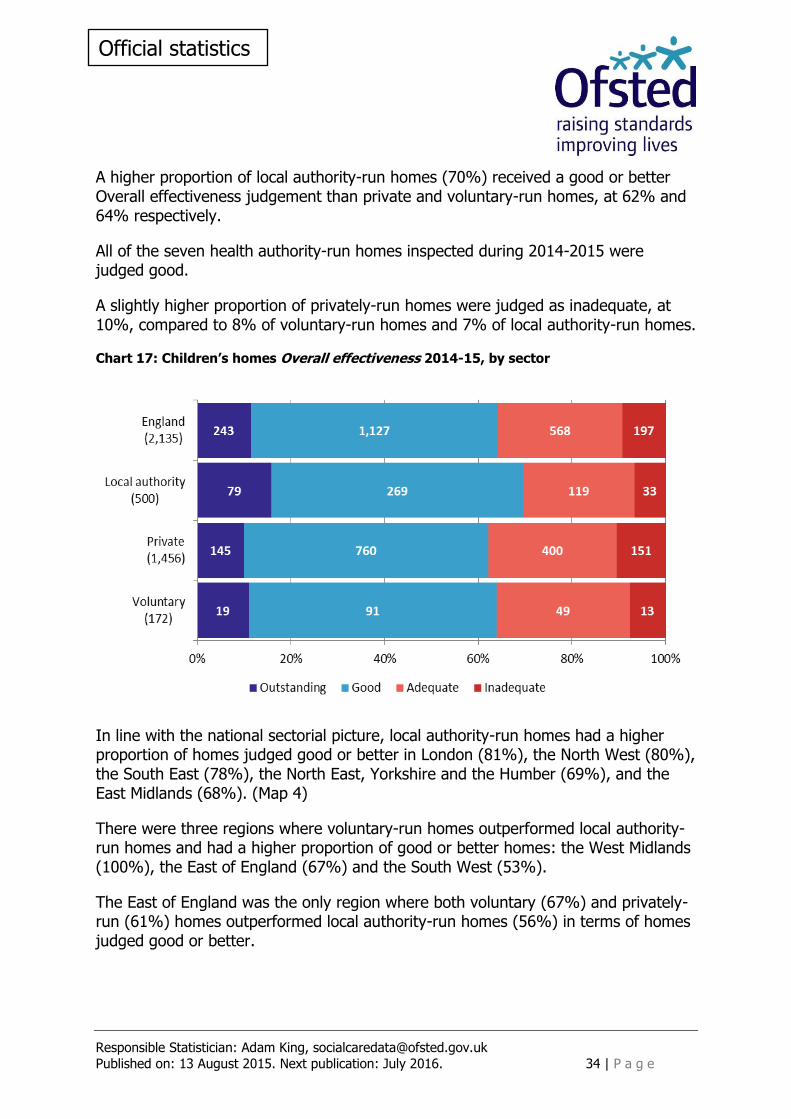
A higher proportion of local authority-run homes (70%) received a good or better Overall effectiveness judgement than private and voluntary-run homes, at 62% and 64% respectively.
All of the seven health authority-run homes inspected during 2014-2015 were judged good.
A slightly higher proportion of privately-run homes were judged as inadequate, at 10%, compared to 8% of voluntary-run homes and 7% of local authority-run homes.
Chart 17: Children’s homes Overall effectiveness 2014-15, by sector
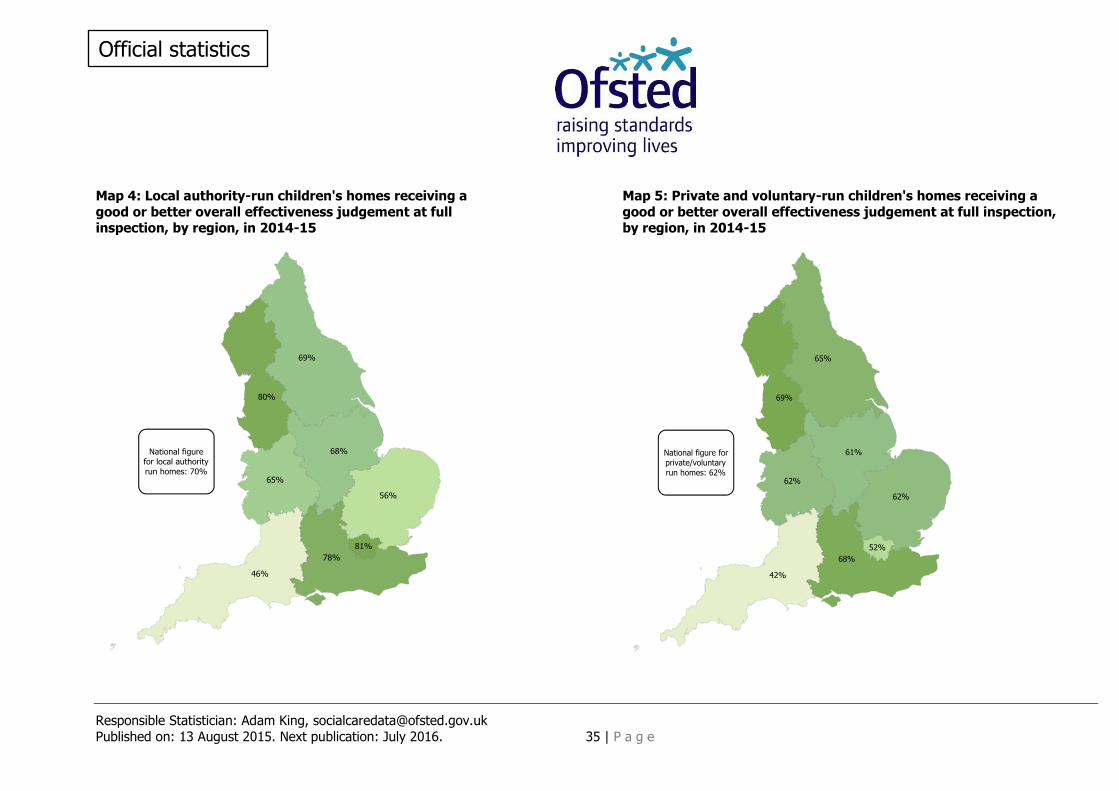
In line with the national sectorial picture, local authority-run homes had a higher proportion of homes judged good or better in London (81%), the North West (80%), the South East (78%), the North East, Yorkshire and the Humber (69%), and the East Midlands (68%). (Map 4)
There were three regions where voluntary-run homes outperformed local authority-run homes and had a higher proportion of good or better homes: the West Midlands (100%), the East of England (67%) and the South West (53%).
The East of England was the only region where both voluntary (67%) and privately-run (61%) homes outperformed local authority-run homes (56%) in terms of homes judged good or better.
Responsible Statistician: Adam King, [email protected]
Published on: 13 August 2015. Next publication: July 2016. 35 | P a g e
Official statistics
Map 4: Local authority-run children's homes receiving a good or better overall effectiveness judgement at full inspection, by region, in 2014-15
Map 5: Private and voluntary-run children's homes receiving a good or better overall effectiveness judgement at full inspection, by region, in 2014-15
Map 4: Local authority-run children's homes receiving a Map 5: Private and voluntary-run children's homes receiving a
good or better overall effectiveness judgement at full good or better overall effectiveness judgement at full inspection, inspection, by region, in 2014-15 by region, in 2014-15
Responsible Statistician: Adam King, [email protected]
Published on: 13 August 2015. Next publication: July 2016. 36 | P a g e
Official statistics
Interim inspections for all children’s homes 2014-15
Between 1 April 2014 and 31 March 2015, there were 1,564 interim inspections of all types of children’s homes.
Of these, 588 (38%) were judged to have improved effectiveness, 719 (46%) were judged to have sustained effectiveness, and 170 (11%) had declined in effectiveness.
There were also 87 (6%) interim inspections that did not receive an inspection judgement as no children were being cared for at the time of inspection.
The North East, Yorkshire and the Humber (50%), East of England (47%), and East Midlands (45%) had the highest proportion of children’s homes that were judged to have improved effectiveness.
For all the regions, except the South West, the proportion of homes that were judged to have declined in effectiveness was similar at between 9% to 11%. In the South West 20% of homes were judged to have declined in effectiveness.
Of the 243 homes found to be outstanding at their most recent full inspection in 2014-15, 152 (94%) either sustained or improved effectiveness in their subsequent interim inspection, nine (6%) declined in effectiveness and one was not judged. Eighty one of these homes did not have a subsequent, published, interim inspection.
Of the 1,124 homes judged good at their most recent full inspection in 2014-15, 746 (90%) had sustained or improved effectiveness at their subsequent interim inspection, 79 (9%) declined in effectiveness and seven were not judged. Two hundred and ninety two of these homes did not have a subsequent, published, interim inspection.
Of the 563 homes judged adequate at their most recent full inspection in 2014-15, 292 (81%) had sustained or improved effectiveness at their subsequent interim inspection, 61 (17%) declined in effectiveness and nine were not judged. Two hundred and one homes did not have a subsequent, published, interim inspection.
Monitoring visits for all children’s homes 2014-15
There were 72 monitoring visits carried out to all types of children’s homes during the year. These visits did not result in outcome judgements for the homes.
Responsible Statistician: Adam King, [email protected]
Published on: 13 August 2015. Next publication: July 2016. 37 | P a g e
Official statistics
Children’s homes Overall effectiveness: the picture for all children’s homes as at 31 March 2015
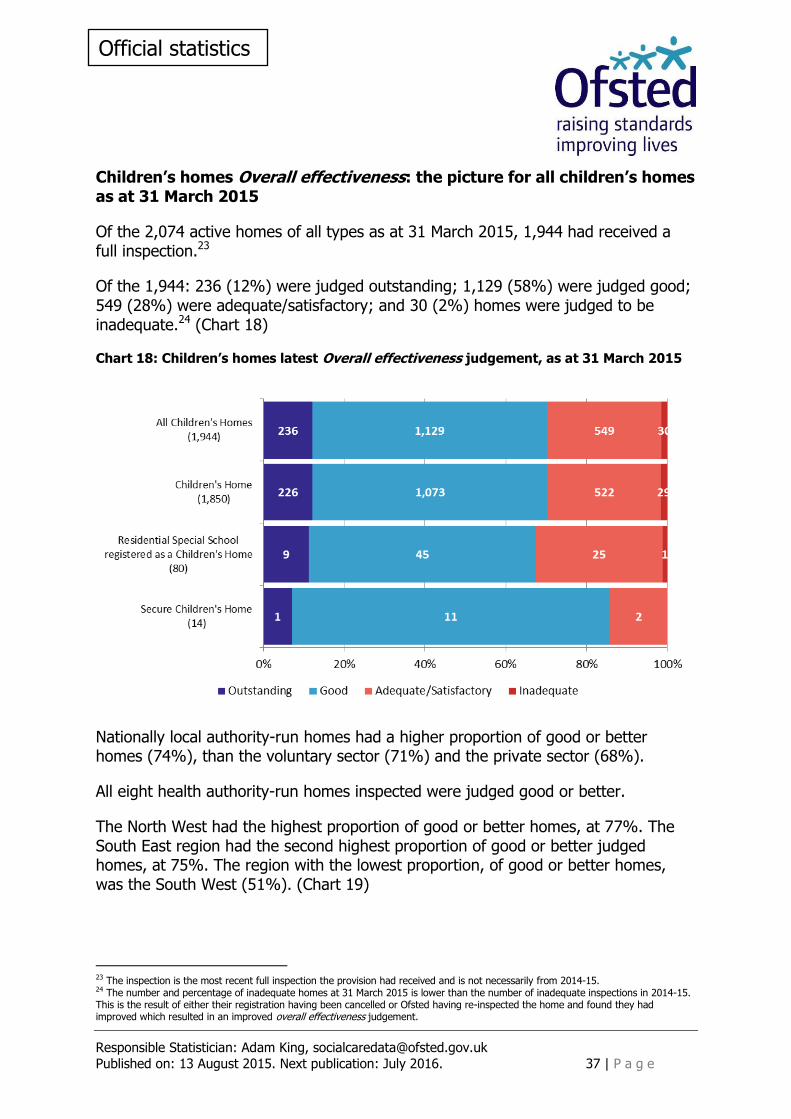
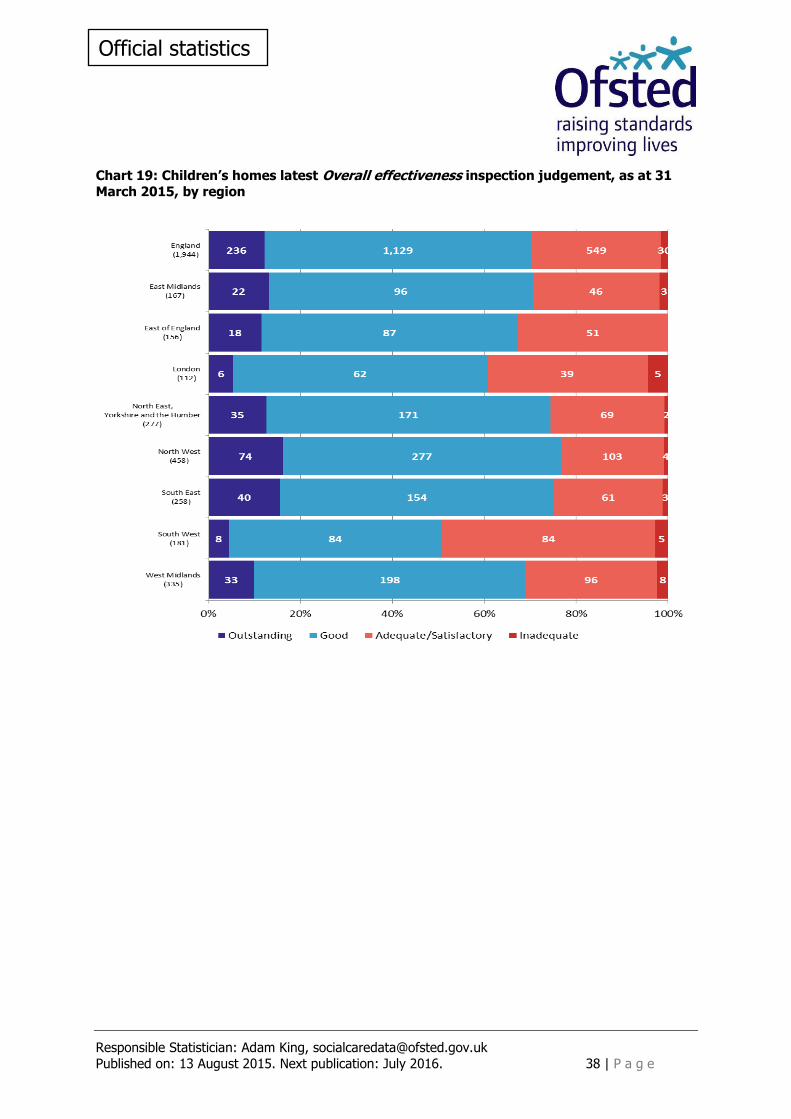
Of the 2,074 active homes of all types as at 31 March 2015, 1,944 had received a full inspection.23
Of the 1,944: 236 (12%) were judged outstanding; 1,129 (58%) were judged good; 549 (28%) were adequate/satisfactory; and 30 (2%) homes were judged to be inadequate.24 (Chart 18)
Chart 18: Children’s homes latest Overall effectiveness judgement, as at 31 March 2015
Nationally local authority-run homes had a higher proportion of good or better homes (74%), than the voluntary sector (71%) and the private sector (68%).
All eight health authority-run homes inspected were judged good or better.
The North West had the highest proportion of good or better homes, at 77%. The South East region had the second highest proportion of good or better judged homes, at 75%. The region with the lowest proportion, of good or better homes, was the South West (51%). (Chart 19)
23 The inspection is the most recent full inspection the provision had received and is not necessarily from 2014-15. 24 The number and percentage of inadequate homes at 31 March 2015 is lower than the number of inadequate inspections in 2014-15. This is the result of either their registration having been cancelled or Ofsted having re-inspected the home and found they had improved which resulted in an improved overall effectiveness judgement.
Responsible Statistician: Adam King, [email protected]
Published on: 13 August 2015. Next publication: July 2016. 38 | P a g e
Official statistics
Chart 19: Children’s homes latest Overall effectiveness inspection judgement, as at 31
March 2015, by region
Responsible Statistician: Adam King, [email protected]
Published on: 13 August 2015. Next publication: July 2016. 39 | P a g e
Official statistics
Other social care providers
Residential Family Centres
Residential family centres provides accommodation for children and their parents, while the parents’ capacity to respond to the children’s needs and to safeguard their welfare is monitored and assessed. They are inspected on a three year cycle; 2014-15 was the second year of the current cycle.
As at the 31 March 2015, there were 38 active residential family centres, compared to 41 the previous year, a fall of seven per cent.
In March 2015, there were 257 places, compared to 292 in 2014, a fall of 12%.25
There was a net decrease of three residential family centres during 2014-15, as eight providers registered and 11 providers de-registered. In terms of the numbers of places for these provisions, this was a net reduction of 33 places: the 11 that de-registered had 80 places and the eight registered 47 places.
Ownership of residential family centres has marginally shifted towards the private sector. All eight new providers registered in 2014-15 were run by the private sector: a net increase of one private provider as seven private providers de-registered. Four residential family centres that de-registered in 2014-15 were run by local authorities and voluntary providers (two in each sector).
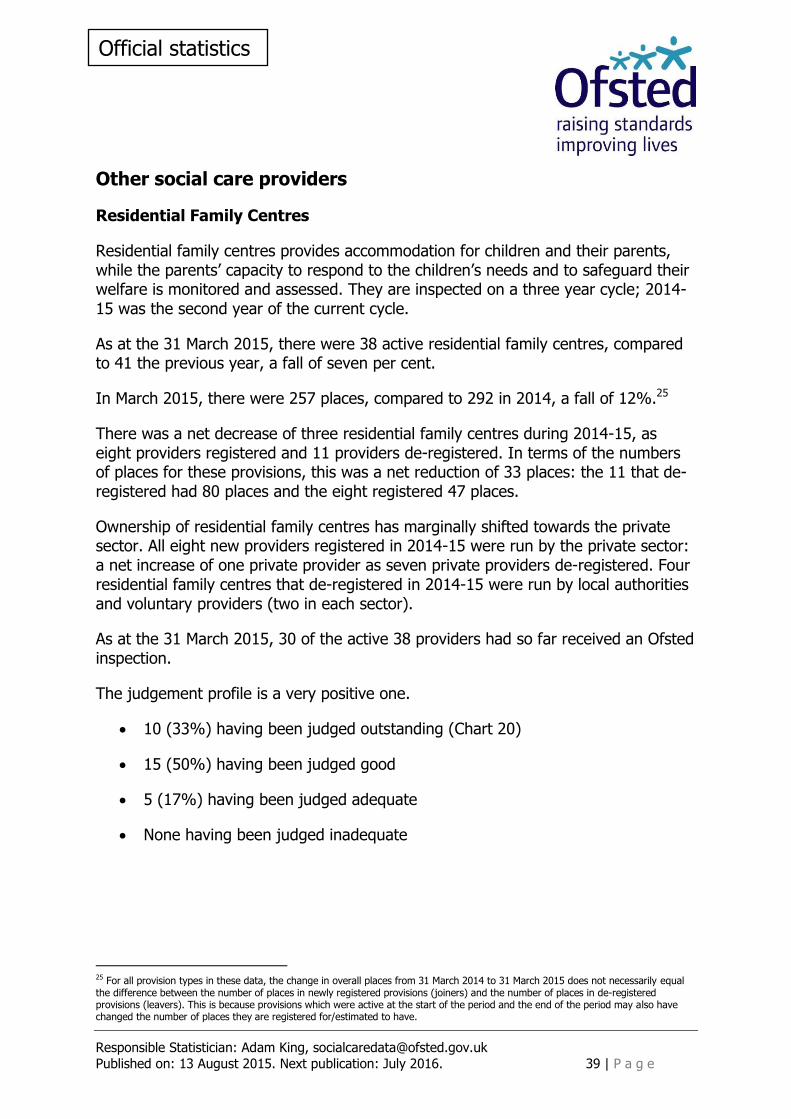
As at the 31 March 2015, 30 of the active 38 providers had so far received an Ofsted inspection.
The judgement profile is a very positive one.
10 (33%) having been judged outstanding (Chart 20)
15 (50%) having been judged good
5 (17%) having been judged adequate
None having been judged inadequate
25 For all provision types in these data, the change in overall places from 31 March 2014 to 31 March 2015 does not necessarily equal the difference between the number of places in newly registered provisions (joiners) and the number of places in de-registered provisions (leavers). This is because provisions which were active at the start of the period and the end of the period may also have changed the number of places they are registered for/estimated to have.
Responsible Statistician: Adam King, [email protected]
Published on: 13 August 2015. Next publication: July 2016. 40 | P a g e
Official statistics
Chart 20: Residential family centres’ latest Overall effectiveness judgement, as at 31
March 2015
Only three inspections of residential family centres were carried out in 2014-15. One was judged outstanding and two were judged good.
Independent Fostering Agencies
An independent fostering agency is a voluntary or private organisation that places children with foster carers, on behalf of a local authority. They are inspected on a three year cycle; 2014-15 was the second year of the current cycle.
There were 300 active independent fostering agencies in England as at the 31 March 2015, compared to 308 the previous year, a three per cent fall.
During the year ending 31 March 2015, 22 agencies registered and 30 de-registered.
Over three quarters of independent fostering agencies were run by the private sector: there were 232 (77%) private providers and 68 (23%) voluntary providers, as at 31 March 2015.
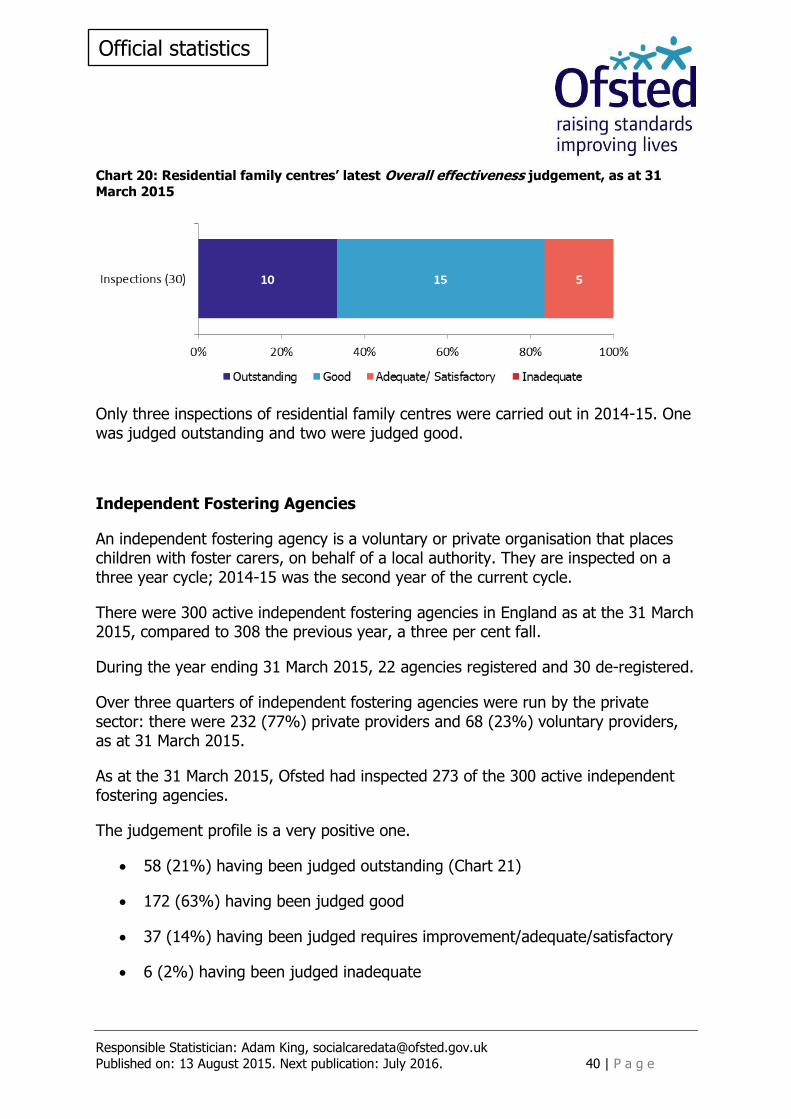
As at the 31 March 2015, Ofsted had inspected 273 of the 300 active independent fostering agencies.
The judgement profile is a very positive one.
58 (21%) having been judged outstanding (Chart 21)
172 (63%) having been judged good
37 (14%) having been judged requires improvement/adequate/satisfactory
6 (2%) having been judged inadequate
Responsible Statistician: Adam King, [email protected]
Published on: 13 August 2015. Next publication: July 2016. 41 | P a g e
Official statistics
Chart 21: Independent fostering agencies’ latest Overall effectiveness judgement, as at
31 March 2015
During 2014-15, there were 101 inspections carried out of 100 independent fostering agencies:26
12 (12%) were judged outstanding
68 (67%) were judged good
14 (14%) were judged requires improvement
7 (7%) were judged inadequate
Voluntary Adoption Agencies
A Voluntary Adoption Agency is a voluntary organisation that recruits and assesses prospective adopters, and matches them with children who are looked after by a local authority, on behalf of the authority, on a non-profit basis. Some agencies also provides services to adoptees and birth relatives. They are inspected on a three year cycle; 2014-15 was the first year of the current cycle.
There were 42 active voluntary adoption agencies in England as at the 31 March 2015, compared to 45 in the previous year.
The small net decrease was because two providers registered and five de-registered. One of the newly registered voluntary adoption agencies was previously a local authority adoption agency.
As at the 31 March 2015, of the 42 active voluntary adoption agencies, 38 had received a full inspection.
The judgement profile is a very positive one:
26 One agency was inspected twice during the year.
Responsible Statistician: Adam King, [email protected]
Published on: 13 August 2015. Next publication: July 2016. 42 | P a g e
Official statistics
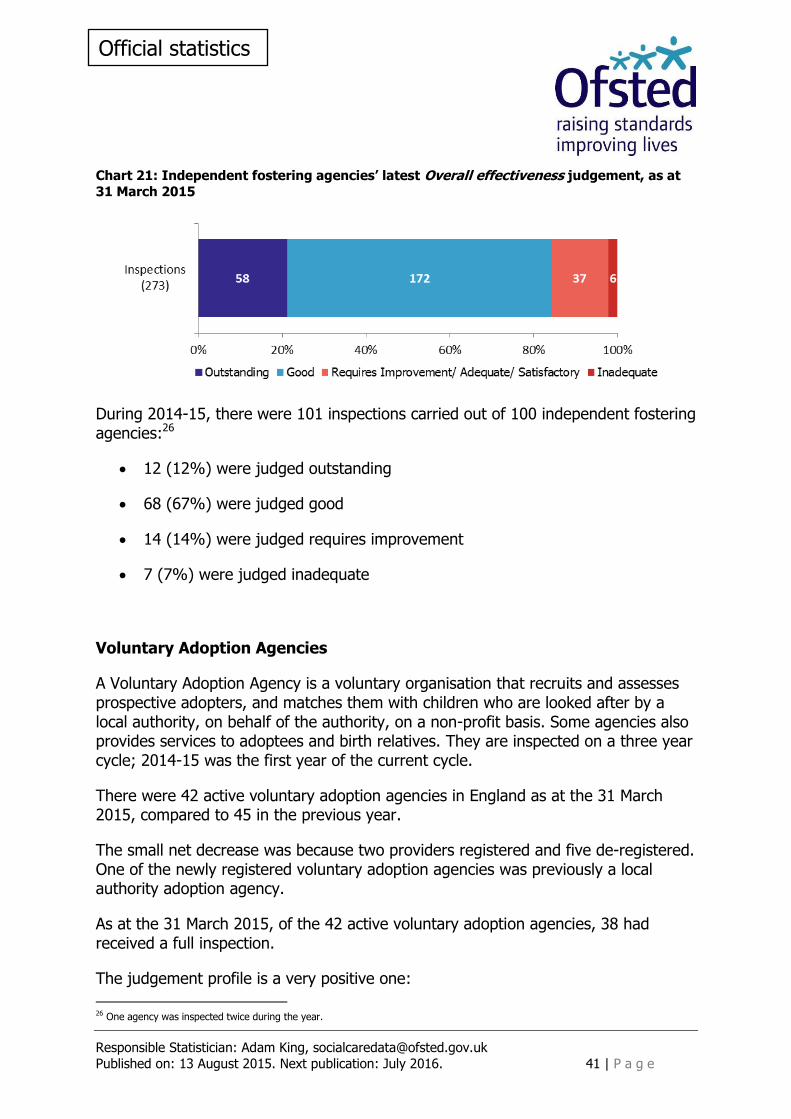
16 (42%) having been judged outstanding (Chart 22)
18 (47%) having been judged good
4 (11%) having been judged requires improvement/adequate/satisfactory
None having been judged inadequate
Chart 22: Voluntary adoption agencies’ latest Overall effectiveness judgement, as at 31
March 2015
Between 1 April 2014 and 31 March 2015, there were 13 inspections of voluntary adoption agencies.
The majority of inspections resulted in agencies being judged good or better: four were outstanding and eight good. One agency was judged requires improvement.
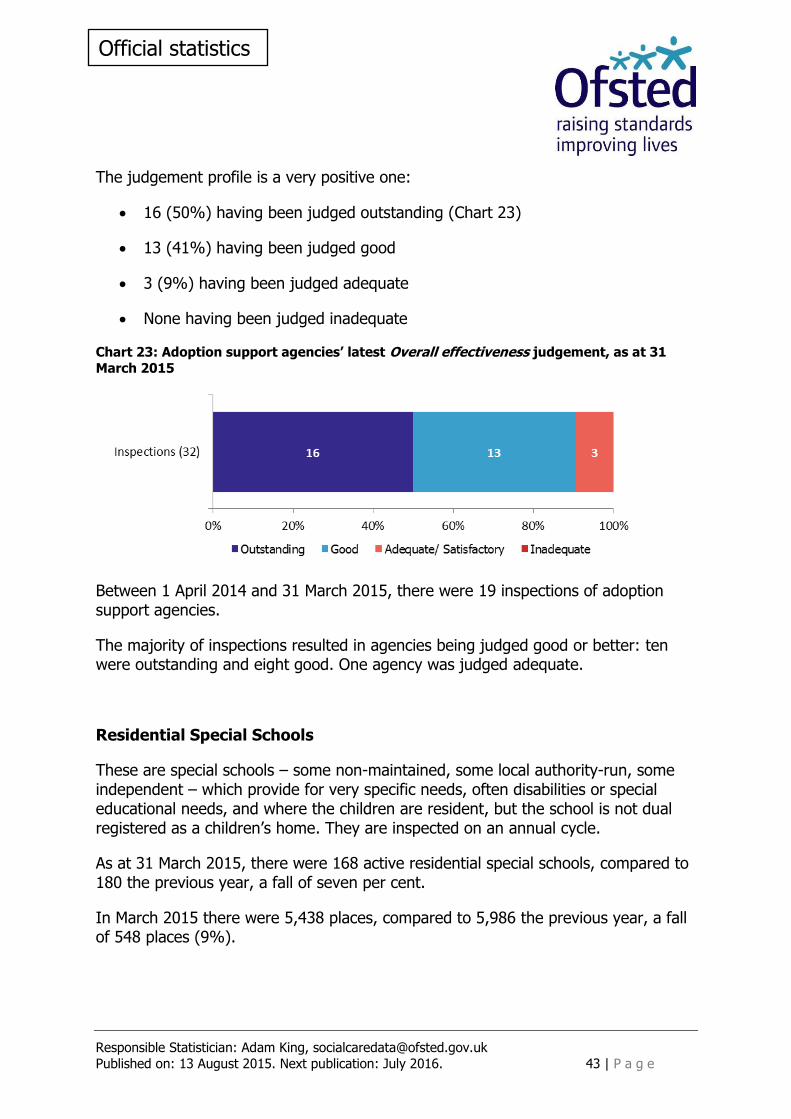
Adoption Support Agencies
Adoption support agencies provide services to anyone touched by adoption, of any age. They are inspected on a three year cycle; 2014-15 was the first year of the current cycle.
As at the 31 March 2015, there were 35 active Adoption Support Agencies.
This was a net decrease of two providers since last year, as three providers registered and five de-registered during 2014-15.
Two thirds of adoption support agencies (23) are run by the private sector. One third (12) are run by the voluntary sector.
As at the 31 March 2015, of the 35 active adoption support agencies, 32 had been inspected by Ofsted.
Responsible Statistician: Adam King, [email protected]
Published on: 13 August 2015. Next publication: July 2016. 43 | P a g e
Official statistics
The judgement profile is a very positive one:
16 (50%) having been judged outstanding (Chart 23)
13 (41%) having been judged good
3 (9%) having been judged adequate
None having been judged inadequate
Chart 23: Adoption support agencies’ latest Overall effectiveness judgement, as at 31
March 2015
Between 1 April 2014 and 31 March 2015, there were 19 inspections of adoption support agencies.
The majority of inspections resulted in agencies being judged good or better: ten were outstanding and eight good. One agency was judged adequate.
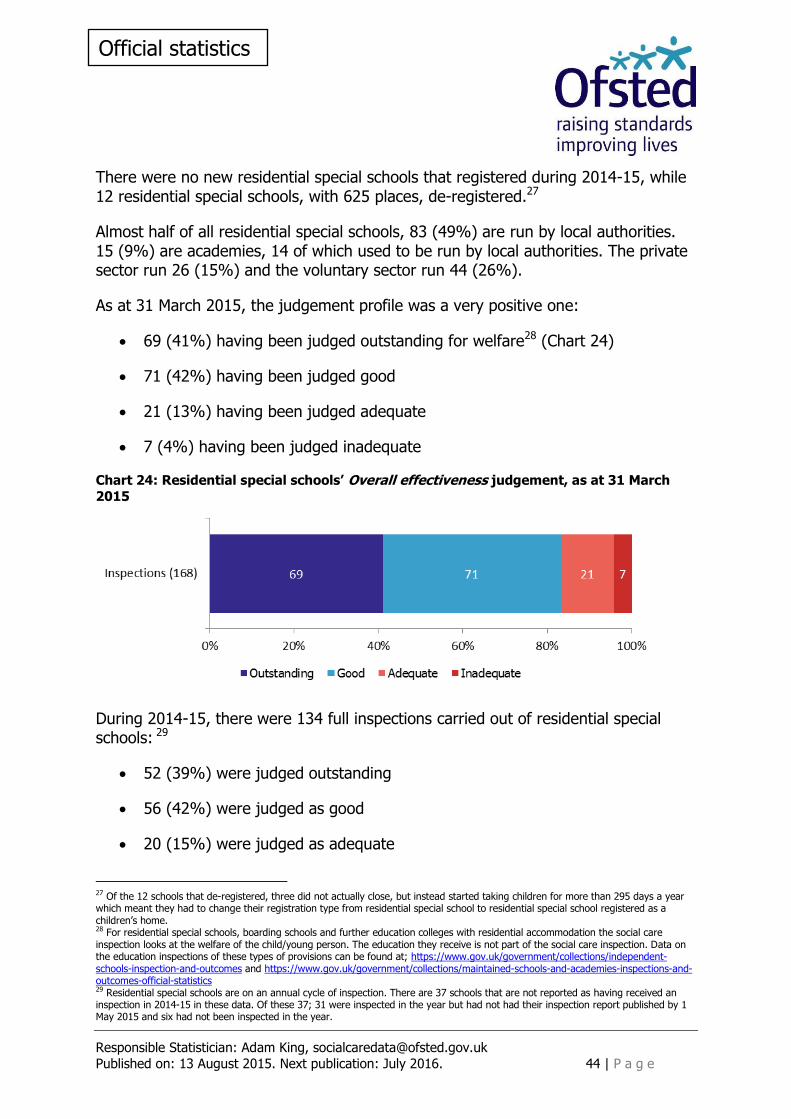
Residential Special Schools
These are special schools – some non-maintained, some local authority-run, some independent – which provide for very specific needs, often disabilities or special educational needs, and where the children are resident, but the school is not dual registered as a children’s home. They are inspected on an annual cycle.
As at 31 March 2015, there were 168 active residential special schools, compared to 180 the previous year, a fall of seven per cent.
In March 2015 there were 5,438 places, compared to 5,986 the previous year, a fall of 548 places (9%).
Responsible Statistician: Adam King, [email protected]
Published on: 13 August 2015. Next publication: July 2016. 44 | P a g e
Official statistics
There were no new residential special schools that registered during 2014-15, while 12 residential special schools, with 625 places, de-registered.27
Almost half of all residential special schools, 83 (49%) are run by local authorities. 15 (9%) are academies, 14 of which used to be run by local authorities. The private sector run 26 (15%) and the voluntary sector run 44 (26%).
As at 31 March 2015, the judgement profile was a very positive one:
69 (41%) having been judged outstanding for welfare28 (Chart 24)
71 (42%) having been judged good
21 (13%) having been judged adequate
7 (4%) having been judged inadequate
Chart 24: Residential special schools’ Overall effectiveness judgement, as at 31 March
2015
During 2014-15, there were 134 full inspections carried out of residential special schools: 29
52 (39%) were judged outstanding
56 (42%) were judged as good
20 (15%) were judged as adequate
27 Of the 12 schools that de-registered, three did not actually close, but instead started taking children for more than 295 days a year which meant they had to change their registration type from residential special school to residential special school registered as a children’s home. 28 For residential special schools, boarding schools and further education colleges with residential accommodation the social care inspection looks at the welfare of the child/young person. The education they receive is not part of the social care inspection. Data on the education inspections of these types of provisions can be found at; https://www.gov.uk/government/collections/independent-schools-inspection-and-outcomes and https://www.gov.uk/government/collections/maintained-schools-and-academies-inspections-and-outcomes-official-statistics 29 Residential special schools are on an annual cycle of inspection. There are 37 schools that are not reported as having received an inspection in 2014-15 in these data. Of these 37; 31 were inspected in the year but had not had their inspection report published by 1 May 2015 and six had not been inspected in the year.
Responsible Statistician: Adam King, [email protected]
Published on: 13 August 2015. Next publication: July 2016. 45 | P a g e
Official statistics
6 (4%) were judged as inadequate.
Between 1 April 2014 and 31 March 2015, there were six monitoring visits carried out where four residential special schools were judged to have made good progress and two were judged to be not meeting the national minimum standards.
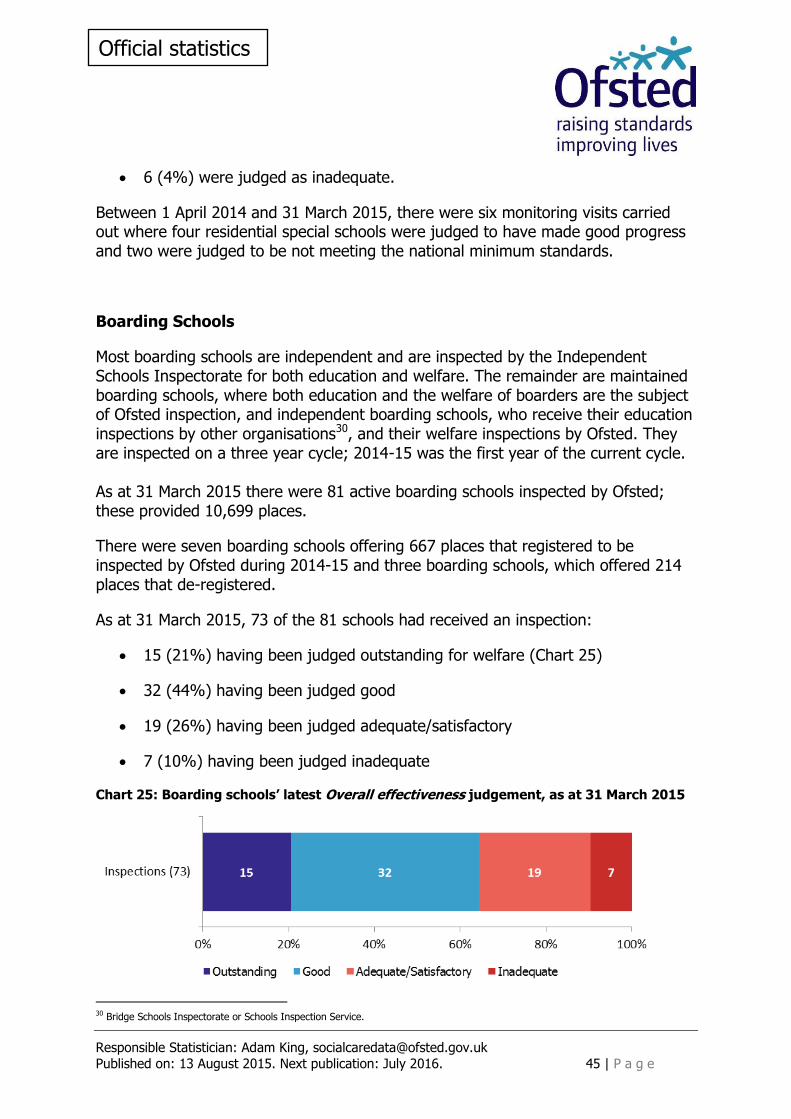
Boarding Schools
Most boarding schools are independent and are inspected by the Independent Schools Inspectorate for both education and welfare. The remainder are maintained boarding schools, where both education and the welfare of boarders are the subject of Ofsted inspection, and independent boarding schools, who receive their education inspections by other organisations30, and their welfare inspections by Ofsted. They are inspected on a three year cycle; 2014-15 was the first year of the current cycle. As at 31 March 2015 there were 81 active boarding schools inspected by Ofsted; these provided 10,699 places.
There were seven boarding schools offering 667 places that registered to be inspected by Ofsted during 2014-15 and three boarding schools, which offered 214 places that de-registered.
As at 31 March 2015, 73 of the 81 schools had received an inspection:
15 (21%) having been judged outstanding for welfare (Chart 25)
32 (44%) having been judged good
19 (26%) having been judged adequate/satisfactory
7 (10%) having been judged inadequate
Chart 25: Boarding schools’ latest Overall effectiveness judgement, as at 31 March 2015
30 Bridge Schools Inspectorate or Schools Inspection Service.
Responsible Statistician: Adam King, [email protected]
Published on: 13 August 2015. Next publication: July 2016. 46 | P a g e
Official statistics
There were 16 full inspections of boarding schools carried out between 1 April 2014 and 31 March 2015.
Two schools were judged to be outstanding, eight good, three adequate and three inadequate.
Between 1 April 2014 and 31 March 2015, there were six monitoring visits carried out where five boarding schools were judged to have made good progress and one was judged to be not meeting the national minimum standards.
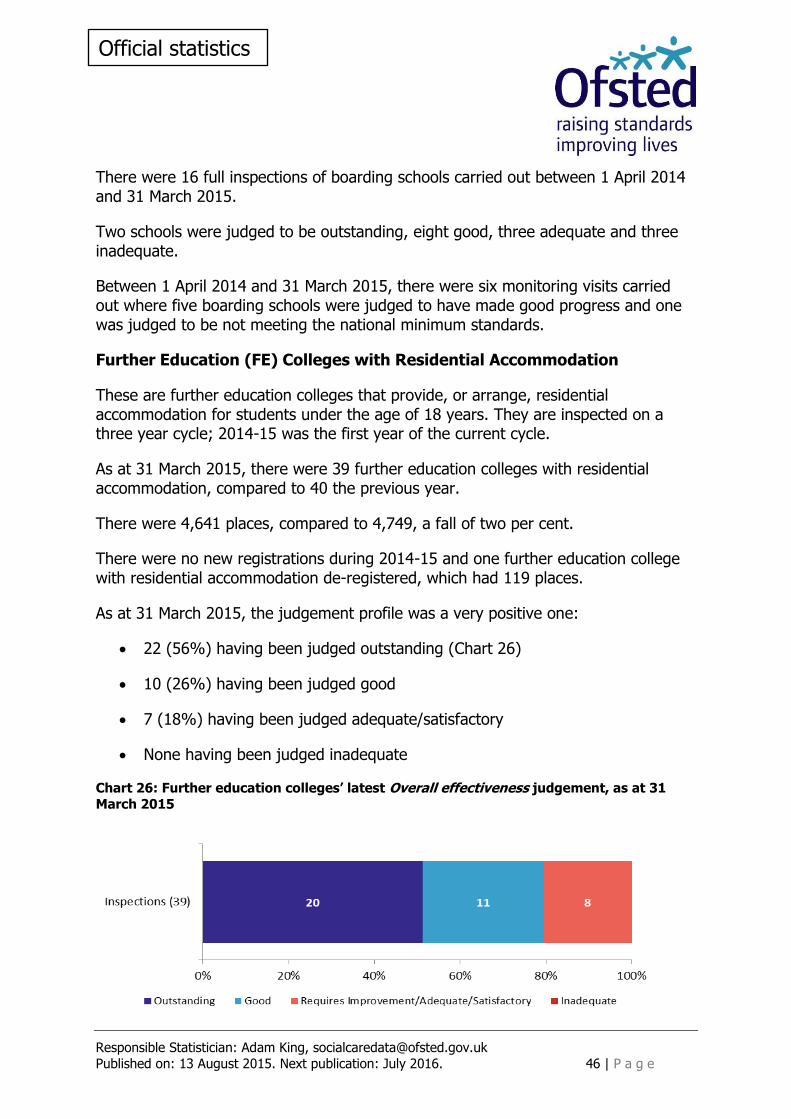
Further Education (FE) Colleges with Residential Accommodation
These are further education colleges that provide, or arrange, residential accommodation for students under the age of 18 years. They are inspected on a three year cycle; 2014-15 was the first year of the current cycle.
As at 31 March 2015, there were 39 further education colleges with residential accommodation, compared to 40 the previous year.
There were 4,641 places, compared to 4,749, a fall of two per cent.
There were no new registrations during 2014-15 and one further education college with residential accommodation de-registered, which had 119 places.
As at 31 March 2015, the judgement profile was a very positive one:
22 (56%) having been judged outstanding (Chart 26)
10 (26%) having been judged good
7 (18%) having been judged adequate/satisfactory
None having been judged inadequate
Chart 26: Further education colleges’ latest Overall effectiveness judgement, as at 31
March 2015
Responsible Statistician: Adam King, [email protected]
Published on: 13 August 2015. Next publication: July 2016. 47 | P a g e
Official statistics
Seven further education colleges with residential accommodation were inspected during 2014-15.31 Five were judged to be outstanding, one was judged to be good and one was judged to be requires improvement. There were fewer inspections than usual in 2014-15 due to the introduction of a new inspection framework in January 2015.
Residential Holiday Schemes for Disabled Children
A residential holiday scheme for disabled children provides care and accommodation wholly or mainly for disabled children for a specified period for the purposes of a holiday, or for recreational, sporting, cultural or educational purposes. They are inspected on an annual cycle.
As at 31 March 2015 there were six active residential holiday schemes for disabled children.
Of the six homes, four had been inspected in 2014-15 and two had yet to be inspected since registering. Two schemes were judged outstanding and two were judged good.
Secure Training Centres
Secure training centres accommodate young people between the ages of 12 and 17 who have been remanded or sentenced by the courts. They are inspected on an annual cycle.
As at 31 March 2015 there were four active secure training centres. The four centres were inspected in 2014-15 and three were judged good and one was judged inadequate.
31 This figure includes six further education colleges with residential accommodation inspections which are not included in the main tables in the accompanying Excel document. They are not in the Excel tables due to the data not being part of the database where the Excel data were taken from. The six inspections have been manually added to the underlying data in the Excel document.
Responsible Statistician: Adam King, [email protected]
Published on: 13 August 2015. Next publication: July 2016. 48 | P a g e
Official statistics
List of charts
Chart 1: SIF Overall effectiveness from November 2013 to June 2015 8
Chart 2: SIF Overall effectiveness and key judgements from November 2013 to June 2015 10
Chart 3: SIF sub-judgements from November 2013 to June 2015 11
Chart 4: SIF Overall effectiveness judgements, by region 13
Chart 5: Children who need help and protection judgements, change from previous inspection judgement 16
Chart 6: Children looked after and achieving permanence judgements, change from previous inspection judgement 17
Chart 7: Overall effectiveness judgements for LSCB reviews from November 2013 to June 2015 18
Chart 8: Overall effectiveness judgements of LSCB reviews, by region 19
Chart 9: Percentage of children’s homes run by each sector 20
Chart 10: Number of children’s homes by region 23
Chart 11: Number of children’s homes places by region 23
Chart 12: Children’s homes Overall effectiveness judgements 2014-15 28
Chart 13: Change to Overall effectiveness judgement compared to previous inspection 30
Chart 14: Children’s homes Overall effectiveness 2014-15, by region 31
Chart 15: Change for children’s homes previously judged good or better for Overall effectiveness, by region 32
Chart 16: Change for children’s homes previously judged adequate or lower for Overall effectiveness, by region 33
Chart 17: Children’s homes Overall effectiveness 2014-15, by sector 34
Map 4: Local authority-run children's homes receiving a good or better overall effectiveness judgement at full inspection, by region, in 2014-15 35
Map 5: Private and voluntary-run children's homes receiving a good or better overall effectiveness judgement at full inspection, by region, in 2014-15 35
Chart 18: Children’s homes latest Overall effectiveness judgement, as at 31 March 2015 37
Chart 19: Children’s homes latest Overall effectiveness inspection judgement, as at 31 March 2015, by region 38
Chart 20: Residential family centres’ latest Overall effectiveness judgement, as at 31 March 2015 40
Chart 21: Independent fostering agencies’ latest Overall effectiveness judgement, as at 31 March 2015 41
Chart 22: Voluntary adoption agencies’ latest Overall effectiveness judgement, as at 31 March 2015 42
Chart 23: Adoption support agencies’ latest Overall effectiveness judgement, as at 31 March 2015 43
Chart 24: Residential special schools’ Overall effectiveness judgement, as at 31 March 2015 44
Responsible Statistician: Adam King, [email protected]
Published on: 13 August 2015. Next publication: July 2016. 49 | P a g e
Official statistics
Chart 25: Boarding schools’ latest Overall effectiveness judgement, as at 31 March 2015 45
Chart 26: Further education colleges’ latest Overall effectiveness judgement, as at 31 March 2015 46
List of tables
Table 1: National number of children’s social care providers and places six monthly, by provision type ............................................................................................... 50
List of maps
Map 1: SIF inspection Overall effectiveness judgements from November 2013 to June 2015 ......................................................................................................... 14
Map 2: Local authorities who do not run any of the children’s homes within their authority boundary............................................................................................. 24
Map 3: Local authorities who do not run any of the children’s homes within their authority boundary and excluding short-breaks only homes .................................. 25
Map 4: Local authority-run children's homes receiving a good or better overall effectiveness judgement at full inspection, by region, in 2014-15 .......................... 35
Map 5: Private and voluntary-run children's homes receiving a good or better overall effectiveness judgement at full inspection, by region, in 2014-15 .......................... 35
Responsible Statistician: Adam King, [email protected]
Published on: 13 August 2015. Next publication: July 2016. 50 | P a g e
Official statistics
Annex 1
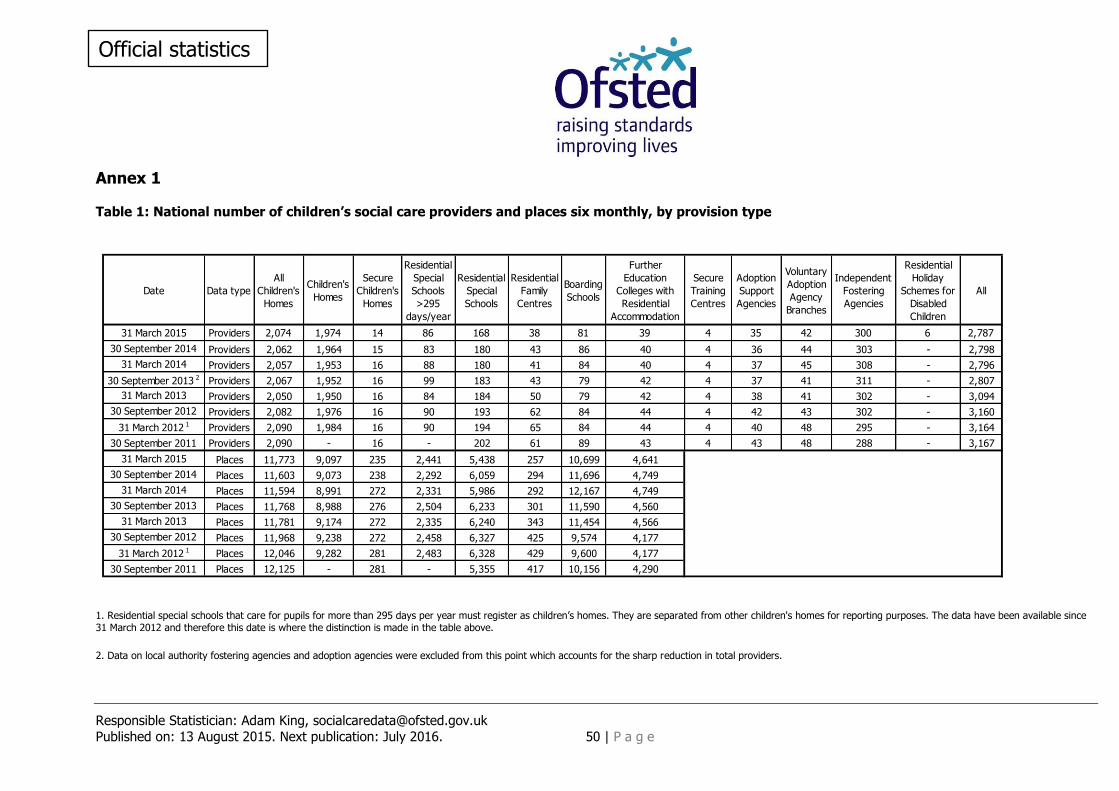
Table 1: National number of children’s social care providers and places six monthly, by provision type
Date Data type
All
Children's
Homes
Children's
Homes
Secure
Children's
Homes
Residential
Special
Schools
>295
days/year
Residential
Special
Schools
Residential
Family
Centres
Boarding
Schools
Further
Education
Colleges with
Residential
Accommodation
Secure
Training
Centres
Adoption
Support
Agencies
Voluntary
Adoption
Agency
Branches
Independent
Fostering
Agencies
Residential
Holiday
Schemes for
Disabled
Children
All
31 March 2015 Providers 2,074 1,974 14 86 168 38 81 39 4 35 42 300 6 2,787
30 September 2014 Providers 2,062 1,964 15 83 180 43 86 40 4 36 44 303 - 2,798
31 March 2014 Providers 2,057 1,953 16 88 180 41 84 40 4 37 45 308 - 2,796
30 September 2013 2 Providers 2,067 1,952 16 99 183 43 79 42 4 37 41 311 - 2,807
31 March 2013 Providers 2,050 1,950 16 84 184 50 79 42 4 38 41 302 - 3,094
30 September 2012 Providers 2,082 1,976 16 90 193 62 84 44 4 42 43 302 - 3,160
31 March 2012 1 Providers 2,090 1,984 16 90 194 65 84 44 4 40 48 295 - 3,164
30 September 2011 Providers 2,090 - 16 - 202 61 89 43 4 43 48 288 - 3,167
31 March 2015 Places 11,773 9,097 235 2,441 5,438 257 10,699 4,641
30 September 2014 Places 11,603 9,073 238 2,292 6,059 294 11,696 4,749
31 March 2014 Places 11,594 8,991 272 2,331 5,986 292 12,167 4,749
30 September 2013 Places 11,768 8,988 276 2,504 6,233 301 11,590 4,560
31 March 2013 Places 11,781 9,174 272 2,335 6,240 343 11,454 4,566
30 September 2012 Places 11,968 9,238 272 2,458 6,327 425 9,574 4,177
31 March 2012 1 Places 12,046 9,282 281 2,483 6,328 429 9,600 4,177
30 September 2011 Places 12,125 - 281 - 5,355 417 10,156 4,290
1. Residential special schools that care for pupils for more than 295 days per year must register as children’s homes. They are separated from other children's homes for reporting purposes. The data have been available since 31 March 2012 and therefore this date is where the distinction is made in the table above.
2. Data on local authority fostering agencies and adoption agencies were excluded from this point which accounts for the sharp reduction in total providers.
Responsible Statistician: Adam King, [email protected]
Published on: 13 August 2015. Next publication: July 2016. 51 | P a g e
Official statistics
Revisions to previous release
Revisions are published in line with Ofsted’s revisions policy for official statistics. For more information about the policy, please visit the Ofsted website or access the policy via the following link: https://www.gov.uk/government/publications/ofsted-standards-for-official-statistics.
Some of the data contained here have previously been published as provisional data, as one of the four previous releases which have now been combined into one.
The data that fall into this category are children’s homes full and interim inspection outcomes covering the period 1 July 2014 – 30 September 2014, and full inspection outcomes covering the period 1 April 2014 – 30 September 2014 for all other non-LA provision types.
The revision of statistics relating to all children’s homes inspections between the 1 July 2014 – 30 September 2014 from ‘provisional’ to ‘revised’ status includes outcomes relating to a further 199 inspections. These consist of an additional 177 full inspections and 22 interim inspections, which took place in the period and have been published since 1 November 2014.
Of the additional 177 full inspections, 122 homes received a good or better Overall effectiveness judgement and 55 received adequate or lower. These additional inspections mean only a small change to the grade profile presented in the previous provisional data.
The revision of statistics relating to all other non-LA provision type full inspections between the 1 April 2014 – 30 September 2014 from ‘provisional’ to ‘revised’ status includes outcomes relating to a further 13 inspections.
There were an additional two boarding school inspections, four independent fostering agencies, one residential family centre and six residential special schools. These additional inspections mean only a small change to the grade profile presented in the previous provisional data.
The data that make up these revised statistics can be found in the worksheet in the accompanying Excel document called ‘Provider level in year 2014-15’. By filtering these worksheets on the date of inspection you can obtain the data.

Responsible Statistician: Adam King, [email protected]
Published on: 13 August 2015. Next publication: July 2016. 52 | P a g e
Official statistics
Notes
An explanation about key uses of these data and further contextual information and the arrangements for quality assurance are provided in the accompanying Quality and Methodology report.
The Quality and Methodology report can be found at the following webpage: www.gov.uk/government/collections/childrens-social-care-statistics under the heading ‘Children's social care data in England’.
The report also provides information about, strengths and limitations of the statistics. The key strength of the data are that the data belong to Ofsted and we have robust systems to capture and record data about registration details and inspections. All data is administrative data which is extracted directly from Ofsted’s Regulatory Support Application (RSA) system. A limitation of the data is that the data is exclusively sourced from Ofsted and there are no other sources to verify. All the inspections covered in this release are published on the Ofsted website. The main inspection page can be found at the following link and from there you can search for particular Unique Reference Number (URN) or search by provision type. http://reports.ofsted.gov.uk/
As a new release, covering a period of one year, and not directly comparable to a single previous release, the data within this release are given a status of provisional. The children’s homes 2014-15 inspection data and the LA inspections up until 30 June 2015 data will be revised in the six monthly release in December 2015. The other 2014-15 inspection data will be revised in the next version of ‘Children’s social care data in England’ in July 2016. The inspection data as at 31 March 2015 and the providers and places data as at 31 March 2015, are fixed point in time data and will not be revised.
Responsible Statistician: Adam King, [email protected]
Published on: 13 August 2015. Next publication: July 2016. 53 | P a g e
Official statistics
Glossary
Adoption agencies The focus of all adoption agencies is on placing children successfully into adoptive families who the agency recruits, assesses, prepares and supports, so they will meet the children’s needs and enable them to develop and achieve throughout their lives. The services maintained by local authorities are described in section 3(1) of the Adoption and Children Act 2002. Local authorities place children with adoptive families recruited and approved by themselves, by other local authorities or by voluntary adoption agencies who must register with Ofsted. Adoption agencies may also provide birth records, counselling and intermediary services to adoptees and birth relatives. There are three branches of voluntary adoption agencies in Wales which are inspected by Ofsted because their head offices are in England. These are not included in this publication. Adoption support agencies Adoption support agencies are defined by section 8 of the Adoption and Children Act 2002 and provide services to anyone touched by adoption and are registered with Ofsted. This includes counselling and help for children and adults to gain information about their adoption or to trace birth relatives. Adoption support agencies can be either organisations or individuals, and may be contracted by a local authority to provide support services. Boarding schools The majority of boarding schools are independent and belong to associations which are members of the Independent Schools Council. As both education and welfare in these schools are inspected by their own inspectorate, Ofsted does not inspect these schools and so they are not included in the data. The remainder are maintained boarding schools where both education and the welfare of boarders are the subject of Ofsted inspection and independent boarding schools which are members of the Bridge Schools Inspectorate or Schools Inspection Service and who receive their education inspections by these organisations and their welfare inspections by Ofsted. Children’s homes A children’s home is defined in section 1 of the Care Standards Act 2000, and is an establishment that provides care and accommodation wholly or mainly for children. Children’s homes vary in size and nature. They fulfil a range of purposes designed to meet the different needs of those children and young people who are assessed as needing a residential care placement. Some homes, for example, provide short-breaks which are needed to help support children and their family. Some residential special schools are registered as children’s homes because boarders are resident for more than 295 days per year.
Responsible Statistician: Adam King, [email protected]
Published on: 13 August 2015. Next publication: July 2016. 54 | P a g e
Official statistics
Fostering agencies Local authority fostering services are defined by section 4 of the Care Standards Act 2000. Local authority fostering agencies and independent fostering agencies recruit, prepare, assess, train and support foster carers. Independent fostering agencies (IFAs) are private companies or charities, which are registered with Ofsted and provide placements to children and young people with foster carers approved by them. IFAs work closely with local authorities to deliver these placements. Further education colleges with residential accommodation The care provision of further education colleges that provide, or arrange, residential accommodation for one or more students under the age of 18 years. Ofsted inspects these colleges under section 87 of the children act 1989 as amended by the Care Standards Act 2000. Where a college is registered as a care home, the residential provision is inspected by the Care Quality Commission rather than by Ofsted. Places The term ‘places’ used in this report refers to the number of places for which the social care provider has capacity. This number usually will not, therefore, be the same as the actual number of children who are receiving services from the provider. Ofsted holds data relating to places for: children's homes; secure children's homes; residential special schools; residential family centres; boarding schools; and further education colleges. For some of these providers Ofsted does not hold data relating to places. Where this is the case, the number of places has been estimated. For all other provision types, and aggregated provision types, places data are not available. Providers Children’s social care providers are those institutions or organisations or agencies that provide services to the relevant children and young people. The providers commented on within this report include children’s homes, secure children’s homes, residential special schools, residential family centres, boarding schools, residential further education colleges, secure training centres, residential holiday schemes for disabled children, adoption support agencies, voluntary adoption agencies, and independent fostering services. Residential family centres Residential family centres are defined in section 4(2) of the Care Standards Act 2000 as establishments at which: a) accommodation is provided for children and their parents; b) the parents’ capacity to respond to the children’s needs and to safeguard their welfare is monitored and assessed; and c) the parents are given such advice, guidance and counselling is considered necessary.
Responsible Statistician: Adam King, [email protected]
Published on: 13 August 2015. Next publication: July 2016. 55 | P a g e
Official statistics
Residential holiday schemes for disabled children A residential holiday scheme for disabled children provides care and accommodation wholly or mainly for disabled children for a specified period for the purposes of a holiday, or for recreational, sporting, cultural or educational purposes. Ofsted inspects these schemes under the Care Standards Act 2000, Part 2 (Extension of the Application of Part 2 to Holiday Schemes for Disabled Children) (England) Regulations 2013. Residential special schools Residential special schools are defined in section 59 of the Safeguarding Vulnerable Groups Act 2006. They vary in size and nature. The sector includes large non-maintained special schools which make provision for very specific needs and take children as full boarders from all over the country, to smaller more local providers catering for children with a range of different special needs and disabilities who may be resident at the school only during the week. Some residential special schools are registered as children’s homes because boarders are resident for more than 295 days per year. There are also a small number of independent residential special schools who also tend to cater for children with very specialist needs. Sector Sector refers to the type of provider that owns the children’s social care provision. Academy These are publicly funded independent schools who are run by trusts. Health Authority These are NHS Trust-run. Local Authority These are public bodies responsible for the children’s social care provision. Private These are for-profit organisations mostly with limited company status. These can also though be individually owned children’s social care provision and run for profit. Voluntary These are mostly not-for-profit organisations, mainly with charitable status. These can also be individually owned children’s social care provision and run on a not-for-profit basis. Secure children’s homes Secure children’s homes are defined by section 25 of the Children Act 1989. They accommodate children and young people who are remanded or have been
Responsible Statistician: Adam King, [email protected]
Published on: 13 August 2015. Next publication: July 2016. 56 | P a g e
Official statistics
sentenced for committing a criminal offence. They also accommodate children and young people who are placed there by a court because their behaviour is deemed to present a significant and immediate threat to their safety or the safety of others, unless they are placed in a secure environment. Ofsted inspections are conducted in accordance with the Care Standards Act 2000 and judgements in reports are made in relation to the outcomes for children set out in the Children Act 2004. The criteria are the same as those used to inspect non-secure children’s homes. Secure training centres Secure training centres are defined by section 43(1) (d) of the Prison Act 1952, as amended by Section 6(2) of the Criminal Justice and Public Order Act 1994. Ofsted has the power to inspect under section 146 Education and Inspections Act 2006 and inspects both the care and educational provision for children in four secure training centres. They accommodate young people between the ages of 12 and 17 who have been remanded or sentenced by the courts. The centres are under contract to the Youth Justice Board, which monitors their compliance with requirements. Ofsted does not regulate secure training centres but has an agreement with the Youth Justice Board to inspect care twice a year and education once a year. If you have any comments or feedback on this publication, please contact the Social Care Data & Analysis Team on 03000 130 020 or [email protected].
© Crown copyright You may re-use this information (not including logos) free of charge in any format or medium, under
the terms of the Open Government Licence. To view this licence, visit
http://www.nationalarchives.gov.uk/doc/open-government-licence/ or write to the Information Policy Team, The National Archives, Kew, London, TW9 4DU or e-mail: [email protected]