Embed Size (px)
Citation preview
STOP START
George Smith, Kathy Sylva, Teresa Smith, Pam Sammons and Aghogho Omonigho
- April 2018
Survival, decline or closure? Children’s centres in England, 2018
2
Contents Contents ................................................................................................................................... 2
Foreword ................................................................................................................................... 3
Executive Summary .................................................................................................................... 4
Recommendations ...................................................................................................................... 6
1. Sure Start children’s centres: policy and purpose (2009-2017) ........................................... 7
2. Research design and data sources ..................................................................................... 9
3. Counting children’s centres ............................................................................................ 10
The ‘headline’ count ............................................................................................................. 10
Headline count by area ......................................................................................................... 13
4. Children’s centre services 2017: local authority service results .......................................... 17
Services on offer in 2017 ...................................................................................................... 17
Were children’s centres open access or a service for referred families? ....................................... 20
Organisation and management ............................................................................................... 22
How are children’s centres organised? ................................................................................... 22
Who operates the centres? ..................................................................................................... 23
The principal reasons for change ............................................................................................ 24
Changes in the pipeline ......................................................................................................... 27
Creative strategies in response to local authority cuts ............................................................... 28
5. Six case studies ............................................................................................................ 29
Londonborough .................................................................................................................... 29
Portcity .............................................................................................................................. 30
Shipcity ............................................................................................................................... 31
Rivershire ............................................................................................................................ 33
Midshire ............................................................................................................................. 34
Northport ............................................................................................................................. 35
Conclusion: Children’s centres in 2017 ...................................................................................... 37
Glossary .................................................................................................................................. 40
References .............................................................................................................................. 41
3
Foreword There are many levers we can pull to improve social mobility through the life of a young person – their schooling, university and job opportunities are all hugely important. Yet what happens in the five years before formal school begins plays a big part in shaping that young person’s journey. It is also a crucial - and often difficult - time for parents, trying to balance the wellbeing and development of their child with the need to provide financial stability. Early years childcare and education is hard to get right. Last year, the Sutton Trust published new research showing that while we have made good progress over the last 20 years on early education provision, there remains a substantial gap in the school readiness of less well-off children and their more advantaged classmates by the time they start school. This gap has finally started to narrow but remains at over 17 percentage points. We have also published recently the results of trials showing the impact of different approaches to engaging parents. At the heart of the greater focus on early years since the start of the millennium has been the Sure Start children’s centre programme. The most ambitious of the 3,600 centres brought together a multitude of services designed to improve the life chances of young children and their families – early education and childcare, health visitors, parenting classes, help for mums to find work, playgroups. Services were open to all, but there was a focus on the poorest families. Since 2010, there have been many surveys highlighting the decline in the number of such centres. This new research delves beneath those headlines to get a more detailed picture of what’s been happening. In some ways, the picture looks worse than we feared: as many as a third of all centres have closed, with more to come. But the report also finds big differences between areas and in the range of services still on offer. In some cases, centres have merged and offer services to older children too; in others, the universality that had seen families of all backgrounds using the centres has been lost. The decision by Ofsted no longer to act as a register for children’s centres has made it harder to track what’s happening. More positively, the proportion of centres in the most disadvantaged areas appears to have been maintained. Sure Start had its problems – and its impact on the poorest was sometimes not as great as might have been hoped – but if we are serious about social mobility we need to stop the piecemeal closure of these vital community resources and ensure they are again made part of a clear national strategy to improve social mobility in the early years. That is a challenge for ministers as much as local authorities. I hope our report helps them recognise the importance of acting now. I am grateful to Prof Kathy Sylva, George Smith, Teresa Smith, Prof Pam Sammons and their team for this important new research. Sir Peter Lampl Founder of the Sutton Trust and Chairman of the Education Endowment Foundation
4
Executive Summary
The Sure Start children’s centre programme was one of the key initiatives under the last Labour government, bringing together services for young children and their families and acting as the gateway to more specialised provision. Focused initially on the most disadvantaged areas in England, the programme was later extended to all areas but with lower levels of provision. By its peak in August 2009, there were 3,632 centres, with 54% in the 30% most disadvantaged areas. The programme was initially managed by a government team and the budget ring-fenced.
From 2005 onwards, responsibility for children’s centres was increasingly devolved to local authority level. Under the coalition government after 2010, the budget was no longer ring-fenced but merged with other programmes. National guidance on the ‘core purpose’ of children’s centres in 2013 shifted focus to targeting ‘high need’ families, rather than open access to universal services. Substantial reductions in overall funding for local authorities meant the ‘early intervention’ allocation fell by 64% between 2010/11 and 2017/18.
This study, using administrative data, a survey of local authorities and a series of case studies, paints a picture of what has happened to children’s centres across England. It shows decline, both in numbers and services, but also adaptation and a struggle to survive.
The national database recorded a 14% drop in centre numbers between 2009 and October 2017. This, however, may understate the true figure. There is no clear definition of a ‘children’s centre’, with a large number of ‘linked sites’ counted by some authorities but not by others. Many closures announced locally were not yet reflected in the database: our survey showed a 16% drop. If we only count ‘registered centres’, the drop since 2009 was more than 30%, suggesting that more than 1,000 centres nationally might have closed. There is now growing evidence of a further wave of large scale closures in the pipeline as a ‘tipping point’ is reached
What is clear is that a high proportion of the closures took place in a few areas. By 2017, sixteen authorities closing 50% or more of their centres accounted for 55% of the total number of closures nationally. Six authorities (West Berkshire, Camden, Stockport, Bromley, Oxfordshire and Staffordshire) had closed more than 70% of their centres. Despite this reduction, the proportion of centres in the 30% most disadvantaged areas remained constant from 2009 to 2017 at just over 50%. So, numbers dropped but the focus on disadvantaged areas remained.
Numbers are important - particularly if your local centre closes. But equally important are the services offered. More centres operate on a part-time basis only and the number of services has fallen. While most centres still offer open access services to families of all backgrounds, these have been reduced, restricted to fewer centres or to fewer sessions. Six out of ten local authorities reported most centres were open full-time; but few or none were open full-time in almost one in five authorities.
Reduced services were reported by 55% of local authorities, with only 35% providing a range of ten or more services. There was a greater focus on more limited services targeted at referred families, with less open access and different services distributed across centres in the same authority. This meant families needing services also needed access to public transport and better information.
5
Not surprisingly, financial pressures came top in 84% of local authorities as a principal driver of change in recent years. This financial squeeze since the removal of ring-fencing is intensifying, with 69% of authorities reporting a budget decrease in the last two years.
‘Change of focus’ came a close second (80%) as a driver of change. This was not just a move towards greater targeting of individual high need families and away from open access. It was also a way of integrating children’s centres into a wider package of ‘early help’ as part of local teams with a much wider age range (0-19), with more than 40% of authorities extending the age range to include school age children.
Changed national and local priorities have played a part. The suspension of Ofsted inspections and the lack of any national guidance since 2013 on the purpose of children’s centres were seen in our survey as reducing the importance of children's centres. The effect was to reduce the strength of children’s centres in local authority priorities.
‘Standalone’ centres with their own manager were no longer a preferred method of organisation, with only 18% of authorities reporting this for all or most of their centres. By contrast, 55% stated that all or most of their centres were organised into clusters or groups. Cost was a major driver here; but grouping centres into clusters, or a smaller number of major centres with satellites, was also a favoured way of spreading limited staff time and expertise.
Direct local authority management of all or most centres was reported by 73% of areas. Only in 11% were centres managed by voluntary groups (usually large national charities), and the private sector was a significant player in only two authorities. More significant were local nurseries or primary schools: 15% of areas reported that some or all their centres were managed by headteachers of local schools.
Substantial further changes in the pipeline were expected by 34% of local authorities: more emphasis on referred families (47%), increased age range (40%), reorganising centres in clusters (29%), and further centre closures (19%), with further consultations or reviews to come. Some of these changes were identified as creative strategies, intended to maintain quality and effectiveness even though overall cover was being reduced.
The result has been to move children’s centres away from the original idea of an open access neighbourhood centre. Services are now 'hollowed out' - much more thinly spread, often no longer 'in pram-pushing distance'. The focus of centres has changed to referred families with high need, and provision has diversified as national direction has weakened, with local authorities employing a variety of strategies to survive in an environment of declining resources and loss of strategic direction.
6
Recommendations
1. The government should complete the long-promised review of the children’s centre programme to confirm its national importance and overall purpose with national guidelines. This could stop the piecemeal local closure of centres which is creating a postcode lottery of provision.
2. The central purpose of children’s centres to promote positive child and family
development primarily for the 0-5 age group should be stressed. Focusing on this age group underlines the importance of the early years in child development. Linking children’s centres closely to local nursery or primary schools fits closely with this developmental focus for children’s centres.
3. Children’s centres should reconnect with their original purpose. Shifting the balance too
far towards referred children and families, away from open access, and merging children’s centres into preventative teams working with a very much wider age group, serves a very different function and requires very different skills. It does not seem to fit well under the label of a local ‘children’s centre’. A good mix of children is important for social mobility and children’s social development.
4. A national register of children’s centres should be maintained which establishes
minimum levels of provision for inclusion. Clear criteria of what constitutes a ‘children’s centre’ should be established. Better and more up to date data should be collected and published nationally on all children’s centres.
5. Once the review is completed, the government should consider re-establishing
inspections of a set of core services, to embed children’s centres as a national programme, and ensure accountability and quality of service delivery.
7
1. Sure Start children’s centres: policy and purpose (2009-2017) The Sure Start children’s centre programme was one of the key initiatives for young children and their families under the Labour government between 1998 and 2010. The programme was intended to be a multi-agency area-based initiative to bring together services for young children and their families, focused initially on the most disadvantaged areas in England.1 Since the late 1960s, early education has repeatedly been shown to be among the most effective settings for promoting the development of young children and their families, particularly in disadvantaged areas. The programme started with 250 areas but grew rapidly, and changed focus from 'communities' to centres. Sure Start children's centres were seen as the best location for child and family health services,2
and were intended to link child development, parental employment and poverty prevention.3 The Childcare Act 20064 required local authorities to ensure sufficient childcare for parental employment in their areas. The Narrowing the Gap (2008) strategy focused on improving outcomes for the most disadvantaged5, and in 2009 legislation put children's centres on a statutory footing for the first time. Choice for parents: the best start for children (2004) set a target of 2,500 centres by 2008, and 3,500 by 2010 - one for every community in England, signalling the shift from the original focus on disadvantaged areas to a more universal model.6 The aim was to set up local neighbourhood programmes, focusing on young children and their families, providing some additional services but also developing multi-agency approaches with other relevant services in the area. The initial focus was on disadvantaged areas - those falling into the poorest 30% of areas nationally, based on the national measure of 'income deprivation affecting children' (IDACI). The national programme was later expanded, particularly in Phase 3, to include all areas but with lower levels of provision in areas falling outside the 30% deprivation threshold. The Sure Start programme was initially managed by a central government team and funded by a national ring-fenced budget, but implemented through local community boards. After 2005, however, the Sure Start local programmes (SSLPs) were on the way to becoming Sure Start children's centres increasingly under local authority management. Following the formation of the coalition government in 2010, the role and focus of children’s centres changed substantially at the national level, as did the funding. New statutory guidance was published in April 2013 on their 'core purpose', marking a significant shift towards targeting families in greatest need and focusing on parenting skills, child development and school readiness, and child and family health and life chances. The requirement to provide full daycare and qualified teachers in the most disadvantaged areas was dropped. Children's centres were expected to signpost families to services, particularly to private and voluntary day care providers. In 2011, the ring-fencing around children's centre funding was removed, and funding for all children and young people's services was merged into the Early Intervention Grant (EIG), thus making it difficult to disentangle how much was spent overall
1 (For full references, see bibliography at the end of the report.) Eisenstadt, N. (2011). 2 Department of Health and Social Care (2004). 3 HM Treasury, Department for Education and Skills, Department for Work and Pensions and Department for Trade and Industry (2004). 4 TSO (2006). 5 Springate, I. et al. (2008). 6 HM Treasury, Department for Education and Skills, Department for Work and Pensions and Department for Trade and Industry (2004). See also Bate, A. and Foster, D. (2015).
8
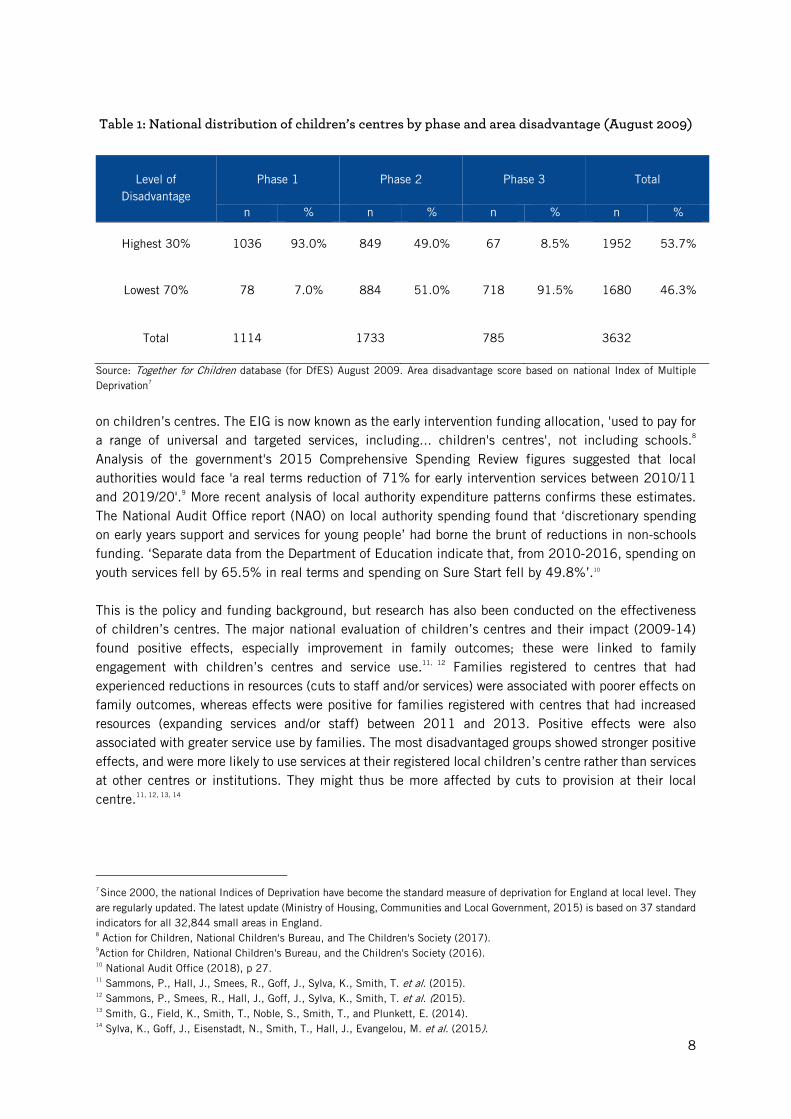
Table 1: National distribution of children’s centres by phase and area disadvantage (August 2009)
Level of Disadvantage
Phase 1 Phase 2 Phase 3 Total
n % n % n % n %
Highest 30% 1036 93.0% 849 49.0% 67 8.5% 1952 53.7%
Lowest 70% 78 7.0% 884 51.0% 718 91.5% 1680 46.3%
Total 1114 1733 785 3632
Source: Together for Children database (for DfES) August 2009. Area disadvantage score based on national Index of Multiple Deprivation7
on children’s centres. The EIG is now known as the early intervention funding allocation, 'used to pay for a range of universal and targeted services, including... children's centres', not including schools.8 Analysis of the government's 2015 Comprehensive Spending Review figures suggested that local authorities would face 'a real terms reduction of 71% for early intervention services between 2010/11 and 2019/20'.9 More recent analysis of local authority expenditure patterns confirms these estimates. The National Audit Office report (NAO) on local authority spending found that ‘discretionary spending on early years support and services for young people’ had borne the brunt of reductions in non-schools funding. ‘Separate data from the Department of Education indicate that, from 2010-2016, spending on youth services fell by 65.5% in real terms and spending on Sure Start fell by 49.8%’.10 This is the policy and funding background, but research has also been conducted on the effectiveness of children’s centres. The major national evaluation of children’s centres and their impact (2009-14) found positive effects, especially improvement in family outcomes; these were linked to family engagement with children’s centres and service use.11, 12 Families registered to centres that had experienced reductions in resources (cuts to staff and/or services) were associated with poorer effects on family outcomes, whereas effects were positive for families registered with centres that had increased resources (expanding services and/or staff) between 2011 and 2013. Positive effects were also associated with greater service use by families. The most disadvantaged groups showed stronger positive effects, and were more likely to use services at their registered local children’s centre rather than services at other centres or institutions. They might thus be more affected by cuts to provision at their local centre.11, 12, 13, 14
7 Since 2000, the national Indices of Deprivation have become the standard measure of deprivation for England at local level. They are regularly updated. The latest update (Ministry of Housing, Communities and Local Government, 2015) is based on 37 standard indicators for all 32,844 small areas in England. 8 Action for Children, National Children's Bureau, and The Children's Society (2017). 9Action for Children, National Children's Bureau, and the Children's Society (2016). 10 National Audit Office (2018), p 27. 11 Sammons, P., Hall, J., Smees, R., Goff, J., Sylva, K., Smith, T. et al. (2015). 12 Sammons, P., Smees, R., Hall, J., Goff, J., Sylva, K., Smith, T. et al. (2015). 13 Smith, G., Field, K., Smith, T., Noble, S., Smith, T., and Plunkett, E. (2014). 14 Sylva, K., Goff, J., Eisenstadt, N., Smith, T., Hall, J., Evangelou, M. et al. (2015).
9
2. Research design and data sources To assess the changing pattern of children’s centres across England between 2009 and late autumn 2017, we have drawn on three main sets of information. These include two sets of quantitative data: first, the ‘headline’ count of children’s centres by location, type, local authority and other variables from the national databases from 2009/10 (probably the high point), using an extract (August 2009) from the Together for Children (TFC) database commissioned by the Department for Education and Skills (DfES) to monitor the development of the programme centrally, with extensive information on each centre, through to the rather more limited information from the national Edubase system which lists every children’s centre and its reported status (up to autumn 2017). These give ‘headline’ totals but also help to uncover which types of centres have survived, and the type of area they serve, by the original phase of the programme and by the level of deprivation affecting children (IDACI) recorded for each centre's location. The headline total also indicates the variation of change among local authorities as they responded to funding pressures and changing national and local priorities. Second, we draw on a brief email survey we conducted of all 152 local authorities in England over the summer and autumn of 2017 to find out more about the current position of children’s centres in their area. This survey finally achieved a response rate of 82% (124 out of 152 local authorities), underlining the respondents’ commitment to children's centres and concern over the way the programme was changing. These areas supported almost exactly 82% of all children’s centres in England in August 2009 and just below 80% of all children’s centres in autumn 2017. It might be the case that authorities which had closed more centres might be reluctant to respond, but it could also be that some authorities had cut back or phased out central staff managing the overall programme so there was nobody left to respond. The survey responses outline the position at local authority level overall rather than individual children’s centres. While some authorities have only ever had a handful of centres, several of the larger areas had well over 50 - with Kent having more than 100 centres at its peak. To minimise pressure on busy staff and encourage a response, the questionnaire was restricted to a simple format with eleven questions covering the current programme across their authority. Respondents were in most cases senior figures with direct responsibility for the children’s centre programme in their authority. While some responded by simply completing the largely tick box survey, many amplified their responses with sometimes very extensive comments, a few providing additional information such as discussion papers and consultation proposals about recent or impending changes in their area. We have drawn on this material selectively to place the survey data in context. Third, we conducted qualitative follow-up interviews face-to-face and by phone in six selected areas, to fill out the picture of what has happened from the perspective of key local authority personnel. Finally, we draw on a mix of policy background and research to set our findings in a broader context.
10
3. Counting children’s centres Despite the very substantial changes in national policy and funding over the period - and particularly from 2010 onwards - the effects take time to filter down to provision on the ground. A joint report from the Children’s Society, Action for Children and the National Children’s Bureau estimates15 that ‘early intervention’ funding overall (not just for children’s centres) from central government to local authorities fell from £3.28bn in 2010/11 to £1.17bn by 2017/8 - a drop of more than 64%. This does not take account of local authority income from other sources such as local taxation or using reserves to offset these reductions. Overall spending by local authorities on children and young people’s services (a much wider category) fell between 2010/11 and 2015/16 by a much smaller amount - 16% in real terms, or 24% if a modelled estimate of ‘spending power’ is used. There were sharp regional variations with London, the North West, North East and Yorkshire and Humber experiencing falls of 20% or more while the South East and South West regions had only a small drop (around 1%). This is explained in part by overall levels of deprivation, with the 20% most deprived areas experiencing the largest drop (23%) and the 20% least deprived areas only a 5% drop in spending. As the most deprived areas started with significantly higher spending in 2010/11 the change moves them closer to the overall average spend for all areas by 2015/16.
But, despite the heavy pressure they were under from these budget reductions, local authorities in principle still retained the power to shelter or cushion children’s centre provision in their area - or to let the changes take direct effect. Also, whatever the policies and funding emanating from central government, provision on the ground inevitably takes time to respond, not least if staff have to be cut back or redeployed to meet new requirements.
The ‘headline’ count The crude overall number - ‘the headline count’ - of children’s centres nationally has frequently been the focus of national and local controversy. How many children’s centres are there at the present time? While the overall number of centres is a key issue (for example, if your local centre closes), it is only one measure of what is happening on the ground. Thus, two centres merging into one but retaining two separate ‘locations’ may look like a reduction in numbers but is not necessarily a reduction in provision; and areas that retain all their centres but very significantly ‘thin down’ or ‘hollow out’ what is offered in each centre may appear from the statistics to have the same level of overall provision as before, but in fact the availability of services may have declined markedly in practice. If we start with the simple headline count in August 2009 (almost certainly the high point) before any budget cuts linked to the austerity programme, it lists 3,734 centres, but this includes some proposed centres without any details. If we exclude these (as they may never have been completed) there were 3,632 centres in August 2009 - either in operation or in process. Since then there has been a steady but not yet precipitate decline, according to official figures. Using extracts from the national Edubase gives a headline figure in January 2016 of 3,336 children’s centres (comprising 2,604 children’s centres and 731 ‘children’s centres linked site’). By October 2017 this had fallen further to 3,123 (comprising 2,404 centres and 719 linked sites), an overall reduction of 14% from 2009/10.
15 See Action for Children, National Children's Bureau, and The Children's Society (2017) for references in this paragraph.
11
However, the Edubase system can lag the ‘real world’ significantly as decisions may have been made to close centres which are still in process - or the national figures may not yet have been updated by local sources to reflect changes on the ground. Thus Hampshire, which was one of the largest providers nationally with 85 centres open or planned in 2009, decided to close a large number in 2016 but still listed 79 centres in Edubase in autumn 2017. Many of the 124 authorities which responded to the question in our postal survey (autumn 2017) on the number of ‘registered children’s centres’ in their authority gave a total number that was the same as the Edubase figure or slightly lower, but some areas gave a very much lower figure - in some cases explaining that there were other locations or centres which they were not counting as ‘registered’ children’s centres. This is likely to reflect changes in organisation, as centres were merged or clustered, the (supposedly temporary) ending of Ofsted inspections of children’s centres in 2015 (which had required them to be formally ‘registered’ and inspected),16 and reluctance by many authorities to announce the complete closure of a local centre if it could possibly be avoided. If we use the data provided by the 124 authorities which responded to the survey, where they were asked to record the number of ‘registered children’s centres' in their authority in July 2017, the survey returns give a total of 1,941, compared with 2,975 in August 2009 (a drop of 35% - using the stricter definition of a ‘registered children’s centre’), while Edubase in October 2017 lists 2,494 centres for these 124 authorities (a lesser fall of 16%). An explanation from one northern authority which had reduced its 19 centres in 2009 to five in 2017 demonstrates one of the problems with the headline count:
'while this looks like a significant decrease in numbers we actually closed only 1 of our 19 buildings. The remaining 18 centres have been reconfigured into a locality model with five main sites, Ofsted-listed as children's centres, five linked sites, and eight satellite sites for outreach'. (Northern urban area)
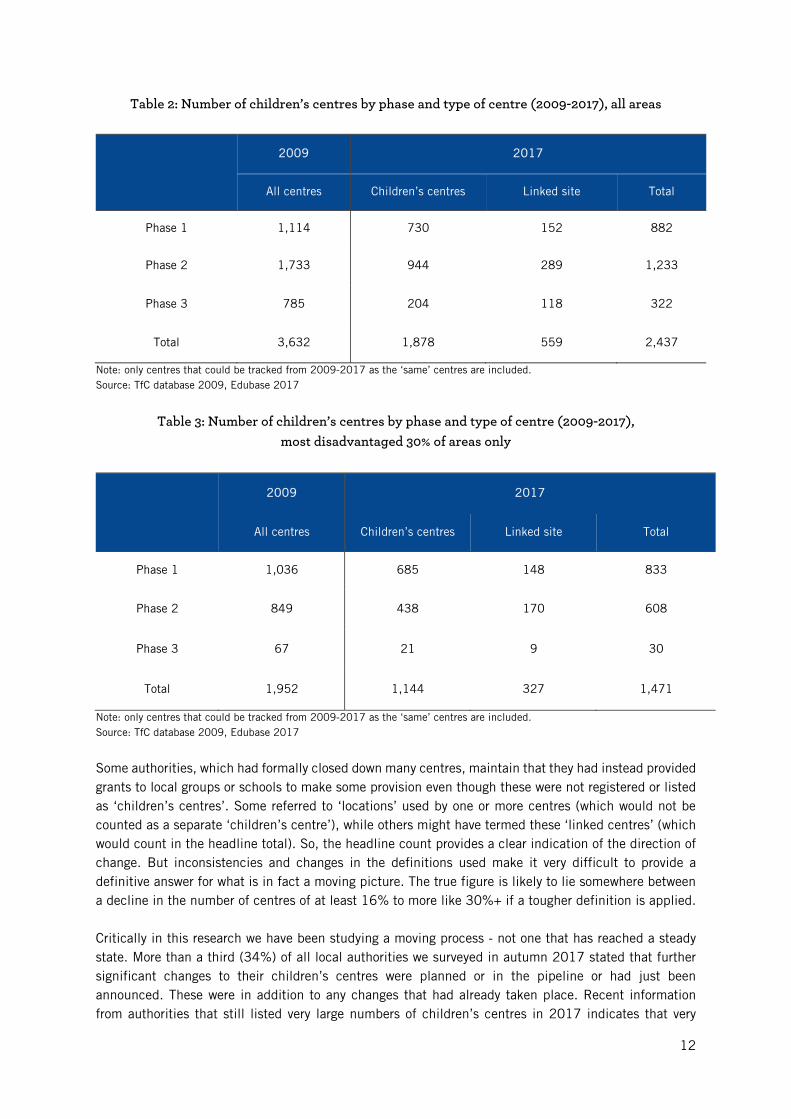
The large number of ‘linked sites’ in the Edubase system (some 22% of all centres in 2017) may also be a way for some local authorities to maintain headline numbers and potentially avoid the heavy local (and sometimes national) ‘flak’ of closing centres completely. Although 58 authorities (38%) have no centres designated as ‘linked sites’ and many have very few, 23 authorities (15%) have a majority of their centres in this category - and in a few cases virtually all their centres are classified as ‘linked sites’, suggesting that this reflects the way some authorities now organise provision across their area. In some cases, ‘linked sites’ would have been the ‘light touch’ Phase 3 centres in 2009. However, if we track down centres from 2009 that can be traced through to 2017, nearly 80% of the Phase 1 and 70% of the Phase 2 centres survive in their original location. But 441 of the centres that started out as substantial Phase 1 or Phase 2 centres in 2009/10 were by 2017 classified as ‘linked sites’; and 318 of these centres were in the 30% most disadvantaged areas, making up a substantial proportion (57%) of the linked centres that can be traced back to 2009. While we cannot be certain what a ‘linked site’ means, it seems likely that for many it entails a reduction on what was in the original package. Very few of the 2009 Phase 3 centres were in the 30% most disadvantaged areas. Centres from Phase 3 were least likely to survive in the same location in 2017 as they could have been merged, moved location or been renamed. Table 2 sets out the figures for all centres in 2017 that can be directly linked back to the information on the original phase (held only in the 2009 dataset), and Table 3 covers centres in the 30% most disadvantaged areas.
16 Puffet, N. (2018).
12
Table 2: Number of children’s centres by phase and type of centre (2009-2017), all areas
2009 2017
All centres Children’s centres Linked site Total
Phase 1 1,114 730 152 882
Phase 2 1,733 944 289 1,233
Phase 3 785 204 118 322
Total 3,632 1,878 559 2,437
Note: only centres that could be tracked from 2009-2017 as the ‘same’ centres are included. Source: TfC database 2009, Edubase 2017
Table 3: Number of children’s centres by phase and type of centre (2009-2017),
most disadvantaged 30% of areas only
2009 2017
All centres Children’s centres Linked site Total
Phase 1 1,036 685 148 833
Phase 2 849 438 170 608
Phase 3 67 21 9 30
Total 1,952 1,144 327 1,471
Note: only centres that could be tracked from 2009-2017 as the ‘same’ centres are included. Source: TfC database 2009, Edubase 2017
Some authorities, which had formally closed down many centres, maintain that they had instead provided grants to local groups or schools to make some provision even though these were not registered or listed as ‘children’s centres’. Some referred to ‘locations’ used by one or more centres (which would not be counted as a separate ‘children’s centre’), while others might have termed these ‘linked centres’ (which would count in the headline total). So, the headline count provides a clear indication of the direction of change. But inconsistencies and changes in the definitions used make it very difficult to provide a definitive answer for what is in fact a moving picture. The true figure is likely to lie somewhere between a decline in the number of centres of at least 16% to more like 30%+ if a tougher definition is applied. Critically in this research we have been studying a moving process - not one that has reached a steady state. More than a third (34%) of all local authorities we surveyed in autumn 2017 stated that further significant changes to their children’s centres were planned or in the pipeline or had just been announced. These were in addition to any changes that had already taken place. Recent information from authorities that still listed very large numbers of children’s centres in 2017 indicates that very
13
substantial reductions are either in process or subject to consultation. These include both shire counties and metropolitan areas. If these areas followed through with their plans the national headline count would fall dramatically.
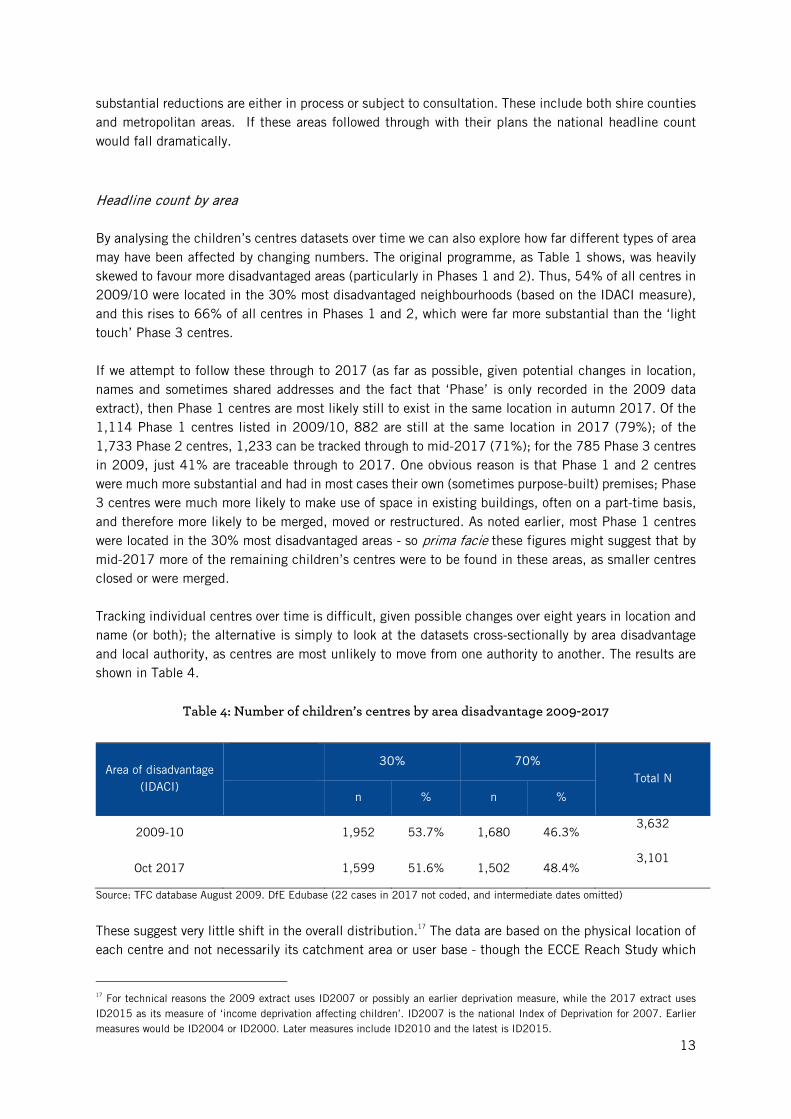
Headline count by area By analysing the children’s centres datasets over time we can also explore how far different types of area may have been affected by changing numbers. The original programme, as Table 1 shows, was heavily skewed to favour more disadvantaged areas (particularly in Phases 1 and 2). Thus, 54% of all centres in 2009/10 were located in the 30% most disadvantaged neighbourhoods (based on the IDACI measure), and this rises to 66% of all centres in Phases 1 and 2, which were far more substantial than the ‘light touch’ Phase 3 centres. If we attempt to follow these through to 2017 (as far as possible, given potential changes in location, names and sometimes shared addresses and the fact that ‘Phase’ is only recorded in the 2009 data extract), then Phase 1 centres are most likely still to exist in the same location in autumn 2017. Of the 1,114 Phase 1 centres listed in 2009/10, 882 are still at the same location in 2017 (79%); of the 1,733 Phase 2 centres, 1,233 can be tracked through to mid-2017 (71%); for the 785 Phase 3 centres in 2009, just 41% are traceable through to 2017. One obvious reason is that Phase 1 and 2 centres were much more substantial and had in most cases their own (sometimes purpose-built) premises; Phase 3 centres were much more likely to make use of space in existing buildings, often on a part-time basis, and therefore more likely to be merged, moved or restructured. As noted earlier, most Phase 1 centres were located in the 30% most disadvantaged areas - so prima facie these figures might suggest that by mid-2017 more of the remaining children’s centres were to be found in these areas, as smaller centres closed or were merged. Tracking individual centres over time is difficult, given possible changes over eight years in location and name (or both); the alternative is simply to look at the datasets cross-sectionally by area disadvantage and local authority, as centres are most unlikely to move from one authority to another. The results are shown in Table 4.
Table 4: Number of children’s centres by area disadvantage 2009-2017
Area of disadvantage (IDACI)
30% 70%
Total N
n % n %
2009-10
1,952 53.7% 1,680 46.3% 3,632
Oct 2017
1,599 51.6% 1,502 48.4% 3,101
Source: TFC database August 2009. DfE Edubase (22 cases in 2017 not coded, and intermediate dates omitted)
These suggest very little shift in the overall distribution.17 The data are based on the physical location of each centre and not necessarily its catchment area or user base - though the ECCE Reach Study which
17 For technical reasons the 2009 extract uses ID2007 or possibly an earlier deprivation measure, while the 2017 extract uses ID2015 as its measure of ‘income deprivation affecting children’. ID2007 is the national Index of Deprivation for 2007. Earlier measures would be ID2004 or ID2000. Later measures include ID2010 and the latest is ID2015.
14
drew on individual user data from a national sample of 128 Phases 1 and 2 centres showed that centres physically located in the 30% most disadvantaged areas drew 60% of their users/potential users from this type of neighbourhood.18
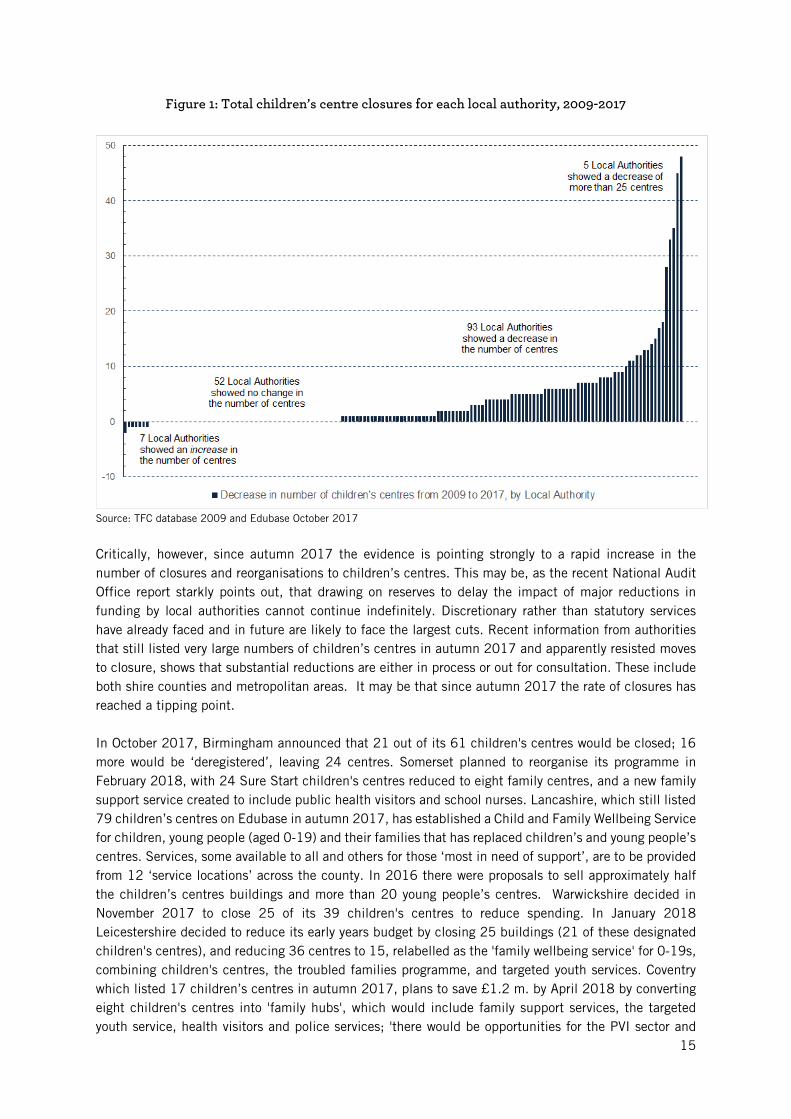
However, if these changes are analysed at local authority level, which became the key decision point once the programme ceased to be a centrally-directed national initiative, then there are some very striking differences in the headline count. If we track the numbers of centres in each local authority from August 2009 to October 2017, then 59 - that is 39% of all local authorities - reported either the same number of centres in October 2017 as in August 2009 or, in a few cases, marginally more. These represent not just authorities with a few centres but some with the largest numbers, and include shire counties as well as large metropolitan areas. At the other end of the scale, 16 authorities (11%) had closed more than half of all the centres they had in 2009/10. Six areas (West Berkshire, Camden, Stockport, Bromley, Oxfordshire and Staffordshire) had closed 70% or more of the centres they had open in 2009.19 In fact, the 16 local authorities which closed half or more of their centres accounted for 55% of all the closures recorded in the national lists, though these authorities only made up about 13% of the total number of centres nationally at their peak in 2009. On the positive side, analysis of local authorities which closed a high proportion of centres indicates that they were more likely to close centres located in their least disadvantaged areas and so overall, they ended up with a higher proportion of their surviving centres located in the 30% most disadvantaged areas – though the absolute number of centres located in the 30% most disadvantaged areas that survived in these 16 authorities was only about half their number in 2009. The Reach Study estimated that in a national sample of Phase1 and Phase 2 centres the overall population of children aged 0-4 in the catchment area averaged 1,350 children, but with a very wide range. So, in conclusion, rather than a general whittling down of the programme across the board in all areas, by autumn 2017 a large number of local authorities had maintained close to their 2009 numbers, while a minority had made very major reductions through closure. These accounted for a high proportion of the centres that had closed across the country. Figure 1 shows the pattern of closures by local authority in terms of their contribution to the national total. Each bar-line represents one local authority. At the extreme left, seven authorities actually had more centres in autumn 2017 than in August 2009 but this was only an additional ten centres overall. Authorities towards the right edge each add more than 4% to the total number of closures, with the highest contributing just below 8% of all closures. The three shire counties with high closure rates (Essex, Oxfordshire and Staffordshire), because they each had large numbers of centres in 2009, contributed more than 20% of the closures in England. In the middle of the chart (with no bar-lines) 53 authorities (35% of all LAs) record the same number of centres in 2017 as they did in 2009.
18 Smith et al. (2014). 19 Hampshire would also join this group if it has finally closed the 40+ centres announced for closure in 2016.
15
Figure 1: Total children’s centre closures for each local authority, 2009-2017
Source: TFC database 2009 and Edubase October 2017
Critically, however, since autumn 2017 the evidence is pointing strongly to a rapid increase in the number of closures and reorganisations to children’s centres. This may be, as the recent National Audit Office report starkly points out, that drawing on reserves to delay the impact of major reductions in funding by local authorities cannot continue indefinitely. Discretionary rather than statutory services have already faced and in future are likely to face the largest cuts. Recent information from authorities that still listed very large numbers of children’s centres in autumn 2017 and apparently resisted moves to closure, shows that substantial reductions are either in process or out for consultation. These include both shire counties and metropolitan areas. It may be that since autumn 2017 the rate of closures has reached a tipping point. In October 2017, Birmingham announced that 21 out of its 61 children's centres would be closed; 16 more would be ‘deregistered’, leaving 24 centres. Somerset planned to reorganise its programme in February 2018, with 24 Sure Start children's centres reduced to eight family centres, and a new family support service created to include public health visitors and school nurses. Lancashire, which still listed 79 children’s centres on Edubase in autumn 2017, has established a Child and Family Wellbeing Service for children, young people (aged 0-19) and their families that has replaced children’s and young people’s centres. Services, some available to all and others for those ‘most in need of support’, are to be provided from 12 ‘service locations’ across the county. In 2016 there were proposals to sell approximately half the children’s centres buildings and more than 20 young people’s centres. Warwickshire decided in November 2017 to close 25 of its 39 children's centres to reduce spending. In January 2018 Leicestershire decided to reduce its early years budget by closing 25 buildings (21 of these designated children's centres), and reducing 36 centres to 15, relabelled as the 'family wellbeing service' for 0-19s, combining children's centres, the troubled families programme, and targeted youth services. Coventry which listed 17 children’s centres in autumn 2017, plans to save £1.2 m. by April 2018 by converting eight children's centres into 'family hubs', which would include family support services, the targeted youth service, health visitors and police services; 'there would be opportunities for the PVI sector and

16
schools to develop "sustainable business models" to provide nursery provision'. Hampshire has already announced the closure of 43 centres (out of the 79 listed in autumn 2017), cutting down to just 11 children’s centres in areas of high deprivation and reorganising the family support service to amalgamate early help hubs with youth support for 0-19s.20 If these areas and other areas which had managed to retain most of their centres followed through with their plans, the national headline count would fall dramatically.
20 Information from news media and local authority public documents.
17
4. Children’s centre services 2017: local authority service results By autumn 2017, only a few authorities had decided to go for outright closure of a high proportion of their children’s centres. Instead, others may have decided to retain the centres but reduce what they offered or to reorganise service delivery. The extent to which this happened is more difficult to pin down, but we can draw on the survey of all local authorities we conducted in autumn 2017 to get their assessment of what services the centres in their area were offering, how they were now managed and run, how this had changed and the main reasons for any changes. We do not have a direct comparison at local authority level of what children’s centres offered in 2009, but we can draw on the original idea behind the children’s centres programme at the outset as a benchmark. We can also draw on the Early Childhood Care and Education (ECCE) research project conducted between 2009 and 2014 into a nationally representative sample of children’s centres from Phase 1 and Phase 2. The original aim, at least for the first two phases, was for a local neighbourhood based centre, normally operating on a full-time basis, with a local manager and administrative team, providing open access for young children and their parents, offering a range of services and acting as a gateway to more specialised provision for young children and families. Children's centres in 2012 were offering a variety of child and family services and community 'capacity-building' activities: centres offered an average of 28 services from a list of a possible 50, ranging from a minimum of 13 to a maximum of 42.21 We have used the term ‘standalone centres’ to cover the original neighbourhood model, though during the ECCE project it was clear that this was giving way to clustered or grouped centres with shared management. Phase 3 centres, from the outset, were more likely to be part-time offering a smaller range of services, and even in 2009 many of these were grouped together or linked with other centres, for instance for administration, management or service delivery. The ECCE Strand 3 report identified six different ways of grouping centres in addition to the single centre standalone model. This ECCE report also included estimates of the distance travelled by users of each centre. The average distance travelled was just over one kilometre, but the median (midpoint) was about 800 metres. The average size of the user group in these centres in 2013 was 770 children aged 0-4 over a year, ranging from 250 to well over 1,000 users.22
Services on offer in 2017
a) Full-time or part-time children’s centres? As noted above, Phase 1 and Phases 2 centres were intended to be full-time; Phase 3 centres were likely to be part-time. So, what was the position in autumn 2017? 73% of local authorities indicated that all or most of their centres were open full-time (five days a week) and a few noted additional times as well (Saturday mornings, for example). But 19% (24 authorities) stated that only a few or none of their centres were open full-time. In some cases, these were large authorities including shire counties with some of the highest number of centres, which indicated that all
21 See table 3.1 in Goff et al. (2013). 22 See Goff et al. (2013) for discussion in this paragraph.
18
their centres were only open a few mornings or afternoons a week. Some urban areas pointed to a service where no centre was open full-time but there would be another open in another part of the authority:
‘...we have an activity timetable that is managed across the week so there are services every day that families can access across the borough.’ (Urban area, Eastern region)
Authorities that had a high proportion of Phases 1 and 2 centres and contained areas with a high level of disadvantage were much more likely to have all or most of their centres open full-time. However, there was a significant minority of authorities (21%) with high levels of disadvantage (defined in terms of the proportion of their centres in the 30% most disadvantaged areas) where only half of their centres were stated to be open full-time, and a subset of these disadvantaged areas (11%) with few or - in one case - no centres open full-time.
b) What range of services was offered? In response to the question about the range of services being offered to families and children in their
centres,23 43 authorities (35%) claimed that all their centres were offering a full range of services and
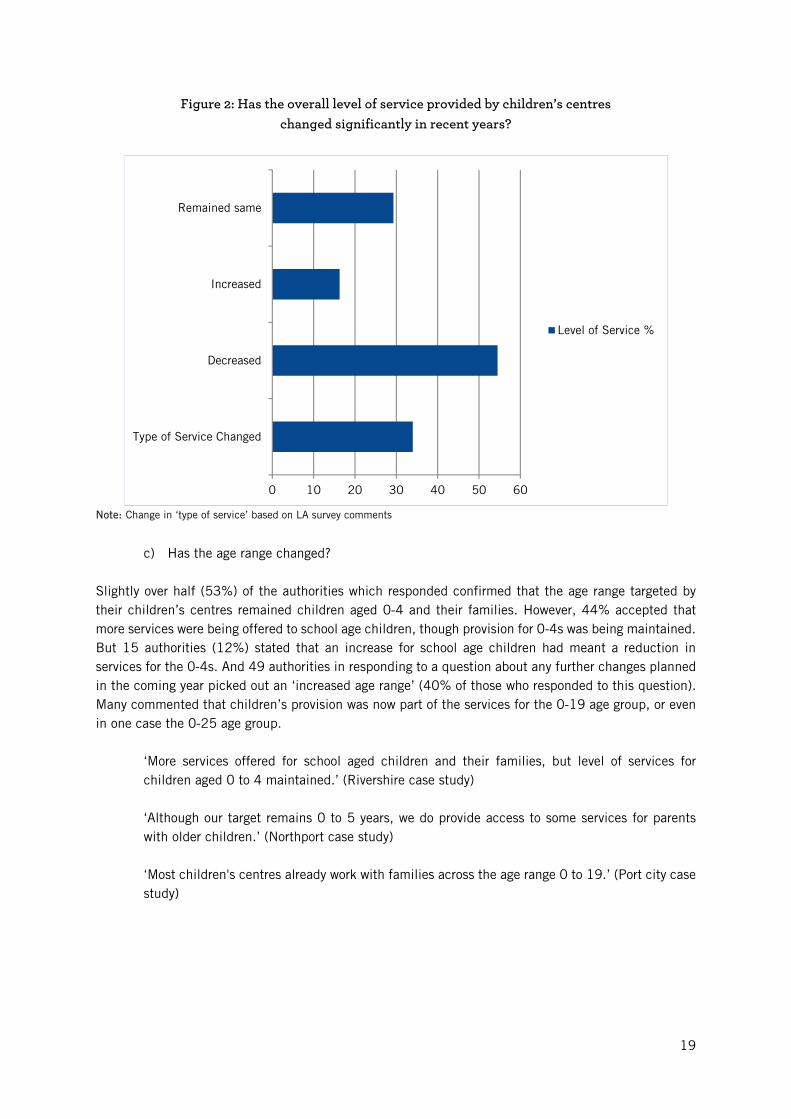
a further 32 (26%) authorities stated most of their centres had a full range. But again, a minority of areas (20%) stated that either none or only a few of the centres in their areas were offering a full range; and in a small number (4%) all their centres only offered a limited range of services. This shows a decline from 2013 when the average number of services on offer was 28,24 though this study was restricted to Phases 1 and 2 centres and was based on data collected from the centres rather than an overall judgement by a local authority manager. In answer to the question on changes in the overall level of services provided by children’s centres in recent years, 55% of local authorities stated that it had been reduced, 29% that it had remained the same, and only 16% that it had increased. However, 34% pointed out that the type of services delivered had changed: for example, serving a wider age group, offering different types of programme and targeting specific groups, making direct comparison with an earlier period difficult. All six case studies provide examples of local authorities reconfiguring services (see section 5).
One local authority official acknowledged the shift away from the previous open access model:
‘It’s not a real children's centre in the old sense of providing a full core offer, but we manage to offer many open access services in the areas formerly served by three children's centres - we just do it in a different way.’ (London borough case study) 'Children's centres are now more involved in early help, aimed at keeping children out of care.... Social care staff are now situated in children's services. The families served by children's centres have more complex needs now.' (Shipcity case study) 'There is pressure on the local authority to increase the early help offer to families in order to prevent greater numbers of children entering care.' (Shipcity case study)
23 A full range: 10 different services or more; a moderate range: 4-9 services; a limited range: 1-3 services. 24 See Goff et al. (2013) section 3.2.
19
Figure 2: Has the overall level of service provided by children’s centres changed significantly in recent years?
Note: Change in ‘type of service’ based on LA survey comments
c) Has the age range changed? Slightly over half (53%) of the authorities which responded confirmed that the age range targeted by their children’s centres remained children aged 0-4 and their families. However, 44% accepted that more services were being offered to school age children, though provision for 0-4s was being maintained. But 15 authorities (12%) stated that an increase for school age children had meant a reduction in services for the 0-4s. And 49 authorities in responding to a question about any further changes planned in the coming year picked out an ‘increased age range’ (40% of those who responded to this question). Many commented that children’s provision was now part of the services for the 0-19 age group, or even in one case the 0-25 age group.
‘More services offered for school aged children and their families, but level of services for children aged 0 to 4 maintained.’ (Rivershire case study) ‘Although our target remains 0 to 5 years, we do provide access to some services for parents with older children.’ (Northport case study) ‘Most children's centres already work with families across the age range 0 to 19.’ (Port city case study)
0 10 20 30 40 50 60
Type of Service Changed
Decreased
Increased
Remained same
Level of Service %
20
Were children’s centres open access or a service for referred families? The idea of a locally-based open access neighbourhood centre within 'pram pushing' distance for parents that had underpinned the original Sure Start programme launched in 1998 formed the starting point for the first phase of children’s centres. The first two phases also reflected the idea that the programme should target disadvantaged areas, defined by the IDACI measure of income deprivation affecting children. So, these centres were, by location, serving high need children and families defined in income terms. But they were also always seen as the contact point for more specialised services - ranging, for example, from speech and language therapy for children through, in some cases, to employment advice services for their parents. Particular targeted health or social issues arose from time to time - whether this was to encourage breastfeeding, work with teenage mothers or other issues. Many large centres also became the setting for specialist groups, for example using some of the evidence-based mother and child early years programmes that could be adopted, such as Incredible Years, Triple P, or Family-Nurse Partnership, though user numbers for these sort of programmes were restricted.25 Higher numbers used the universal open access services such as stay-and-play or baby massage, and greater family engagement with services predicted better outcomes in the ECCE study of impact. The 2013 ECCE Reach Study26, demonstrated across a national sample of Phases 1 and 2 centres that while the overall coverage of young children and families across the local area was very high, most families (60%) only visited the centre a few times a year. But some families and children (13% of users) had a much higher level of contact: these were likely to be attending regular sessions over a period of time. So, these centres were from an early point providing specialist as well as universal services. As the programme expanded to a national level, and particularly with the ‘light touch’ Phase 3 centres, which were predominantly not located in disadvantaged areas, there is potentially a mismatch between open access and specialist provision - for example, there are very few teenage mothers in most local areas. At the same time, there was a shift in the approach to deprivation - away from an economic dimension towards a more social/behavioural approach, where families and children in high need are identified on the basis of issues such as family disorganisation or poor child-rearing practices; and may shade over into criteria used to place families or children on the local children’s services ‘at risk’ register. There is potential here for some confusion or elision between ‘specialist services’ - speech and language support, for instance - and provision for families and their children who may be ‘referred’ or required to attend an organised group as a result of their contact with the statutory social or welfare services. After 2010 - and particularly after 2013 - the statutory guidance on the ‘core purpose’ for the children’s centre programme shifted to focus more on families and children in ‘high need’ and away from open access for all in the local area. So, what was the position at the local level in autumn 2017? It is striking that a very high proportion of areas surveyed claimed that all their centres still had some open access services. Seventy-nine authorities (64%) said that all their centres had open access services; and this rises to 82% (101 areas) if open access to all with some services exclusively for referred families are included. Virtually no authorities had centres that were exclusively for referred families only (that is, no open access). But details provided suggested that the picture is quite varied. One pattern was to have open access services run by other, sometimes voluntary, groups:
25 See chapter 5 in Goff et al. (2013). 26 See chapter 6 in Goff et al. (2013).
21
'In Portcity we believe that it is very important to offer a combination of universal (open access) services as well as referred and targeted services, so that our children's centres are seen by families as non-stigmatising, safe and accessible places to go.’ (Portcity case study) ‘We run a universal offer, exclusively delivered by partners and volunteers so in that sense it’s open access, but the services our staff deliver are targeted and for referred families only. We have done this to keep our core offer and to keep access open (and a stigma-free programme), but also to ensure that we’re narrowing the gap and responding to need.’ (Shire County, East Midlands)
In other cases, there was a strict division between one type of centre and another in terms of access:
’20 of our designated centres are based in libraries and they deliver a universal offer. The remaining 20 (purpose built) centres offer targeted group work for referred families only.’ (Shire County, East Midlands) And another area gave the balance of effort as ‘30% open access and 70% targeted.’ (Shire County, South East)
In other cases, there was a graduated set of services:
‘Some are universal – for example midwifery; and the HCP [Healthy Child Programme] developmental reviews. Some are targeted at specific cohorts of children and/or families: for example, under ones pathways; young/vulnerable parents’ pathways; inclusion & developmental interventions. Others are for referred families only: for example, individual early help interventions, or support for complex SEND [Special educational needs & disability].’ (Urban area, South East)
The open access element from the original idea thus survived in most areas, though it was clear that the pressure was on to change the balance. ‘Change of focus’ was picked out by 80% of respondents as one of the principal drivers of change in the provision of children’s centres in their area.
‘The current contracts for children’s centres are based on a ‘early help’ approach so the majority of the time and resource is focused on children with ‘early help’ levels of need.’ (Shire county, North West) ‘Reshaping of service to meet needs of families presenting at an early help level of need with a reduced universal offer for first time parents only.’ (London borough) ‘Public consultation showed that as cuts were needed money should be targeted on more vulnerable children.’ (Shire county, South East)
Some 58 local authorities (47%) picked out increased services for referred families as an area where further changes were being planned by their authority, though only 20% (25 areas) indicated that a reduction in open access was planned.
22
Organisation and management
How are children’s centres organised? The clear assumption underlying the original children’s centre programme was that centres would be area-based with their own local manager, with the local authority putting forward projects to be supported and funded from a ring-fenced central budget, administered through the local authority. With the increased scale of the national programme, the development of ‘light touch’ Phase 3 centres in less disadvantaged areas intended to provide a ‘universal’ coverage, the ending of the ring-fenced budget and reductions in local authority expenditure after 2010, other ways of organising centres spread rapidly. The ECCE research27 identified a range of different approaches - for example, pairing or clusters of centres with a central manager/administrator, hub and spokes arrangements, a large centre managing a number of smaller satellites. So, what was the position overall in autumn 2017? Some 68 local authorities (55%) stated that all or most of their centres were now organised into clusters or groups. Thirty-six authorities (29%) described their centres as all or mostly organised into main centres managing one or more satellite centres, though there was a small overlap between these two categories, possibly where their organisation did not fit into these two forms or groupings. 18% of authorities stated that all or most of their centres were ‘standalone centres with their own manager’, with another 15 authorities (12%) stating that some centres in their area had this form of management. However, 87 authorities (70%) said they did not have any centres of this type (standalone) or did not mention this type of organisation at all. Many areas with clustered or grouped centres described these as being based on a locality or district model. This arrangement was seen in both urban and rural areas.
‘Exshire has six localities and a manager for each locality. Each locality has 4-5 centres with the exception of South which has one centre. The larger centres contain more activities (both targeted and run by the voluntary sector).’ (Shire County, East Midlands) ‘Hub and spokes - 7 lead centres and 20 linked sites.’ (London borough) ‘We currently have a number of standalone sites and a number of merged sites. Although we currently have 17 centres they operate across 24 sites. In September we will be merging our standalone sites and reducing management but we will still offer a full range of universal and targeted services from 24 sites.’ (Urban area, North West)
'We have reduced our 19 centres in 2009 to five in 2017: while this looks like a significant decrease in numbers we actually closed only one of our 19 buildings. The remaining 18 centres have been reconfigured into a locality model with five main sites, Ofsted-listed as children's centres, five linked sites, and eight satellite sites for outreach.' (Northern urban local authority) One of our case study authorities was moving services out of children’s centres buildings: 'We have put our effort into reach - taking services into the community. The principle of services without walls.' (Shire county, South East)
27 See chapter 6 in Goff et al. (2013).
23
In response to the question on the principal reasons behind any major changes in recent years, the cost of standalone centres was the third most frequently cited after financial pressures (84%) and a change of focus (80%). Fifty-six authorities (45%) picked out the cost of standalone centres as a reason; and in terms of planned changes reorganising centres into clusters was the third most selected category by 36 areas (29%) as an element in forthcoming changes.
‘Standalone centres were not only more expensive, the mixed model of management across 40+ centres led to a fragmented service and created more work for the LA.’ (Urban area, North West) 'Centres have moved into 14 groups with one leader over a group of centres instead of one leader per centre. Reduced staffing costs by reducing number of administrators and building attendants.’ (Urban area, North West)
Who operates the centres? The original children’s centres programme was jointly managed by central government with local authorities, and the centres set up were run directly by the local authority itself, by local or national voluntary organisations and in a few cases by the health services or the private sector. A number of large national children’s charities operated significant numbers of centres in some areas under contract to local authorities. So, what was the position in autumn 2017? Of the local authorities responding, 62% stated that all their centres were under local authority control and another 11% said that most of their centres were under LA control. However, where services were delivered under contract to the authority by voluntary organisations or the private sector, some may have seen this as still being under LA control. A minority of authorities (13%) stated that none of the children's centres were under their management (though some of these were operated by local nursery or primary schools, including academies). In 87 authorities (70%) the voluntary sector did not run any centres and in only a few (7%) were all or most (4%) of centres run by voluntary organisations. These are likely to be the large national children’s charities which are the major providers in a limited number of authorities. The private sector was much less common, with only one authority stating that this form of management covered most of their centres and another one suggesting half their centres. In another seven authorities, the private sector was managing a few centres. An arrangement where centres were attached to, or part of, a local school or nursery school was a form of management control mentioned by 15% of authorities, as covering some or all their centres; this was an arrangement that was quite frequent in the London area with nursery schools taking on the management and leadership of a children’s centre.
‘Half of the centres are run by schools: three by nursery schools and two by primary schools. Four are under LA control.’ (London borough) 'The centres are run by a social enterprise company formed, and jointly owned, by the [local] boroughs to run their Children’s Services.' (London borough) ‘Our 0 to 19 integrated contract is with [a for-profit company] who have contracted [a national charity] to run the children’s centres.’ (Rivershire case study)
24
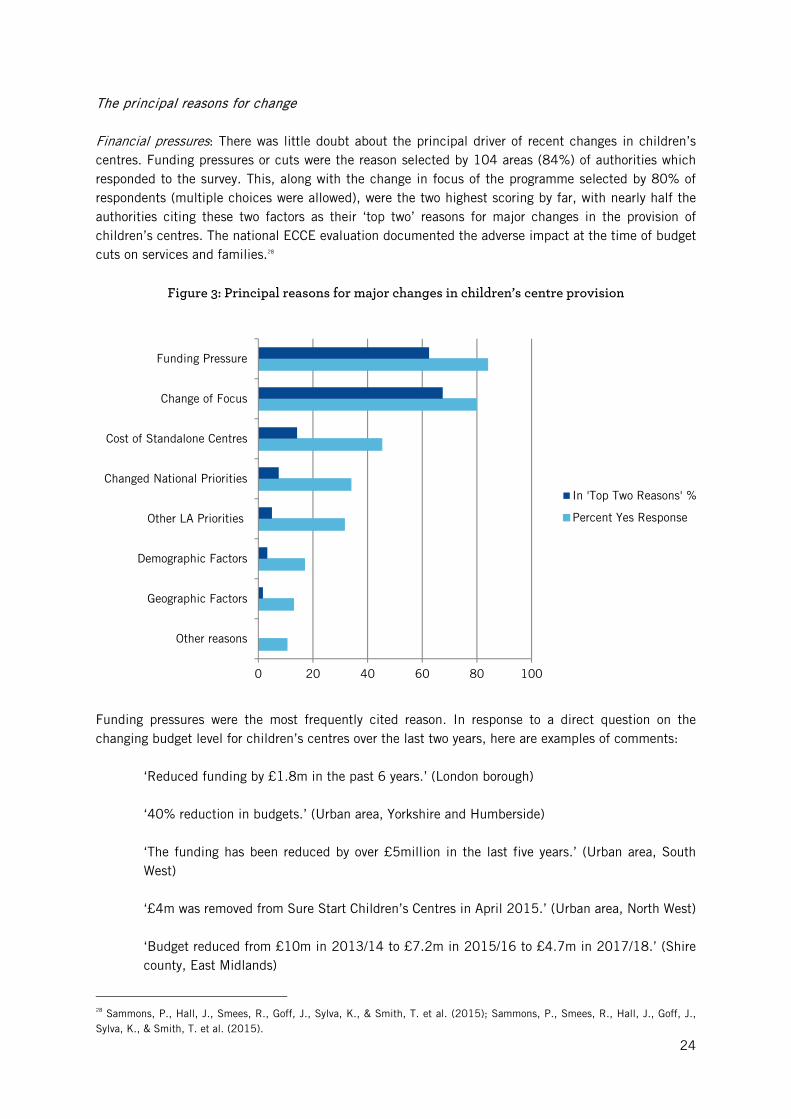
The principal reasons for change Financial pressures: There was little doubt about the principal driver of recent changes in children’s centres. Funding pressures or cuts were the reason selected by 104 areas (84%) of authorities which responded to the survey. This, along with the change in focus of the programme selected by 80% of respondents (multiple choices were allowed), were the two highest scoring by far, with nearly half the authorities citing these two factors as their ‘top two’ reasons for major changes in the provision of children’s centres. The national ECCE evaluation documented the adverse impact at the time of budget cuts on services and families.28
Figure 3: Principal reasons for major changes in children’s centre provision
Funding pressures were the most frequently cited reason. In response to a direct question on the changing budget level for children’s centres over the last two years, here are examples of comments:
‘Reduced funding by £1.8m in the past 6 years.’ (London borough) ‘40% reduction in budgets.’ (Urban area, Yorkshire and Humberside) ‘The funding has been reduced by over £5million in the last five years.’ (Urban area, South West) ‘£4m was removed from Sure Start Children’s Centres in April 2015.’ (Urban area, North West) ‘Budget reduced from £10m in 2013/14 to £7.2m in 2015/16 to £4.7m in 2017/18.’ (Shire county, East Midlands)
28 Sammons, P., Hall, J., Smees, R., Goff, J., Sylva, K., & Smith, T. et al. (2015); Sammons, P., Smees, R., Hall, J., Goff, J., Sylva, K., & Smith, T. et al. (2015).
0 20 40 60 80 100
Other reasons
Geographic Factors
Demographic Factors
Other LA Priorities
Changed National Priorities
Cost of Standalone Centres
Change of Focus
Funding Pressure
In 'Top Two Reasons' %
Percent Yes Response
25
‘Lack of funding means that we have reduced staff capacity which in turn reduces our time in each of the centres and we have limited delivery times.’ (Urban area, North West) ‘We have had to lose our reserves and also 40% of our annual budget. Still the borough with the highest number of 0-5 year-olds living in poverty.’ (London borough)
In response to a specific question about changes in the children’s centre budget for their authority over the last two financial years, 84 areas (69% of those who responded to this question) said it had decreased, 27 areas that it had remained the same and two areas (2%) that it had increased. Some respondents made clear that they were concerned with early years provision rather than budgetary issues. And 5% gave no response – in some cases children’s centres budgets had been merged with other projects.
‘It is difficult to respond to the question above as we now have an integrated service and budget for the Right Start service which includes children’s centres, health visiting, FNP [Family Nurse Partnership] and oral health for under-fives and school nursing.' (Urban area, North West)
Others pointed out that the main reduction in the budget had occurred at an earlier time point:
‘Children’s centres have been incorporated into a wider early help offer for children aged 0-19 and their families. Reduction in budget and number of registered children’s centres occurred prior to 2017.’ (Urban area, Yorkshire and Humber)
Change of focus: this option was a close second choice with 99 areas (80%) selecting this as one of the principal reasons for substantial changes in children’s centres in their authority. As might be expected, many areas commented that this was because of increased targeting on high need families and children. However, the move to integrate children’s centres into a wider package of preventative social and health services was also frequently mentioned; and this in many cases was with a team or locality approach that covered a much wider age range (0-19). Clearly, financial pressures were one of the main reasons behind these developments. ‘Early help’ was probably the most cited approach.29 This may take different forms locally, but in general it consists of collaborative work by different professionals to help families in difficult circumstances support their children. The troubled families programme was also mentioned by some areas.
‘Because of funding pressures, we’ve had to be more focused on what we actually deliver. It’s important to have open access, but our staff need to be focused on responding to needs of targeted families (and not just poor neighbourhoods).’ (Shire county, East Midlands) ‘Children’s centres are now part of local area teams. Local area teams are multi-agency place-based teams bringing together a range of 0-19 services. They work from the universal level through the thresholds for statutory interventions. The introduction of this model has driven significant change in how children’s centres operated to integrate it more with a wider set of multi-agency partners.’ (Urban area, Yorkshire and Humber) ‘Supporting a high number of buildings (some of which were not operating every day) was not sustainable through our early help contracts so we have found different ways to keep them open and delivering early childhood services.’ (Shire County, South West)
29 Ofsted (2015).
26
‘Family hubs are now incorporated into our early help offer and as such the focus is increasingly on those families requiring support to prevent their children needing later intervention from children’s social care.’ (Urban area, North East)
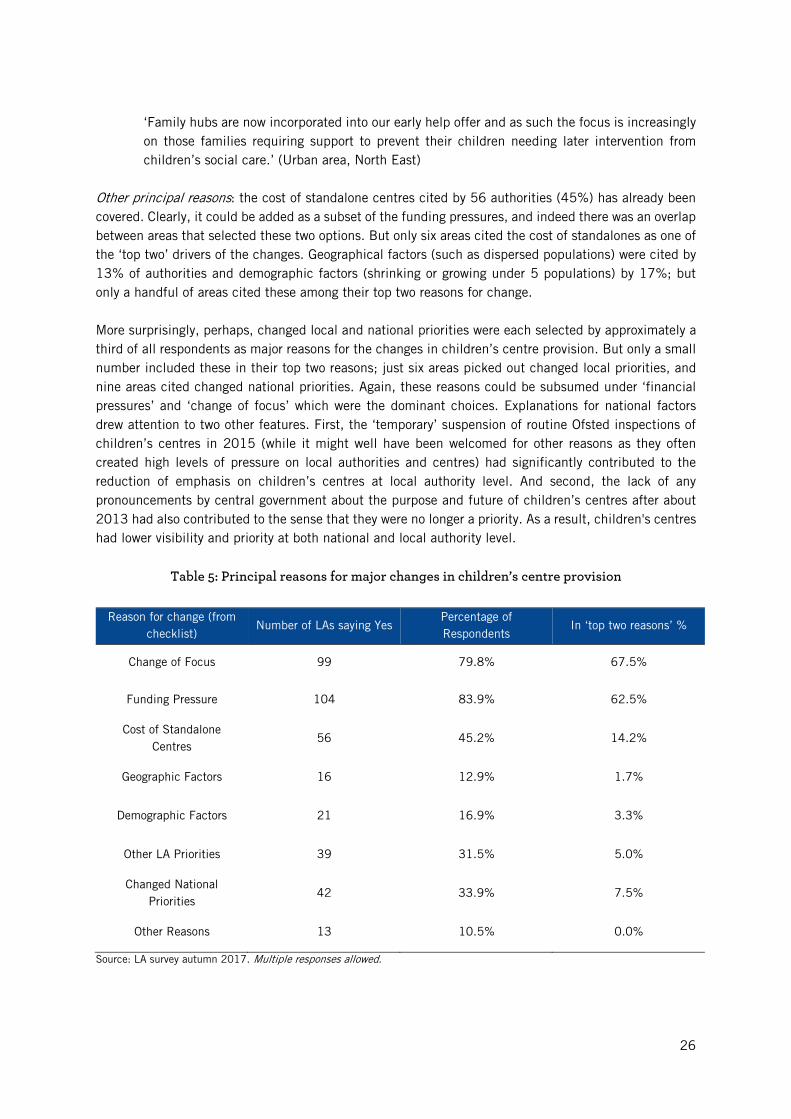
Other principal reasons: the cost of standalone centres cited by 56 authorities (45%) has already been covered. Clearly, it could be added as a subset of the funding pressures, and indeed there was an overlap between areas that selected these two options. But only six areas cited the cost of standalones as one of the ‘top two’ drivers of the changes. Geographical factors (such as dispersed populations) were cited by 13% of authorities and demographic factors (shrinking or growing under 5 populations) by 17%; but only a handful of areas cited these among their top two reasons for change. More surprisingly, perhaps, changed local and national priorities were each selected by approximately a third of all respondents as major reasons for the changes in children’s centre provision. But only a small number included these in their top two reasons; just six areas picked out changed local priorities, and nine areas cited changed national priorities. Again, these reasons could be subsumed under ‘financial pressures’ and ‘change of focus’ which were the dominant choices. Explanations for national factors drew attention to two other features. First, the ‘temporary’ suspension of routine Ofsted inspections of children’s centres in 2015 (while it might well have been welcomed for other reasons as they often created high levels of pressure on local authorities and centres) had significantly contributed to the reduction of emphasis on children’s centres at local authority level. And second, the lack of any pronouncements by central government about the purpose and future of children’s centres after about 2013 had also contributed to the sense that they were no longer a priority. As a result, children's centres had lower visibility and priority at both national and local authority level.
Table 5: Principal reasons for major changes in children’s centre provision
Reason for change (from checklist)
Number of LAs saying Yes Percentage of Respondents
In ‘top two reasons’ %
Change of Focus 99 79.8% 67.5%
Funding Pressure 104 83.9% 62.5%
Cost of Standalone Centres
56 45.2% 14.2%
Geographic Factors 16 12.9% 1.7%
Demographic Factors 21 16.9% 3.3%
Other LA Priorities 39 31.5% 5.0%
Changed National Priorities
42 33.9% 7.5%
Other Reasons 13 10.5% 0.0%
Source: LA survey autumn 2017. Multiple responses allowed.
27
‘The long lost Sure Start review has not materialised and this has made it difficult to maintain Sure Start services as a priority in the LA, particularly since the suspension of the Ofsted inspection framework.’ (Urban area, NW) ‘We still await updated SSCC [Sure Start Children’s Centre] guidance from government and an update on the inspection framework from Ofsted which would significantly assist any future sustainability.’ (Shire County, North West)
Changes in the pipeline
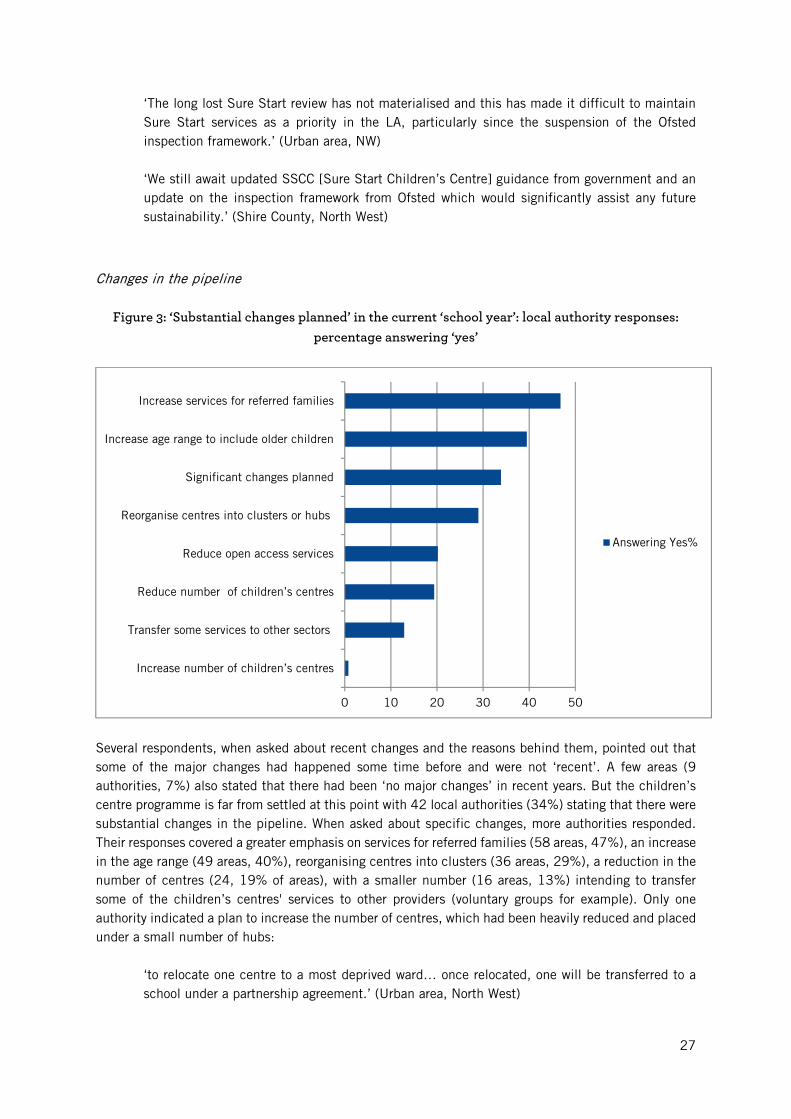
Figure 3: ‘Substantial changes planned’ in the current ‘school year’: local authority responses: percentage answering ‘yes’
Several respondents, when asked about recent changes and the reasons behind them, pointed out that some of the major changes had happened some time before and were not ‘recent’. A few areas (9 authorities, 7%) also stated that there had been ‘no major changes’ in recent years. But the children’s centre programme is far from settled at this point with 42 local authorities (34%) stating that there were substantial changes in the pipeline. When asked about specific changes, more authorities responded. Their responses covered a greater emphasis on services for referred families (58 areas, 47%), an increase in the age range (49 areas, 40%), reorganising centres into clusters (36 areas, 29%), a reduction in the number of centres (24, 19% of areas), with a smaller number (16 areas, 13%) intending to transfer some of the children’s centres' services to other providers (voluntary groups for example). Only one authority indicated a plan to increase the number of centres, which had been heavily reduced and placed under a small number of hubs:
‘to relocate one centre to a most deprived ward… once relocated, one will be transferred to a school under a partnership agreement.’ (Urban area, North West)
0 10 20 30 40 50
Increase number of children’s centres
Transfer some services to other sectors
Reduce number of children’s centres
Reduce open access services
Reorganise centres into clusters or hubs
Significant changes planned
Increase age range to include older children
Increase services for referred families
Answering Yes%
28
In some areas further changes were out for consultation or review, but for some the direction already seemed clear:
‘changes are not yet defined but we will see a significant budget reduction.’ (Shire county, South West)
And in other cases the writing was on the wall for their own jobs or units:
‘reflects the need to deliver budget savings, caused in part by government changes to the EY [early years] block of DSG [dedicated schools grant] and the national early years funding formula in which [this area] is a net loser of funding… From January [2018] there won't be an early years service [in this area] as a distinct entity.' (Urban area, South East)
Creative strategies in response to local authority cuts The overall picture was not only one of decline but also of struggles to survive. What the survey picked up was first, a very high commitment to the children’s centres programme by many local authority officers with direct responsibility for the programme - though not necessarily in its original form. We can see this in the large number of authorities that, despite the lack of national input and sharply reduced funding, had sought to maintain as far as possible the same number of centres even though what they now offered had been cut back. Second, we can see this reflected in some of the creative or imaginative responses to the pressures they were under, particularly making links to other programmes that might offer some opportunity to continue the local children’s centre programme in an often reduced form. Four main strategies were identified. In some areas this was (1) drawing on initiatives under the ‘early help’ banner, or incorporating the children’s centre into a wider ‘locality’ or district team structure, targeting families and children in need across the full age range (0-19).
'[The authority] has embarked on a major service transformation integrating health visiting, breastfeeding support, children’s centres, early help, community providers, parent infant partnership, domestic abuse advisors as one team …, including a dedicated midwife, interfacing with midwifery service.’ (London borough)
There were other developments such as (2) linking centres to local nursery or primary schools. Strong links with nursery or primary schools seem to have become more widespread. Some of this may be ‘needs must’ in the face of budget cuts - as a way of reducing management time and costs - but they are also a way of better integrating services for young children and families that will enhance child development. (3) Another method which was heavily used was to group centres into clusters, ‘hub and spokes’ models, or part-time centres with a coordinated programme of opening times across different sites. (4) A fourth approach was to draw heavily upon external funding sources such as the Healthy Child Programme or the Big Lottery’s A Better Start (ABS). These four strategies were not mutually exclusive, and the six case studies that follow show imaginative strategies for survival, but also ways of managing decline.

29
5. Six case studies These six case studies are intended to provide examples of the great diversity in policy and practice developments described earlier in the report. They are anonymous; the information is drawn from a mixture of background documentation and interviews. Two are large metropolitan authorities; two are shire counties; two are mid-size port cities. Two are notable for a focus on early education and learning, with all children's centres based in schools, and run by the local authority. Two, by contrast, show a mix of local authority and private and voluntary organisation, with a focus on multi-agency work. All claim to continue open access and universal services; but how this is done varies. A common solution in cash-strapped times is to focus local authority staff on targeting the 'most vulnerable' families and leave open access work to the voluntary sector, or in partnership with the health sector, where health visitors have a universal remit. All show, in different ways, innovative strategies to meet increased responsibilities and reduced funding. Key themes are the balance between universal/open access and targeted work; the nature and problems of integrated services and a multi-agency approach; the different staff skills required by the shifting focus of the service; and the diversity in aims and organisation. Faced with this variety, can we any longer claim a status for children's centres as a national programme? This is the challenge for the conclusion to this study.
Londonborough Londonborough is a London authority with very high levels of poverty and ethnic minority families. It reduced its children’s centres from 20 in 2009/10 to 12 by the summer of 2017. At first, Londonborough protected its children’s centres when other boroughs began to close theirs. However, the most recent round of government cuts to the local authority budget meant that they had to make closures to some centres and amalgamation of services in others. ‘A savings target of £3.15m in 2014/15 necessitated a shift in how children’s centres services were delivered. The best start in life programme aimed to make savings on buildings by reducing the number of registered children’s centres and increasing the use of community venues. Improved integration with other delivery partners also allowed us to reduce duplication and achieve efficiencies.’ Because of the high levels of poverty in Londonborough, combined with high proportions of ethnic minority families, the plan was to hold on to open access services wherever possible. This was done by making sure that the remaining 12 centres were all led by a school, either a nursery school or a primary. The rationale was that schools would remain open; they had secure buildings, and paid caretaking and administrative staff; and attending them was not stigmatising. Of the seven maintained nursery schools in the authority, six were affiliated with children’s centres, while the remaining six children’s centres were to be led by a primary school. To take one example, North Park is an area of high deprivation which originally had three children’s centres located in it. The centre led by a maintained nursery school remained open while expanding its remit and ‘reach’. Two other centres were closed as independent centres (each had employed a manager and administrative staff, as well as other staff, including outreach workers), leading to significant savings for the authority, even when compared to the small increase in the remaining centre's budget. The nursery-led children’s centre is open all day five days a week, but its staff now provide services elsewhere where centres have been closed. Three local primary schools have agreed to give space for
30
free as an off-site venue for children's centre work led by North Park Nursery School. The staff working in the schools are paid and managed by the children’s centre. These workers also run services in the local library and a community centre. Thus, all children’s centre services are run by staff managed by the children’s centre, but working in ‘satellite spaces’ given for free by primary schools, libraries or community centres. The headteacher of the nursery school in North Park is also the manager of the children’s centre, and said:
'It’s not a real children’s centre in the old sense of providing a full core offer, but we manage to offer many open access services in the areas formerly served by three children’s centres – we just do it in a different way. We are no longer a well-funded children’s centre, but we have talented and committed staff who provide services across the area so that families can access local services.’
The other remaining children’s centres in Londonborough are organised along the same lines. Each is led by a local authority school and all run services both inside the children’s centre and also in other schools, community centres and in buildings that were formerly full children’s centres but which now act as venues serving 'the hub' children’s centre. Each of the 12 children’s centres offers ten or more services each week, many open access. A few children’s centres (but not the majority) also run some services limited to referred families only. In this authority all the children’s centres are run by the local authority itself, through schools. This local authority has a very public commitment to boosting early years foundation stage profile scores.
‘Children’s centre work in our authority is aimed at learning and development rather than social care.’
This is seen as a success: the levels of ‘good development’ of children in the authority have risen over the last five years and are now above the national average, despite the poverty. Because of the commitment to raising levels of development in children, open access services and services that support children’s development such as Stay and Play are the focus. ‘Early Start’ in this authority is a high profile, arms-length organisation broadly seen as social care, but it does not dominate children’s centre work and its offices are not located in children’s centres. This London borough remains committed to children’s centres serving families of children aged 0-4, with a special focus on the learning and development of children before school entry. However, despite imaginative re-structuring, ‘the reduction in registered children’s centres has led to a natural reduction in the level of services provided.’
Portcity This authority has cut its children's centres from 33 in 2009/10 to 22 in July 2017. Funding has been slashed by over £5m in the last five years - an estimated 30% cut in the 2015/16 to 2017/18 period. Nevertheless, it has managed to maintain a broad range of services and open access in its centres, within an education-based model: ten centres are managed by maintained nursery schools, five by maintained primary schools, and one by a local voluntary provider, and a local library is also used as a children's centre. The following quotations come from an interview with the head of early years services. All the centres offer a combination of open access services and services just for referred families; none offer services for referred families only.
31
'Families like open access because of loneliness and isolation. In Portcity, we believe that it is very important to offer a combination of universal (open access) services as well as referred and targeted services, so that our children's centres are seen by families as non-stigmatising, safe and accessible places to go. This approach has had a very positive impact: currently, almost 25,000 children under five are registered with their local children's centre in Portcity. This represents 87% of families with under-fives living in the 10% most disadvantaged Super Output Areas and 82% of families overall. Our children's centre funding formula is based on a 'proportionate universal' approach as set out by Michael Marmot,30 according to the number of children under five in each area, weighted by deprivation, with children living in the 10% most disadvantaged SOAs [super output areas] receiving the highest level of funding. Centres deliver integrated early education, health and family support services.'
The education focus of the centres provides 'economies of scale regarding management costs, pedagogical leadership, and seamless transition to school for children...Pedagogical leadership is essential.' Lead teachers in the centres are expected to work with all the schools and early years settings in their reach areas, including childminders. This has had a significant impact on the quality of early years provision across the city: 100% of maintained and voluntary early years providers and more than 97% of private providers and childminders have been judged good or better by Ofsted in their latest inspections. Thus, children's centres are firmly bedded into their early years communities. Financial constraints have meant increased pressure to move to a more targeted approach, but so far centres remain open access to all, encouraging families wary of officialdom. One example is the use by gypsy, Roma and traveller families of health services delivered through children's centres. For some families this was the first time they had used public services. Portcity currently brings together the statutory frameworks in the early years foundation stage and the healthy child programme in multi-agency partnership working. How much further integration is possible? There are proposals to reorganise the family support services into four areas across the city. Plans suggest reductions in management and administration costs, but also possible reductions in services. Here is Portcity's vision of the role played by children's centres in the coordination and integration of services to support young children and their families:
'Children's centres act as the connectors, the conduit for policy, pedagogy and practice.'
Shipcity Shipcity has seen little change in the overall number of children's centres over the last decade, with 16 remaining in 2017 from the original 17 registered in 2009. The children’s centre budget has been cut by only 2%; however, 'these funds are being spent to a different purpose in many cases'. Local authority officials believe that 'quality has not diminished; but we have changed the balance of work from universal to targeted services'. Eight years ago, provision was based on the 'full core offer' of a blend of open
30 Sir Michael Marmot is professor of public health and epidemiology at University College London (UCL). His work focuses on health inequalities and the social determinants of health.

32
access services such as Stay and Play or baby massage combined with specialist services such as 'The Incredible Years' for referred families. Today, all 16 centres are offering a new mix of services, with a heavier emphasis on 'vulnerable families'. Although Shipcity does not have any children’s centres that serve referred families only, their emphasis has shifted more to targeted work. However, all centres still run open access services and they think it is important to retain them, although at a reduced level. One official said:
'We now focus on early help - keeping children out of care. Social care staff are now situated directly in the children’s centres. We do more complex assessments now, such as pre-birth to prevent problems later on. We also have many more requests from the court for reports. These require a different kind of training than previous staff had - different skills than those needed for leading open access activities for children and parents. We now need to write accurate and concise reports for submission to court.'
Whereas in 2009 the local authority managed the majority of centres, in 2017 virtually all were managed by the voluntary sector:
'This has many advantages, such as the capacity to raise funds from outside sources. Because the centres are managed by the private, voluntary and independent sector, our multi-agency work is better. It just works better, more collaborative. There are also new opportunities for partnership with other agencies. The move out of LA management and into PVI [Private, voluntary and independent] has been a success.'
The 16 centres are grouped in three clusters, each cluster with a manager and administrative team. This is a major change from 16 standalone centres, each with its own manager and administrative team. So the Shipcity centres have witnessed a great reduction in staffing, especially at senior levels. This has accompanied a shift in the focus of the service:
'the quality has remained the same; the level of service remains the same, except that it is more targeted. All centres run for the full day. Children’s centres are now more involved in early help, aimed at keeping children out of care. Social care staff are now situated in children’s centres. The families served by centres have more complex needs now. We are reaching the most vulnerable families now. Before, the more confident came into the centres while the less confident remained at home. Also, in the past some buildings were under-utilised and this is no longer the case.'
'We follow a systems leadership approach in Shipcity. Children’s centres now and in the future will relate more to mental health, to special needs, and to police work. The new commissioning in Shipcity is in different "bundles". Children’s centre budgets will now become part of the "vulnerable children bundle".'
Shipcity is in the middle of a major transformation for the following reasons:
'First, there is pressure on the local authority to increase the early help offer to families in order to prevent greater numbers of children entering care. Secondly, we are trying to offer a more integrated system of support for families, and children's centres are an integral part of this transformation. More agencies are involved in the main work of the centres. Thirdly, we have to save money: children's centres are expected to reduce management, administration and building
33
costs. We will do more outreach work in homes, and we now rent space in the buildings to others such as health.'
Shipcity appears to have accomplished this massive change with almost no public protest.
'We consulted widely in Shipcity on the new arrangements in just seven weeks. We consulted on the shifting of resources and there were no protests, except for one local protest that had special reasons, not authority wide.'
Rivershire Rivershire is a large county, with villages and some large towns, now London 'commuter land'. The following quotations come from an interview with the head of commissioning for early years and children's centres services. The 86 centres registered in 2009 were being reduced to 12 major centres in 2017. The authority has embarked on a large-scale reorganisation of its services for young children and families, following a two-year review:
'The system is very confusing for families; having to tell their stories too many times; getting conflicting messages. Families don't go to buildings for services. Why are more vulnerable families not using children's centres? Too formal; too stigmatising; too far away, no transport, families can't get there.'
Rivershire has been divided into four areas, and these areas into 12 districts. Each district has a 'family hub' building centrally sited, with multiple 'local sites', or outreach in village halls or schools, or work in families' homes. This is a 'hub and spokes' model, with the 12 children's centres operating as 'family hubs', registered with Ofsted, on Edubase, open 8 am to 6 pm Monday to Friday and run collaboratively with other professionals, in principle providing offices and 'meet and greet' and offering delivery space to other organisations to provide services. In addition, there are 'delivery sites', registered as 'linked sites' on Edubase, on main bus routes for access, with staff delivering timetabled sessions and information on websites and Facebook as well as in libraries.
'We have put our effort into reach - taking services into the community. The principle of services without walls.'
Rivershire has a 0-19 'integrated contract' with a company, which in turn has contracted a national charity to run the children's centres services, planned to run for ten years. The aim is that a family's key worker will come from the service dealing with the family's root problem. The company will provide 70% of the workforce and employ the health workers, and the remaining 30% of the workforce will be employed by the national charity.
'The former team of 27 early years staff has now shrunk to nine; the early years and children's centres service has shrunk; so work done formerly by the Preschool Learning Alliance, 4Children, the National Day Nursery Association etc is now taken in-house.' 'We have merged the healthy child programme and the healthy schools programme for 5-11s, run by schools. The health visitor workforce is on board providing the universal aspect. We also rely on families' peer support and friendship networks.'
34
Has the balance shifted between targeted work and universal services/ open access?
'Yes. Universal services are provided by the health visitor offer, while children's centres offer more targeted work. But we want to create more community support - the aim is that the community runs the group or service with support from local authority workers.' 'The local authority will only take on targeted work. There should be the volunteer network for other services; but not for targeted work. But how do we incentivise volunteers? How provide support? There is no cash. All we can say is it is good for your career or study; and what about accreditation for volunteer support?'
Rivershire ended the interview with looming questions about the role of the voluntary sector and how to recruit and keep volunteers on board - issues of increasing importance in times of austerity.
Midshire Midshire made huge cuts in funding and closed the majority of its children's centres in 2016/17 against a continuing and vociferous public outcry, including well publicised letters against the closure written by a member of a senior minister's family. Despite consultation showing massive opposition to closure, Midshire closed 34 centres, while the eight centres (plus two satellites) that remained open saw a shift in the balance of services in favour of referred families. The remaining eight (+2) centres operate under the direct control of the local authority and have been re-named ‘Family and Children’s Centres’ with an extended age range of 0-19. All eight of the remaining local authority-run centres focus on services for the exclusive use of referred families, for example 'supervised access visits' and family mediation, although they also provide a few open access services. Their function has changed from a ‘place where services were run’ (which virtually all did in 2009/2010) to acting as an institutional hub for social care or health activities, including providing offices for those who work in social care. None of the eight centres is a constituent part of a cluster; all have their own manager with administrative back-up. What is striking is that none of the eight have daily services for children, although all have a few sessions a week, mostly for children from families referred by social services. The age range of users has changed from 0-4 to 0-19, which means that the age range of services has expanded since 2009/10. All centres offer substantial health services and each has at least one dedicated health room for services including child and adolescent mental health services (CAMHS), health visitor or midwife appointments, speech and language therapy, breastfeeding support, baby sleep clinic. The health authority provides funding for these activities but the local authority is loath to charge them for space since they bring open access, non-stigmatising services such as breastfeeding support. This huge change is laid squarely at the feet of central government, with the cuts to local authority funding:
'There are increasing numbers of children requiring statutory intervention. The CP [child protection] and LAC [looked after children] programmes need to increase capacity in statutory services to deal with this increased work. The reason for this massive closure and change of focus is the government spending reductions to this local authority’.
35
Apart from the eight registered centres run by the local authority, there are 34 former children's centres which have been 'deregistered' and are now used to provide open access services funded and run by a range of organisations in the voluntary and private sectors. The authority pays three full-time ‘locality coordinators’ whose job is to work with community groups - church groups, Rotary Club, the local co-operative store - to set up and run the kind of services formerly run by the centres. The local authority-run libraries are also used as a venue for ‘Rhyme Time’ and other activities for children and parents.
‘The professional children’s centre staff have gone and their work is now being done by community volunteers or those employed in the PVI sector to provide services that used to be provided by the local authority. The LA contributes some free training and pays the three "locality coordinators" who support the PVI sector.'
A major challenge in describing services in the de-registered centres is that terminology varies across the local authority. However, there is no doubt that:
'the centres now have to fend for themselves and raise their own money, which is easier to do as a charity than as an arm of local government.’
Northport Northport reduced the number of children's centres from 27 in 2009 to 17 in 2017, with reductions in management and reorganisation of service delivery with a mix of open access and targeting:
'We currently have a number of standalone sites and a number of merged sites: although we currently have 17 centres they operate across 24 sites. In September [2017] we will be merging our standalone sites and reducing management, but we will still offer a full range of universal and targeted services from 24 sites.' 'We serve a transient population. Commissioning centres are required to offer open access to all families that come, so there is a mix of open access and targeting.'
There is close liaison with health services. For example, the universal two year-old check carried out by health visitors and organised in the children's centres, may pick up a child who needs the additional support of a speech and language programme, or speech therapy, or physiotherapy - 'there are massive waiting lists'. The healthy child programme is delivered through the children's centres; health visitors provide 'a universal pathway', varied according to different needs and requirements in different areas:
'The council does targeted work; our partners support universal services. The council seeks government funding for work done through the early help programme using the common assessment framework [CAF]. Families think this is a bad stigmatising name; so we have renamed it the Early Help Assessment Tool, EHAT.'
Northport's children's centres were a mixture of local authority-run and school-run centres, with one voluntary organisation about to be phased out.
'All services are delivered in all centres; we follow the principle of good practice and standardisation according to the Ofsted framework, with a "graduated response" that is

36
responsive to local needs. Ofsted inspects children's services and the local authority, and the local authority follows Ofsted's framework for early years work.'
Northport is expecting very large budget cuts: reportedly 82-86% of the current year's expenditure. But there was to be a large increase in targeted work for referred families, and the changes to children centre policy were clearly put down to this shift as well as to the reduction in government funding and the removal of the ring-fenced grant. Strategies to reconfigure services include streamlining management, linking with schools and merging centres under one management. Strategies also include income generation: for example, one children's centre site is used five days a week by a big local hospital; and the authority is looking at a bid to the European Social Fund (ESF). Here we see a very large urban authority playing across a large geographical area, creatively seeking to maximise its budget with partnerships across integrated services and new sources of funding, while facing increased workloads and very large financial challenges.
37
Conclusion: Children’s centres in 2017
The children’s centres programme in England started out life as a national initiative, initially targeting the most disadvantaged areas defined by the proportion of children aged 0-5 living in low income families. The aim was to set up an open access neighbourhood based centre for young children and their families directly providing some services and acting as a gateway for more specialised provision. It then expanded to a country-wide programme for all areas by 2009, with at least one centre in every local authority and some larger authorities with 70 or more centres, but there was still a central team with the programme delivered via local authorities from a ring-fenced national budget. At its height, there were 3,632 centres operating across England, 78% of which were the substantial Phases 1 and 2 centres, usually in their own sometimes purpose-built premises - and the remaining 22% in the ‘light touch’ often part-time Phase 3 centres. Some 54% of all centres (mainly in Phases 1 and 2) were located in the 30% most disadvantaged areas in August 2009. By late 2017, the overall national picture was radically different – indeed, it is difficult to see it any longer as a truly ‘national programme’ as there is so much local variation in what is now provided - not so much a ‘postcode lottery’ as dependent on which local authority serves your area. Once the national element was removed in 2010 by the abolition of ring-fenced funding, the key decision point on its future became the local authority - though this clearly had to act under severely tightening budgetary constraints. This variation gathered pace once the programme was no longer centrally managed and the budget no longer ring-fenced. The ending of full Ofsted inspections of children’s centres in 2015 (as a ‘temporary’ measure pending ministerial review of the programme promised, but still awaited in 2018), and the lack of any overall national guidance after 2013, both contributed to the reduced sense of an important national programme. The terminology now used to describe children’s centres and their organisation, while never very precise, is used in increasingly variable ways across different authorities – with ‘registered children’s centres’, ‘linked sites’, ‘locations’, 'venues', ‘hubs and spokes’. This makes a reliable and consistent headline count of centres at national level virtually impossible. The widespread pressure from central government for greater targeting on high need families defined in social and behavioural terms and away from ‘open access’ clearly fits better with the priorities of some local authorities, but less well in others where centres serve highly disadvantaged areas based on socio-economic criteria, where many families might be defined as in need. The move in many areas to link children’s centres more closely to other structures or groups locally, not least as a way of reducing overall costs, also adds to this variation. If they are tucked under the wing of a local nursery or primary school then their educational and child development purposes and the 0-5 target age group is likely to be reinforced. If they are moved to become part of a ‘locality team’ with a broad preventative ‘early help’ agenda for a much wider target age group (those aged 0-19), then this too contributes to the variation between children’s centres in one authority and another. It is true in late 2017 that every authority in England responsible for children’s services still had one or more children’s centres. And it is also true that many local authorities have shown a strong commitment to maintain the programme and done their best to retain existing numbers of children’s centres, despite sharp reductions in their overall funding. Official figures suggest that overall there was only a modest decline (around 16%) in the national number of centres by autumn 2017 (though this almost certainly understates the true picture which may be much higher due to time lags and inconsistent ways of counting ‘centres’ in official data bases). The ‘true’ figure may be 30% or more. It is also true that,
38
measured on the basis of income deprivation affecting families with children, there has been only marginal change since 2009 in the location of centres in the poorest 30% of neighbourhoods (with 54% in 2009 and 52% in 2017) - although there are critically fewer centres in all areas. The very high proportions of closures in some areas which have frequently been headline news, locally and sometimes nationally, was a route initially taken by a limited number of authorities. By 2017 the 16 (out of 152) authorities which had closed down 50% or more of their centres contributed some 55% of the overall total of centres formally closed by this point. But the logic of steeply falling budgets which these authorities faced, leading them to the early adoption of large closures, was also faced by other areas. If large scale closure was one response, there were several other possible routes that have been taken to respond to reduced funding. These included changes in organisation and management away from standalone local centres with their own manager - to mergers, clusters or a few major centres with several linked sites or ‘locations’ elsewhere. Another strategy used was to reduce what is offered by a single centre through clustering and linking. This may be by moving to a more part-time offer or a limited programme in any one centre where a cluster of centres in the authority may coordinate their opening times so that there is some cover somewhere in the authority; or by ‘layering’ the service provided - for example, with voluntary staff providing the surviving open access programmes and paid staff dealing with high need families or services for referred cases. The ECCE evaluation found that some children’s centre staff were concerned that they lacked the necessary training and skills to work with the most vulnerable groups.31 Clustering or grouping centres may help to spread limited staff time and expertise. Another method was to link children’s centres to another programme, for example to a much wider age group with a ‘locality team’ covering the 0-19 age group or to a health programme such as ‘The Healthy Child' or the 'Troubled Families' programme. Finally, one successful approach that has been adopted by several areas is to link the children’s centre to the nearby nursery school or primary school under the headteacher, if they were able to take on this extra responsibility. Many authorities have woven together a set of these strategies for survival, of keeping centres in existence but reducing the overall resources rather than going for major closures. But by late autumn 2017, there was powerful and growing evidence that the continuing impact of reductions in local authority budgets, set out in detail in the recent National Audit Office report, meant that this could not be continued. A tipping point may have been reached. Since then many local authorities which had so far managed to maintain large number of children’s centres have announced major closures and reorganisations or are in the process of consultation over such changes. The major driver is the budgetary imperative to reduce overall expenditure, with discretionary services such as children’s centres one of the targets. The example of Northamptonshire, which issued a section 114 notice (in effect a form of bankruptcy) in February 2018 as it was ‘at risk of failing to balance its books...’32 can only add to these pressures. Devolution of control to local authorities for the children’s centre programme can be presented as restoring local decision-making power where it rightfully belongs - away from central government. But if this has to operate under increasingly tight financial constraints as overall funding drops year on year, then local decision-making is heavily restricted. For the children’s centre programme one result has been the extraordinary range of variation from one authority to another, in both scale (as centres are closed) and purpose (whether it should be primarily concerned with child and family development or largely restricted to an ‘early help’ approach for referred families). These changes take us a long way from what began as a 'flagship' national programme.
31 See Goff et al. (2013) p xxv. 32 National Audit Office (2018). See page 9.
39
Acknowledgements We are very grateful to the many local authority officials who completed the survey, sent us local documents and added specific information to questions. We are particularly grateful to the six authorities that provided the case studies. We thank Emma Powell and Beatriz Melendro Martinez for research assistance.
About the authors
George Smith is Associate Fellow at the University of Oxford Department of Social Policy and Intervention. He is a former Head of the Department of Social Policy and Social Work at Oxford, where he co-directed the Social Disadvantage Research Centre that developed the national Indices of Deprivation. For 15 years he was research adviser to HMI and Ofsted nationally. His fields of interest include educational policy, urban disadvantage, poverty and measuring local deprivation. Prof Kathy Sylva is Honorary Research Fellow and Professor of Educational Psychology at the University of Oxford. She has acted as lead researcher on the Effective Pre-school and Primary Education Study (EPPSE) and co-led the national Evaluation of Children’s Centres in England. Along with early education, her research also focuses on parenting programmes. Currently, she is conducting an EU funded study on the early childhood curriculum across Europe. She was awarded an OBE in 2008 for services to children and families. Teresa Smith is Associate Fellow at the University of Oxford Department of Social Policy and Intervention, where she served as head of department for eight years. She is an emeritus fellow of St Hilda's College, Oxford. She has served as an expert advisor to the House of Commons Select Committee for Education, advisor to the Strategy Unit in the Cabinet Office, and a research associate at the Institute for Fiscal Studies. Her research interests are in community, disadvantage and family, preschool policy, childcare and education and the relationship between formal and informal care.
Prof Pam Sammons is Professorial Senior Research Fellow at the Department of Education, University of Oxford and Senior Research Fellow at Jesus College, Oxford. Her research interests focus on school effectiveness and improvement, leadership, equity in education, and evaluation. She was a principal investigator on the Effective Pre-school and Primary Education Study (EPPSE) and co-led the national Evaluation of Children’s Centres in England.
Aghogho Omonigho was a Research Assistant at the Oxford University Department of Education and is a final year psychology student at the University of Bath.
40
Glossary CAF Common Assessment Framework: a multi-agency assessment led by a social worker, of a child under a child protection order CAMHS Child and adolescent mental health services CP Child protection DfE Department for Education DfES Department for Education and Skills DSG Dedicated Schools Grant EIG Early Intervention Grant ESF European Social Fund EYG Early Years Grant FNP Family nurse partnership IDACI Income Deprivation Affecting Children Index: one of the indices forming part of the
national Indices of Deprivation IMD or ID Indices of (Multiple) Deprivation: a set of 37 standardised measures of local deprivation
for all 32,844 small areas (SOAs) in England LA Local authority LAC Looked after children (that is, in the care of the local authority) NAO National Audit Office NDNA National Day Nurseries Association PLA or PPA Preschool Learning Alliance; previously Preschool Playgroups Association PVI Private, voluntary and independent sector SEND Special educational needs and disability SOA/LLSOA Lower-level super output areas: standard areas with c1500 people for which a large
volume of data is released
41
References Action for Children, National Children's Bureau, and the Children's Society (2016) Losing in the long run. Trends in early intervention funding. Action for Children. Retrieved from https://www.actionforchildren.org.uk/media/5826/losing_in_the_long_run.pdf Action for Children, National Children's Bureau, and The Children's Society (2017) Turning the tide: Reversing the move to late intervention spending in children and young people's services. Retrieved from https://www.ncb.org.uk/sites/default/files/uploads/documents/Turning%20the%20tide%20report_final.pdf Bate, A. and Foster, D. (2015) Sure Start (England). House of Commons. Retrieved from http://researchbriefings.parliament.uk/ResearchBriefing/Summary/CBP-7257#fullreport Department of Health and Social Care (2004) National Service Framework for Maternal and Child Health. Retrieved from https://www.gov.uk/government/publications/national-service-framework-children-young-people-and-maternity-services Eisenstadt, N. (2011) Providing a sure start: how government discovered early childhood. Policy Press Goff, J., Hall, J., Sylva, K., Smith, T., Smith, G., Eisenstadt, N., Sammons, P., Evangelou, M., Smees, R. and Chu, K. (2013) Strand 3: Delivery of family services by children's centres. Retrieved from https://www.gov.uk/government/uploads/system/uploads/attachment_data/file/224096/DFE-RR297.pdf HM Treasury, Department for Education and Skills, Department for Work and Pensions, and Department for Trade and Industry (2004) Choice for parents, the best start for children: a ten year strategy for childcare. Retrieved from http://news.bbc.co.uk/nol/shared/bsp/hi/pdfs/bud05_choice_for_parents_210.pdf Ministry of Housing, Communities and Local Government (2015) The English Indices of Deprivation 2015. Retrieved from https://www.gov.uk/government/statistics/english-indices-of-deprivation-2015 National Audit Office (2018) Financial sustainability of local authorities 2018. Ministry of Housing, Communities & Local Government. Retrieved from https://www.nao.org.uk/wp-content/uploads/2018/03/Financial-sustainabilty-of-local-authorites-2018.pdf Ofsted (2015) Early help: whose responsibility? Ofsted. Retrieved from https://www.gov.uk/government/uploads/system/uploads/attachment_data/file/410378/Early_help_whose_responsibility.pdf Puffett, N. (2018) Inspection freeze undermines children's centres, charity warns. Children and Young People Now January 22 2018. Retrieved from https://www.cypnow.co.uk/cyp/news/2004780/inspection-freeze-undermines-childrens-centres-charity-warns Sammons, P., Hall, J., Smees, R., Goff, J., Sylva, K., & Smith, T. et al. (2015). The impact of children's centres: studying the effects of children's centres in promoting better outcomes for young children and their families. Department of Education. Retrieved from
42
https://www.gov.uk/government/uploads/system/uploads/attachment_data/file/485346/DFE-RR495_Evaluation_of_children_s_centres_in_England__the_impact_of_children_s_centres.pdf Sammons, P., Smees, R., Hall, J., Goff, J., Sylva, K., & Smith, T. et al. (2015) Changes in resourcing and characteristics of children's centres. Department of Education. Retrieved from https://www.gov.uk/government/uploads/system/uploads/attachment_data/file/485362/DFE-RR494_Children_s_centres_changes_in_resourcing_and_characteristics.pdf Smith, G., Field, K., Smith, T., Noble, S., Smith, T., and Plunkett, E. (2014) The extent to which centres 'reach' eligible families, their neighbourhood characteristics and levels of use. Department of Education. Retrieved from https://www.gov.uk/government/uploads/system/uploads/attachment_data/file/318227/RR358_-FINALrevisedReachReport07042014.pdf Springate, I., Atkinson, M., Straw, S., Lamont, E. and Grayson, H. (2008) Narrowing the gap in outcomes: early years (0–5 years). Slough: NFER. Retrieved from https://www.nfer.ac.uk/publications/LNG02/LNG02.pdf Sylva, K., Goff, J., Eisenstadt, N., Smith, T., Hall, J., & Evangelou, M. et al. (2015) Organisation, services and reach of children's centres. Department of Education. Retrieved from https://www.gov.uk/government/uploads/system/uploads/attachment_data/file/433853/RR433A_-Organisation_Services_and_Reach_of_Childrens_Centres.pdf The Stationery Office (2006) Childcare Act 2006. Retrieved from http://www.legislation.gov.uk/ukpga/2006/21/pdfs/ukpga_20060021_en.pdf

1
The Sutton Trust
9th Floor
Millbank Tower
21-24 Millbank
London, SW1P 4QP
T: 020 7802 1660
F: 020 7802 1661
W: www.suttontrust.com
Twitter: @suttontrust