Embed Size (px)
Citation preview
27 (2005) 329–340
www.elsevier.com/locate/childyouth
Children’s adjustment to long-term foster care
James Barber a,*, Paul Delfabbrob
aFaculty of Social Work, University of Toronto, 246 Bloor Street West, Toronto, Canada M5R 3P6bPsychology Department, Adelaide University, North Terrace, Adelaide, Australia 5001
Received 24 May 2004; received in revised form 12 July 2004; accepted 18 October 2004
Available online 8 December 2004
Abstract
The psychosocial adjustment of children to long-term foster care was investigated in two studies.
The first study tracked 235 children over 2 years and obtained repeated measures of foster child well-
being, while the second study employed semistructured interviewing to obtain consumer feedback of
48 children in the care system. Taken together, results suggested that children adjust well to long-term
foster care as reflected by the overall positive developmental trajectory in standardized measures of
psychological adjustment and by the generally very positive feedback of the children interviewed.
D 2004 Elsevier Ltd. All rights reserved.
Keywords: Foster care; Child well-being; Psychosocial adjustment
1. Introduction
The philosophy of permanency planning is built on the assumption that the ideal
environment for raising children is the conventional nuclear family structure involving one
and preferably two stable parent figures who are willing to accept responsibility for the
child care until he or she comes of age. So strong is this belief that US child protection
jurisdictions would prefer to terminate the rights of biological parents altogether rather
than expose children to less stable or less conventional arrangements. Permanency
planning received official sanction in the US Adoption Assistance and Child Welfare Act
(1980) which was a response to the alarming numbers of children who were experiencing
0190-7409/$ -
doi:10.1016/j.
* Corresp
E-mail add
Children and Youth Services Review
see front matter D 2004 Elsevier Ltd. All rights reserved.
childyouth.2004.10.010
onding author. Tel.: +1 416 978 3255; fax: +1 416 978 7072.
ress: [email protected] (J. Barber).
J. Barber, P. Delfabbro / Children and Youth Services Review 27 (2005) 329–340330
harmful separations and indeterminate stays in care (cf. Barth & Berry, 1987; Bryce &
Ehlert, 1971; Claburn, Magura, & Resnick, 1976; Katz, 1990; Maluccio, Fein, &
Olmstead, 1986). A further legislative attempt was made to keep children out of care in
1993 when the US Senate passed the Omnibus Budget Reconciliation Act (1993) which,
inter alia, increased funding for family preservation services across the country. Further
legislative support for the goal of permanency was provided by the Adoption and Safe
Families Act (1997), the aim of which was to prevent children returning from foster care to
unsafe homes and to find permanent homes for those unable to return to their biological
families. Under this Act, a permanency planning hearing must be conducted within 12
months of placement for each child entering care and every 12 months thereafter (Gendell,
2001). The State is required to petition for termination of parental rights in cases where a
child has been in care for 15 of the preceding 22 months (with some limited exceptions);
where the court determines that a child has been abandoned; where parents have attempted
to murder or have committed voluntary manslaughter of one of their children; or where
parents have committed felony assault resulting in serious bodily harm to one of their
children (Lindsey, 2001). The Adoption and Safe Families Act also created financial
incentives to State welfare departments to increase their rate of adoptions. A total of
$US20 million was awarded each year until 2003 to States that led the nation in adoptions.
Not surprisingly, children began moving out of the foster care system in large numbers. In
the 1st year after the Act, for example, the numbers moving from foster care to adoption
increased by almost 30%, from 28,000 in 1996 to 36,000 in 1998 (US Department of
Health and Human Services, 2000). In Australia, by contrast, termination of parental rights
remains very rare, meaning that children can and do remain in foster care indefinitely.
Meanwhile, reunification efforts are expected to continue and/or parental contact is to be
maintained except in those rare cases where it is either manifestly dangerous or distressing
to the child. From a permanency planning viewpoint then, Australian foster children are in
an invidious position; as foster children, they are provisional family members and are
constantly exposed to the prospect of being uprooted and reunified with biological parents
at some time in the future.
While the case for placement permanence with stable parental figures may seem
intuitively appealing, we have previously pointed out that the evidence on which
permanency planning is based remains flimsy. Not only is there no evidence to suggest
that the policy shift toward placement permanency has improved the psychosocial
adjustment of children in out-of-home care but there is some evidence that foster children
are not necessarily impaired by transient living arrangements for up to 1 year in care
(Barber & Delfabbro, 2000), provided that the children were not evicted from placement
but moved for positive reasons, such as proximity to friends or biological family. In this
paper, we examine the question of whether long-term fostering is associated with adverse
psychosocial outcomes. In the first part of the paper, we present foster children’s
placement movements and psychosocial well-being after different lengths of time in care.
Stage 1 spanned the period from intake to 4 months, Stage 2 from 4 to 8 months, Stage 3
from 8 months to 1 year and Stage 4 from one to 2 years. An unstable placement then was
one where a child had to change placement at least once in the period. In addition to
placement stability and psychosocial adjustment, this paper also presents the feedback of
foster children on their placements. A key tenet of the United Nations Convention on the
J. Barber, P. Delfabbro / Children and Youth Services Review 27 (2005) 329–340 331
Rights of the Child is that children’s views should be taken into account in any decision
that is likely to affect their well-being or position in life (Gilligan, 2000). This view now
features strongly in alternative care policies around the world. Despite this, few systematic
attempts have been made to obtain information regarding children’s satisfaction with care.
One explanation for this may be that this kind of research is inherently difficult for
logistical reasons (see Gilbertson & Barber, 2002). The requirement in many jurisdictions
to obtain consent from foster carers, parents, service providers and children inevitably
limits access to many children in care. Furthermore, doubts have also been raised about the
extent to which foster children are likely to express their true feelings about foster homes.
The approach taken in this study was to limit our interviews to a subsample, which was
broadly representative of the overall sample, and to use interviewers who were manifestly
unconnected with the foster care system.
2. Method
2.1. Design
The paper reports the results of two interrelated studies into children’s adjustment to
long-term foster care; the first was a tracking study of children entering care over a 1-year
period, and the second was a consumer feedback study. The placement movements and
psychosocial well-being of children in the tracking study were monitored over a 2-year
period: at intake, 4-months, 8-months, 1-year, and 2-years. The second study used a
semistructured interview schedule to obtain the feedback of children who had been in
foster care for a minimum of 2 years.
3. Study 1: placement movements and psychosocial outcomes
3.1. Sample
Children were selected if they were referred for out-of-home care between May 1999
and April 2000. The final sample at baseline contained 121 boys and 114 girls with a
mean age of 10.8 years and an age range of 4–17 years. Excluded from the sample were
children on detention orders, children placed in supported accommodation or referred for
family preservation services. Also excluded were those referred for respite from a
continuing placement and those with placements expected to last for less than 2 weeks.
The final sample consisted of 129 children who were new to care and 105 who were
reentering care or changing placement. The status of one child could not be determined.
This group of children represents the entire cohort of children meeting the selection
criteria referred via the central referral agency for both metropolitan and rural areas of
South Australia during the study period. At Times 2, 3, 4 and 5, there were 164, 139, 126
and 109 children remaining in the foster care system. For children reentering care or
changing carer, time in care was calculated from the point of referral into this study (the
new placement).
J. Barber, P. Delfabbro / Children and Youth Services Review 27 (2005) 329–340332
3.2. Measures and procedure
To recruit the sample, referral records at the central alternative care agency were
monitored each week. Data on the children selected were recorded along with the contact
details and location of the social worker responsible for each case. Information was
collected from central agency records and government databases and verified in face-to-
face interviews with social workers. At baseline (Time 1), the measures of child
adjustment described below were also obtained from the child’s social worker. At each
follow-up point thereafter, most measures were reobtained for those children whose cases
remained open. Where a child was removed from placement other than to return home, the
reason for the move was also ascertained in social worker interviews.
Among the variables extracted from agency records were demographic characteristics,
background details on reasons for care and whether or not the child was diagnosed with a
mental health problem. Among the measures obtained from interviews with the child’s
social worker was an abbreviated form of Boyle et al.’s (1987) Child Behavior Checklist
(CBC). The CBC contains four subscales: conduct disorder, hyperactivity, somatization
disorder and emotional disorder. For the purposes of this study, only conduct disorder,
hyperactivity and emotionality subscale items were used. All three subscales were designed
by Boyle et al. (1987) to operationalize DSM criteria for the relevant disorder, and the items
selected for inclusion in this study were those found in a previous study of over 2000 junior
and senior high school students to possess the highest item total correlations within their
relevant subscales (Barber, Bolitho & Bertrand, 1998, 1999a, 1999b). Using this approach,
six of the 15 conduct disorder items could be extracted without negatively affecting alpha
for the subscale. Similarly, three of the six items comprising Boyle et al.’s (1987)
hyperactivity subscale and five of their 13 emotionality items were selected for the
remainder of the abbreviated CBC. Internal consistency for each of the abbreviated
subscales was acceptable using the baseline sample from the present study, a=0.83, 0.87 and0.82 for the conduct disorder, hyperactivity and emotional disorder subscales, respectively.
The six items comprising the abbreviated conduct disorder subscale referred to
destroying property, damaging property, being disobedient at school, lying and cheating,
stealing from outside the home and physical assault. The three hyperactivity items were
inability to concentrate for long, inability to sit still and distractibility. Emotionality items
related to feelings of unhappiness, feelings of nervousness, anxiety and worry. All items
were scored on 3-point scales: 0=never, 1=sometimes and 2=often. Because of the
different number of items within subscales, mean rather than total subscale scores are
reported in this paper.
4. Results
4.1. Placement movements
Table 1 presents a summary of placement destinations at the end of each follow-up
point. Throughout the study period, the most common placement destination was either in
stable or unstable foster care, with a sharp decline in the number of unstable placements
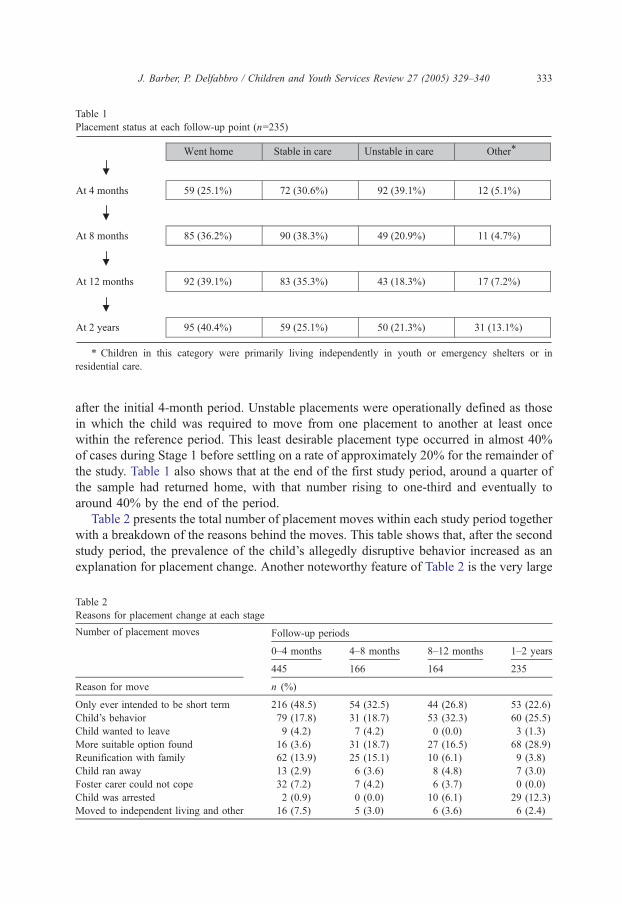
Table 1
Placement status at each follow-up point (n=235)
* Children in this category were primarily living independently in youth or emergency shelters or in
residential care.
J. Barber, P. Delfabbro / Children and Youth Services Review 27 (2005) 329–340 333
after the initial 4-month period. Unstable placements were operationally defined as those
in which the child was required to move from one placement to another at least once
within the reference period. This least desirable placement type occurred in almost 40%
of cases during Stage 1 before settling on a rate of approximately 20% for the remainder of
the study. Table 1 also shows that at the end of the first study period, around a quarter of
the sample had returned home, with that number rising to one-third and eventually to
around 40% by the end of the period.
Table 2 presents the total number of placement moves within each study period together
with a breakdown of the reasons behind the moves. This table shows that, after the second
study period, the prevalence of the child’s allegedly disruptive behavior increased as an
explanation for placement change. Another noteworthy feature of Table 2 is the very large
Table 2
Reasons for placement change at each stage
Follow-up periods
0–4 months 4–8 months 8–12 months 1–2 years
Number of placement moves
445 166 164 235
Reason for move n (%)
Only ever intended to be short term 216 (48.5) 54 (32.5) 44 (26.8) 53 (22.6)
Child’s behavior 79 (17.8) 31 (18.7) 53 (32.3) 60 (25.5)
Child wanted to leave 9 (4.2) 7 (4.2) 0 (0.0) 3 (1.3)
More suitable option found 16 (3.6) 31 (18.7) 27 (16.5) 68 (28.9)
Reunification with family 62 (13.9) 25 (15.1) 10 (6.1) 9 (3.8)
Child ran away 13 (2.9) 6 (3.6) 8 (4.8) 7 (3.0)
Foster carer could not cope 32 (7.2) 7 (4.2) 6 (3.7) 0 (0.0)
Child was arrested 2 (0.9) 0 (0.0) 10 (6.1) 29 (12.3)
Moved to independent living and other 16 (7.5) 5 (3.0) 6 (3.6) 6 (2.4)
J. Barber, P. Delfabbro / Children and Youth Services Review 27 (2005) 329–340334
number of placements that were only ever intended to be short term, particularly during
Stage 1 of the study. While there are no doubt many good reasons why it may be necessary
to make short-term placements from time to time, it is obviously preferable to avoid such
arrangements wherever possible and to seek more stable foster homes from the outset.
4.2. Psychosocial outcomes
Turning now to psychosocial adjustment, this section presents results of standardized
assessments at intake and at every follow-up point thereafter.
4.2.1. Four-month follow-up
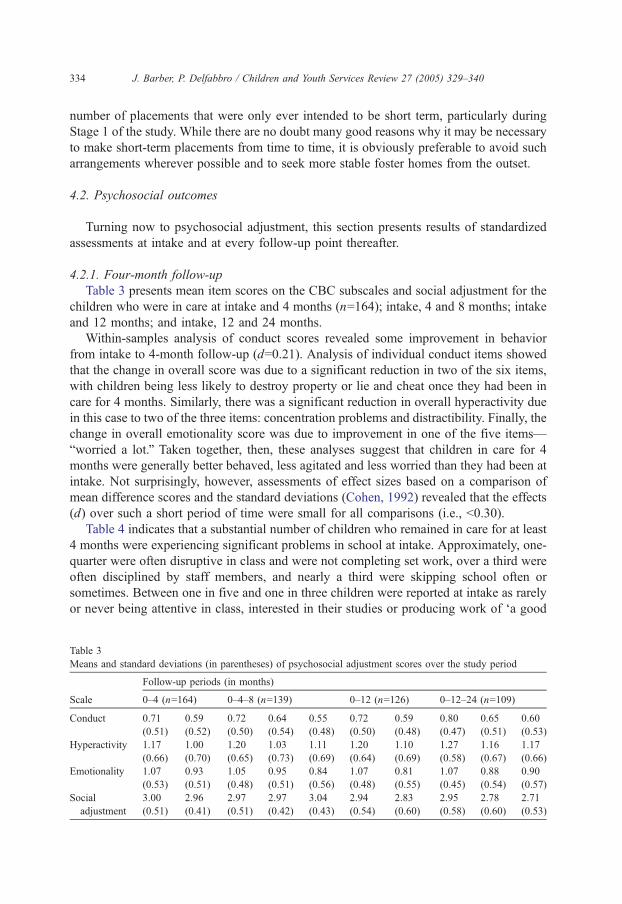
Table 3 presents mean item scores on the CBC subscales and social adjustment for the
children who were in care at intake and 4 months (n=164); intake, 4 and 8 months; intake
and 12 months; and intake, 12 and 24 months.
Within-samples analysis of conduct scores revealed some improvement in behavior
from intake to 4-month follow-up (d=0.21). Analysis of individual conduct items showed
that the change in overall score was due to a significant reduction in two of the six items,
with children being less likely to destroy property or lie and cheat once they had been in
care for 4 months. Similarly, there was a significant reduction in overall hyperactivity due
in this case to two of the three items: concentration problems and distractibility. Finally, the
change in overall emotionality score was due to improvement in one of the five items—
bworried a lot.Q Taken together, then, these analyses suggest that children in care for 4
months were generally better behaved, less agitated and less worried than they had been at
intake. Not surprisingly, however, assessments of effect sizes based on a comparison of
mean difference scores and the standard deviations (Cohen, 1992) revealed that the effects
(d) over such a short period of time were small for all comparisons (i.e., b0.30).
Table 4 indicates that a substantial number of children who remained in care for at least
4 months were experiencing significant problems in school at intake. Approximately, one-
quarter were often disruptive in class and were not completing set work, over a third were
often disciplined by staff members, and nearly a third were skipping school often or
sometimes. Between one in five and one in three children were reported at intake as rarely
or never being attentive in class, interested in their studies or producing work of da good
Table 3
Means and standard deviations (in parentheses) of psychosocial adjustment scores over the study period
Follow-up periods (in months)
Scale 0–4 (n=164) 0–4–8 (n=139) 0–12 (n=126) 0–12–24 (n=109)
Conduct 0.71
(0.51)
0.59
(0.52)
0.72
(0.50)
0.64
(0.54)
0.55
(0.48)
0.72
(0.50)
0.59
(0.48)
0.80
(0.47)
0.65
(0.51)
0.60
(0.53)
Hyperactivity 1.17
(0.66)
1.00
(0.70)
1.20
(0.65)
1.03
(0.73)
1.11
(0.69)
1.20
(0.64)
1.10
(0.69)
1.27
(0.58)
1.16
(0.67)
1.17
(0.66)
Emotionality 1.07
(0.53)
0.93
(0.51)
1.05
(0.48)
0.95
(0.51)
0.84
(0.56)
1.07
(0.48)
0.81
(0.55)
1.07
(0.45)
0.88
(0.54)
0.90
(0.57)
Social
adjustment
3.00
(0.51)
2.96
(0.41)
2.97
(0.51)
2.97
(0.42)
3.04
(0.43)
2.94
(0.54)
2.83
(0.60)
2.95
(0.58)
2.78
(0.60)
2.71
(0.53)
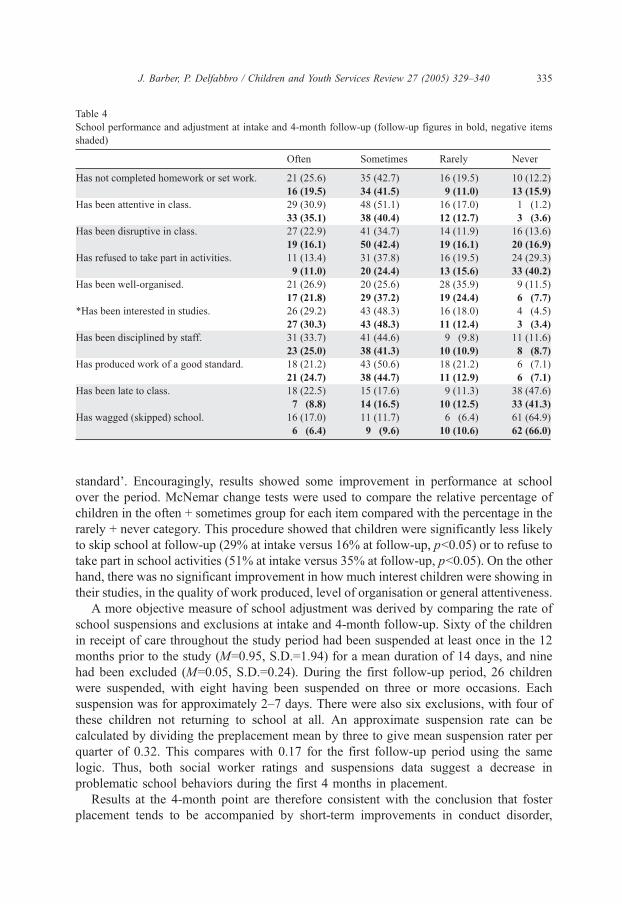
Table 4
School performance and adjustment at intake and 4-month follow-up (follow-up figures in bold, negative items
shaded)
J. Barber, P. Delfabbro / Children and Youth Services Review 27 (2005) 329–340 335
standardT. Encouragingly, results showed some improvement in performance at school
over the period. McNemar change tests were used to compare the relative percentage of
children in the often + sometimes group for each item compared with the percentage in the
rarely + never category. This procedure showed that children were significantly less likely
to skip school at follow-up (29% at intake versus 16% at follow-up, pb0.05) or to refuse to
take part in school activities (51% at intake versus 35% at follow-up, pb0.05). On the other
hand, there was no significant improvement in how much interest children were showing in
their studies, in the quality of work produced, level of organisation or general attentiveness.
A more objective measure of school adjustment was derived by comparing the rate of
school suspensions and exclusions at intake and 4-month follow-up. Sixty of the children
in receipt of care throughout the study period had been suspended at least once in the 12
months prior to the study (M=0.95, S.D.=1.94) for a mean duration of 14 days, and nine
had been excluded (M=0.05, S.D.=0.24). During the first follow-up period, 26 children
were suspended, with eight having been suspended on three or more occasions. Each
suspension was for approximately 2–7 days. There were also six exclusions, with four of
these children not returning to school at all. An approximate suspension rate can be
calculated by dividing the preplacement mean by three to give mean suspension rater per
quarter of 0.32. This compares with 0.17 for the first follow-up period using the same
logic. Thus, both social worker ratings and suspensions data suggest a decrease in
problematic school behaviors during the first 4 months in placement.
Results at the 4-month point are therefore consistent with the conclusion that foster
placement tends to be accompanied by short-term improvements in conduct disorder,
J. Barber, P. Delfabbro / Children and Youth Services Review 27 (2005) 329–340336
hyperactivity and emotional disorder. There was also a statistically significant improve-
ment in the children’s attendance and participation at school, and this improvement was
reflected in a lower rate of school exclusions after the children came into care. It must be
emphasised of course that in the absence of an adequate control condition, improvements
in behavior and well-being cannot be attributed to foster placement itself. Among the more
obvious threats to the internal validity of this conclusion in the present instance is child
maturation. Whatever the explanation, however, it is encouraging to find that psychosocial
adjustment generally improves in foster care.
4.2.2. Eight-month follow-up
Nelson, Singer and Johnson (1978) note that improvements in the child’s functioning
on entering care are likely to be short lived as most children can be expected to conform at
least temporarily to the behavioral expectations of a new setting. On the contrary, the
findings presented in Table 3 suggest that adjustment scores of the 139 children still in care
at the end of the 8-month follow-up point continued to exceed intake levels. Because of the
large amount of missing data in relation to educational items for each child the longer that
the study went on, measures of psychosocial adjustment beyond 4 months in care had to be
restricted to CBC and social adjustment scores.
A one-way repeated measures analysis of variance with time as the repeated factor was
applied to each of CBC subscale score. This procedure revealed a significant main effect
of time for conduct disorder, F(2,114)=5.09, pb0.01, which took the form of a significant
negative linear trend, F(1,115)=10.27, pb0.01. Fisher least significant difference (LSD)
tests applied to this result showed that conduct scores at 8 months were significantly
lower than at intake ( pb0.05) but not 4 months. Similarly, there was a significant
improvement in emotionality scores across time, F(2,114)=8.07, pb0.001, again
characterised by a significant negative linear trend, F(1,115)=13.37, pb0.001. A Fisher
test revealed that emotionality scores at 8 months were significantly lower than at intake
( pb0.05) but not 4 months. The same analyses revealed no significant change in
hyperactivity or social adjustment scores from intake to 8 months although the change for
hyperactivity was close to significance ( p=0.07) and in the same direction as conduct and
emotionality. Effect size analyses indicated that the effect for conduct was small (d=0.35),
and the difference between intake and 8-month scores for emotionality was moderate
(d=0.40).
4.2.3. Twelve-month follow-up
Although the prevalence of missing values at any one follow-up point was not
excessive (approximately 15% of cases), the accumulation of missing values across time
combined with list-wise deletion in repeated measures analysis meant that it was not
feasible or useful to compare all four sets of data available at 12 months. Instead, pairwise
comparisons were conducted to ascertain whether improvements in adjustment observed at
8 months were also evident when comparing 12-month scores with intake scores (Table 3).
Repeated measures analysis revealed that conduct disorder scores had indeed improved at
12 months compared with those at intake, F(1,110)=5.00, pb0.05. The same trend was
observed for emotionality, F(1,109)=17.42, pb0.001, but not for hyperactivity,
F(1,106)b1, which remained relatively stable over time. Effect size analyses showed that
J. Barber, P. Delfabbro / Children and Youth Services Review 27 (2005) 329–340 337
the improvement in conduct scores could be classified as small (d=0.27), whereas the
improvement in emotionality constituted a moderate effect (d=0.51). Overall then, the
general improvements in psychosocial well-being observed over the 0–8-month period
were maintained after 12 months in care.
4.2.4. Two-year follow-up
The 2-year series of analyses was undertaken in the same manner as those completed
for the 8-month follow-up period except that the interval between measurement points this
time was extended to 12 months (Table 3). Thus, the analyses for 12 months were
extended by comparing psychosocial adjustment scores recorded at 2 years with those
obtained at 12 months and at intake. Naturally, this comparison involved only those
children still in care after 2 years. The total number was therefore 109, although data were
not available at some follow-up points for some children thereby reducing the overall n for
the analyses that follow. A repeated measures ANOVA revealed a significant time main
effect for conduct, F(2,87)=6.211, pb0.01, and also for emotionality, F(2,86)=4.89,
pb0.01, both of which displayed significant negative linear trends: F(1,86)=11.31,
pb0.001 (for conduct disorder), F(1,86)=7.94, pb0.01 (for emotionality). Fisher LSD post
hoc tests applied to these results identified the same phenomenon in both cases. Scores at
both 12 months and 2 years were significantly lower than at intake, but scores at 2 years
were no different from those at 12 months. In other words, initial improvements in
psychosocial well-being observed soon after placement into foster care were maintained
after 2 years in care. Again, there was no significant change in hyperactivity, F(2,83)b1,
for the sample as a whole.
5. Study 2: consumer feedback
5.1. Sample
A total of 48 children from the broader foster care population in South Australia (23
girls, 25 boys) with a mean age of 13.1 (S.D.=2.40) were interviewed for the study on
satisfaction with long-term foster care. Six (12.5%) of the children were aged 10 years and
younger, and 42 (87.5%) were over 10 years of age. These children were selected based
upon availability and capacity to answer questions about their well-being. All children
were non-Aboriginal and drawn from the metropolitan area of Adelaide or country towns
within a 50-km radius of the city. The children had been in their current placement for a
mean of 5.1 (S.D.=4.65) years. The mean item score on the conduct disorder subscale did
not differ from the intake scores of the sample in Study 1 (this study: M=0.67, S.D.=0.40;
Study 1: M=0.69, S.D.=0.54).
5.2. Instruments and procedure
The children’s social workers were administered the six-item conduct disorder subscale
described in Study 1, and the children were administered a measure of child satisfaction
derived from Stuntzner-Gibson, Koren, and DeChillo (1995), as well as Barber and
J. Barber, P. Delfabbro / Children and Youth Services Review 27 (2005) 329–340338
Delfabbro’s (2000) 14-item caregiving scale. The former measure consists of 11 items
relating to the child’s satisfaction with placement, including whether the child likes living
with the foster family, is able to get help, have fun and feels supported. Each item is scored
on a 3-point scale: 1=Yes, 2=Sort of, 3=No. Barber and Delfabbro’s (2000) instrument
asks respondents to rate how often various actions have been provided to the child by his
or her self-selected primary caregiver over the last month (1=not at all, 2=once or twice,
3=a few times, 4=at least once a day). Sample items from this scale include dhad a
conversation,T dshared meals,T dhelped with homework,T dpraised me for something,Tdshowed affection.T In their study of 375 adolescents from the general Australian
population, Barber and Delfabbro found that the scale possessed an acceptable level of
internal consistency (a=0.70) for male and female respondents. From a possible range of
14 (no care) to 56 (maximum care), the mean score within the general population was
(M=33.47, S.D.=6.57) with no significant difference between male and female ratings.
Children in long-term foster care were also asked to rate their happiness with the
placement out of 10, where 1=Really unhappy and 10=Really happy.
6. Results
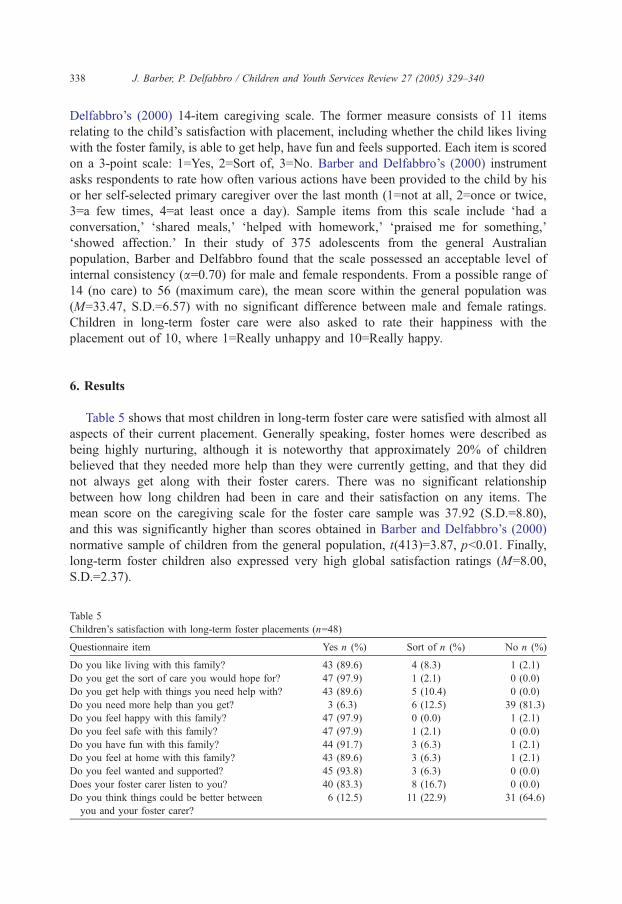
Table 5 shows that most children in long-term foster care were satisfied with almost all
aspects of their current placement. Generally speaking, foster homes were described as
being highly nurturing, although it is noteworthy that approximately 20% of children
believed that they needed more help than they were currently getting, and that they did
not always get along with their foster carers. There was no significant relationship
between how long children had been in care and their satisfaction on any items. The
mean score on the caregiving scale for the foster care sample was 37.92 (S.D.=8.80),
and this was significantly higher than scores obtained in Barber and Delfabbro’s (2000)
normative sample of children from the general population, t(413)=3.87, pb0.01. Finally,
long-term foster children also expressed very high global satisfaction ratings (M=8.00,
S.D.=2.37).
Table 5
Children’s satisfaction with long-term foster placements (n=48)
Questionnaire item Yes n (%) Sort of n (%) No n (%)
Do you like living with this family? 43 (89.6) 4 (8.3) 1 (2.1)
Do you get the sort of care you would hope for? 47 (97.9) 1 (2.1) 0 (0.0)
Do you get help with things you need help with? 43 (89.6) 5 (10.4) 0 (0.0)
Do you need more help than you get? 3 (6.3) 6 (12.5) 39 (81.3)
Do you feel happy with this family? 47 (97.9) 0 (0.0) 1 (2.1)
Do you feel safe with this family? 47 (97.9) 1 (2.1) 0 (0.0)
Do you have fun with this family? 44 (91.7) 3 (6.3) 1 (2.1)
Do you feel at home with this family? 43 (89.6) 3 (6.3) 1 (2.1)
Do you feel wanted and supported? 45 (93.8) 3 (6.3) 0 (0.0)
Does your foster carer listen to you? 40 (83.3) 8 (16.7) 0 (0.0)
Do you think things could be better between
you and your foster carer?
6 (12.5) 11 (22.9) 31 (64.6)
J. Barber, P. Delfabbro / Children and Youth Services Review 27 (2005) 329–340 339
7. Discussion
Generally speaking then, our findings suggest that long-term foster care is a positive
experience for the majority of children. Psychosocial adjustment, as measured by our
standardised instruments, appeared to improve in the short-term, and the gains made were
maintained at least until the 2-year period. It bears repeating that the absence of an
experimental control condition obscures the clinical significance of these results
somewhat. Not only is it impossible to attribute improvement to foster care itself, but it
is also impossible to determine whether the extent of improvement is greater or less than
could be expected under different conditions. However, results of both consumer feedback
studies suggest that the children in our study found foster care to be a very satisfactory
arrangement. This applied not only to newly placed children but also to those who had
been in care for some time. Both samples reported being happy in their placements and
feeling safe and well looked after by their foster parents. These findings are consistent with
work by Wilson and Conroy (1999), who also found that children in residential care were
less satisfied both with their placements and their social workers than were foster children.
Our findings are also broadly supportive of the work of Johnson, Yoken and Voss
(1995) who interviewed 59 early adolescents using a structured interview approach similar
to ours and found that the vast majority of the children in foster care reported being
satisfied with their time in care and with the services provided by their social worker. And
based upon administrative assessments of 1100 children in the US state of Illinois, Wilson
and Conroy (1999) found that approximately 85% of the children in that study reported
feeling loved and safe in their current placement and were satisfied with their quality of
life, as measured by their clothes, living environment, food and level of enjoyment. Three-
quarters were satisfied with their social workers, although almost half of the children did
report having unmet needs. It is also worth noting that the positive feedback we obtained
was unlikely to be merely the result of socially desirable responding or selective sampling.
In addition to the fact that the children seemed perfectly willing to express their concerns
in our interviews, satisfaction ratings were significantly correlated with scores on Barber
and Delfabbro’s (2000) Parent Checklist as one would expect of any valid measure of
child satisfaction. Our results also showed that children’s happiness and their satisfaction
with the quality of care provided are not necessarily related. Although it is important to
acknowledge that the absence of statistical association might be due to the limited
variability of responses (most children were happy), there are good reasons why such
relationships might not always be expected. Prolonged abuse, disillusionment and
frustration at not being able to see siblings or parents are only some of the factors
contributing to feelings of unhappiness in foster children, and these factors are likely to
persist in the best of placements.
From a policy viewpoint, the present studies caution against the common assumption
that long-term foster care is antithetical to psychosocial adjustment. After all, the concept of
foster care is fundamentally a legal one, and the child’s legal status is likely to matter far
less, particular to the young child, than is his or her day-to-day experience of life at home. In
this respect, what is likely to matter more are the attitudes and behaviors of carers, whether
those carers be foster, adoptive or biological parents. Perhaps the rush in some jurisdictions
either to return foster children to biological parents or to find alternative adoptive parents as
J. Barber, P. Delfabbro / Children and Youth Services Review 27 (2005) 329–340340
quickly as possible is more reflective of an adult’s need for administrative and legal clarity
than it is of a child’s concern for relationships and quality of care.
References
Barber, J. G., Bolitho, F., & Bertrand, L. (1998). Age and gender differences in the predictors of adolescent
drinking. Social Work Research, 22, 164–172.
Barber, J. G., Bolitho, F., & Bertrand, L. (1999a). The predictors of adolescent smoking. Journal of Social Service
Research, 26, 51–66.
Barber, J. G., Bolitho, F., & Bertrand, L. (1999b). Intrapersonal versus peer group predictors of adolescent drug
use. Children and Youth Services Review, 21, 565–579.
Barber, J. G., & Delfabbro, P. H. (2000). Predictors of adolescent adjustment: Parent–peer relationships and
parent–child conflict. Child & Adolescent Social Work Journal, 17, 275–288.
Barth, R. P., & Berry, M. (1987). Outcomes of child welfare services under permanency planning. Social Service
Review, 61, 71–90.
Boyle, M. H., Offord, D. T., Hofman, H. G., Catlin, G. P., Byles, J. A., Cadman, D. T., et al. (1987). Ontario child
health study: I. Methodology. Archives of General Psychiatry, 44, 826–831.
Bryce, M. E., & Ehlert, R. C. (1971). 144 foster children. Child Welfare, 50, 499–503.
Claburn, W. E., Magura, S., & Resnick, W. (1976). Administrative case review for foster care: A brief national
assessment. Child Welfare, 55, 395–405.
Cohen, J. (1992). A power primer. Psychological Bulletin, 112, 155–159.
Gendell, S. J. (2001). In search of permanency: A reflection on the first 3 years of the Adoption and Safe Families
Act. Family Court Review, 39, 25–42.
Gilbertson, R., & Barber, J. G. (2002). Obstacles to involving children and young people in foster care research.
Child and Family Social Work, 7, 253–258.
Gilligan, R. (2000). The importance of listening to the child in foster care. In G. Kelly, & R. Gilligan (Eds.),
Issues in foster care. London7 Jessican Kingsley Publishers.
Johnson, P. R., Yoken, C., & Voss, R. (1995). Family foster care placement: The child’s perspective. Child
Welfare, 74, 959–974.
Katz, L. (1990). Effective permanency planning for children in foster care. Social Work, 35, 220–226.
Lindsey, E.W. (2001). Foster family characteristics and emotional problems of foster children: Practice implications
for child welfare, family life education, and marriage and family therapy. Family Relations, 50, 19–22.
Maluccio, A. N., Fein, E., & Olmstead, K. A. (1986). Permanency planning for children: Concepts and methods.
New York7 Tavistock Publications.
Nelson, R. H., Singer, M. J., & Johnson, L. O. (1978). The application of a residential treatment evaluation model.
Child Care Quarterly, 7, 164–173.
Stuntzner-Gibson, D., Koren, P. E., & DeChillo, N. (1995). The youth satisfaction questionnaire: What kids think
of services. Families in Society, 76, 614–624.
U.S. Department of Health and Human Services (2000). Adoption and foster care analysis and reporting system
(ACFARS). www.acf.hhs.gov/programs/cb/dis/afcars/cwstats.htm
Wilson, L., & Conroy, J. (1999). Satisfaction of children in out-of-home care. Child Welfare, 78, 53–69.