Embed Size (px)
Citation preview
Children with disabilities in Australia
The Australian Institute of Health and Welfare is Australia’s national health and welfare statistics and information agency. The Institute’s mission is better health and wellbeing for Australians through better health and welfare statistics and information.
Children with disabilities
in Australia
Australian Institute of Health and Welfare Canberra
AIHW cat. no. DIS 38
© Australian Institute of Health and Welfare 2004 This work is copyright. Apart from any use as permitted under the Copyright Act 1968, no part may be reproduced without prior written permission from the Australian Institute of Health and Welfare. Requests and enquiries concerning reproduction and rights should be directed to the Head, Media and Publishing, Australian Institute of Health and Welfare, GPO Box 570, Canberra ACT 2601. A complete list of the Institute’s publications is available from the Publications Unit, Australian Institute of Health and Welfare, GPO Box 570, Canberra ACT 2601, or via the Institute’s web site (http://www.aihw.gov.au). ISBN 1 74024 432
Suggested citation
Australian Institute of Health and Welfare (AIHW) 2004. Children with disabilities in Australia. AIHW cat. no. DIS 38. Canberra: AIHW.
Australian Institute of Health and Welfare
Board Chair Hon. Peter Collins, AM, QC Director Dr Richard Madden Any enquiries about or comments on this publication should be directed to: Louise York or Samantha Bricknell Australian Institute of Health and Welfare GPO Box 570 Canberra ACT 2601 Phone: (02) 6244 1000 The cover artwork and illustrations used within this report were provided by students of 3/4/6D, Monash Primary School, ACT. Cover design by Fiona Edge, Design Edge Published by the Australian Institute of Health and Welfare Printed by Pirion
v
Contents List of tables ........................................................................................................................................ vii
List of figures ....................................................................................................................................... ix
List of boxes.......................................................................................................................................... ix
Acknowledgments ................................................................................................................................x
Abbreviations....................................................................................................................................... xi
Highlights ............................................................................................................................................ xii
1 Introduction........................................................................................................................................1
1.1 Purpose of the report...............................................................................................................1
1.2 Structure of the report.............................................................................................................1
1.3 Historical context .....................................................................................................................2
2 Concepts and definitions .................................................................................................................5
2.1 Children ....................................................................................................................................5
2.2 Disability ...................................................................................................................................5
2.3 Information sources...............................................................................................................10
3 The prevalence of disability in children.....................................................................................11
3.1 Introduction............................................................................................................................11
3.2 Prevalence of childhood disability in Australia ................................................................11
3.3 Prevalence of disability groups............................................................................................18
3.4 Some significant diseases and health conditions associated with disability.................25
3.5 Characteristics of children with disabilities.......................................................................29
3.6 Trends in childhood disability.............................................................................................32
4 Families and carers..........................................................................................................................43
4.1 Introduction............................................................................................................................43
4.2 Characteristics of families of children with disabilities ...................................................43
4.3 Family effects of childhood disability.................................................................................46
4.4 Characteristics of carers of children with disabilities.......................................................53
5 Services, assistance and other care arrangements .....................................................................60
5.1 Introduction............................................................................................................................60
5.2 Income support ......................................................................................................................60
5.3 Disability support services ...................................................................................................65

vi
5.4 Relevant generic services......................................................................................................71
5.5 Alternative care arrangements for children with disabilities..........................................78
6 Data sources, data gaps and future directions ...........................................................................82
6.1 Introduction............................................................................................................................82
6.2 Data sources............................................................................................................................82
6.3 Data gaps and future directions ..........................................................................................99
6.4 Future directions..................................................................................................................104
Appendix 1.........................................................................................................................................105
Appendix 2.........................................................................................................................................106
References..........................................................................................................................................108
vii
List of tables Table S1: Children aged 0–14 years with a disability by disability group and level of
restriction, 1998 ............................................................................................................. xiii Table 1.1: Children aged 0–14 years with a severe or profound core activity restriction:
accommodation type, Australia, 1981–1998..................................................................4 Table 3.1: Key terms from the ABS Survey of Disability, Ageing and Carers, 1998 ...............13 Table 3.2: Disability status by sex and age, Australia, 1998........................................................16 Table 3.3: Children aged 0–14 years with a disability: type of disabling condition by level
of restriction and sex, as a percentage of the Australian population of that sex and age, 1998 ...................................................................................................................20
Table 3.4: Children with a disability: type of disabling condition by level of restriction, as a percentage of the Australian population of the same age (0–4, 5–9, 10–14 years), 1998............................................................................................................24
Table 3.5: Selected health conditions associated with physical disability, children aged 0–14 years, number and percentage of all children aged 0–14 years, 1998 (’000).........................................................................................................................27
Table 3.6: Estimated total prevalence of selected birth defects (including terminations of pregnancy), Victoria, Western Australia and South Australia, 2001.......................28
Table 3.7: Children aged 0–14 years receiving CSTDA-funded services, by English Proficiency Group, 1 January to 30 June 2003.............................................................31
Table 3.8: Children aged 0–14 years with a disability, by sex, area of residence and specific core activity restriction status, 1998 (rate per 1,000 population)................31
Table 3.9: Children aged 0–14 years with a disability by disability status, for 1981, 1988, 1993 and 1998, age-standardised prevalence rates.....................................................35
Table 3.10: Children aged 5–14 years with a severe or profound core activity restriction living in households: activity type with which assistance needed, 1993–1998 (’000)..................................................................................................................................36
Table 3.11: Children and youth aged 5–20 years with a disability, school attendance by type of school and class, by disability status, as a percentage of the Australian population of that age, 1981–1998 ................................................................................38
Table 3.12: Children aged 0–14 years with a disability: prevalence rates (%) of all reported disabling conditions by type of condition, Australia, 1981, 1988, 1993 and 1998............................................................................................................................39
Table 3.13: Dexamphetamine prescription items requested under the Pharmaceutical Benefits Scheme (PBS), by state and territory, 1992–2003 .........................................40
Table 3.14: Recipients of disability-related carer payments and allowances, June 1994–June 2002 .......................................................................................................41
Table 3.15: Consumers of CSTDA-funded services, 0–14 years, 1999–2002...............................42 Table 4.1: Primary carers of co-resident children aged 0–14 years with a disability:
relationship to recipient of care, 1998 ..........................................................................54
viii
Table 4.2: Children aged 0–14 years with a profound or severe core activity restriction living in households, by need for assistance with daily activities and type of assistance received, 1998................................................................................................54
Table 4.3: Primary carers of co-resident children aged 0–14 years with a disability: hours of care provided per week by the primary carer, 1998...................................55
Table 4.4: Primary carers of co-resident children aged 0–14 years with a disability: assistance with core activity, 1998 ................................................................................55
Table 4.5: Primary carers of co-resident children aged 0–14 years with a disability: greatest support needs, 1998 .........................................................................................56
Table 4.6: Labour force participation of primary carers of co-resident children aged 0–14 years with a disability and mothers of children aged 0–14 years, 1998 .........56
Table 4.7: Primary carers of co-resident children aged 0–14 years with a disability: principal source of income and effect of caring role on financial situation, 1998 ...................................................................................................................................57
Table 4.8: Primary carers of co-resident children aged 0–14 years with a disability, living in households: reported changes in emotional and physical wellbeing, 1998 .......58
Table 4.9: Primary carers of co-resident children aged 0–14 years and with a disability: changes to relationships with child, family and friends ...........................................59
Table 5.1: Recipients of disability-related carer payments, June 2003 ......................................65 Table 5.2: Service users of CSTDA-funded support services, service type by age group,
1 January–30 June 2003...................................................................................................67 Table 5.3: Service users aged 0–14 years of CSTDA-funded services, disability group by
service type, 1 January–30 June 2003 ...........................................................................68 Table 5.4: Aids used by children aged 0–14 years with a disability, 1998 ................................71 Table 5.5: Students with disabilities attending government and non-government schools,
2002 (FTE).........................................................................................................................72 Table 5.6: Children aged 5–14 years with a specific restriction, by type of school/class
attended and severity of restriction, 1998....................................................................73 Table 5.7: Children aged 5–14 years with a specific restriction by type of support
provided and type of school/class, 1998.....................................................................74 Table 5.8: SAAP clients aged 0–14 years identified as having a disability, as a proportion
of all clients, 2002–03 ......................................................................................................76 Table 5.9: Children with disabilities: attendance at child care services, May 2002 .................77 Table A2.1: Level of core activity restriction by age group, percentage of population of
same age, percentage of population of same age with disability and number, Australia, 1998 (‘000) ....................................................................................................106
Table A2.2: Level of communication restriction among children aged 0–14 years with a disability, 1998...............................................................................................................106
Table A2.3: Disability status by disability group, all disabling conditions and main disabling conditions, 0–14 years and all ages, Australia, 1998...............................107
ix
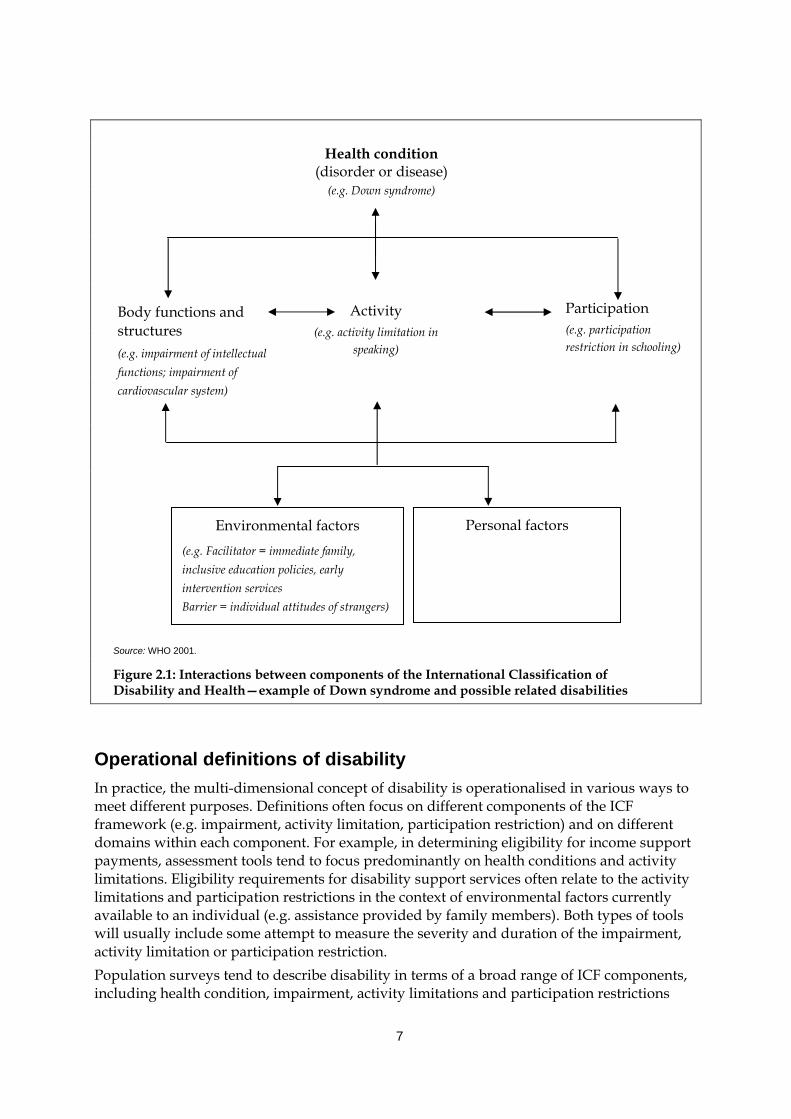
List of figures Figure 2.1: Interactions between components of the International Classification of
Functioning, Disability and Health—example of Down syndrome and possible related disabilities..............................................................................................7
Figure 3.1: Children aged 0–14 years by disability status, Australia, 1998 ................................15 Figure 3.2: Main disabling conditions and all disabling conditions, children aged
0–14 years, 1998...............................................................................................................22 Figure 3.3: Children aged 0–14 years with a disability: type of disabling condition by
level of restriction, 1998 (’000).......................................................................................25 Figure 3.4: Prevalence rate of severe and profound core activity restriction for children
aged 5–14 years, various years (percentage of children aged 5–14 years)..............36
List of boxes Box 2.1: Disability groups...............................................................................................................9 Box 3.1: Areas of limitation, restriction or impairment identified by the ABS .....................12 Box 3.2: Prevalence estimates for disability groups..................................................................19 Box 5.1: Definition of ‘profoundly disabled child’ (CP)...........................................................61 Box 5.2: Child Disability Assessment Tool (CDAT) .................................................................62 Box 5.3: Concession cards.............................................................................................................63 Box 5.4: Other allowances and assistance for carers of children with disabilities ...............64 Box 5.5: Service types offered under the CSTDA......................................................................66 Box 5.6: Government-funded housing assistance under the Commonwealth State
Housing Agreement (CSHA) ........................................................................................75 Box 6.1: Examples of the types of questions asked about children aged 0–14 years in
the 1998 ABS Survey of Disability, Ageing and Carers.............................................84
Box 6.2: Australian Bureau of Statistics 2006 Population Census: proposed ‘disability, need for assistance’ questions .....................................................................................101
Box 6.3: Children's Services NMDS Pilot Test 2004: child disability question ...................102
Box 6.4 Western Australian examples of data linkage ..........................................................103
x
Acknowledgments The authors of this report were Louise York and Samantha Bricknell. The report builds on previous AIHW reports on the definition and prevalence of disability in Australia, in particular the work of Ros Madden and Xingyan Wen. Special thanks to Ros Madden, Head of Functioning and Disability Unit, who was involved in scoping this study and who provided intellectual and practical guidance and input throughout. Thanks to Diane Gibson, Head of Welfare Division, who was largely responsible for getting this project on the AIHW work program and who provided comments throughout. Thanks also to the Children, Youth and Families Unit, which was involved in the early work on the project, and Monique Nesa who reviewed the section on siblings. We also thank the remaining members of the Functioning and Disability Unit and other units within the AIHW, who provided input on specific aspects of the report and who commented on various drafts. The expertise and input of the report’s external referees are also gratefully acknowledged (see Appendix 1 for a list of referees).
xi
Abbreviations ABI Acquired brain injury ABS Australian Bureau of Statistics ADHD Attention Deficit Hyperactivity Disorder AIHW Australian Institute of Health and Welfare CDAT Child Disability Assessment Tool CRA Commonwealth Rent Assistance CS NMDS Children’s Services National Minimum Data Set CSDA Commonwealth State Disability Agreement CSHA Commonwealth State Housing Agreement CSTDA Commonwealth State/Territory Disability Agreement DoHA Australian Government Department of Health and Ageing DSIAPC Disability Services Initiative in Adoption and Permanent Care DVA Department of Veterans’ Affairs EP English Proficiency FaCS Australian Government Department of Family and Community Services FTE full-time equivalent GCS General Customer Survey HACC Home and Community Care (program) HILDA Household Income and Labour Dynamics in Australia (survey) ICF International Classification of Functioning, Disability and Health IRSED Index of Relative Socio-Economic Disadvantage JJ NMDS Juvenile Justice National Minimum Data Set LDS Longitudinal Administrative Data Set LSAC Longitudinal Survey of Australian Children LSIC Longitudinal Survey of Indigenous Children MCHRDB Maternal and Child Health Research Database (Western Australia) MDS Minimum Data Set MMR measles, mumps and rubella (vaccine) NISU National Injury Surveillance Unit NMDS National Minimum Data Set PBS Pharmaceutical Benefits Scheme RSE relative standard error SAAP Supported Accommodation Assistance Program SDAC Survey of Disability, Ageing and Carers (conducted by the Australian
Bureau of Statistics) WHO World Health Organization
xii
Highlights
Chapter 1—Introduction • What is known about children with disabilities in Australia, in terms of their
characteristics, and the needs and circumstances of them and their families? What is known about the services, benefits and assistance provided to them? This report uses a range of information sources to explore these questions and presents for the first time, an overview of this important group in Australia.
Chapter 2—Concepts and definitions • This report focuses on children aged 0–14 years of age. • Disability is conceptualised as a multi-dimensional concept, relating to a child’s health
conditions, their body functions and structures, the activities they do, the life areas in which they participate and the environmental factors that affect all of these experiences. This report therefore highlights information that relates to all of these facets of disability, including, for example, information about health conditions such as Attention Deficit Hyperactivity Disorder, participation of children in mainstream education, and the presence of environmental factors such as family support and formal services.
• Wherever possible, analysis is broken down to the level of five disability groups—intellectual/learning disability, psychiatric disability, sensory/speech disability, physical/diverse disability and acquired brain injury.
Chapter 3—The prevalence of disability in children • This report draws on two main groups of children: children with a disability, and children
with a severe or profound core activity restriction (‘severe disability’). The latter group of children are those who require assistance with one or more activities of daily living (i.e. self-care, mobility or communication). This could mean, for example, they need help to change their clothes or shower, to get out of bed or move around their bedroom, or talk to a family member.
• In 1998, about 296,400 children, or 7.6% of children aged 0–14 years, were estimated to have a disability. Of these, about 144,300, or 3.7% of children aged 0–14 years, had a severe or profound core activity restriction (‘severe disability’).
• Almost twice as many boys as girls had a disability (192,800 or 9.6% of boys compared to 103,600 or 5.4% of girls). This sex difference also applies when we consider the pattern for children with a severe disability (97,400 or 4.9% of boys compared to 47,000 or 2.5% of girls).
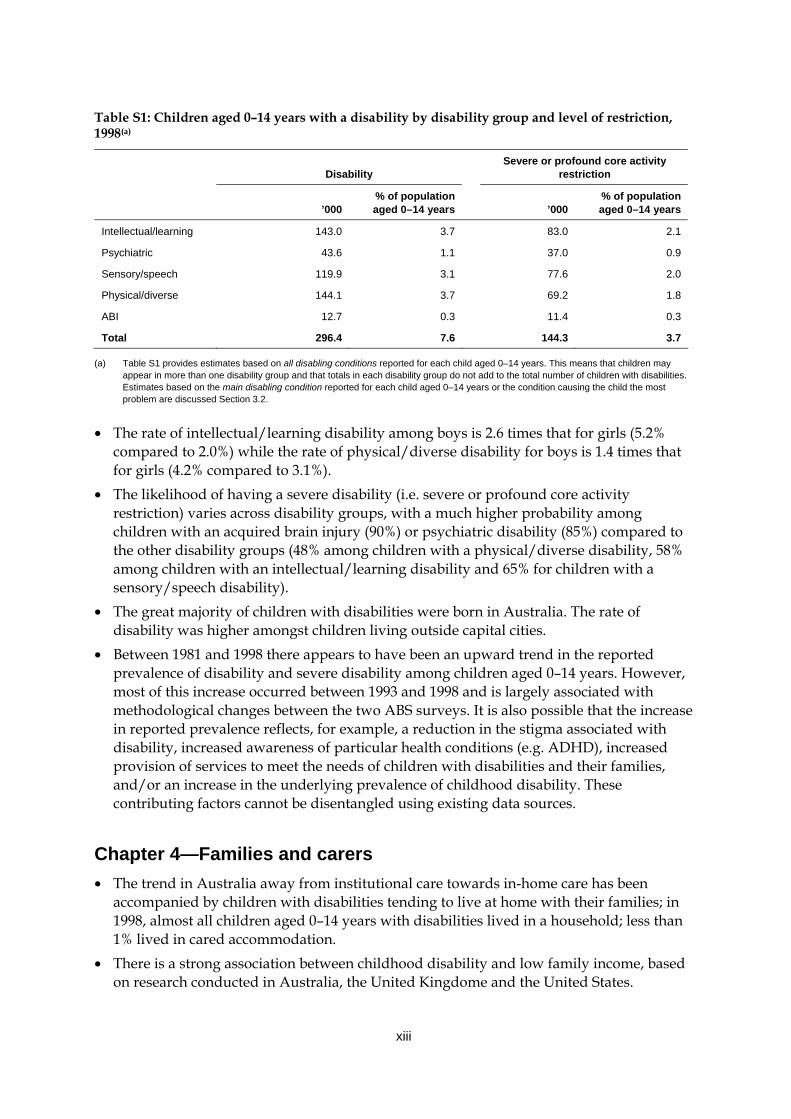
• Of the 296,400 children with a disability, 144,100 children (or 3.7% of the population aged 0–14 years) were estimated to have a physical/diverse disability, either as a main disabling condition or an associated disabling condition. The next most common disability group among children was intellectual/learning disability (143,000 children or 3.7% of the population of this age), followed by sensory/speech disability (119,900 or 3.1%), psychiatric disability (43,600 or 1.1%) and disability related to acquired brain injury (12,700 or 0.3%) (Table S1).
xiii
Table S1: Children aged 0–14 years with a disability by disability group and level of restriction, 1998(a)
Disability
Severe or profound core activity restriction
’000
% of population aged 0–14 years
’000
% of population aged 0–14 years
Intellectual/learning 143.0 3.7 83.0 2.1
Psychiatric 43.6 1.1 37.0 0.9
Sensory/speech 119.9 3.1 77.6 2.0
Physical/diverse 144.1 3.7 69.2 1.8
ABI 12.7 0.3 11.4 0.3
Total 296.4 7.6 144.3 3.7
(a) Table S1 provides estimates based on all disabling conditions reported for each child aged 0–14 years. This means that children may appear in more than one disability group and that totals in each disability group do not add to the total number of children with disabilities. Estimates based on the main disabling condition reported for each child aged 0–14 years or the condition causing the child the most problem are discussed Section 3.2.
• The rate of intellectual/learning disability among boys is 2.6 times that for girls (5.2% compared to 2.0%) while the rate of physical/diverse disability for boys is 1.4 times that for girls (4.2% compared to 3.1%).
• The likelihood of having a severe disability (i.e. severe or profound core activity restriction) varies across disability groups, with a much higher probability among children with an acquired brain injury (90%) or psychiatric disability (85%) compared to the other disability groups (48% among children with a physical/diverse disability, 58% among children with an intellectual/learning disability and 65% for children with a sensory/speech disability).
• The great majority of children with disabilities were born in Australia. The rate of disability was higher amongst children living outside capital cities.
• Between 1981 and 1998 there appears to have been an upward trend in the reported prevalence of disability and severe disability among children aged 0–14 years. However, most of this increase occurred between 1993 and 1998 and is largely associated with methodological changes between the two ABS surveys. It is also possible that the increase in reported prevalence reflects, for example, a reduction in the stigma associated with disability, increased awareness of particular health conditions (e.g. ADHD), increased provision of services to meet the needs of children with disabilities and their families, and/or an increase in the underlying prevalence of childhood disability. These contributing factors cannot be disentangled using existing data sources.
Chapter 4—Families and carers • The trend in Australia away from institutional care towards in-home care has been
accompanied by children with disabilities tending to live at home with their families; in 1998, almost all children aged 0–14 years with disabilities lived in a household; less than 1% lived in cared accommodation.
• There is a strong association between childhood disability and low family income, based on research conducted in Australia, the United Kingdome and the United States.
xiv
• The financial costs associated with having a child with a disability can be especially marked, and more keenly felt, by families already living on low incomes. In some families, having a child with a disability may be linked to cycles or more sustained periods of dependence on government benefits, and in some cases, poverty.
• A more equivocal picture of the family effects of childhood disability is drawn from the current literature. Families of children with disabilities undergo a range of experiences and emotions associated with caregiving, none of which are necessarily unique to these families. However, there is evidence that some family members, especially mothers, experience more stress and a change to their wellbeing than families who do not have children with disabilities. Time and emotional commitments associated with raising a child with high support needs are usual sources of this stress.
• Mothers and fathers hence benefit significantly, both financially and emotionally, from receiving additional informal and formal support. While access to formal support services is crucial to parents, mothers have also described emotional support as possibly the most important influential coping factor.
• In 1998, primary carers of Australian children with a disability were mostly mothers (85% of all primary carers), followed by fathers (10%).
• Over half of these carers spent more than 40 hours a week engaged directly in the care of a resident child with a disability.
• Around 53% of primary carers felt they needed more support, particularly in relation to financial assistance and respite care.
Chapter 5—Services, assistance and other care arrangements • Formal services available to children with disabilities and their families in Australia
include a range of income support benefits, respite care, therapy and early child intervention, aids and equipment services, housing and crisis accommodation services, and child protection.
• Most carers of children with disabilities receive the Carer Allowance as their main ‘disability-related’ support payment, with a smaller proportion receiving the Carer Payment.
• CSTDA-funded support services are a primary source of formal support for children with disabilities in Australia. Nineteen per cent, or 29,563, of all service users receiving CSTDA-funded support services between 1 January and 30 June 2003 were children with disabilities aged 0–14 years. Community support, including services such as therapy support, early childhood intervention and behaviour/specialist intervention, was the most common support service received, followed by respite services.
• Additional forms of formal support can be sourced from programs such as HACC (Home and Community Care). In 2002–03, 2.1%, or 12,679, of all clients receiving HACC services were aged under 15 years.
• Children with disabilities tend to visit health care professionals more often than other children but actual access to health care services may be more limited.
• Mainstreaming of children with disabilities within the education system has increased substantially in Australia. In 2002, 81% of children with disabilities attending government schools and 91% of children with disabilities attending non-government schools attended
xv
mainstream rather than special schools. Support for children, however, was more commonly provided in 1998 in special schools (82% of all children with a disability attending received support services) or special classes (82% of all children with a disability) compared with mainstream classes (17% of all children with a disability).
• Participation of children with disabilities in mainstream child care facilities is encouraged, with child-care services entitled to receive additional funding and services to care for children with disabilities. However, while children with disabilities made up 1–4% of children in each of the formal child care service settings, 14% of children cared for in an in-home setting had a disability.
• Around 40% of children with disabilities aged 0–14 years in 1998 used aids and equipment; almost half of these children relied on medical aids.
• Processes are in place to assist children with disabilities and their families to find accommodation within public and community housing, and to provide alternative care arrangements for children at risk of harm or of entering the juvenile justice system. There is also a range of valuable data collections relating to adoptions, child protection and juvenile justice, however little or no data are currently collected to provide statistical information on the numbers and characteristics of children with disabilities accessing these services.
Chapter 6—Data sources, data gaps and future directions • This chapter provides a brief overview of the main data collections used in preparing this
report, before describing in less detail a number of collections that were considered for analysis but not used, along with the reasons these sources were not used. This chapter therefore provides a valuable resource for others interested in statistics about children in general, or in statistics about children with disabilities.
• Australia is in the relatively privileged position of having a wealth of existing data sources that capture, in various formats and levels of detail, parts of the picture about the experiences of children with disabilities and their families. With relatively minor additions and improvements to these existing data sources, and more collaborative use or linkage of existing data sources, it is possible that substantial gains could be made in our ability to identify and describe this group and therefore assist them and their families.

1
1 Introduction
1.1 Purpose of the report Children represent our future. Promoting their development and wellbeing is widely accepted as an essential investment, as well as a moral obligation because of their vulnerability. This report sets out to piece together what we know about one group of children, those with disabilities, who are potentially a particularly vulnerable group, both in childhood and later in their adult lives. Throughout the report we seek to answer a number of important questions, including: How many children in Australia live with disability? What do we know about them, their disability and the experiences of their families? What do we know about the environment these children and their families live in and the services they access? Do we know anything about trends over time in the number of children with disability? The purpose of this report is to detail what is currently known about children with disability in Australia. The report consists of two broad parts—the first part presents a basic profile of children with disabilities, and their families, in Australia, examining their needs and circumstances; the second part constructs a picture of the services, benefits and assistance provided to children with disabilities. For a number of reasons, it is a complex task to describe this group of children and the special needs they and their families face. Disability exists on a continuum which means that ‘children with disabilities’ are not a single, easily identifiable group. Whether or not a child is described as having a disability may vary across different contexts. Thus while most children with activity limitations associated with Down syndrome will be considered to have a disability in all circumstances, children who experience limitations associated with health conditions such as Attention Deficit Hyperactivity Disorder (ADHD) or asthma may not. The multidimensional nature of disability is discussed further in Chapter 2. In addition to conceptual and definitional problems, research, practice and policy relating to children have often been conducted in ‘silos’ (e.g. Prior 2002), meaning that information about children with disability is often difficult to find and synthesise into a meaningful picture. This report presents a broad range of information about this important group of children and their families, drawing on a number of data and information sources. We take a multidimensional view of childhood disability, examining both health and disability of children, characteristics of and effects on families in which a child with disability lives, and government and non-government service provision across a range of portfolios.
1.2 Structure of the report The structure of the report is as follows: • This introductory chapter provides context to the report, including a brief discussion of
the historical policies and practices relating to and attitudes towards children with disabilities.
2
• Chapter 2 outlines key definitions and a conceptual framework for the report. • Chapter 3 provides information about the prevalence of disability among Australian
children. • Chapter 4 describes the characteristics of families in which a child with disability lives,
including some discussion of what is known about the effects of childhood disability on these families, and particularly the primary carer. This chapter also includes a discussion about the costs of disability and the related issue of family poverty and its relationship to childhood disability.
• Chapter 5 describes a range of formal supports such as specialist disability support services, health, education and housing, and benefits such as income support, which affect the ability of children with disabilities and their families to thrive and develop to their full potential.
• Chapter 6 focuses on data issues, including details of the data sources used throughout the report, data gaps identified during the process of developing the report, and future developments that may lead to improved data availability in the future.
This report thus begins by focusing on the child and moves attention out to the family and then to formal services and benefits which assist the child and their family. The International Classification of Functioning, Disability and Health (ICF) is used as a framework to organise the information included throughout this report (for more information on the ICF, see Chapter 2 and the following web sites <www.aihw.gov.au/disability/icf> and <www3.who.int/icf/icftemplate.cfm>).
1.3 Historical context In the first half of the 20th century, Australian children with disabilities were largely an invisible population. Living conditions were variable and children had few opportunities to mix with other, non-disabled children. This period, however, saw some improvements, specifically in the education of children with disabilities. A government endorsement of education as an entitlement for all led the way for the establishment of ‘special’ schools. These schools catered for children with sensory, intellectual or physical disabilities and were run by private charities, with backing from state governments. The 1960s and 1970s proved to be a turning point for reshaping public opinion on disability and people with disabilities (see AIHW 1993 for a more extensive review of the history of disability policy and services in Australia). Central to this transformation was the human rights movement and the theory of normalisation, which promoted independence and participation for people with disabilities. Increasing nationwide and worldwide adoption of these principles saw Australia become a signatory to the 1971 United Nations Declaration on the Rights of Mentally Disabled Persons and the 1975 United Nations Declaration on the Rights of Disabled Persons, both of which declared the right of people with disabilities to be given access to opportunities available to all other citizens. For children with disabilities in Australia, this call for inclusiveness mostly manifested itself in new directions in schooling. Scholars had argued that children educated in special schools developed ‘institutionalised’ and ‘dependent’ behaviours and recommended greater integration of children with disabilities into mainstream schools. State governments responded by establishing special educational units within mainstream school settings.
3
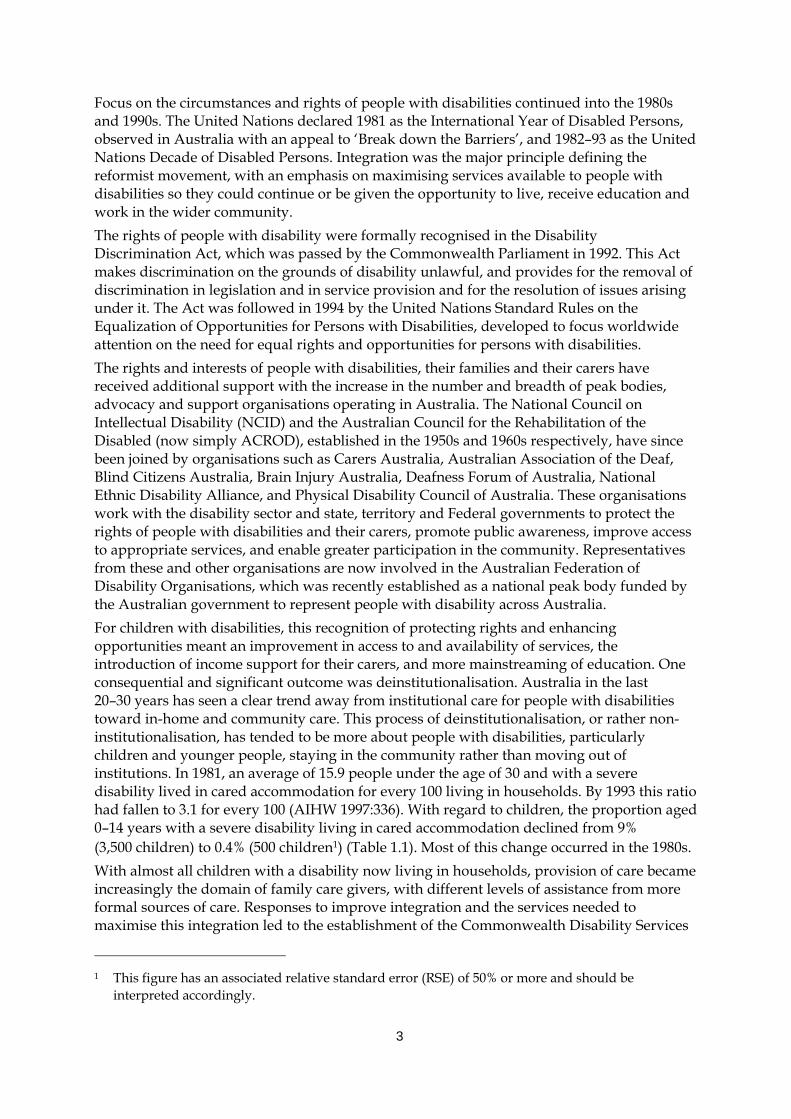
Focus on the circumstances and rights of people with disabilities continued into the 1980s and 1990s. The United Nations declared 1981 as the International Year of Disabled Persons, observed in Australia with an appeal to ‘Break down the Barriers’, and 1982–93 as the United Nations Decade of Disabled Persons. Integration was the major principle defining the reformist movement, with an emphasis on maximising services available to people with disabilities so they could continue or be given the opportunity to live, receive education and work in the wider community. The rights of people with disability were formally recognised in the Disability Discrimination Act, which was passed by the Commonwealth Parliament in 1992. This Act makes discrimination on the grounds of disability unlawful, and provides for the removal of discrimination in legislation and in service provision and for the resolution of issues arising under it. The Act was followed in 1994 by the United Nations Standard Rules on the Equalization of Opportunities for Persons with Disabilities, developed to focus worldwide attention on the need for equal rights and opportunities for persons with disabilities. The rights and interests of people with disabilities, their families and their carers have received additional support with the increase in the number and breadth of peak bodies, advocacy and support organisations operating in Australia. The National Council on Intellectual Disability (NCID) and the Australian Council for the Rehabilitation of the Disabled (now simply ACROD), established in the 1950s and 1960s respectively, have since been joined by organisations such as Carers Australia, Australian Association of the Deaf, Blind Citizens Australia, Brain Injury Australia, Deafness Forum of Australia, National Ethnic Disability Alliance, and Physical Disability Council of Australia. These organisations work with the disability sector and state, territory and Federal governments to protect the rights of people with disabilities and their carers, promote public awareness, improve access to appropriate services, and enable greater participation in the community. Representatives from these and other organisations are now involved in the Australian Federation of Disability Organisations, which was recently established as a national peak body funded by the Australian government to represent people with disability across Australia. For children with disabilities, this recognition of protecting rights and enhancing opportunities meant an improvement in access to and availability of services, the introduction of income support for their carers, and more mainstreaming of education. One consequential and significant outcome was deinstitutionalisation. Australia in the last 20–30 years has seen a clear trend away from institutional care for people with disabilities toward in-home and community care. This process of deinstitutionalisation, or rather non-institutionalisation, has tended to be more about people with disabilities, particularly children and younger people, staying in the community rather than moving out of institutions. In 1981, an average of 15.9 people under the age of 30 and with a severe disability lived in cared accommodation for every 100 living in households. By 1993 this ratio had fallen to 3.1 for every 100 (AIHW 1997:336). With regard to children, the proportion aged 0–14 years with a severe disability living in cared accommodation declined from 9% (3,500 children) to 0.4% (500 children1) (Table 1.1). Most of this change occurred in the 1980s. With almost all children with a disability now living in households, provision of care became increasingly the domain of family care givers, with different levels of assistance from more formal sources of care. Responses to improve integration and the services needed to maximise this integration led to the establishment of the Commonwealth Disability Services
1 This figure has an associated relative standard error (RSE) of 50% or more and should be
interpreted accordingly.
4
Act (DSA) in 1986 and the Commonwealth/State Disability Agreement (CSDA) in 1991, the latter outlining government responsibility in the provision of disability services. The CSDA, now CSTDA, was re-signed in 1998 and 2003, giving the Commonwealth (Australian Government) responsibility for the planning, policy development and management of employment services, and the states and territories responsibility for all other specialist services, including accommodation support, community support and respite. In the period 1 January to 30 June 2003, around 29,600 children with a disability aged 0–14 years received CSTDA services (see Table 5.2 in Chapter 5 for the type of CSTDA services received).
Table 1.1: Children aged 0–14 years with a severe or profound core activity restriction: accommodation type, Australia, 1981–1998(a)
1981 1988 1993 1998
’000 % ’000 % ’000 % ’000 %
Children 0–14 living in households 38.0 91.5 54.3 98.2 69.6 98.4 117.8 99.6
Children 0–14 living in cared accommodation
*3.5 8.5 **1.0 1.8 **1.1 1.6 **0.5 0.4
Total (’000) 41.5 100.0 55.3 100.0 70.7 100.0 118.2 100.0
(a) Substantial changes made to the ABS survey methodology appear to have resulted in greater identification of the number of people with disability, especially severe or profound core activity restriction, compared with the 1993 survey (ABS: Davis et al. 2001; AIHW 2001a). The 2003 SDAC, which largely retained the 1998 questions, found that there was no significant increase in the rate of disability among children aged 0–14 years between 1998 and 2003, or in the rate of profound or severe core activity restriction among children of this age (ABS 2004).
Note: Estimates marked with a * have an associated relative standard error (RSE) of between 25% and 50%. Estimates marked with a ** have an associated relative standard error (RSE) of 50% or more. These estimates should be interpreted accordingly.
Source: AIHW 1999: Table 4.8.
Additional services that became available to children with disabilities and their families in this period included other community-based forms of care, such as Home and Community Care (HACC) services, respite care, and government and non-government funded aids and equipment schemes, providing aids based on eligibility criteria. Income support also became tailored, to some extent, to assist carers of children with disabilities. The Carer Allowance, including Carer Allowance (Child), was established in 1999, and a 1997–98 Federal Budget extension of the Carer Payment allowed caregivers of children under 16 years of age with a profound disability to be eligible for the Carer Payment benefit. Children’s education in the 1980s and 1990s became progressively more mainstreamed than it was in the decades before, with fewer children being educated in special schools. Between 1976 and 1993, the number of children with a disability attending special schools dropped from 25,200 to under 18,000, although the trend between 1993 and 1998 is less clear, partly due to the absence of consistent nationwide data (Dempsey et al. 2002). This decline was associated with further implementation of special classes within mainstream educational settings and inclusion of children with disabilities into mainstream classes. In 2002, over 80% of children with a disability were being educated in a mainstream school (see Table 5.5).
5
2 Concepts and definitions
2.1 Children This report focuses on children aged 0–14 years. This age group is used in much of the relevant research and corresponds to one of the standard definitions used by the Australian Bureau of Statistics (ABS). The ABS definition relates to the concept of dependency, assuming that all children under the age of 15 years are dependent on their parents or caregivers for income, housing, food and other necessities. At 15 years of age children are legally able to gain employment and, in most Australian states, leave school if they wish (ABS: Webster 1998). The concept of dependency is more complicated in relation to many children with disability, who may remain in some way dependent on their parents or caregivers for many more years or throughout their life. However, all families have expectations about the life areas in which their children and they themselves should be participating at certain stages of their family life cycle. The selected age range allows some analysis of the important transitions to formal child care and school but excludes discussion of the transition from school to employment or other day time activities and the transition to intimate adult relationships including marriage. For many other purposes, children are regarded as all people under the age of 18 years. This is the age of majority in Australia, when young people are given civic responsibilities and are able to vote, marry without parental consent and purchase alcohol. This is also the definition adopted by the United Nations in the 1990 Convention on the Rights of the Child. In this report, adolescents or youth aged 15–18 years are generally excluded from analysis.
2.2 Disability
The conceptualisation and classification of disability The International Classification of Functioning, Disability and Health (ICF) is used in this report as a framework for conceptualising disability. This report uses the ICF framework to assist in organising an array of data in which the concept of ‘disability’ is often operationalised in different ways. The ICF describes disability as a multi-dimensional concept, relating to the body functions and structures of people, the activities they do, the life areas in which they participate, and the factors in their environment that affect these experiences (WHO 2001). The conceptual framework of the ICF has three components: body functions and structures, activities and participation, and environmental factors (see Figure 2.1). These components are defined ‘in the context of health’. That is, the framework excludes situations that are not health related, such as participation restrictions due solely to socioeconomic or religious factors (WHO 2001). The ICF provides a classification structure within each component, which is useful in terms of organising information on the various domains of the disability experience. For example:
6
• the body functions and structures components each consist of eight domains, including mental functions, voice and speech functions, structures of the nervous system and structures related to the digestive, metabolic and endocrine systems;
• the activities and participation component consists of nine domains, including self-care, mobility, communication, learning and applying knowledge and interpersonal interactions and relationships; and
• the environmental factors component consists of five domains including products and technology, natural environment and human-made changes to the environment, and services, systems and policies (AIHW 2003a; WHO 2001).
The first two components—body functions and structures, activities and participation—can be used in two ways. They can be used to describe neutral or positive aspects of health states, summarised with the umbrella term ‘functioning’. They can also be used to describe problems (impairments, activity limitations or participation restrictions), which are summarised under the umbrella term ‘disability’. Impairments are ‘problems in body function or structure such as a significant deviation or loss’ of hearing or vision. Activity limitations are ‘difficulties an individual may have in executing activities’ such as learning to read. Participation restrictions are ‘problems an individual may experience in involvement in life situations’ such as attending school or participating in recreation (WHO 2001). Personal factors, like environmental factors, are contextual factors but they are not classified in, and beyond the scope, of the ICF. Personal factors relate to the individual, for example, their age, gender and socioeconomic status. The italicised text in Figure 2.1 provides examples of the type of information that might be collected under each of the ICF components. The example case refers to the type of information that might be used to describe the experience of a child with Down syndrome. The International Statistical Classification of Diseases and Related Health Problems 10th Revision (ICD-10) (WHO 1992) is the primary international classification used to define and classify diseases and disorders. The ICD-10 has been used widely as a framework and coding system to classify health conditions, including those related to disability (AIHW 2003b). It is important to note that the ICF framework does not describe a ‘process’ of disability in terms of causal links between health condition, impairment, activity limitation and participation restriction. Rather, it is considered that information about diagnosis or health condition together with information about functioning provide a more meaningful picture of the health status of a population (WHO 2001). In this report, information about health condition, functioning and disability (including impairment, activity limitation and participation restriction as well as associated need for assistance), environmental and personal factors, will be drawn together in an attempt to describe the experience of children with disabilities and their families, living in Australia today.
7
Source: WHO 2001.
Figure 2.1: Interactions between components of the International Classification of Disability and Health—example of Down syndrome and possible related disabilities
Operational definitions of disability In practice, the multi-dimensional concept of disability is operationalised in various ways to meet different purposes. Definitions often focus on different components of the ICF framework (e.g. impairment, activity limitation, participation restriction) and on different domains within each component. For example, in determining eligibility for income support payments, assessment tools tend to focus predominantly on health conditions and activity limitations. Eligibility requirements for disability support services often relate to the activity limitations and participation restrictions in the context of environmental factors currently available to an individual (e.g. assistance provided by family members). Both types of tools will usually include some attempt to measure the severity and duration of the impairment, activity limitation or participation restriction. Population surveys tend to describe disability in terms of a broad range of ICF components, including health condition, impairment, activity limitations and participation restrictions
Health condition (disorder or disease)
(e.g. Down syndrome)
Body functions and structures (e.g. impairment of intellectual functions; impairment of cardiovascular system)
Activity (e.g. activity limitation in
speaking)
Participation (e.g. participation restriction in schooling)
Environmental factors (e.g. Facilitator = immediate family, inclusive education policies, early intervention services Barrier = individual attitudes of strangers)
Personal factors
8
and environmental factors. Population surveys may vary in terms of question wording and the way data are collected (e.g. telephone interview, self-completed questionnaire). They may also vary in terms of their screening devices—the set of questions, based on the operational definition of disability, that identify people who may have a disability and ‘screen’ them into the detailed ‘disability’ section of a survey. Such screening questions, as with the operationalisation of ‘disability’ more generally, can substantially affect estimates of disability prevalence (AIHW 2003b). Care is therefore often needed when interpreting data about disability. As noted in the introduction to this report, children with disability are not a uniquely identifiable group. This is largely because different operational definitions of disability mean that some children are considered to have a disability in one context or data collection and not in another. The ICF provides a framework which enables us to understand and ‘locate’ the different groups of children included in the various service programs and data collections. To illustrate: • The ABS population survey covers the ICF model fairly well, including questions
regarding health conditions, impairments and activity limitations, together with information on carers and more limited information on participation restrictions and environmental factors. All of these ICF components feed into AIHW estimates of prevalence of disability (see Chapter 3).
• Disability support services provide personal assistance to people with disabilities, including respite to them and their carers; the information in related data collections focuses on activity limitations, in particular assistance needed.
• Income support services, in relation to children with disabilities, are effectively providing income replacement to parents who must take additional time to look after their children. Again, the focus is on the support of the child’s needs in their daily lives (i.e. activity limitation and participation restriction).
• Health-focused analyses tend to focus on health conditions often associated with disability, such as cerebral palsy and Down syndrome. Frequently the concern is with prevention and the analytical focus is therefore on ‘causal pathways’ rather than on related disability in the form of impairments, activity limitations and participation restrictions.
Disability groups In Australia, disability groups, such as ‘intellectual disability’ and ‘physical disability’, provide a broad categorisation of disabilities based not only on underlying health conditions and impairments, but also on activity limitations and participation restrictions. These groupings are generally recognised in the disability field and in legislative and administrative contexts in Australia (AIHW 2003b). Disability groups are not an attempt to classify people but rather to categorise the experience of people across various domains of functioning and disability (AIHW 2003b).
9
Box 2.1: Disability groups Intellectual/learning disability is associated with impairment of intellectual functions with limitations in a range of daily activities and with restriction in participation in various life areas. Supports may be needed throughout life, the level of support tending to be consistent over a period of time but may change in association with changes in life circumstances. Psychiatric disability is associated with clinically recognisable symptoms and behaviour patterns frequently associated with distress that may impair personal functioning in normal social activity. Impairments of global or specific mental functions may be experienced, with associated activity limitations and participation restrictions in various areas. Supports needed may vary in range, and may be required with intermittent intensity during the course of the condition. Changes in level of support tend to be related to changes in the extent of impairment, or in the environment. Sensory/speech disability is associated with impairment of the eye, ear and related structures and of speech, structures and functions. Extent of impairment and activity limitation may remain consistent for long periods. Activity limitations may occur in various areas, for instance communication and mobility. Availability of a specific range of environmental factors will affect the level of disability experienced by people in this grouping. Once in place, the level of support tends to be relatively consistent. Physical/diverse disability is associated with the presence of an impairment, which may have diverse effects within and among individuals, including effects on physical activities such as mobility. The range and extent of activity limitation and participation restriction will vary with the extent of impairment as well as with environmental factors. Environmental adjustments and support needs are related to areas of activity limitation and participation restriction, and may be required for long periods. Levels of support may vary with both life changes and extent of impairment. Acquired brain injury is the term used to describe multiple disabilities arising from damage to the brain acquired after birth. It can occur as a result of accidents, stroke, brain tumours, infection, poisoning, lack of oxygen, degenerative neurological disease, etc. Effects include deterioration in cognitive, physical, emotional or independent functioning. For national and international data comparison purposes, acquired brain injury is often included as a subcategory in the broad category of physical/diverse disability.
Source: AIHW 2003b.
Wherever possible, this report provides information in terms of the disability groups described in Box 2.1. 2 Further information is also provided throughout the report about particular health conditions that are usually or always associated with long-term disability (e.g. Down syndrome, generally associated with intellectual disability, and cystic fibrosis, generally associated with physical disability). It is important to note that many children experience health conditions that are related to more than one disability group. Furthermore, there is often an overlap between disability groups, such as a reported association between intellectual and psychiatric disability (for children, see Borthwick-Duffy 1994; Tonge et al. 1996). Throughout this report, unless otherwise stated, the experience of these children is recorded under all of the disability groups they experience. It should also be noted that the prevalence estimates presented in this report for each of the disability groups described above will not necessarily relate to estimates derived for other purposes and using other methodologies. For example, the prevalence of intellectual/learning disability, as estimated using population data, is based on a range of survey questions which relate to whether the person has difficulty in learning or
2 These groups are further described in the National Community Services Data Dictionary Version 3
(AIHW 2004a) and the report Disability Prevalence and Trends (AIHW 2003b).
10
understanding, whether this difficulty is associated with restrictions in everyday activities, which health conditions are associated with the difficulty etc. These questions thus relate to a range of ICF components (health conditions, impairments, activity limitations) and will not relate directly to estimates of intellectual disability based solely on, for example, an impairment measure such as the intelligence quotient (IQ) rating of less than 70–75.
2.3 Information sources As stated in the previous chapter, this report was undertaken to provide a comprehensive picture of children with disabilities in Australia. To ensure completeness and balance, information was sourced from a range of resources and assembled, for the first time, to describe Australian children with disabilities, their experiences, and the experiences of their families. To do so, a list of key Australian data collections was first collated and, where possible, these collections were investigated as primary sources of information. These collections are outlined and described in Chapter 6, which also discusses gaps in the data relating to children with disabilities. Many of the data collections relevant to this topic have been analysed previously and reported on by the AIHW and its collaborating centres; however, the report also includes original analyses where no published data were available or further enquiry was considered warranted. A literature review was then undertaken, as well as searches of relevant government, non-government and research organisations’ web sites. These references were used to provide detail in areas such as family characteristics and effects where Australian data were lacking, as well as context for the report as a whole.
11
3 The prevalence of disability in children
3.1 Introduction This chapter firstly presents broad prevalence estimates of childhood disability based on Australian population data (Section 3.2), before presenting more detailed estimates of the prevalence of the five disability groups described in Chapter 2 (intellectual/learning disability, psychiatric disability, sensory/speech disability, physical/diverse disability and acquired brain injury) (Section 3.3). Section 3.4 outlines what is known about some of the significant diseases and health conditions associated with childhood disability. Section 3.5 then discusses available information on the prevalence of childhood disability among different population sub-groups, specifically Aboriginal and Torres Strait Islander children, children from different cultural and linguistic backgrounds, and children living in different geographic locations. Section 3.6 presents a brief discussion of trends over time in the prevalence of childhood disability in Australia.
3.2 Prevalence of childhood disability in Australia The main data source for estimating the prevalence of disability in Australia is the Australian Bureau of Statistics (ABS) Survey of Disability, Ageing and Carers (SDAC), conducted in 1981, 1988, 1993 and 1998. 3 The AIHW has undertaken extensive analysis of this survey in the past and this report draws on and expands those previous analyses. Further details of the ABS survey and AIHW analysis of the survey are included in Chapter 6 on data sources. The 1998 Survey of Disability, Ageing and Carers defines ‘disability’ as the presence of one or more of 17 limitations, restrictions or impairments which restrict everyday activities (Box 3.1). When a survey respondent states that they experience one or more of the 17 listed items, they are ‘screened’ into the full survey. They are then asked to provide details about health conditions they may have, how much personal assistance they require with specified tasks, whether this assistance is provided formally or informally, and whether they use aids or equipment for specified tasks. The key terms used in describing the ABS survey results are detailed in Table 3.1.
3 The ABS conducted a Survey of Disability, Ageing and Carers in 2003. While summary data from
this survey were available at the time of finalising this report, the detailed Confidentialised Unit Record File (CURF), required to repeat the analysis presented elsewhere in this report for 2003, was not. ABS analysis of the 2003 SDAC suggests that there has been no significant change in the rate of disability among children aged 0–14 years between 1998 and 2003, or in the rate of severe or profound core activity restriction among children of this age (ABS 2004).
12
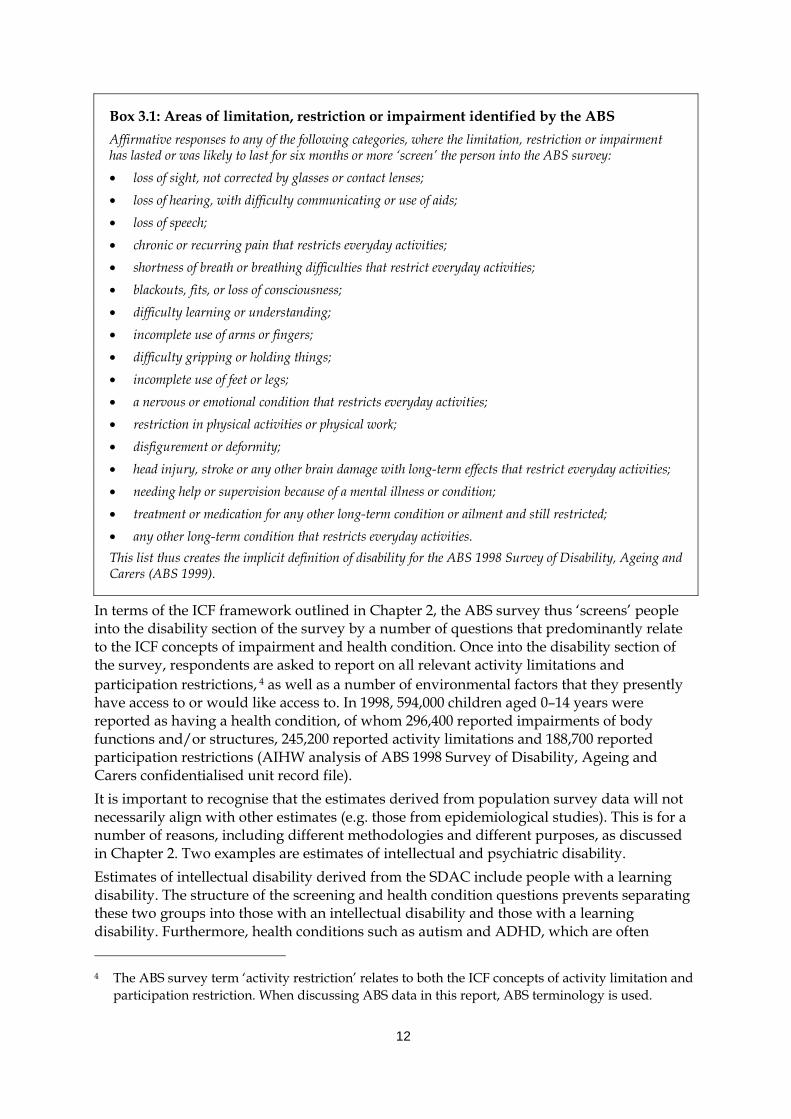
Box 3.1: Areas of limitation, restriction or impairment identified by the ABS Affirmative responses to any of the following categories, where the limitation, restriction or impairment has lasted or was likely to last for six months or more ‘screen’ the person into the ABS survey: • loss of sight, not corrected by glasses or contact lenses; • loss of hearing, with difficulty communicating or use of aids; • loss of speech; • chronic or recurring pain that restricts everyday activities; • shortness of breath or breathing difficulties that restrict everyday activities; • blackouts, fits, or loss of consciousness; • difficulty learning or understanding; • incomplete use of arms or fingers; • difficulty gripping or holding things; • incomplete use of feet or legs; • a nervous or emotional condition that restricts everyday activities; • restriction in physical activities or physical work; • disfigurement or deformity; • head injury, stroke or any other brain damage with long-term effects that restrict everyday activities; • needing help or supervision because of a mental illness or condition; • treatment or medication for any other long-term condition or ailment and still restricted; • any other long-term condition that restricts everyday activities. This list thus creates the implicit definition of disability for the ABS 1998 Survey of Disability, Ageing and Carers (ABS 1999).
In terms of the ICF framework outlined in Chapter 2, the ABS survey thus ‘screens’ people into the disability section of the survey by a number of questions that predominantly relate to the ICF concepts of impairment and health condition. Once into the disability section of the survey, respondents are asked to report on all relevant activity limitations and participation restrictions, 4 as well as a number of environmental factors that they presently have access to or would like access to. In 1998, 594,000 children aged 0–14 years were reported as having a health condition, of whom 296,400 reported impairments of body functions and/or structures, 245,200 reported activity limitations and 188,700 reported participation restrictions (AIHW analysis of ABS 1998 Survey of Disability, Ageing and Carers confidentialised unit record file). It is important to recognise that the estimates derived from population survey data will not necessarily align with other estimates (e.g. those from epidemiological studies). This is for a number of reasons, including different methodologies and different purposes, as discussed in Chapter 2. Two examples are estimates of intellectual and psychiatric disability. Estimates of intellectual disability derived from the SDAC include people with a learning disability. The structure of the screening and health condition questions prevents separating these two groups into those with an intellectual disability and those with a learning disability. Furthermore, health conditions such as autism and ADHD, which are often 4 The ABS survey term ‘activity restriction’ relates to both the ICF concepts of activity limitation and
participation restriction. When discussing ABS data in this report, ABS terminology is used.
13
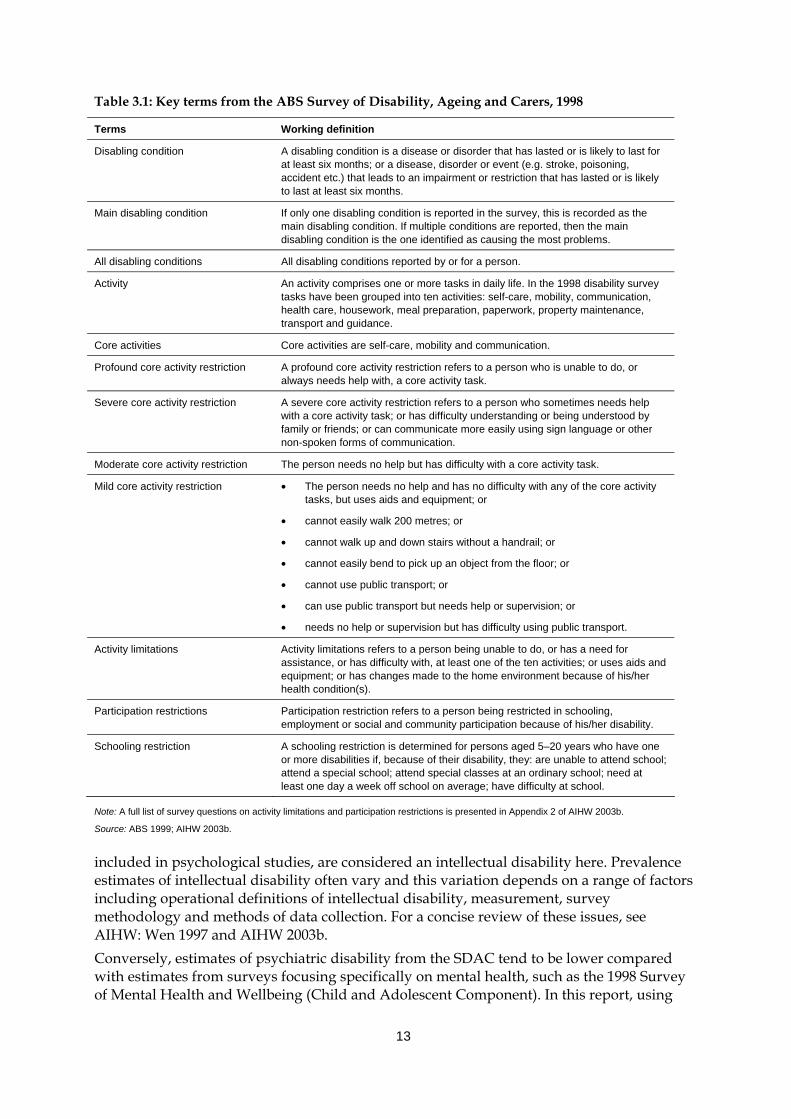
Table 3.1: Key terms from the ABS Survey of Disability, Ageing and Carers, 1998
Terms Working definition
Disabling condition A disabling condition is a disease or disorder that has lasted or is likely to last for at least six months; or a disease, disorder or event (e.g. stroke, poisoning, accident etc.) that leads to an impairment or restriction that has lasted or is likely to last at least six months.
Main disabling condition If only one disabling condition is reported in the survey, this is recorded as the main disabling condition. If multiple conditions are reported, then the main disabling condition is the one identified as causing the most problems.
All disabling conditions All disabling conditions reported by or for a person.
Activity An activity comprises one or more tasks in daily life. In the 1998 disability survey tasks have been grouped into ten activities: self-care, mobility, communication, health care, housework, meal preparation, paperwork, property maintenance, transport and guidance.
Core activities Core activities are self-care, mobility and communication.
Profound core activity restriction A profound core activity restriction refers to a person who is unable to do, or always needs help with, a core activity task.
Severe core activity restriction A severe core activity restriction refers to a person who sometimes needs help with a core activity task; or has difficulty understanding or being understood by family or friends; or can communicate more easily using sign language or other non-spoken forms of communication.
Moderate core activity restriction The person needs no help but has difficulty with a core activity task.
Mild core activity restriction • The person needs no help and has no difficulty with any of the core activity tasks, but uses aids and equipment; or
• cannot easily walk 200 metres; or
• cannot walk up and down stairs without a handrail; or
• cannot easily bend to pick up an object from the floor; or
• cannot use public transport; or
• can use public transport but needs help or supervision; or
• needs no help or supervision but has difficulty using public transport.
Activity limitations Activity limitations refers to a person being unable to do, or has a need for assistance, or has difficulty with, at least one of the ten activities; or uses aids and equipment; or has changes made to the home environment because of his/her health condition(s).
Participation restrictions Participation restriction refers to a person being restricted in schooling, employment or social and community participation because of his/her disability.
Schooling restriction A schooling restriction is determined for persons aged 5–20 years who have one or more disabilities if, because of their disability, they: are unable to attend school; attend a special school; attend special classes at an ordinary school; need at least one day a week off school on average; have difficulty at school.
Note: A full list of survey questions on activity limitations and participation restrictions is presented in Appendix 2 of AIHW 2003b.
Source: ABS 1999; AIHW 2003b.
included in psychological studies, are considered an intellectual disability here. Prevalence estimates of intellectual disability often vary and this variation depends on a range of factors including operational definitions of intellectual disability, measurement, survey methodology and methods of data collection. For a concise review of these issues, see AIHW: Wen 1997 and AIHW 2003b. Conversely, estimates of psychiatric disability from the SDAC tend to be lower compared with estimates from surveys focusing specifically on mental health, such as the 1998 Survey of Mental Health and Wellbeing (Child and Adolescent Component). In this report, using
14
AIHW analysis of the SDAC, we present estimates of the prevalence of ‘psychiatric disability’ as 1.3% among boys aged 0–14 years and 0.6% for girls of this age (based on all disabling conditions). The Survey of Mental Health and Wellbeing (Child and Adolescent Component) estimates the prevalence of ‘mental health problems’, finding that, for example, 4.1% of boys aged 4–12 years and 2.9% of girls aged 4–12 years are anxious or depressed (Sawyer et al. 2000). These differences are understandable given that the SDAC was not specifically designed to monitor psychological wellbeing among children and young people, and also because it focuses on a broad range of health conditions associated with disabilities but not those health conditions where no disability is involved. The methodology used here has been designed for consistency with the national and international disability groups specified in the National Community Services Data Dictionary V3 (AIHW 2004a) and to enable comparison with estimates for the population overall (as in AIHW 2003b).
Level of restriction In 1998, there were an estimated 3,905,600 children aged 0–14 years living in Australia, of whom 296,400 (or 7.6% of children aged 0–14 years) had a disability (Table 3.2, Figure 3.1). The rate of disability among children is lower than for the population overall, where 19.3% (or 3,610,300 from 18,660,600 people) have a disability (ABS 1999). While children aged 0–14 years make up 20.9% of the Australian population, they account for only 8.2% of the population with a disability. Of the 296,400 children with a disability, 252,800 experienced specific restrictions. Of these, 206,300 experienced core activity restrictions (i.e. in the areas of self-care, mobility or communication) and 175,200 experienced schooling restrictions (Figure 3.1, Table 3.2). The level of core activity restriction experienced by a child provides a broad understanding of the level of support they are reported as needing in areas known as activities of daily living (i.e. self-care, mobility or communication). The estimated number of people with a severe or profound core activity restriction is generally accepted as a broad indicator of potential need for disability support services in Australia. That is, this is the broad target group for specialist disability support services, although not all of these people will necessarily need services (and some with moderate restrictions will). Throughout this report, the term ‘severe disability’ is used interchangeably with ‘severe or profound core activity restriction’. In 1998, there were an estimated 144,300 children aged 0–14 years (or 3.7% of children aged 0–14 years) with a severe or profound core activity restriction (severe disability). In more detail, in 1998 there were: • 76,500 children aged 0–14 years (2.0% of children of this age) with a profound level of
core activity restriction, meaning that they were unable to do, or always needed help with, one or more core activity;
• 67,800 children in this age group (1.7% of children of this age) with a severe level of core activity restriction, meaning that they sometimes needed help with a core activity task, or had difficulty understanding or being understood by family or friends, or could communicate more easily using sign language or other non-spoken forms of communication;
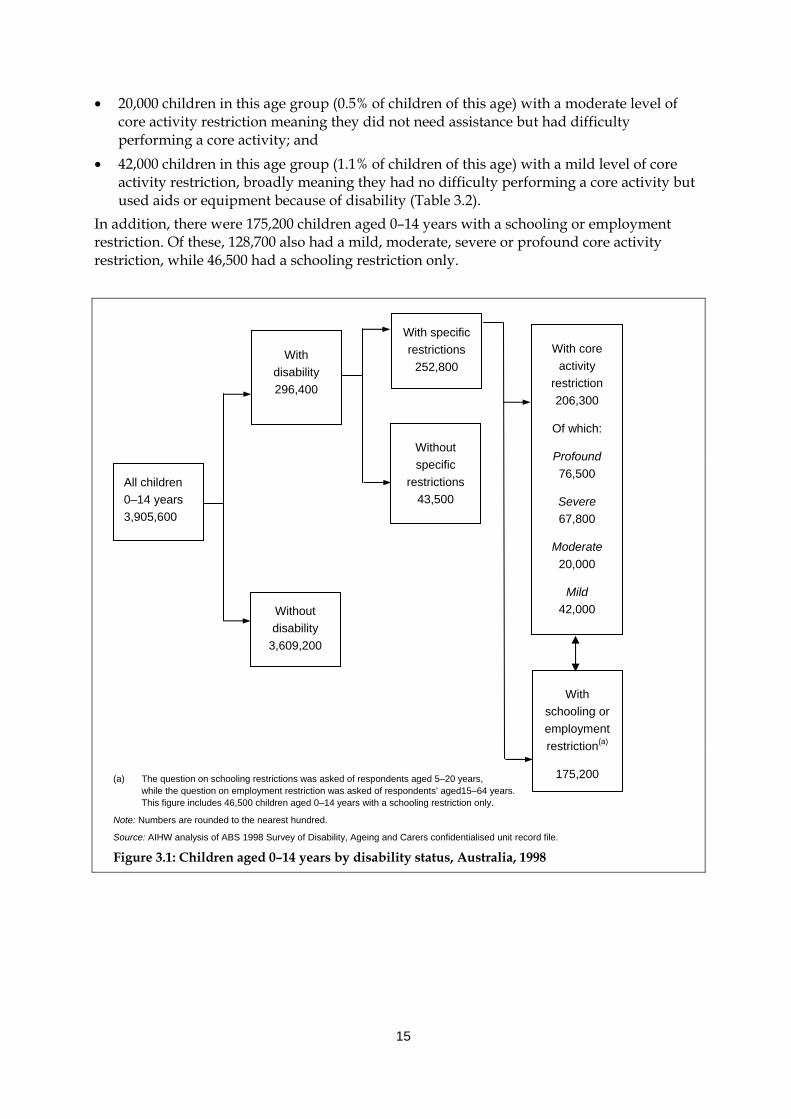
15
• 20,000 children in this age group (0.5% of children of this age) with a moderate level of core activity restriction meaning they did not need assistance but had difficulty performing a core activity; and
• 42,000 children in this age group (1.1% of children of this age) with a mild level of core activity restriction, broadly meaning they had no difficulty performing a core activity but used aids or equipment because of disability (Table 3.2).
In addition, there were 175,200 children aged 0–14 years with a schooling or employment restriction. Of these, 128,700 also had a mild, moderate, severe or profound core activity restriction, while 46,500 had a schooling restriction only.
(a) The question on schooling restrictions was asked of respondents aged 5–20 years,
while the question on employment restriction was asked of respondents’ aged15–64 years. This figure includes 46,500 children aged 0–14 years with a schooling restriction only.
Note: Numbers are rounded to the nearest hundred.
Source: AIHW analysis of ABS 1998 Survey of Disability, Ageing and Carers confidentialised unit record file.
Figure 3.1: Children aged 0–14 years by disability status, Australia, 1998
With core activity
restriction 206,300
Of which:
Profound 76,500
Severe 67,800
Moderate 20,000
Mild 42,000
Without specific
restrictions 43,500
With schooling or employment restriction(a)
175,200
With specific restrictions
252,800 With
disability 296,400
Without disability
3,609,200
All children 0–14 years 3,905,600
16
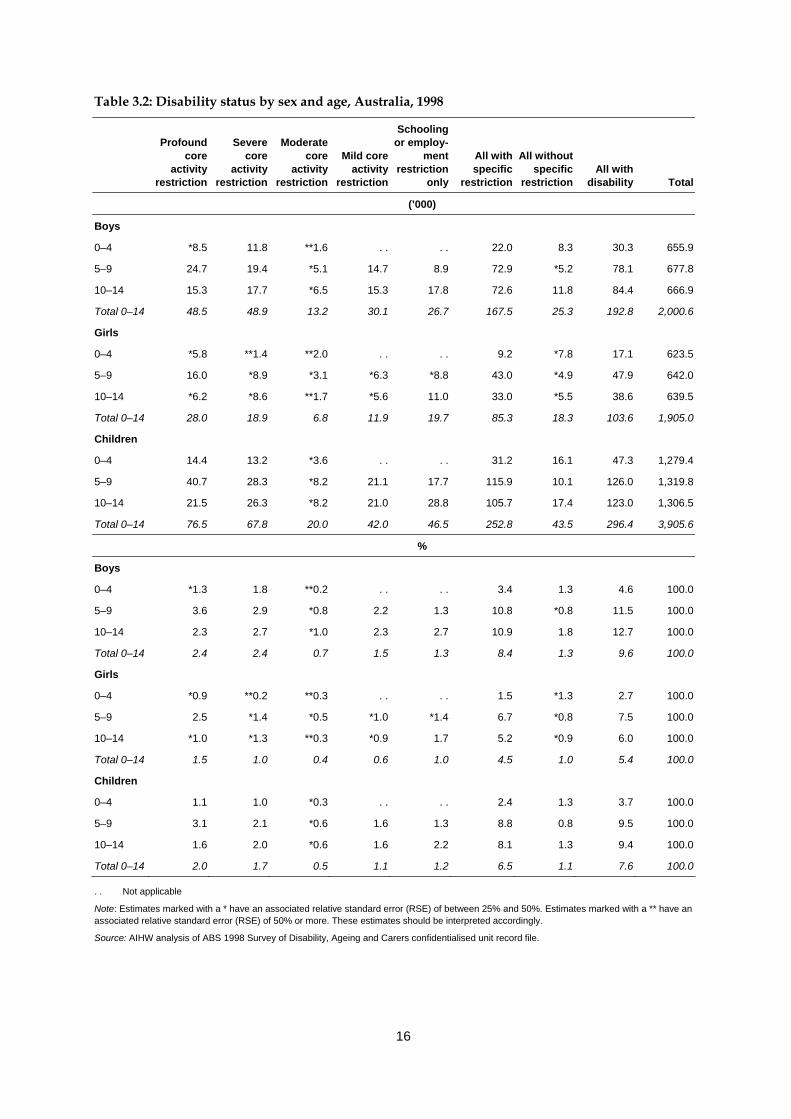
Table 3.2: Disability status by sex and age, Australia, 1998
Profound
core activity
restriction
Severe
core activity
restriction
Moderate core
activity restriction
Mild core activity
restriction
Schooling or employ-
ment restriction
only
All with specific
restriction
All without specific
restriction
All with disability Total
(’000)
Boys
0–4 *8.5 11.8 **1.6 . . . . 22.0 8.3 30.3 655.9
5–9 24.7 19.4 *5.1 14.7 8.9 72.9 *5.2 78.1 677.8
10–14 15.3 17.7 *6.5 15.3 17.8 72.6 11.8 84.4 666.9
Total 0–14 48.5 48.9 13.2 30.1 26.7 167.5 25.3 192.8 2,000.6
Girls
0–4 *5.8 **1.4 **2.0 . . . . 9.2 *7.8 17.1 623.5
5–9 16.0 *8.9 *3.1 *6.3 *8.8 43.0 *4.9 47.9 642.0
10–14 *6.2 *8.6 **1.7 *5.6 11.0 33.0 *5.5 38.6 639.5
Total 0–14 28.0 18.9 6.8 11.9 19.7 85.3 18.3 103.6 1,905.0
Children
0–4 14.4 13.2 *3.6 . . . . 31.2 16.1 47.3 1,279.4
5–9 40.7 28.3 *8.2 21.1 17.7 115.9 10.1 126.0 1,319.8
10–14 21.5 26.3 *8.2 21.0 28.8 105.7 17.4 123.0 1,306.5
Total 0–14 76.5 67.8 20.0 42.0 46.5 252.8 43.5 296.4 3,905.6
%
Boys
0–4 *1.3 1.8 **0.2 . . . . 3.4 1.3 4.6 100.0
5–9 3.6 2.9 *0.8 2.2 1.3 10.8 *0.8 11.5 100.0
10–14 2.3 2.7 *1.0 2.3 2.7 10.9 1.8 12.7 100.0
Total 0–14 2.4 2.4 0.7 1.5 1.3 8.4 1.3 9.6 100.0
Girls
0–4 *0.9 **0.2 **0.3 . . . . 1.5 *1.3 2.7 100.0
5–9 2.5 *1.4 *0.5 *1.0 *1.4 6.7 *0.8 7.5 100.0
10–14 *1.0 *1.3 **0.3 *0.9 1.7 5.2 *0.9 6.0 100.0
Total 0–14 1.5 1.0 0.4 0.6 1.0 4.5 1.0 5.4 100.0
Children
0–4 1.1 1.0 *0.3 . . . . 2.4 1.3 3.7 100.0
5–9 3.1 2.1 *0.6 1.6 1.3 8.8 0.8 9.5 100.0
10–14 1.6 2.0 *0.6 1.6 2.2 8.1 1.3 9.4 100.0
Total 0–14 2.0 1.7 0.5 1.1 1.2 6.5 1.1 7.6 100.0
. . Not applicable
Note: Estimates marked with a * have an associated relative standard error (RSE) of between 25% and 50%. Estimates marked with a ** have an associated relative standard error (RSE) of 50% or more. These estimates should be interpreted accordingly.
Source: AIHW analysis of ABS 1998 Survey of Disability, Ageing and Carers confidentialised unit record file.
17
Sex patterns There are sex differentials in the prevalence of disability among children. In 1998, there were almost twice as many boys aged 0–14 years with a disability as girls (192,800 boys compared to 103,600 girls). Even though there are slightly more boys than girls aged 0–14 years in the Australian population, the prevalence rate of disability for boys was also almost twice the rate for girls (9.6% compared to 5.4%). The sex difference persists when we consider the pattern for children with severe disability (97,400 boys compared to 47,000 girls) (Table 3.2). Put another way, about one in ten boys (9.6%) aged 0–14 years were estimated to have a disability and nearly one in twenty (4.9%) a severe disability, with rates roughly half this level for girls (5.4% and 2.5% respectively).
Age patterns The prevalence of core activity restriction (in terms of numbers and rates) in 1998 tended to be lowest in the 0–4 years age group and highest among 5–9 year olds. This pattern is particularly pronounced among the group of children with profound core activity restrictions. This may relate to the increased identification of activity restrictions upon school entry, the availability of assistance, and may suggest that some issues resolve or become less prominent in the minds of parents, children and/or teachers as children age. It may also relate to the complexity of asking and answering questions about activity limitations among children aged 0–4 years, who, regardless of disability, are likely to need assistance in many activity areas due to their age (see Box 6.1 for more detail about question wording in the SDAC). The pattern or distribution of core activity restriction among children with disability is quite different than for the population overall with a disability. As previously noted, 3.7% of children aged 0–14 years have a severe or profound core activity restriction compared to 6.1% of the population overall (and 1.6% of children aged 0–14 have moderate or mild core activity restrictions compared to 9.0% of the population overall). Among children aged 0–14 years with a disability, there are relatively more children aged 0–14 years with severe or profound core activity restriction (144,300 or 49% of children with a disability) than moderate or mild core activity restriction (62,000 or 21% of all children with a disability). However, this is not the case when we consider Australians of all ages, where relatively fewer people have a severe or profound core activity restriction (1,135,900 or 31% of all people with a disability) than moderate or mild core activity restriction (1,692,100 or 47% of all people with a disability) (ABS 1999; Appendix Table A2.1). There are a number of possible explanations for the different pattern in level of restriction among children compared to the population overall. First, as outlined above, it is possible severe or profound core activity restrictions are more likely to be reported among children because of the difficulty in estimating need for assistance among children aged 0–4 years and the way that support needs are identified among children aged 5–9 years upon school entry. Second, the relatively large proportion of children with disability who experience severe or profound core activity restriction might relate to their increased likelihood of reporting communication restrictions. Communication, self-care and mobility are the three core activities in the ABS Survey of Disability, Ageing and Carers. If a child always or sometimes needs assistance with any one of these three areas then they are considered to have a severe or profound core activity restriction. About one-fifth (17.8%) of all people with a disability living in households and nearly one-third (30.1%) of people with a severe or profound core
18
activity restriction living in households experienced a communication restriction (AIHW 2003c). These proportions are much higher for children, where 39.1% of children with a disability have a communication restriction and 69.4% of children with a severe or profound core activity restriction have a communication restriction (Table A2.2). This could mean that children with disability are much more likely than the population overall with a disability to experience a communication restriction but it could also point to a possible issue with the survey methodology, whereby the question wording makes it more likely that communication restrictions will be reported for children. For example, it should be noted that the majority of children identified as having a communication restriction (65,500 or 45.4% of all children of this age with a severe or profound core activity restriction) had a severe communication restriction, which means they had responded positively to the survey questions about having difficulty understanding or being understood by family or friends, or about whether the child can communicate more easily using sign language or non-spoken communication (see Chapter 6 for more details about the ABS survey methodology).
3.3 Prevalence of disability groups The AIHW developed prevalence estimates for each of the five major recognised disability groups: intellectual/learning, psychiatric, sensory/speech, physical/diverse and acquired brain injury (AIHW 2003b). A description of each of the sets of prevalence estimates is included in Box 3.2 (these groups are defined in Box 2.1). These estimates were based on the 1998 ABS SDAC. For a more detailed discussion of how the estimates were generated for each disability group see the report Disability Prevalence and Trends in Australia (AIHW 2003b). Table 3.3 presents prevalence estimates for each disability group for boys and girls. The top panel of the table provides estimates based on all disabling conditions reported for each child aged 0–14 years. This means that children may appear in more than one disability group and that totals in each disability group do not add to the total number of children with disabilities. The bottom panel of Table 3.3 presents estimates based on the main disabling condition reported for each child aged 0–14 years, or the condition causing the child the most problem. When using estimates based on main disabling condition, people who reported a physical disabling condition as their main disabling condition are only included in the physical/diverse disability group, even if they also report, for example, intellectual or sensory disabling conditions. The main disabling condition approach means that the numbers in each disability group are mutually exclusive and the sum of each disability group adds to the total number of children with a disability. Unless otherwise stated, prevalence estimates in this chapter are based on the all disabling conditions estimation methodology.
Level of restriction
All disabling conditions In 1998, 144,100 children aged 0–14 years (or 3.7% of the population of this age) were estimated to have a physical/diverse disability, either as a main disabling condition or an associated disabling condition. The next most common disability group among children was intellectual/learning disability (143,000 children or 3.7% of the population of this age),
19
followed by sensory/speech disability (119,900 or 3.1%), psychiatric disability (43,600 or 1.1%) and disability related to acquired brain injury (12,700 or 0.3%) (Table 3.3). This pattern varies somewhat when we consider only children aged 0–14 years with a severe disability. Among this group of children the most common disability group is intellectual/learning (83,000 children or 2.1% of the population of this age), followed by sensory/speech disability (77,600 or 2.0%), then physical/diverse disability (69,200 or 1.8%), psychiatric disability (37,000 or 0.9%) and acquired brain injury (11,400 or 0.3%) (Table 3.3).
Box 3.2: Prevalence estimates for disability groups The AIHW has developed four sets of prevalence estimates for each of the five disability groups. These are estimates based on: 1. main disabling condition; 2. all disabling conditions; 3. all disabling conditions plus activity limitations and participation restrictions; and 4. main/all disabling conditions plus a severe or profound core activity restriction. The key terms relating to each of these approaches are listed in Table 3.1. Estimates based on reported main disabling condition relate to conditions that were identified by survey respondents as causing the most problems. For example, where people are identified as having a physical disability, this means the physical disabling conditions caused them more problems than any other disabling conditions they may also have had. In this approach, people are excluded from the estimate of physical disability unless they reported physical disabling conditions as their main disabling condition (for the full list of groupings of impairments and disabling conditions see Appendix 1 in AIHW 2003b). Such estimates are useful for some purposes because the estimates of different disability groups are mutually exclusive. This means that the numbers in each disability group sum to give the total number of people with a disability, as defined by the 1998 ABS disability survey (AIHW 2003b). The estimates based on all disabling conditions are the most inclusive of the four types of estimates, including all reported disabling conditions, whether or not these were reported as main disabling conditions. This approach prevents the underestimation that results using the main disabling conditions and enables the disability experiences of people with multiple disabling conditions to be recorded. When this approach is used the numbers in each disability group do not sum to give the total number of people with a disability (AIHW 2003b). The approach using data on all disabling conditions and activity limitations and participation restrictions draws in multi-dimensional information from the survey on impairment, disabling conditions, activity limitations, participation restrictions, and need for assistance with daily activities (AIHW 2003b). This approach initially includes people who reported one or more disabling conditions relating to each of the five disability groups (whether or not these were reported as main disabling conditions). The estimates are then narrowed down to only include people who reported limitations or restrictions in one or more activities of daily or social life (for a full list of survey questions on limitations and restrictions see Appendix 2 in AIHW 2003b). The approach using data on all disabling conditions and a severe or profound core activity restriction is similar to the previous approach except that an additional and more exclusive ‘filter’ is used. Only people who reported a severe or profound core activity restriction, meaning that they sometimes or always needed personal assistance or supervision with activities of daily life (self-care, mobility and communication), are included in these estimates. This corresponds quite closely to the ‘target population’ of specialist disability services provided throughout Australia under the Commonwealth State/Territory Disability Agreement (see Chapter 5 for more on CSTDA services). The estimated number of people with a severe or profound core activity restriction is generally accepted as a broad indicator of potential need for disability support services in Australia (AIHW 2003b).
Source: AIHW 2003b.
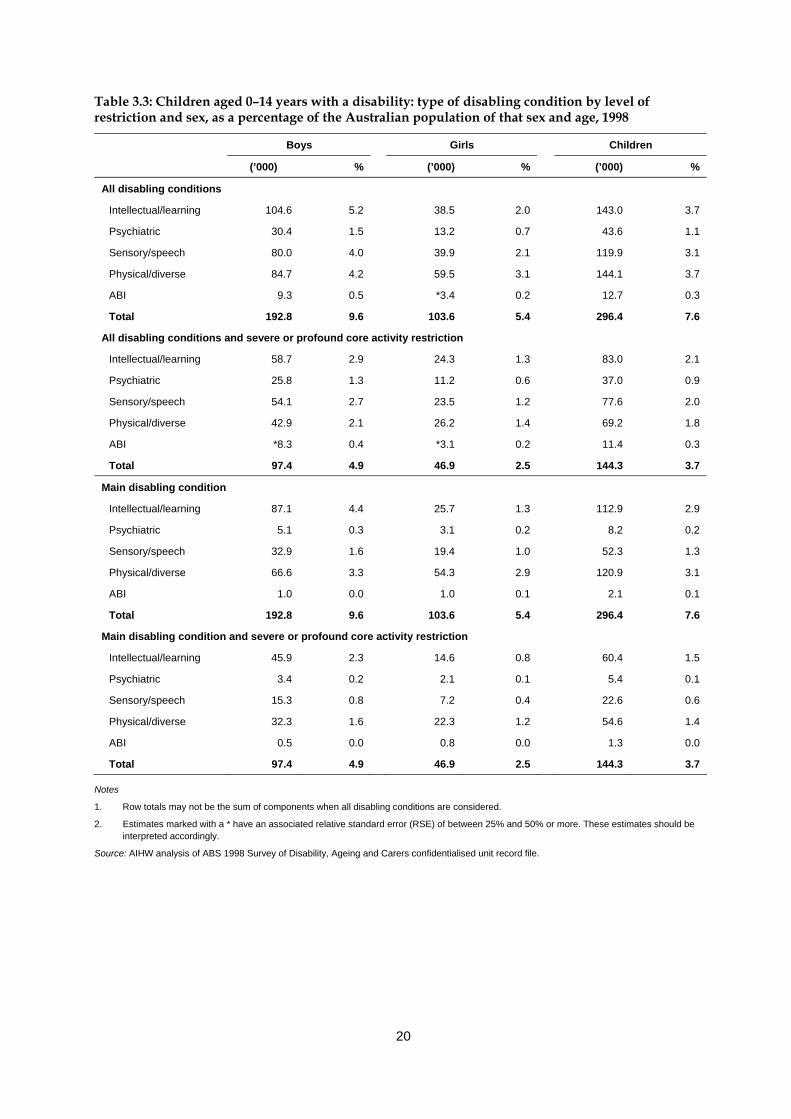
20
Table 3.3: Children aged 0–14 years with a disability: type of disabling condition by level of restriction and sex, as a percentage of the Australian population of that sex and age, 1998
Boys Girls Children
(’000) % (’000) % (’000) %
All disabling conditions
Intellectual/learning 104.6 5.2 38.5 2.0 143.0 3.7
Psychiatric 30.4 1.5 13.2 0.7 43.6 1.1
Sensory/speech 80.0 4.0 39.9 2.1 119.9 3.1
Physical/diverse 84.7 4.2 59.5 3.1 144.1 3.7
ABI 9.3 0.5 *3.4 0.2 12.7 0.3
Total 192.8 9.6 103.6 5.4 296.4 7.6
All disabling conditions and severe or profound core activity restriction
Intellectual/learning 58.7 2.9 24.3 1.3 83.0 2.1
Psychiatric 25.8 1.3 11.2 0.6 37.0 0.9
Sensory/speech 54.1 2.7 23.5 1.2 77.6 2.0
Physical/diverse 42.9 2.1 26.2 1.4 69.2 1.8
ABI *8.3 0.4 *3.1 0.2 11.4 0.3
Total 97.4 4.9 46.9 2.5 144.3 3.7
Main disabling condition
Intellectual/learning 87.1 4.4 25.7 1.3 112.9 2.9
Psychiatric 5.1 0.3 3.1 0.2 8.2 0.2
Sensory/speech 32.9 1.6 19.4 1.0 52.3 1.3
Physical/diverse 66.6 3.3 54.3 2.9 120.9 3.1
ABI 1.0 0.0 1.0 0.1 2.1 0.1
Total 192.8 9.6 103.6 5.4 296.4 7.6
Main disabling condition and severe or profound core activity restriction
Intellectual/learning 45.9 2.3 14.6 0.8 60.4 1.5
Psychiatric 3.4 0.2 2.1 0.1 5.4 0.1
Sensory/speech 15.3 0.8 7.2 0.4 22.6 0.6
Physical/diverse 32.3 1.6 22.3 1.2 54.6 1.4
ABI 0.5 0.0 0.8 0.0 1.3 0.0
Total 97.4 4.9 46.9 2.5 144.3 3.7
Notes
1. Row totals may not be the sum of components when all disabling conditions are considered.
2. Estimates marked with a * have an associated relative standard error (RSE) of between 25% and 50% or more. These estimates should be interpreted accordingly.
Source: AIHW analysis of ABS 1998 Survey of Disability, Ageing and Carers confidentialised unit record file.
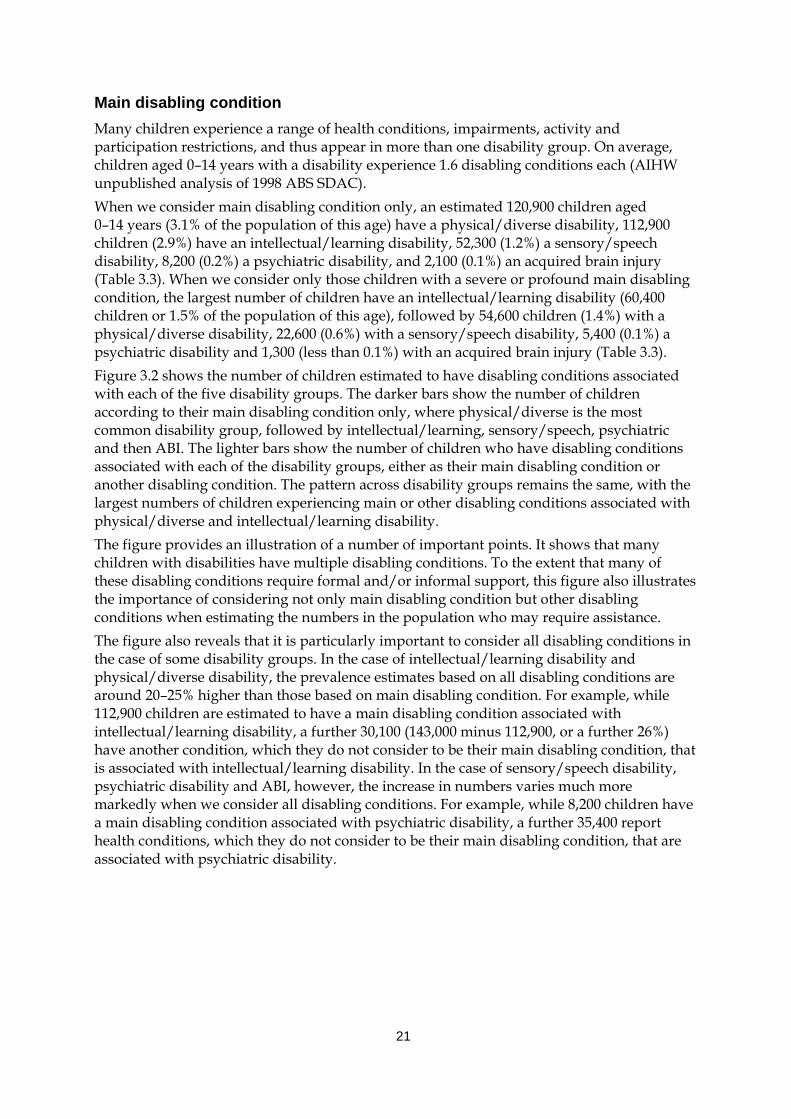
21
Main disabling condition Many children experience a range of health conditions, impairments, activity and participation restrictions, and thus appear in more than one disability group. On average, children aged 0–14 years with a disability experience 1.6 disabling conditions each (AIHW unpublished analysis of 1998 ABS SDAC). When we consider main disabling condition only, an estimated 120,900 children aged 0–14 years (3.1% of the population of this age) have a physical/diverse disability, 112,900 children (2.9%) have an intellectual/learning disability, 52,300 (1.2%) a sensory/speech disability, 8,200 (0.2%) a psychiatric disability, and 2,100 (0.1%) an acquired brain injury (Table 3.3). When we consider only those children with a severe or profound main disabling condition, the largest number of children have an intellectual/learning disability (60,400 children or 1.5% of the population of this age), followed by 54,600 children (1.4%) with a physical/diverse disability, 22,600 (0.6%) with a sensory/speech disability, 5,400 (0.1%) a psychiatric disability and 1,300 (less than 0.1%) with an acquired brain injury (Table 3.3). Figure 3.2 shows the number of children estimated to have disabling conditions associated with each of the five disability groups. The darker bars show the number of children according to their main disabling condition only, where physical/diverse is the most common disability group, followed by intellectual/learning, sensory/speech, psychiatric and then ABI. The lighter bars show the number of children who have disabling conditions associated with each of the disability groups, either as their main disabling condition or another disabling condition. The pattern across disability groups remains the same, with the largest numbers of children experiencing main or other disabling conditions associated with physical/diverse and intellectual/learning disability. The figure provides an illustration of a number of important points. It shows that many children with disabilities have multiple disabling conditions. To the extent that many of these disabling conditions require formal and/or informal support, this figure also illustrates the importance of considering not only main disabling condition but other disabling conditions when estimating the numbers in the population who may require assistance. The figure also reveals that it is particularly important to consider all disabling conditions in the case of some disability groups. In the case of intellectual/learning disability and physical/diverse disability, the prevalence estimates based on all disabling conditions are around 20–25% higher than those based on main disabling condition. For example, while 112,900 children are estimated to have a main disabling condition associated with intellectual/learning disability, a further 30,100 (143,000 minus 112,900, or a further 26%) have another condition, which they do not consider to be their main disabling condition, that is associated with intellectual/learning disability. In the case of sensory/speech disability, psychiatric disability and ABI, however, the increase in numbers varies much more markedly when we consider all disabling conditions. For example, while 8,200 children have a main disabling condition associated with psychiatric disability, a further 35,400 report health conditions, which they do not consider to be their main disabling condition, that are associated with psychiatric disability.
22
0 20,000 40,000 60,000 80,000 100,000 120,000 140,000 160,000
Intellectual/learning
Psychiatric
Sensory/speech
Physical/diverse
ABI
Number of children aged 0–14 years
All disabling conditions Main disabling condition
Source: Table 3.2.
Figure 3.2: Main disabling conditions and all disabling conditions, children aged 0–14 years, 1998
The above patterns are also likely to be a reflection of the finding that children with intellectual/learning disability are more likely to also have associated health conditions, for example, relating to the psychiatric or sensory/speech disability groups (see, for example, US Public Health Service 2002).
Sex patterns Sex differences in disability are particularly pronounced in relation to intellectual/learning disability, where the rate among boys aged 0–14 years is 2.6 times that for girls (5.2% compared to 2.0%). The prevalence rate of physical/diverse disability amongst similarly aged boys, however, is not quite as marked, around 1.4 times that for girls (4.2% compared to 3.1%) (Table 3.3). There is a slight reduction in the differences between the sexes across disability groups when we consider only those children with a severe disability. For example, the rate of severe intellectual/learning disability among boys is 2.2 times that for girls. Boys aged 0–14 years with a disability were much more likely than girls to have an intellectual/learning disability (45% compared to 26%) and much less likely to have a physical/diverse disability (35% compared to 54%) as their main disabling condition (Table 3.3). This pattern applies whether we consider children with disability or children with a disability and a severe disability (Table 3.3). This could relate to health conditions, such as ADHD, that are more commonly observed in boys and often associated with lower levels of restriction (see discussion in Section 3.5 on trends in disability).
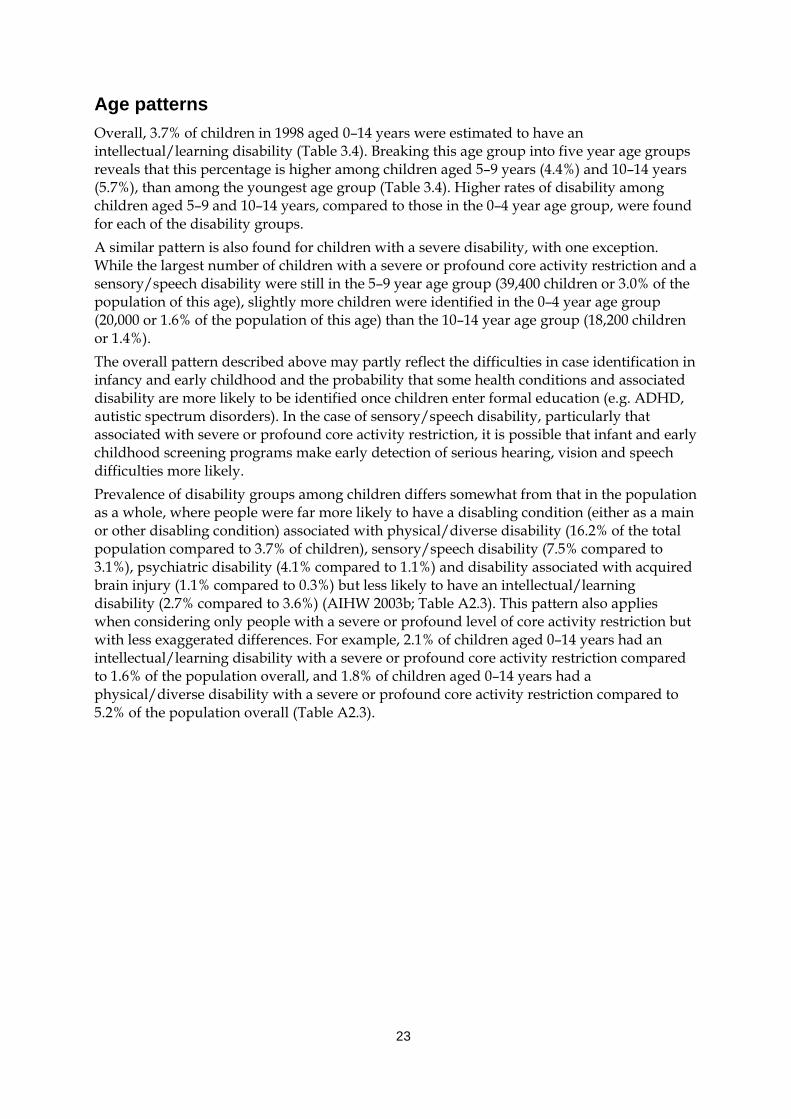
23
Age patterns Overall, 3.7% of children in 1998 aged 0–14 years were estimated to have an intellectual/learning disability (Table 3.4). Breaking this age group into five year age groups reveals that this percentage is higher among children aged 5–9 years (4.4%) and 10–14 years (5.7%), than among the youngest age group (Table 3.4). Higher rates of disability among children aged 5–9 and 10–14 years, compared to those in the 0–4 year age group, were found for each of the disability groups. A similar pattern is also found for children with a severe disability, with one exception. While the largest number of children with a severe or profound core activity restriction and a sensory/speech disability were still in the 5–9 year age group (39,400 children or 3.0% of the population of this age), slightly more children were identified in the 0–4 year age group (20,000 or 1.6% of the population of this age) than the 10–14 year age group (18,200 children or 1.4%). The overall pattern described above may partly reflect the difficulties in case identification in infancy and early childhood and the probability that some health conditions and associated disability are more likely to be identified once children enter formal education (e.g. ADHD, autistic spectrum disorders). In the case of sensory/speech disability, particularly that associated with severe or profound core activity restriction, it is possible that infant and early childhood screening programs make early detection of serious hearing, vision and speech difficulties more likely. Prevalence of disability groups among children differs somewhat from that in the population as a whole, where people were far more likely to have a disabling condition (either as a main or other disabling condition) associated with physical/diverse disability (16.2% of the total population compared to 3.7% of children), sensory/speech disability (7.5% compared to 3.1%), psychiatric disability (4.1% compared to 1.1%) and disability associated with acquired brain injury (1.1% compared to 0.3%) but less likely to have an intellectual/learning disability (2.7% compared to 3.6%) (AIHW 2003b; Table A2.3). This pattern also applies when considering only people with a severe or profound level of core activity restriction but with less exaggerated differences. For example, 2.1% of children aged 0–14 years had an intellectual/learning disability with a severe or profound core activity restriction compared to 1.6% of the population overall, and 1.8% of children aged 0–14 years had a physical/diverse disability with a severe or profound core activity restriction compared to 5.2% of the population overall (Table A2.3).
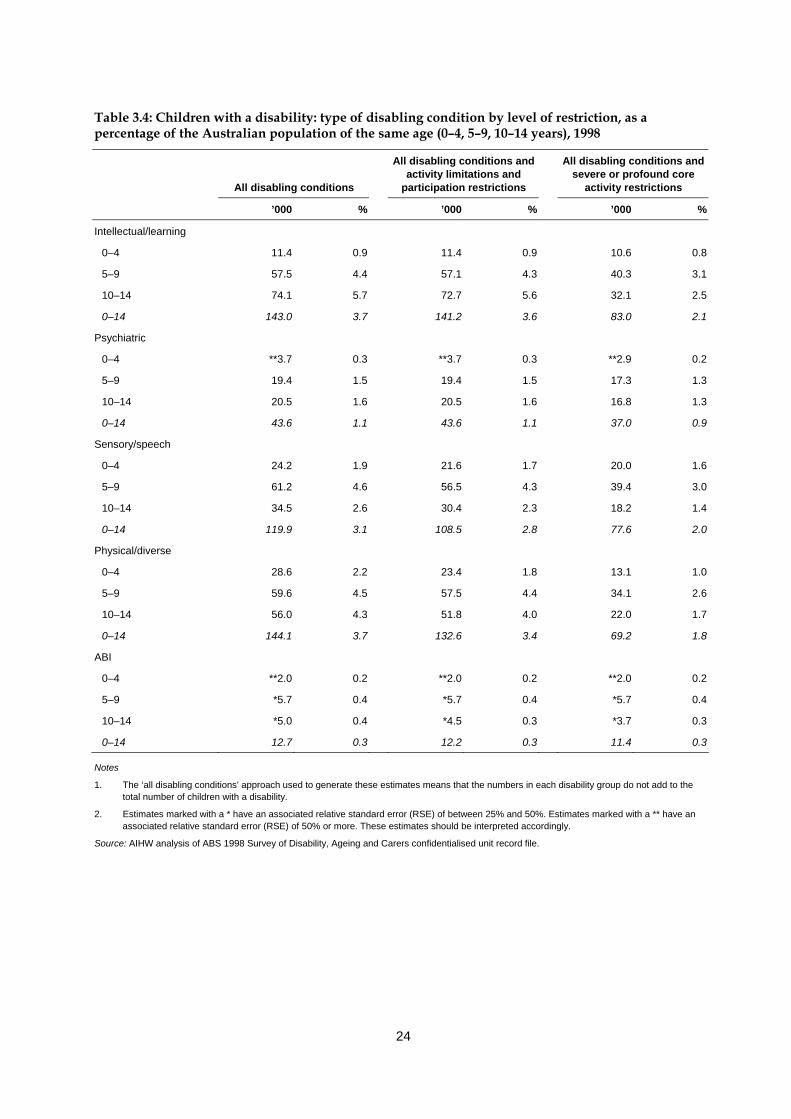
24
Table 3.4: Children with a disability: type of disabling condition by level of restriction, as a percentage of the Australian population of the same age (0–4, 5–9, 10–14 years), 1998
All disabling conditions
All disabling conditions and activity limitations and
participation restrictions
All disabling conditions and severe or profound core
activity restrictions
’000 % ’000 % ’000 %
Intellectual/learning
0–4 11.4 0.9 11.4 0.9 10.6 0.8
5–9 57.5 4.4 57.1 4.3 40.3 3.1
10–14 74.1 5.7 72.7 5.6 32.1 2.5
0–14 143.0 3.7 141.2 3.6 83.0 2.1
Psychiatric
0–4 **3.7 0.3 **3.7 0.3 **2.9 0.2
5–9 19.4 1.5 19.4 1.5 17.3 1.3
10–14 20.5 1.6 20.5 1.6 16.8 1.3
0–14 43.6 1.1 43.6 1.1 37.0 0.9
Sensory/speech
0–4 24.2 1.9 21.6 1.7 20.0 1.6
5–9 61.2 4.6 56.5 4.3 39.4 3.0
10–14 34.5 2.6 30.4 2.3 18.2 1.4
0–14 119.9 3.1 108.5 2.8 77.6 2.0
Physical/diverse
0–4 28.6 2.2 23.4 1.8 13.1 1.0
5–9 59.6 4.5 57.5 4.4 34.1 2.6
10–14 56.0 4.3 51.8 4.0 22.0 1.7
0–14 144.1 3.7 132.6 3.4 69.2 1.8
ABI
0–4 **2.0 0.2 **2.0 0.2 **2.0 0.2
5–9 *5.7 0.4 *5.7 0.4 *5.7 0.4
10–14 *5.0 0.4 *4.5 0.3 *3.7 0.3
0–14 12.7 0.3 12.2 0.3 11.4 0.3
Notes
1. The ‘all disabling conditions’ approach used to generate these estimates means that the numbers in each disability group do not add to the total number of children with a disability.
2. Estimates marked with a * have an associated relative standard error (RSE) of between 25% and 50%. Estimates marked with a ** have an associated relative standard error (RSE) of 50% or more. These estimates should be interpreted accordingly.
Source: AIHW analysis of ABS 1998 Survey of Disability, Ageing and Carers confidentialised unit record file.
25
Severe restriction The likelihood of having a severe or profound core activity restriction (and associated high levels of need for assistance) varied across disability groups, with a much higher probability among children with an acquired brain injury or psychiatric disability compared to the other disability groups. Nearly all children (90%) who were identified as having an acquired brain injury (as a main or associated disabling condition) had severe or profound core activity restrictions (11,400 of 12,700 children) (Table 3.4). Similarly, most children with a psychiatric disability had severe or profound core activity restrictions (37,000 of 43,600 or 85%). In contrast, about half the children (69,200 of 144,100 or 48%) identified as having a physical/diverse disability, about three-fifths of children with intellectual/learning disability (58% or 83,000 of 143,000) and about two-thirds of children with sensory/speech disability (65% or 77,600 of 119,900) experienced severe or profound core activity restrictions (Table 3.4 and Figure 3.3).
0
20
40
60
80
100
120
140
160
Intell
ectua
l/learn
ing
Psych
iatric
Senso
ry/sp
eech
Physic
al/dive
rse ABI
Disability group
No.
('00
0)
All disabling conditions
All disabling conditions and activitylimitations and participationrestrictions
All disabling conditions and severeor profound core activityrestrictions
Source: Table 3.4.
Figure 3.3: Children aged 0–14 years with a disability: type of disabling condition by level of restriction, 1998 (’000)
3.4 Some significant diseases and health conditions associated with disability According to the ICF framework, disability exists in the context of a health condition. Childhood disability is associated with a wide range of health conditions and diseases (e.g. Down syndrome, ADHD, asthma, depression).
26
Population data Using population data it is possible to examine some of the most common health conditions associated with each of the five disability groups: intellectual/learning, psychiatric, sensory/speech, physical/diverse and acquired brain injury. In interpreting the following data it should be noted that individuals may report any number of health conditions in the main data source. Intellectual/learning disability was associated with a range of diseases or health conditions, some of which are separately identified in the 1998 ABS disability survey. 5 On the basis of all reported disabling conditions among children aged 0–14 years with an intellectual/learning disability in 1998 it is possible to estimate that: • about 42,700 (1.1% of the population of this age and 29.9% of children this age with an
intellectual/learning disability) reported ADHD; • about 10,700 (0.3% of the population of this age and 7.5% of children this age with an
intellectual/learning disability) reported autism and related disorders. Boys were far more likely to experience these health conditions than girls. For example, ADHD was reported in relation to 36,400 boys compared to 6,400 girls and a developmental learning disorder was reported in relation to about 8,400 boys compared to about 4,000 girls.6 Of the 119,900 children aged 0–14 years with a sensory/speech disability: • about 89,000 (2.3% of the population of this age, or 74.2% of children this age with a
sensory/speech disability) reported health conditions such as speech impediment or speech difficulties, associated with speech disability;
• about 31,000 (0.8% of the population of this age, or 25.8% of children this age with a sensory/speech disability) reported health conditions such as congenital hearing loss or noise-induced hearing loss, associated with hearing disability; and
• about 13,800 (0.4% of the population of this age, or 11.5% of children this age with a sensory/speech disability) reported health conditions including cataracts and retinal disorders, associated with vision disability.
Boys aged 0–14 years were more likely than girls of the same age to experience all forms of sensory disability, particularly speech disability (62,300 boys compared to 26,700 girls). About 16,200 boys reported health conditions associated with hearing disability (compared to 14,000 girls) and about 5,300 boys reported health conditions associated with vision disability (compared to 3,500 girls7) (AIHW unpublished analysis of the 1998 ABS SDAC). Physical/diverse disability is associated with a large number of diseases or health conditions. Some of the most common conditions reported in relation to children aged
5 Many specific diseases or conditions associated with intellectual/learning disability were not
separately identified in the 1998 ABS Survey of Disability, Ageing and Carers, but rather included under headings such as ‘intellectual and developmental disorders not further defined’.
6 The estimated figures of 6,400 girls aged 0–14 years with ADHD, 8,400 boys aged 0–14 years with a developmental learning disorder and 4,000 girls aged 0–14 years with a developmental learning disorder have associated relative standard errors of between 25% and 50% and should be interpreted accordingly.
7 The estimated figure of 3,500 girls aged 0–14 years with vision disability has an associated relative standard error of between 25% and 50% and should be interpreted accordingly.
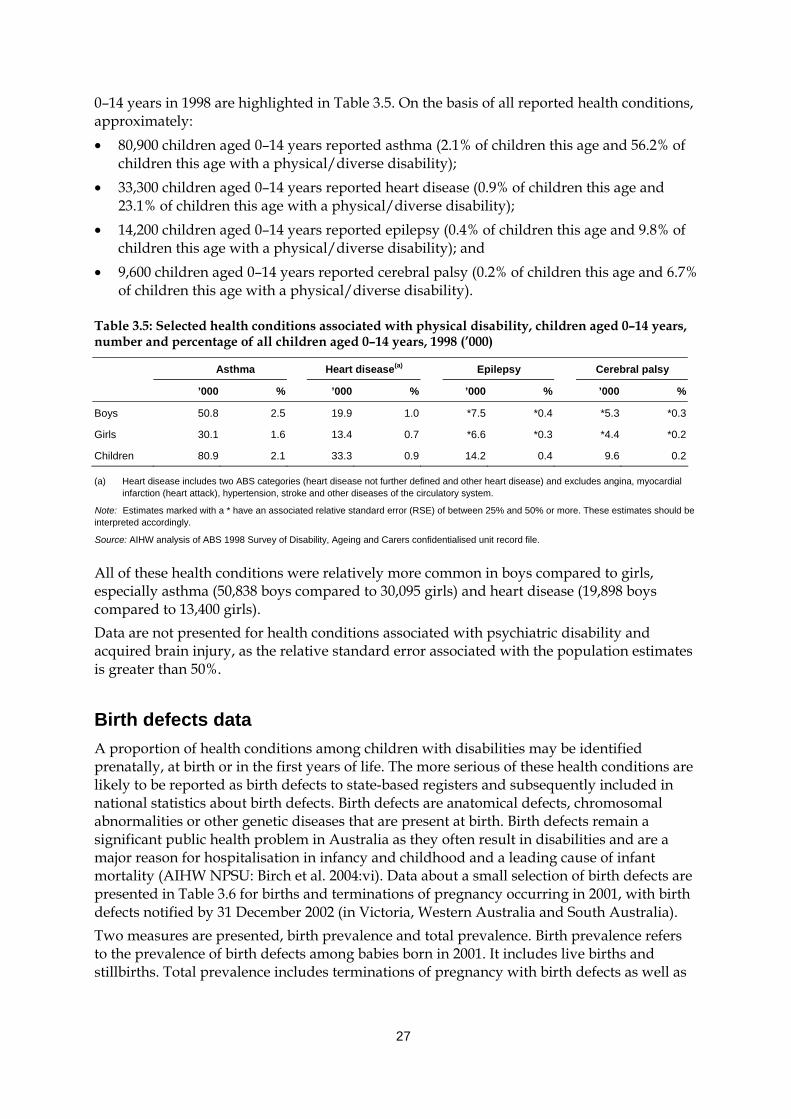
27
0–14 years in 1998 are highlighted in Table 3.5. On the basis of all reported health conditions, approximately: • 80,900 children aged 0–14 years reported asthma (2.1% of children this age and 56.2% of
children this age with a physical/diverse disability); • 33,300 children aged 0–14 years reported heart disease (0.9% of children this age and
23.1% of children this age with a physical/diverse disability); • 14,200 children aged 0–14 years reported epilepsy (0.4% of children this age and 9.8% of
children this age with a physical/diverse disability); and • 9,600 children aged 0–14 years reported cerebral palsy (0.2% of children this age and 6.7%
of children this age with a physical/diverse disability).
Table 3.5: Selected health conditions associated with physical disability, children aged 0–14 years, number and percentage of all children aged 0–14 years, 1998 (’000)
Asthma Heart disease(a) Epilepsy Cerebral palsy
’000 % ’000 % ’000 % ’000 %
Boys 50.8 2.5 19.9 1.0 *7.5 *0.4 *5.3 *0.3
Girls 30.1 1.6 13.4 0.7 *6.6 *0.3 *4.4 *0.2
Children 80.9 2.1 33.3 0.9 14.2 0.4 9.6 0.2
(a) Heart disease includes two ABS categories (heart disease not further defined and other heart disease) and excludes angina, myocardial infarction (heart attack), hypertension, stroke and other diseases of the circulatory system.
Note: Estimates marked with a * have an associated relative standard error (RSE) of between 25% and 50% or more. These estimates should be interpreted accordingly.
Source: AIHW analysis of ABS 1998 Survey of Disability, Ageing and Carers confidentialised unit record file.
All of these health conditions were relatively more common in boys compared to girls, especially asthma (50,838 boys compared to 30,095 girls) and heart disease (19,898 boys compared to 13,400 girls). Data are not presented for health conditions associated with psychiatric disability and acquired brain injury, as the relative standard error associated with the population estimates is greater than 50%.
Birth defects data A proportion of health conditions among children with disabilities may be identified prenatally, at birth or in the first years of life. The more serious of these health conditions are likely to be reported as birth defects to state-based registers and subsequently included in national statistics about birth defects. Birth defects are anatomical defects, chromosomal abnormalities or other genetic diseases that are present at birth. Birth defects remain a significant public health problem in Australia as they often result in disabilities and are a major reason for hospitalisation in infancy and childhood and a leading cause of infant mortality (AIHW NPSU: Birch et al. 2004:vi). Data about a small selection of birth defects are presented in Table 3.6 for births and terminations of pregnancy occurring in 2001, with birth defects notified by 31 December 2002 (in Victoria, Western Australia and South Australia). Two measures are presented, birth prevalence and total prevalence. Birth prevalence refers to the prevalence of birth defects among babies born in 2001. It includes live births and stillbirths. Total prevalence includes terminations of pregnancy with birth defects as well as
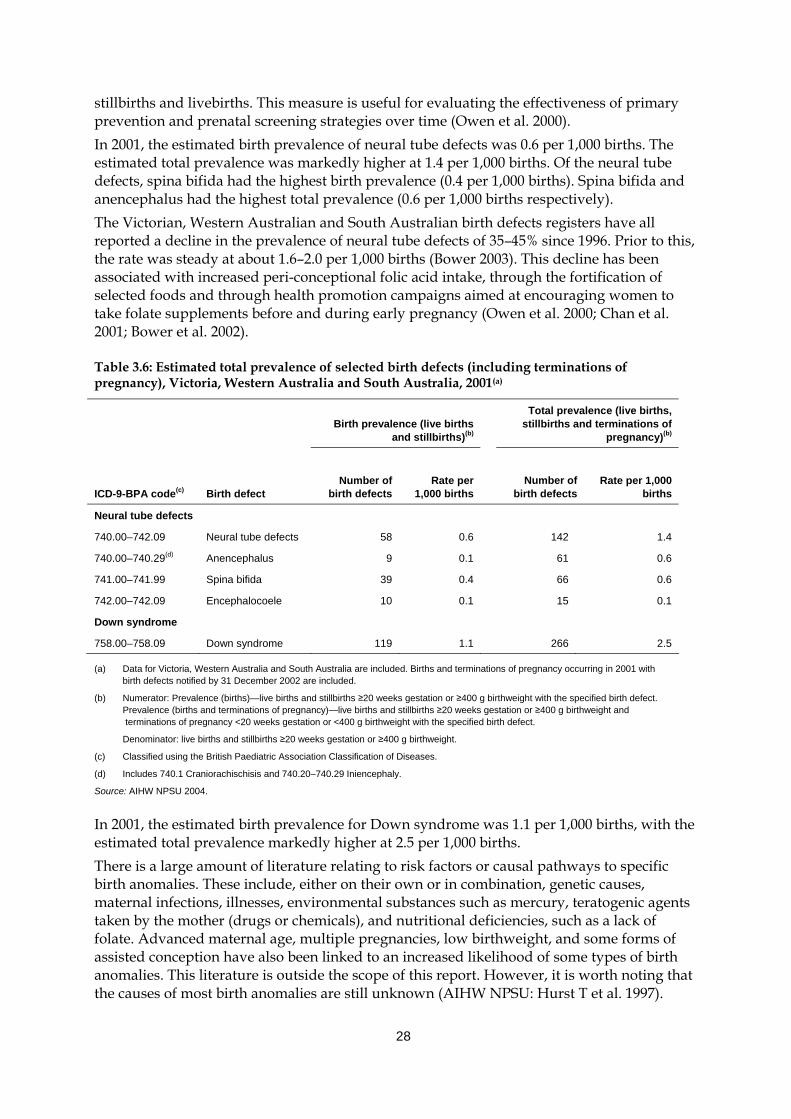
28
stillbirths and livebirths. This measure is useful for evaluating the effectiveness of primary prevention and prenatal screening strategies over time (Owen et al. 2000). In 2001, the estimated birth prevalence of neural tube defects was 0.6 per 1,000 births. The estimated total prevalence was markedly higher at 1.4 per 1,000 births. Of the neural tube defects, spina bifida had the highest birth prevalence (0.4 per 1,000 births). Spina bifida and anencephalus had the highest total prevalence (0.6 per 1,000 births respectively). The Victorian, Western Australian and South Australian birth defects registers have all reported a decline in the prevalence of neural tube defects of 35–45% since 1996. Prior to this, the rate was steady at about 1.6–2.0 per 1,000 births (Bower 2003). This decline has been associated with increased peri-conceptional folic acid intake, through the fortification of selected foods and through health promotion campaigns aimed at encouraging women to take folate supplements before and during early pregnancy (Owen et al. 2000; Chan et al. 2001; Bower et al. 2002).
Table 3.6: Estimated total prevalence of selected birth defects (including terminations of pregnancy), Victoria, Western Australia and South Australia, 2001(a)
Birth prevalence (live births
and stillbirths)(b)
Total prevalence (live births, stillbirths and terminations of
pregnancy)(b)
ICD-9-BPA code(c) Birth defect Number of
birth defects Rate per
1,000 births
Number of birth defects
Rate per 1,000 births
Neural tube defects
740.00–742.09 Neural tube defects 58 0.6 142 1.4
740.00–740.29(d) Anencephalus 9 0.1 61 0.6
741.00–741.99 Spina bifida 39 0.4 66 0.6
742.00–742.09 Encephalocoele 10 0.1 15 0.1
Down syndrome
758.00–758.09 Down syndrome 119 1.1 266 2.5
(a) Data for Victoria, Western Australia and South Australia are included. Births and terminations of pregnancy occurring in 2001 with birth defects notified by 31 December 2002 are included.
(b) Numerator: Prevalence (births)—live births and stillbirths ≥20 weeks gestation or ≥400 g birthweight with the specified birth defect. Prevalence (births and terminations of pregnancy)—live births and stillbirths ≥20 weeks gestation or ≥400 g birthweight and terminations of pregnancy <20 weeks gestation or <400 g birthweight with the specified birth defect.
Denominator: live births and stillbirths ≥20 weeks gestation or ≥400 g birthweight.
(c) Classified using the British Paediatric Association Classification of Diseases.
(d) Includes 740.1 Craniorachischisis and 740.20–740.29 Iniencephaly.
Source: AIHW NPSU 2004.
In 2001, the estimated birth prevalence for Down syndrome was 1.1 per 1,000 births, with the estimated total prevalence markedly higher at 2.5 per 1,000 births. There is a large amount of literature relating to risk factors or causal pathways to specific birth anomalies. These include, either on their own or in combination, genetic causes, maternal infections, illnesses, environmental substances such as mercury, teratogenic agents taken by the mother (drugs or chemicals), and nutritional deficiencies, such as a lack of folate. Advanced maternal age, multiple pregnancies, low birthweight, and some forms of assisted conception have also been linked to an increased likelihood of some types of birth anomalies. This literature is outside the scope of this report. However, it is worth noting that the causes of most birth anomalies are still unknown (AIHW NPSU: Hurst T et al. 1997).
29
3.5 Characteristics of children with disabilities What is known about the prevalence of disability among different population groups in Australia? Does the overall prevalence of disability vary according to the ethnic background of children? Does the prevalence of certain disability groups or health conditions differ among children according to Indigenous status or geographic location? While there is a lack of information in this area, this section presents a brief summary from the literature of what is known about disability in Indigenous children, children of different cultural backgrounds and children in regional and rural settings compared to other children.
Indigenous profile Very little is known about the rate at which Aboriginal and Torres Strait Islander children experience disabilities. In present sample surveys such as the 1998 ABS Survey of Disability, Ageing and Carers, Indigenous people are not identified. The inclusion of an item on disability status in the National Aboriginal and Torres Strait Islander Social Survey will enable a profile of the prevalence of disability amongst Indigenous people; however, the survey is restricted to people aged 15 years and over so no population estimates will be available about the health conditions and disability of children. Plans for a Longitudinal Study of Indigenous Children (LSIC) will assist in future determinations of childhood disability prevalence amongst Indigenous children. Bower et al. (1989) compared the prevalence of congenital malformations in Aboriginal and non-Aboriginal infants born in Western Australia from 1980 to 1987. They found that total malformation rates were similar in the two groups but that there were significant differences in some particular congenital malformations. Aboriginal infants were more likely than non-Aboriginal infants to have microcephaly, several types of congenital heart defect, cleft lip with or without cleft palate and talipes. A number of malformations were less common in Aboriginal infants, namely pyloric stenosis, hypospadias and undescended testes. More recent data on Aboriginal childhood disability are available from the Western Australian Aboriginal Child Health Survey, conducted in 2001 and 2002 by the Telethon Institute for Child Health Research. This survey focused on developmental and environmental factors to describe the prevalence of commonly occurring medical conditions and disabilities, adverse health behaviours (e.g. smoking, substance abuse) and other psychosocial problems (e.g. school leaving, juvenile offending), the impact of common health and mental health problems, and access and use of health care, education, housing, juvenile justice and social services of Aboriginal children living in different regions of Western Australia. A total of 5,289 children aged 0–17 years were surveyed with data collected, depending on information sought, from primary and secondary carers. The prevalence of disability amongst Aboriginal children aged 4–17 years was determined using questions on activity limitation and sensory/speech impairment (Zubrick et al. 2004). An estimated 1.7% of Aboriginal children living in Western Australia were reported to need some sort of physical help when eating, dressing, bathing and/or going to the toilet. While difficulties with mobility could not be determined due to the small number of positive responses, limitation in vigorous activity such as sports was experienced by 4.1% of Aboriginal children. Sensory and speech impairment was investigated in more detail. Of the children aged 4–17 years surveyed:
30
• 8.1% did not have ‘normal’ vision in both eyes. This rate fell from 11.3% in the Perth metropolitan area to 3.1% in areas of ‘extreme’ relative isolation.
• 6.8% did not have ‘normal’ hearing in both ears. Of these children, 49% were deaf or partially unable to hear in one ear only and 24% were deaf or partially unable to hear in both ears.
• 9.8% had trouble saying certain sounds. Amongst children aged 4–11 years, this difficulty was more pronounced in boys (16.5%) than girls (9.9%).
• 8.5% had a speech impairment which prevented other people readily understanding them when they spoke (Zubrick et al. 2004).
For a discussion on the conceptualisation of disability by Indigenous people in the Northern Territory, see Senior 2000.
Cultural and linguistic profile Given the scarcity of data about the prevalence of childhood disability overall, it is not surprising that information about disability among children from various cultural and linguistic backgrounds is also rare. The conceptualisation of disability and the readiness to approach formal services differs across different cultural and ethnic groups. The health screening of potential migrants to Australia, combined with the known tendency for migrants to be in good health when deciding to migrate, probably has the effect of lowering their prevalence of disability (AIHW: Black & Eckerman 1997). Disability types likely to arise from conditions at birth, or the early developmental period, would therefore be expected to be less frequent for the overseas-born population. As a result it is likely that the prevalence of disability amongst overseas-born children living in Australia is correspondingly low. Population data from 1998 for children aged 0–14 years shows almost all children with a disability were born in Australia (99%). Somewhat less, but still the majority, of child consumers receiving CSTDA-funded services between 1 January and 30 June 2003 were also born in Australia (87%) (Table 3.7). A considerably smaller proportion of children were born in EP18 (or English Proficiency 1) countries, which include Canada, Ireland, New Zealand, South Africa, United Kingdom and USA, with even less from other English Proficiency Groups. EP1 countries are those where immigrants score 98% or higher on the English Proficiency Index, and from where there is an immigrant population of 10,000 or more.
8 The 1996 Classification of Countries into English Proficiency Groups places every country into one of
four groups based on the relative English Proficiency (EP) of recent arrivals to Australia from the 1996 census data. An ‘English Proficiency Index’, a standard tool developed by the Bureau of Immigration, Multicultural and Population Research, was used to construct each of the EP groups (see DIMA 1999).
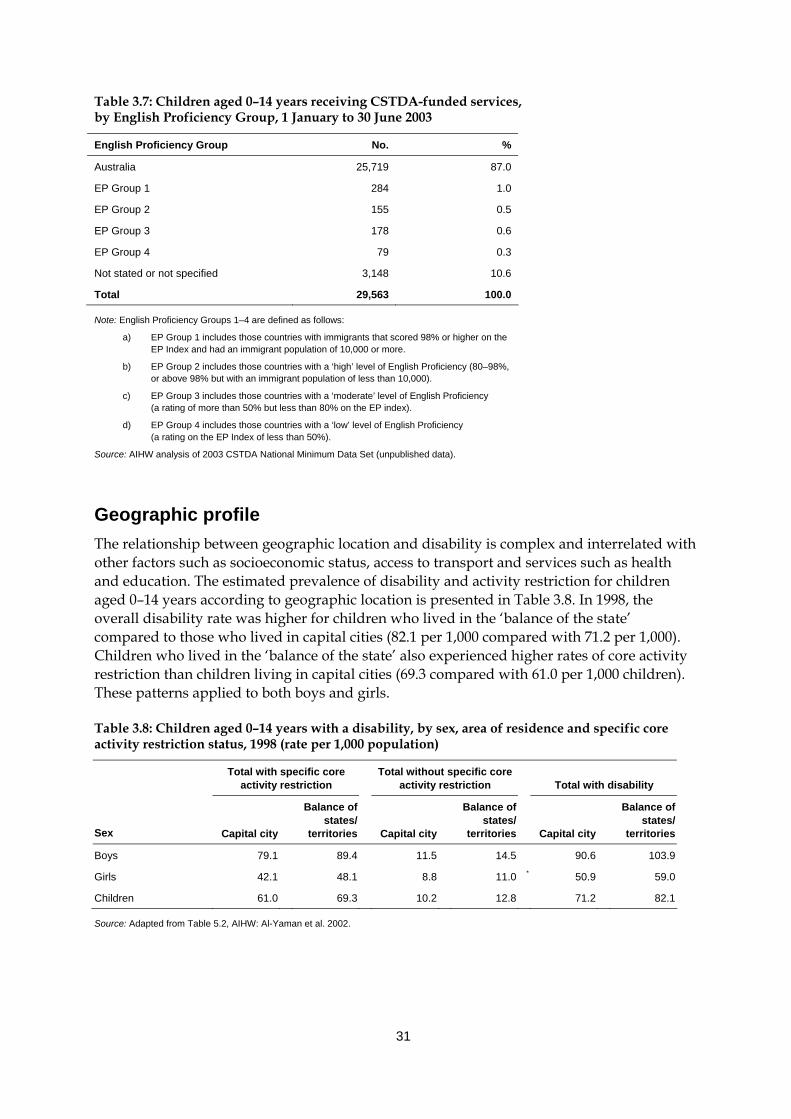
31
Table 3.7: Children aged 0–14 years receiving CSTDA-funded services, by English Proficiency Group, 1 January to 30 June 2003
English Proficiency Group No. %
Australia 25,719 87.0
EP Group 1 284 1.0
EP Group 2 155 0.5
EP Group 3 178 0.6
EP Group 4 79 0.3
Not stated or not specified 3,148 10.6
Total 29,563 100.0
Note: English Proficiency Groups 1–4 are defined as follows:
a) EP Group 1 includes those countries with immigrants that scored 98% or higher on the EP Index and had an immigrant population of 10,000 or more.
b) EP Group 2 includes those countries with a ‘high’ level of English Proficiency (80–98%, or above 98% but with an immigrant population of less than 10,000).
c) EP Group 3 includes those countries with a ‘moderate’ level of English Proficiency (a rating of more than 50% but less than 80% on the EP index).
d) EP Group 4 includes those countries with a ‘low’ level of English Proficiency (a rating on the EP Index of less than 50%).
Source: AIHW analysis of 2003 CSTDA National Minimum Data Set (unpublished data).
Geographic profile The relationship between geographic location and disability is complex and interrelated with other factors such as socioeconomic status, access to transport and services such as health and education. The estimated prevalence of disability and activity restriction for children aged 0–14 years according to geographic location is presented in Table 3.8. In 1998, the overall disability rate was higher for children who lived in the ‘balance of the state’ compared to those who lived in capital cities (82.1 per 1,000 compared with 71.2 per 1,000). Children who lived in the ‘balance of the state’ also experienced higher rates of core activity restriction than children living in capital cities (69.3 compared with 61.0 per 1,000 children). These patterns applied to both boys and girls.
Table 3.8: Children aged 0–14 years with a disability, by sex, area of residence and specific core activity restriction status, 1998 (rate per 1,000 population)
Total with specific core activity restriction
Total without specific core activity restriction Total with disability
Sex Capital city
Balance of states/
territories Capital city
Balance of states/
territories Capital city
Balance of states/
territories
Boys 79.1 89.4 11.5 14.5 90.6 103.9
Girls 42.1 48.1 8.8 11.0 * 50.9 59.0
Children 61.0 69.3 10.2 12.8 71.2 82.1
Source: Adapted from Table 5.2, AIHW: Al-Yaman et al. 2002.
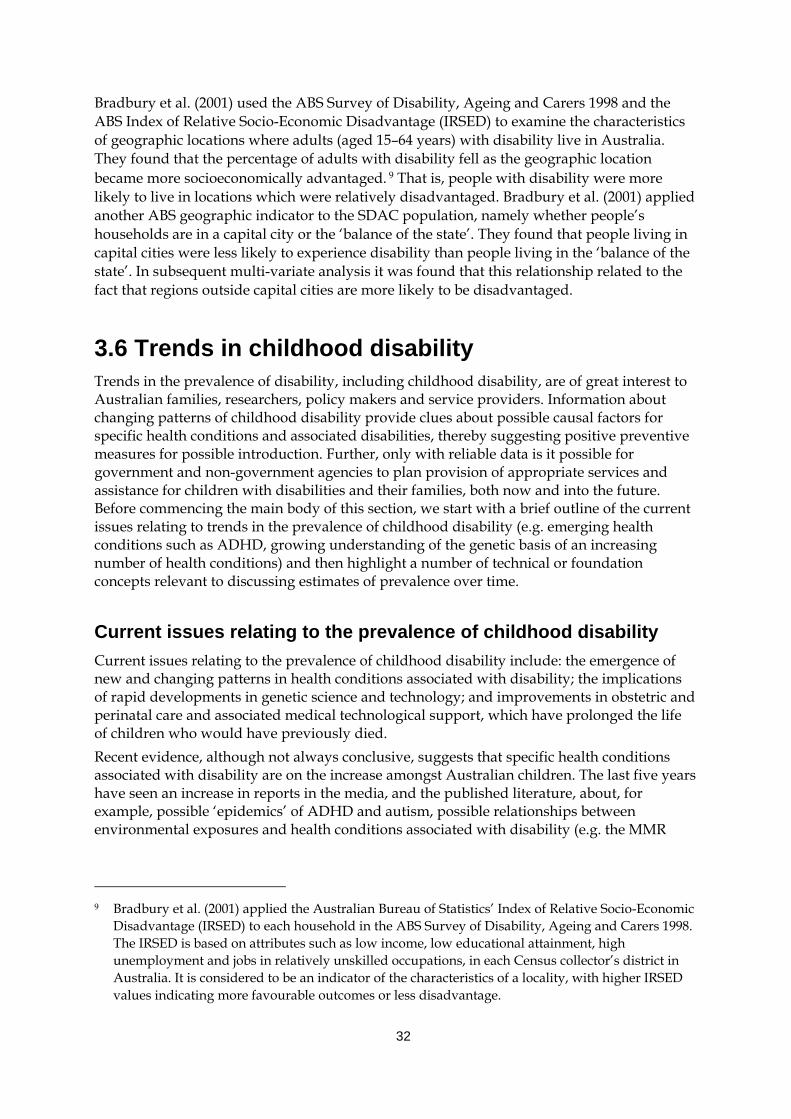
32
Bradbury et al. (2001) used the ABS Survey of Disability, Ageing and Carers 1998 and the ABS Index of Relative Socio-Economic Disadvantage (IRSED) to examine the characteristics of geographic locations where adults (aged 15–64 years) with disability live in Australia. They found that the percentage of adults with disability fell as the geographic location became more socioeconomically advantaged. 9 That is, people with disability were more likely to live in locations which were relatively disadvantaged. Bradbury et al. (2001) applied another ABS geographic indicator to the SDAC population, namely whether people’s households are in a capital city or the ‘balance of the state’. They found that people living in capital cities were less likely to experience disability than people living in the ‘balance of the state’. In subsequent multi-variate analysis it was found that this relationship related to the fact that regions outside capital cities are more likely to be disadvantaged.
3.6 Trends in childhood disability Trends in the prevalence of disability, including childhood disability, are of great interest to Australian families, researchers, policy makers and service providers. Information about changing patterns of childhood disability provide clues about possible causal factors for specific health conditions and associated disabilities, thereby suggesting positive preventive measures for possible introduction. Further, only with reliable data is it possible for government and non-government agencies to plan provision of appropriate services and assistance for children with disabilities and their families, both now and into the future. Before commencing the main body of this section, we start with a brief outline of the current issues relating to trends in the prevalence of childhood disability (e.g. emerging health conditions such as ADHD, growing understanding of the genetic basis of an increasing number of health conditions) and then highlight a number of technical or foundation concepts relevant to discussing estimates of prevalence over time.
Current issues relating to the prevalence of childhood disability Current issues relating to the prevalence of childhood disability include: the emergence of new and changing patterns in health conditions associated with disability; the implications of rapid developments in genetic science and technology; and improvements in obstetric and perinatal care and associated medical technological support, which have prolonged the life of children who would have previously died. Recent evidence, although not always conclusive, suggests that specific health conditions associated with disability are on the increase amongst Australian children. The last five years have seen an increase in reports in the media, and the published literature, about, for example, possible ‘epidemics’ of ADHD and autism, possible relationships between environmental exposures and health conditions associated with disability (e.g. the MMR
9 Bradbury et al. (2001) applied the Australian Bureau of Statistics’ Index of Relative Socio-Economic
Disadvantage (IRSED) to each household in the ABS Survey of Disability, Ageing and Carers 1998. The IRSED is based on attributes such as low income, low educational attainment, high unemployment and jobs in relatively unskilled occupations, in each Census collector’s district in Australia. It is considered to be an indicator of the characteristics of a locality, with higher IRSED values indicating more favourable outcomes or less disadvantage.
33
vaccination and autism10) as well as considerably more interest in environmental factors affecting the lives of children with disabilities (e.g. highly publicised cases where children with disabilities are denied access to a particular school). While there is a lot of interest in disability and increasing interest in the social context of disability, there is often insufficient data to fully support claims. Some chronic diseases and risk factors associated with disability may be on the increase. For example, there is a general acceptance that there was a rise in the proportion of children with asthma in the 1980s and early 1990s (ACAM 2003), although more recent surveys, in Melbourne (Robertson et al. 2004) and Belmont, New South Wales (Toelle et al. 2004), have found no further increase since that time. Current estimates for children show the prevalence estimate of asthma to be around 14–16% (ACAM 2003). The incidence of diabetes is also rising amongst children. For example, between 1983 and the period 2000–02, the incidence of Type 1 diabetes rose from 12.3 per 100,000 to 19–20 per 100,000 (AIHW 2004b; Glatthaar et al. 1988). Risk factors are an additional issue, and a prominent risk factor gaining significant attention is the increase in the number of overweight and obese children in Australia (see, for example, Magarey et al. 2001). One study, which compared rates of overweight and obesity for children in 1969, 1985 and 1997 found the prevalence of overweight to have risen by 60–70% and obesity to have trebled, with most of this increase occurring between 1985 and 1997 (Booth et al. 2003). The potential for long-term health issues, and hence experience of disability, for overweight and obese children is still being investigated and will only be fully realised when these children reach adulthood. Nonetheless, there are strong suggestions that overweight and obese children are doubly at risk of being overweight or obese as adults, and developing coronary heart disease and other adult comorbidities (Must 1996). Some of these health conditions have already been detected in obese children, for example, early signs of atherosclerosis in obese Western Australian children as young as six years (Watts et al. 2004). Conversely, the advent of immunisation programs targeting specific diseases has seen a decline in other health conditions associated with disability. Such programs have resulted, for example, in the eradication of polio (Roche & Spencer 2002) and, more recently, a reduction in the occurrence of rubella (Sullivan et al. 1999), particularly since the introduction of the MMR vaccination schedule (McIntyre et al. 2000; McIntyre et al. 2002). Similarly, the introduction of health campaigns promoting the peri-conceptional intake of folic acid has been associated with a decline in the incidence of neural tube defects (Bower 2003). If childhood disability, or specific childhood disabilities related to health conditions, is increasing (or declining) this has implications for the continuation and extension of appropriate services. Changes to obstetric and perinatal care, and technological improvements, associated with increased survival rates for babies have meant that babies who in the past may not have been expected to live, often do so now. This is particularly apparent for low (<2,500 g) and very low (<1,500 g) birth weight babies. Since such babies are often more likely to have or develop disabilities, this potentially means that more babies born with severe anomalies are surviving to childhood, and sometimes into adulthood. On the other hand, advancements in genetic testing, both of the embryo and foetus, mean parents not only have the option to find out whether their child has a genetic disorder, but to selectively terminate the pregnancy if they
10 The absence of any significant association between autism and the MMR vaccine has since been
found in a number of large epidemiological studies (see, for example, Taylor et al. 1999; Kaye et al. 2001).
34
wish to do so. Both forms of intervention raise serious ethical issues, on the rights of the child and of the parents, and the perception of disability in the current world (see a brief review in AIHW 2003d).
Measuring the prevalence of childhood disability over time Given the varying ways in which the concept of disability can be defined and operationalised, it is a very complex task to compare the prevalence of childhood disability, both over time and in different countries or locations. This section focuses predominantly on Australian population data to explore what is known about trends in childhood disability and associated health conditions over time. The complicated task of fully exploring international literature about overall trends in childhood disability is not attempted in this report. Further, while there is a lot of interest in causes of or risk factors for health conditions likely to be associated with disability, this report does not attempt to explore this area. At any point in time, the underlying prevalence of disability is determined by the combined effect of a range of factors. These include past and recent incidence, remission rates for diseases, rehabilitation rates, age at onset of disability and survival rates of people with disability and of the general population (AIHW 2003b: Chapter 8.1). A host of environmental factors also influence the extent to which health conditions, impairments, activity limitations or participation restrictions are experienced by individuals as disability. For example, changes to legislation relating to transport or building codes can diminish or eliminate activity limitations and participation restrictions often associated with physical disability, and changes in social attitudes towards people with certain health conditions (e.g. HIV/AIDS) can prevent participation restriction and associated disability. A discussion of the environmental factors possibly influencing the prevalence or severity of childhood disability is included in Chapter 4 on children and their families and carers and Chapter 5 on services and assistance. In addition to factors affecting the underlying prevalence of disability, there are factors that may influence the reported prevalence of disability, even when the underlying prevalence rates may not have changed. These factors include changes in community perceptions and awareness of disability and certain health conditions, economic incentives surrounding the reporting of disability and health conditions, and changes in survey methodology. These factors are most likely to affect the prevalence rates of mild and moderate disability, rather than more severe disability (AIHW 2003b: Chapter 8.1).
Australian population data This section draws on population data from the Australian Bureau of Statistics disability surveys conducted in 1981, 1988, 1993 and 1998. 11 The reported prevalence of disability among children aged 0–14 years was relatively stable across the 1981, 1988 and 1993 surveys, before increasing between 1993 and 1998 (Table 3.9, Figure 3.4).
11 While summary data from the 2003 Survey of Disability, Ageing and Carers (SDAC) were available
at the time of finalising this report, the detailed Confidentialised Unit Record File (CURF), required to repeat the analysis presented elsewhere in this report, was not. The 2003 SDAC, which largely retained the 1998 questions, found that there was no significant increase in the rate of disability among children aged 0–14 years between 1998 and 2003, or in the rate of profound or severe core activity restriction among children of this age (ABS 2004).
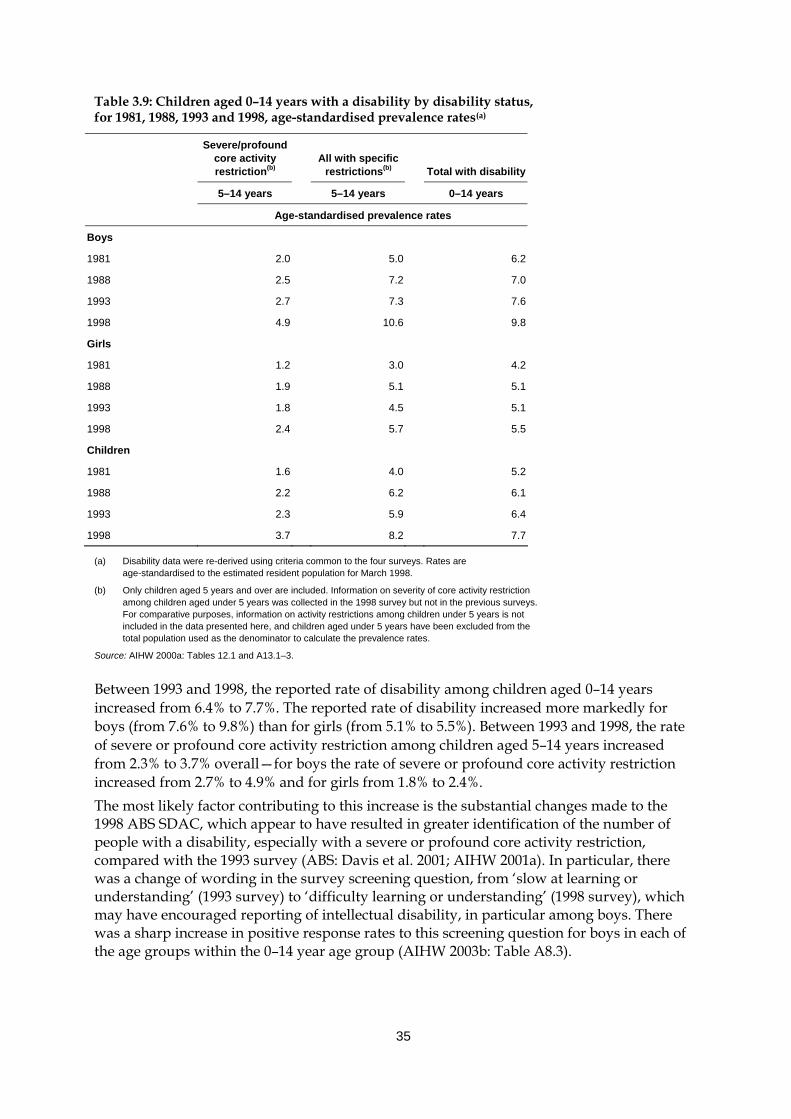
35
Table 3.9: Children aged 0–14 years with a disability by disability status, for 1981, 1988, 1993 and 1998, age-standardised prevalence rates(a)
Severe/profound core activity restriction(b)
All with specific
restrictions(b)
Total with disability
5–14 years 5–14 years 0–14 years
Age-standardised prevalence rates
Boys
1981 2.0 5.0 6.2
1988 2.5 7.2 7.0
1993 2.7 7.3 7.6
1998 4.9 10.6 9.8
Girls
1981 1.2 3.0 4.2
1988 1.9 5.1 5.1
1993 1.8 4.5 5.1
1998 2.4 5.7 5.5
Children
1981 1.6 4.0 5.2
1988 2.2 6.2 6.1
1993 2.3 5.9 6.4
1998 3.7 8.2 7.7
(a) Disability data were re-derived using criteria common to the four surveys. Rates are age-standardised to the estimated resident population for March 1998.
(b) Only children aged 5 years and over are included. Information on severity of core activity restriction among children aged under 5 years was collected in the 1998 survey but not in the previous surveys. For comparative purposes, information on activity restrictions among children under 5 years is not included in the data presented here, and children aged under 5 years have been excluded from the total population used as the denominator to calculate the prevalence rates.
Source: AIHW 2000a: Tables 12.1 and A13.1–3.
Between 1993 and 1998, the reported rate of disability among children aged 0–14 years increased from 6.4% to 7.7%. The reported rate of disability increased more markedly for boys (from 7.6% to 9.8%) than for girls (from 5.1% to 5.5%). Between 1993 and 1998, the rate of severe or profound core activity restriction among children aged 5–14 years increased from 2.3% to 3.7% overall—for boys the rate of severe or profound core activity restriction increased from 2.7% to 4.9% and for girls from 1.8% to 2.4%. The most likely factor contributing to this increase is the substantial changes made to the 1998 ABS SDAC, which appear to have resulted in greater identification of the number of people with a disability, especially with a severe or profound core activity restriction, compared with the 1993 survey (ABS: Davis et al. 2001; AIHW 2001a). In particular, there was a change of wording in the survey screening question, from ‘slow at learning or understanding’ (1993 survey) to ‘difficulty learning or understanding’ (1998 survey), which may have encouraged reporting of intellectual disability, in particular among boys. There was a sharp increase in positive response rates to this screening question for boys in each of the age groups within the 0–14 year age group (AIHW 2003b: Table A8.3).
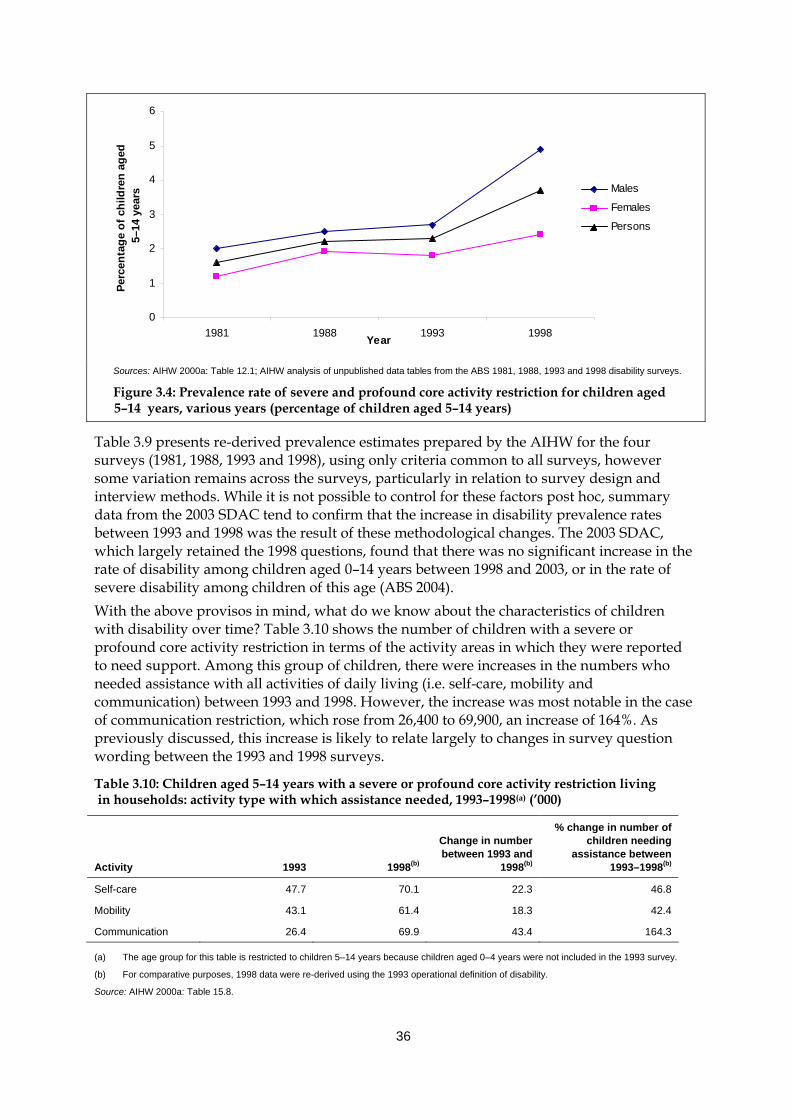
36
0
1
2
3
4
5
6
1981 1988 1993 1998Year
Perc
enta
ge o
f chi
ldre
n ag
ed5–
14 y
ears Males
Females
Persons
Sources: AIHW 2000a: Table 12.1; AIHW analysis of unpublished data tables from the ABS 1981, 1988, 1993 and 1998 disability surveys.
Figure 3.4: Prevalence rate of severe and profound core activity restriction for children aged 5–14 years, various years (percentage of children aged 5–14 years)
Table 3.9 presents re-derived prevalence estimates prepared by the AIHW for the four surveys (1981, 1988, 1993 and 1998), using only criteria common to all surveys, however some variation remains across the surveys, particularly in relation to survey design and interview methods. While it is not possible to control for these factors post hoc, summary data from the 2003 SDAC tend to confirm that the increase in disability prevalence rates between 1993 and 1998 was the result of these methodological changes. The 2003 SDAC, which largely retained the 1998 questions, found that there was no significant increase in the rate of disability among children aged 0–14 years between 1998 and 2003, or in the rate of severe disability among children of this age (ABS 2004). With the above provisos in mind, what do we know about the characteristics of children with disability over time? Table 3.10 shows the number of children with a severe or profound core activity restriction in terms of the activity areas in which they were reported to need support. Among this group of children, there were increases in the numbers who needed assistance with all activities of daily living (i.e. self-care, mobility and communication) between 1993 and 1998. However, the increase was most notable in the case of communication restriction, which rose from 26,400 to 69,900, an increase of 164%. As previously discussed, this increase is likely to relate largely to changes in survey question wording between the 1993 and 1998 surveys.
Table 3.10: Children aged 5–14 years with a severe or profound core activity restriction living in households: activity type with which assistance needed, 1993–1998(a) (’000)
Activity
1993 1998(b)
Change in number between 1993 and
1998(b)
% change in number of children needing
assistance between 1993–1998(b)
Self-care 47.7 70.1 22.3 46.8
Mobility 43.1 61.4 18.3 42.4
Communication 26.4 69.9 43.4 164.3
(a) The age group for this table is restricted to children 5–14 years because children aged 0–4 years were not included in the 1993 survey.
(b) For comparative purposes, 1998 data were re-derived using the 1993 operational definition of disability.
Source: AIHW 2000a: Table 15.8.
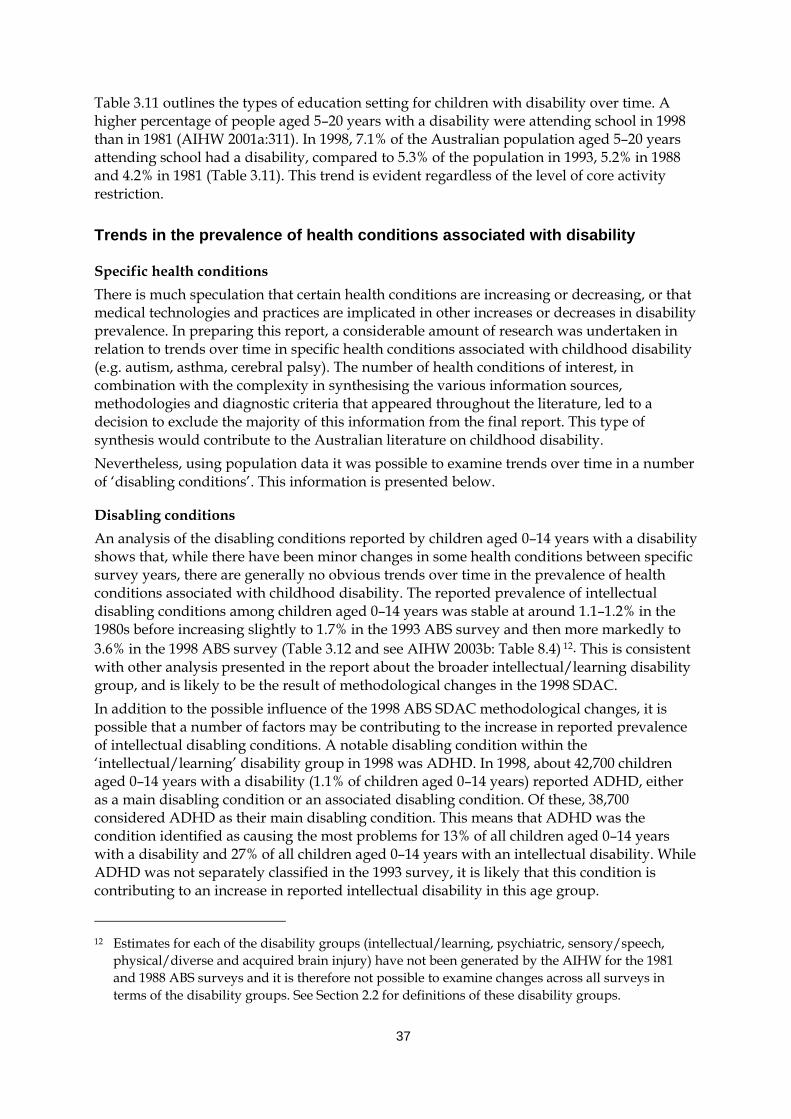
37
Table 3.11 outlines the types of education setting for children with disability over time. A higher percentage of people aged 5–20 years with a disability were attending school in 1998 than in 1981 (AIHW 2001a:311). In 1998, 7.1% of the Australian population aged 5–20 years attending school had a disability, compared to 5.3% of the population in 1993, 5.2% in 1988 and 4.2% in 1981 (Table 3.11). This trend is evident regardless of the level of core activity restriction.
Trends in the prevalence of health conditions associated with disability
Specific health conditions There is much speculation that certain health conditions are increasing or decreasing, or that medical technologies and practices are implicated in other increases or decreases in disability prevalence. In preparing this report, a considerable amount of research was undertaken in relation to trends over time in specific health conditions associated with childhood disability (e.g. autism, asthma, cerebral palsy). The number of health conditions of interest, in combination with the complexity in synthesising the various information sources, methodologies and diagnostic criteria that appeared throughout the literature, led to a decision to exclude the majority of this information from the final report. This type of synthesis would contribute to the Australian literature on childhood disability. Nevertheless, using population data it was possible to examine trends over time in a number of ‘disabling conditions’. This information is presented below.
Disabling conditions An analysis of the disabling conditions reported by children aged 0–14 years with a disability shows that, while there have been minor changes in some health conditions between specific survey years, there are generally no obvious trends over time in the prevalence of health conditions associated with childhood disability. The reported prevalence of intellectual disabling conditions among children aged 0–14 years was stable at around 1.1–1.2% in the 1980s before increasing slightly to 1.7% in the 1993 ABS survey and then more markedly to 3.6% in the 1998 ABS survey (Table 3.12 and see AIHW 2003b: Table 8.4) 12. This is consistent with other analysis presented in the report about the broader intellectual/learning disability group, and is likely to be the result of methodological changes in the 1998 SDAC. In addition to the possible influence of the 1998 ABS SDAC methodological changes, it is possible that a number of factors may be contributing to the increase in reported prevalence of intellectual disabling conditions. A notable disabling condition within the ‘intellectual/learning’ disability group in 1998 was ADHD. In 1998, about 42,700 children aged 0–14 years with a disability (1.1% of children aged 0–14 years) reported ADHD, either as a main disabling condition or an associated disabling condition. Of these, 38,700 considered ADHD as their main disabling condition. This means that ADHD was the condition identified as causing the most problems for 13% of all children aged 0–14 years with a disability and 27% of all children aged 0–14 years with an intellectual disability. While ADHD was not separately classified in the 1993 survey, it is likely that this condition is contributing to an increase in reported intellectual disability in this age group.
12 Estimates for each of the disability groups (intellectual/learning, psychiatric, sensory/speech,
physical/diverse and acquired brain injury) have not been generated by the AIHW for the 1981 and 1988 ABS surveys and it is therefore not possible to examine changes across all surveys in terms of the disability groups. See Section 2.2 for definitions of these disability groups.
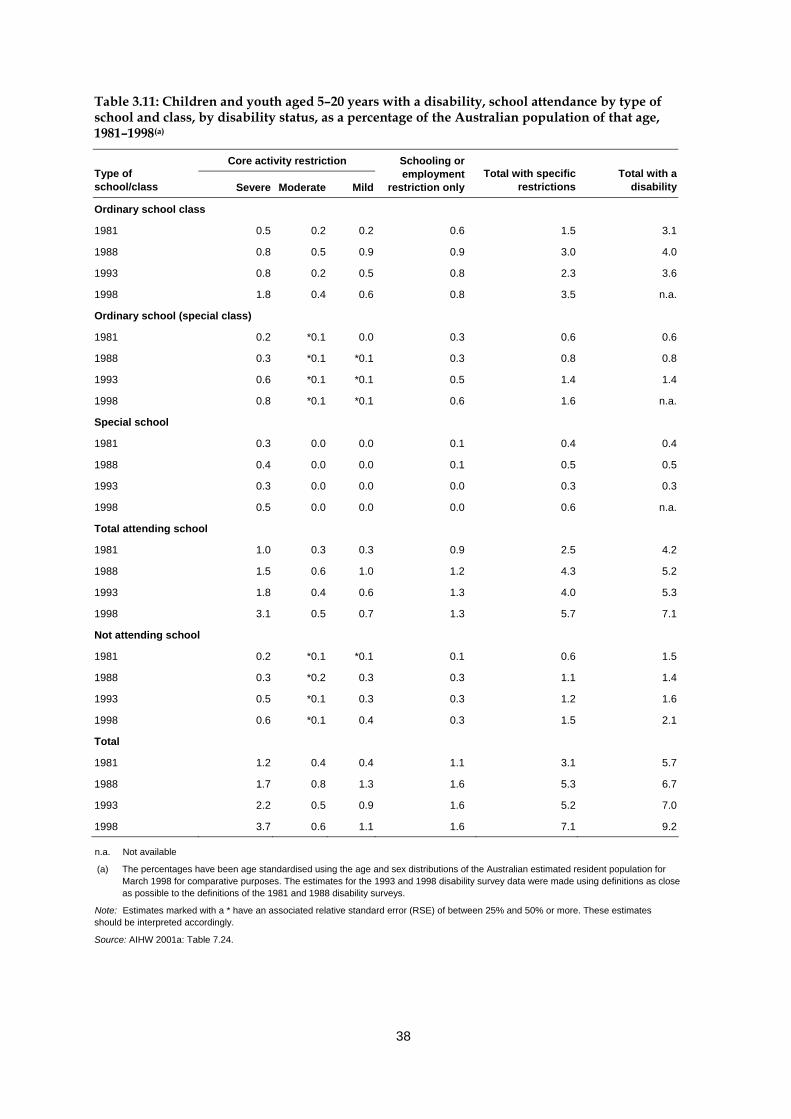
38
Table 3.11: Children and youth aged 5–20 years with a disability, school attendance by type of school and class, by disability status, as a percentage of the Australian population of that age, 1981–1998(a)
Core activity restriction Type of school/class Severe Moderate Mild
Schooling or employment
restriction only Total with specific
restrictions Total with a
disability
Ordinary school class
1981 0.5 0.2 0.2 0.6 1.5 3.1
1988 0.8 0.5 0.9 0.9 3.0 4.0
1993 0.8 0.2 0.5 0.8 2.3 3.6
1998 1.8 0.4 0.6 0.8 3.5 n.a.
Ordinary school (special class)
1981 0.2 *0.1 0.0 0.3 0.6 0.6
1988 0.3 *0.1 *0.1 0.3 0.8 0.8
1993 0.6 *0.1 *0.1 0.5 1.4 1.4
1998 0.8 *0.1 *0.1 0.6 1.6 n.a.
Special school
1981 0.3 0.0 0.0 0.1 0.4 0.4
1988 0.4 0.0 0.0 0.1 0.5 0.5
1993 0.3 0.0 0.0 0.0 0.3 0.3
1998 0.5 0.0 0.0 0.0 0.6 n.a.
Total attending school
1981 1.0 0.3 0.3 0.9 2.5 4.2
1988 1.5 0.6 1.0 1.2 4.3 5.2
1993 1.8 0.4 0.6 1.3 4.0 5.3
1998 3.1 0.5 0.7 1.3 5.7 7.1
Not attending school
1981 0.2 *0.1 *0.1 0.1 0.6 1.5
1988 0.3 *0.2 0.3 0.3 1.1 1.4
1993 0.5 *0.1 0.3 0.3 1.2 1.6
1998 0.6 *0.1 0.4 0.3 1.5 2.1
Total
1981 1.2 0.4 0.4 1.1 3.1 5.7
1988 1.7 0.8 1.3 1.6 5.3 6.7
1993 2.2 0.5 0.9 1.6 5.2 7.0
1998 3.7 0.6 1.1 1.6 7.1 9.2
n.a. Not available
(a) The percentages have been age standardised using the age and sex distributions of the Australian estimated resident population for March 1998 for comparative purposes. The estimates for the 1993 and 1998 disability survey data were made using definitions as close as possible to the definitions of the 1981 and 1988 disability surveys.
Note: Estimates marked with a * have an associated relative standard error (RSE) of between 25% and 50% or more. These estimates should be interpreted accordingly.
Source: AIHW 2001a: Table 7.24.
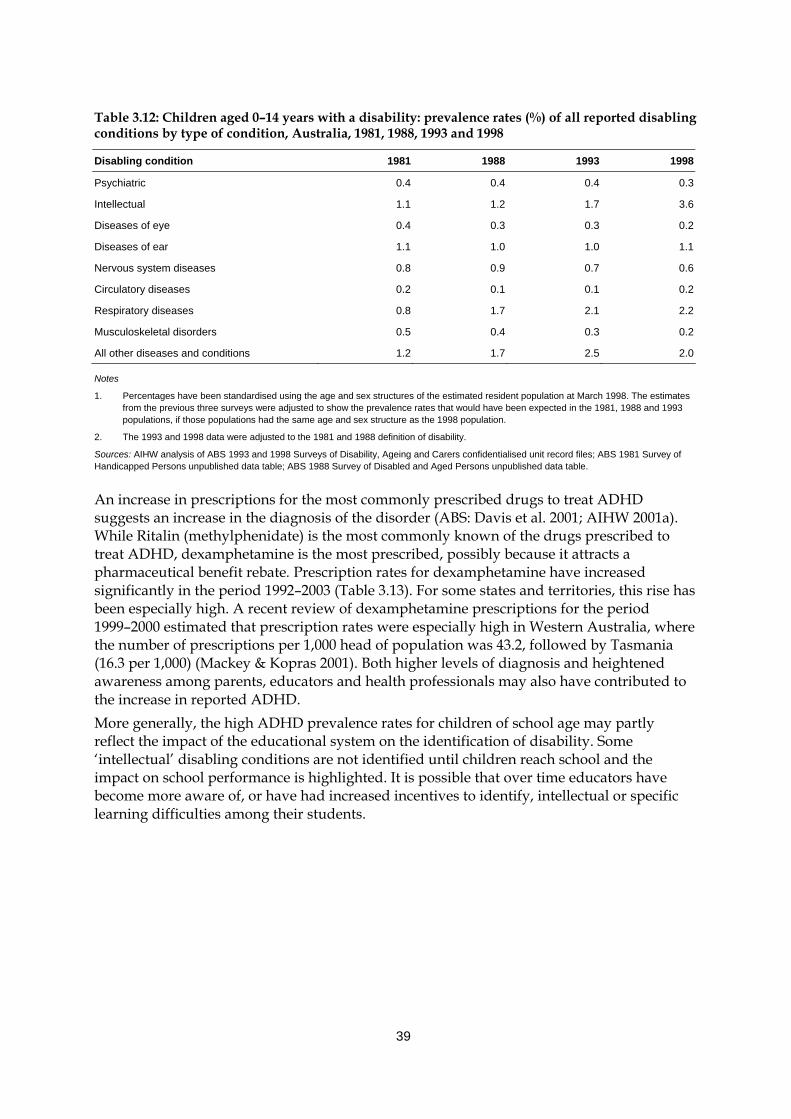
39
Table 3.12: Children aged 0–14 years with a disability: prevalence rates (%) of all reported disabling conditions by type of condition, Australia, 1981, 1988, 1993 and 1998
Disabling condition 1981 1988 1993 1998
Psychiatric 0.4 0.4 0.4 0.3
Intellectual 1.1 1.2 1.7 3.6
Diseases of eye 0.4 0.3 0.3 0.2
Diseases of ear 1.1 1.0 1.0 1.1
Nervous system diseases 0.8 0.9 0.7 0.6
Circulatory diseases 0.2 0.1 0.1 0.2
Respiratory diseases 0.8 1.7 2.1 2.2
Musculoskeletal disorders 0.5 0.4 0.3 0.2
All other diseases and conditions 1.2 1.7 2.5 2.0
Notes
1. Percentages have been standardised using the age and sex structures of the estimated resident population at March 1998. The estimates from the previous three surveys were adjusted to show the prevalence rates that would have been expected in the 1981, 1988 and 1993 populations, if those populations had the same age and sex structure as the 1998 population.
2. The 1993 and 1998 data were adjusted to the 1981 and 1988 definition of disability.
Sources: AIHW analysis of ABS 1993 and 1998 Surveys of Disability, Ageing and Carers confidentialised unit record files; ABS 1981 Survey of Handicapped Persons unpublished data table; ABS 1988 Survey of Disabled and Aged Persons unpublished data table.
An increase in prescriptions for the most commonly prescribed drugs to treat ADHD suggests an increase in the diagnosis of the disorder (ABS: Davis et al. 2001; AIHW 2001a). While Ritalin (methylphenidate) is the most commonly known of the drugs prescribed to treat ADHD, dexamphetamine is the most prescribed, possibly because it attracts a pharmaceutical benefit rebate. Prescription rates for dexamphetamine have increased significantly in the period 1992–2003 (Table 3.13). For some states and territories, this rise has been especially high. A recent review of dexamphetamine prescriptions for the period 1999–2000 estimated that prescription rates were especially high in Western Australia, where the number of prescriptions per 1,000 head of population was 43.2, followed by Tasmania (16.3 per 1,000) (Mackey & Kopras 2001). Both higher levels of diagnosis and heightened awareness among parents, educators and health professionals may also have contributed to the increase in reported ADHD. More generally, the high ADHD prevalence rates for children of school age may partly reflect the impact of the educational system on the identification of disability. Some ‘intellectual’ disabling conditions are not identified until children reach school and the impact on school performance is highlighted. It is possible that over time educators have become more aware of, or have had increased incentives to identify, intellectual or specific learning difficulties among their students.
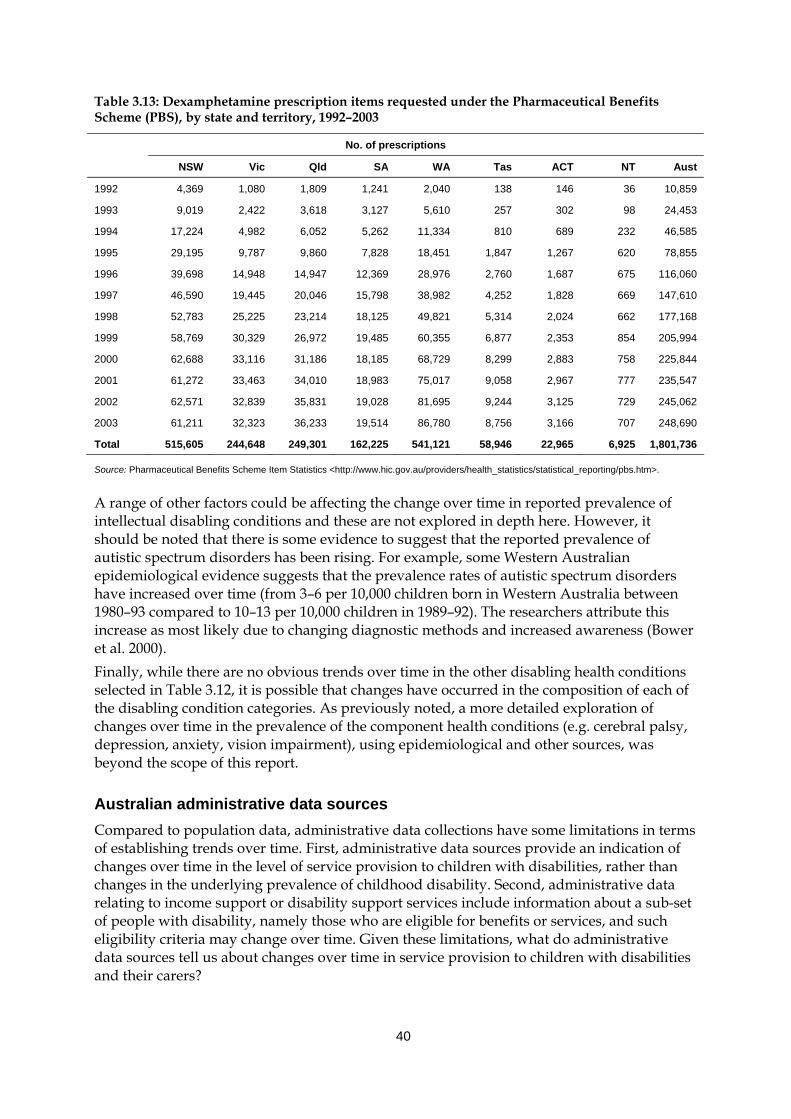
40
Table 3.13: Dexamphetamine prescription items requested under the Pharmaceutical Benefits Scheme (PBS), by state and territory, 1992–2003
No. of prescriptions
NSW Vic Qld SA WA Tas ACT NT Aust
1992 4,369 1,080 1,809 1,241 2,040 138 146 36 10,859
1993 9,019 2,422 3,618 3,127 5,610 257 302 98 24,453
1994 17,224 4,982 6,052 5,262 11,334 810 689 232 46,585
1995 29,195 9,787 9,860 7,828 18,451 1,847 1,267 620 78,855
1996 39,698 14,948 14,947 12,369 28,976 2,760 1,687 675 116,060
1997 46,590 19,445 20,046 15,798 38,982 4,252 1,828 669 147,610
1998 52,783 25,225 23,214 18,125 49,821 5,314 2,024 662 177,168
1999 58,769 30,329 26,972 19,485 60,355 6,877 2,353 854 205,994
2000 62,688 33,116 31,186 18,185 68,729 8,299 2,883 758 225,844
2001 61,272 33,463 34,010 18,983 75,017 9,058 2,967 777 235,547
2002 62,571 32,839 35,831 19,028 81,695 9,244 3,125 729 245,062
2003 61,211 32,323 36,233 19,514 86,780 8,756 3,166 707 248,690
Total 515,605 244,648 249,301 162,225 541,121 58,946 22,965 6,925 1,801,736
Source: Pharmaceutical Benefits Scheme Item Statistics <http://www.hic.gov.au/providers/health_statistics/statistical_reporting/pbs.htm>.
A range of other factors could be affecting the change over time in reported prevalence of intellectual disabling conditions and these are not explored in depth here. However, it should be noted that there is some evidence to suggest that the reported prevalence of autistic spectrum disorders has been rising. For example, some Western Australian epidemiological evidence suggests that the prevalence rates of autistic spectrum disorders have increased over time (from 3–6 per 10,000 children born in Western Australia between 1980–93 compared to 10–13 per 10,000 children in 1989–92). The researchers attribute this increase as most likely due to changing diagnostic methods and increased awareness (Bower et al. 2000). Finally, while there are no obvious trends over time in the other disabling health conditions selected in Table 3.12, it is possible that changes have occurred in the composition of each of the disabling condition categories. As previously noted, a more detailed exploration of changes over time in the prevalence of the component health conditions (e.g. cerebral palsy, depression, anxiety, vision impairment), using epidemiological and other sources, was beyond the scope of this report.
Australian administrative data sources Compared to population data, administrative data collections have some limitations in terms of establishing trends over time. First, administrative data sources provide an indication of changes over time in the level of service provision to children with disabilities, rather than changes in the underlying prevalence of childhood disability. Second, administrative data relating to income support or disability support services include information about a sub-set of people with disability, namely those who are eligible for benefits or services, and such eligibility criteria may change over time. Given these limitations, what do administrative data sources tell us about changes over time in service provision to children with disabilities and their carers?
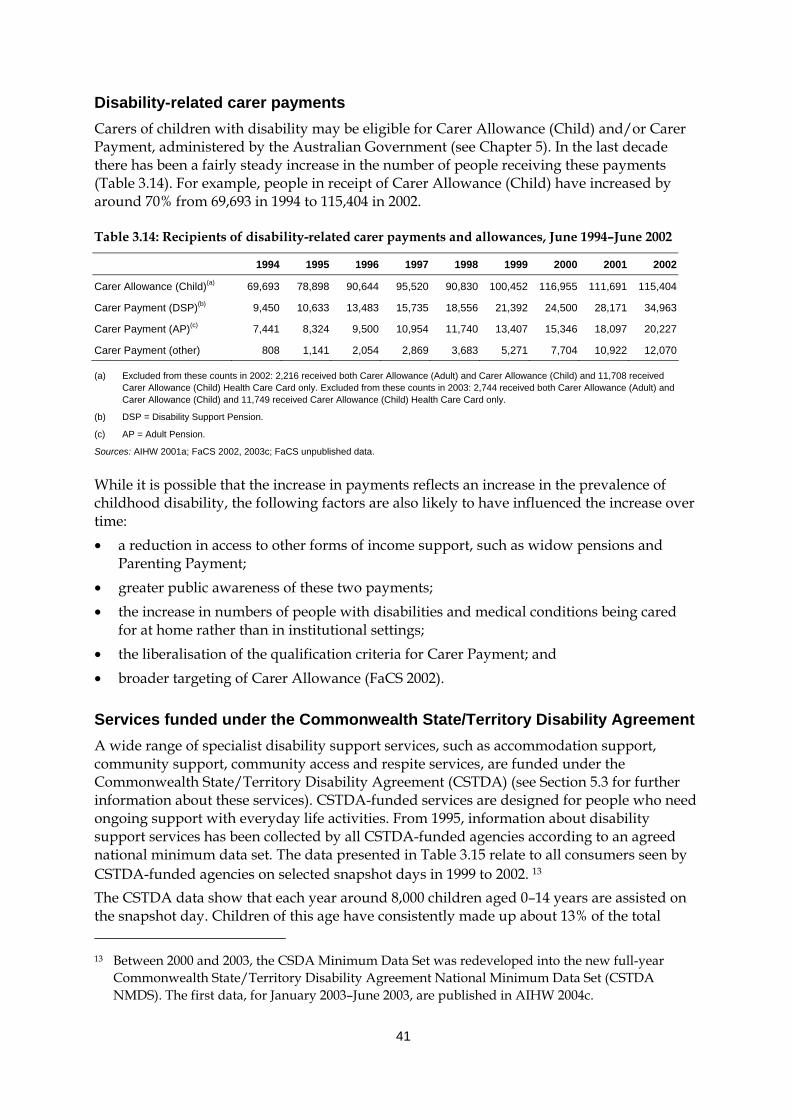
41
Disability-related carer payments Carers of children with disability may be eligible for Carer Allowance (Child) and/or Carer Payment, administered by the Australian Government (see Chapter 5). In the last decade there has been a fairly steady increase in the number of people receiving these payments (Table 3.14). For example, people in receipt of Carer Allowance (Child) have increased by around 70% from 69,693 in 1994 to 115,404 in 2002.
Table 3.14: Recipients of disability-related carer payments and allowances, June 1994–June 2002
1994 1995 1996 1997 1998 1999 2000 2001 2002
Carer Allowance (Child)(a) 69,693 78,898 90,644 95,520 90,830 100,452 116,955 111,691 115,404
Carer Payment (DSP)(b) 9,450 10,633 13,483 15,735 18,556 21,392 24,500 28,171 34,963
Carer Payment (AP)(c) 7,441 8,324 9,500 10,954 11,740 13,407 15,346 18,097 20,227
Carer Payment (other) 808 1,141 2,054 2,869 3,683 5,271 7,704 10,922 12,070
(a) Excluded from these counts in 2002: 2,216 received both Carer Allowance (Adult) and Carer Allowance (Child) and 11,708 received Carer Allowance (Child) Health Care Card only. Excluded from these counts in 2003: 2,744 received both Carer Allowance (Adult) and Carer Allowance (Child) and 11,749 received Carer Allowance (Child) Health Care Card only.
(b) DSP = Disability Support Pension.
(c) AP = Adult Pension.
Sources: AIHW 2001a; FaCS 2002, 2003c; FaCS unpublished data.
While it is possible that the increase in payments reflects an increase in the prevalence of childhood disability, the following factors are also likely to have influenced the increase over time: • a reduction in access to other forms of income support, such as widow pensions and
Parenting Payment; • greater public awareness of these two payments; • the increase in numbers of people with disabilities and medical conditions being cared
for at home rather than in institutional settings; • the liberalisation of the qualification criteria for Carer Payment; and • broader targeting of Carer Allowance (FaCS 2002).
Services funded under the Commonwealth State/Territory Disability Agreement A wide range of specialist disability support services, such as accommodation support, community support, community access and respite services, are funded under the Commonwealth State/Territory Disability Agreement (CSTDA) (see Section 5.3 for further information about these services). CSTDA-funded services are designed for people who need ongoing support with everyday life activities. From 1995, information about disability support services has been collected by all CSTDA-funded agencies according to an agreed national minimum data set. The data presented in Table 3.15 relate to all consumers seen by CSTDA-funded agencies on selected snapshot days in 1999 to 2002. 13 The CSTDA data show that each year around 8,000 children aged 0–14 years are assisted on the snapshot day. Children of this age have consistently made up about 13% of the total 13 Between 2000 and 2003, the CSDA Minimum Data Set was redeveloped into the new full-year
Commonwealth State/Territory Disability Agreement National Minimum Data Set (CSTDA NMDS). The first data, for January 2003–June 2003, are published in AIHW 2004c.
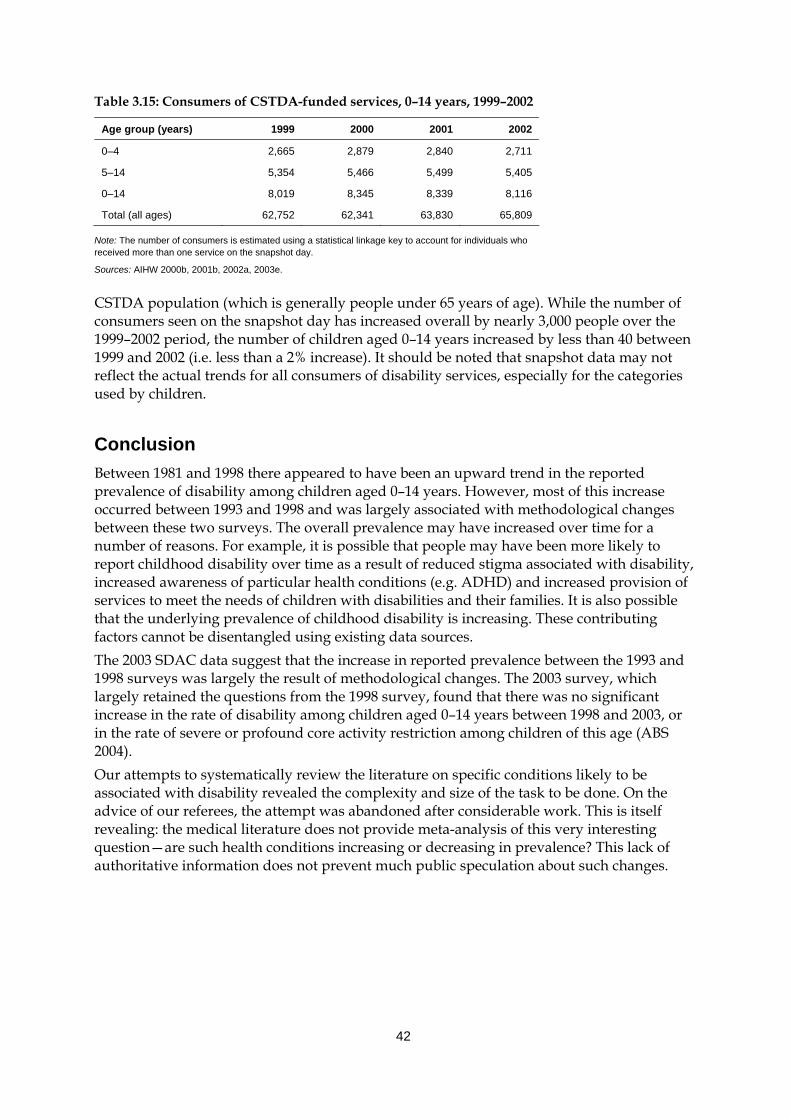
42
Table 3.15: Consumers of CSTDA-funded services, 0–14 years, 1999–2002
Age group (years) 1999 2000 2001 2002
0–4 2,665 2,879 2,840 2,711
5–14 5,354 5,466 5,499 5,405
0–14 8,019 8,345 8,339 8,116
Total (all ages) 62,752 62,341 63,830 65,809
Note: The number of consumers is estimated using a statistical linkage key to account for individuals who received more than one service on the snapshot day.
Sources: AIHW 2000b, 2001b, 2002a, 2003e.
CSTDA population (which is generally people under 65 years of age). While the number of consumers seen on the snapshot day has increased overall by nearly 3,000 people over the 1999–2002 period, the number of children aged 0–14 years increased by less than 40 between 1999 and 2002 (i.e. less than a 2% increase). It should be noted that snapshot data may not reflect the actual trends for all consumers of disability services, especially for the categories used by children.
Conclusion Between 1981 and 1998 there appeared to have been an upward trend in the reported prevalence of disability among children aged 0–14 years. However, most of this increase occurred between 1993 and 1998 and was largely associated with methodological changes between these two surveys. The overall prevalence may have increased over time for a number of reasons. For example, it is possible that people may have been more likely to report childhood disability over time as a result of reduced stigma associated with disability, increased awareness of particular health conditions (e.g. ADHD) and increased provision of services to meet the needs of children with disabilities and their families. It is also possible that the underlying prevalence of childhood disability is increasing. These contributing factors cannot be disentangled using existing data sources. The 2003 SDAC data suggest that the increase in reported prevalence between the 1993 and 1998 surveys was largely the result of methodological changes. The 2003 survey, which largely retained the questions from the 1998 survey, found that there was no significant increase in the rate of disability among children aged 0–14 years between 1998 and 2003, or in the rate of severe or profound core activity restriction among children of this age (ABS 2004). Our attempts to systematically review the literature on specific conditions likely to be associated with disability revealed the complexity and size of the task to be done. On the advice of our referees, the attempt was abandoned after considerable work. This is itself revealing: the medical literature does not provide meta-analysis of this very interesting question—are such health conditions increasing or decreasing in prevalence? This lack of authoritative information does not prevent much public speculation about such changes.
43
4 Families and carers
4.1 Introduction The trend away from institutional living towards in-home care has seen children with disabilities living and being cared for in their own homes with their families. This has generally been accompanied by the responsibility of care transferring to family members, usually the mother, with varying degrees of access to more formal forms of support. This chapter starts with a brief discussion of the literature relating to characteristics of families of children with disabilities (Section 4.2), before outlining some of the reported family effects of childhood disability (Section 4.3). Section 4.4 closes with an exploration of the characteristics of carers of children with disabilities, based predominantly on population data. Unlike other chapters in this report, with the exception of Section 4.4, this chapter relies on the research literature to describe the experience of families and carers of children with disabilities. While Australian researchers are beginning to investigate this area, most of the available published work comes from studies conducted in the United States and United Kingdom and hence forms the majority of the detail here.
4.2 Characteristics of families of children with disabilities This section focuses on the Australian family and the characteristics of families of children with disabilities, specifically their socioeconomic profile and the perceived ‘costs’ of disability.
Family structure Family structure in Australia has undergone significant changes in the last 30 years, including a decline in fertility rates, a preference for smaller families, and an increase in divorce-rates, one-parent families, and de facto relationships (McDonald 2003). The majority of Australian families in 2001 were couple families with dependent children (39%) or couple families without children (36%)(AIHW 2004d). One-parent families made up 15% of all families. Between 1991 and 2001, age-specific first marriage rates decreased for both men and women aged less than 30 years, and men aged 30–34 years(AIHW 2003d). Median age at first marriage also rose by two years in the same period. Divorce rates remained relatively stable between 1991 and 2002, from 11.6 to 12.0 per 1,000 for men and 11.5 to 12.0 per 1,000 for women (AIHW 2003a:218). The total fertility rate, however, fell from 1.86 to 1.73. Children aged 0–14 years made up 21% (3,912,500) of the total population in 2001 (ABS 2002a). Of these children, 160,900, or 4.1% of this population, were Indigenous children. Boys continue to outnumber girls; the ratio of boys to girls was 1.05 in 2001, reflecting a trend observed since 1921.
44
In 1998, 99% of children with a disability aged 0–14 years lived in households. Of these children, 211,900 (or 72%) lived in a couple-parent family, and 83,700 (28%) lived in a single-parent family. Bradbury et al. (2001), using the same data, estimated the disability rate for children aged 5–14 years in single-parent families to be almost double that found in couple families (7.3% compared to 3.8% respectively). This result suggests that 30.6% of children with a disability live in single-parent families, compared with an estimated 18.1% of children without a disability. The link between childhood disability and single-parent families has been replicated in studies from the United States (US) and United Kingdom (UK) (e.g. Newacheck 1998), although one UK study found little difference between single- and couple-parent families if maternal education and income were controlled for (Boyce et al. 1995). The stresses sometimes associated with raising a child with a disability (see discussion below) have fuelled the belief that parents of children with disabilities are more likely to divorce than other parents, explaining the association between childhood disability and single-parent families. The evidence, however, is far from conclusive (Cooke et al. 1986; Longo & Bond 1984). For example, if social class is held constant, divorce rates in US families are not significantly different between couples with children with disabilities, and couples without (Wickler et al. 1984, in Boyce et al. 1995).
Socioeconomic profile The socioeconomic profile of families that have a family member with a disability indicates a strong association between the prevalence of disability and low income. In 1998, 70% of household-living Australians aged 15–64 years with a profound core activity restriction, and 56% of those with severe restrictions, were in the two lowest income quintiles, compared with 31% of people without a disability (AIHW 1999). 14 A similar picture is reported overseas. In the US, children in low income families experience a 40% increased risk of having a disability (Newacheck & McManus 1988) while in the UK, it has been reported that three-quarters of families with a disabled family member are located in the bottom half of income distribution (Martin & White 1988, in Bradbury et al. 2001). For some families, having a child with a disability is inexorably linked to poverty, either cyclical or in a more sustained fashion. A recent study of poverty in Britain identified the birth or diagnosis of a child with a disability as a recognised ‘trigger event’ for poverty in a person’s life (Department of Work and Pensions 2002). Younger people with an intellectual disability, compared with their non-disabled peers, are especially prone to living in poverty. For example, US households in which a person with an intellectual disability lived were more likely than other households to have lower aggregate household incomes, receive means-tested income support and live below the poverty line (Fujiura 1998). Families in the UK with a child with an intellectual disability were also significantly more disadvantaged than other families (Emerson 2003). Single-parent (mother) families are particularly vulnerable, as these families tend to live in poverty and socially deprived areas more so than families where both parents were resident. However, Emerson and colleagues have reported that although single-parent families with a disabled child are more likely to live in poverty or experience financial hardship than other families, the association between having a child with a disability and increased risk of entering or living in poverty was actually significantly 14 This group includes people’s main source of income as being (a) wages, salary, own or partner’s
business, (b) superannuation, dividends or other private income source and (c) any government pension allowance.
45
higher for couple families with a disabled child (Emerson et al. 2004). A large population-based study of 8,000 families in the UK found that couples who have a child with a disability were at an 80% increased risk of living in poverty, and at double the risk of living in persistent poverty (Emerson et al. 2004). A rise in the rate of childhood disability associated with poverty has also been observed in the US. Fujiura and Yamaki’s (2000) analysis of population survey data from 1983 to 1996 found that the rate of childhood disability in families living below the poverty line rose from 7.8% to 11.1%; for families at or above the poverty line, the rise was only 5.6% to 5.8%. The relationship between disability and low income/poverty is a complex but so far hypothetical one. For some families, it has been supposed, poverty may contribute to the occurrence and severity of a child’s disability, because of the child’s increased exposure to environmental risks and inadequate nutrition, housing and health care, or because of increased maternal risk factors and their association with low birth weight babies and related complications (Meyers et al. 1998). In other families, the special needs of a child with a disability, and their associated costs (see below for further discussion), may lead to socioeconomic disadvantage and poverty, particularly for families already living on a limited income. For many families, however, it is likely to be the interplay between these and other factors which increases the chance of a child with a disability living in a poor household. The ‘costs’ of having a child with a disability can be direct (i.e. financial) and indirect (e.g. time constraints) (Jacobs & McDermott 1989) and may exert a significant effect on the financial stability and functioning of a family. Research from the UK and the US generally shows that the direct costs of having a child with a disability impact more on families with lower incomes, with children with more severe disabilities, or more than one child with a disability or chronic health condition. Three-quarters of British families with a child with a disability surveyed during 1985 and 1988 reported not having enough money to care for their child (Martin et al. 1988, in Dowling & Dolan 2001). They face on average three times the costs of parents who do not have children with a disability (Gordon et al. 2000). In the US, families with children with disabilities often experience out-of-pocket expenses two to three times higher than other families (Newacheck & McManus 1988). These extra financial commitments are particularly felt by families on medium to low incomes, especially those receiving welfare payments. For example, around half of the out-of-pocket expenses reported by US families receiving AFDC payments in 1993 and 1995 were directly related to a child’s special needs (Meyers et al. 1998) and around 43% of AFDC families spent more than US$100 in the previous month on child-related expenses (Lukemeyer et al. 2000). In another study, caregivers living on low incomes and applying for specialised medical care for their child indicated that 12.5% of their income went on costs associated with bringing up a child with a severe disability (Leonard et al. 1992). For families already struggling on low incomes, these sorts of financial commitments can be hard felt and may lead to long periods on government benefits. Single mothers are especially susceptible to the cycle of benefits dependency as their care commitments may prevent them from taking up or staying in employment, and the costs of looking after their children necessitates the receipt of some sort of income supplement. A number of studies examining family disability and government benefits use in the US found between 10–30% of such families had a mother, a child or both with a disability (Lukemeyer et al. 2000; Meyers et al. 1998). Brandon et al. (forthcoming), in their analysis of families receiving TANF (Temporary Assistance for Needy Families) payments, proposed that child disability is as important as
46
maternal disability in predicting a family’s need to receive government benefits. Furthermore, single mothers with a disability, or with a child with a disability, are much less likely to exit dependency on government benefits than other families. One of the most described indirect costs of having a child with a disability is a mother’s reduced opportunity to enter the workforce. The care required for a child with a disability, coupled with a limited availability of specialised and experienced formal child care services, often means mothers who ordinarily would like to work are unable to do so. This feeds further into reduced family income and, for single mothers, can mean considerable financial hardship and the previously discussed potential for long-term government benefits dependence. Brandon and Hogan (forthcoming) describe the trade-off families are inevitably drawn to consider: sustaining a higher income against the considerable amounts of time and money needed to provide quality medical, rehabilitative and other forms of care for their child. For many families, they argue, it is the latter and its subsequent positive effect on their child’s wellbeing that is of greater importance than improved financial security. In Australia, limited research has focused on families with children with disability and their socioeconomic profile. A Western Australian study investigating sociodemographic correlates of intellectual disability of unknown cause established that mothers in more disadvantaged groups were at an increased risk of having a child with an intellectual disability (Leonard et al. forthcoming). For mothers in the most disadvantaged 10%, their risk of having a child with a mild or moderate intellectual disability was five times higher than mothers in the least disadvantaged 10%. A report by Bradbury et al. (2001) on socioeconomic disadvantage and the prevalence of disability in Australia also confirmed the overseas pattern of childhood disability’s association with lower household income. This association, however, was strong for single-parent families only, the association being negligible for couple families (but see Emerson et al. 2004).
4.3 Family effects of childhood disability The family is an interactive and reactive being, where ‘the physical, social and emotional functioning of family members is profoundly interdependent, with changes in one part of the system reverberating in other parts of the system’ (McGoldrick & Gerson 1985:5, in Marshak et al. 1999). Families are not static but undergo regular transformation, as individual family members move through and experience different stages of theirs and other’s life cycles. Family effects of childhood disability have received extensive research attention. Earlier studies tended to focus on the mother, primarily in her role as primary care giver, but more recently the scope has expanded to include other family members, specifically fathers, siblings and grandparents. Much of this research describes the negative impact of having a child with a disability (e.g. stress, family disruption) which Llewellyn et al. (1996) consider to be the consequence of a ‘prevailing societal response to childhood disability as an unanticipated, negatively defined event’. Closer scrutiny of the literature indicates, however, a broad spectrum of experiences, felt within and between families; a range of experiences universal to all families.
47
Effects on parents The birth of a child is accompanied by a myriad of positive emotions and expectations which can be tempered by the realisation that the child is not what was originally anticipated. For some families, that realisation occurs soon after the birth of a child, sometimes before, but for others the child’s disability only becomes obvious as the child develops. Parents who have a child with a disability must undergo a different process of adaptation than other parents (Kearney & Griffin 2001), firstly by understanding and accepting the child’s disability, and then by assessing what the future holds in terms of current priorities, life plans and lifestyle (Barr & Millar 2003). For many parents, and their families, this process ‘cannot help but reflect to some degree the larger context of social attitudes and historical realities’ surrounding the meaning of disability (Ferguson 2002). These attitudes and realities are frequently interpreted to be negative, fuelled at times by the perspective of professionals and relatives or friends, and can often be overwhelming for parents. Stress is an oft-cited response to the demands associated with caring for a person with a disability. A discussion of carer health and wellbeing in AIHW 2003d indicated that carers experienced a self-reported decline in their physical, emotional or mental wellbeing, feelings of overload and poorer life satisfaction, and a negative effect on their personal relationships. Rearing a child with a disability can be very stressful, and, for some mothers, such stress is experienced much more acutely than mothers without children with disabilities. For example, some mothers of children with autism (Mahoney et al. 1992; McCubbin et al. 1996, in Little 2002), with physical and learning disabilities (Lewis-Abney 1993), and with Asperger’s syndrome and nonverbal learning disorders (Little 2002), reported experiencing high levels of stress and depression, and in the latter case, a higher incidence of seeking professional help and taking medication. In turn, these mothers have felt a disruption to their family’s functioning, with cohesion and harmony the primary casualties. Single mothers may be more vulnerable to stress due to their dual role of primary caregiver and primary bread-winner. Role conflict and overload, especially for single mothers with little or no support, unrelieved daily responsibility and living off a low income, inflict additional strains on mothers (Gottlieb 1997). However, a review of eight studies concluded that having a child with a disability was ‘no clear disadvantage for single mothers’ (Boyce et al. 1995). While not denying that single mothers experience elevated levels of stress, Boyce et al. (1995) argue that the mixed results from these studies suggest that a mother’s education and income, or lack of, are the primary influence on stress levels, and act to mediate or exacerbate any stress associated with looking after a child with a disability. Research conducted by Emerson et al. (2004) also demonstrates the importance of socioeconomic status as a moderating effect on a mother’s wellbeing; interestingly, it is the more affluent mothers who experience elevated levels of stress, maternal unhappiness and lowered self-esteem. For fathers, the picture is not so clear, since the small number of studies completed, in combination with the limitations of these studies to date, make it difficult to draw firm conclusions about the likely effects on fathers. For example, most studies have tended to focus on fathers of children with intellectual disability and on the period immediately following identification of the disability (Marshak et al. 1999:148). However, on the basis of studies to date, it appears that some fathers experience adverse reactions to the birth of a child with a disability. When fathers cope poorly themselves, they can find it difficult to support other family members, especially the mother. This has a number of effects, creating family tension as well as possibly setting the tone for the whole family’s response to the new
48
child with a disability. There is some evidence that fathers cope better with a daughter than a son who has a disability (Farber 1959, in Marshak et al. 1999; Grossman 1972 in Marshak et al. 1999) but this has not been supported by later studies (e.g. Houser & Seligman 1991 in Marshak et al. 1999). It has been suggested that fathers are more concerned than mothers about socially acceptable behaviour of their children, social status and occupational success. This can make them more affected by the visibility of their child’s disability (Lamb & Meyer 1991 in Marshak et al. 1999). Recent literature reviews, however, have established a more equivocal relationship between paternal stress and having a child with a disability (e.g. Boyce et al. 1995; Llewellyn et al. 1996; Marshak et al. 1999; Woolfson 2004). Some of this inconsistency can be explained in terms of methodological issues (e.g. small sample size, consideration of families with children of different types and severity of disabling conditions), or by taking into account other, just as pertinent stresses such as difficulties associated with low income or poor marital quality (see review in Britner et al. 2003). It has also been suggested that it is the presence of behavioural problems, rather than disability itself, which exerts the most demands on parents (Floyd & Gallagher 1997). However, another explanation is the very simple fact that families are unique and differ both in their reactions to disability as well as in their methods of coping and adapting. Social support, or the extent to which a person receives assistance and help from others, is one of the most common resources used by families to counteract the demands of looking after a child with a disability (Crnic et al. 1983). Support may be informally or formally resourced, actual or perceived, and generally characterised as either emotional or instrumental. The most resilient of families are thought to be those who are skilled users of social support resources, in particular ‘close-tie’ (familial) social support (Trute 2003). Emotional support is possibly the more influential coping factor, particularly for mothers. Receipt of emotional support helps buffer the rejection and isolation parents might feel due to their intense involvement in the care of their child, and the social stigma often attached to disability (Marshak et al. 1999). ‘Instrumental support’ is also crucial as it provides the information or physical means by which families deal with the often complex support needs of a child with a disability. Access to formal services, such as early intervention, respite, therapies, equipment services, and family support programs, explains some of the variability in stress observed in parents of children with disabilities (Shonkoff et al. 1992), although there needs to be an associated sense of optimism that formal support will be helpful (Floyd & Gallagher 1997). Instrumental support closer to home is also beneficial to parental wellbeing; marital satisfaction tends to be greater if fathers routinely help their female partners in at least some of the daily care-giving tasks (Willoughby & Glidden 1995). In some instances, it is the perception of receiving support which may be of greater relevance to parents than actual receipt. Trute (2003), for example, found that parents’ perception of their own mothers being involved in their child’s care giving is the most ‘salient predictor’ of parenting stress and wellbeing. The capacity to cope is also affected by more personal factors, such as the health and morale of parents, problem solving skills, and an accepted readjustment of life goals, including a redefining of what constitutes fulfilment (Folkman et al. 1979, in Leyser et al. 1996; Tunali & Power 1993). These, the receipt of personal support and more formal support services, and the financial security of a family all interact to influence a family’s chances of coping with the recognised demands of raising a child with a disability. If one or more of these factors drops out, that ability to cope may be fractured.
49
While the literature has considered some of the positive outcomes of having a child with a disability (e.g. strengthening of relationships between couples), there has been an absence of any reflection on beneficial experiences. This may be because of a narrowed focus on the effect of the disability, rather than a broader examination of the relationship the parent holds with their child. Mothers and fathers of children with disabilities do report experiencing positive emotional relationships with their children (e.g. O’Halloron 1993) and feelings of happiness and optimism (Leyser et al. 1996) and it is the establishment of the emotional bond between parent and child which is possibly the most significant experience for a parent. As Ferguson and Asch (1989:108) have stated:
‘…the most important thing that happens when a child with disabilities is born is that a child is born. The most important thing that happens when a couple become parents of a child with disabilities is that a couple become parents’.
Effects on siblings The sibling relationship is a unique one, usually the longest and most enduring of all family relationships. This means that siblings are in a position to exert considerable influence over one another over long periods of time. They are also in a unique position to offer support and provide a buffer to the effects from the outside world. Having a sibling with a disability may alter a child’s family environment in fundamental ways. Time ordinarily spent with a parent may be disrupted by the caregiving commitments of their parents, and siblings may also be expected, or needed, to assist in household tasks and caregiving responsibilities, potentially reducing opportunities to participate in out-of-home activities. There has been a lot of research interest in the psychological adjustment of siblings of children with disability and, as found for parental effects, this has produced mixed results. A review of the literature by Seligman and Darling (1997) summarises the findings to date and notes that:
‘From an empirical point of view, the question of whether siblings are not affected, are helped, or are harmed by the presence of a brother or sister with a disability remains open to speculation. Available data have not yet determined the prevalence of emotional problems among siblings residing with a disabled brother or sister compared with that in families where there is no disability. The factors that interact and subsequently lead to adjustment or psychological difficulties are many and combine in complex ways’ (p. 143).
Powell and Gallagher (1993) have argued that the influence a child with a disability has on a sibling can be placed on a continuum, with positive outcomes at one end and negative outcomes at the other end. Adaptation is not a unidimensional construct, and differences in sibling responses described in the literature may be an artefact of children displaying quite different reactions at different moments and in different domains of functioning (Verté et al. 2003). Some of the interacting factors and circumstances are:
• Sibling age, gender, birth order, and age spacing between children may interact in complex ways (Simeonsson & Bailey 1986). For example, adolescents seeking independence may experience increased anger and resentment about their caregiving role in conjunction with increased sensitivity to their own appearance and public image. Also, female siblings, particularly those older than the child with the disability, may not adjust as well (Gath 1974, in Seligman & Darling 1997). This is possibly because they tend to be involved more in caregiving responsibilities than other, especially male,
50
siblings (McHale & Gamble 1989), although a review has found no significant differences in home and caregiving responsibilities between male and female siblings (Damiani 1999).
• Family size: There is some evidence suggesting that siblings from two-child families experience more stress in relation to their sibling with intellectual disability than children from larger families. This may relate to the extra helping hands or could be reduced pressure on each sibling to excel to compensate for the sibling with disability (Grossman 1972, in Seligman & Darling 1997).
• The extent to which appropriate information is made available to siblings about the health conditions and disabilities experienced by their sibling: Siblings who are not well informed about their brother or sister’s health condition and disability, and hence do not develop an understanding of the condition, are more likely to experience somatic complaints and excessive guilt and anger (Rolland 1994; Roeyers & Mycke 1995).
• The extent to which anger and guilt are experienced by siblings of children with disability: This in turn depends on factors like the extent to which the child assumes a major caretaking role in the family, the extent to which the child with disability may restrict their sibling’s social life and the extent to which the child with disability requires excessive time and attention from parents. Children may feel guilty over feelings of rivalry toward a sibling who obviously needs special care (Crocker 1981, in McHale & Gamble 1989).
• The caregiving responsibility of siblings of children with disabilities: Siblings may have to assume extra caretaking responsibilities, particularly if extended support is not provided. Excessive caregiving can result in anger, resentment, guilt and possibly psychological problems, particularly if this responsibility co-exists with limited parental attention to the sibling (Seligman & Darling 1997).
• Socioeconomic status: It has been suggested that greater financial resources make it possible for some families to reduce the amount of responsibility assumed by siblings (Grossman 1972, in Seligman & Darling 1997), with children from lower income families reporting higher levels of household and caregiver responsibility (Stoneman et al. 1988). However, the choice of families to obtain formal help from outside the family relates to family values and other factors in addition to financial wealth.
• The type, severity and number of disabilities: These factors have all been found to influence the effect on siblings. Generally, the larger the number of disabilities, the greater caretaking required, greater stress levels experienced by family members and extra responsibility for siblings.
• Parental attitude: If parents are having difficulties accepting the child’s disability and view the disability as a ‘burden’ on the family, this attitude may filter down to other children in the family.
A range of other effects on siblings are also discussed in the literature. • There is some evidence suggesting that parents may have excessively high aspirations
for their child without a disability. One study observed that the pressure to achieve was particularly high if the child with the disability was a boy (Grossman 1972, in Seligman & Darling 1997) while another found that the pressure on the child without a disability to achieve was higher when their sibling had a developmental disability rather than a physical disability (Coleman 1990, in Seligman & Darling 1997).
51
• Siblings may have some difficulty developing their own identity. Feigon (1981, in Seligman & Darling 1997) observed that siblings of a child with disability strongly identified with their sibling to the point that they felt that they were or would become disabled themselves. It is possible that the basic life goals of siblings of a child with disability may be affected. For example, Farber (1959, in Marshak et al. 1999) and Cleveland and Miller (1977) found that ‘non-disabled siblings internalised helping norms and turned their career endeavours toward the improvement of mankind or at least toward life goals that require dedication and sacrifice’. There is not enough empirical evidence to support the theory that siblings of children with disabilities are more likely to enter ‘helping’ professions.
• Siblings of children with severe behavioural problems may become the victim of violent and anti-social behaviour. Siblings of brothers with disruptive ADHD behaviours from 11 families in the United States reported feelings of victimisation, through their brothers’ overt acts of physical violence and verbal aggression (Kendall 1999).
• Many siblings exhibit some discomfort or difficulty explaining to peers about their sibling, particularly if their understanding about their sibling’s disability is limited (Monique Nesa 2004, personal communication).
• Due to the extra care that children with a disability require, many siblings may have limited opportunity to engage in out-of-home activities, either due to their extra responsibilities or because their parents have limited time to arrange such activities (Monique Nesa 2004, personal communication).
On the positive end of the continuum, siblings of children with disabilities have reported increased self-esteem, empathy, maturity, and a sense of responsibility (see review of literature: Kendall 1999; McHale & Gamble 1989), with the potential to influence family resilience and cohesion. Lobato (1990) even claims that some children are advantaged by living with a special needs sibling. She concludes:
‘To many parents of young children, it may seem as though the child’s illness or disability will do nothing but harm to the other children. However, this is actually quite far from the truth. As young siblings mature, evidence is clear that they usually do not have more problems than other children. In fact, many siblings show areas of great social and psychological strength. Their relationships with and behaviour toward one another also tend to be more nurturing and positive than between many other sibling pairs’ (p. 60).
One consistent theme to emerge from the literature in this area is that siblings share their parents’ worry about the future care of their sibling with a disability (Damiana 1999; Powell & Gallagher 1993). It is possible that this worry, and not the additional responsibility that may be assumed by or required of siblings, leads to increased risk of psychological problems such as anxiety and depression. Seligman and Darling (1989) recommend that a child’s feelings about responsibility for their sibling with a disability, and their expectations about their future caring role, should be a major focus for professionals working with siblings.
Effects on grandparents Grandparents can provide enormous support to their adult children and grandchildren. In terms of family systems, grandparents both affect and are affected by what happens in the nuclear family of their own offspring.
52
When a child with a disability is born, ‘grandparents, just like parents, must face the disappointment of a “less-than-perfect” baby and ponder the relationship between this child and themselves’ (Marshak et al. 1999:159). From the parents’ point of view, they may be acutely aware of and concerned about the reactions of their own parents to the birth or later identification of disability in their child. The grandparents are likely to experience a ‘dual hurt’, not only for their grandchild, but for their own child, who they perceive as being burdened for life (Marsh 1993, in Marshak et al. 1995: 160). Grandparents must come to terms with and grieve the loss of the idealised grandchild they wished for. Grandparents typically have an expectation that the birth of a grandchild will be associated with many of the fun and joyful aspects of child rearing, in the absence of the full responsibility of caring for a child, a role which they have already completed. They must first deal with their own disappointment, as well as possibly going through the same stages as parents of denial, grief, anger, detachment and eventually acceptance (Marshak et al. 1999). Grandparents can and do provide considerable support to parents raising a child with a disability. Maternal grandmothers are usually the primary source of support for parents (Baranowski & Schilmoeller 1999; Findler 2000; Trute 2003), particularly for their daughters. In one Israeli study mothers of children with cerebral palsy ranked their mother ahead of their own husband as their most important source of support (Findler 2000). Fathers also benefit from receiving parental support; stress levels in fathers are lower when their parents are involved in caregiving (Sandler et al. 1995). Research has found that a father’s relationship with his own parents is the most important of all his support sources (Weisbren 1980, in Marshak et al. 1999). This research found that fathers and mothers who perceive the father’s parents to be supportive, were more likely to engage positively with the child and feel more positive about their child. Grandparents who live near their children are likely to make contributions in varied ways. They may assist with practical tasks such as shopping, errands and cleaning, provide childcare and respite, and help parents to access information, community resources and services. But it is their emotional support and ability to accept the child with a disability that parents really value. Emotional support, both perceived and received, has been shown to improve parental wellbeing and reduce stress (Findler 2000; Seligman 1991; Trute 2003). Hands-on support also benefits the grandparents themselves. Caring for a child with a disability allows grandparents to get to know their grandchild on a more intimate basis, promoting feelings of pride and normalised attitudes towards the child (Green 2003). The impact of grandparent involvement, however, is not always positive or benign. Problems can arise between the mother and paternal grandparents, in particular the paternal grandmother (Marshak et al. 1999). It is not uncommon for the paternal grandmother to blame the mother for the child’s disability (see, for example, Pieper 1976, in Marshak et al. 1999) and for both sides of the family to spend a good deal of time examining their potential role in the disability in their grandchild. Difficulties may also arise if grandparents do not understand the problems parents face in raising a child with a disability or there is disagreement over the best way to care for such a child. Mothers of children with Down syndrome reported higher stress levels if there was any conflict with grandparents, although fathers’ stress levels were not affected (Hastings et al. 2002). Other studies have indicated that grandparent involvement is considered by some parents as an additional burden (Hornby & Ashworth 1994; Seligman 1991). Marshak et al. (1999) noted that grandparents are an important resource for families in which a child has a disability. Research suggests that grandparents often want to be better informed
53
about their grandchild’s disability, suitable therapies for and the likely long-term outcomes for their grandchild (Vadasy et al. 1986). Grandparents also worry about whether they are doing the right thing for their grandchild and own offspring and express anxiety about the future (Marshak et al. 1999:166). Marshak et al. (1999) suggest that the inclusion of grandparents in support groups, whether on their own or with their extended family, may provide a valuable mechanism for improving the functioning of the entire family.
4.4 Characteristics of carers of children with disabilities Most of the care children with disabilities receive is informal, usually provided by the family. Formal support is provided in some cases, and to varying levels (AIHW 2003d), with very few children being cared for solely by a formal carer. While a family member’s role in caring for a child with a disability is a natural expression of their relationship with that child, more generalised studies of informal care reveal the situation may not always be the carer’s first choice (CAA 2000; Schofield et al. 1997) and partly a consequence of the carer not having access to additional forms of support. In 1998, there were 62,600 self-reported primary carers, providing care to children with disabilities aged 0–14 years and living in the same household. 15 A primary carer is a person of any age who provides the most informal assistance, in terms of help or supervision, to a person with one or more disabilities. The assistance has to be ongoing, or likely to be ongoing, for at least six months and be provided for one or more of the core activities (communication, mobility and self-care). The following provides a profile of these primary carers; an absence of appropriate comparative data prevents any discussion of carer characteristics against other members of the community.
Relationship of carer Who, then, are the primary carers of children with disability living in households? The great majority are mothers—in 1998, 53,400 primary carers of children with a disability aged 0–14 years, or 85% of all such carers, were mothers (Table 4.1). Another 6,300 carers were fathers, with parents representing 95% of all primary carers looking after resident children under the age of 15 years. The other 5% of carers were relatives or friends, most of whom were female. Family, and other informal carers, thus provide the majority of care for children with disabilities.
15 The following analysis is derived from ABS survey data collected for respondents identifying as
primary carers of children aged 0–14 years with a disability.
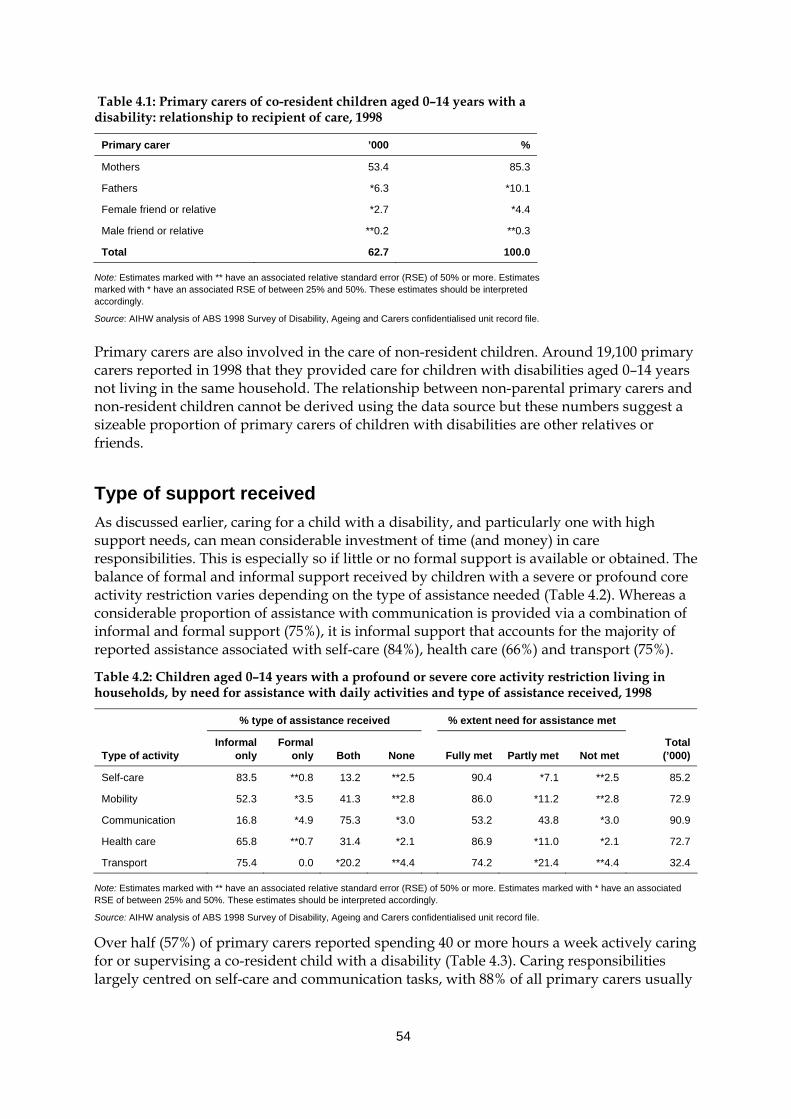
54
Table 4.1: Primary carers of co-resident children aged 0–14 years with a disability: relationship to recipient of care, 1998
Primary carer ’000 %
Mothers 53.4 85.3
Fathers *6.3 *10.1
Female friend or relative *2.7 *4.4
Male friend or relative **0.2 **0.3
Total 62.7 100.0
Note: Estimates marked with ** have an associated relative standard error (RSE) of 50% or more. Estimates marked with * have an associated RSE of between 25% and 50%. These estimates should be interpreted accordingly.
Source: AIHW analysis of ABS 1998 Survey of Disability, Ageing and Carers confidentialised unit record file.
Primary carers are also involved in the care of non-resident children. Around 19,100 primary carers reported in 1998 that they provided care for children with disabilities aged 0–14 years not living in the same household. The relationship between non-parental primary carers and non-resident children cannot be derived using the data source but these numbers suggest a sizeable proportion of primary carers of children with disabilities are other relatives or friends.
Type of support received As discussed earlier, caring for a child with a disability, and particularly one with high support needs, can mean considerable investment of time (and money) in care responsibilities. This is especially so if little or no formal support is available or obtained. The balance of formal and informal support received by children with a severe or profound core activity restriction varies depending on the type of assistance needed (Table 4.2). Whereas a considerable proportion of assistance with communication is provided via a combination of informal and formal support (75%), it is informal support that accounts for the majority of reported assistance associated with self-care (84%), health care (66%) and transport (75%).
Table 4.2: Children aged 0–14 years with a profound or severe core activity restriction living in households, by need for assistance with daily activities and type of assistance received, 1998
% type of assistance received % extent need for assistance met
Type of activity
Informal only
Formal only Both None
Fully met Partly met
Not met
Total (’000)
Self-care 83.5 **0.8 13.2 **2.5 90.4 *7.1 **2.5 85.2
Mobility 52.3 *3.5 41.3 **2.8 86.0 *11.2 **2.8 72.9
Communication 16.8 *4.9 75.3 *3.0 53.2 43.8 *3.0 90.9
Health care 65.8 **0.7 31.4 *2.1 86.9 *11.0 *2.1 72.7
Transport 75.4 0.0 *20.2 **4.4 74.2 *21.4 **4.4 32.4
Note: Estimates marked with ** have an associated relative standard error (RSE) of 50% or more. Estimates marked with * have an associated RSE of between 25% and 50%. These estimates should be interpreted accordingly.
Source: AIHW analysis of ABS 1998 Survey of Disability, Ageing and Carers confidentialised unit record file.
Over half (57%) of primary carers reported spending 40 or more hours a week actively caring for or supervising a co-resident child with a disability (Table 4.3). Caring responsibilities largely centred on self-care and communication tasks, with 88% of all primary carers usually
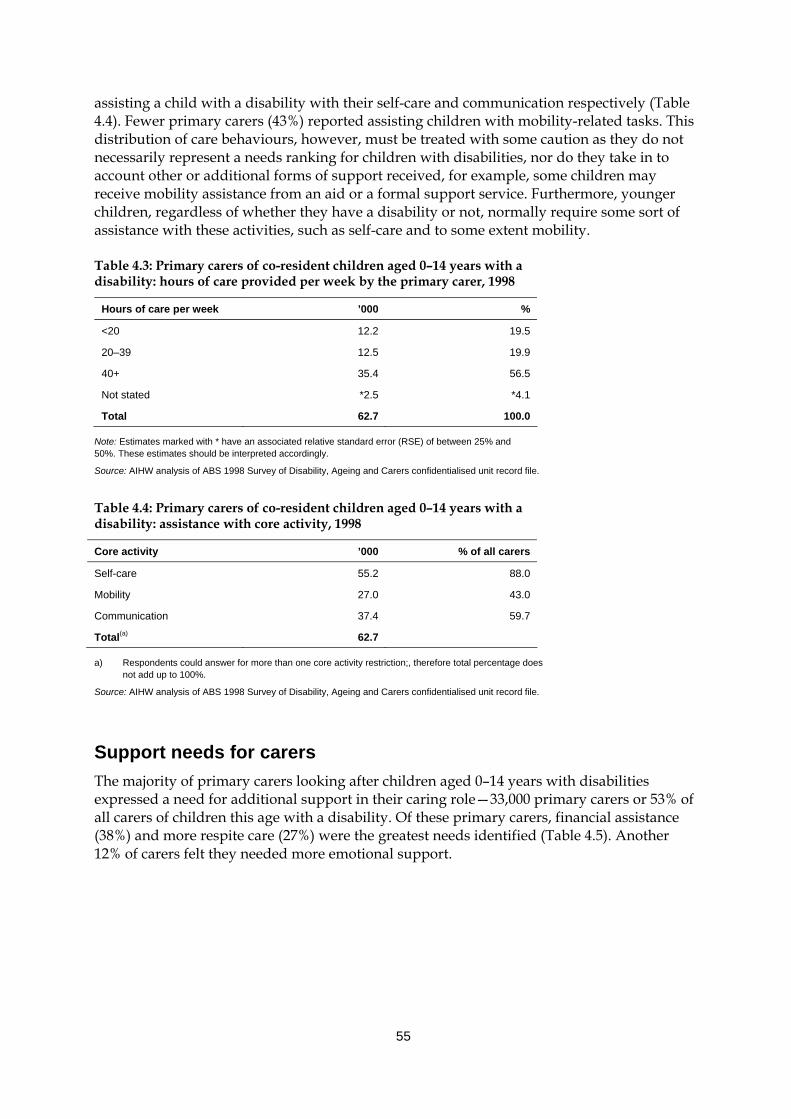
55
assisting a child with a disability with their self-care and communication respectively (Table 4.4). Fewer primary carers (43%) reported assisting children with mobility-related tasks. This distribution of care behaviours, however, must be treated with some caution as they do not necessarily represent a needs ranking for children with disabilities, nor do they take in to account other or additional forms of support received, for example, some children may receive mobility assistance from an aid or a formal support service. Furthermore, younger children, regardless of whether they have a disability or not, normally require some sort of assistance with these activities, such as self-care and to some extent mobility.
Table 4.3: Primary carers of co-resident children aged 0–14 years with a disability: hours of care provided per week by the primary carer, 1998
Hours of care per week ’000 %
<20 12.2 19.5
20–39 12.5 19.9
40+ 35.4 56.5
Not stated *2.5 *4.1
Total 62.7 100.0
Note: Estimates marked with * have an associated relative standard error (RSE) of between 25% and 50%. These estimates should be interpreted accordingly.
Source: AIHW analysis of ABS 1998 Survey of Disability, Ageing and Carers confidentialised unit record file.
Table 4.4: Primary carers of co-resident children aged 0–14 years with a disability: assistance with core activity, 1998
Core activity ’000 % of all carers
Self-care 55.2 88.0
Mobility 27.0 43.0
Communication 37.4 59.7
Total(a) 62.7
a) Respondents could answer for more than one core activity restriction;, therefore total percentage does not add up to 100%.
Source: AIHW analysis of ABS 1998 Survey of Disability, Ageing and Carers confidentialised unit record file.
Support needs for carers The majority of primary carers looking after children aged 0–14 years with disabilities expressed a need for additional support in their caring role—33,000 primary carers or 53% of all carers of children this age with a disability. Of these primary carers, financial assistance (38%) and more respite care (27%) were the greatest needs identified (Table 4.5). Another 12% of carers felt they needed more emotional support.
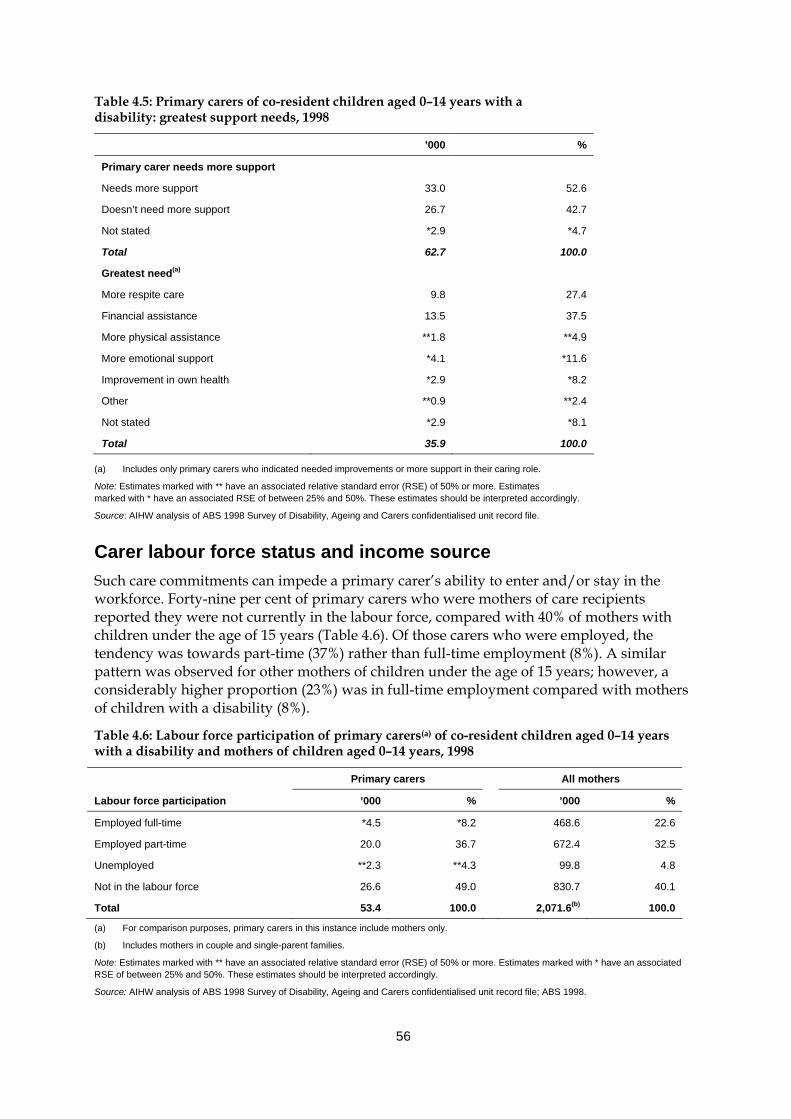
56
Table 4.5: Primary carers of co-resident children aged 0–14 years with a disability: greatest support needs, 1998
’000 %
Primary carer needs more support
Needs more support 33.0 52.6
Doesn’t need more support 26.7 42.7
Not stated *2.9 *4.7
Total 62.7 100.0
Greatest need(a)
More respite care 9.8 27.4
Financial assistance 13.5 37.5
More physical assistance **1.8 **4.9
More emotional support *4.1 *11.6
Improvement in own health *2.9 *8.2
Other **0.9 **2.4
Not stated *2.9 *8.1
Total 35.9 100.0
(a) Includes only primary carers who indicated needed improvements or more support in their caring role.
Note: Estimates marked with ** have an associated relative standard error (RSE) of 50% or more. Estimates marked with * have an associated RSE of between 25% and 50%. These estimates should be interpreted accordingly.
Source: AIHW analysis of ABS 1998 Survey of Disability, Ageing and Carers confidentialised unit record file.
Carer labour force status and income source Such care commitments can impede a primary carer’s ability to enter and/or stay in the workforce. Forty-nine per cent of primary carers who were mothers of care recipients reported they were not currently in the labour force, compared with 40% of mothers with children under the age of 15 years (Table 4.6). Of those carers who were employed, the tendency was towards part-time (37%) rather than full-time employment (8%). A similar pattern was observed for other mothers of children under the age of 15 years; however, a considerably higher proportion (23%) was in full-time employment compared with mothers of children with a disability (8%).
Table 4.6: Labour force participation of primary carers(a) of co-resident children aged 0–14 years with a disability and mothers of children aged 0–14 years, 1998
Primary carers All mothers
Labour force participation ’000 % ’000 %
Employed full-time *4.5 *8.2 468.6 22.6
Employed part-time 20.0 36.7 672.4 32.5
Unemployed **2.3 **4.3 99.8 4.8
Not in the labour force 26.6 49.0 830.7 40.1
Total 53.4 100.0 2,071.6(b) 100.0
(a) For comparison purposes, primary carers in this instance include mothers only.
(b) Includes mothers in couple and single-parent families.
Note: Estimates marked with ** have an associated relative standard error (RSE) of 50% or more. Estimates marked with * have an associated RSE of between 25% and 50%. These estimates should be interpreted accordingly.
Source: AIHW analysis of ABS 1998 Survey of Disability, Ageing and Carers confidentialised unit record file; ABS 1998.
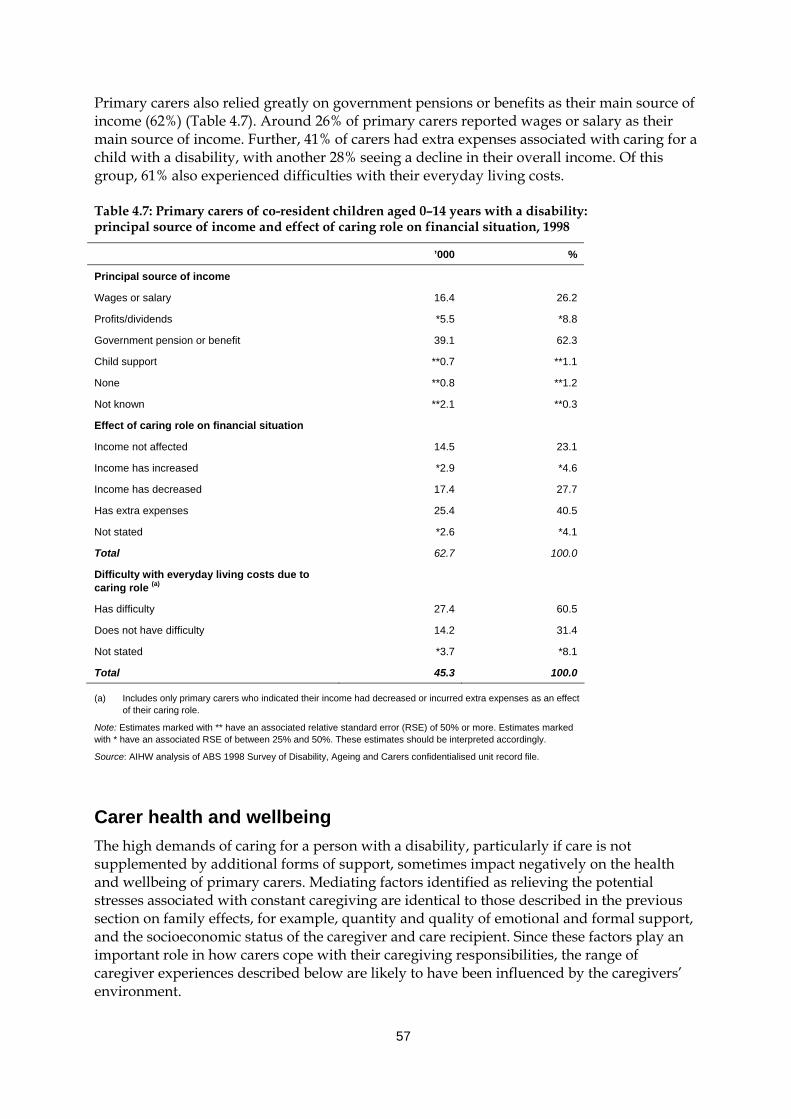
57
Primary carers also relied greatly on government pensions or benefits as their main source of income (62%) (Table 4.7). Around 26% of primary carers reported wages or salary as their main source of income. Further, 41% of carers had extra expenses associated with caring for a child with a disability, with another 28% seeing a decline in their overall income. Of this group, 61% also experienced difficulties with their everyday living costs.
Table 4.7: Primary carers of co-resident children aged 0–14 years with a disability: principal source of income and effect of caring role on financial situation, 1998
’000 %
Principal source of income
Wages or salary 16.4 26.2
Profits/dividends *5.5 *8.8
Government pension or benefit 39.1 62.3
Child support **0.7 **1.1
None **0.8 **1.2
Not known **2.1 **0.3
Effect of caring role on financial situation
Income not affected 14.5 23.1
Income has increased *2.9 *4.6
Income has decreased 17.4 27.7
Has extra expenses 25.4 40.5
Not stated *2.6 *4.1
Total 62.7 100.0
Difficulty with everyday living costs due to caring role (a)
Has difficulty 27.4 60.5
Does not have difficulty 14.2 31.4
Not stated *3.7 *8.1
Total 45.3 100.0
(a) Includes only primary carers who indicated their income had decreased or incurred extra expenses as an effect of their caring role.
Note: Estimates marked with ** have an associated relative standard error (RSE) of 50% or more. Estimates marked with * have an associated RSE of between 25% and 50%. These estimates should be interpreted accordingly.
Source: AIHW analysis of ABS 1998 Survey of Disability, Ageing and Carers confidentialised unit record file.
Carer health and wellbeing The high demands of caring for a person with a disability, particularly if care is not supplemented by additional forms of support, sometimes impact negatively on the health and wellbeing of primary carers. Mediating factors identified as relieving the potential stresses associated with constant caregiving are identical to those described in the previous section on family effects, for example, quantity and quality of emotional and formal support, and the socioeconomic status of the caregiver and care recipient. Since these factors play an important role in how carers cope with their caregiving responsibilities, the range of caregiver experiences described below are likely to have been influenced by the caregivers’ environment.
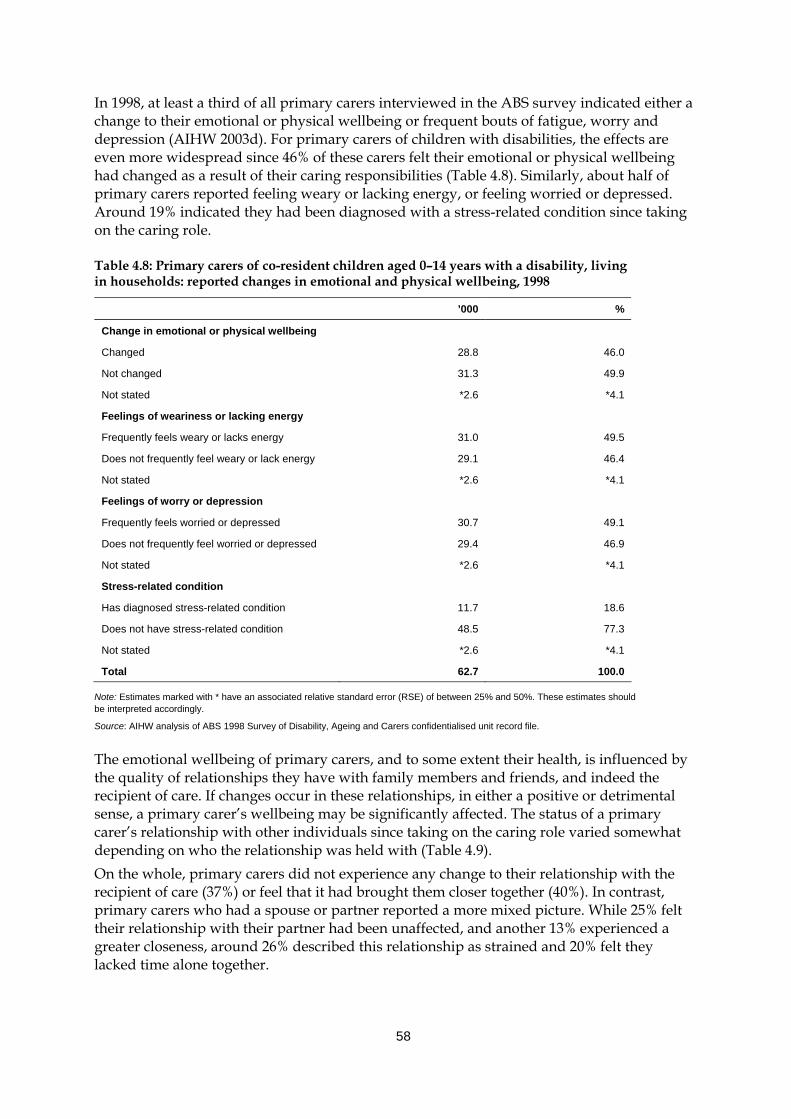
58
In 1998, at least a third of all primary carers interviewed in the ABS survey indicated either a change to their emotional or physical wellbeing or frequent bouts of fatigue, worry and depression (AIHW 2003d). For primary carers of children with disabilities, the effects are even more widespread since 46% of these carers felt their emotional or physical wellbeing had changed as a result of their caring responsibilities (Table 4.8). Similarly, about half of primary carers reported feeling weary or lacking energy, or feeling worried or depressed. Around 19% indicated they had been diagnosed with a stress-related condition since taking on the caring role.
Table 4.8: Primary carers of co-resident children aged 0–14 years with a disability, living in households: reported changes in emotional and physical wellbeing, 1998
’000 %
Change in emotional or physical wellbeing
Changed 28.8 46.0
Not changed 31.3 49.9
Not stated *2.6 *4.1
Feelings of weariness or lacking energy
Frequently feels weary or lacks energy 31.0 49.5
Does not frequently feel weary or lack energy 29.1 46.4
Not stated *2.6 *4.1
Feelings of worry or depression
Frequently feels worried or depressed 30.7 49.1
Does not frequently feel worried or depressed 29.4 46.9
Not stated *2.6 *4.1
Stress-related condition
Has diagnosed stress-related condition 11.7 18.6
Does not have stress-related condition 48.5 77.3
Not stated *2.6 *4.1
Total 62.7 100.0
Note: Estimates marked with * have an associated relative standard error (RSE) of between 25% and 50%. These estimates should be interpreted accordingly.
Source: AIHW analysis of ABS 1998 Survey of Disability, Ageing and Carers confidentialised unit record file.
The emotional wellbeing of primary carers, and to some extent their health, is influenced by the quality of relationships they have with family members and friends, and indeed the recipient of care. If changes occur in these relationships, in either a positive or detrimental sense, a primary carer’s wellbeing may be significantly affected. The status of a primary carer’s relationship with other individuals since taking on the caring role varied somewhat depending on who the relationship was held with (Table 4.9). On the whole, primary carers did not experience any change to their relationship with the recipient of care (37%) or feel that it had brought them closer together (40%). In contrast, primary carers who had a spouse or partner reported a more mixed picture. While 25% felt their relationship with their partner had been unaffected, and another 13% experienced a greater closeness, around 26% described this relationship as strained and 20% felt they lacked time alone together.
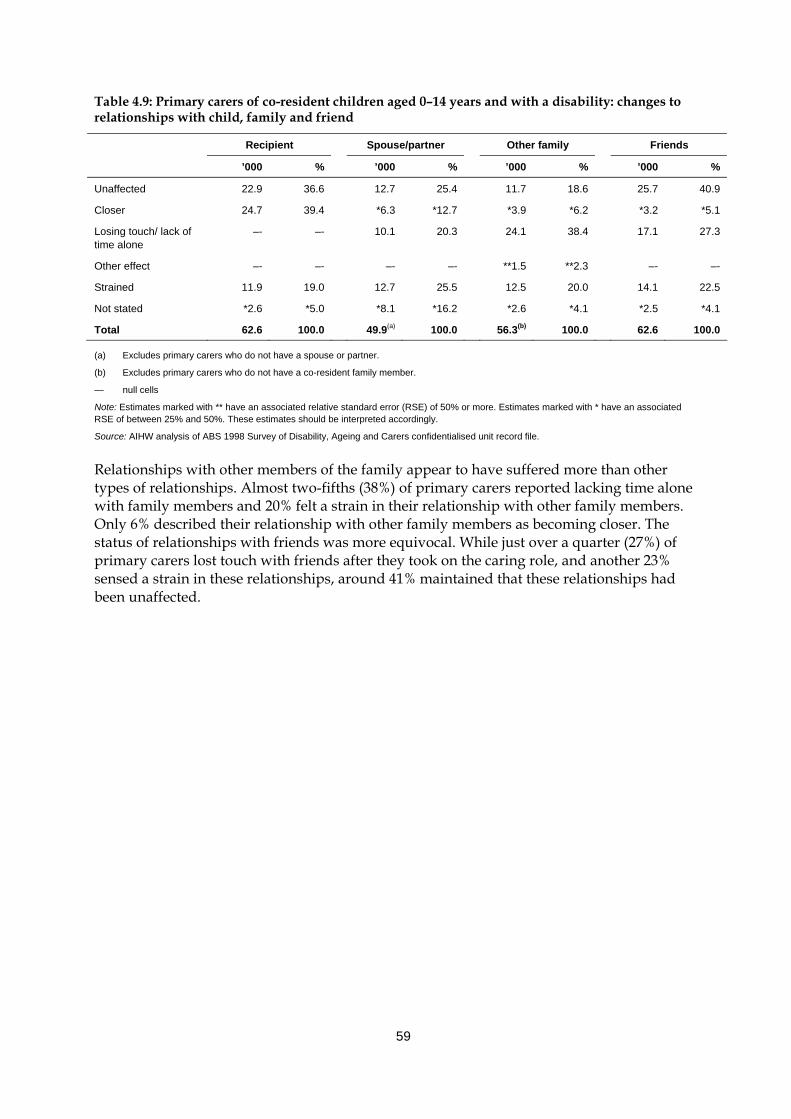
59
Table 4.9: Primary carers of co-resident children aged 0–14 years and with a disability: changes to relationships with child, family and friend
Recipient Spouse/partner Other family Friends
’000 % ’000 % ’000 % ’000 %
Unaffected 22.9 36.6 12.7 25.4 11.7 18.6 25.7 40.9
Closer 24.7 39.4 *6.3 *12.7 *3.9 *6.2 *3.2 *5.1
Losing touch/ lack of time alone
–- –- 10.1 20.3 24.1 38.4 17.1 27.3
Other effect –- –- –- –- **1.5 **2.3 –- –-
Strained 11.9 19.0 12.7 25.5 12.5 20.0 14.1 22.5
Not stated *2.6 *5.0 *8.1 *16.2 *2.6 *4.1 *2.5 *4.1
Total 62.6 100.0 49.9(a) 100.0 56.3(b) 100.0 62.6 100.0
(a) Excludes primary carers who do not have a spouse or partner.
(b) Excludes primary carers who do not have a co-resident family member.
— null cells
Note: Estimates marked with ** have an associated relative standard error (RSE) of 50% or more. Estimates marked with * have an associated RSE of between 25% and 50%. These estimates should be interpreted accordingly.
Source: AIHW analysis of ABS 1998 Survey of Disability, Ageing and Carers confidentialised unit record file.
Relationships with other members of the family appear to have suffered more than other types of relationships. Almost two-fifths (38%) of primary carers reported lacking time alone with family members and 20% felt a strain in their relationship with other family members. Only 6% described their relationship with other family members as becoming closer. The status of relationships with friends was more equivocal. While just over a quarter (27%) of primary carers lost touch with friends after they took on the caring role, and another 23% sensed a strain in these relationships, around 41% maintained that these relationships had been unaffected.
60
5 Services, assistance and other care arrangements
5.1 Introduction As noted in previous chapters, the vast majority of care for children with disabilities is provided informally. A range of formal services and assistance is also available from government and non-government sectors to assist families generally. Where families include a child with a disability, some disability-specific forms of assistance are also available. The first section of this chapter (Section 5.2) focuses on income support arrangements for families in which a child has a disability. Section 5.3 then describes the main specialist disability services available to these families, including the characteristics of the children using these services and the types of service received. The final sections of the chapter (Sections 5.4 and 5.5) examine what is known about the use of generic services and alternative care arrangements by children with disabilities.
5.2 Income support The Australian Government is the main source of income support for families caring for a child with a disability or severe medical condition. Centrelink, on behalf of the Australian Government, provides two main payments to carers for children under the age of 16 years: • Carer Payment (Child); and • Carer Allowance (Child). In addition, carers may be eligible for a Pensioner Concession Card or Health Care Card, Pharmaceutical Allowance, Rent Assistance and the Pensioner Education Supplement (PES). Families may also be eligible for the Family Tax Benefit and other benefits available to all families, dependent on income and assets tests. Details of each of these payments and allowances are provided below.
Carer Payment (Child) Carer Payment (Child) is an income support payment for people whose caring responsibilities prevent them from substantial workforce participation. The recipient must provide constant care for a child under the age of 16 years with a profound disability or for two or more children under the age of 16 years with disabilities and who require a level of care that is at least equivalent to the care required by a child with profound disabilities. Care must be provided in the child’s home. Eligibility for the Carer Payment (Child) is based on whether the child meets the definition of a ‘profoundly disabled child’ as given in Box 5.1. The Carer Payment (Child) is subject to income and assets tests for both the carer and the child.
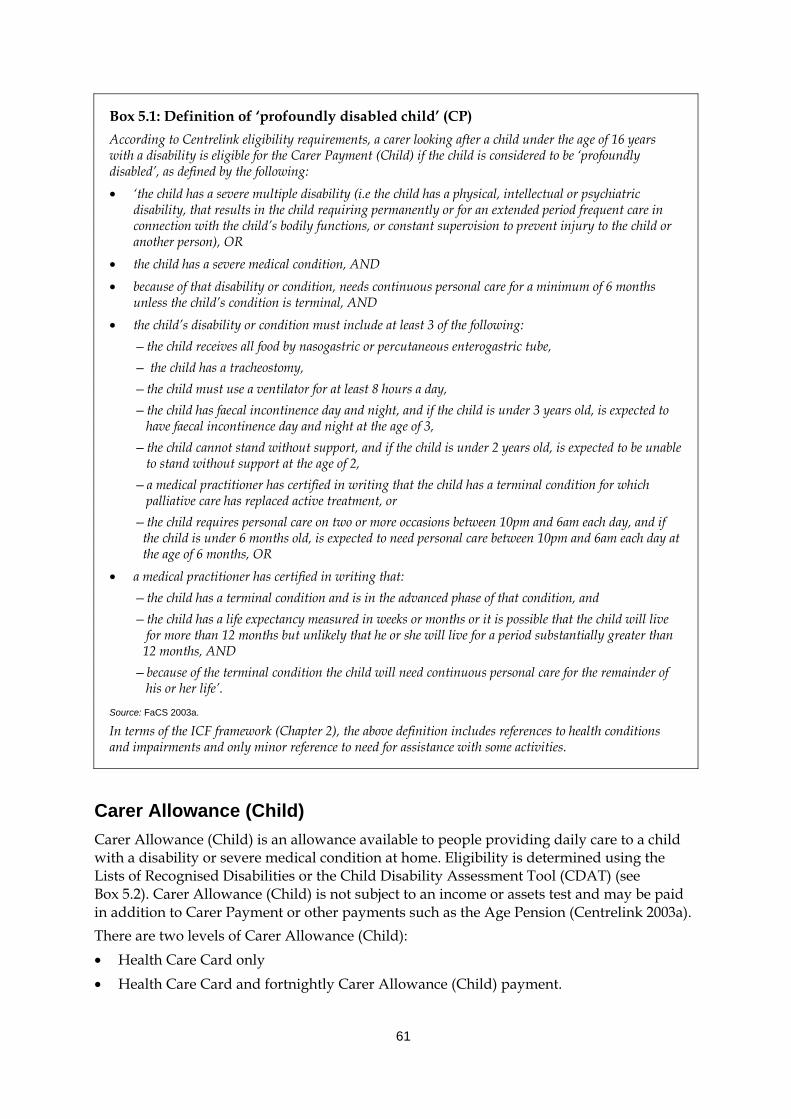
61
Box 5.1: Definition of ‘profoundly disabled child’ (CP) According to Centrelink eligibility requirements, a carer looking after a child under the age of 16 years with a disability is eligible for the Carer Payment (Child) if the child is considered to be ‘profoundly disabled’, as defined by the following: • ‘the child has a severe multiple disability (i.e the child has a physical, intellectual or psychiatric
disability, that results in the child requiring permanently or for an extended period frequent care in connection with the child’s bodily functions, or constant supervision to prevent injury to the child or another person), OR
• the child has a severe medical condition, AND • because of that disability or condition, needs continuous personal care for a minimum of 6 months
unless the child’s condition is terminal, AND • the child’s disability or condition must include at least 3 of the following:
—the child receives all food by nasogastric or percutaneous enterogastric tube, — the child has a tracheostomy, —the child must use a ventilator for at least 8 hours a day, —the child has faecal incontinence day and night, and if the child is under 3 years old, is expected to
have faecal incontinence day and night at the age of 3, —the child cannot stand without support, and if the child is under 2 years old, is expected to be unable
to stand without support at the age of 2, —a medical practitioner has certified in writing that the child has a terminal condition for which
palliative care has replaced active treatment, or —the child requires personal care on two or more occasions between 10pm and 6am each day, and if
the child is under 6 months old, is expected to need personal care between 10pm and 6am each day at the age of 6 months, OR • a medical practitioner has certified in writing that:
—the child has a terminal condition and is in the advanced phase of that condition, and —the child has a life expectancy measured in weeks or months or it is possible that the child will live
for more than 12 months but unlikely that he or she will live for a period substantially greater than 12 months, AND
—because of the terminal condition the child will need continuous personal care for the remainder of his or her life’.
Source: FaCS 2003a.
In terms of the ICF framework (Chapter 2), the above definition includes references to health conditions and impairments and only minor reference to need for assistance with some activities.
Carer Allowance (Child) Carer Allowance (Child) is an allowance available to people providing daily care to a child with a disability or severe medical condition at home. Eligibility is determined using the Lists of Recognised Disabilities or the Child Disability Assessment Tool (CDAT) (see Box 5.2). Carer Allowance (Child) is not subject to an income or assets test and may be paid in addition to Carer Payment or other payments such as the Age Pension (Centrelink 2003a). There are two levels of Carer Allowance (Child): • Health Care Card only • Health Care Card and fortnightly Carer Allowance (Child) payment.
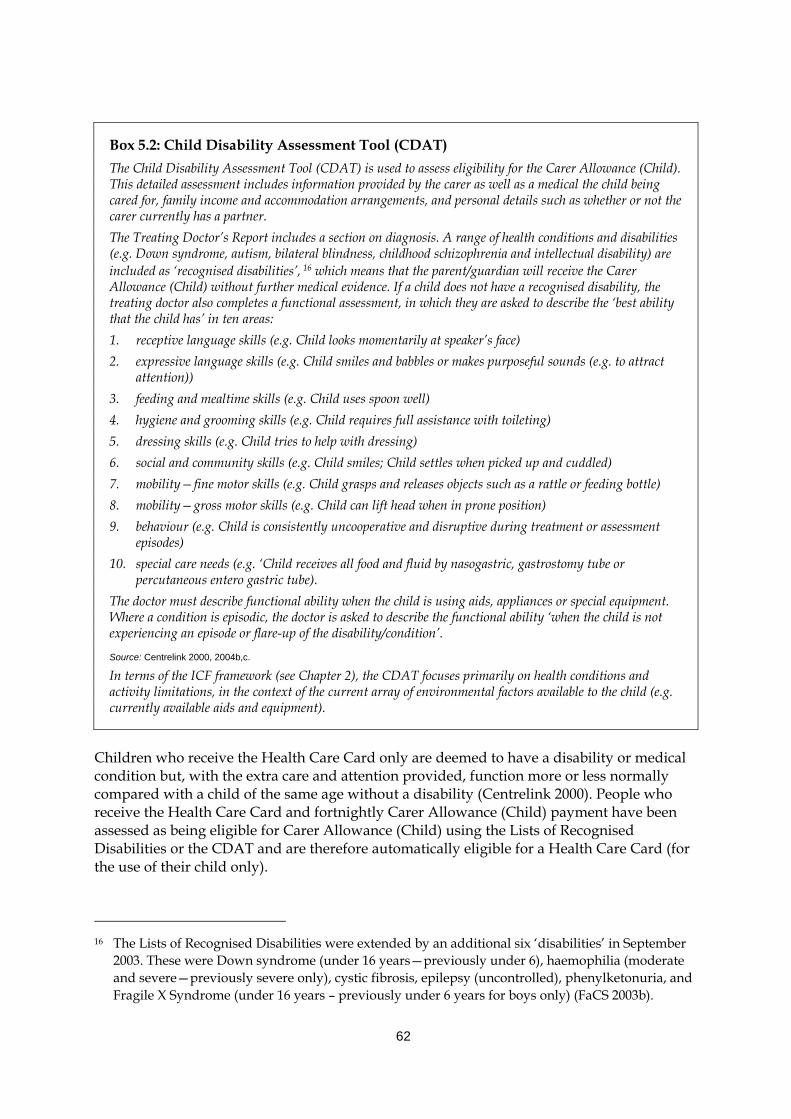
62
Box 5.2: Child Disability Assessment Tool (CDAT) The Child Disability Assessment Tool (CDAT) is used to assess eligibility for the Carer Allowance (Child). This detailed assessment includes information provided by the carer as well as a medical the child being cared for, family income and accommodation arrangements, and personal details such as whether or not the carer currently has a partner. The Treating Doctor’s Report includes a section on diagnosis. A range of health conditions and disabilities (e.g. Down syndrome, autism, bilateral blindness, childhood schizophrenia and intellectual disability) are included as ‘recognised disabilities’, 16 which means that the parent/guardian will receive the Carer Allowance (Child) without further medical evidence. If a child does not have a recognised disability, the treating doctor also completes a functional assessment, in which they are asked to describe the ‘best ability that the child has’ in ten areas: 1. receptive language skills (e.g. Child looks momentarily at speaker’s face) 2. expressive language skills (e.g. Child smiles and babbles or makes purposeful sounds (e.g. to attract
attention)) 3. feeding and mealtime skills (e.g. Child uses spoon well) 4. hygiene and grooming skills (e.g. Child requires full assistance with toileting) 5. dressing skills (e.g. Child tries to help with dressing) 6. social and community skills (e.g. Child smiles; Child settles when picked up and cuddled) 7. mobility—fine motor skills (e.g. Child grasps and releases objects such as a rattle or feeding bottle) 8. mobility—gross motor skills (e.g. Child can lift head when in prone position) 9. behaviour (e.g. Child is consistently uncooperative and disruptive during treatment or assessment
episodes) 10. special care needs (e.g. ‘Child receives all food and fluid by nasogastric, gastrostomy tube or
percutaneous entero gastric tube). The doctor must describe functional ability when the child is using aids, appliances or special equipment. Where a condition is episodic, the doctor is asked to describe the functional ability ‘when the child is not experiencing an episode or flare-up of the disability/condition’.
Source: Centrelink 2000, 2004b,c.
In terms of the ICF framework (see Chapter 2), the CDAT focuses primarily on health conditions and activity limitations, in the context of the current array of environmental factors available to the child (e.g. currently available aids and equipment).
Children who receive the Health Care Card only are deemed to have a disability or medical condition but, with the extra care and attention provided, function more or less normally compared with a child of the same age without a disability (Centrelink 2000). People who receive the Health Care Card and fortnightly Carer Allowance (Child) payment have been assessed as being eligible for Carer Allowance (Child) using the Lists of Recognised Disabilities or the CDAT and are therefore automatically eligible for a Health Care Card (for the use of their child only).
16 The Lists of Recognised Disabilities were extended by an additional six ‘disabilities’ in September
2003. These were Down syndrome (under 16 years—previously under 6), haemophilia (moderate and severe—previously severe only), cystic fibrosis, epilepsy (uncontrolled), phenylketonuria, and Fragile X Syndrome (under 16 years – previously under 6 years for boys only) (FaCS 2003b).
63
Other allowances and assistance People in receipt of Carer Payment or Carer Allowance (Child) may also be eligible for a range of other more generic income support allowances and assistance. These benefits include concession cards, Pharmaceutical Allowance, Pensioner Education Supplement, Rent Assistance, Remote Area Allowance and Family Tax Benefit, outlined briefly below in Boxes 5.3 and 5.4. Once a child turns 16 years of age they become eligible themselves for a range of payments such as the Disability Support Pension, Mobility Allowance etc.
Box 5.3: Concession cards The Australian Government provides a number of concession cards for eligible people with a disability and their carers. These cards entitle holders to a range of concessions on specific Commonwealth, state and territory, and local government services, as well as some private sector concessions (AIHW 2003d:20). The coverage of the cards varies somewhat across the country as concessions are granted according to state/territory discretion. Coverage areas include ambulance travel for isolated patients, glasses, dental care, taxi subsidies etc. (AIHW 2003d:20). Core areas agreed by all jurisdictions are energy consumption, water and sewerage, municipal rates and transport (including public transport, motor vehicle registration and licence fees) (AIHW 2003d:20). Two main types of concession card are relevant for carers of children with a disability: • Pensioner Concession Card; and • Health Care Card. A Pensioner Concession Card is automatically issued to people receiving a number of income support payments, including Carer Payment. The card entitles holders to Commonwealth health concessions, such as low-cost medicines under the Pharmaceutical Benefits Scheme, as well as additional health, household, educational and recreational concessions from state and local government authorities (FaCS unpublished data as cited in AIHW 2003d:20). A Health Care Card is automatically issued to people receiving most types of income support payments from Centrelink, including the Carer Allowance (Child). The Health Care Card assists with reducing the cost of some medicines under the Pharmaceutical Benefits Scheme, doctor’s fees (where bulk billing is offered) and other benefits that vary across states and territories (Centrelink 2003a). A more limited range of concessions at the state/territory and local government level are available using the Health Care Card, compared with the Pensioner Concession Card (FaCS unpublished data as cited in AIHW 2003d:354).
What level of assistance do carers of children generally receive? As at September 2004, Carer Allowance (Child) was a non-taxable payment of $90.10 per fortnight (Centrelink 2004a). 17 The maximum rate of Carer Payment, at this time (subject to income and assets tests) was $470.70 per fortnight for a single recipient, and $393.00 each for couples. The 2004–05 Federal Budget has also stipulated a one-off payment in June of $1,000 for carers receiving the Carer Payment and $600 for carers receiving the Carer Allowance, in respect of each eligible care recipient. The Pensioner Education Supplement is $31.20 a fortnight for an approved student with a study load of at least 25% but less than 50% (Centrelink 2004a). Rent Assistance varies
17 All payment information was obtained from the Centrelink web site in June 2004. The information
is provided on the web site as a guide only. Final payment rates are determined following detailed assessment through Centrelink.
64
according to the family situation and rent paid. These payments were effective as of March 2004.
Box 5.4: Other allowances and assistance for carers of children with disabilities Pharmaceutical Allowance In addition to concession cards, Carer Payment recipients may also be eligible for a Pharmaceutical Allowance to help pay for the cost of prescription medicines. Pharmaceutical Allowance is paid automatically with the Carer Payment (Centrelink 2003a). Pensioner Education Supplement People who are eligible for the Carer Payment may also be eligible for a Pensioner Education Supplement if the carer is undertaking approved study. The supplement is non-taxable and does not have an income or assets test (Centrelink 2003a). Rent Assistance People paying rent who are receiving a payment from Centrelink or the Family Assistance Office may be eligible for Rent Assistance. The rate of Rent Assistance depends on the type and amount of rent paid and the family situation (e.g. whether the recipient is single or has a partner)(Centrelink 2003a). For people with dependent children, Rent Assistance is usually paid with the Family Tax Benefit Part A (Centrelink 2003a). Remote Area Allowance Carers of children with disabilities may qualify for Remote Area Allowance if, for example, the child has a proven special health-related need that cannot be catered for locally. Family Tax Benefit Family Tax Benefit (Parts A and B) were introduced in 2000 as part of broader reforms to the Australian tax structure. Family Tax Benefit Part A is paid to low- and middle-income families with respect to each dependent child under 21 and/or dependent full-time student aged 21 to 24 years. The benefit is subject to an income and assets test. There are three rates of Family Tax Benefit Part A: maximum rate, part (or broken) rate and the base rate, depending on the family income. Maximum and part rates vary with the age of the child, with payments increasing for teenagers and young people. Family Tax Benefit Part B provides additional assistance to single-income families, including single parents, with a child under 16 or a child aged 16–18 years studying full-time. Higher rates are payable where families have a child less than 5 years. For single parents the benefit is not means-tested and for couple families the payment is means-tested on the income of the partner with the lower income (AIHW 2003d:222)
How many carers of children are on these benefits? In June 2003 there were well over 133,000 carers in receipt of Carer Allowance in relation to a child with disability (Table 5.1). This figure includes 119,003 people who received Carer Allowance (Child), 2,744 people who received Carer Allowance (Adult) as well as Carer Allowance (Child) and a further 11,749 people who received Carer Allowance Child Health Care Card only. People on Carer Allowance (Child) provided care to 153,553 children under 16 years (including 15,192 children eligible for the Health Care Card only)(FaCS 2003c). As at June 2003 there were 75,937 people receiving Carer Payment (FaCS 2003c). Three-quarters (75%) of Carer Payment recipients also received Carer Allowance. People on the Carer Payment provided care for 80,926 care receivers.
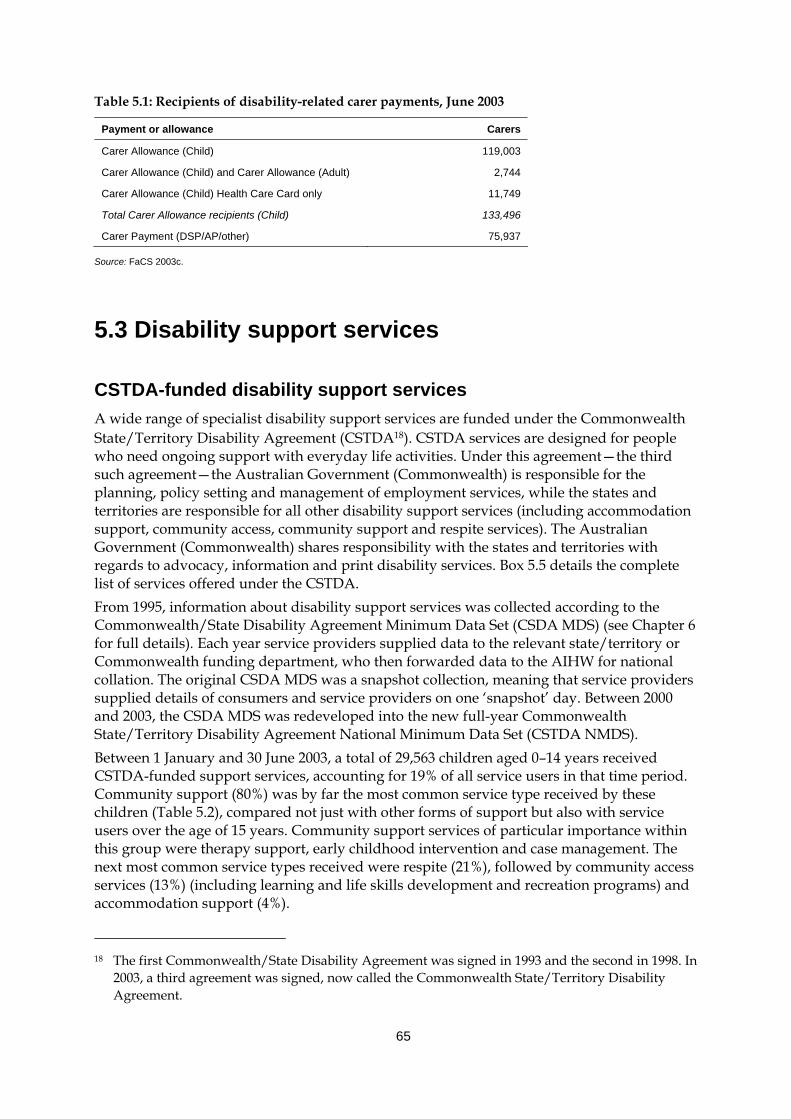
65
Table 5.1: Recipients of disability-related carer payments, June 2003
Payment or allowance Carers
Carer Allowance (Child) 119,003
Carer Allowance (Child) and Carer Allowance (Adult) 2,744
Carer Allowance (Child) Health Care Card only 11,749
Total Carer Allowance recipients (Child) 133,496
Carer Payment (DSP/AP/other) 75,937
Source: FaCS 2003c.
5.3 Disability support services
CSTDA-funded disability support services A wide range of specialist disability support services are funded under the Commonwealth State/Territory Disability Agreement (CSTDA18). CSTDA services are designed for people who need ongoing support with everyday life activities. Under this agreement—the third such agreement—the Australian Government (Commonwealth) is responsible for the planning, policy setting and management of employment services, while the states and territories are responsible for all other disability support services (including accommodation support, community access, community support and respite services). The Australian Government (Commonwealth) shares responsibility with the states and territories with regards to advocacy, information and print disability services. Box 5.5 details the complete list of services offered under the CSTDA. From 1995, information about disability support services was collected according to the Commonwealth/State Disability Agreement Minimum Data Set (CSDA MDS) (see Chapter 6 for full details). Each year service providers supplied data to the relevant state/territory or Commonwealth funding department, who then forwarded data to the AIHW for national collation. The original CSDA MDS was a snapshot collection, meaning that service providers supplied details of consumers and service providers on one ‘snapshot’ day. Between 2000 and 2003, the CSDA MDS was redeveloped into the new full-year Commonwealth State/Territory Disability Agreement National Minimum Data Set (CSTDA NMDS). Between 1 January and 30 June 2003, a total of 29,563 children aged 0–14 years received CSTDA-funded support services, accounting for 19% of all service users in that time period. Community support (80%) was by far the most common service type received by these children (Table 5.2), compared not just with other forms of support but also with service users over the age of 15 years. Community support services of particular importance within this group were therapy support, early childhood intervention and case management. The next most common service types received were respite (21%), followed by community access services (13%) (including learning and life skills development and recreation programs) and accommodation support (4%).
18 The first Commonwealth/State Disability Agreement was signed in 1993 and the second in 1998. In
2003, a third agreement was signed, now called the Commonwealth State/Territory Disability Agreement.
66
Services received by child service users for each disability group followed the same general pattern, that is, the majority of children received community support services, followed by respite or community access services (Table 5.3). The exception was children with psychiatric disabilities, for whom community access (34%) and accommodation support (26%) were the most common service types received.
Box 5.5: Service types offered under the CSTDA Accommodation support services provide accommodation to people with a disability and services that provide support needed to enable a person with a disability to remain in their existing accommodation or to move to more suitable or appropriate accommodation. Accommodation support includes large or small residential/institutions, hostels, group homes as well as attendant or personal care, in-home accommodation support and alternative family placement. Community support services provide the support needed for a person with a disability to live in a non-institutional setting. Community support services include therapy, early childhood intervention, behaviour/specialist intervention, counselling (individual, family or group), support provided by regional resource and support teams and case management, local coordination and development. Community access services are designed to provide opportunities for people with a disability to gain and use their abilities to enjoy their full potential for social independence. People who do not attend school, or who are not employed full-time mainly use these services. These services range from educational to leisure and recreational pursuits and may be offered in the home or in other facilities or locations. Community access services can be classified generally as learning and life skills development (often called Day Programs) or recreation/holiday programs. Respite services provide a short-term and time-limited break for families and other voluntary caregivers of people with disabilities, to assist in supporting and maintaining the primary caregiving relationship, while providing a positive experience for the person with a disability. Respite options include respite offered in the person’s own home, or it may be centre-based or provided by a host family. Employment services are designed to assist people with disabilities to enter the labour force. These services include open employment services (that provide employment assistance to people with a disability in obtaining and/or retaining paid employment in another organisation) and supported employment services (that support or employ people with a disability within the same organisation, often known as Business Services). Advocacy, information and print disability is a broad category, including a range of specific service types. Advocacy services are designed to enable people with a disability to increase the control they have over their lives through the representation of their interests and views in the community. Examples include individual advocacy and system/systematic advocacy. Information/referral services provide accessible information to people with disabilities, their carers, families and related professionals. This service type provides specific information about disability-specific and generic services, and equipment, and promotes the development of community awareness. Mutual support/self-help groups promote self-advocacy through the provision of information, support and assistance. Print disability/alternative formats of communication include alternative formats of communication for people who by reason of their disabilities are unable to access information provided in a print medium. Alternative formats include radio, TTY and braille. Other support services include research and evaluation (e.g. the measurement of outcomes for people with disabilities using services), training and development (e.g. to train disability-funded agencies to deliver higher quality or more appropriate services to people with disabilities), and peak bodies. Source: AIHW 2004c.
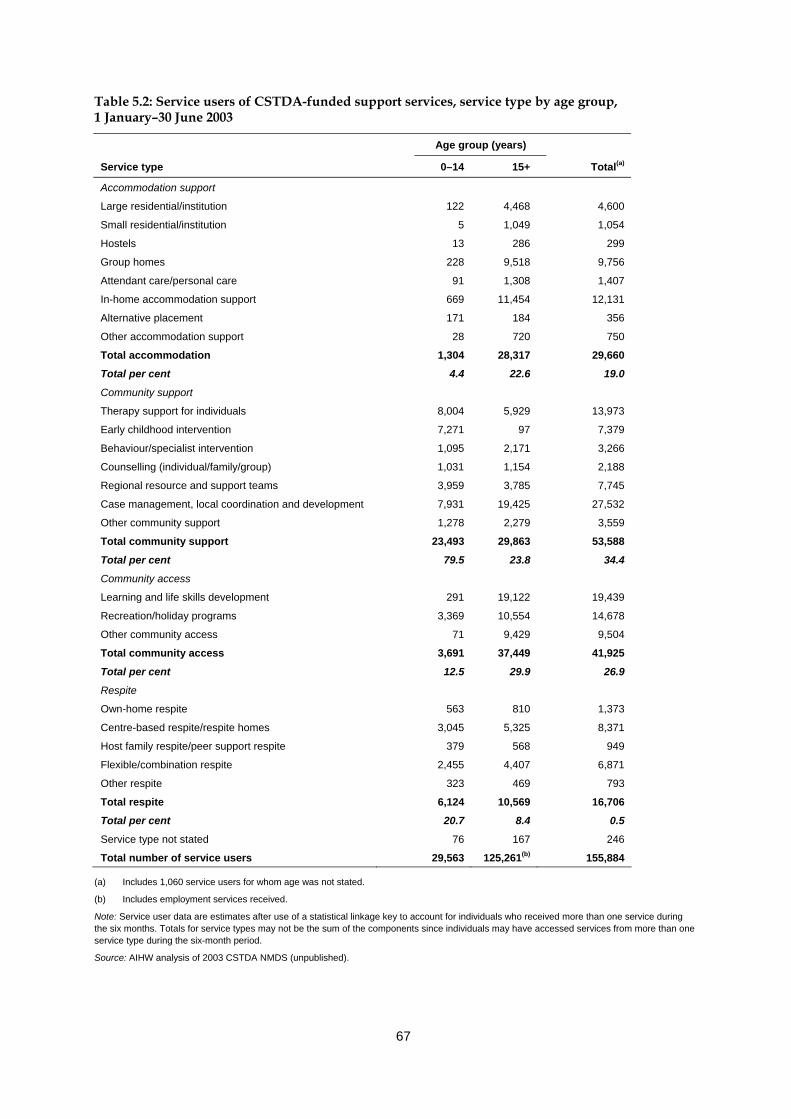
67
Table 5.2: Service users of CSTDA-funded support services, service type by age group, 1 January–30 June 2003
Age group (years)
Service type 0–14 15+ Total(a)
Accommodation support
Large residential/institution 122 4,468 4,600
Small residential/institution 5 1,049 1,054
Hostels 13 286 299
Group homes 228 9,518 9,756
Attendant care/personal care 91 1,308 1,407
In-home accommodation support 669 11,454 12,131
Alternative placement 171 184 356
Other accommodation support 28 720 750
Total accommodation 1,304 28,317 29,660
Total per cent 4.4 22.6 19.0
Community support
Therapy support for individuals 8,004 5,929 13,973
Early childhood intervention 7,271 97 7,379
Behaviour/specialist intervention 1,095 2,171 3,266
Counselling (individual/family/group) 1,031 1,154 2,188
Regional resource and support teams 3,959 3,785 7,745
Case management, local coordination and development 7,931 19,425 27,532
Other community support 1,278 2,279 3,559
Total community support 23,493 29,863 53,588
Total per cent 79.5 23.8 34.4
Community access
Learning and life skills development 291 19,122 19,439
Recreation/holiday programs 3,369 10,554 14,678
Other community access 71 9,429 9,504
Total community access 3,691 37,449 41,925
Total per cent 12.5 29.9 26.9
Respite
Own-home respite 563 810 1,373
Centre-based respite/respite homes 3,045 5,325 8,371
Host family respite/peer support respite 379 568 949
Flexible/combination respite 2,455 4,407 6,871
Other respite 323 469 793
Total respite 6,124 10,569 16,706
Total per cent 20.7 8.4 0.5
Service type not stated 76 167 246
Total number of service users 29,563 125,261(b) 155,884
(a) Includes 1,060 service users for whom age was not stated.
(b) Includes employment services received.
Note: Service user data are estimates after use of a statistical linkage key to account for individuals who received more than one service during the six months. Totals for service types may not be the sum of the components since individuals may have accessed services from more than one service type during the six-month period.
Source: AIHW analysis of 2003 CSTDA NMDS (unpublished).
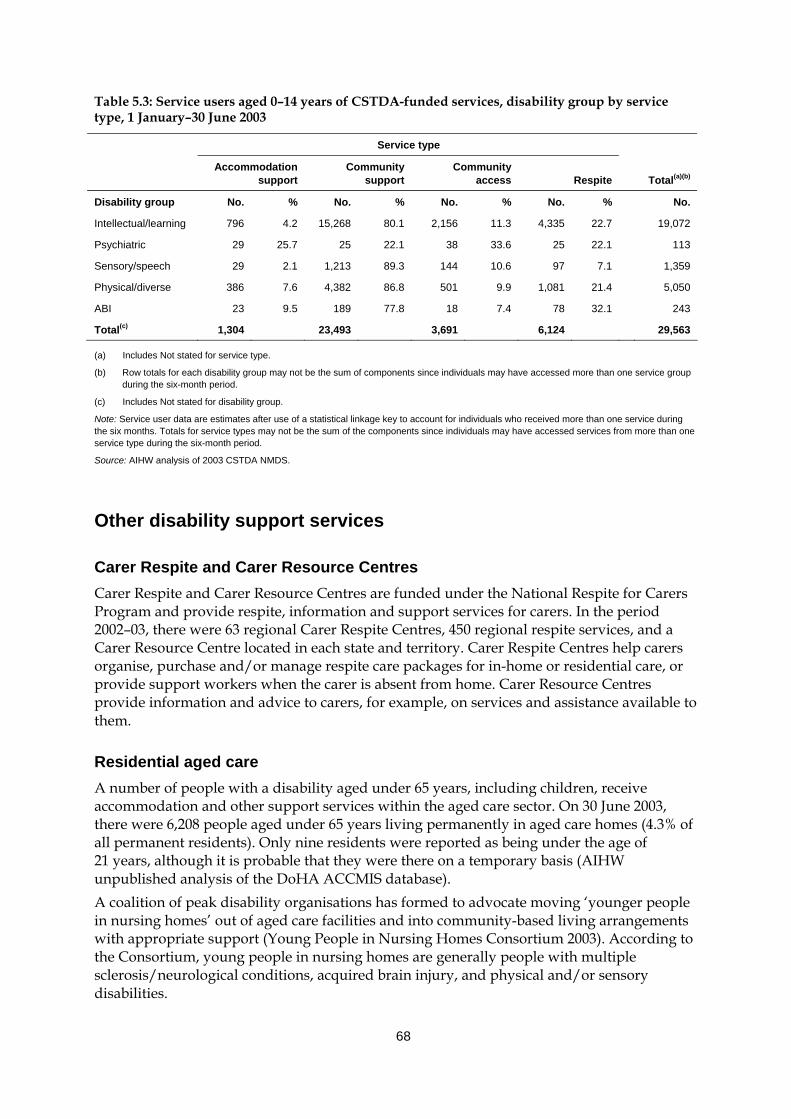
68
Table 5.3: Service users aged 0–14 years of CSTDA-funded services, disability group by service type, 1 January–30 June 2003
Service type
Accommodation
support Community
support Community
access Respite Total(a)(b)
Disability group No. % No. % No. % No. % No.
Intellectual/learning 796 4.2 15,268 80.1 2,156 11.3 4,335 22.7 19,072
Psychiatric 29 25.7 25 22.1 38 33.6 25 22.1 113
Sensory/speech 29 2.1 1,213 89.3 144 10.6 97 7.1 1,359
Physical/diverse 386 7.6 4,382 86.8 501 9.9 1,081 21.4 5,050
ABI 23 9.5 189 77.8 18 7.4 78 32.1 243
Total(c) 1,304 23,493 3,691 6,124 29,563
(a) Includes Not stated for service type.
(b) Row totals for each disability group may not be the sum of components since individuals may have accessed more than one service group during the six-month period.
(c) Includes Not stated for disability group.
Note: Service user data are estimates after use of a statistical linkage key to account for individuals who received more than one service during the six months. Totals for service types may not be the sum of the components since individuals may have accessed services from more than one service type during the six-month period.
Source: AIHW analysis of 2003 CSTDA NMDS.
Other disability support services
Carer Respite and Carer Resource Centres Carer Respite and Carer Resource Centres are funded under the National Respite for Carers Program and provide respite, information and support services for carers. In the period 2002–03, there were 63 regional Carer Respite Centres, 450 regional respite services, and a Carer Resource Centre located in each state and territory. Carer Respite Centres help carers organise, purchase and/or manage respite care packages for in-home or residential care, or provide support workers when the carer is absent from home. Carer Resource Centres provide information and advice to carers, for example, on services and assistance available to them.
Residential aged care A number of people with a disability aged under 65 years, including children, receive accommodation and other support services within the aged care sector. On 30 June 2003, there were 6,208 people aged under 65 years living permanently in aged care homes (4.3% of all permanent residents). Only nine residents were reported as being under the age of 21 years, although it is probable that they were there on a temporary basis (AIHW unpublished analysis of the DoHA ACCMIS database). A coalition of peak disability organisations has formed to advocate moving ‘younger people in nursing homes’ out of aged care facilities and into community-based living arrangements with appropriate support (Young People in Nursing Homes Consortium 2003). According to the Consortium, young people in nursing homes are generally people with multiple sclerosis/neurological conditions, acquired brain injury, and physical and/or sensory disabilities.
69
Under the CSTDA, the issue of younger people in residential aged care is included as an area for cooperative action between governments in bilateral agreements. At the July 2003 meeting of the Community and Disability Services Ministerial Council, disability ministers from the Australian, state and territory governments agreed that younger people in residential aged care will be a priority area for action under the CSTDA.
Home and Community Care (HACC) The HACC program provides community care services to frail and older people with disabilities, to younger people with disabilities, and to their carers. HACC services aim to enhance the independence of people in these groups and avoid their premature or inappropriate admission to long-term residential care. The program is jointly funded by the Commonwealth and the state and territory governments (AIHW 2003d:300). The bulk of home- and community-based services for older people are provided under the auspices of this program. However, the target population is people of all ages with a moderate, severe or profound level of disability (and their carers), and many young people, including children with disabilities, access HACC services. Services available under the HACC program include home nursing services, delivered meals, home help and home maintenance services, transport and shopping assistance, allied health services, home- and centre-based respite care, and advice and assistance of various kinds. HACC also provides brokered or coordinated care for some clients, through community options or linkages projects (AIHW 2003d:300). In the 2002–03 financial year, a total of 12,679 children under the age of 15 years received HACC services, accounting for 2.1% of all persons receiving such services (2002–03 HACC MDS, unpublished data). Of this group, 9,822, or 1.9% of all HACC clients, received services as a result of their own frailty or disability. Around 47% (4,601) of these clients were boys and 53% (5,162) were girls.
Hearing services The Office of Hearing Services purchases hearing services from a national network of private sector service providers and Australian Hearing, which is the sole government-funded provider of hearing services. Eligible people can obtain help by applying to the Office of Hearing Services for a hearing services voucher. Hearing assessment, hearing rehabilitation and the selection and fitting of hearing aids if required are the services available under this program. In addition eligible people may obtain maintenance of their hearing aids and devices and a regular supply of batteries on payment of an annual service charge (Centrelink 2003b). Australian Hearing delivers services to children and young adults up to the age of 21 years and age pensioners. For the financial year 2002–03, a total of 47,152 hearing services were provided to 28,015 clients under the age of 21 years (Australian Hearing 2003). Australian Hearing aims to fit children with hearing aids as early as possible and 33 babies less than six months of age were fitted with hearing aids during the same time period. As part of Australian Hearing’s services to Indigenous Australians, 356 visits were made to 129 communities by flying, driving or sailing to often remote and difficult-to-access locations (Australian Hearing 2003).
70
Aids and equipment and related services Aids and equipment are environmental factors with the potential to improve the life of people with disabilities by assisting them to achieve greater independence and less reliance on personal assistance (AIHW: Bricknell 2003). A large range of aids and equipment is available in Australia, to assist with mobility, self-care and communication and to treat medical conditions, as well as orthoses and prostheses and modifications made to the home. A range of government and non-government equipment services provide cost-free or low-cost aids to people with disabilities. Some of these services target specific disability or population groups (e.g. people with hearing impairments) and some are more generically targeted towards the provision of aids and equipment to assist people with self-care, mobility, communication and other needs (AIHW: Bricknell 2003). National equipment schemes funded by the Australian Government include Australian Hearing Services, Commonwealth Rehabilitation Service (CRS) and the Continence Aids Assistance Scheme (CAAS) but children are only eligible for assistance from the first. Children are also eligible for aids and equipment under equipment schemes funded by state and territory governments, for example, the Program of Appliances for Disabled People (PADP) in New South Wales and the Victorian Aids and Equipment Program in Victoria. Non-government organisations such as The Spastic Centre in New South Wales and the Cerebral Palsy League of Queensland also provide access to aids and equipment. Such schemes are generally self-funded and distribute equipment on a long-term or temporary loan basis. Aids and equipment can of course be purchased privately. However, individuals have more limited purchasing power than governments and one-off high-tech items such as wheelchairs and high-tech communication aids are extremely costly. ‘Despite recent reviews to improve the quality and delivery of aids, it still appears that these schemes do not provide complete coverage in terms of scope, size and the types of aids and equipment provided’ (AIHW: Bricknell 2003). The ‘system’ is administratively complex and cumbersome for families to negotiate. Long waiting times are a particular concern, especially as such waiting times appear to be systemic. As Dowling (2002) noted in her study of equipment use by children with disabilities.
‘Long waiting times create difficulties for all people with disabilities who need equipment. The developmental, maturation, sudden and rapid growth patterns of children, however, combine with changing, often critical, medical conditions to create a particular urgency about children’s need for equipment’.
There are currently no national administrative data available about the types of aids and equipment provided under government- or non-government-funded schemes. However, the ABS Survey of Disability, Ageing and Carers provides some insight into the types of equipment used by children with disabilities in Australia. According to the survey, 118,200 children aged 0–14 years with a disability (or 40% of children in this age group with a disability) used aids. This figure included 66,700 children aged 0–14 years with a severe or profound core activity restriction (46% of children in this category) who used aids (AIHW: Bricknell 2003). Nearly half of all children with a disability (49%) used medical aids, 16% used self-care or communication aids and 12% used mobility aids. Children using aids used an average of 1.5 aids (Table 5.4).
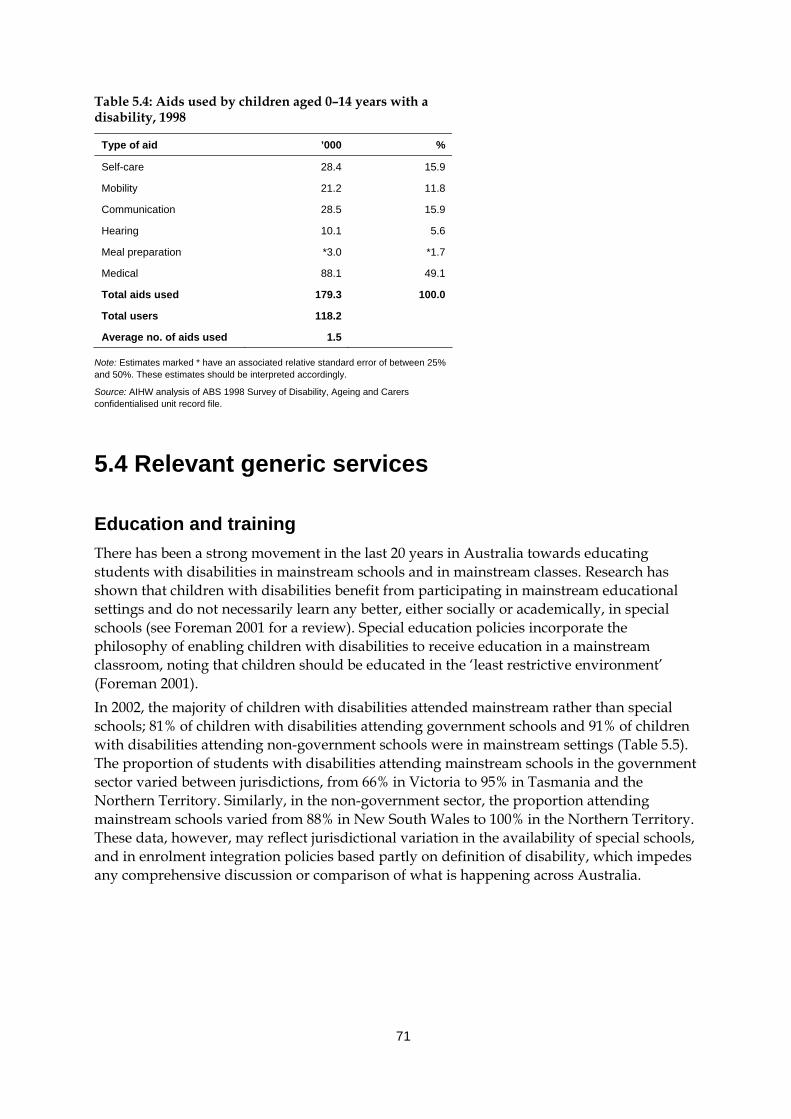
71
Table 5.4: Aids used by children aged 0–14 years with a disability, 1998
Type of aid ’000 %
Self-care 28.4 15.9
Mobility 21.2 11.8
Communication 28.5 15.9
Hearing 10.1 5.6
Meal preparation *3.0 *1.7
Medical 88.1 49.1
Total aids used 179.3 100.0
Total users 118.2
Average no. of aids used 1.5
Note: Estimates marked * have an associated relative standard error of between 25% and 50%. These estimates should be interpreted accordingly.
Source: AIHW analysis of ABS 1998 Survey of Disability, Ageing and Carers confidentialised unit record file.
5.4 Relevant generic services
Education and training There has been a strong movement in the last 20 years in Australia towards educating students with disabilities in mainstream schools and in mainstream classes. Research has shown that children with disabilities benefit from participating in mainstream educational settings and do not necessarily learn any better, either socially or academically, in special schools (see Foreman 2001 for a review). Special education policies incorporate the philosophy of enabling children with disabilities to receive education in a mainstream classroom, noting that children should be educated in the ‘least restrictive environment’ (Foreman 2001). In 2002, the majority of children with disabilities attended mainstream rather than special schools; 81% of children with disabilities attending government schools and 91% of children with disabilities attending non-government schools were in mainstream settings (Table 5.5). The proportion of students with disabilities attending mainstream schools in the government sector varied between jurisdictions, from 66% in Victoria to 95% in Tasmania and the Northern Territory. Similarly, in the non-government sector, the proportion attending mainstream schools varied from 88% in New South Wales to 100% in the Northern Territory. These data, however, may reflect jurisdictional variation in the availability of special schools, and in enrolment integration policies based partly on definition of disability, which impedes any comprehensive discussion or comparison of what is happening across Australia.
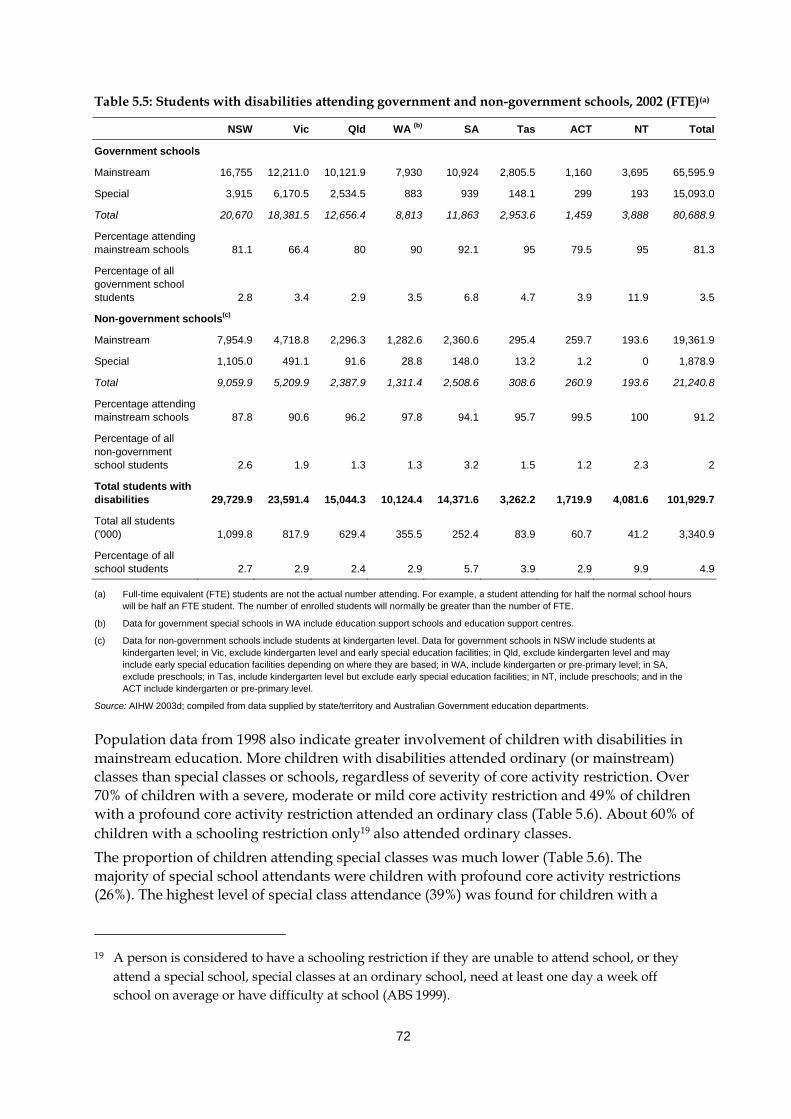
72
Table 5.5: Students with disabilities attending government and non-government schools, 2002 (FTE)(a)
NSW Vic Qld WA (b) SA Tas ACT NT Total
Government schools
Mainstream 16,755 12,211.0 10,121.9 7,930 10,924 2,805.5 1,160 3,695 65,595.9
Special 3,915 6,170.5 2,534.5 883 939 148.1 299 193 15,093.0
Total 20,670 18,381.5 12,656.4 8,813 11,863 2,953.6 1,459 3,888 80,688.9
Percentage attending mainstream schools 81.1 66.4 80 90 92.1 95 79.5 95 81.3
Percentage of all government school students 2.8 3.4 2.9 3.5 6.8 4.7 3.9 11.9 3.5
Non-government schools(c)
Mainstream 7,954.9 4,718.8 2,296.3 1,282.6 2,360.6 295.4 259.7 193.6 19,361.9
Special 1,105.0 491.1 91.6 28.8 148.0 13.2 1.2 0 1,878.9
Total 9,059.9 5,209.9 2,387.9 1,311.4 2,508.6 308.6 260.9 193.6 21,240.8
Percentage attending mainstream schools 87.8 90.6 96.2 97.8 94.1 95.7 99.5 100 91.2
Percentage of all non-government school students 2.6 1.9 1.3 1.3 3.2 1.5 1.2 2.3 2
Total students with disabilities 29,729.9 23,591.4 15,044.3 10,124.4 14,371.6 3,262.2 1,719.9 4,081.6 101,929.7
Total all students (’000) 1,099.8 817.9 629.4 355.5 252.4 83.9 60.7 41.2 3,340.9
Percentage of all school students 2.7 2.9 2.4 2.9 5.7 3.9 2.9 9.9 4.9
(a) Full-time equivalent (FTE) students are not the actual number attending. For example, a student attending for half the normal school hours will be half an FTE student. The number of enrolled students will normally be greater than the number of FTE.
(b) Data for government special schools in WA include education support schools and education support centres.
(c) Data for non-government schools include students at kindergarten level. Data for government schools in NSW include students at kindergarten level; in Vic, exclude kindergarten level and early special education facilities; in Qld, exclude kindergarten level and may include early special education facilities depending on where they are based; in WA, include kindergarten or pre-primary level; in SA, exclude preschools; in Tas, include kindergarten level but exclude early special education facilities; in NT, include preschools; and in the ACT include kindergarten or pre-primary level.
Source: AIHW 2003d; compiled from data supplied by state/territory and Australian Government education departments.
Population data from 1998 also indicate greater involvement of children with disabilities in mainstream education. More children with disabilities attended ordinary (or mainstream) classes than special classes or schools, regardless of severity of core activity restriction. Over 70% of children with a severe, moderate or mild core activity restriction and 49% of children with a profound core activity restriction attended an ordinary class (Table 5.6). About 60% of children with a schooling restriction only19 also attended ordinary classes. The proportion of children attending special classes was much lower (Table 5.6). The majority of special school attendants were children with profound core activity restrictions (26%). The highest level of special class attendance (39%) was found for children with a
19 A person is considered to have a schooling restriction if they are unable to attend school, or they
attend a special school, special classes at an ordinary school, need at least one day a week off school on average or have difficulty at school (ABS 1999).
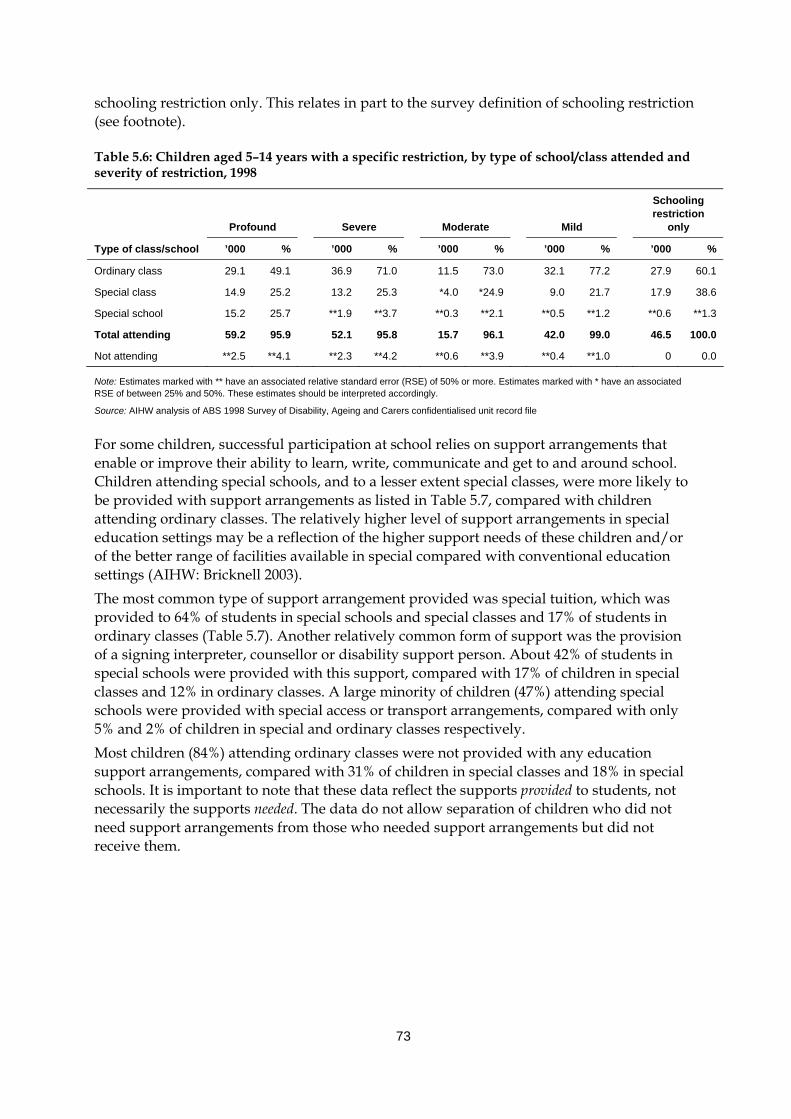
73
schooling restriction only. This relates in part to the survey definition of schooling restriction (see footnote).
Table 5.6: Children aged 5–14 years with a specific restriction, by type of school/class attended and severity of restriction, 1998
Profound
Severe
Moderate
Mild
Schooling restriction
only
Type of class/school ’000 % ’000 % ’000 % ’000 % ’000 %
Ordinary class 29.1 49.1 36.9 71.0 11.5 73.0 32.1 77.2 27.9 60.1
Special class 14.9 25.2 13.2 25.3 *4.0 *24.9 9.0 21.7 17.9 38.6
Special school 15.2 25.7 **1.9 **3.7 **0.3 **2.1 **0.5 **1.2 **0.6 **1.3
Total attending 59.2 95.9 52.1 95.8 15.7 96.1 42.0 99.0 46.5 100.0
Not attending **2.5 **4.1 **2.3 **4.2 **0.6 **3.9 **0.4 **1.0 0 0.0
Note: Estimates marked with ** have an associated relative standard error (RSE) of 50% or more. Estimates marked with * have an associated RSE of between 25% and 50%. These estimates should be interpreted accordingly.
Source: AIHW analysis of ABS 1998 Survey of Disability, Ageing and Carers confidentialised unit record file
For some children, successful participation at school relies on support arrangements that enable or improve their ability to learn, write, communicate and get to and around school. Children attending special schools, and to a lesser extent special classes, were more likely to be provided with support arrangements as listed in Table 5.7, compared with children attending ordinary classes. The relatively higher level of support arrangements in special education settings may be a reflection of the higher support needs of these children and/or of the better range of facilities available in special compared with conventional education settings (AIHW: Bricknell 2003). The most common type of support arrangement provided was special tuition, which was provided to 64% of students in special schools and special classes and 17% of students in ordinary classes (Table 5.7). Another relatively common form of support was the provision of a signing interpreter, counsellor or disability support person. About 42% of students in special schools were provided with this support, compared with 17% of children in special classes and 12% in ordinary classes. A large minority of children (47%) attending special schools were provided with special access or transport arrangements, compared with only 5% and 2% of children in special and ordinary classes respectively. Most children (84%) attending ordinary classes were not provided with any education support arrangements, compared with 31% of children in special classes and 18% in special schools. It is important to note that these data reflect the supports provided to students, not necessarily the supports needed. The data do not allow separation of children who did not need support arrangements from those who needed support arrangements but did not receive them.
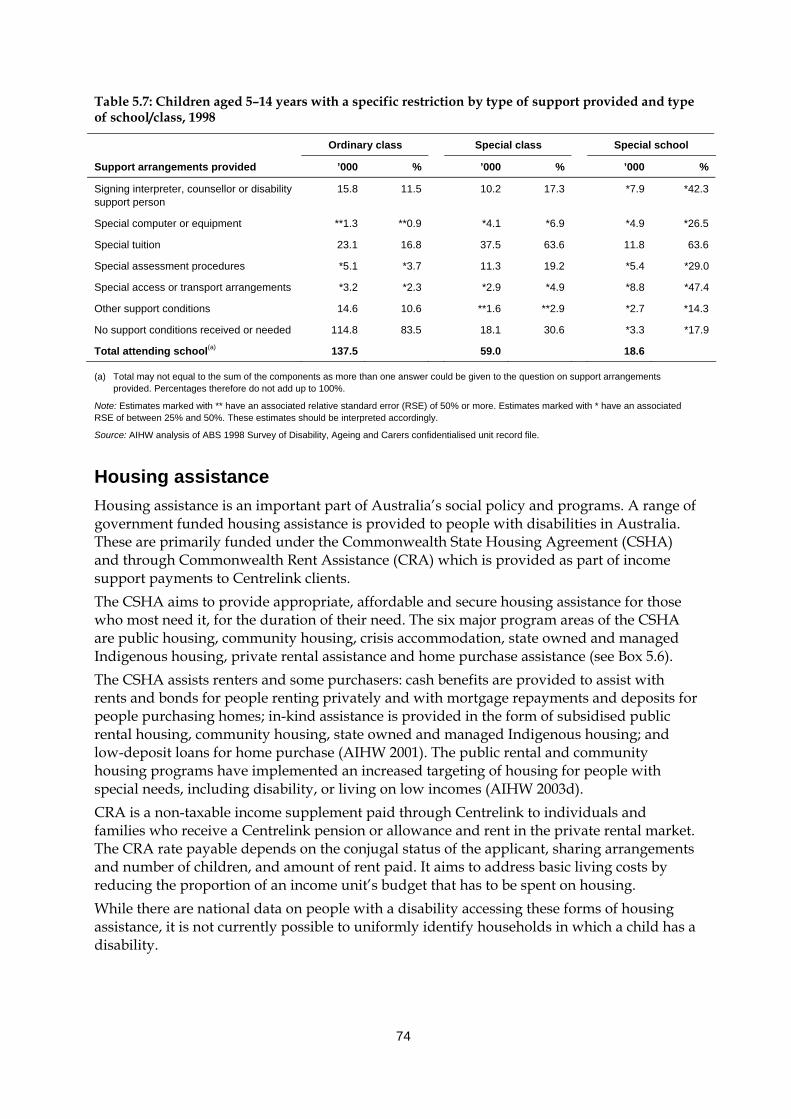
74
Table 5.7: Children aged 5–14 years with a specific restriction by type of support provided and type of school/class, 1998
Ordinary class Special class Special school
Support arrangements provided ’000 % ’000 % ’000 %
Signing interpreter, counsellor or disability support person
15.8 11.5 10.2 17.3 *7.9 *42.3
Special computer or equipment **1.3 **0.9 *4.1 *6.9 *4.9 *26.5
Special tuition 23.1 16.8 37.5 63.6 11.8 63.6
Special assessment procedures *5.1 *3.7 11.3 19.2 *5.4 *29.0
Special access or transport arrangements *3.2 *2.3 *2.9 *4.9 *8.8 *47.4
Other support conditions 14.6 10.6 **1.6 **2.9 *2.7 *14.3
No support conditions received or needed 114.8 83.5 18.1 30.6 *3.3 *17.9
Total attending school(a) 137.5 59.0 18.6
(a) Total may not equal to the sum of the components as more than one answer could be given to the question on support arrangements provided. Percentages therefore do not add up to 100%.
Note: Estimates marked with ** have an associated relative standard error (RSE) of 50% or more. Estimates marked with * have an associated RSE of between 25% and 50%. These estimates should be interpreted accordingly.
Source: AIHW analysis of ABS 1998 Survey of Disability, Ageing and Carers confidentialised unit record file.
Housing assistance Housing assistance is an important part of Australia’s social policy and programs. A range of government funded housing assistance is provided to people with disabilities in Australia. These are primarily funded under the Commonwealth State Housing Agreement (CSHA) and through Commonwealth Rent Assistance (CRA) which is provided as part of income support payments to Centrelink clients. The CSHA aims to provide appropriate, affordable and secure housing assistance for those who most need it, for the duration of their need. The six major program areas of the CSHA are public housing, community housing, crisis accommodation, state owned and managed Indigenous housing, private rental assistance and home purchase assistance (see Box 5.6). The CSHA assists renters and some purchasers: cash benefits are provided to assist with rents and bonds for people renting privately and with mortgage repayments and deposits for people purchasing homes; in-kind assistance is provided in the form of subsidised public rental housing, community housing, state owned and managed Indigenous housing; and low-deposit loans for home purchase (AIHW 2001). The public rental and community housing programs have implemented an increased targeting of housing for people with special needs, including disability, or living on low incomes (AIHW 2003d). CRA is a non-taxable income supplement paid through Centrelink to individuals and families who receive a Centrelink pension or allowance and rent in the private rental market. The CRA rate payable depends on the conjugal status of the applicant, sharing arrangements and number of children, and amount of rent paid. It aims to address basic living costs by reducing the proportion of an income unit’s budget that has to be spent on housing. While there are national data on people with a disability accessing these forms of housing assistance, it is not currently possible to uniformly identify households in which a child has a disability.
75
Box 5.6: Housing assistance programs under the Commonwealth State Housing Agreement (CSHA) Public housing Public housing is administered through the states and territories, which provide publicly owned dwellings that are funded through the CSHA and used to provide appropriate, affordable and accessible shelter for low to moderate income earners who are unable to enter the private market. Eligibility for public housing is determined by multi-faceted criteria designed to identify those most in need. State owned and managed Indigenous housing State-owned and managed Indigenous housing involves the government provision and administration of publicly owned dwellings funded through the CSHA. This program provides appropriate, affordable and accessible shelter for low to moderate income Indigenous families or those otherwise in housing need for the duration of their need. The dwellings are CSHA-funded stock that are put aside for allocation to Indigenous households only. Community housing Community housing is managed by non-profit community-based organisations such as local governments, churches and charity groups. Community housing is available to low income households and individuals who are eligible for public housing and who may have special needs best catered for by a community-managed organisation. It takes several forms: from emergency or crisis accommodation through medium-term or transitional accommodation to long-term housing. Some community housing providers assist specific groups, including people with support or care needs. Crisis accommodation The Crisis Accommodation Program provides emergency accommodation and funds are used for the purchase, lease and maintenance of dwellings that provide accommodation assistance to people who are homeless or in crisis. Private rental housing Private rental assistance is provided to low income households experiencing difficulty in securing or maintaining private rental accommodation. Assistance is provided in the form of bond loans, advance rent payments, cash assistance additional to Commonwealth Rent Assistance, rental grants and subsidies, relocation expenses and other one-off assistance grants. Home purchase Home purchase assistance is provided to people who wish to purchase a house but need assistance with financing. This program also provides an avenue for purchase of public housing by tenants. Home purchase assistance includes direct lending, deposit assistance, interest rate assistance, mortgage relief, and home purchase advisory and counselling services.
Source: AIHW 2001a, 2004e.
SAAP accommodation assistance SAAP clients identified as having a disability must have reported at least one of the following: • receiving the Disability Support Pension or DVA disability pension; • having been referred from a psychiatric unit to SAAP services; • reported having a psychiatric illness as a reason for seeking assistance; • coming from a hospital or psychiatric institution before or after receiving support; • requesting and/or receiving support from psychological, psychiatric, intellectual
disability or physical disability specialist services.
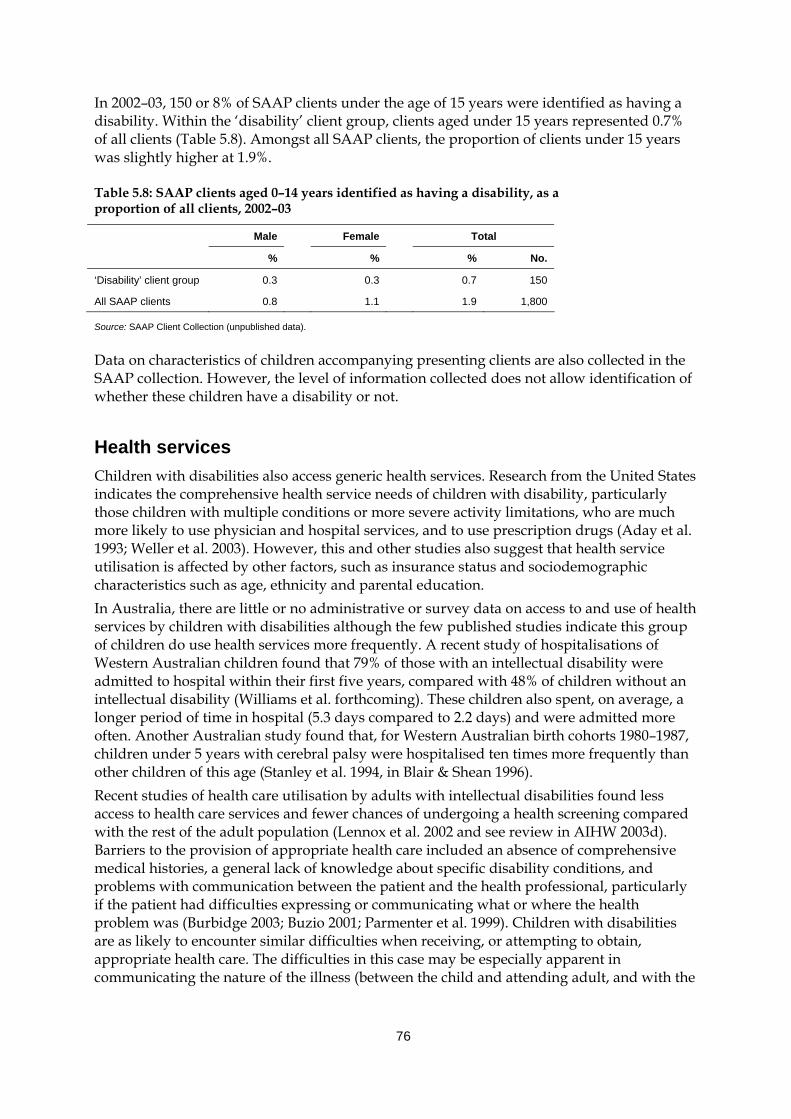
76
In 2002–03, 150 or 8% of SAAP clients under the age of 15 years were identified as having a disability. Within the ‘disability’ client group, clients aged under 15 years represented 0.7% of all clients (Table 5.8). Amongst all SAAP clients, the proportion of clients under 15 years was slightly higher at 1.9%.
Table 5.8: SAAP clients aged 0–14 years identified as having a disability, as a proportion of all clients, 2002–03
Male Female Total
% % % No.
‘Disability’ client group 0.3 0.3 0.7 150
All SAAP clients 0.8 1.1 1.9 1,800
Source: SAAP Client Collection (unpublished data).
Data on characteristics of children accompanying presenting clients are also collected in the SAAP collection. However, the level of information collected does not allow identification of whether these children have a disability or not.
Health services Children with disabilities also access generic health services. Research from the United States indicates the comprehensive health service needs of children with disability, particularly those children with multiple conditions or more severe activity limitations, who are much more likely to use physician and hospital services, and to use prescription drugs (Aday et al. 1993; Weller et al. 2003). However, this and other studies also suggest that health service utilisation is affected by other factors, such as insurance status and sociodemographic characteristics such as age, ethnicity and parental education. In Australia, there are little or no administrative or survey data on access to and use of health services by children with disabilities although the few published studies indicate this group of children do use health services more frequently. A recent study of hospitalisations of Western Australian children found that 79% of those with an intellectual disability were admitted to hospital within their first five years, compared with 48% of children without an intellectual disability (Williams et al. forthcoming). These children also spent, on average, a longer period of time in hospital (5.3 days compared to 2.2 days) and were admitted more often. Another Australian study found that, for Western Australian birth cohorts 1980–1987, children under 5 years with cerebral palsy were hospitalised ten times more frequently than other children of this age (Stanley et al. 1994, in Blair & Shean 1996). Recent studies of health care utilisation by adults with intellectual disabilities found less access to health care services and fewer chances of undergoing a health screening compared with the rest of the adult population (Lennox et al. 2002 and see review in AIHW 2003d). Barriers to the provision of appropriate health care included an absence of comprehensive medical histories, a general lack of knowledge about specific disability conditions, and problems with communication between the patient and the health professional, particularly if the patient had difficulties expressing or communicating what or where the health problem was (Burbidge 2003; Buzio 2001; Parmenter et al. 1999). Children with disabilities are as likely to encounter similar difficulties when receiving, or attempting to obtain, appropriate health care. The difficulties in this case may be especially apparent in communicating the nature of the illness (between the child and attending adult, and with the
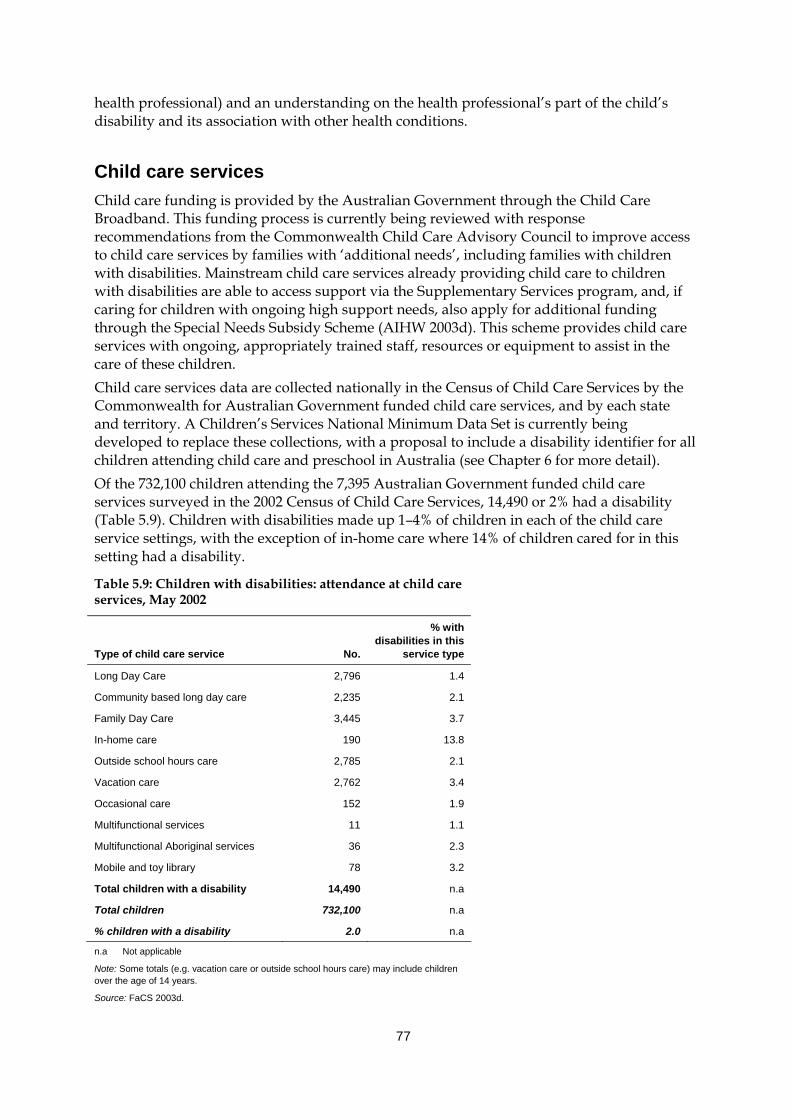
77
health professional) and an understanding on the health professional’s part of the child’s disability and its association with other health conditions.
Child care services Child care funding is provided by the Australian Government through the Child Care Broadband. This funding process is currently being reviewed with response recommendations from the Commonwealth Child Care Advisory Council to improve access to child care services by families with ‘additional needs’, including families with children with disabilities. Mainstream child care services already providing child care to children with disabilities are able to access support via the Supplementary Services program, and, if caring for children with ongoing high support needs, also apply for additional funding through the Special Needs Subsidy Scheme (AIHW 2003d). This scheme provides child care services with ongoing, appropriately trained staff, resources or equipment to assist in the care of these children. Child care services data are collected nationally in the Census of Child Care Services by the Commonwealth for Australian Government funded child care services, and by each state and territory. A Children’s Services National Minimum Data Set is currently being developed to replace these collections, with a proposal to include a disability identifier for all children attending child care and preschool in Australia (see Chapter 6 for more detail). Of the 732,100 children attending the 7,395 Australian Government funded child care services surveyed in the 2002 Census of Child Care Services, 14,490 or 2% had a disability (Table 5.9). Children with disabilities made up 1–4% of children in each of the child care service settings, with the exception of in-home care where 14% of children cared for in this setting had a disability.
Table 5.9: Children with disabilities: attendance at child care services, May 2002
Type of child care service No.
% with disabilities in this
service type
Long Day Care 2,796 1.4
Community based long day care 2,235 2.1
Family Day Care 3,445 3.7
In-home care 190 13.8
Outside school hours care 2,785 2.1
Vacation care 2,762 3.4
Occasional care 152 1.9
Multifunctional services 11 1.1
Multifunctional Aboriginal services 36 2.3
Mobile and toy library 78 3.2
Total children with a disability 14,490 n.a
Total children 732,100 n.a
% children with a disability 2.0 n.a
n.a Not applicable
Note: Some totals (e.g. vacation care or outside school hours care) may include children over the age of 14 years.
Source: FaCS 2003d.
78
5.5 Alternative care arrangements for children with disabilities Alternative care arrangements for children with disabilities in Australia include child protection and out-of-home care (for children at risk or experiencing neglect or harm), adoption services and the juvenile justice system. Currently, in Australia, responsibility for the provision of disability services and these alternative care arrangements for children with disabilities and their families lies within different government-funded community service programs in each state and territory. This partition means that similarly themed programs, such as early intervention support services, do not necessarily cross-check with regard to strategies and processes appropriate for providing care. There are now initial proposals to improve the interface between disability support and child protection services, with discussion on the potential for developing a national framework for the safeguarding of children with a disability in or at risk of entering the child protection system. Areas of interest include identifying current interface programs and potential areas for collective approach; training of child protection and disability support workers in each other’s field of expertise; and the reasons why children with disability are at risk of needing child protection. At issue is the deficiency of national data on alternative care arrangements for children with disabilities, which precludes any comprehensive assemblage of the level of contact children with disabilities have with alternative care arrangements. While there are national data collections which detail adoptions and child protection, they do not currently include data items which enable us to determine whether children have a disability. However, there are procedures in place to develop the child protection data collection into a unit record file in the next few years, thus introducing the potential for additional variables to be included in the collection. A national minimum data set and associated collection has also recently been established for juvenile justice but this data collection will also not include a disability identifier. If both the new juvenile justice and child protection collections include a statistical linkage key, it may be possible to provide statistical information concerning the proportion of children receiving services in one sector (e.g. disability services) who are also receiving services in another (e.g. child protection). What do other information sources tell us about the likelihood that children with disability will be adopted, or come into contact with the child protection or juvenile justice system?
Adoption In Australia, opportunities for adopting children with disabilities are few, primarily because the number of local placement adoptions tend to be relatively small compared with inter-country and known20 adoptions. In 2002–03, 16% (78) of all adoptions were local placement adoptions, most of which occurred in New South Wales, Victoria and Queensland (AIHW 2003f). Some of the larger Australian jurisdictions have specific programs for adoptive parents choosing to adopt a ‘special needs’ child, for example, the Special Placements Program in New South Wales and the Special Needs Children’s Adoption Program in Queensland. Children considered to have special needs include those with disabilities or 20 ‘Known’ child adoptions are adoptions of children who have a pre-existing relationship with the
adoptive parents and who are generally not available for adoption by anyone other than the adoptive parent(s) (AIHW 2003f).
79
serious medical conditions, but the program also covers older children, siblings that need to be placed together, and children from specific cultural backgrounds. Victoria has also implemented the Disability Services Initiative in Adoption and Permanent Care (DSIAPC) to find placements for children with intellectual disability or developmental delay. This scheme also provides discretionary funding of a maximum $5,000 per annum per child to assist families with costs associated with the child’s disability (Lunken & Grant 2002). Data on adoption numbers of special needs children are not currently published, and in some cases may not be collected, partly due to problems in defining disability. The most recent available data come from New South Wales where four of the 17 (23.5%) local placement adoptions in 2002–03 involved special needs children (NSW DoCS 2003). In Victoria, the DSPIAC scheme has aided the placement of 170 children with intellectual disability or development delay with permanent families since the early 1990s (Lunken & Grant 2002).
Child protection and out-of-home care Determining whether children with disabilities are more at risk of neglect or maltreatment from their family or other responsible adults is generally fraught by a lack of data and, when it is available, by the absence of a consistently applied definition of disability and collection methodology (Chenoweth 2002). The scant data available in Australia do not indicate children with disabilities are significantly at more risk of abuse or neglect. For example, of 293 child maltreatment cases in Victoria reviewed by Tomison (1994, in Tomison 1996), 32 or 11% involved a child with a ‘form of learning difficulty’. An earlier study by the New South Wales Department of Community Services reported 33 of 449 or 7% of registered child protection cases were identified as involving a child with a disability (Tomison 1996). In the United States, a somewhat different picture emerges. Analysis of the 1990 US National Incidence Study of Child Maltreatment found the incidence of maltreatment of children with disabilities to be 1.7 times higher than for children who did not have a disability (Crosse et al. 1993, in Kairys et al. 2001). Another US study, this one using merged school, social service and law enforcement databases in Omaha, Nebraska, determined that children with ‘educationally relevant disability’ were 3.4 times more likely to have suffered abuse (Sullivan & Knutson 2000). The vulnerability of children with a disability to maltreatment is affected by a range of factors based at the personal, family and service level (NSPCC 2003). A child’s impairment may prevent their being able to physically resist or avoid abuse, and those with communication difficulties are not necessarily able to tell or express what is going on. Family stresses associated with raising a child with high support needs also potentially expose a child to the risk of maltreatment if a caregiver starts to feel unable to cope. He or she may respond by neglecting the child’s support needs, or in extreme cases, by taking their stress out on the child through physical or emotional abuse. Access to community resources, and reliable coordination between support services, influence ability to cope, and the absence or lack of either potentially affects caregivers; coping strategies and how they deal with stress. If abuse or neglect is occurring, skill gaps between disability and child protection professionals amplify the chances of child maltreatment not being reported or acted upon. For example, a lack of awareness regarding childhood disability can result in failures to recognise the impact of abuse or neglect and/or prompt assumptions that a child’s behaviour or physical symptoms stem from the impairment rather than abuse. Budiselik (1999) has explored this problem for children with severe and multiple disabilities, arguing
80
that caregiver neglect, particularly in the area of therapy, is not always obvious, nor is its impact on the child easy to detect, and hence experienced case workers are needed to recognise when neglect is occurring. Attitudes and assumptions about disability can also influence child welfare workers to question the credibility of children with disabilities as witnesses and hence may stop proceedings on these grounds (NSPCC 2003). Child protection services in Australia are the responsibility of state and territory community services departments. Any concern regarding a child’s welfare can be brought to the attention of the relevant department by a family member or individual who knows the family, professionals in contact with the family, or the child himself or herself. This concern may relate to suspicion of harm, abuse or neglect of the child, or if the parents are unable to provide adequate care or protection. If an investigation of the child’s circumstances indicates he or she is at risk, the notification is substantiated with some children being put on a care and protection order and out-of-home care. The absence of a disability identifier in data collections prevents any comment on rates for children with disabilities compared with other children.
Juvenile justice There has been a long-held assumption that criminal behaviour, or delinquency, is associated with intellectual and learning disability but a re-evaluation of the literature suggests that this assumption is somewhat misplaced (Hayes 1997). Methodological issues, particularly the lack of standardised definitions and processes of assessment, make any comparison between studies difficult to achieve and probably explain the range in prevalence rates of delinquency amongst youth. While children with lower IQs are reported to be at a somewhat elevated risk of engaging in criminal behaviour in their adolescent years (see Hayes 1997 for a review), this association often disappears once socioeconomic status is considered (Eric Emerson 2004, personal communication). Nevertheless, there is some indication from overseas and Australian data that there is an over-representation of people with intellectual and learning disabilities in corrective services (Hayes & McIlwain 1988; Wagner 1992, in Garfinkel 1998 and see reviews in Hayes 1997 and Wall 1995). This may be because some offenders with an intellectual disability are being imprisoned by default, because of the absence of appropriate support services and alternative sentencing options (NSW Law Reform Commission 1998). However, obtaining a clear picture is impeded, in Australia at least, by a general lack of empirical evidence. For example, data on disability are not collected by police, courts, prisons or crime statistics agencies, the disability status is generally not determined for offenders and, if disability is recorded, different definitions of disability are used. Also inter-jurisdictional variation in statistics exists, due to a variation in sentencing, custodial/non-custodial options, parole practices and community service availability between jurisdictions (NSW Law Reform Commission 1998). The juvenile justice system in Australia includes, at the broadest level, the police, children’s and youth court, detention centres, and government agencies supervising court orders for custodial and community sentences, and is administered at the state and territory level (AIHW 1998). Children aged 10–17 years who have been charged with committing a criminal offence enter the juvenile justice system, although this age range is different for Tasmania (7–16 years), the Northern Territory (11–17 years) and the ACT (8–17 years) (AIHW 1998). In some jurisdictions, it is mandated that any child under 14 years is considered not to have known they were doing wrong when committing the crime. Those who have been found guilty of their crime receive either a custodial sentence, to be served at a youth detention
81
centre, or a non-detention order, involving community service, regular attendance at a centre, or some other deemed participatory obligation. Regardless of sentence type, juveniles are provided with a range of services, including those providing appropriate skills for re-entering the community. Generic services relevant to children with disabilities comprise access to mental health services and professionals, alcohol and drug specialist services, education programs, and living skills programs. Some states and territories have also administered more specific services such as a cognitive skills program in Queensland, therapeutic units in Western Australia and assessments of special needs in the Australian Capital Territory (AIHW 1998). To improve the situation for people with an intellectual disability who may enter the criminal justice system, the New South Wales Law Reform Commission recommended changes at various levels of the justice system (NSW Law Reform Commission 1996). While these recommendations were determined regarding adult offenders, many of these are likely to be just as relevant for juvenile offenders with disabilities. These recommendations include appropriate procedures for questioning, cautioning and interviewing, such as ensuring there is comprehension on the part of the arrested individual and the presence of a support person at the interview stage; training of involved personnel for better identification of people with disabilities and those fit to be tried, instigation of special court arrangements surrounding the giving of evidence (e.g. assistance of support person, closed circuit television), the implementation of special units and specialist services in prisons and detention centres, and specialist supervision and support services for those serving non-custodial sentences.
82
6 Data sources, data gaps and future directions
6.1 Introduction Australia is in the relatively privileged position of having a wealth of existing data sources that capture, in various formats and levels of detail, parts of the picture about the experiences of children with disabilities and their families. It is important to consider whether, with minor variations, data sources can be harnessed to provide a more complete picture of the needs and circumstances of this important group. This avoids major investment in new data collection infrastructure and maximises the benefits of the enormous efforts currently expended across various portfolios and sectors. This chapter provides a brief overview of the main data collections used in preparing this report, before describing in less detail a number of collections that were considered for analysis but not used, along with the reasons these sources were not used. This chapter therefore provides a valuable resource for others interested in statistics about children in general, or in statistics about children with disabilities. The chapter closes with a brief discussion of identified data gaps in relation to describing the needs and circumstances of children with disabilities and their families, some proposed changes that could increase the power of existing data sources, and future developments that may lead to improved data availability in the near future.
6.2 Data sources The main data source for this publication was the: (a) Australian Bureau of Statistics (ABS) Surveys of Disability, Ageing and Carers (SDAC)
(1981, 1988, 1993, 1998). Other useful data sources were the: (b) National Survey of Mental Health and Wellbeing; (c) Australian Birth Anomalies System; (d) Pharmaceutical Benefits Scheme (PBS) data; (e) Commonwealth State/Territory Disability Agreement National Minimum Data Set
(CSTDA NMDS); (f) Home and Community Care Program National Minimum Data Set (HACC NMDS); (g) Supported Accommodation Assistance Program National Data Collection (SAAP NDC); (h) Commonwealth Child Care Census; (i) Centelink data. Data sources considered for analysis but not used in this report were the: (j) ABS National Health Survey;
83
(k) National injury surveillance data; (l) National Hospital Morbidity Database; (m) National Housing Data Repository; (n) Longitudinal Data Set (LDS); (o) General Customer Survey (GCS); (p) Growing Up in Australia: The Longitudinal Survey of Australian Children (LSAC); (q) Footprints in Time: The Longitudinal Survey of Indigenous Children (LSIC); (r) Household Income and Labour Dynamics in Australia (HILDA); (s) Children’s Services National Minimum Data Set (CS NMDS); (t) ABS Child Care Survey; (u) Juvenile Justice National Minimum Data Set (JJ NMDS); (v) National Child Protection Collection; and (w) National Adoptions Collection. Details about each of these sources are provided below, along with the purpose for which they were used in the report or, in cases where they were not used, reasons they were not used for this report.
Main data source
(a) ABS Survey of Disability, Ageing and Carers (SDAC) The ABS disability surveys are an important source of national population data on disability, covering both rural and urban areas in all states and territories. Data are gathered from both households and cared accommodation (hospitals, nursing homes and hostels etc.) (ABS 1999). The ABS conducted surveys in 1981, 1988, 1993, 1998 and 2003, although data from the 2003 survey were not available for detailed analysis at the time of preparing this report. Survey definitions and main data items are discussed in Section 3.2. This section further describes the types of questions asked in relation to children’s disability in the 1998 ABS SDAC. It should be noted that the 1998 SDAC was the first time the ABS asked questions about the level of restriction (difficulty experienced by and need for help or supervision with activity areas) of children under 5 years. The 1998 SDAC commenced by asking a series of 17 screening questions of a responsible adult in a selected household to establish whether the household included a person with one or more disabilities (see Box 3.1). Proxy interviews were conducted in relation to all children under 15 years of age who were identified as having a disability and for children aged 15–17 years who were identified as having a disability and whose parents did not permit them to be personally interviewed (ABS 1999:53). Box 6.1 provides examples of the types of questions that were asked of proxy respondents in respect of children.
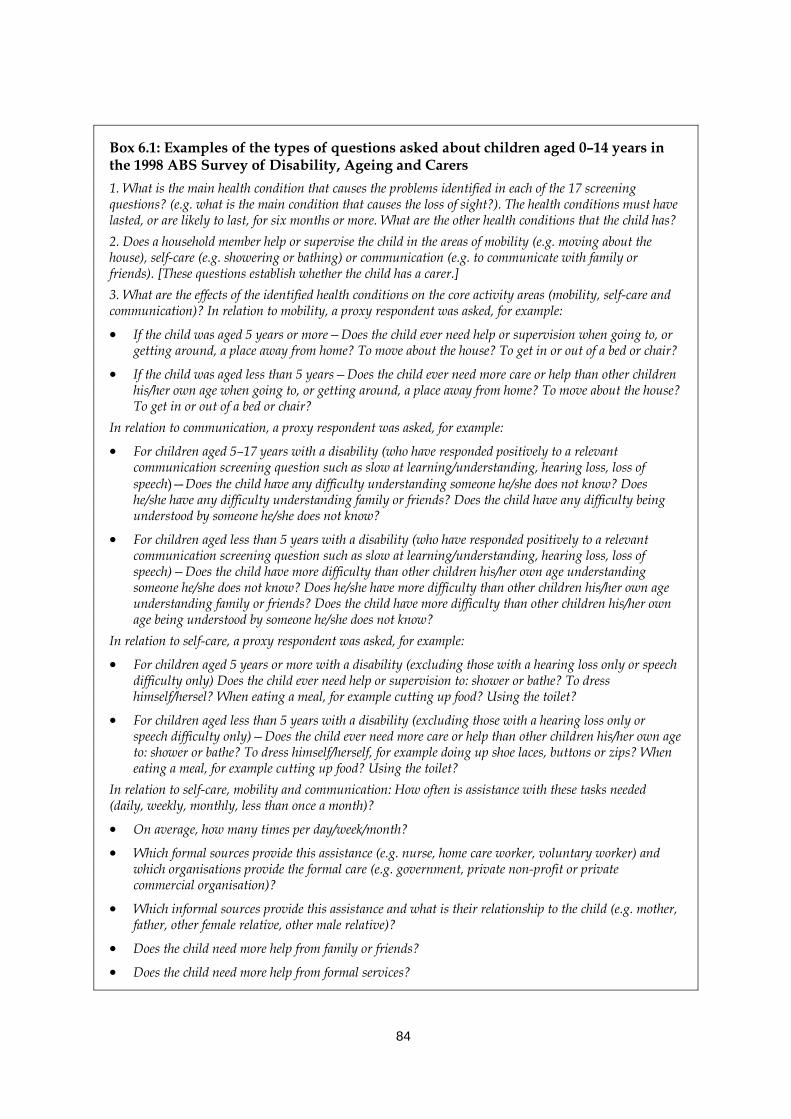
84
Box 6.1: Examples of the types of questions asked about children aged 0–14 years in the 1998 ABS Survey of Disability, Ageing and Carers 1. What is the main health condition that causes the problems identified in each of the 17 screening questions? (e.g. what is the main condition that causes the loss of sight?). The health conditions must have lasted, or are likely to last, for six months or more. What are the other health conditions that the child has? 2. Does a household member help or supervise the child in the areas of mobility (e.g. moving about the house), self-care (e.g. showering or bathing) or communication (e.g. to communicate with family or friends). [These questions establish whether the child has a carer.] 3. What are the effects of the identified health conditions on the core activity areas (mobility, self-care and communication)? In relation to mobility, a proxy respondent was asked, for example:
• If the child was aged 5 years or more—Does the child ever need help or supervision when going to, or getting around, a place away from home? To move about the house? To get in or out of a bed or chair?
• If the child was aged less than 5 years—Does the child ever need more care or help than other children his/her own age when going to, or getting around, a place away from home? To move about the house? To get in or out of a bed or chair?
In relation to communication, a proxy respondent was asked, for example:
• For children aged 5–17 years with a disability (who have responded positively to a relevant communication screening question such as slow at learning/understanding, hearing loss, loss of speech)—Does the child have any difficulty understanding someone he/she does not know? Does he/she have any difficulty understanding family or friends? Does the child have any difficulty being understood by someone he/she does not know?
• For children aged less than 5 years with a disability (who have responded positively to a relevant communication screening question such as slow at learning/understanding, hearing loss, loss of speech)—Does the child have more difficulty than other children his/her own age understanding someone he/she does not know? Does he/she have more difficulty than other children his/her own age understanding family or friends? Does the child have more difficulty than other children his/her own age being understood by someone he/she does not know?
In relation to self-care, a proxy respondent was asked, for example:
• For children aged 5 years or more with a disability (excluding those with a hearing loss only or speech difficulty only) Does the child ever need help or supervision to: shower or bathe? To dress himself/hersel? When eating a meal, for example cutting up food? Using the toilet?
• For children aged less than 5 years with a disability (excluding those with a hearing loss only or speech difficulty only)—Does the child ever need more care or help than other children his/her own age to: shower or bathe? To dress himself/herself, for example doing up shoe laces, buttons or zips? When eating a meal, for example cutting up food? Using the toilet?
In relation to self-care, mobility and communication: How often is assistance with these tasks needed (daily, weekly, monthly, less than once a month)?
• On average, how many times per day/week/month?
• Which formal sources provide this assistance (e.g. nurse, home care worker, voluntary worker) and which organisations provide the formal care (e.g. government, private non-profit or private commercial organisation)?
• Which informal sources provide this assistance and what is their relationship to the child (e.g. mother, father, other female relative, other male relative)?
• Does the child need more help from family or friends?
• Does the child need more help from formal services?
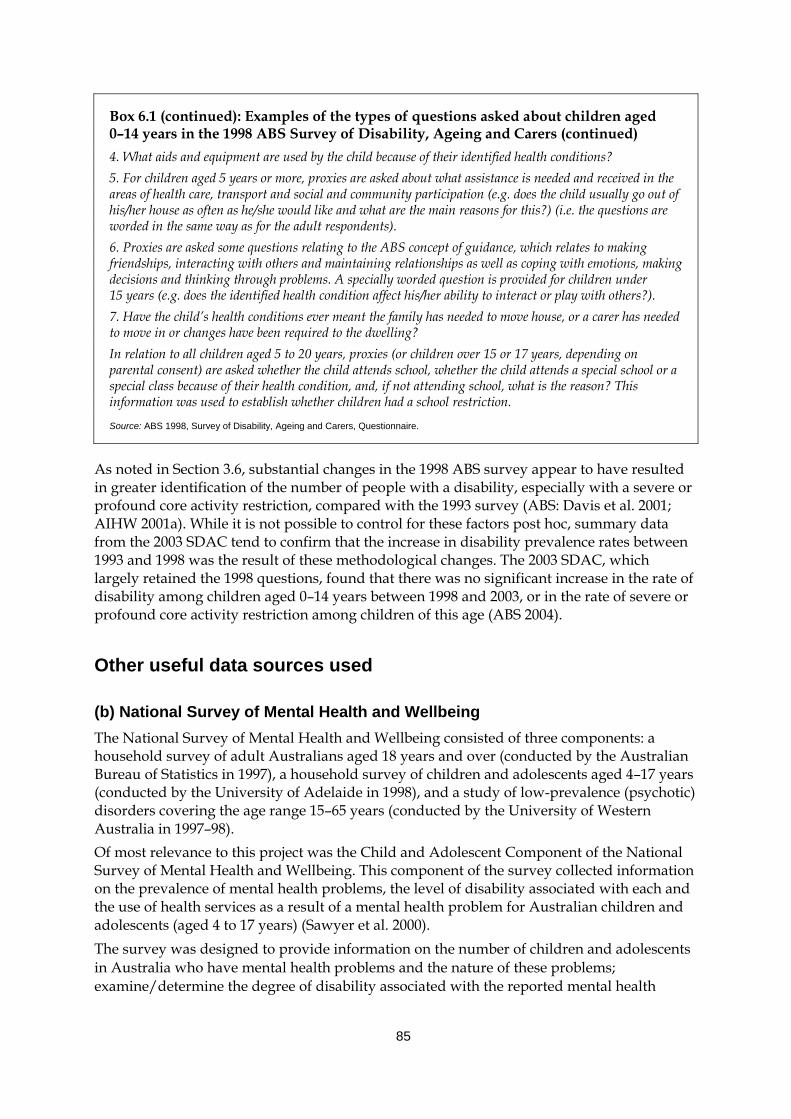
85
Box 6.1 (continued): Examples of the types of questions asked about children aged 0–14 years in the 1998 ABS Survey of Disability, Ageing and Carers (continued) 4. What aids and equipment are used by the child because of their identified health conditions? 5. For children aged 5 years or more, proxies are asked about what assistance is needed and received in the areas of health care, transport and social and community participation (e.g. does the child usually go out of his/her house as often as he/she would like and what are the main reasons for this?) (i.e. the questions are worded in the same way as for the adult respondents). 6. Proxies are asked some questions relating to the ABS concept of guidance, which relates to making friendships, interacting with others and maintaining relationships as well as coping with emotions, making decisions and thinking through problems. A specially worded question is provided for children under 15 years (e.g. does the identified health condition affect his/her ability to interact or play with others?). 7. Have the child’s health conditions ever meant the family has needed to move house, or a carer has needed to move in or changes have been required to the dwelling? In relation to all children aged 5 to 20 years, proxies (or children over 15 or 17 years, depending on parental consent) are asked whether the child attends school, whether the child attends a special school or a special class because of their health condition, and, if not attending school, what is the reason? This information was used to establish whether children had a school restriction.
Source: ABS 1998, Survey of Disability, Ageing and Carers, Questionnaire.
As noted in Section 3.6, substantial changes in the 1998 ABS survey appear to have resulted in greater identification of the number of people with a disability, especially with a severe or profound core activity restriction, compared with the 1993 survey (ABS: Davis et al. 2001; AIHW 2001a). While it is not possible to control for these factors post hoc, summary data from the 2003 SDAC tend to confirm that the increase in disability prevalence rates between 1993 and 1998 was the result of these methodological changes. The 2003 SDAC, which largely retained the 1998 questions, found that there was no significant increase in the rate of disability among children aged 0–14 years between 1998 and 2003, or in the rate of severe or profound core activity restriction among children of this age (ABS 2004).
Other useful data sources used
(b) National Survey of Mental Health and Wellbeing The National Survey of Mental Health and Wellbeing consisted of three components: a household survey of adult Australians aged 18 years and over (conducted by the Australian Bureau of Statistics in 1997), a household survey of children and adolescents aged 4–17 years (conducted by the University of Adelaide in 1998), and a study of low-prevalence (psychotic) disorders covering the age range 15–65 years (conducted by the University of Western Australia in 1997–98). Of most relevance to this project was the Child and Adolescent Component of the National Survey of Mental Health and Wellbeing. This component of the survey collected information on the prevalence of mental health problems, the level of disability associated with each and the use of health services as a result of a mental health problem for Australian children and adolescents (aged 4 to 17 years) (Sawyer et al. 2000). The survey was designed to provide information on the number of children and adolescents in Australia who have mental health problems and the nature of these problems; examine/determine the degree of disability associated with the reported mental health
86
problems; and provide information on the health services used by children and adolescents with mental health problems. Information was collected for the survey using the following methods: • behaviour checklists to identify mental health problems; • diagnostic interview schedule for children (parent version for children 6 to 17 years) to
identify mental disorders; • information obtained from parents (interview and questionnaire); and • information obtained from adolescents. Information was obtained from the parents of all participants and also from adolescents aged 13–17 years (Sawyer et al. 2000). The prevalence of mental health problems was based on scores obtained from the Child Behaviour Checklist, which was completed by parents. The Checklist scales identify mental health problems in three general areas (internalising problems such as anxiety or depression, externalising problems such as delinquency or aggression, total problems) and eight general areas (somatic complaints scale, delinquent behaviour scale, attention problems scale, aggressive behaviours scale, social problems scale, withdrawn behaviour scale, anxious/depressed scale and thought problems scale). Children or adolescents are considered to have a mental health problem if their score on the relevant scale was in the clinical range (that is, above a recommended threshold score) (Sawyer et al. 2000). The methodologies of this survey and the SDAC are quite varied, thus generating substantially different prevalence estimates (the former for ‘psychiatric disability’ and the latter for ‘mental health problems’). A small amount of data from the Survey of Mental Health and Wellbeing (Child and Adolescent Component) was presented in Chapter 3.
(c) Australian Birth Anomalies system The National Perinatal Statistics Unit, established in 1979, was responsible for collating and publishing data from the National Congenital Malformations and Birth Defects Data Collection between 1981 and 1997. This data collection was a compilation of notifications of major birth defects from state and territory birth defects registers and perinatal data systems. The data collection included information about mothers and babies, including demographic details, diagnosis, method of prenatal diagnosis, source of notification, birth outcome, plurality and birth order, birth weight, and previous pregnancies and outcomes (AIHW NPSU: Birch et al. 2004). The National Congenital Malformations and Birth Defects Data Collection was reviewed in 2004 to assess its utility and scope and make recommendations for its future. The review found that there was a lack of national consistency in birth defects data and that this affected the quality and utility of the national collection. A new Australian Birth Anomalies System was recommended and is currently under development. Data were presented in Section 3.4, which provided estimates of prevalence rates (birth and total) for selected birth defects in 2001. These data were prepared by the National Perinatal Statistics Unit, based on information provided by all jurisdictions except the Northern Territory.
(d) Pharmaceutical Benefits Scheme (PBS) data The Health Insurance Commission collects information on most prescriptions funded through the PBS and provides these data to the Australian Government Department of
87
Health and Ageing. Data are collected about the medication prescribed (e.g. type and cost of medication), the prescribing practitioner (e.g. speciality) and the supplying pharmacy (e.g. location). This report presents a small amount of PBS data in Section 3.6, which examines trends over time and state/territory for dexamphetamine prescriptions under the PBS. Dexamphetamine is the most commonly prescribed drug to treat ADHD.
(e) Commonwealth State/Territory Disability Agreement National Minimum Data Set (CSTDA NMDS) The CSTDA NMDS facilitates the annual collation of nationally comparable data about CSDTA-funded services (see Section 5.3 for further detail about the CSTDA). The original Commonwealth/State Disability Agreement Minimum Data Set (CSDA MDS), collected from 1994 to 2002, provided information about clients and service providers on one ‘snapshot’ day. Data items included administrative information about the service provider (e.g. service type, staff hours) and a range of service user characteristics (e.g. date of birth, Indigenous status, living arrangements, disability group and support needs). The CSDA MDS was redeveloped between 2000 and 2003. The redeveloped collection, now known as the Commonwealth State/Territory Disability Agreement National Minimum Data Set (CSTDA NMDS) has been collected from 1 January 2003. The CSTDA NMDS now provides information about all clients seen over the full year and includes a range of additional data items (e.g. information about carer arrangements via data items such as carer relationship to service user and carer age group) as well as information about the type and quantity of all services received by each client over the year. As in the CSDA MDS (since 1997), a statistical linkage key is used to estimate client numbers and account for individuals who received more than one service during the reporting period. For this report, data from the CSTDA NMDS for the period 1 January 2003 to 30 June 2003 were used in Section 5.3 to look at the numbers of children aged 0–14 years according to the service type(s) received and the child’s primary disability group. Section 3.6 drew on CSDA MDS ‘snapshot’ day data to examine the relative numbers of children aged 0–14 years receiving CSTDA-funded services between 1999 and 2002.
(f) Home and Community Care Program National Minimum Data Set (HACC NMDS) The Home and Community Care (HACC) program provides community care services to frail aged and younger people with disabilities, and their carers. The HACC program aims to provide a range of basic maintenance and support services for frail aged people, people with a disability and their carers, and support these people to be more independent at home and in the community, thereby enhancing their quality of life and/or preventing their inappropriate admission to long-term residential care (DoHA 2004a). The type of services funded through the HACC Program include nursing care; allied health care; meals and other food services; domestic assistance; personal care; home modification and maintenance; transport; respite care; counselling, support, information and advocacy; and assessment. HACC is a joint Australian, state and territory cost-shared program. The Home and Community Care Program National Minimum Data Set (HACC MDS) is reported three-monthly by HACC-funded agencies, who are required to report details for each known client who has received any HACC-funded assistance in the reporting period (DoHA 2004b).
88
Data items about each client include date of birth, sex, accommodation setting, living arrangements, postcode, carer relationship, as well as a number of data items relating to the type and quantity of service received by the client. HACC MDS data were used in this report in Section 5.3 to examine the number of children aged 0–14 years who accessed HACC program services.
(g) Supported Accommodation Assistance Program National Data Collection (SAAP NDC) The SAAP NDC collects a range of information from all agencies funded under the Supported Accommodation Assistance Program (SAAP). SAAP is Australia’s major program response to the needs of people who are homeless or at risk of being homeless. The overall aim of the program is to provide transitional supported accommodation and related support services to help homeless people achieve the maximum possible degree of self-reliance and independence. The SAAP NDC comprises a number of different collections: • a client collection, which includes information on all clients receiving ongoing or
substantial support under SAAP; • an unmet demand collection, which operates over a one-week period, twice a year, and
which collects information about the number of people who request support or accommodation at SAAP agencies but, for whatever reason, are not provided with the desired service;
• a casual client collection, which is collected for a two-week period each year and which collects information about one-off types of assistance provided to casual clients (those who receive only one-off assistance requiring less than one hour of a SAAP worker’s time and do not establish an ongoing relationship with the agency);
• an administrative data collection, which contains descriptive information (such as the number, size, structure and service mode) about the 1,200 or so non-government and community organisations providing accommodation and support services to people who are homeless or in crisis; and
• a special issues collection, which includes provision to conduct a limited number of special issues collections (past special issues included casual clients, support provided to accompanying children and resources available to agencies assisting children) (AIHW 2004f).
SAAP NDC data were used in Section 5.4 to estimate the number of children aged 0–14 years with a ‘disability’ who accessed SAAP services in 2002–03. In the SAAP collection, the concept of ‘disability’ is estimated using a series of proxy measures, described in Section 5.4.
(h) Commonwealth Child Care Census The Commonwealth Child Care Census is a census of Commonwealth-funded child care providers, conducted by the Australian Government Department of Family and Community Services (FaCS). The census collects information from Commonwealth Child Care Support service providers on their staff, the children and parents using the service and various other aspects of service provision. Types of child care covered include long day care centres, family day care, occasional/other care, before/after school care and vacation care. The latest census was conducted in 2002 (AIHW 2003d).
89
Data items of interest to this report were the: • number and characteristics of children in the last 12 months supported by the
Commonwealth Government’s Special Needs Subsidy Scheme—a program which provides support for children with ongoing high support needs to participate to their full potential in mainstream child care through the provision of staffing and access to equipment, resources etc.; and
• number and characteristics of children in the last 12 months needing assistance from the Supplementary Services Program—a program which aims to assist children with additional needs (e.g. culturally diverse background, children with a disability, Aboriginal or Torres Strait Islander children) to participate equally in child care services. Forms of assistance may include helping children settle in, cultural activities, talking to parents/professionals, support in implementing appropriate programs, training, equipment and resources.
The Commonwealth Child Care Census has been conducted since 1986 and is expected to be replaced by the new Children’s Services National Minimum Data Set (see below), which extends the scope to include state-funded childcare as well as preschool services. FaCS estimates of the number of children attending child care services who have a disability were presented in Section 5.4 of this report.
(i) Centrelink data Data collected by Centrelink and held by the Australian Government Department of Family and Community Services about numbers of people on various carer payments were presented in Chapters 3 and 5. As part of the process of establishing eligibility for income support benefits and assistance, a range of information is collected by Centrelink about its customers. For example, to determine a parent/guardian’s qualification for Carer Allowance (in relation to child under 16 years of age with a disability) the parent/guardian completes a functional assessment form and the child’s doctor is asked to complete a Treating Doctor’s Report. See Box 5.2 for further detail of the types of questions asked of parents/guardians and doctors. The vast majority of this information is held electronically by Centrelink and specific tables can be requested from Centrelink by emailing [email protected]. Analysis of information from this data source presents an interesting possibility for future analysis.
Data sources considered for analysis but not used in this report
(j) ABS National Health Survey The ABS National Health Surveys collect information about the health status of Australians, their use of health services and facilities, and health-related aspects of their lifestyle such as smoking, alcohol consumption and exercise (ABS 1997, 2002b). Information most relevant to disability in the national health surveys is derived from the data items about long-term conditions, which are defined as medical conditions (illness, injury or disability) that have lasted or are expected to last six months or more. The health survey data are used to extract prevalence estimates of long-term conditions for comparison with those derived from the disability surveys and other data sources.
90
National health surveys cover only people in households and exclude people in hospitals, nursing homes and other institutions. This may contribute to an underestimation of the prevalence of long-term conditions in the Australian population based on these data. Questions asked in relation to children include their demographic information and for older children their socioeconomic characteristics (information is collected from all children aged 0–6 years and one child aged 7–17 years). For example, there are questions on the child’s sex; age; date of birth; Indigenous status; country of birth; year of arrival; household type; language; proxy education; proxy current labour force; child labour force; child income; child immunisation; breastfeeding; assessment of child health; height/weight; exercise; sun protection; nutrition; asthma; cancer; heart and circulatory conditions; diabetes; eyesight; hearing; arthritis; long-term conditions; all conditions; injuries; time off work/school; use of health services; private health insurance; proxy income; proxy partner/spouse income. As would be expected, this survey focuses on health conditions and does not include information that relates to the concept of disability more broadly. Thus, it would be possible to use the National Health Survey to explore characteristics of children who identify certain health conditions as a long-term health condition, and compare these characteristics to children with other long-term health conditions or no long term health conditions. This type of analysis warrants further exploration, particularly in terms of whether the sample size is sufficient to generalise conclusions, but was considered outside the scope of this report. Related analysis has been undertaken by the AIHW in Disability and its Relationship to Health Conditions and Other Factors (AIHW 2004g). This report compares prevalence estimates of long-term health conditions from both the SDAC and the National Health Survey. Prevalence rates from the National Health Survey tend to be higher than those from the SDAC which is perhaps not surprising given that the disability survey records only health conditions associated with disability. The AIHW report also notes that the national health survey data file for 2001 did not include information on a number of selected health conditions that were highly related to disability (e.g. ADHD, cerebral palsy). This may present a limitation to the usefulness of the National Health Survey in possible future analysis of childhood disability.
(k) National injury surveillance data The AIHW National Injury Surveillance Unit (NISU), a collaborating unit of the AIHW, aims to inform community discussion and support policy making on the prevention and control of injury in Australia by developing, coordinating, interpreting and disseminating relevant information, research and analysis. National injury surveillance is currently limited to three main sources: analysis of annual hospital separations data compiled by the AIHW (see National Hospital Morbidity Database below); analysis of deaths data compiled by the ABS; and analysis of intermittent population surveys conducted by the ABS such as the National Health Survey (AIHW: Bradley & Harrison 2003). Data from these sources enable analysis of injury incidence and demographics associated with the injured, but are limited to the more severe injuries. Furthermore, these sources do not include information about impairments, activity limitations or participation restrictions. In 1997, the NISU summarised progress and current issues in relation to child injury prevention. As part of this work, NISU collated information about deaths and hospitalisations of children (aged 0–4, 5–9 and 10–14 years). For example, in the case of deaths, trends over time were estimated for boys and girls of the above ages according to major cause groups such as ‘motor vehicle occupant deaths’, ‘child pedal cycle deaths’, ‘child pedestrian deaths’, ‘child drowning deaths’ and ‘child fire and flame related deaths’ (AIHW
91
NISU 1997). Hospitalisation data were also used to estimate child hospitalisation rates by children of the above age groups according to major cause groups. While these data are interesting in terms of monitoring childhood injury, particularly in relation to injury prevention measures, they do not provide information about whether non-fatal injuries are subsequently associated with disability. The injury surveillance data were therefore of limited value to this report.
(l) National Hospital Morbidity Database The National Hospital Morbidity Database is a compilation of electronic summary records for patients admitted to Australian hospitals. It includes data from public acute and psychiatric hospitals, private acute and psychiatric hospitals, and private free-standing day hospital facilities (AIHW 2002b). The information in the database includes demographic and diagnosis data for patients, data on procedures undertaken, length of stay, and external cause of injury and poisoning. Diagnoses and procedures are classified and coded using the ICD–10–AM. The latest available data from this database are for 2001–2002, which details hospital ‘separations’ (i.e. discharges, transfers, deaths or changes in care type) between 1 July 2001 and 30 June 2002. Data on patients who were admitted during this period are included, provided that they also separated in this period. A record is included for each separation, so patients who separated more than once in the year have more than one record in the database.
(m) National Housing Database The National Housing Data Repository holds the following data: 1) CSHA funded data collections; 2) Commonwealth Housing Dataset (including Commonwealth Rent Assistance data) The CSHA consists of a multilateral agreement and bilateral agreements between the Commonwealth, and each state and territory. The National Housing Data Agreement (NHDA), a subsidiary agreement to the CSHA, specifies the agreed data that will be provided for national collation by all signatories to the CSHA. The AIHW collates data provided by the jurisdictions and manages the data as part of the National Housing Data Repository. The data repository contains information from the six data collections funded under the CSHA: • Public Rental Housing; • State owned and managed Indigenous Housing; • Community Housing; • Home Purchase Assistance; • Crisis Accommodation; • Private Rent Assistance. A special needs item was trialled in the Public Rental Housing National Minimum Dataset 2001–02. Households with a person with a disability were identified. It is therefore possible to calculate the number of people with a disability accessing public rental housing assistance, although not the number of households in which a child with a disability lives.
92
The Commonwealth Housing Data set, which includes Commonwealth Rent Assistance (CRA) data, is collected by Centrelink. The data set contains information about income units in receipt of income support including rent assistance. CRA recipients are individuals in receipt of a Centrelink pension or allowance, or an amount of Family Tax Benefit over the base rate of Family Tax Benefit Part A (FTB A), who pay private rent above minimum thresholds. The data set has a disability item for the client and his/her partner where the item describes the medical condition e.g. asthma, cystic fibrosis. If an individual has multiple medical conditions only the first record is extracted.
(n) Longitudinal Data Set (LDS) Since January 1995, the Australian Government Department of Family and Community Services (FaCS), via Centrelink, has been accumulating full extracts of its operational databases. These fortnightly extracts are stored in the FaCS Longitudinal Warehouse, which describes customers’ characteristics and payment details. A more manageable 1% sample named the Longitudinal Data Set (LDS), has been created from the Longitudinal Warehouse, which enables policy analysts and researchers, both within and outside FaCS, to monitor the outcomes of a large sample of FaCS customers. The LDS population covers the whole of Australia and includes FaCS customers administered under the Social Security Act 1991 and the Family Assistance Act 1999, their partners and their eligible children. Everyone in the LDS is either: • a Centrelink customer who is currently in receipt of an income support payment; • a Centrelink customer who is currently in receipt of a non income support payment; or • a partner or child of the above. The LDS 1% sample currently contains data items spanning the period January 1995 to March 2003. Examples include: customers’ and their partners’ demographics such as date of birth, gender and postcode, a customer’s child details where the child is eligible for a family-related benefit, benefits a customer is receiving and the time spent on a benefit, private income and assets. During the year 2002 the LDS 1% sample was redesigned to: • expand the customer population to include all FaCS customers administered under the
Social Security Act 1991 and the Family Assistance Act 1999, their partners and their eligible children;
• provide researchers with a richer source of data by adding new data; and • improve accessibility to data in the LDS 1%. A major change resulting from the redesign was that information became available for a customer’s child or children, where they were eligible for at least one child-related payment such as Carers Allowance (formerly Child Disability Allowance). No attempt was made to analyse the LDS 1% sample for this report as the dataset does not include disability information about the children of Centrelink customers. Future research may consider exploring whether it is possible to generate a population of families which are likely to include a child with a disability (based on payment type) and examining trends over time from June 2001 (when data about multiple payments and children were introduced to the LDS) (FaCS 2003e, 2003f; FaCS personal communication).
93
Information about the numbers of people in receipt of various disability-related carer payments, collected by Centrelink and provided by FaCS, are presented in Sections 3.6and 5.2.
(o) General Customer Survey (GCS) The General Customer Survey (GCS) is a panel survey of a representative sample of FaCS customers, developed and conducted by the Australian Government Department of Family and Community Services to meet its needs for quantitative customer research. All respondents are interviewed once in each year of the three years of the survey. Those respondents who enter the survey in receipt of an employment-related payment, such as Newstart, have an additional three interviews in the first year (i.e. one each quarter). The GCS complements the Longitudinal (Administrative) Data Set (LDS) as survey answers from the GCS can be linked to an individual’s income support history as far back as 1995. This aspect enables the examination of people’s pathways into and out of the income support system, providing detailed information on the circumstances of individuals when they are not on payment including longer-term outcomes experienced after ceasing to receive a benefit. The GCS has three cohorts, one each from the 2000, 2001 and 2002 customer populations, with around 3,000 respondents in each cohort. Information collected by the GCS includes: • personal details; • household details: including housing tenure; information about other household
members; and perceptions of the local community; • education: including details of educational qualifications; current or planned study; and
barriers to undertaking further education; • employment: including current and past employment; and barriers to participation; • retirement: including plans for and experience of; • children and childcare: including childcare arrangements for children up to 12 years and
characteristics of children living away from home; • youth: including parental support provided; • disability and caring: including type of condition; limitations faced and care provided; • community and emergency services: including use of supported accommodation; • other services and entitlements: including awareness of Centrelink services and use of
concession cards; • awareness of entitlements and incentives: including awareness of the income and assets
test, taper rates and cut-out amounts; • income, assets and expenditure: including perceptions of financial position; and • activities and participation: including details of volunteering and club membership. The GCS asks respondents whether they have a child or children and (in the 2002 wave of the GCS) what their special needs are. In all waves of the GCS, adult respondents in receipt of carer payments are asked a series of questions about disability and caring. These include questions about the person they are receiving the payment for, type of condition, number of people outside household cared for, age of person cared for and relationship of person cared for, use of and satisfaction with respite services (FaCS 2004, personal communication).
94
The GCS is currently available to researchers outside FaCS only for projects approved by FaCS, where the organisation can meet the department’s confidentiality and security requirements. It is possible that future research could explore the potential of the GCS to inform questions about children with disability being cared for by income support recipients. For example, in conjunction with the LDS, it is possible that the GCS could be used to generate answers to important research questions about, for example, whether or not parents of children with disabilities are at increased risk of remaining on income support payments. Such questions have been addressed in studies using income support data in the United States (e.g. Brandon et al. (forthcoming)).
(p) Growing Up in Australia: The Longitudinal Survey of Australian Children (LSAC) Growing Up in Australia: The Longitudinal Survey of Australian Children (LSAC) has been funded as part of the Department of Family and Community Services Stronger Families and Communities Strategy. It is planned that the results will be used by FaCS, a range of other Australian Government and state and territory departments, and the research community. It is hoped that the data will add to the understanding of early childhood development, inform social policy debate and be used to identify opportunities for early intervention and prevention strategies, in policy areas concerning children—specifically parenting, family relationships and functioning, early childhood education and schooling, childcare and health. The LSAC is designed to identify factors that influence children’s pathways to good and poor outcomes. As part of this national study data are to be collected over seven years from two cohorts every two years. The first cohort of 5,000 children aged less than 12 months in 2003–04 will be followed until they reach 6 to 7 years of age, and the second cohort will comprise 5,000 children aged 4 years in 2003–04. Study respondents will include the child (when of an appropriate age) and their parents, carers and teachers. Wave 1 of data collection commenced in March 2004 and will track respondents until 2010. The first data from the LSAC are due to be released to researchers and policy makers in April 2005 and were therefore not available at the time of preparing this report. However, the survey does not include a disability indicator or particular questions that could be used to estimate whether a child is likely to have a disability and therefore would have been of limited value to this report even if available. It is possible that a disability question may be included in future waves of the LSAC.
(q) Footprints in Time: The Longitudinal Survey of Indigenous Children (LSIC) Footprints in Time: The Longitudinal Survey of Indigenous Children (LSIC) was announced by the Australian Government in the 2003–04 budget. The study, to be managed by the Department of Family and Community Services, is currently in its development phase, involving extensive consultations with Indigenous people, communities and organisations to ensure that its design reflects their interests and is done in a way that benefits Aboriginal and Torres Strait Islander children and their families. The survey includes a broad plan to track two age groups over time: 2,000 babies aged under 12 months and 2,000 four to five year olds. The study aims to improve the understanding of, and policy response to, the diverse circumstances faced by Aboriginal and Torres Strait Islander children, their families, and communities. It will provide a data resource that can be
95
drawn on by Australian governments, researchers, service providers, parents and communities. At this stage, it is hoped that the LSIC will address four main research questions: 1. What do Indigenous children need to have the best start in life to grow up strong? 2. What helps Indigenous children to stay on track or get them back to become healthy,
positive and strong? 3. The importance of family, extended family and community in the early years of life and
when growing up. 4. The difference between how Indigenous children are raised compared to non-
Indigenous children. Relating to these four new research questions, it is expected that data will be collected in the following areas: • Culture: language, Elders, child rearing, the effects of the Stolen Generation,
participation in activities, law, dance, story telling, art, and spirituality. • Health: Pregnancy, birth, age of birth mother and father, illness, medical services,
doctors, immunisation, transport, stress, mental health, medical conditions, diabetes, kidney disease, substance use, diets, hearing, eyesight, sleep patterns, accidents.
• Childcare: availability, culturally appropriate, used, or not used, how often, Indigenous carers and non-Indigenous carers.
• Education: access to and experience in playgroups, preschool, primary, secondary and tertiary, early learning skills, access to books, television and other media, computers, bullying, racism, access to before and after school care, educational levels.
• Families: extended family, fathers, grandparents, siblings, uncles’ and aunts’ community, parents’ work, income, health and how they were raised as a child, out of home care, violence, discipline, death, grief, child abuse, family movements and contact.
• Community: Housing, infrastructure, services—how many are available, type, access and responsiveness to needs, history, access to food, seasonal changes, communication—access to technology and telephone (FaCS 2004).
It is possible that the LSIC data, once available, will provide valuable information about aspects of childhood disability among Aboriginal and Torres Strait Islander children. For example, the survey aims to include information about mental health, medical conditions, and hearing and eyesight problems among Indigenous children. The LSIC will collect information similar to the Western Australian Aboriginal Child Health Survey (referred to in Section 3.5).
(r) Household Income and Labour Dynamics in Australia (HILDA) The Household, Income and Labour Dynamics in Australia (HILDA) survey is a longitudinal or panel survey of Australian households. HILDA was the first longitudinal household survey in Australia and, prior to its funding, Australia was one of the few OECD countries not to have such a study of households and their members. The Department of Family and Community Services (FaCS) manages the HILDA survey on behalf of the Australian Government. FaCS contracted the design, development and implementation of HILDA to a consortium comprising the Melbourne Institute of Applied Economic and Social Research, the Australian Institute of Family Studies and the Australian
96
Council for Educational Research. AC Nielsen has been sub-contracted to undertake the HILDA fieldwork. HILDA is an Australia-wide, voluntary study of 7,680 households (around 14,000 people aged 15 years and over). Data are collected annually, using face-to-face interviews and self-completion questionnaires with all individuals aged 15 years or more within selected households. HILDA has been designed to support research around understanding the interaction of income, labour market and family dynamics. Information is also collected on neighbourhoods/locations, health, social participation and long-run effects. Wave 1 of the survey involved administration of four questionnaires. Two of these—the Household Form and the Household Questionnaire — were administered by personal interview to at least one adult member of the household. A Person Questionnaire (PQ) was then administered, again via personal interview, to all household members aged 15 years and over. Finally, a Self-Completion Questionnaire was provided to all persons completing the Person Questionnaire and collected by the interviewer at a later date. For Waves 2 to 8 this basic format has been retained, with the possibility that in subsequent waves, the main mode of delivery could become computer-assisted telephone interviewing. Data from Waves 1 and 2 are currently available for research purposes (in the form of moderately confidentialised unit record files) and three waves of interviewing have been conducted, with Wave 4 in the field at the time of preparing this report. Wave 4 of HILDA includes the following data items, collected via four instruments, the: i. Household Form (HF): This collects administrative information on address, dwelling
characteristics, reasons for refusal etc. as well as household composition (name, date of birth, age and sex of all household members), information about people joining and leaving the household since the previous interview and other selected personal characteristics of household members aged over 15 years (e.g. health/disability status, marital status, employment status) and relationship between household members.
ii. Household Questionnaire (HQ): This collects information about all household members including whether they have a long-term health condition, disability or impairment, use of child care (e.g. which type(s) for school-aged children and children not yet at school), whether anyone in the household currently receives the Child Care Benefit; and information about housing (e.g. whether the person or any other household member owns the home, rents it, or lives there rent free), information about household spending and income).
iii. Person Questionnaire (PQ) (either new or continuing): Administered to every household member aged 15 years and over. It has 20 sections on: country of birth and visa; education; current employment; persons not in paid employment; annual activity calendar (of work and study activities); income; family formation; partnering/relationships; private health insurance; living in Australia (e.g. health/disability); youth issues (e.g. importance of having lots of friends now and at age 35 years); tracking information.
iv. Self-Completion Questionnaire (SCQ): Completed by all people who completed the Person Questionnaire (i.e. 15 years and over), this comprises six main sections: general health and wellbeing (SF-36 Health Survey); lifestyle and living situation; personal and household finances; your job and the workplace; parenting; sex, age and comments (Melbourne Institute 2004).
97
The HILDA survey enables all household members who have a long-term health condition, disability or impairment to be identified (HF16). In Wave 4, only those aged over 15 were asked questions about the impact of that condition. It is therefore possible that the survey has some potential for future data analysis.
(s) Children’s Services National Minimum Data Set (CS NMDS) In 1998, in response to the need to improve national children’s services data, the National Community Services Information Management Group (NCSIMG) set up a Children’s Services Data Working Group. At its first meeting the Children’s Services Data Working Group agreed that the best way to obtain a national picture of children’s services would be to implement a National Minimum Data Set (NMDS) that would be applied to all child care and preschools around Australia. The initial pilot test (or trial) of the CS NMDS was completed in 2002 and a second pilot test in September 2004. Following completion and analysis of the second pilot test, the AIHW will be able to provide final recommendations to the Children’s Services Data Working Group about the content and structure of the CS NMDS. The scope of the CS NMDS will be all children’s services that are defined as child care and preschool services and that receive Australian or state/territory government funding (in the form of capital grants, operational funding, per capita funding and/or funding to reduce charges to parents (e.g. approved for Child Care Benefit). Playgroups, toy libraries and other activities that require the attendance of both the parent and the child will be excluded from the scope of the CS NMDS. Hence the CS NMDS will cover a major portion of children’s services but not all children’s services. It will not cover ‘full-time primary education services’ for children or services which are funded solely by local governments. It has been agreed that the CS NMDS should describe: • the children who use child care and preschool services; • the organisations (services) providing child care and preschool activities and the nature
of the activities provided; and • the workers delivering child care and preschool activities to children.
Data items relating to the service will include weeks of operation per year and information about the main service activity type. Data items relating to the workers will include date of birth, sex, whether they are paid or unpaid and qualification level. Data items relating to children will include date of birth, sex, Indigenous status, disability status and working arrangements of parents. The disability status question for the CS NMDS has been based on the International Classification of Functioning, Disability and Health and designed to be comparable with the ABS Survey of Disability, Ageing and Carers. If this question is included in the final CS NMDS, this will therefore represent a major development in the usefulness of administrative data collections in terms of describing access to services by children with disabilities.
It is expected that the development stages for the CS NMDS will be finalised by June 2005, when a final report will be published by the AIHW. Once these developmental stages are completed, it is anticipated that the CS NMDS will be able to replace current Australian government and state and territory data collections on children’s services. However, implementation proposals are still under development.
98
(t) ABS Child Care Survey The Australian Bureau of Statistics conduct a Child Care Survey every three years, with the most recent survey conducted in 2002. This survey collects information from parents on the use of ‘child care’ by children aged 0–11 years, with ‘child care’ including all formal child care services and preschools, as well as informal care. The survey and the Commonwealth Child Care Census (see above) are not directly comparable as, for example, the census collects information only about formal child care (specifically Commonwealth-funded child care providers) and generally covers children aged 0–12 years (AIHW 2003d). The Child Care Survey collects information about the use of, and demand for, child care for children under 12 years of age by state or territory of usual residence. For example, information is collected about the characteristics of families (e.g. number of children), characteristics of parents (e.g. sex, age, labour force status), characteristics of children (i.e. sex, age, country of birth, main language spoken at home, school attendance), child care arrangements for children (e.g. type of care, days of week, weekly cost of care, use of the Child Care Benefit, and unmet need for formal care for children). The Child Care Survey does not include information about childhood disability and was therefore not used in this report.
(u) Juvenile Justice National Minimum Data Set (JJ NMDS) The AIHW has been developing a Juvenile Justice National Minimum Data Set (JJ NMDS) since early 2000, on behalf of the Australasian Juvenile Justice Administrators and the National Community Services Information Management Group (see, for background, AIHW: Broadbent 2001). Field and pilot testing (Stage 2 of development) were conducted during 2001–03.The implementation of an ongoing JJ NMDS was endorsed by the Australasian Juvenile Justice Administrators in November 2003 and commenced during 2004. Data will be available annually, with the first report, relating to the period 2001–02 to 2003–04, to be available in late 2005. The JJ NMDS will aim to provide a national picture of the juvenile justice system and its clients in Australia. The collection will be a compilation of administrative by-product data collected by relevant juvenile justice departments in each jurisdiction and then forwarded to the AIHW. The data collection will include information relating to juvenile justice clients, juvenile justice episodes and juvenile justice supervision periods, provided as unit record data. Information about juvenile justice remand/detention centres will be aggregated data collected annually. Client-related data items in the JJ NMDS will include date of birth, sex, statistical linkage key (derived from letters of name, sex and date of birth), Indigenous status, and cultural and linguistic background but it is not planned for the collection to include information about the disability status of JJ clients. Thus, even when data become available from this collection, they will not inform questions about the prevalence of disability among children and young people accessing the juvenile justice system.
(v) National Child Protection Collection The AIHW is data custodian for three separate national data collections relating to child protection: • child protection notifications, investigations and substantiations; • children on care and protection orders; and
99
• children in out of home care. Data for each of these collections are forwarded to the AIHW each year by the relevant state and territory community services departments according to specified definitions, data items, classifications and counting rules (see, for example, AIHW 2003g). Data are supplied in aggregate form for each collection. For example, in the case of data relating to child protection notifications, investigations and substantiations, jurisdictions provide specified tables using agreed data definitions. Data items include age of child, family of residence (e.g. two-parent families where both parents are either the biological or adoptive parents of the child, male single-parent), Indigenous status, investigation outcome, person believed responsible, relationship to child of the person believed responsible, source of notification, type of abuse or neglect and type of action. The current child protection collections do not include a data item that would enable the disability status of children involved to be established or estimated. However, these collections are currently being redeveloped and will be replaced by a new Child Protection National Minimum Data Set. The redevelopment methodology includes field testing a disability question for inclusion in the final NMDS. The question proposed for field testing will be the same as that currently being field tested for the Children’s Services National Minimum Data Set. It is anticipated that data will be available from the new Child Protection NMDS by 2006–07.
(w) National Adoptions Collection Each year the AIHW publishes a collation of adoptions statistics provided by state and territory community services departments (see, for example, AIHW 2003f). These reports cover all finalised adoptions reported to state and territory community services departments during the financial year. For example, the report on 2002–03 data provided information on adopted children, adoptive families and birth mothers as well as data on the number of requests for information and the number of contact and information vetoes lodged by parties to the adoption. Information collected about adopted children includes their country of birth, country of origin, age, whether the adoption was a placement adoption (local placement adoption or intercountry adoption) or ‘known’ child adoption (e.g. by step-parents or other relatives). Information is not available at a national level about whether children who are adopted have a disability.
6.3 Data gaps and future directions
Areas for data improvement As we have demonstrated in this report, even when data sources do not directly align, available information can be synthesised to shed light on many of the questions we seek answers for. Nevertheless, this review has also highlighted areas for improvement or further development in nationally significant data collections. In the process of preparing this report it became clear that available data sources would not enable us to thoroughly explore, for example, information about government expenditure on childhood disability or information about factors contributing to childhood disability. It also became clear that information about trends over time in the prevalence of childhood
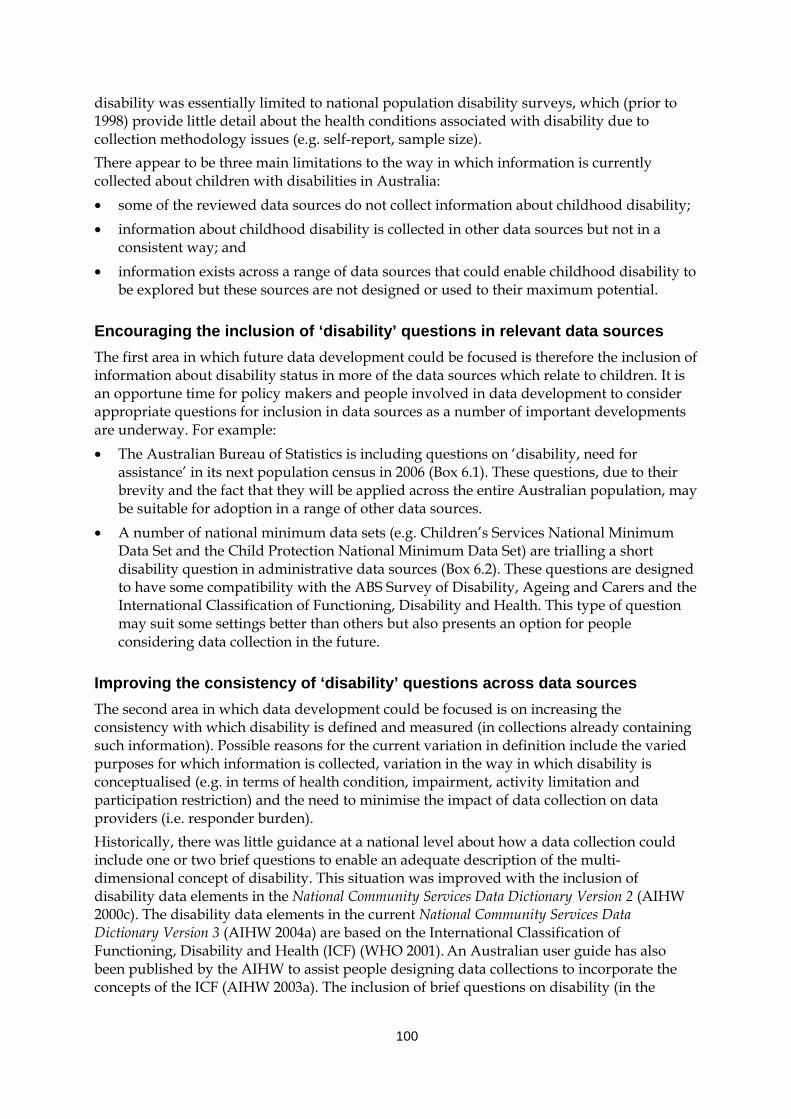
100
disability was essentially limited to national population disability surveys, which (prior to 1998) provide little detail about the health conditions associated with disability due to collection methodology issues (e.g. self-report, sample size). There appear to be three main limitations to the way in which information is currently collected about children with disabilities in Australia: • some of the reviewed data sources do not collect information about childhood disability; • information about childhood disability is collected in other data sources but not in a
consistent way; and • information exists across a range of data sources that could enable childhood disability to
be explored but these sources are not designed or used to their maximum potential.
Encouraging the inclusion of ‘disability’ questions in relevant data sources The first area in which future data development could be focused is therefore the inclusion of information about disability status in more of the data sources which relate to children. It is an opportune time for policy makers and people involved in data development to consider appropriate questions for inclusion in data sources as a number of important developments are underway. For example: • The Australian Bureau of Statistics is including questions on ‘disability, need for
assistance’ in its next population census in 2006 (Box 6.1). These questions, due to their brevity and the fact that they will be applied across the entire Australian population, may be suitable for adoption in a range of other data sources.
• A number of national minimum data sets (e.g. Children’s Services National Minimum Data Set and the Child Protection National Minimum Data Set) are trialling a short disability question in administrative data sources (Box 6.2). These questions are designed to have some compatibility with the ABS Survey of Disability, Ageing and Carers and the International Classification of Functioning, Disability and Health. This type of question may suit some settings better than others but also presents an option for people considering data collection in the future.
Improving the consistency of ‘disability’ questions across data sources The second area in which data development could be focused is on increasing the consistency with which disability is defined and measured (in collections already containing such information). Possible reasons for the current variation in definition include the varied purposes for which information is collected, variation in the way in which disability is conceptualised (e.g. in terms of health condition, impairment, activity limitation and participation restriction) and the need to minimise the impact of data collection on data providers (i.e. responder burden). Historically, there was little guidance at a national level about how a data collection could include one or two brief questions to enable an adequate description of the multi-dimensional concept of disability. This situation was improved with the inclusion of disability data elements in the National Community Services Data Dictionary Version 2 (AIHW 2000c). The disability data elements in the current National Community Services Data Dictionary Version 3 (AIHW 2004a) are based on the International Classification of Functioning, Disability and Health (ICF) (WHO 2001). An Australian user guide has also been published by the AIHW to assist people designing data collections to incorporate the concepts of the ICF (AIHW 2003a). The inclusion of brief questions on disability (in the
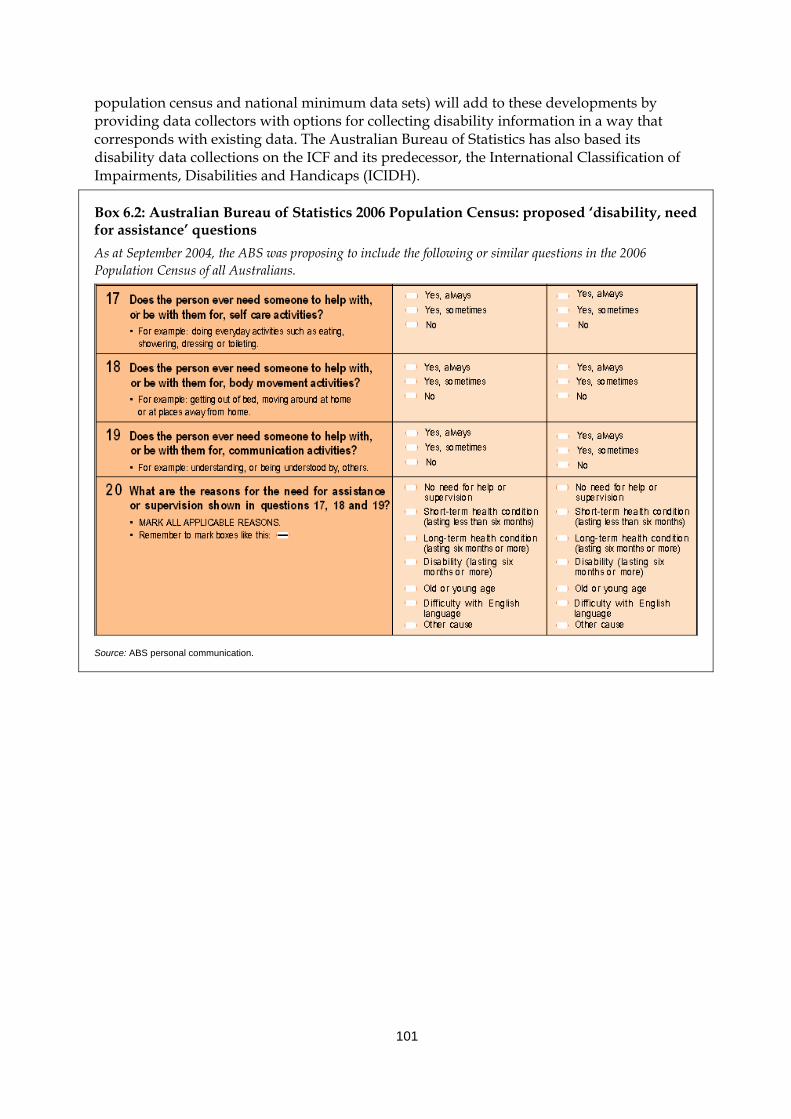
101
population census and national minimum data sets) will add to these developments by providing data collectors with options for collecting disability information in a way that corresponds with existing data. The Australian Bureau of Statistics has also based its disability data collections on the ICF and its predecessor, the International Classification of Impairments, Disabilities and Handicaps (ICIDH).
Box 6.2: Australian Bureau of Statistics 2006 Population Census: proposed ‘disability, need for assistance’ questions As at September 2004, the ABS was proposing to include the following or similar questions in the 2006 Population Census of all Australians.
Source: ABS personal communication.
102
Box 6.3: Children’s Services NMDS Pilot Test 2004: child disability question Does this child have a difficulty or delay in any of the following areas compared to children of a similar age, that is related to an underlying long-term health condition or disability? (Please tick as many as apply. ‘Long-term’ means experienced for 6 months or more. See page 8 of Guidelines) 1 = Communication 2 = Mobility 3 = Self-care 4 = Interpersonal interactions and relationships 5 = Learning and applying knowledge, education 6 = Other (including general tasks and demands, domestic life, and community, social and civic life) 7 = Not applicable—no assistance needed in the areas listed 8 = Don’t know
Source: AIHW Caregiver’s Collection Form.
Maximising the analytical potential of existing data sources In relation to the third issue listed above—harnessing the power of existing data sources—a major area for further exploration appears to be data linkage. The benefits of this type of work have been actively promoted by the AIHW in its national data development work for some years and, more recently, by the Australian Research Alliance for Children and Youth (ARACY). A great deal of work has been undertaken and continues at both national and state levels. For example, the AIHW recently established a data linkage unit which will develop protocols for and promote the benefits of data linkage using community services data collections. This builds on a long work program of linking data across health-related data collections such as mortality and morbidity databases. Work conducted in Western Australia, in particular by the Telethon Institute for Child Health Research, provides examples of the benefits of linking existing data sources to address questions relating to causal pathways to specific outcomes (Box 6.4). For example, the Institute’s Maternal and Child Health Research Database (MCHRDB) has been used for the surveillance of cerebral palsy in low birthweight infants (Stanley & Watson 1992), the impact of changing obstetric and neonatal care practices on mortality and cerebral palsy (Stanley & Blair 1991), and the prevalence of birth defects in the offspring of Aboriginal and non-Aboriginal women (Bower et al. 1989).
103
Box 6.4 Western Australian examples of data linkage Maternal and Child Health Research Database (MCHRDB) of Western Australia The Western Australian Telethon Institute for Child Health Research Maternal and Child Health Research Database (MCHRDB) is a linked total population database, established in Western Australia in 1980 for the purposes of monitoring and evaluating maternal and child health and conducting epidemiological studies. The database includes data linked from sources such as the Midwives’ Notification of Case Attended Form, birth registration forms (Registrar General of WA), death certificates, hospital inpatient morbidity data from the WA Health Department, information on birth defects as notified to the WA Birth Defects Registry and the WA Cerebral Palsy Register. This means that information is available about the physical and sociodemographic characteristics of mothers, about pregnancy complications, perinatal details including infant birthweight and gestational age, all causes of deaths (from 20 weeks gestation to 1 year of age), and details on hospital in-patient morbidity for all children up to 6 years of age who attend WA hospitals. The data may also be linked to various longitudinal studies of WA children (e.g. the Raine Study, WATCH, WA Child Health Survey). From 2004 onwards, under new collaborative arrangements, data linkage will be undertaken by the Western Australian Health Department and will include linkage to, for example, the Pharmaceutical Benefits Scheme (PBS), the Medicare Benefits Scheme (MBS), the Australian Childhood Immunisation Register and the AIHW’s National Death Index and National Cancer Register. The whole infrastructure is now known as the Western Australia Data Linkage System. Data linkage involves bringing together records from a variety of sources relating to the same individual. The advantages of using linked population data are many, including close to complete ascertainment of cases, avoidance of selection and recall bias and cost effectiveness. The data can also be used over time to address a variety of hypotheses or public health questions, and are not intrusive. Data from the MCHRDB have been used for descriptive epidemiology relating to perinatal and paediatric outcomes, as a sampling frame for case control studies and cohort studies and for studies to evaluate care. Developmental pathways to health, education and delinquent outcomes in Western Australian children Another example of utilising existing data sources to address important public health and social policy issues is a project called ‘Developmental pathways to health, education and delinquent outcomes in Western Australian children: A holistic approach to inform early intervention strategies’. A collaborative team in WA, including the University of Western Australia (Centre for Child Health Research at the Telethon Institute for Child Health Research and the Crime Research Centre) and six government jurisdictions in Western Australia (the Departments of Health, Education and Training, Community Development and Justice, Disability Services Commission and Office of Youth Affairs), was recently awarded an Australian Research Council grant to conduct this project. The primary aims of the project are to: • pioneer an extensive population-level data linkage across multiple disciplines and government sectors; • use this unique longitudinal data source to provide an overview of temporal, regional, socioeconomic
and racial differences in developmental outcomes and to describe key risk and protective factors; • identify pathways to health and wellbeing, education and juvenile delinquency outcomes among
Western Australian children and youth including those who have had contact with the child protection system;
• identify risk and protective factors for persistent juvenile offending; • explore and define risk and resilience factors for Aboriginal juvenile delinquency; and • identify risk and protective factors for those who enter the child protection system and determinants of
adverse outcomes after leaving the system, with a separate component for Aboriginal children.
Sources: Stanley et al. 1994; AIHW presentation by Fiona Stanley, 5 October 2004.
104
6.4 Future directions A vast array of information is collected about children in Australia in the form of population surveys and, where children access government-funded services and benefits, administrative data. A subset of these data sources includes information which enables the disability status of children to be estimated. With the current data available it has been possible to answer many of the questions we set out to address in this report. However, with the relatively minor additions and improvements to existing data sources identified in this report, and with more collaborative use or linkage of existing data sources, substantial gains could be made in terms of our ability to readily identify and describe children with disability in Australia, describe their needs and circumstances along with those of their families, and provide a coordinated picture of the services they access and the outcomes of these interventions. A number of recent initiatives and policy developments suggest that there is considerable interest in improving the usefulness of information about children, particularly those with complex needs. These include, for example: • the recent establishment of the Australian Research Alliance for Children and Youth
(ARACY); • various government initiatives such as the Commonwealth Taskforce on Child
Development, Health and Wellbeing and the National Agenda for Early Childhood; • policy and research effort to improve the whole-of-government approach to working
with children with disabilities, such as the July 2004 National Disability Administrators forum on support for children and young people with a disability and their families, which focused on contact by children with disabilities with the child protection system; and
• efforts to draw on multiple existing data sources to address policy questions, such as work under way by the National Child Protection and Support Services (NCPASS) Data Group to examine educational outcomes of children on care and protection orders.
This interest and momentum, combined with Australia’s rich data sources, suggest that there is great potential for improvement in relation to information about children with disabilities.
105
Appendix 1
External referees Professor Eric Emerson Professor of Clinical Psychology
Institute for Health Research Lancaster University, United Kingdom
Professor Denis Hogan Robert E. Turner Distinguished Professor of Population Studies Population Studies and Training Center Brown University, United States
Dr Helen Leonard Telethon Institute for Child Health Research, Perth, WA
Ms Helen Moyle Strategic Policy & Knowledge Branch Australian Government Department of Family and Community Services Canberra, ACT
Professor Trevor Parmenter Director Centre for Developmental Disability Studies University of Sydney, NSW
Dr Tony Shaddock Professor of Special Education University of Canberra, ACT
Mr Carrington Shepherd Australian Bureau of Statistics, National Children and Youth Statistics Unit Perth, WA
Ms Cath Winter Office of Disability Australian Government Department of Family and Community Services Canberra, ACT
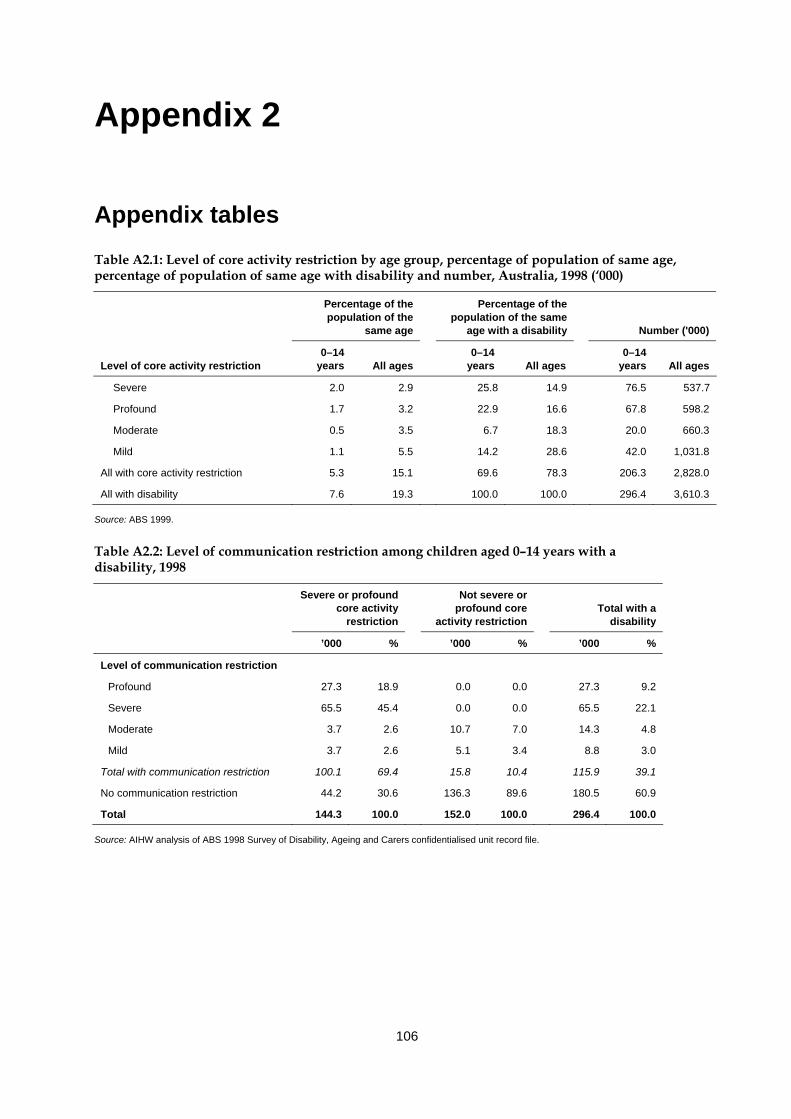
106
Appendix 2
Appendix tables Table A2.1: Level of core activity restriction by age group, percentage of population of same age, percentage of population of same age with disability and number, Australia, 1998 (‘000)
Percentage of the population of the
same age
Percentage of the population of the same
age with a disability Number ('000)
Level of core activity restriction 0–14
years All ages 0–14
years All ages 0–14
years All ages
Severe 2.0 2.9 25.8 14.9 76.5 537.7
Profound 1.7 3.2 22.9 16.6 67.8 598.2
Moderate 0.5 3.5 6.7 18.3 20.0 660.3
Mild 1.1 5.5 14.2 28.6 42.0 1,031.8
All with core activity restriction 5.3 15.1 69.6 78.3 206.3 2,828.0
All with disability 7.6 19.3 100.0 100.0 296.4 3,610.3
Source: ABS 1999.
Table A2.2: Level of communication restriction among children aged 0–14 years with a disability, 1998
Severe or profound core activity
restriction
Not severe or profound core
activity restriction
Total with a
disability
’000 % ’000 % ’000 %
Level of communication restriction
Profound 27.3 18.9 0.0 0.0 27.3 9.2
Severe 65.5 45.4 0.0 0.0 65.5 22.1
Moderate 3.7 2.6 10.7 7.0 14.3 4.8
Mild 3.7 2.6 5.1 3.4 8.8 3.0
Total with communication restriction 100.1 69.4 15.8 10.4 115.9 39.1
No communication restriction 44.2 30.6 136.3 89.6 180.5 60.9
Total 144.3 100.0 152.0 100.0 296.4 100.0
Source: AIHW analysis of ABS 1998 Survey of Disability, Ageing and Carers confidentialised unit record file.
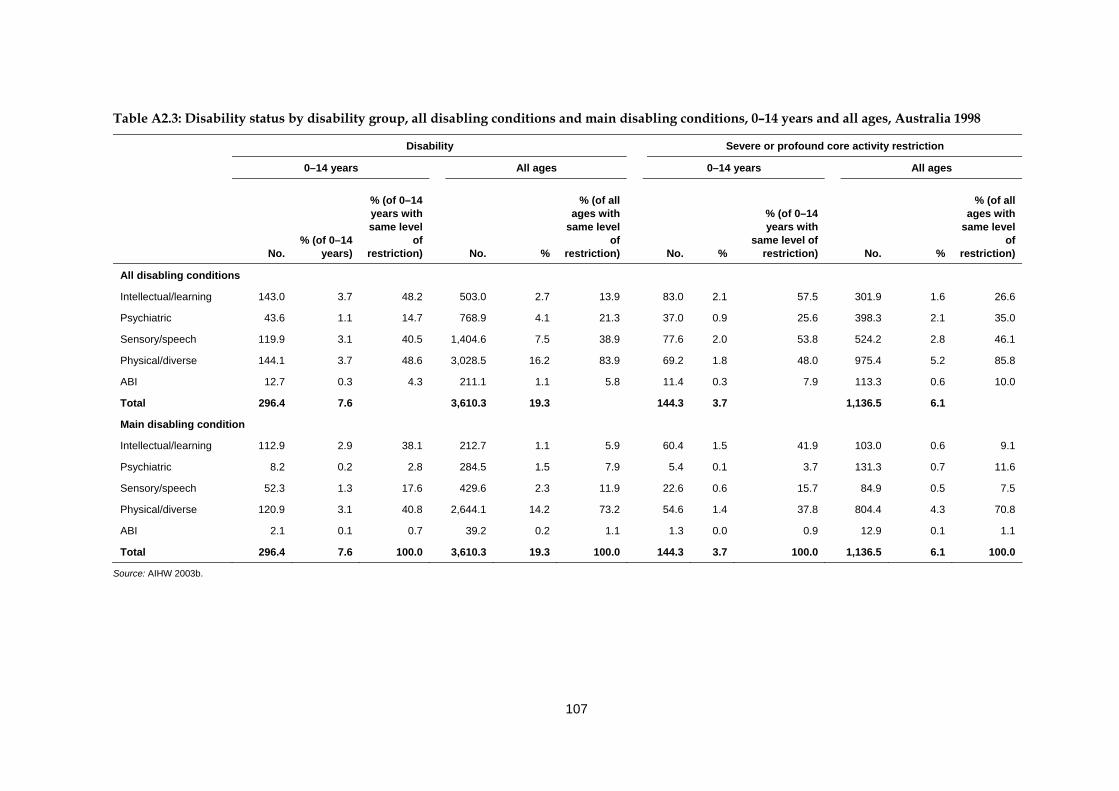
107
Table A2.3: Disability status by disability group, all disabling conditions and main disabling conditions, 0–14 years and all ages, Australia 1998
Disability Severe or profound core activity restriction
0–14 years All ages 0–14 years All ages
No. % (of 0–14
years)
% (of 0–14 years with same level
of restriction) No. %
% (of all ages with
same level of
restriction) No. %
% (of 0–14 years with
same level of restriction) No. %
% (of all ages with
same level of
restriction)
All disabling conditions
Intellectual/learning 143.0 3.7 48.2 503.0 2.7 13.9 83.0 2.1 57.5 301.9 1.6 26.6
Psychiatric 43.6 1.1 14.7 768.9 4.1 21.3 37.0 0.9 25.6 398.3 2.1 35.0
Sensory/speech 119.9 3.1 40.5 1,404.6 7.5 38.9 77.6 2.0 53.8 524.2 2.8 46.1
Physical/diverse 144.1 3.7 48.6 3,028.5 16.2 83.9 69.2 1.8 48.0 975.4 5.2 85.8
ABI 12.7 0.3 4.3 211.1 1.1 5.8 11.4 0.3 7.9 113.3 0.6 10.0
Total 296.4 7.6 3,610.3 19.3 144.3 3.7 1,136.5 6.1
Main disabling condition
Intellectual/learning 112.9 2.9 38.1 212.7 1.1 5.9 60.4 1.5 41.9 103.0 0.6 9.1
Psychiatric 8.2 0.2 2.8 284.5 1.5 7.9 5.4 0.1 3.7 131.3 0.7 11.6
Sensory/speech 52.3 1.3 17.6 429.6 2.3 11.9 22.6 0.6 15.7 84.9 0.5 7.5
Physical/diverse 120.9 3.1 40.8 2,644.1 14.2 73.2 54.6 1.4 37.8 804.4 4.3 70.8
ABI 2.1 0.1 0.7 39.2 0.2 1.1 1.3 0.0 0.9 12.9 0.1 1.1
Total 296.4 7.6 100.0 3,610.3 19.3 100.0 144.3 3.7 100.0 1,136.5 6.1 100.0
Source: AIHW 2003b.
108
References ABS (Australian Bureau of Statistics) 1997. National health survey: summary of findings. ABS cat. no. 4365.0. Canberra: ABS. ABS 1998. Mental health and wellbeing: profile of adults, Australia. ABS cat. no. 4326.0. Canberra: ABS. ABS 1999. Disability, ageing and carers: summary of findings, Australia 1998. ABS cat. no. 4430.0. Canberra: ABS. ABS 2002a. Census of population and housing: selected social and housing characteristics, Australia. ABS cat. no. 2015.0. Canberra: ABS. ABS 2002b. National health survey: summary of results. ABS cat. no. 4364.0. Canberra: ABS. ABS 2004. Disability, ageing and carers: summary of findings 2003. ABS cat. no. 4430.0. Canberra: ABS. ABS: Davis E, Beer J, Gligora C et al. 2001. Accounting for change in disability and severe restriction, 1981–1998. Working papers in Health and Welfare, no. 2001/1. Canberra: ABS. ABS: Webster A 1998. ABS statistics on children and child indicators. Paper presented at ‘Population Matters—global, regional, local’, Australian Population Association Conference, University of Queensland, Brisbane, 29 September–2 October 1998. ACAM (Australian Centre for Asthma Monitoring) 2003. Asthma in Australia 2003. AIHW Asthma Series 1. AIHW cat. no. ACM 1. Canberra: AIHW. Aday LA, Lee ES, Spears BS et al. 1993. Health insurance and utilization of medical care for children with special needs. Medical Care 31:1013–26. AIHW (Australian Institute of Health and Welfare) 1993. Australia’s welfare 1993: services and assistance. Canberra: AGPS. AIHW 1997. Australia’s welfare 1997: services and assistance. Canberra: AIHW. AIHW 1998. Juvenile justice and youth welfare: a scoping study. AIHW cat. no. CSW 6. Canberra: AIHW. AIHW 1999. Australia’s welfare 1999: services and assistance. Canberra: AIHW. AIHW 2000a. Disability and ageing: Australian population patterns and implications. AIHW cat. no. DIS 19. Canberra: AIHW. AIHW 2000b. Disability support services provided under the Commonwealth/State Disability Agreement: national data, 1999. AIHW cat. no. DIS 18. Canberra: AIHW. AIHW 2000c. National community services data dictionary. Version 2. AIHW cat. no. HWI 27. Canberra: AIHW. AIHW 2001a. Australia’s welfare: services and assistance 2001. Canberra: AIHW. AIHW 2001b. Disability support services 2000: national data on services provided under the Commonwealth/State Disability Agreement. AIHW cat. no. DIS 23. Canberra: AIHW. AIHW 2002a. Disability support services 2001: national data on services provided under the Commonwealth/State Disability Agreement. AIHW cat. no. DIS 25. Canberra: AIHW. AIHW 2002b. Australia’s health 2002. Canberra: AIHW.
109
AIHW 2003a. Australian ICF user guide version 1.0. AIHW cat. no. DIS 33. Canberra: AIHW. AIHW 2003b. Disability prevalence and trends. AIHW cat. no. DIS 34. Canberra: AIHW. AIHW 2003c. Communication restrictions—the experience of people with disability in the community. Disability data briefing no. 23. Canberra: AIHW. AIHW 2003d. Australia’s welfare 2003. Canberra: AIHW. AIHW 2003e. Disability support services 2002: national data on services provided under the Commonwealth/State Disability Agreement. AIHW cat. no. DIS 31. Canberra: AIHW. AIHW 2003f. Adoptions Australia 2002–03. AIHW cat. no. CWS 21. Canberra: Australia. AIHW 2003g. Child protection counting rules. Viewed 21 October 2004, <http://www.aihw.gov.au/childyouth/childprotection/countingrules.html>. AIHW 2004a. National community services data dictionary Version 3. AIHW cat. no. HWI 65. Canberra: AIHW. AIHW 2004b. Australia’s health 2004. Canberra: AIHW. AIHW 2004c. Disability support services 2002–03: the first six months of data from the Commonwealth State/Territory Disability Agreement National Minimum Data Set. AIHW cat. no. DIS 35. Canberra: AIHW. AIHW 2004d. Indicators of Australia’s welfare. Welfare working paper series no. 42. Canberra: AIHW. AIHW 2004e. Housing assistance programs and statistics. Viewed 17 May 2004, <http://www.aihw.gov.au/housing/assistance/index.html>. AIHW 2004f. SAAP administrative data collection classification and procedures May 2004 . Canberra: AIHW. AIHW 2004g. Disability and its relationship to health conditions and other factors. AIHW cat. no. DIS 37. Canberra: AIHW. AIHW: Al-Yaman F, Bryant M & Sargeant H 2002. Australia’s children: their health and wellbeing 2002. AIHW cat. no. PHE 36. Canberra: AIHW. AIHW: Black K & Eckerman S 1997. Disability support services provided under the Commonwealth/State Disability Agreement, 1995: first national data. AIHW cat. no. DIS 1. Canberra: AIHW. AIHW: Bradley C & Harrison JE 2003. Injury risk factors, attitudes and awareness: a submission to the CATI-TRG. Injury Technical Paper Series Number 3. AIHW cat. no. INJCAT 61. Adelaide: AIHW. AIHW: Bricknell S 2003. Disability: the use of aids and the role of the environment. AIHW cat. no. DIS 32. Canberra: AIHW. AIHW: Broadbent A 2001. Report on the development of a Juvenile Justice National Minimum Data Set. AIHW cat. no. CWS 14. Canberra: AIHW. AIHW: Wen X 1997. The definition and prevalence of intellectual disability. AIHW cat. no. DIS 2. Canberra: AIHW. AIHW NISU (National Injury Surveillance Unit) 1997. Injury prevention bulletin 15. Issue 15, February 1997. AIHW cat. no. INJ 006. Adelaide: AIHW. AIHW NPSU (National Perinatal Statistics Unit): Birch M-R, Grayson N & Sullivan EA 2004. Recommendations for development of a new Australian Birth Anomalies System: a review of
110
the Congenital Malformations and Birth Defects Data Collection. AIHW cat. no. PER 23. Sydney: AIHW NPSU. AIHW NPSU 2004. Australia’s babies: their health and wellbeing. Bulletin no. 21. AIHW cat. no. AUS 54. Canberra: AIHW NPSU. AIHW NPSU: Hurst T, Shafir E, Day P et al. 1997. Congenital malformations Australia 1995 and 1996. AIHW cat. no. PER-8. Sydney: AIHW NPSU. Australian Hearing 2003. About Australian hearing. Viewed 14 July 2004, <http//www.hearing.com.au/about_aust_home.htm>. Baranowski MD & Schilmoeller GL 1999. Grandparents in the lives of grandchildren with disabilities: mothers’ perceptions. Education and Treatment of Children 22(4):427–46. Barr O & Millar R 2003. Parents of children with intellectual disabilities: their expectations and experience of genetic counselling. Journal of Applied Research in Intellectual Disabilities 16:189–204. Blair EM & Shean RE 1996. Trends in childhood disability. The Medical Journal of Australia 165(19):206–8. Booth ML, Chey T, Wake M et al. 2003. Change in the prevalence of overweight and obesity among young Australians, 1969–1997. American Journal of Clinical Nutrition 77:29–36. Borthwick-Duffy S 1994. Epidemiology and prevalence of psychopathology in people with mental retardation. Journal of Consulting and Clinical Psychology 62:17–27. Bower C 2003. Fortification of food with folic acid and the prevention of neural tube defects. New Zealand Medical Journal 116:U292. Bower C, Forbes R, Seward M et al. 1989. Congenital malformations in Aboriginal and non-Aboriginal infants in Western Australia, 1980–87. The Medical Journal of Australia 151(4):245–48. Bower C, Leonard H & Petterson B 2000. Intellectual disability in Western Australia. Journal of Paediatrics and Child Health 36:213–15. Bower C, Ryan A, Rudy E et al. 2002.Trends in neural tube defects in Western Australia. Australian and New Zealand Journal of Public Health 26:150–51. Boyce GC, Miller BC, White KR et al. 1995. Single parenting in families of children with disabilities. Marriage and Family Review 20(3–4):389–409. Bradbury B, Norris K & Abello D 2001. Socio-economic disadvantage and the prevalence of disability. A report prepared by the Social Policy Research Centre, University of New South Wales, for the Victorian Department of Human Services, DisAbility Services. SPRC Report 1/01. Sydney: University of New South Wales. Brandon PD, Hofferth SL & Hogan DP (forthcoming). Do disabilities in former TANF families hasten their return to cash assistance? Working Paper, Department of Sociology, The University of Massachusetts, Amherst. Brandon PD & Hogan DP (forthcoming). Impediments to mothers leaving welfare: the role of maternal and child disability. Population Research and Policy Review. Britner PA, Morog MC, Pianta RC et al. 2003. Stress and coping: a comparison of self-report measures of functioning in families of young children with cerebral palsy or no medical diagnosis. Journal of Child and Family Studies 12(3):335–48.
111
Budiselik M 1999. Does it really matter? Children with severe multiple disabilities and the neglect of their therapy needs. Paper presented at the 7th Australasian Conference on Child Abuse and Neglect, 17–20 October 1999, Perth. Burbidge M 2003. Personal health records for people with developmental disability. Viewed 14 May 2004, <http// cddh.med.monash.edu.au/clinical/phr/phr.html >. Buzio A 2001. Hospitalisation of adults with cerebral palsy. I Am (Magazine of the Spastic Centre) July 2(3):12. CAA (Carers Association of Australia) 2000. Results of the 1999 national health survey of carer health and wellbeing. Canberra: CAA and Department of Health and Aged Care. Centrelink 2000. Claim pack for Carer Allowance and/or Carer Payment: Caring for a child under 16 years). Canberra: Centrelink. Centrelink 2003a. Are you caring for someone who is frail aged, ill or who has a disability? A guide to your options and services. September 2003. Viewed 17 November 2003, <http://www.centrelink.gov.au/internet/internet.nsf/publications/id001.htm>. Centrelink 2003b. Hearing services. Viewed 18 November 2003, <http://www.centrelink.gov.au/internet/internet.nsf/services/hearing_services.htm>. Centrelink 2004a. Disability and carer payment rates. Viewed 4 June 2003, <http//www.centrelink.gov.au/internet/internet.nsf/publications/id001.htm>. Centrelink 2004b. Carer Allowance: functional assessment for a child—under 16 years. Canberra: Centrelink Centrelink 2004c. Carer Allowance: doctor’s report for a child—under 16 years. Canberra: Centrelink Chan A, Pickering J, Haan EA et al. 2001. Folate before pregnancy: the impact on women and health professionals of a population-based health promotion campaign in South Australia. Medical Journal of Australia 174:631–6. Chenoweth L 2002. Children with disabilities: what evidence do we have for better practice? Paper presented at the Association of Children’s Welfare Agencies conference ‘What works? Evidence based practice in child and family services’, 2–4 September 2002, Sydney. Cleveland DW & Miller N 1977. Attitudes and life commitments of older siblings of mentally retarded adults. Mental Retardation 15:38–41. Cooke K, Bradshaw J, Lawton D et al. 1986. Child disablement, family dissolution and reconstitution. Developmental Medicine and Child Neurology 28:610–16. Crnic KA, Greenberg MT, Ragozin AS et al. 1983. Effects of stress and social support on mothers and premature and full-term infants. Child Development 54:209–17. Damiani V 1999. Responsibility and adjustment in siblings of children with disabilities: update and review. Families in Society: The Journal of Contemporary Human Services. 80(1):34–40. Dempsey I, Foreman P & Jenkinson J 2002. Educational enrolment of students with a disability in New South Wales and Victoria. International Journal of Disability, Development and Education 49(1):31–46. Department of Work and Pensions 2002. The dynamics of poverty in Britain. London: The Stationary Office.
112
DIMA (Australian Government Department of Immigration and Multicultural Affairs) 1999. 1996 classification of countries into English Proficiency Groups. Statistical focus C96.1A revised. Canberra: DIMA. DoHA (Australian Government Department of Health and Ageing) 2004a. HACC program page. Viewed 12 October 2004, <http://www.hacc.health.gov.au/index.htm>. DoHA 2004b. Home and Community Care (HACC) Program National Minimum Data Set (MDS) Guidelines to the HACC MDS. A companion to the HACC Data Dictionary v1.0 (May 1999), Version 1.6, April 2004. Viewed 29 September 2004, <http://www.hacc.health.gov.au/pub_mds_gdd.htm>. Dowling L 2002. Children who live with equipment. Interim report to the Department of Ageing, Disability and Home Care. Issues Paper, Feb 2002. Dowling M & Dolan L 2001. Families with children with disabilities—inequalities and the social model. Disability and Society 16(1):21–35. Emerson E 2003. Mothers of children and adolescents with intellectual disability: social and economic situation, mental health status, and the self-assessed social and psychological impact of the child’s difficulties. Journal of Intellectual Disability Research 47(4/5):385–99. Emerson E, Hatton C & Llewellyn G 2004. Happiness, self-esteem and self-efficacy among mothers of children with intellectual disabilities . Paper presented at IASSID World Conference, Montpellier, France, June 2004. FaCS (Australian Government Department of Family and Community Services) 2002. Annual report 2001–02. Viewed 17 November 2003, <http://www.facs.gov.au/annreport_2001–02/index.html>. FaCS 2003a. 1.1.P.430 Profoundly disabled child (CP) (Guide to social security law). Viewed 2 June 2004, <http://www.facs.gov.au/guide/ssguide/11p430.htm>. FaCS 2003b. Six disabilities to gain automatic access to carer allowance. Viewed 14 November 2003, <http://www.facs.gov.au/internet/minfacs.nsf/549ed30c27024062ca2569e900837d9c/e604589f47d51ad5ca256d80001869c6?OpenDocument>. FaCS 2003c. FaCS Annual report 2002–03. Viewed 17 November 2003, <http://www.facs.gov.au/annreport_2002–03/volume02/part1/outcome3>. FaCS 2003d. 2002 Census of child care services. Viewed 6 May 2004, <http://www.facs.gov.au/internet/facsinternet.nsf/vIA/cc_census_2002/$file/full_report.pdf>. FaCS 2003e. LDS data sets information pack, unpublished FaCS information sent to AIHW February 2003. FaCS 2003f. LDS 1% Sample User documentation for SAS Format, Version Number 2.1, Version Date 22/8/03, produced by Longitudinal Data Section, FaCS. Unpublished. FaCS 2004. LSIC web page. Viewed 6 October 2004, <http://www.facs.gov.au/internet/facsinternet.nsf/aboutfacs/programs/indigenous-lsic_background_waachs.htm>. Ferguson PM 2002. A place in the family: an historical interpretation of research on parental reactions to having a child with a disability. The Journal of Special Education 36(3):124–30. Ferguson P & Asch A 1989. Lessons from life: personal and parental perspectives on school, childhood and disability. In: Biklen D, Ferguson D & Asch A (eds). Schooling and disability. Chicago: University of Chicago Press, 108–40.
113
Findler LS 2000. The role of grandparents in the social support systems of mothers of children with a physical disability. Families in Society 81(4):370–81. Floyd FJ & Gallagher EM 1997. Parental stress, care demands, and use of support services for school-age children with disabilities and behavior problems. Family Relations 46(4):359–71. Foreman PJ (ed.) 2001. Integration and inclusion in action. 2nd ed. Sydney: Harcourt. Fujiura GT 1998. Demography of family households. American Journal of Mental Retardation 103:225–35. Fujiura GT & Yamaki K 2000. Trends in demography of childhood poverty and disability. Exceptional Children 66(2):187–99. Garfinkel L 1998. Children with disabilities in the justice system. Reclaiming Children and Youth 7(2):80–82. Glatthaar C, Whittall D, Welborn T et al. 1988 Diabetes in Western Australian children: descriptive epidemiology. Medical Journal of Australia 148:117–23. Gordon D, Parker R, Loughram F et al. 2000. Disabled children in Britain: a re-analysis of the OPCS disability surveys. London: The Stationary Office. Gottlieb AS 1997. Single mothers of children with developmental disabilities: the impact of multiple roles. Family Relations 46(1):5–12. Green SE 2003. Grandma’s hands: parental perceptions of the importance of grandparents as secondary caregivers in families of children with disabilities. The International Journal of Aging and Human Development 53(1):11–33. Hastings RP, Thomas H & Delwiche N 2002. Grandparent support for families of children with Down’s syndrome. Journal of Applied Research in Intellectual Disabilities 15:97–104. Hayes S 1997. Learning and intellectual disabilities and juvenile crime. In: Borowski A & O’Connor I (eds.) Juvenile crime justice and corrections. South Melbourne: Longman, 190–205. Hayes S & McIlwain D 1988. The incidence of intellectual disability in the New South Wales prison population. Sydney: Department of Behavioural Sciences in Medicine, Sydney University. Hornby G & Ashworth T 1994. Grandparents’ support for families who have children with disabilities. Journal of Child and Family Studies 3:403–12. Jacobs P & McDermott S 1989. Family caregiving costs of chronically ill and handicapped children: method and literature review. Public Health Report 104:158–63. Kairys SW, Alexander RC, Block RW et al. 2001. Assessment of maltreatment of children with disabilities. Pediatrics 109(2):508–12. Kaye JA, del Mar Melero-Montes M & Jick H 2001. Mumps, measles and rubella vaccine and the incidence of autism recorded by general practitioners: a time trend analysis. British Medical Journal 322:460–63. Kearney PM & Griffin T 2001. Between sorrow and joy: being a parent of a child with developmental disability. Journal of Advanced Nursing 34(5):582–92. Kendall J 1999. Sibling accounts of attention deficit hyperactivity disorder (ADHD). Family Process 38(1):117–36. Lennox N, Beange H & Edwards NS 2002. The health needs of people with intellectual disability. Medical Journal of Australia 173(6):308–30.
114
Leonard B, Dwyer Brust J & Sapienza JJ 1992. Financial and time costs to parents of severely disabled children. Public Health Reports 107(3):302–12. Leonard H, Petterson B, De Klerk N et al. (forthcoming). Association of sociodemographic demographic characteristics of children with intellectual disability in Western Australia. Lewis-Abney K 1993. Correlates of family functioning when a child has attention deficit disorder. Issues in Comprehensive Pediatric Nursing 16(3):175–90. Leyser Y, Heinze A & Kapperman G 1996. Stress and adaptation in families of children with visual disabilities. Family in Society 77(4):240–49. Little L 2002. Differences in stress and coping for mothers and fathers of children with Asperger’s syndrome and nonverbal learning disorders. Pediatric Nursing 28(6):565–70. Llewellyn G, Dunn P, Fante M et al. 1996. Families with young children with disabilities and high support needs. Report to Ageing and Disability Department April 1996. Family Support and Services Project, Faculty of Health Sciences, University of Sydney in collaboration with Australia Rural Health Research Institute, Charles Sturt University and Multicultural Respite Options. Sydney. Lobato DJ 1990. Brothers and sisters with special needs. Baltimore: Brookes. Longo DC & Bond L 1984. Families of the handicapped child: research and practice. Family Relations 33:57–65. Lukemeyer A, Meyers MK & Smeeding T 2000. Expensive children in poor families: out-of-pocket expenditures for the care of disabled and chronically ill children in welfare families. Journal of Marriage and the Family 62:399–415. Lunken T & Grant J 2002. Families that share and care. Paper presented at the Association of Childrens Welfare Agencies conference ‘What works? Evidence based practice in child and family services’, 2–4 September 2002, Sydney. Mackey P & Kopras A 2001. Medication for Attention Deficit/Hyperactivity Disorder (ADHD): an analysis by federal electorate. Viewed 12 June 2004, < http://www.aph.gov.au/library/pubs/cib/2000-01/01cib11.htm#medication>. Magarey A, Daniel L & Boulton TJ 2001. Prevalence of overweight and obesity in Australian children and adolescents: reassessment of 1985 and 1995 data against new standard international definitions. The Medical Journal of Australia 174:561–64. Mahoney G, O’Sullivan P & Robinson C 1992. The family environments of children with disabilities: diverse but not so different. Topics in Early Childhood Special Education 12:386–402. Marshak L, Seligman M & Prezant F 1999. Disability and the family life cycle. New York: Basic Books. McDonald P 2003. Transformations in the Australian family. In: Khoo S-E & McDonald P (eds). The transformation of Australia’s population 1970–2030. Sydney: University of New South Wales Press, 77–103. McHale SM & Gamble WC 1989. Sibling relationships of children with disabled and nondisabled brothers and sisters. Developmental Psychology 25(3):421–29. McIntyre P, Amin J, Gidding H et al. 2000. Vaccine preventable diseases and vaccination coverage in Australia, 1993–1998. Communicable Diseases Intelligence (Supplement): 1–92. McIntyre P, Gidding H, Gilmour R et al. 2002. Vaccine preventable diseases and vaccination coverage in Australia, 1999 to 2000. Communicable Diseases Intelligence (Supplement): 1–124.
115
Melbourne Institute (University of Melbourne) 2004. HILDA survey instruments. Viewed 10 November 2004, <http://www.melbourneinstitute.com/hilda/sinstruments.html>. Meyers MK, Lukemeyer A & Smeeding T 1998. The cost of caring: childhood disability and poor families. Social Service Review 72:209–33. Must A 1996. Morbidity and mortality associated with elevated body weight in children and adolescents. American Journal of Clinical Nutrition 63 (Supplement):445S–47S. Newacheck PW 1998. Prevalence and impact of disabling chronic conditions in childhood. American Journal of Public Health 88(4):610–17. Newacheck PW & McManus M 1988. Financing health care for disabled children. Pediatrics 81:385–94. NSPCC (National Working Group on Child Protection and Disability) 2003. It doesn’t happen to disabled children. Report of the National Working Group on Child Protection and Disability. Viewed 12 May 2004, <http//www.nspcc.org.uk/inform/downloads/ItDoesn’tHappenToDisabledChildren.pdf>. NSW DoCS (New South Wales Department of Community Services) 2003. Annual report 2003. Viewed 10 May 2004, <http://www.community.nsw.gov.au/html/Annual_Report_03>. New South Wales Law Reform Commission 1998. People with an intellectual disability and the criminal justice system. Report 80. Viewed 13 May 2004, <http://www.lawlink.nsw.gov.au/lrc.nsf/pages/R80REC>. O’Halloran JM 1993. Welcome to our family, Casey Patrick. In: Turbull AP, Patterson M, Behr SK, Murphy DL, Marquis JG & Blue-Banning MJ (eds). Cognitive coping, families and disability. Baltimore: Paul H Brookes Publishing Company, 19–29. Owen TJ, Halliday JL & Stone CA 2000. Neural tube defects in Victoria, Australia: potential contributing factors and public health implications. Australian and New Zealand Journal of Public Health 24:584–89. Parmenter TR, Atkinson N, Balandin S & Durvasula S 1999. Health needs and services for people with developmental disabilities. Sydney: Centre for Developmental Disability Studies. Prior M (ed.) 2002. Investing in our children: developing a research agenda. Canberra: Academy of the Social Sciences in Australia. Powell TH & Gallagher PA 1993. Brothers and sisters: a special part of exceptional families. 2nd ed. Baltimore, New York: Paul H. Brookes Publishing Company. Robertson C, Roberts M & Kappers J 2004. Asthma prevalence in Melbourne schoolchildren: have we reached the peak? The Medical Journal of Australia 180(6):273–76. Roche P & Spencer J 2002. Editorial: polio eradication in Australia and the world. Communicable Diseases Intelligence 26(2):113–17. Roeyers H & Mycke K 1995. Sibling of a child with autism, with mental retardation and with a normal development. Child: Care, Health and Development 21:305–19. Rolland JS 1994. Families, illness, and disability: an integrated model. New York: Basic Books. Sandler AG, Warren SH & Raver SA 1995. Grandparents as a source of support for parents of children with disabilities: a brief report. Mental Retardation 33:248–50.
116
Sawyer MG, Arney FM, Baghurst PA et al. 2000. Mental health of young people in Australia. Canberra: Mental health and Special Programs Branch, Commonwealth Department of Health and Aged Care. Schofield H, Herrman H, Bloch S et al. 1997. A profile of Australian family caregivers: diversity of roles and circumstances. Australian and New Zealand Journal of Public Health 21(1):59–66. Seligman M 1991. Grandparents of disabled grandchildren: hopes, fears and adaptation. Families in Society 72(3):147–52. Seligman M & Darling RB 1997. Ordinary families, special children. 2nd ed. New York: Guilford Press. Seligman M & Darling RB 1989. Ordinary families, special children. New York: Guilford Press. Senior K 2000. Testing the ICIDH-2 with Indigenous Australians: results of field work in two Aboriginal communities in the Northern Territory. Viewed 17 May 2004, <http://www.aihw.gov.au/publications/dis/ddb21/5_icidh_ind.doc>. Shonkoff JP, Hauser-Cram P, Krauss MW & Upshur CC 1992. Development of infants with disabilities and their families. Monographs of the Society for Research in Child Development, No 57. Simeonsson RJ & Bailey DB 1986. Siblings of handicapped children. In: Gallagher JJ & Vietze PM (eds). Families of handicapped persons: research, programs and policy issues. Baltimore, New York: Paul H. Brookes Publishing Company, 67–77. Stanley F & Blair E 1991. Why have we failed to reduce the frequency of cerebral palsy? The Medical Journal of Australia 154:623–26. Stanley F & Watson L 1992. Trends in perinatal mortality and cerebral palsy in Western Australia, 1967 to 1985. British Medical Journal 304:1658–63. Stanley FJ, Croft ML, Gibbins J et al. 1994. A population database for maternal and child health research in Western Australia using record linkage. Paediatric and Perinatal Epidemiology 8:433–47. Stoneman Z, Brody GH, Davis CH et al. 1988. Childcare responsibilities, peer relations, and sibling conflict: older siblings of mentally retarded children. American Journal on Mental Retardation 99(2):174–83. Sullivan EM, Burgess MA & Forrest JM 1999. The epidemiology of rubella and congenital rubella in Australia, 1992 to 1997. Communicable Diseases Intelligence 23(8):209–14. Sullivan PM & Knutson JF 2000. Maltreatment and disabilities: a population-based epidemiological study. Child Abuse and Neglect 10:1257–73. Taylor B, Miller E, Farrington CP et al. 1999. Autism and measles, mumps and rubella vaccine: no epidemiological evidence for a causal association. Lancet 353:2026–29. Toelle B, Ng K, Belousova E et al. 2004. The prevalence of asthma and allergy in schoolchildren in Belmont, Australia: three cross-sectional surveys over 20 years. British Medical Journal 328(7436):386. Tomison AM 1996. Child maltreatment and disability. Issues in Child Abuse Prevention National Child Protection Clearing House Issues Paper, No. 7. Tonge B, Einfield S, Krupinksi J et al. 1996. The use of factor analysis for ascertaining patterns of psychopathology in children with intellectual disability. Journal of Intellectual Disability Research 40:198–207.
117
Trute B 2003. Grandparents of children with developmental disabilities: intergenerational support and family well-being. Families in Society 84(1):119–26. Tunali B & Power T 1993. Creating satisfaction: a psychological perspective on stress and coping in families of handicapped children. Journal of Child Psychology and Psychiatry 34:945–57. US Public Health Service 2002. Closing the gap: a national blueprint for improving the health of individuals with mental retardation. Report of the Surgeon General’s conference on health disparities and mental retardation. Washington DC: US Public Health Service. Vadasy PF, Fewell RR & Meyer DJ 1986. Grandparents of children with special needs: insights into their experiences and concerns. Journal of the Division for Early Childhood 10:36–44. Verté H, Roeyers H & Buysse A 2003. Behavioural problems, social competence and self-concept in siblings of children with autism. Child: Care, Health and Development 29(3):193–205. Watts K, Beye P, Siafarikas A et al. 2004. Exercise training normalizes vascular dysfunction and improves central adiposity in obese adolescents. Journal of the American College of Cardiology 43(10):1823–27. Weller WE, Minkovitz CS & Anderson GF 2003. Utilization of medical and health-related services among school-age children and adolescents with special health care needs (1994 National Health Interview Survey on Disability [NHIS-D] Baseline Data). Pediatrics 112(3):593–603. WHO (World Health Organization) 1992. International statistical classification of diseases and related health problems 10th Revision (ICD-10). Geneva: WHO. WHO 2001. International classification of functioning, disability and health. Geneva: WHO. Williams K, Leonard H, Tursan d’Espaignet E et al. (forthcoming). Hospitalisations from birth to five years in a population cohort of Western Australian children with intellectual disability. Willougby JC & Glidden LM 1995. Fathers helping out: shared child care and marital satisfaction of parents of children with disabilities. American Journal of Mental Retardation 99(4):399–406. Woolfson L 2004. Family well-being and disabled children: a psychosocial model of disability-related child behaviour problems. British Journal of Health Psychology 9:1–13. Young People in Nursing Homes Consortium 2003. Background. Viewed 18 November 2003, <http://ypinh.org.au>. Zubrick SR, Lawrence DM, Silburn SR et al. 2004. The Western Australian Aboriginal Child Health Survey: the health of Aboriginal children and young people. Volume 1. Perth: Telethon Institute for Child Health Research.