Embed Size (px)
Citation preview

Children of Parents Incarcerated in Alameda County JailsKATIE KRAMER, MSW/MPHTHE BRIDGING GROUP

Alameda County Overviewo 2,007 people offered surveys
o 1,134 people completed surveys 57% completion rate – “opt in” process
o Jail Distribution 88% from Santa Rita 12% from Glenn Dyer
o Language of Survey Distribution 95% conducted in English 5% in Spanish

Parent ParticipantDemographics (N=878)
Participant Demographics
878 of participants (77%) were parents or primary caregivers for child(ren) ≤ 25 years
Average # children was 2 (range: 1-10+) Among parents / primary caregivers:
◦ Average age was 31 years (range: 18-66)
Gender Language(s) Spoken◦ 90% male 93% English◦ 9% female 17% Spanish◦ 1% trans-male/female 0.6% Mandarin or
Cantonese 6% Other language
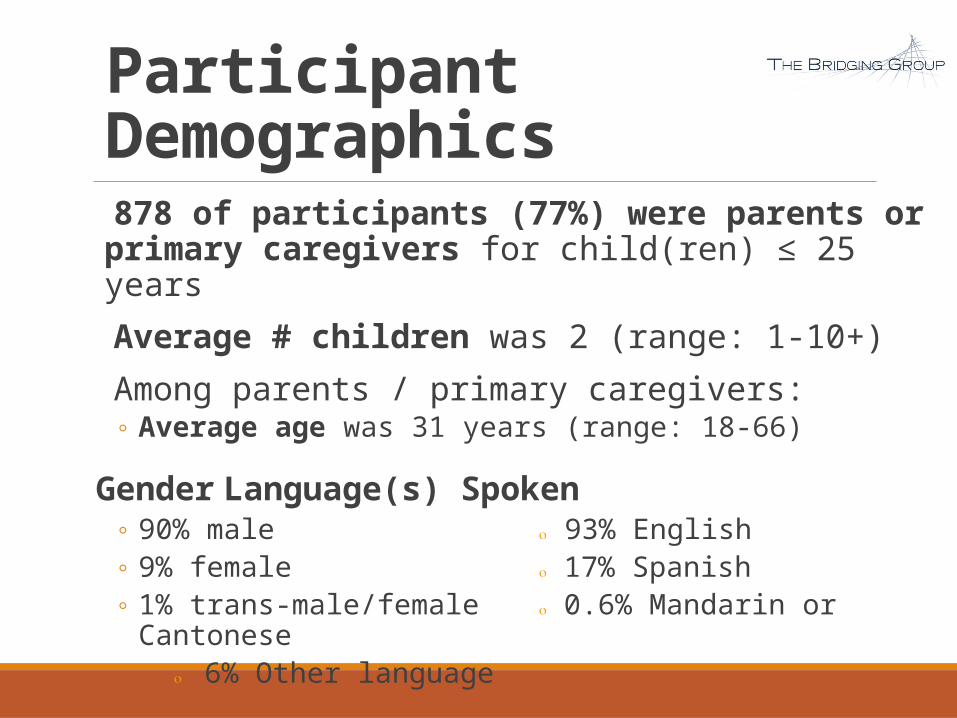
Race / Ethnicity
Black; 51%
Latino; 22%White;
11%
Asian orPacific Is-
lander; 5%
American Indian or
Alaska Na-tive; 1%
Mixed / Other;
10%
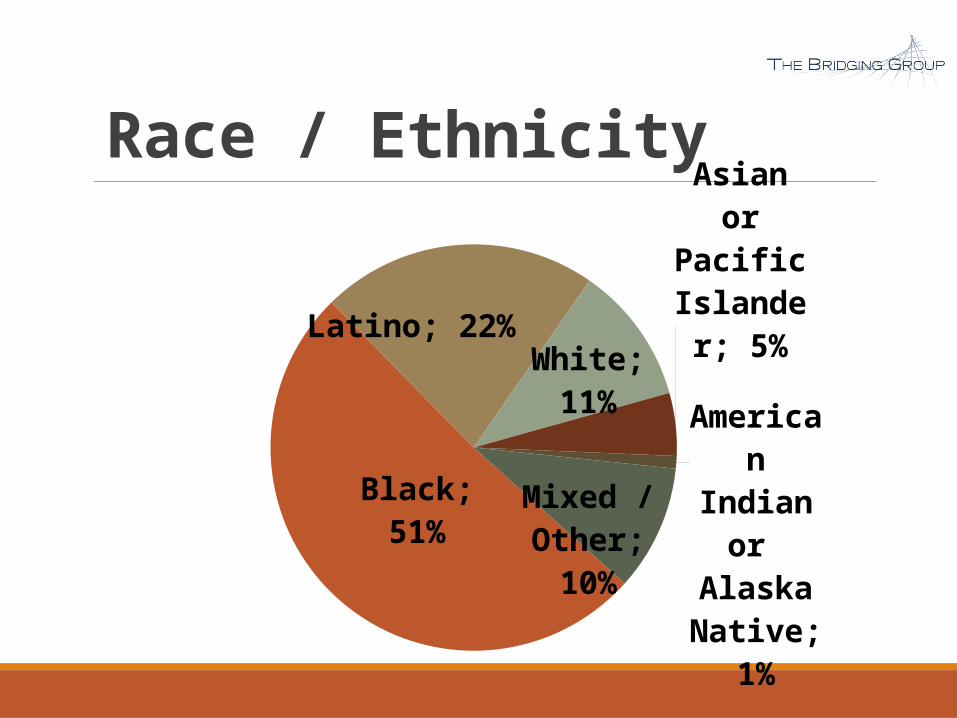
Total Times Incarcerated Since Becoming a Parent
43% reported their own parents have been incarcerated1 time 2-5 times 6-10 times 11+ times
0%
10%
20%
30%
40%
50%
29%
40%
17%13%
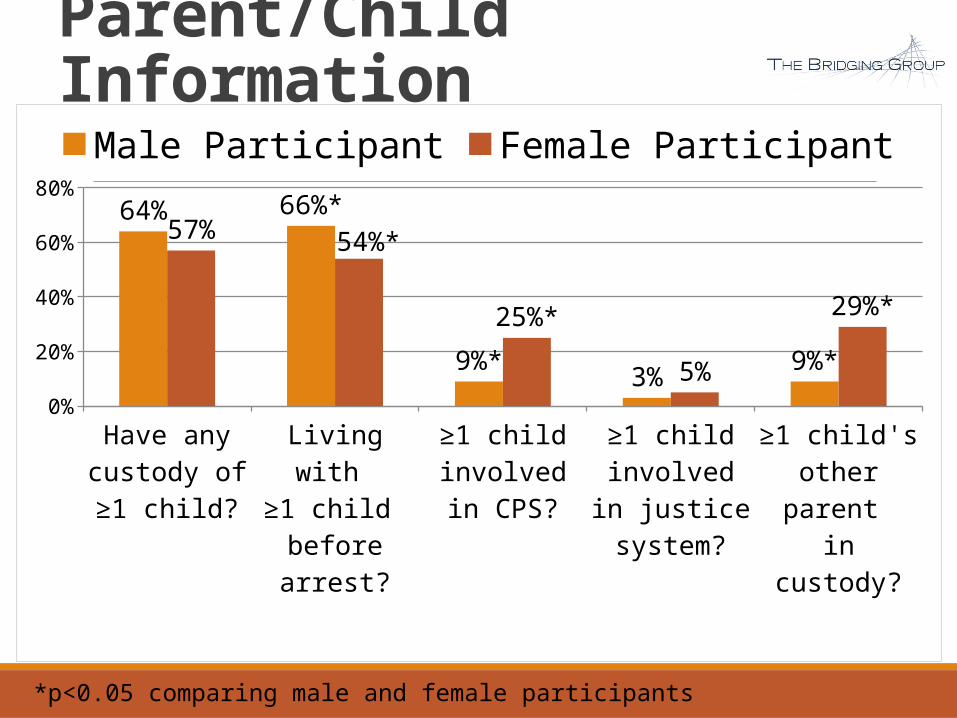
Parent/Child Information
Have any c
ustody o
f
≥1 child
?Liv
ing with
≥1 child
before arrest?
≥1 child
invo
lved in
CPS?
≥1 child
invo
lved in
justi
ce sy
stem?
≥1 child
's
other parent
in custo
dy?
0%
20%
40%
60%
80%64% 66%*
9%* 3% 9%*
57% 54%*
25%*
5%
29%*
Male Participant Female Participant
*p<0.05 comparing male and female participants

ChildDemographics (N= 1,781)
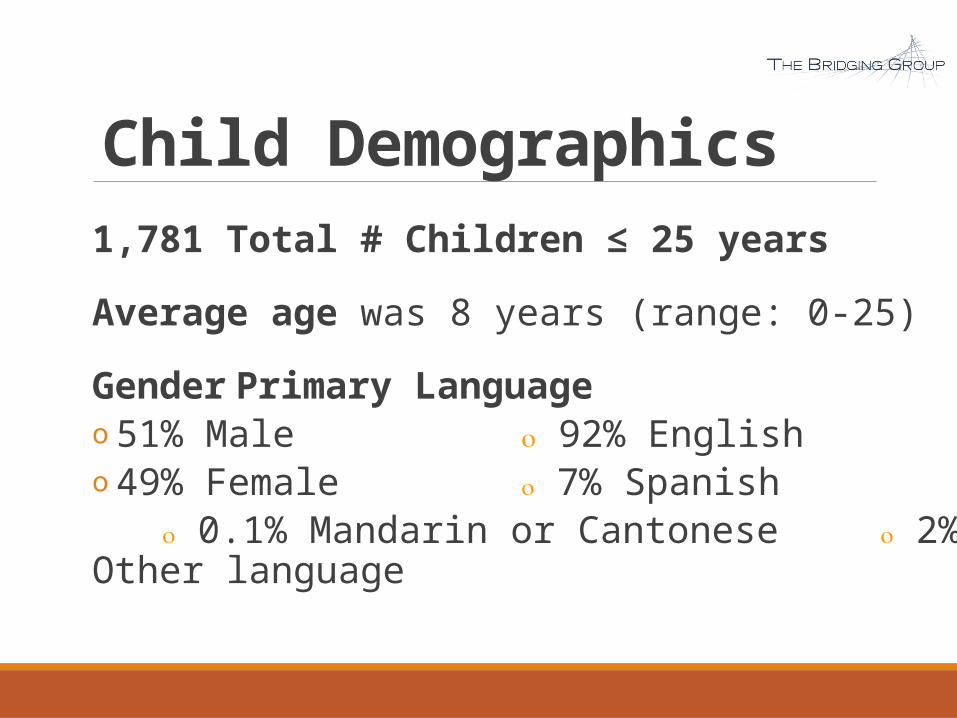
Child Demographics1,781 Total # Children ≤ 25 years
Average age was 8 years (range: 0-25)
Gender Primary Languageo 51% Male 92% Englisho 49% Female 7% Spanish
0.1% Mandarin or Cantonese 2% Other language

Race / Ethnicity of Children
Black; 45%
Latino; 20%
White; 10%
Asian orPacific Is-
lander; 4%
American Indian or
Alaska Na-tive; 1%
Mixed / Other; 21%
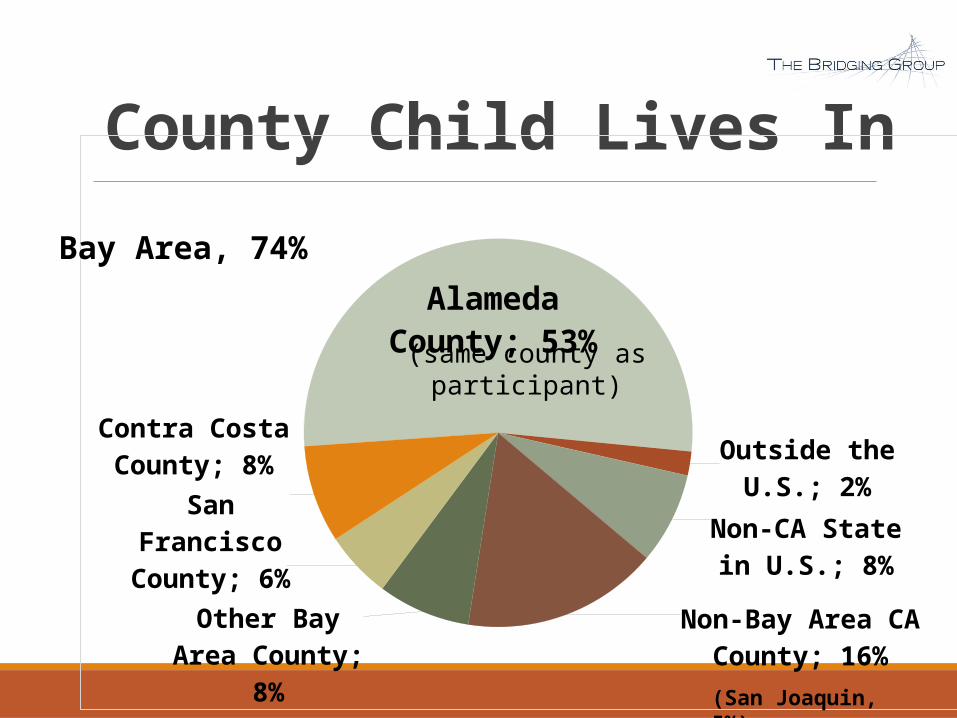
County Child Lives In
Alameda County; 53%
Outside the U.S.; 2%
Non-CA State in U.S.; 8%
Non-Bay Area CA County; 16%Other Bay Area
County; 8%
San Francisco County; 6%
Contra Costa County; 8%
(same county as participant)
Bay Area, 74%
(San Joaquin, 5%)
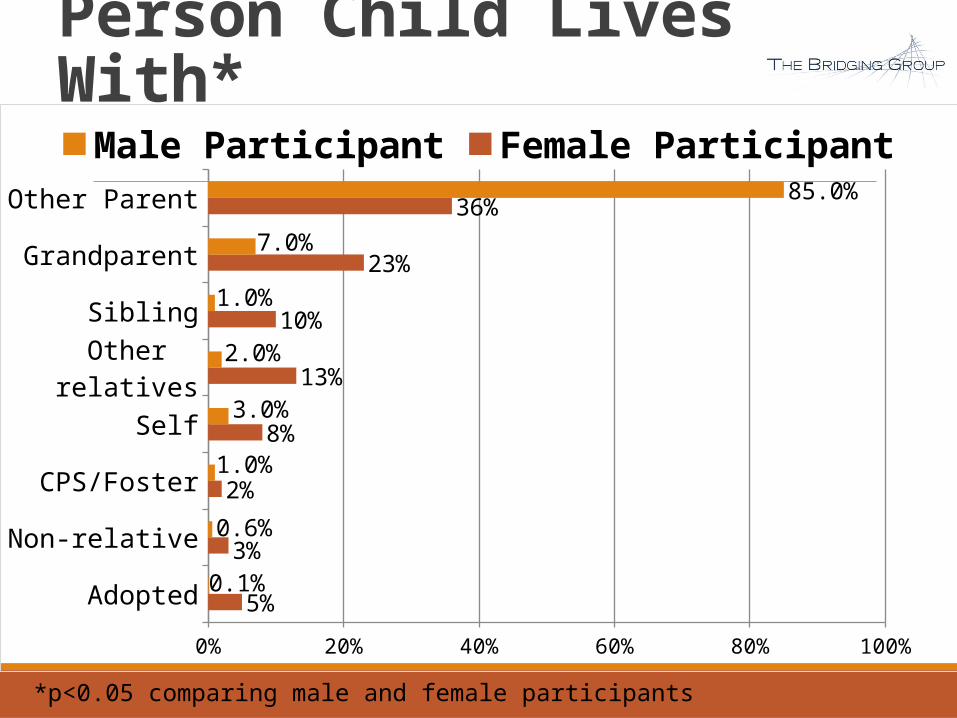
Person Child Lives With*
*p<0.05 comparing male and female participants
Adopted
Non-relative
CPS/Foster
Self
Other relatives
Sibling
Grandparent
Other Parent
0% 20% 40% 60% 80% 100%
5%
3%
2%
8%
13%
10%
23%
36%
0.1%
0.6%
1.0%
3.0%
2.0%
1.0%
7.0%
85.0%
Male Participant Female Participant

Child Demographics
*p<0.05 comparing male and female participants
Participant has any custody?
Living with participant
before arrest?
Involved in CPS?
Other parent in custody?
0%
10%
20%
30%
40%
50%
60%
70%
60%*57%*
7%* 7%*
46%* 45%*
24%* 26%*
Male Participant Female Participant
Child’sExperience (N= 878)
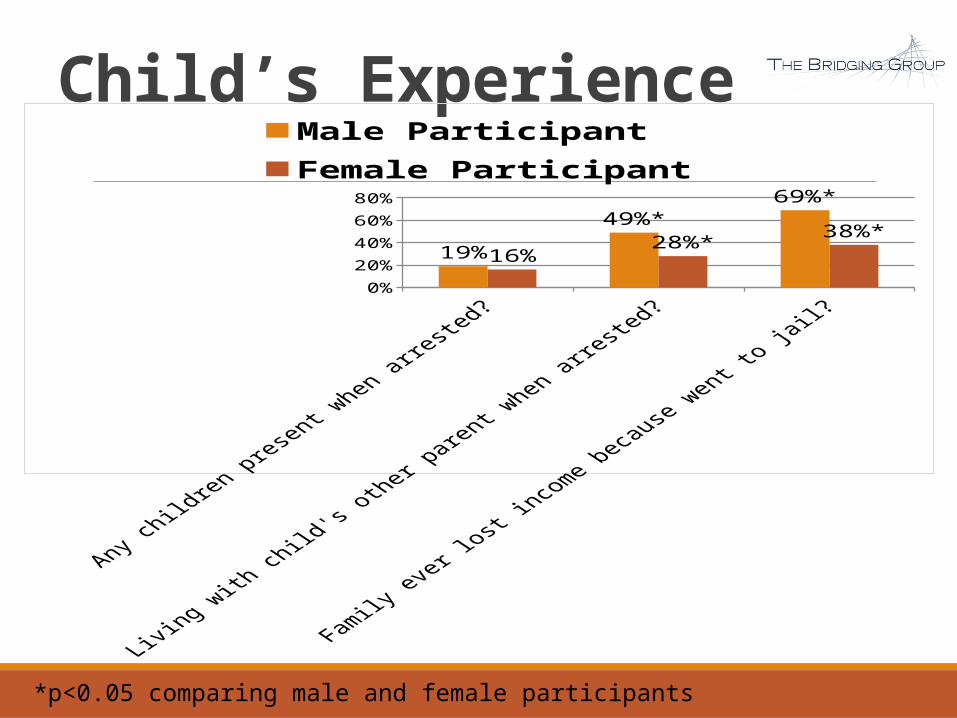
Child’s Experience
*p<0.05 comparing male and female participants
Any children present when arrested?
Living with child's other parent when arrested?
Family ever lost income because went to jail?
0%
20%
40%
60%
80%
19%
49%*
69%*
16%
28%*
38%*
Male Participant Female Participant

Child Change Where Live?
1 time 2-5 times 6-10 times 11+ times
-25%
0%
25%
50%
75%
55%
41%
4% 1%
54%
43%
0%4%
Male Participant Female Participant
28% of participants have children that had to change where they live because parent went to jail

Child Change Schools?
17% of participants have children that had to change schools because parent went to jail
1 time 2-5 times 6-10 times 11+ times0%
25%
50%
75%
100%
58%
37%
4% 1%
13%
75%
13%
0%
Male Participant Female Participant
Contact withChildren (N=878)
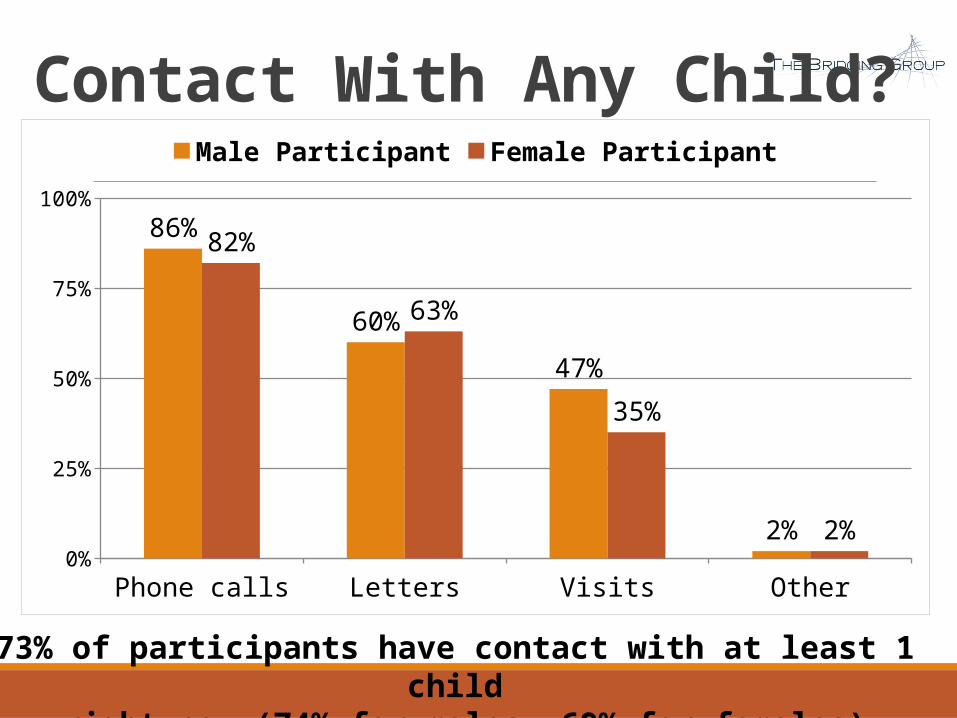
Contact With Any Child?
73% of participants have contact with at least 1 child right now (74% for males, 69% for females)
Phone calls Letters Visits Other0%
25%
50%
75%
100%
86%
60%
47%
2%
82%
63%
35%
2%
Male Participant Female Participant
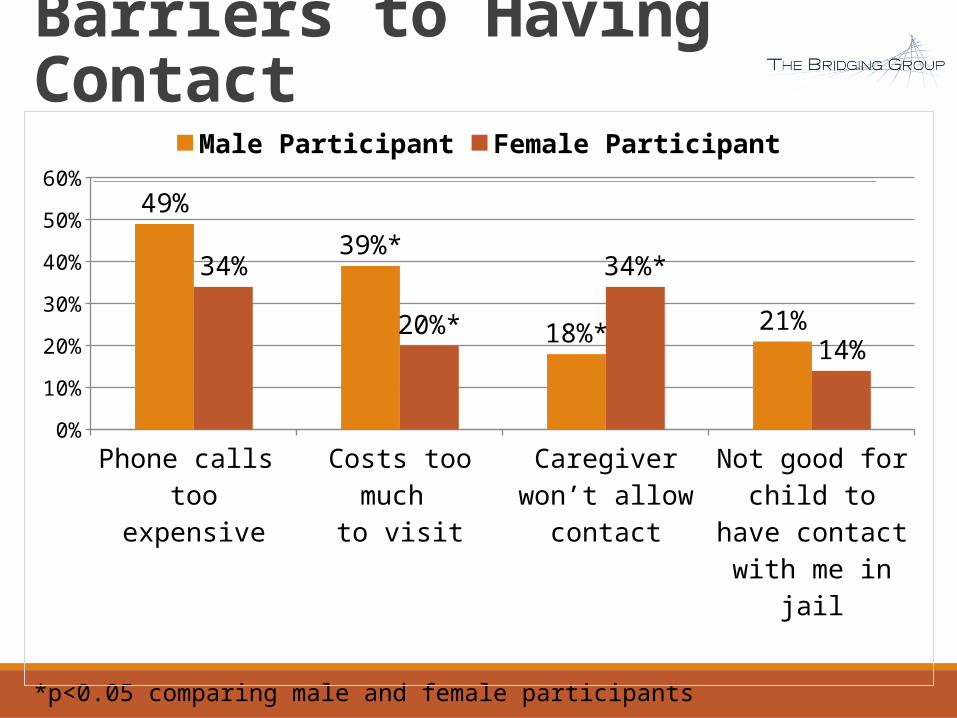
Barriers to Having Contact
*p<0.05 comparing male and female participants
Phone calls too expensive
Costs too much to visit
Caregiver won’t allow contact
Not good for child to have contact with me in jail
0%
10%
20%
30%
40%
50%
60%
49%
39%*
18%*21%
34%
20%*
34%*
14%
Male Participant Female Participant
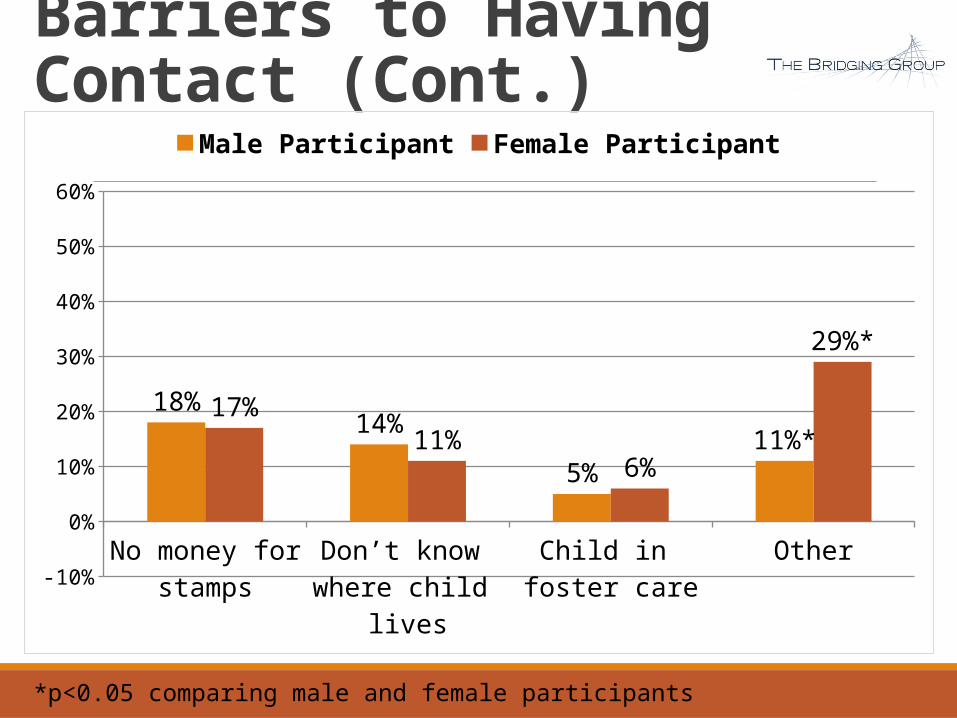
Barriers to Having Contact (Cont.)
*p<0.05 comparing male and female participants
No money for stamps
Don’t know where child
lives
Child in foster care
Other-10%
0%
10%
20%
30%
40%
50%
60%
18%14%
5%11%*
17%11%
6%
29%*
Male Participant Female Participant
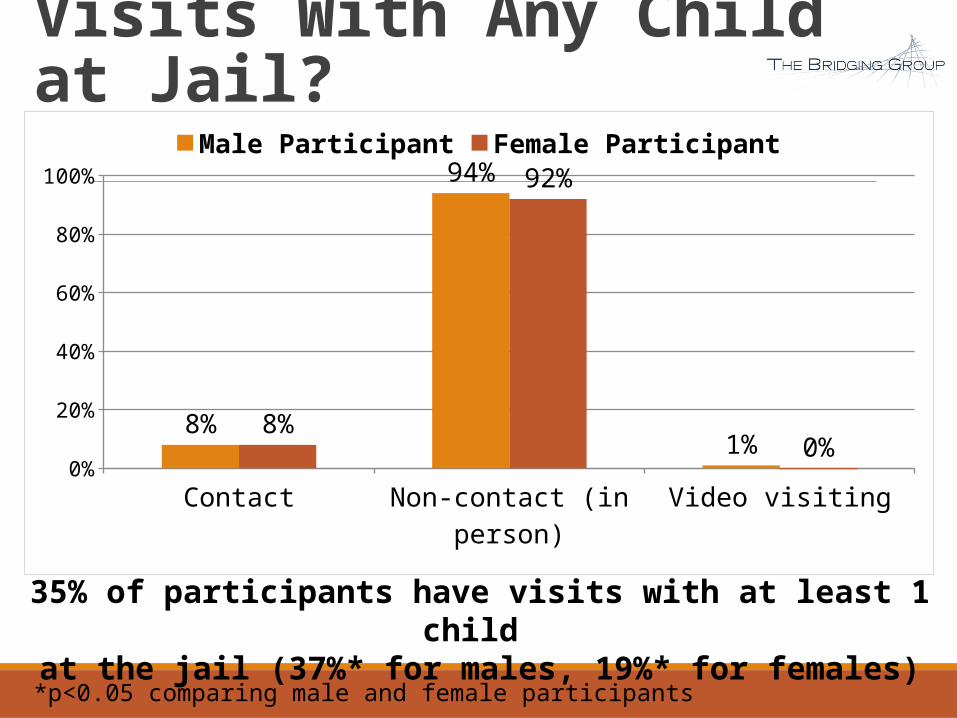
Visits With Any Child at Jail?
35% of participants have visits with at least 1 child at the jail (37%* for males, 19%* for females)
*p<0.05 comparing male and female participants
Contact Non-contact (in person) Video visiting0%
20%
40%
60%
80%
100%
8%
94%
1%8%
92%
0%
Male Participant Female Participant

How to Support Visits?
Want contact
Extend visitinghours
Help with transportation
Easier to get & set-up
visits
Improve visiting
environment
Other0%
20%
40%
60%
80%
65%
23%
5% 5%2% 3%

Reconnecting After Release
96% of participants planned to reconnect with at least 1 child after their release
Don’t hav
e
resource
s to
reconnect
Don’t know
where child
is livi
ng
Have paro
le/
probati
on that
prevent c
ontact
with ch
ild Geographic
limita
tions
CPS invo
lvement
doesn’t a
llow
contac
t with
child
Don’t know /
No conce
rns
0%
20%
40%
60%
80%
26%
7% 7% 7% 3%
62%
Concerns About Reconnecting After Release

Additional Support for Child?
Positive family
activities
Recreational activities
Support for basic life
needs
Counseling /therapy
Homework /tutoring
0%
10%
20%
30%
40%
50%
60% 56%
48%42%
35% 35%

Additional Support? (Cont.)
Youth mentoring
Mediation with child’s
caregiver
Restorative justice work
Help locating child
Other
-10%
0%
10%
20%
30%
40%
50%
60%
26%
15%12% 12% 11%