Embed Size (px)
Citation preview

Children and Young People Living Well and Staying WellNew Zealand Childhood Obesity Programme Baseline Report 2016/17
Released 2017 health.govt.nz

Citation: Ministry of Health. 2017. Children and Young People Living Well and Staying Well: New Zealand Childhood Obesity Programme Baseline Report
2016/17.Wellington: Ministry of Health.
Published in June 2017by the Ministry of Health
PO Box 5013, Wellington 6140, New Zealand
ISBN 978-1-98-850246-5 (online)HP 6593
This document is available at health.govt.nz
This work is licensed under the Creative Commons Attribution 4.0 International licence. In essence, you are free to: share ie, copy and redistribute the material in any medium or format; adapt ie, remix, transform and build upon the material. You must give appropriate credit, provide a link to the licence and indicate if changes were made.
ContentsExecutive summary v
Introduction 1Background 1The effects of childhood obesity 1Factors that contribute to childhood obesity 1The New Zealand Childhood Obesity Programme 2The reducing childhood obesity intervention logic model 5Overview 7Data sources 8How we will use the Reducing childhood obesity indicators 8
Reducing childhood obesity indicators 9
Indicators 1–3: More children are physically active 9Indicator 1: Time spent watching television, videos and screens 10Indicator 2: Sleep duration 12Indicator 3: Time spent on physical activity 13
Indicators 4–7: More children eat well 14Indicator 4: Breastfeeding 15Indicator 5: Consumption of fast foods 16Indicator 6: Consumption of sugary drinks 18Indicator 7: Fruit and vegetable intake 20
Indicators 8–11: Children’s environments support physical activity and healthy living 23
Indicator 8: Awareness of the Health Star Rating system 24Indicator 9: Active transport to and from school 26Indicator 10: Use of a bicycle 28Indicator 11: Water in schools 29
Indicators 12–15: More children have improved health outcomes 30Indicator 12: Body mass index 31Indicator 13: Gestational diabetes 33Indicator 14: Raising Healthy Kids health target 34Indicator 15: Birth weight 36
Baseline performance against the reducing childhood obesity indicators 38
Children and Young People Living Well and Staying Well iii

References 41
List of TablesTable 1: Reducing childhood obesity indicators 7Table 2: Percentage of children (aged 2–14 years) who usually watch two
or more hours of television (including DVDs or videos) per day, by group, 2015/16 11
Table 3: Recommended sleep durations for children and young people aged 0–17 years old 12
Table 4: Percentage of infants who are exclusively, fully or partially breastfed at two weeks, six weeks, three months and six months, March 2016 15
Table 5: Percentage of children (aged 2–14 years) who ate fast food at least once in the past week, by group, 2015/16 16
Table 6: Percentage of children (aged 2–14 years) who had fizzy drink three or more times in the past week, by group, 2015/16 19
Table 7: Percentage of children (aged 2–14 years) who eat at least two servings of fruit each day, by group, 2015/16 21
Table 8: Percentage of children (aged 2–14 years) who meet New Zealand’s age-specific vegetable intake guidelines, by group, 2015/16 22
Table 9: Percentage of grocery shoppers who recognise, understand and use the Health Star Rating system, by group, 2015 25
Table 10: Percentage of children (aged 5–14 years) who usually use an active mode of transport, such as walking, biking or skating, to get to and from school, by group, 2015/16 26
Table 11: Number and percentage of children (aged 2–14 years) with a body mass index that indicates they are thin, a healthy weight, overweight but not obese, overweight or obese, or obese, by group, 2015/16 32
Table 12: Number and percentage of births where the mother had gestational diabetes, 2015/16 33
Table 13: Raising Healthy Kids health target performance, quarter one 2016/17 35
Table 14: Number and percentage of babies by birth weight category, 2015 37Table 15: Baseline performance against the reducing childhood obesity
indicators 38
List of FiguresFigure 1: Overview of the New Zealand Childhood Obesity Programme and
Plan 4Figure 2: Reducing childhood obesity intervention logic model 6Figure 3: Percentage of children (aged 2–14 years) who usually watch two
or more hours of television (including DVDs or videos) per day, 2011/12–2015/16 11
Figure 4: Percentage of children (aged 2–14 years) who ate fast food at least once in the past week, 2011/12–2015/16 17
iv Children and Young People Living Well and Staying Well

Figure 5: Percentage of children (aged 2–14 years) who had fizzy drink three or more times in the past week, 2011/12–2015/16 19
Figure 6: Percentage of children (aged 2–14 years) who eat at least two servings of fruit each day, 2011/12–2015/16 21
Figure 7: Percentage of children (aged 2–14 years) who meet New Zealand’s age-specific vegetable intake guidelines, 2011/12–2015/16 22
Figure 8: Example of a Health Star Rating 24Figure 9: Percentage of children (aged 5–14 years) who usually use active
transport (eg, walk, bike or skate) to get to and from school, 2011/12–2015/16 27
Children and Young People Living Well and Staying Well v

Executive summaryThe Ministry of Health developed this report in collaboration with the Ministry of Education, Sport New Zealand, the Ministry for Primary Industries and the Health Promotion Agency, as part of the activities of the New Zealand Childhood Obesity Programme. The report builds on the work that these organisations undertook in 2016 to develop an intervention logic model for reducing childhood obesity. That model includes an agreed set of reducing childhood obesity indicators that we will use to monitor the programme’s progress over the next five years.
The purpose of this report is to describe each of the reducing childhood obesity indicators in more detail, and present a baseline view of their performance. The report also includes a brief overview of the New Zealand Childhood Obesity Programme and the Reducing childhood obesity intervention logic model, as well as an update on the programme’s first year of implementation (2015/16).
The reducing childhood obesity indicators have been divided into four categories to align with the programme’s four medium-term outcomes. Indicators 1–3 measure whether children and young people are becoming less
sedentary and more physically active. Indicators 4–7 measure whether more children and young people are eating
well. Indicators 8–11 measure whether the environments that children and young
people live and play in are supporting children to become more physically active and to lead healthier lives.
Indicators 12–15 measure whether children’s obesity-related health outcomes are improving.
Baseline performance is not available for four of the indicators, because data collection only began in 2016/17. Results for most of these indicators will be included in the first Children and young people living well and staying well monitoring report, due to be published in early 2018. That report will be the first in an annual series of monitoring reports on the New Zealand Childhood Obesity Programme; it will provide information on the second year of implementation and an updated view of performance against the reducing childhood obesity indicators.
This baseline report highlights some inequities between different population groups for a number of the indicators. The programme’s long-term goal is to reduce childhood obesity in New Zealand equitably, with a particular focus on Māori, Pacific peoples and children living in areas of high deprivation.
vi Children and Young People Living Well and Staying Well
IntroductionBackgroundNew Zealand has high rates of childhood obesity: 10.7 percent of New Zealand children (aged2–14 years) are obese, and these rates are even higher among Māori children (14.7 percent), Pacific children (29.8 percent) and children living in our most deprived neighbourhoods (20.0 percent) (Ministry of Health 2016d).
The effects of childhood obesityObese children are at risk of immediate and long-term health consequences. Childhood obesity is associated with obstructive sleep apnoea; musculoskeletal problems; asthma; and psychological problems including body dissatisfaction, poor self-esteem and depression. Childhood obesity can have a negative impact on children’s learning and academic achievement; obese children may become targets for bullying, which can further impact on their self-esteem and mental wellbeing.
Obese children are also more likely to become obese adults, and are therefore more at risk of developing long-term conditions such as type 2 diabetes, heart disease, dementia, some cancers, mental illness and chronic pain.
Factors that contribute to childhood obesityEvidence on the causes of obesity is still evolving. However, we do know that:1. Energy (kilojoule) intake is key – the amount of food a person eats and its
energy density is the single biggest driver of obesity. Helping people to make good food choices and reduce their intake of energy-dense foods will have the greatest impact on reducing obesity.
2. Environmental factors (physical, economic, political or social) play an important role – for example, obesity increases when there is greater availability and more invasive marketing of high-energy, low-nutrient food and beverages, and reduced opportunities for physical activity.
3. Parental health, including maternal and infant nutrition, is significant – the World Health Organization’s Commission on Ending Childhood Obesity notes that a mother can reduce her child’s risk of obesity by avoiding gestational diabetes, eating well during pregnancy, and continuing to breastfeed her infant.
4. Physical activity has health and educational benefits – increasing levels of physical activity helps children and young people to attain and maintain a healthy weight, and can break the intergenerational cycle of inactivity. Physical activity also supports positive educational outcomes, specifically through improved cognition and behaviour.
Children and young people living well and staying well 1

5. Children need to get the right amount of sleep – children who sleep less than the recommended amount are twice as likely to be overweight or obese. The exact relationship between insufficient sleep and weight gain is unclear, but it is thought that being awake for longer affects a person’s ability to regulate their appetite, leading to excess energy intake. Not getting enough sleep may also lead to reduced physical activity and energy expenditure.
The New Zealand Childhood Obesity ProgrammeIn October 2015, the Government launched the Childhood Obesity Plan (see Figure 1). The plan includes 22 initiatives designed to reduce the risk of children becoming obese, or to increase support for children and young people who are already obese. The initiatives include developing improved public information and resources, encouraging children to be more physically active, supporting children and their families/whānau to make healthier food choices and working with the food and beverage industry to encourage the development and promotion of healthier food options.
The Childhood Obesity Plan is being implemented through the multi-agency New Zealand Childhood Obesity Programme, which aims to equitably reduce childhood obesity in New Zealand so that all children and young people can live well and stay well.
We have made good progress on the Childhood Obesity Plan over the past year (see Text box 1), but there is still plenty of work to do. The New Zealand Childhood Obesity Programme is looking at other cross-government, private sector and community initiatives that have the potential to reduce childhood obesity. Both the programme and the plan are likely to evolve over time, to reflect what we are learning about what works for different population groups and why.
2 Children and Young People Living Well and Staying Well

Text box 1: The New Zealand Childhood Obesity Plan’s achievements to date
The Government has introduced the Raising Healthy Kids health target, to help identify children and families/whānau that may need extra support to achieve a healthy lifestyle. The target requires that ‘By December 2017, 95% of obese children identified in the B4 School Check programme will be offered a referral to a health professional for clinical assessment and family-based nutrition, activity and lifestyle interventions.’ In quarter two 2016/17, achievement against the target was 71.9%.
The Health Star Rating system, which rates the healthiness of packaged foods, is now on over 2000 products and is supported by a promotional campaign.
The pilot programme Play.sport is in 44 schools across Upper Hutt and Waitakere. Play.sport aims to support teachers, schools, parents and caregivers and community organisations to improve the quality of young people’s experiences of play, physical education, physical activity and sport, by improving community and national leadership.
All district health boards (DHBs) have become sugar-sweetened beverage free, and are working towards implementing the National District Health Board Food and Drink Environments Network’s National Healthy Food and Drink Policy.
The Ministry of Health has published updated Eating and Activity Guidelines for New Zealand adults and Clinical Guidelines for Weight Management in New Zealand Children and Young People.
The Education Review Office has published two reports on food, nutrition and physical activity in New Zealand schools and early learning services.
Since October 2015, 285 new schools have signed up to the Ministry of Health’s Health Promoting Schools programme, which works with school leaders to identify health and wellbeing priorities for students, and to create and implement a plan to address these priorities.
Healthy Families New Zealand is operating in 10 locations across the country (Far North, Waitakere, Manukau, Manurewa-Papakura, East Cape, Rotorua, Whanganui, Lower Hutt, Christchurch and Invercargill). It takes a whole-of-community approach to the prevention of chronic disease; activating local leadership and creating healthy changes in the places where people live, learn, work and play – including schools, early childhood education centres, workplaces, sports clubs, marae, places of worship and community spaces.
Children and young people living well and staying well 3

Figure 1: Overview of the New Zealand Childhood Obesity Programme and Plan
4 Children and Young People Living Well and Staying Well

The reducing childhood obesity intervention logic modelThe Reducing childhood obesity intervention logic model (see Figure 3) was developed to provide direction and support for the New Zealand Childhood Obesity Programme. The model sets out a number of shared goals, outcomes and indicators which will help us identify new opportunities and priorities for investment.
The model aligns with the recommendations of the World Health Organization’s Commission on Ending Childhood Obesity (WHO 2016) and was developed in consultation with the Ministry of Education, Sport New Zealand, the Health Promotion Agency, the Education Review Office, the New Zealand Transport Agency and the Accident Compensation Corporation.
The model includes four medium-term outcomes that describe what we hope to achieve over the next 4–5 years: more children are physically active more children eat well children’s environments support physical activity and healthy eating more children have improved health outcomes.
The model also includes an agreed set of performance indicators (known as the reducing childhood obesity indicators), which will allow us to measure whether the medium-term outcomes are being achieved. Each indicator was chosen based on its relevance to childhood obesity and its ability to be measured using existing data collections. Some of the indicators are outcomes-focused (eg, percentage of children whose body mass index is within a healthy weight range); others focus on the drivers of childhood obesity (eg, unhealthy eating and low levels of physical activity).
Children and young people living well and staying well 5

Figure 2: Reducing childhood obesity intervention logic model
6 Children and Young People Living Well and Staying Well

OverviewThis report provides a brief description of each of the reducing childhood obesity indicators and their measures, and presents a baseline view of their performance. Where possible, we have broken the data down by sex, age, ethnic group and neighbourhood deprivation quintile (to highlight any inequities between population groups), and presented actual numbers alongside percentages.
Table 1 lists each of the indicators and their measures, according to which medium-term outcome they align with. We may amend the list of indicators over time, as more information becomes available, new evidence emerges or new initiatives are established.
Table 1: Reducing childhood obesity indicators
Indicator Measure
More children are physically active
1 Time spent watching television, videos or screens
Percentage of children (aged 2–14 years) who usually watch two or more hours of television (including DVDs and videos) per day
2 Sleep duration Percentage of children (aged 5–13 years) who get 9–11 hours of sleep per day on average
3 Time spent on physical activity
Percentage of children (aged 5–17 years) who spent at least one hour per day being physically active (for sport, physical education, exercise or fun) over the last week
More children eat well
4 Breastfeeding Percentage of infants who are exclusively or fully breastfed at two weeks, six weeks and three monthsPercentage of infants who are still receiving breast milk at six months
5 Consumption of fast foods Percentage of children (aged 2–14 years) who ate fast food at least once in the past week
6 Consumption of sugary drinks
Percentage of children (aged 2–14 years) who had fizzy drink three or more times in the past week
7 Fruit and vegetable intake Percentage of children (aged 2–14 years) who eat at least two servings of fruit each dayPercentage of children (aged 2–14 years) who meet New Zealand’s age-specific vegetable intake guidelines
Children’s environments support physical activity and healthy living
8 Awareness of the Health Star Rating system
Percentage of grocery shoppers who recognise the Health Star Rating system when promptedPercentage of grocery shoppers who understand the Health Star Rating systemPercentage of grocery shoppers who use the Health Star Rating system when shopping
9 Active transport to and from school
Percentage of children (aged 5–14 years) who usually use an active mode of transport, such as walking, biking or skating, to get to and from school
10 Use of a bike Percentage of children (aged 5–17 years) who have ridden a bike in the last week for sport, exercise or funAverage number of hours children (aged 5–17 years) spent riding a bike in the last week for sport, exercise or fun
11 Water in schools This measure is still under development
Children and young people living well and staying well 7

Indicator Measure
More children have improved outcomes
12 Body mass index Percentage of children (aged 2–14 years) with a BMI that indicates they are thin, a healthy weight, overweight (but not obese) or obese
13 Gestational diabetes Percentage of births where the mother had gestational diabetes
14 Raising Healthy Kids health target
Percentage of obese children identified in the B4 School Check programme who were offered a referral to a health professional for clinical assessment and family-based nutrition, activity and lifestyle intervention
15 Birth weight Percentage of babies whose birth weight (kg) was extremely low, very low, low, normal or high
Data sourcesThe following data sources were used to establish baseline performance against each of the indicators: the Ministry of Health’s New Zealand Health Survey (Ministry of Health 2016d) Sport New Zealand’s Active New Zealand Survey the Ministry of Health’s Indicators for the Well Child/Tamariki Ora Quality
Improvement Framework: March 2016 report (Ministry of Health 2016c) Colmar Brunton’s Health Star Rating Monitoring and Evaluation report, Health
Promotion Agency (Colmar Brunton 2016) the Ministry of Health’s National Maternity Collection the Ministry of Health’s National Minimum Data Set the Ministry of Health’s B4 School Check database the Ministry of Health’s annual Report on Maternity series.
We will continue to use these data sources for future monitoring reports, to make sure that the data is comparable over time.
How we will use the Reducing childhood obesity indicatorsThe reducing childhood obesity indicators will be used to monitor the progress of the New Zealand Childhood Obesity Programme, and will form the basis of future Children and young people living well and staying well monitoring reports. The first monitoring report will be published in early 2018. This will allow performance from baseline to be analysed for the first time, and will indicate whether the initiatives included in the Childhood Obesity Plan are achieving the desired outcomes.
8 Children and Young People Living Well and Staying Well

Reducing childhood obesity indicatorsIndicators 1–3: More children are physically activeRationale and purposePhysical activity is important for maintaining a healthy lifestyle. Physical activity is not just sport; it also includes active recreation, incidental activities, transportation and physical work.
Regular physical activity in children and young people improves health and wellbeing in numerous ways, including by: helping to build healthy bones, muscles and joints improving mental wellbeing assisting weight management strengthening the cardiovascular system improving coordination and movement control.
Children who establish good habits during childhood and maintain them during adolescence experience many long-term health benefits, including reducing their risk of developing long-term conditions such as heart disease and type 2 diabetes.
Children and young people living well and staying well 9

Indicator 1: Time spent watching television, videos and screensDescriptionThis indicator measures the percentage of children (aged 2–14 years) who watch two or more hours of television (including DVDs and videos) per day, averaged over a week.
Watching television is a sedentary behaviour that takes up time that children could spend being physically active. The Ministry of Health recommends that children and young people (aged5–18 years) should spend less than two hours a day (out of school hours) in front of a television, computer or games console (Ministry of Health 2015).
Baseline performanceThe Ministry of Health has collected the data for this indicator annually since 2011/12 through the New Zealand Health Survey. The baseline performance set out here comes from the 2015/16 survey.
In 2016/17, the survey questions changed slightly to capture the total amount of time children spend looking at screens, because the recent decline observed in television viewing time (see Figure 3) is likely to be offset by the time children spend using other devices, such as laptops or tablets. This means that the definition for this indicator will be slightly different in the first Children and young people living well and staying well monitoring report (due to be published in early 2018). In the first report, the indicator will measure the percentage of children (aged2–14 years) who had two or more hours of total screen time (including television, DVDs, videos, video games or computer) per day, averaged over a week.
The data for this indicator is available by sex, age group, ethnic group and neighbourhood deprivation quintile.
10 Children and Young People Living Well and Staying Well

Table 2: Percentage of children (aged 2–14 years) who usually watch two or more hours of television (including DVDs or videos) per day, by group, 2015/16
Total Boys Girls Estimated number of children (95% CI1)
Population group
Total 44.8% 44.1% 45.5% 355,000 (340,000–371,000)
Age group (years)
2–4 41.4% 47.3% 35.1% 74,000 (67,000–82,000
5–9 43.7% 39.9% 47.8% 140,000 (129,000–151,000)
10–14 48.1% 46.7% 49.5% 141,000 (132,000–150,000)
Ethnic group
Māori 51.8% 52.9% 50.5% 104,000 (97,000–111,000)
Pacific peoples 47.4% 43.9% 51.1% 49,000 (45,000–54,000)
Asian 46.9% 42.2% 51.6% 48,000 (43,000–53,000)
European/Other 43.2% 42.7% 43.7% 244,000 (229,000–258,000)
Neighbourhood deprivation quintile (NZDep2013)
Quintile 1 (least deprived) 41.9% 39.6% 44.4% 70,000 (59,000–81,000)
Quintile 2 39.2% 36.7% 42.1% 60,000 (52,000–68,000)
Quintile 3 43.3% 45.6% 41.0% 61,000 (54,000–69,000)
Quintile 4 47.3% 47.3% 47.3% 70,000 (64,000–77,000)
Quintile 5 (most deprived) 51.3% 51.2% 51.3% 94,000 (88,000–100,000)
Source: Ministry of Health 2016dNote: The estimated number of children who usually watch two or more hours of television has been rounded to the nearest 1,000. For more information on how these numbers are calculated, please see section 7 of Ministry of Health 2016b.
Figure 3: Percentage of children (aged 2–14 years) who usually watch two or more hours of television (including DVDs or videos) per day, 2011/12–2015/16
2011/12 2012/13 2013/14 2014/15 2015/160%
10%
20%
30%
40%
50%
60%
70%
80%
90%
100%
Source: Ministry of Health 2016d
1 The 95% confidence interval (CI) refers to the fact that if repeated samples were taken and the 95% CI was calculated for each sample, 95% of the intervals would contain the population mean (ie, a 95% CI has a 0.95 probability of containing the population mean).
Children and young people living well and staying well 11

Indicator 2: Sleep durationDescriptionThis indicator will measure the percentage of children (aged 5–13 years) who get an average of 9–11 hours sleep in a 24-hour period, in line with the Ministry of Health’s recommended sleep durations for school-age children (see Table 3).
Table 3: Recommended sleep durations for children and young people aged 0–17 years old
Age Recommended hours of sleep
Newborn babies (0–3 months) 14–17
Infants (4–11 months) 12–15
Toddlers (1–2 years) 11–14
Pre-schoolers (3–4 years) 10–13
School-age children (5–13 years) 9–11
Teenagers (14–17 years) 8–10
Source: Ministry of Health 2016a
Inadequate amounts of sleep adversely impact children and young people’s health in a variety of ways, including their weight status, school performance, driver safety, emotional and behavioural wellbeing and dietary intake (Shochat et al 2014; Bartel et al 2015).
Fatima et al (2015) found that children who did not get the recommended amount of sleep were twice as likely to be obese than those who did. Exactly how greater amounts of sleep protect against weight gain is unclear, but sleep deprivation is thought to affect both sides of the energy balance equation. Being awake for longer leaves a person more time to eat; it also affects appetite regulation, leading to excess energy intake. Not getting enough sleep may also lead to less physical activity and reduced energy expenditure, although these effects may not be as strong (Schmid et al 2015).
Baseline performanceThere is currently no baseline data available for this indicator. The Ministry will start collecting data for the indicator through the New Zealand Health Survey from 1 July 2017, and expects the first results around December 2018. The first results will likely be included in the second Children and young people living well and staying well monitoring report, which will be published in early 2019. From then, the results will be available annually by age group, ethnic group and neighbourhood deprivation quintile.
12 Children and Young People Living Well and Staying Well

Indicator 3: Time spent on physical activityDescriptionThere are many opportunities and reasons why children might be physically active. They may play a sport or partake in physical education at school, or they may do physical activity for exercise or fun.
This indicator will measure the percentage of children (aged 5–17 years) who spent at least one hour per day being physically active (for sport, physical education, exercise or fun) over the last week.
The Ministry of Health recommends that children and young people should: partake in at least 60 minutes of moderate to vigorous physical activity every
day be active in as many ways as possible; for example, through play, cultural
activities, dance, sport and recreation, jobs and transport be active with friends and family/whānau, at home, at school and in their
community (Ministry of Health 2015).
The results for this indicator may or may not include the time children spend using active transport (ie, walking, cycling or skating) to get to and from school. It will depend on whether the child being surveyed considers getting to and from school as sport, physical education, exercise or fun.
The indicator also doesn’t specify how intensive the child’s physical activity was; therefore, it is only a proxy for the proportion of children meeting the Ministry of Health’s recommendations for physical activity.
Baseline performanceThere is currently no baseline data available for this indicator. Sport New Zealand will start collecting data for the indicator through the Active New Zealand Survey, which it launched in January 2017. Sport New Zealand is still finalising its reporting requirements and timeframes for this survey. However, it is likely that the first Children and young people living well and staying well monitoring report will include the first results.
Children and young people living well and staying well 13

Indicators 4–7: More children eat wellRationale and purposeEating well is important for children’s growth, development and wellbeing. Eating well means eating a wide variety of nutritious foods, including: plenty of fruit and vegetables some grain foods: mostly wholegrain and those naturally high in fibre some milk and milk products, mostly low- and reduced-fat some legumes, nuts, seeds, fish and other seafood, eggs or poultry, or red meat
with the fat removed.
Eating well also means restricting the amount of energy-dense, nutrient-poor foods and sugar-sweetened beverages children consume. These foods have little or no nutritional value, and are key drivers of childhood obesity.
14 Children and Young People Living Well and Staying Well

Indicator 4: BreastfeedingDescriptionThis indicator measures the percentage of infants who are exclusively or fully breastfed at two weeks, six weeks and three months, and the percentage of infants who are exclusively, fully or partially breastfed at six months.
A baby has been exclusively breastfed if he or she has never had any water, formula, other liquid or solid food, besides breast milk (from the breast or expressed) and prescribed medicines, since birth.
A baby has been fully breastfed if he or she has taken breast milk and a minimal amount of water or prescribed medicines, but no other liquids or solids, in the past 48 hours.
Breastfeeding helps to optimise babies’ development, growth and nutrition. The Ministry of Health recommends exclusively breastfeeding until babies are six months old and continuing breastfeeding for at least the first year of infants’ lives, or beyond.
Research has shown that exclusive breastfeeding for the first six months of life, followed by the introduction of appropriate complementary foods, significantly reduces a child’s risk of obesity (Horta et al 2015). Appropriate complementary feeding with continued breastfeeding can reduce the risk of under-nutrition and excess body fat in infants, both of which are risk factors for childhood obesity.
Baseline performanceThe data for this indicator comes from the Indicators for the Well Child/Tamariki Ora Quality Improvement Framework report (Ministry of Health 2016c). That report sources data from the Ministry of Health’s National Maternity Collection and the Well Child/Tamariki Ora database. The National Maternity Collection contains data on primary maternity services provided under section 88 of the New Zealand Public Health and Disability Act 2000, while the Well Child/ Tamariki Ora database contains service coverage and event-level data relating to the contractual requirements of the national Well Child/Tamariki Ora tier two service specification.
The data for this indicator is available by age group and ethnic group, and for those living in neighbourhood deprivation quintile 5 (ie, the most deprived neighbourhoods). The baseline performance set out here provides only rates; the Well Child/Tamariki Ora Quality Improvement Framework report did not include the number of children in each group.
Table 4: Percentage of infants who are exclusively, fully or partially breastfed at two weeks, six weeks, three months and six months, March 2016
Infants exclusively or fully breastfed Infants exclusively, fully or partially breastfed
2 weeks 6 weeks 3 months 6 months
Population group
Total 78% 74% 55% 66%
Ethnic group
Māori 76% 68% 43% 53%
Children and young people living well and staying well 15

Pacific peoples 74% 70% 46% 62%
Neighbourhood deprivation quintile (NZDep2013)
Quintile 5 (most deprived) 75% 69% 46% 57%
Source: Ministry of Health 2016c
Indicator 5: Consumption of fast foodsDescriptionThis indicator measures the percentage of children (aged 2–14 years) who ate fast-food at least once in the past week. Fast-food includes any food purchased from a fast-food place or takeaway shop, such as fish and chips, burgers, fried chicken or pizza.
Fast-foods are generally high in fat, salt and sugar, and provide very few nutrients relative to their energy content (ie, they are energy-dense and nutrient-poor) (Ministry of Health 2012). Diets that are high in fat and salt are associated with a number of long-term conditions, including heart disease and hypertension.
The Ministry of Health recommends that parents and caregivers should buy fast-food no more than once a week, and should try to choose a healthier fast food option where possible (Ministry of Health 2016a).
Baseline performanceThe Ministry of Health has collected the data for this indicator annually since 2011/12 through the New Zealand Health Survey. The baseline performance set out here comes from the 2015/16 survey and is broken down by sex, age group, ethnic group and neighbourhood deprivation quintile.
Table 5: Percentage of children (aged 2–14 years) who ate fast food at least once in the past week, by group, 2015/16
Total Boys Girls Estimated number of children (95% CI)
Population group
Total 69.4% 68.9% 70.0% 551,000 (534,000–567,000)
Age group (years)
2–4 63.1% 63.4% 62.8% 114,000 (106,000–120,000)
5–9 70.5% 69.0% 72.1% 226,000 (216,000–235,000)
10–14 72.1% 72.1% 72.1% 212,000 (203,000–220,000)
Ethnic group
Māori 78.6% 79.5% 77.6% 157,000 (151,000–163,000)
Pacific peoples 81.7% 81.1% 82.2% 84,000 (80,000–88,000)
Asian 66.6% 67.2% 66.0% 68,000 (61,000–75,000)
European/Other 66.7% 65.8% 67.6% 377,000 (365,000–389,000)
Neighbourhood deprivation quintile (NZDep2013)
Quintile 1 (least deprived) 66.0% 63.8% 68.3% 110,000 (102,000–118,000)
16 Children and Young People Living Well and Staying Well

Total Boys Girls Estimated number of children (95% CI)
Quintile 2 66.7% 66.6% 66.8% 102,000 (93,000–111,000)
Quintile 3 67.5% 66.7% 68.3% 96,000 (90,000–102,000)
Quintile 4 73.2% 74.2% 72.2% 109,000 (101,000–115,000)
Quintile 5 (most deprived) 73.4% 73.1% 73.8% 133,000 (126,000–140,000)
Source: Ministry of Health 2016dNote: The estimated number of children in each group who ate fast food at least once in the last week has been rounded to the nearest 1,000. For more information on how these numbers are calculated, please see section 7 of Ministry of Health 2016b.
Figure 4: Percentage of children (aged 2–14 years) who ate fast food at least once in the past week, 2011/12–2015/16
2011/12 2012/13 2013/14 2014/15 2015/160%
10%
20%
30%
40%
50%
60%
70%
80%
90%
100%
Source: Ministry of Health 2016d
Children and young people living well and staying well 17

Indicator 6: Consumption of sugary drinksDescriptionThere is a strong association between fizzy drinks and increased risk of obesity (Taylor et al 2005; Vartanian et al 2007; World Cancer Research Fund and American Institute for Cancer Research 2007). Fizzy drinks are high in sugar and have very little nutritional value, and studies suggest that they displace more nutritional fluids, such as milk, in the diets of children (Harnack et al 1999; Mrdjenovic and Levitsky 2003).
The Ministry of Health recommends that children and young people choose drinks that are low in added sugar, and that they make plain water their first choice wherever possible (Ministry of Health 2016a). It also recommends that parents and caregivers not buy sugar-sweetened drinks for their children, and offer them mostly water, along with two or three glasses of milk per day (Ministry of Health 2016a).
This indicator measures the percentage of children (aged 2–14 years) who drank fizzy drink three or more times in the past week. We have constructed the indicator to identify regular/high consumers of fizzy drinks. If we looked at children who drank one or more fizzy drinks in the past week, it is likely that we would include some occasional consumers, therefore distorting our results.
For the purposes of this indicator, ‘fizzy drink’ incudes fizzy drinks like cola and lemonade, artificially sweetened fizzy drinks like diet cola and energy drinks such as Powerade or V. It does not include powdered drinks made up with water, such as cordial or Raro, or fruit juice such as Just Juice.
Baseline performanceThe Ministry of Health has collected the data for this indicator annually since 2011/12 through the New Zealand Health Survey. The baseline performance set out here comes from the 2015/16 survey. The data is broken down by sex, age group, ethnic group and neighbourhood deprivation quintile.
18 Children and Young People Living Well and Staying Well

Table 6: Percentage of children (aged 2–14 years) who had fizzy drink three or more times in the past week, by group, 2015/16
Total Boys Girls Estimated number of children (95% CI)
Population group
Total 17.5% 19.4% 15.4% 138,000 (126,000–152,000)
Age group (years)
2–4 9.8% 10.9% 8.7% 18,000 (13,000–24,000)
5–9 15.5% 16.2% 14.8% 50,000 (42,000–58,000)
10–14 24.2% 28.1% 20.3% 71,000 (63,000–80,000)
Ethnic group
Māori 23.1% 25.1% 21.0% 46,000 (41,000–52,000)
Pacific peoples 30.6% 32.1% 29.0% 32,000 (27,000–37,000)
Asian 14.4% 15.9% 12.9% 15,000 (11,000–20,000)
European/Other 14.4% 15.5% 13.2% 81,000 (72,000–91,000)
Neighbourhood deprivation quintile (NZDep2013)
Quintile 1 (least deprived) 9.5% 11.2% 7.5% 16,000 (12,000–21,000)
Quintile 2 12.4% 12.0% 12.9% 19,000 (14,000–26,000)
Quintile 3 13.9% 15.6% 12.3% 20,000 (16,000–24,000)
Quintile 4 19.5% 23.1% 15.8% 29,000 (24,000–35,000)
Quintile 5 (most deprived) 30.2% 33.6% 26.7% 55,000 (48,000–62,000)
Source: Ministry of Health 2016dNote: The estimated number of children in each group who drank fizzy drink three or more times in the past week has been rounded to the nearest 1,000. For more information on how these numbers are calculated, please see section 7 of Ministry of Health 2016b.
Figure 5: Percentage of children (aged 2–14 years) who had fizzy drink three or more times in the past week, 2011/12–2015/16
2011/12 2012/13 2013/14 2014/15 2015/160%
10%
20%
30%
40%
50%
60%
70%
80%
90%
100%
Source: Ministry of Health 2016d
Children and young people living well and staying well 19

Indicator 7: Fruit and vegetable intakeDescriptionFruit and vegetables are an important part of a healthy diet. They provide a person with energy, carbohydrate, dietary fibre, vitamins (including vitamin A, vitamin C and folate) and minerals (including potassium and magnesium). Most fruit and vegetables are also low in energy and contribute to satiety (a feeling of abdominal fullness after eating), thereby helping people maintain a healthy weight.
This indicator measures the: percentage of children (aged 2–14 years) who eat at least two servings of fruit
each day percentage of children (aged 2–14 years) who meet New Zealand’s age-specific
vegetable intake guidelines.
The Ministry of Health (2012) recommend that: children of all ages should eat at least two servings of fruit per day children aged 2–4 years should eat at least two servings of vegetables per day children aged 5–14 years should eat at least three servings of vegetables per
day.
For the purposes of this indicator, ‘fruit’ includes any fresh, frozen, canned or stewed fruit, but does not include fruit juice or dried fruit. One serving of fruit means one medium-sized piece of fruit, two small pieces of fruit or half a cup of stewed fruit. For example, one apple and two small apricots is equal to two servings.
‘Vegetable’ includes any fresh, frozen and canned vegetables, but does not include vegetable juices. One serving of vegetables means one medium-sized potato/kumara, half a cup of cooked vegetables or one cup of salad vegetables. For example, two medium-sized potatoes and half a cup of peas is equal to three servings.
Baseline performanceThis report presents the baseline data for both measures by sex, age group, ethnic group and neighbourhood deprivation quintile. The data comes from the New Zealand Health Survey, and has been collected annually since 2011/12.
20 Children and Young People Living Well and Staying Well

Fruit intakeTable 7: Percentage of children (aged 2–14 years) who eat at least two servings of fruit each day, by group, 2015/16
Total Boys Girls Estimated number of children (95% CI)
Population group
Total 73.6% 73.4% 73.9% 584,000 (569,000–599,000)
Age group (years)
2–4 80.2% 80.6% 79.7% 144,000 (138,000–150,000)
5–9 76.2% 74.8% 77.7% 244,000 (235,000–252,000)
10–14 66.9% 67.5% 66.2% 196,000 (185,000–206,000)
Ethnic group
Māori 73.8% 71.0% 76.9% 148,000 (142,000–154,000)
Pacific peoples 70.4% 66.4% 74.7% 74,000 (69,000–78,000)
Asian 59.8% 55.4% 64.1% 61,000 (55,000–67,000)
European/Other 76.9% 77.6% 76.1% 434,000 (423,000–445,000)
Neighbourhood deprivation quintile (NZDep2013)
Quintile 1 (least deprived) 78.6% 78.4% 78.7% 131,000 (122,000–138,000)
Quintile 2 74.9% 75.9% 73.7% 114,000 (106,000–122,000)
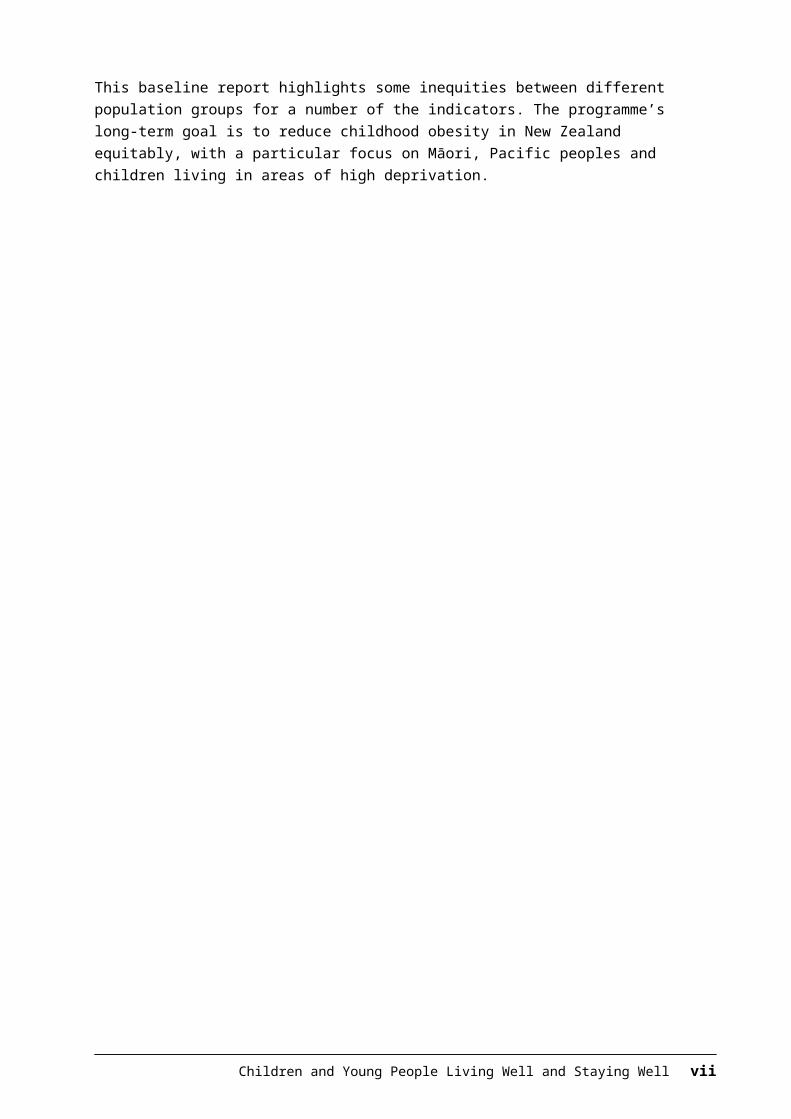
Quintile 3 74.1% 73.8% 74.4% 105,000 (100,000–110,000)
Quintile 4 72.0% 70.6% 73.6% 107,000 (102,000–112,000)
Quintile 5 (most deprived) 69.1% 68.4% 69.7% 126,000 (120,00–133,000)
Source: Ministry of Health 2016dNote: The estimated number of children in each group who eat at least two servings of fruit each day has been rounded to the nearest 1,000. For more information on how these numbers are calculated, please see section 7 of Ministry of Health 2016b.
Figure 6: Percentage of children (aged 2–14 years) who eat at least two servings of fruit each day, 2011/12–2015/16
2011/12 2012/13 2013/14 2014/15 2015/160%
10%
20%
30%
40%
50%
60%
70%
80%
90%
100%
Source: Ministry of Health 2016d
Children and young people living well and staying well 21

Vegetable intakeTable 8: Percentage of children (aged 2–14 years) who meet New Zealand’s age-specific vegetable intake guidelines, by group, 2015/16
Total Boys Girls (%) Estimated number of children (95% CI)
Population group
Total 50.5% 52.3% 48.7% 401,000 (380,000–422,000)
Age group (years)
2–4 67.7% 70.6% 64.7% 122,000 (114,000–129,000)
5–9 43.3% 45.5% 41.0% 139,000 (127,000–151,000)
10–14 47.9% 48.4% 47.3% 140,000 (128,000–152,000)
Ethnic group
Māori 46.9% 49.3% 44.4% 94,000 (87,000–102,000)
Pacific peoples 39.8% 37.3% 42.4% 42,000 (36,000–47,000)
Asian 36.2% 37.8% 34.5% 37,000 (31,000–43,000)
European/Other 56.2% 58.1% 54.2% 318,000 (300,000–335,000)
Neighbourhood deprivation quintile (NZDep2013)
Quintile 1 (least deprived) 55.2% 56.1% 54.2% 92,000 (79,000–104,000)
Quintile 2 55.3% 61.8% 48.0% 85,000 (76,000–93,000)
Quintile 3 52.7% 55.3% 49.9% 74,000 (67,000–82,000)
Quintile 4 48.2% 47.7% 48.8% 72,000 (64,000–80,000)
Quintile 5 (most deprived) 42.7% 41.8% 43.5% 78,000 (72,000–85,000)
Source: Ministry of Health 2016dNote: The estimated numbers of children in each group who eat at least two servings of vegetables each day has been rounded to the nearest 1,000. For more information on how these numbers are calculated, please see section 7 of Ministry of Health 2016b.
Figure 7: Percentage of children (aged 2–14 years) who meet New Zealand’s age-specific vegetable intake guidelines, 2011/12–2015/16
2011/12 2012/13 2013/14 2014/15 2015/160%
10%
20%
30%
40%
50%
60%
70%
80%
90%
100%
Source: Ministry of Health 2016d
22 Children and Young People Living Well and Staying Well

Indicators 8–11: Children’s environments support physical activity and healthy livingRationale and purposeCreating environments that support children to eat well and be more physically active is important for reducing rates of childhood obesity. We can do this by developing policies and interventions that influence how we market, label and subsidise foods and beverages for children, and by supporting policies and projects that make the built environment more activity-friendly (eg, by creating spaces where children can safely walk and cycle).
Children and young people living well and staying well 23

Indicator 8: Awareness of the Health Star Rating systemDescriptionThe Health Star Rating system is a voluntary front-of-pack labelling system adopted by New Zealand and Australia in 2014. Health Star Ratings provide a quick and easy way for shoppers to choose healthier packaged foods. They rate the healthiness of packaged foods, from half a star to five stars (see Figure 8). Foods lower in saturated fat, sugar or sodium, and/or higher in fibre, protein, nut, legume, fruit or vegetable content, have higher Health Star Ratings, meaning that they are a healthier food option.
Figure 8: Example of a Health Star Rating
This indicator measures the: percentage of grocery shoppers who recognise the Health Star Rating system
when prompted percentage of grocery shoppers who understand the Health Star Rating system percentage of grocery shoppers who use the Health Star Rating system when
shopping.
Shoppers can only use the ratings to compare similar types of packaged foods; for example, to compare breakfast cereals with other breakfast cereals, or muesli bars with other muesli bars. Food manufacturers calculate Health Star Ratings using an algorithm-based calculator. As at 30 September 2016, approximately 2000 packaged foods in New Zealand featured a Health Star Rating.
Baseline performanceThe Ministry for Primary Industries is responsible for administering the Health Star Rating system in New Zealand. The Health Promotion Agency worked with the Ministry for Primary Industries and the Ministry of Health in 2016 to develop and implement a consumer marketing and education campaign to increase awareness, recognition and correct use of the Health Star Rating system.
The Health Promotion Agency then contracted Colmar Brunton to monitor the effectiveness of the campaign. Comar Brunton surveyed 1,678 shoppers online between 19 October and 16 November 2015 to obtain their baseline results. Priority audiences for the campaign and the survey were shoppers in households that have at least one child under the age of 14 years, with an emphasis on Māori, Pacific and low-income families/whānau.
24 Children and Young People Living Well and Staying Well

The baseline results presented in this report come from Colmar Brunton’s baseline report (Colmar Brunton 2016). Colmar Brunton conducted one follow-up survey in 2016, and will conduct another in 2017. The first Children and young people living well and staying well monitoring report will include results from the first follow-up survey.
Table 9: Percentage of grocery shoppers who recognise, understand and use the Health Star Rating system, by group, 2015
Recognise the system
Understand the system
Use thesystem
Population group
Total 38% 51% 10%
Ethnic group
Māori with children under 14 years of age 36% 56% 6%
Pacific people with children under 14 years of age 65% 31% 25%
Deprivation
People of low income with children under 14 years of age 44% 49% 14%
Source: Colmar Brunton 2016Notes:1. The percentage of grocery shoppers who understand the Health Star Rating system is not a subset of shoppers who
recognised the system. Colmar Brunton’s survey showed all participants an image of a Health Star Rating and asked questions to gauge how well they understood the rating.
2. The percentage of grocery shoppers who used the system when shopping is a subset of those who said that they recognised the system.
Children and young people living well and staying well 25

Indicator 9: Active transport to and from schoolDescriptionThis indicator measures the percentage of children (aged 5–14 years) who usually use an active mode of transport, such as walking, biking or skating, to get to and from school.
Using an active mode of transport to get to and from school gives children of all physical abilities an opportunity to be more physically active. Research has shown that children who walk to school are less likely to be obese, and are more likely to have a lower BMI and a smaller waist circumference, than children who use more sedentary modes of transport, such as a car or bus (Pizarro et al 2013; Sarmiento et al 2015).
Baseline performanceThe baseline data presented in this report comes from the 2015/16 New Zealand Health Survey. The New Zealand Health Survey has collected this information annually since 2011/12 with the results broken down by sex, age group, ethnic group and neighbourhood deprivation quintile.
Table 10: Percentage of children (aged 5–14 years) who usually use an active mode of transport, such as walking, biking or skating, to get to and from school, by group, 2015/16
Total Boys Girls Estimated number of children (95% CI)
Population group
Total 45.8% 48.5% 43.0% 280,000 (261,000–300,000)
Age group (years)
5–9 42.3% 43.0% 41.5% 135,000 (124,000–146,000)
10–14 49.7% 54.6% 44.7% 145,000 (132,000–158,000)
Ethnic group
Māori 45.0% 45.6% 44.4% 69,000 (63,000–75,000)
Pacific peoples 48.3% 53.4% 42.6% 39,000 (34,000–43,000)
Asian 45.1% 52.0% 38.7% 34,000 (28,000-39,000)
European/Other 44.6% 46.5% 42.6% 196,000 (180,000–212,000)
Neighbourhood deprivation quintile (NZDep2013)
Quintile 1 (least deprived) 49.9% 54.8% 44.7% 67,000 (56,000–79,000)
Quintile 2 41.9% 40.9% 43.1% 48,000 (40,000–57,000)
Quintile 3 41.5% 44.2% 38.9% 45,000 (38,000–52,000)
Quintile 4 47.0% 49.8% 44.0% 53,000 (47,000–59,000)
Quintile 5 (most deprived) 47.5% 51.2% 43.9% 66,000 (59,000–74,000)
Source: Ministry of Health 2016dNote: The estimated number of children in each group who usually use active transport to get to and from school has been rounded to the nearest 1,000. For more information on how these numbers are calculated, please see section 7 of Ministry of Health 2016b.
26 Children and Young People Living Well and Staying Well
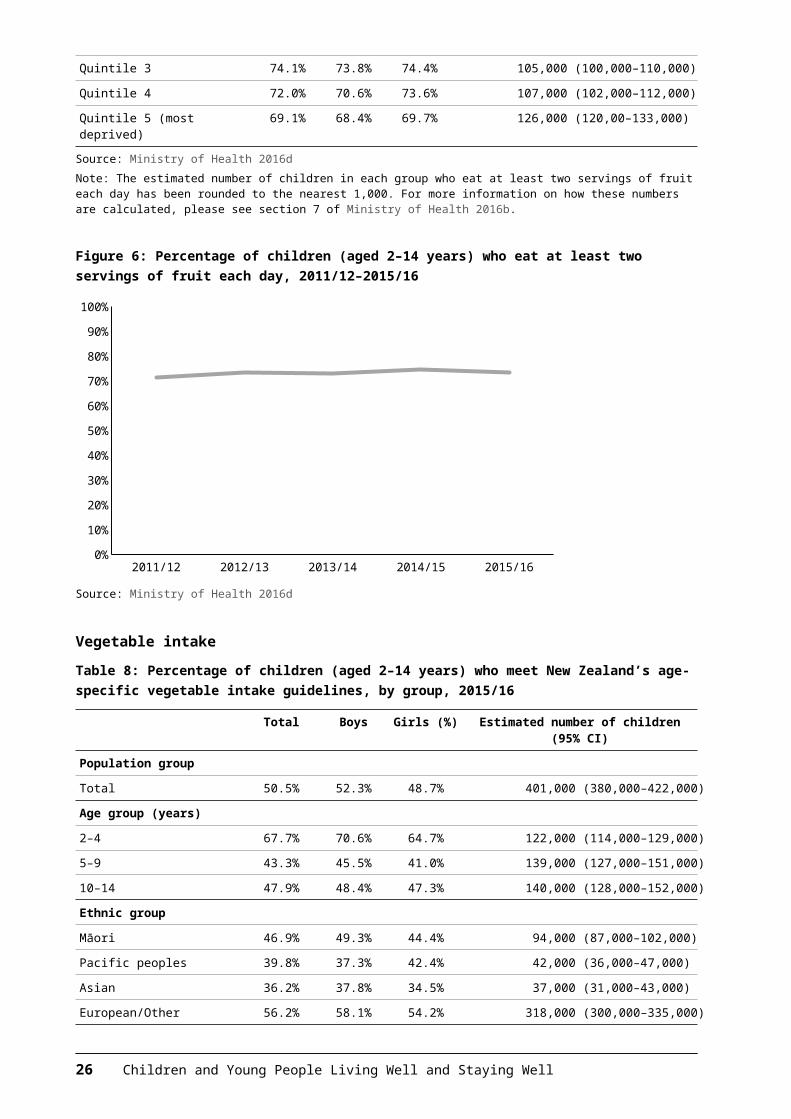
Figure 9: Percentage of children (aged 5–14 years) who usually use active transport (eg, walk, bike or skate) to get to and from school, 2011/12–2015/16
2011/12 2012/13 2013/14 2014/15 2015/160%
10%
20%
30%
40%
50%
60%
70%
80%
90%
100%
Source: Ministry of Health 2016d
Children and young people living well and staying well 27

Indicator 10: Use of a bicycleDescriptionThe health benefits of regular cycling include increased cardiovascular fitness, increased muscle strength and flexibility, improved joint mobility, improved posture and coordination and decreased body fat levels.
In New Zealand, nearly 70 percent of families/whānau have one or more bicycles at home (Ministry of Transport 2015), though we don’t know which family/whānau members own those bicycles, or how often they use them.
This indicator will measure the: percentage of children (aged 5–17 years) who have ridden a bicycle in the last
week for sport, exercise or fun average number of hours children (aged 5–17 years) spent riding a bicycle in the
last week for sport, exercise or fun.
Baseline performanceThere is currently no baseline data available for this indicator. Sport New Zealand started collecting the data in January 2017 through its new Active New Zealand Survey. It is still finalising its reporting requirements and timeframes, but it is likely that the first results will be included in the first Children and young people living well and staying well monitoring report.
28 Children and Young People Living Well and Staying Well

Indicator 11: Water in schoolsDescriptionThe measure for this indicator is still under development.
Several New Zealand schools have adopted water-only policies, meaning they have banned sugary drinks from their premises and only allow students to consume water and/or plain reduced-fat milk whilst at school.
Studies have shown that poor nutrition and low levels of physical activity are associated with poorer academic performance (Cushman 2016; Miller et al 2013; Suhrcke and de Paz Nieves 2011). Encouraging children to drink water, rather than less healthy drink options (like fizzy drinks – see Indicator 6), is one way that schools can promote better nutrition.
The Ministries of Education and Health encourage all schools to adopt water-only policies. Anecdotally, schools that have implemented water-only policies have seen benefits in teaching and learning as well as in students’ health and wellbeing.
Baseline performanceThere is currently no baseline data available for this indicator, as the measure is still being developed by the Ministries of Education and Health.
Children and young people living well and staying well 29
Indicators 12–15: More children have improved health outcomesRationale and purposeIndicators 1–11 mainly focus on the drivers of childhood obesity, including physical activity, nutrition and the environments that our children live and play in. However, it’s important that we also look at the impact that the New Zealand Childhood Obesity Programme is having on obesity-related outcomes. The most common measure of obesity is body mass index, which indirectly measures the extent of a person’s fat tissue, or adiposity. However, there are other outcomes that we hope to influence with this programme that take more of a life-course approach, including rates of gestational diabetes and babies with high birth weights, both of which are linked to an increased risk of childhood obesity. We also want to know whether more children who are obese and their families/whānau are getting the support they need to achieve a healthy weight and to manage any clinical risk associated with obesity; the Raising Healthy Kids health target provides us with a good indication of whether this is happening.
30 Children and Young People Living Well and Staying Well

Indicator 12: Body mass indexDescriptionThis indicator measures the percentage of children (aged 2–14 years) with a body mass index (BMI) that indicates they are thin, a healthy weight, overweight (but not obese) or obese.
Health practitioners use BMI to give an indirect measure of whether a person is underweight, overweight or an ideal weight for their height. BMI is calculated by dividing a person’s weight (in kilograms) by their height (in centimetres) squared. Age- and sex-specific centiles are used, because body composition changes with normal growth and maturation, and varies by sex.
If a child’s BMI is between the 91st and 98th centiles (ie, between 91.1 and ≤98.0) health practitioners should discuss the associated health risks with the child’s family/whānau and offer brief nutrition and lifestyle advice. If a child’s BMI is over the 98th centile (ie, ≥98.1), health practitioners should: discuss the associated health risks with the child’s family/whānau take a full history and do a clinical examination consider referral to a multi-disciplinary team, appropriate specialist or specialist
services (eg, a paediatrician or dietician) (Ministry of Health 2016a).
Baseline performanceThe baseline data presented in this report comes from the 2015/16 New Zealand Health Survey. The results have been broken down by age group, ethnic group and neighbourhood deprivation quintile.
The 2015/16 New Zealand Health Survey used the revised International Obesity Task Force (IOTF) BMI reference values to classify children as either overweight or obese (Cole and Lobstein 2012). The IOTF cut-off points are sex- and age-specific, and designed to coincide with the World Health Organization’s adult BMI cut-off points. The BMI cut-off points that were used in the 2015/16 health survey were as follows. Thin2 = equivalent to a BMI of 18.5 or lower in adults Healthy weight = equivalent to a BMI between 18.5 and 24.9 in adults Overweight but not obese = equivalent to a BMI between 25.0 and 29.9 in
adults Obese = equivalent to a BMI of 30.0 or greater in adults.
From 2016/17, the New Zealand Health Survey will use the New Zealand/World Health Organization BMI definitions, which have been developed for New Zealand children specifically. These definitions will align with those used for the Raising Healthy Kids health target. Because of this change, the results presented in the first Children and young people living well and staying well monitoring report may show higher rates of childhood obesity than at baseline.
2 The term ‘thin’ refers to children who have a low BMI for their age, rather than children who are ‘underweight’.
Children and young people living well and staying well 31

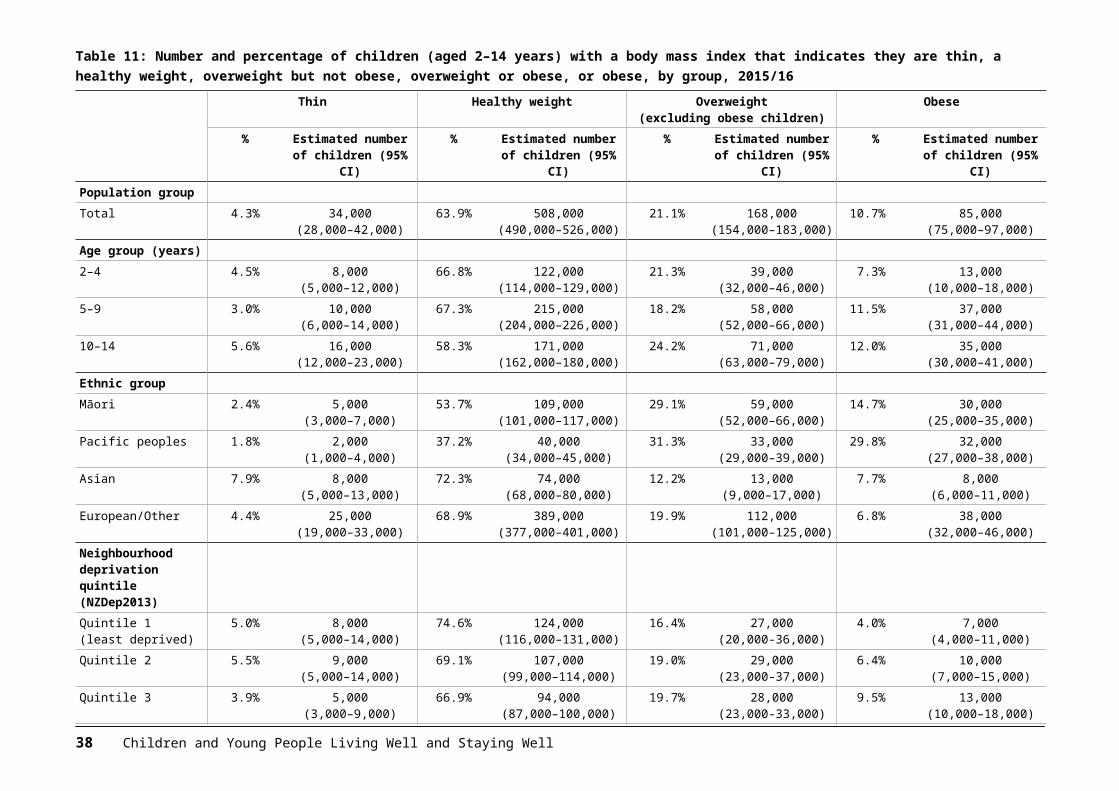
Table 11: Number and percentage of children (aged 2–14 years) with a body mass index that indicates they are thin, a healthy weight, overweight but not obese, overweight or obese, or obese, by group, 2015/16
Thin Healthy weight Overweight(excluding obese children)
Obese
% Estimated number of children (95% CI)
% Estimated number of children (95% CI)
% Estimated number of children (95% CI)
% Estimated number of children (95% CI)
Population groupTotal 4.3% 34,000
(28,000–42,000)63.9% 508,000
(490,000–526,000)21.1% 168,000
(154,000–183,000)10.7% 85,000
(75,000–97,000)Age group (years)2–4 4.5% 8,000
(5,000–12,000)66.8% 122,000
(114,000–129,000)21.3% 39,000
(32,000–46,000)7.3% 13,000
(10,000–18,000)5–9 3.0% 10,000
(6,000–14,000)67.3% 215,000
(204,000–226,000)18.2% 58,000
(52,000–66,000)11.5% 37,000
(31,000–44,000)10–14 5.6% 16,000
(12,000–23,000)58.3% 171,000
(162,000–180,000)24.2% 71,000
(63,000–79,000)12.0% 35,000
(30,000–41,000)Ethnic groupMāori 2.4% 5,000
(3,000–7,000)53.7% 109,000
(101,000–117,000)29.1% 59,000
(52,000–66,000)14.7% 30,000
(25,000–35,000)Pacific peoples 1.8% 2,000
(1,000–4,000)37.2% 40,000
(34,000–45,000)31.3% 33,000
(29,000–39,000)29.8% 32,000
(27,000–38,000)Asian 7.9% 8,000
(5,000–13,000)72.3% 74,000
(68,000–80,000)12.2% 13,000
(9,000–17,000)7.7% 8,000
(6,000–11,000)European/Other 4.4% 25,000
(19,000–33,000)68.9% 389,000
(377,000–401,000)19.9% 112,000
(101,000–125,000)6.8% 38,000
(32,000–46,000)Neighbourhood deprivation quintile (NZDep2013)Quintile 1(least deprived)
5.0% 8,000(5,000–14,000)
74.6% 124,000(116,000–131,000)
16.4% 27,000(20,000-36,000)
4.0% 7,000(4,000–11,000)
Quintile 2 5.5% 9,000(5,000–14,000)
69.1% 107,000(99,000–114,000)
19.0% 29,000(23,000-37,000)
6.4% 10,000(7,000–15,000)
Quintile 3 3.9% 5,000(3,000–9,000)
66.9% 94,000(87,000–100,000)
19.7% 28,000(23,000-33,000)
9.5% 13,000(10,000–18,000)
Quintile 4 2.9% 4,000(2,000–7,000)
61.5% 91,000(83,000–98,000)
23.4% 35,000(29,000-41,000)
12.1% 18,000(14,000–23,000)
Quintile 5(most deprived)
4.1% 8,000(5,000–11,000)
49.6% 93,000(84,000–101,000)
26.4% 49,000(43,000-57,000)
20.0% 37,000(32,000–44,000)
Source: Ministry of Health 2016d
Note: The estimated numbers of children in each weight category and group are rounded to the nearest 1,000. For more information on how these numbers are calculated, please see section 7 of Ministry of Health 2016b.
32 Children and Young People Living Well and Staying Well

Indicator 13: Gestational diabetesDescriptionThis indicator measures the percentage of births where the mother had gestational diabetes.
Gestational diabetes is a form of diabetes that is first detected in pregnancy and resolves following the birth of the baby. It occurs when a pregnant woman cannot produce enough insulin (a woman’s insulin needs are two to three times higher during pregnancy), causing the level of glucose in her blood to rise.
Gestational diabetes poses a number of risks to mothers and their babies. For the baby, it can cause prolonged newborn jaundice, low levels of calcium in the blood and respiratory distress syndrome (Diabetes New Zealand 2016). It can also cause babies to be very large at birth; babies who are too large at birth have a much higher risk of developing serious problems following their birth and are more likely to become obese later in life.
All women diagnosed with gestational diabetes should be offered treatment including specialised dietary and lifestyle advice (Ministry of Health 2014). There is good evidence to suggest that treatment improves maternal, fetal and neonatal outcomes.
Baseline performanceThe data for this indicator comes from the Ministry of Health’s National Minimum Data Set. It excludes women who had a stillborn baby and any women who gave birth outside of a hospital (in 2015/16, 94.2% of New Zealand women had their baby in hospital).
This report presents data from 2015/16, broken down by ethnic group and neighbourhood deprivation quintile.
Table 12: Number and percentage of births where the mother had gestational diabetes, 2015/16
Number of births Number of mothers with gestational
diabetes
Births where the mother had gestational
diabetes
Population group
Total 55,263 3,386 6.1%
Ethnic group
Māori 13,560 549 4.0%
Pacific peoples 5,855 538 9.2%
European 25,271 996 3.9%
Neighbourhood deprivation (NZDep2013) quintile
Quintile 1 (least deprived) 7,846 414 5.3%
Quintile 2 8,947 558 6.2%
Quintile 3 9,858 599 6.1%
Children and young people living well and staying well 33

Quintile 4 12,315 779 6.3%
Quintile 5 (most deprived) 16,093 1,026 6.4%
Source: National Minimum Data Set
Indicator 14: Raising Healthy Kids health targetDescriptionThe Raising Healthy Kids health target is one of six national health targets. It requires that 95 percent of obese children identified in the B4 School Check programme3 be offered a referral to a health professional for clinical assessment and family-based nutrition, activity and lifestyle intervention.
The aim of the health target is to: identify children who are obese early ensure that any clinical risks associated with children’s obesity are actively
managed encourage parents and caregivers to take action regularly monitor children’s growth and support them to achieve a healthy
weight.
For a child to be included in the results, their referral needs to be acknowledged by the service within 30 days of the referral being made. The referral must be made to a health professional that the Ministry of Health has deemed acceptable for the purposes of the health target, such as a: general practitioner practice nurse community dietician public health nurse multi-disciplinary team that includes a registered primary health care
professional.
The results also include children already under the care of a relevant service, and those whose parent/caregiver declined the referral.
Baseline performanceThe data for this indicator is extracted from the Ministry of Health’s B4 School Check database each quarter. The results cover all of the B4 School Checks completed in a six-month period. For example, the results for quarter one 2016/17 cover the period from 1 March 2016 to 31 August 2016 with referrals acknowledged by 30 September 2016.
3 The B4 School Check is the final core Well Child/Tamariki Ora check. It is a comprehensive needs assessment, screening and health education opportunity for children turning four and their parents/caregivers. Registered health professionals provide the free check through a range of community health services; the check includes hearing, eyesight, height, weight and oral health assessments, as well as comprehensive health and development questionnaires.
34 Children and Young People Living Well and Staying Well

This report presents data by ethnic group and neighbourhood deprivation quintile.
Table 13: Raising Healthy Kids health target performance, quarter one 2016/17
Number of B4 School
checks
Number of obese
children
Obesityrate
Number of obese children
referred
Referral rate
Population group
Total 29,376 2,408 8% 1,180 49%
Ethnic group
Māori 7,251 842 12% 415 49%
Pacific peoples 2,600 553 21% 271 49%
Other 19,525 1,013 5% 494 49%
Neighbourhood deprivation quintile (NZDep2013)
Quintile 1 (least deprived) 5,637 242 4% 119 49%
Quintile 2 5,473 277 5% 149 54%
Quintile 3 5,387 392 7% 192 49%
Quintile 4 5,440 493 9% 254 52%
Quintile 5 (most deprived) 7,338 1,001 14% 466 47%
Source: B4 School Check database
Children and young people living well and staying well 35
Indicator 15: Birth weightDescriptionThis indicator measures the percentage of babies whose birth weight (in kilograms) was extremely low, very low, low, normal or high. Birth weight is the first weight of the baby obtained after birth, preferably measured within the first hour of life before significant postnatal weight loss has occurred.
Low birth weight is associated with increased risk of foetal and neonatal mortality and morbidity, as well as inhibited growth and cognitive development (WHO and UNICEF 2004). Low birth weight can be caused by prematurity, multiple pregnancy, restricted fetal (intra-uterine) growth or environmental factors like the mother’s exposure to second-hand smoke. High birth weight can be caused by gestational diabetes, or excessive weight gain by the mother during pregnancy. It can also be caused by some congenital abnormalities or genetic disorders.
Researchers have identified that a baby born at either end of the two weight extremes – too small or too large for its gestational age – has an increased risk of obesity in later life; the exact cause of this is not known (Singhal et al 2003).
Baseline performanceThe five birth weight categories are defined as follows: Extremely low = birth weight lower than 1.0 kg Very low = birth weight between 1.0 and 1.4 kg Low = birth weight between 1.5 and 2.4 kg Normal = birth weight between 2.5 and 4.4 kg High = birth weight of 4.5 kg or more.
Some babies may have an extremely low, very low or low birth weight because they were born pre-term. Some babies may have a high birth weight because they were born after their due date.
The baseline data for this indicator comes from the Ministry of Health’s Report on Maternity for 2015. The Report on Maternity is an annual publication, which uses data from the National Maternity Collection.
36 Children and Young People Living Well and Staying Well

Table 14: Number and percentage of babies by birth weight category, 2015
Extremely low (n)
Very low(n)
Low(n)
Normal(n)
High(n)
Population group
Total 0.4%(210)
0.6%(353)
4.9%(2,795)
91.8%(51,856)
2.2%(1,251)
Ethnic group
Māori 0.4%(59)
0.7%(109)
5.6%(835)
91.1%(13,632)
2.2%(327)
Pacific peoples 0.4%(22)
0.6%(33)
4.0%(240)
90.9%(5,394)
4.1%(246)
Indian 0.7%(24)
0.7%(22)
8.1%(262)
90.1%(2,898)
0.3%(10)
Asian 0.4%(21)
0.5%(29)
5.0%(298)
93.6%(5,595)
0.6%(34)
European/Other 0.3%(84)
0.6%(160)
4.4%(1,160)
92.3%(24,315)
2.4%(634)
Neighbourhood deprivation quintile (NZDep2013)
Quintile 1 (least deprived) 0.3%(22)
0.5%(41)
4.2%(317)
92.8%(6,982)
2.1%(160)
Quintile 2 0.3%(23)
0.7%(62)
4.8%(414)
91.9%(7,937)
2.4%(204)
Quintile 3 0.4%(37)
0.7%(71)
5.1%(500)
91.6%(8,922)
2.1%(206)
Quintile 4 0.4%(53)
0.7%(83)
4.8%(596)
92.1%(11,402)
2.0%(252)
Quintile 5 (most deprived) 0.4%(71)
0.5%(90)
5.5%(898)
91.2%(15,010)
2.3%(385)
Source: Report on Maternity 2015
Children and young people living well and staying well 37

Baseline performance against the reducing childhood obesity indicatorsTable 15 summarises baseline performance against the complete set of reducing childhood obesity indicators. The table presents the results for the total New Zealand population and for the three key population groups – Māori, Pacific peoples, and people living in our most deprived (ie, quintile 5) neighbourhoods.
Table 15: Baseline performance against the reducing childhood obesity indicators
Indicator Measure Total Māori Pacificpeoples
High deprivation
More children are physically active
1 Time spent watching television, videos or screens
Percentage of children (aged 2–14 years) who usually watch two or more hours of television per day (2015/16)
44.8% 51.8% 47.4% 51.3%
2 Sleep duration Percentage of children (aged 5–13 years) who get 9–11 hours of sleep per day on average
First data available in early 2019
First data available in early 2019
First data available in early 2019
First data available in early 2019
3 Time spent on physical activity
Percentage of children (aged 5–17 years) who spent at least one hour per day being physically activity (for sport, physical education, exercise or fun) over the last week
First data available in early 2018
First data available in early 2018
First data available in early 2018
First data available in early 2018
More children eat well
4 Breastfeeding rates
Percentage of infants who are exclusively or fully breastfed at: two weeks 78% 76% 74% 75% six weeks 74% 68% 70% 69% three months(March 2016)
55% 43% 46% 46%
Percentage of infants who are still receiving breast milk at six months (March 2016)
66% 53% 62% 57%
5 Consumption of fast foods
Percentage of children (aged 2–14 years) who ate fast food at least once in the past week (2015/16)
69.4% 78.6% 81.7% 73.4%
38 Children and Young People Living Well and Staying Well
Indicator Measure Total Māori Pacificpeoples
High deprivation
6 Consumption of sugary drinks
Percentage of children (aged 2–14 years) who had fizzy drink three or more times in the past week
17.5% 23.1% 30.6% 30.2%
7 Fruit and vegetable intake
Percentage of children (aged 2–14 years) who eat at least two servings of fruit each day (2015/16)
73.6% 73.8% 70.4% 69.1%
Percentage of children (aged 2–14 years) who meet New Zealand’s age-specific vegetable intake guidelines (2015/16)
50.5% 46.9% 39.8% 42.7%
Children’s environments support physical activity and healthy living
8 Awareness of the Health Star Rating system
Percentage of grocery shoppers who recognise the Health Star Rating system when prompted (2015)
38% Māori with children
under 14: 36%
Pacific people with children
under 14: 65%
People of low income with
children under 14: 44%
Percentage of grocery shoppers who understand the Health Star Rating system (2015)
51% Māori with children
under 14: 56%
Pacific people with children
under 14: 31%
People of low income with
children under 14: 49%
Percentage of grocery shoppers who use the Health Star Rating system when shopping (2015)
10% Māori with children
under 14:6%
Pacific people with children
under 14: 25%
People of low income with
children under 14: 14%
9 Active transport to and from school
Percentage of children (aged 5–14 years) who usually use an active mode of transport, such as walking, biking or skating, to get to and from school (2015/16)
45.8% 45.0% 48.3% 47.5%
10 Use of a bicycle Percentage of children (aged 5–17 years) who have ridden a bicycle in the last week for sport, exercise or fun.
First data available in early 2018
First data available in early 2018
First data available in early 2018
First data available in early 2018
Average number of hours children (aged5–17 years) spent riding a bicycle in the last week for sport, exercise or fun
First data available in early 2018
First data available in early 2018
First data available in early 2018
First data available in early 2018
11 Water in schools This measure is still under development
Children and young people living well and staying well 39

Indicator Measure Total Māori Pacificpeoples
High deprivation
More children have improved outcomes
12 Body mass index levels
Percentage of children (aged 2–14 years) with a BMI that indicates they are: thin 4.3% 2.4% 1.8% 4.1% a healthy weight 63.9% 53.7% 37.2% 49.6% overweight (but not
obese)21.1% 29.1% 31.3% 26.4%
obese(2015/16)
10.7% 14.7% 29.8% 20.0%
13 Gestational diabetes
Percentage of births where the mother had gestational diabetes (2015/16)
6.1% 4.0% 9.2% 6.4%
14 Raising Healthy Kids health target
Percentage of obese children identified in the B4 School Check programme who were offered a referral to a health professional for clinical assessment and family-based nutrition, activity and lifestyle interventions (Q1 2016/17)
49% 49% 49% 47%
15 Birth weight Percentage of babies whose birth weight (in kilograms) was: extremely low 0.4% 0.4% 0.4% 0.4% very low 0.6% 0.7% 0.6% 0.5% low 4.9% 5.6% 4.0% 5.5% normal 91.8% 91.1% 90.9% 91.2% high(2014)
2.2% 2.2% 4.1% 2.3%
40 Children and Young People Living Well and Staying Well

ReferencesBartel KA, Gradisar M, Williamson P. 2015. Protective and risk factors for adolescent sleep: a meta-analytic review. Sleep Medicine Reviews 21: 72–85.
Cole TJ, Bellizzi MC, Flegal KM, et al. 2000. Establishing a standard definition for child overweight and obesity worldwide: international survey. British Medical Journal 320(7244): 1240.
Cole TJ, Flegal KM, Nicholls D, et al. 2007. Body mass index cut offs to define thinness in children and adolescents: international survey. British Medical Journal 335(7612): 194.
Cole TJ, Lobstein T. 2012. Extended international (IOTF) body mass index cut-offs for thinness, overweight and obesity. Pediatric Obesity 7(4): 284–94.
Colmar Brunton. 2016. Health Star Rating Monitoring and Evaluation. Wellington: Health Promotion Agency.
Cushman P. 2016. The Effects of Childhood Obesity on Learning, and the Role of the School Food Environment: A summary of the evidence. Prepared for the Heart Foundation of New Zealand. University of Canterbury 1–82.
Diabetes New Zealand. 2016. Gestational Diabetes. URL: www.diabetes.org.nz/about_diabetes/gestational_diabetes (accessed 7 April 2017).
Fatima Y, Doi SA, Mamun AA. 2015. Longitudinal impact of sleep on overweight and obesity in children and adolescents: a systematic review and bias-adjusted meta-analysis. Obesity Reviews 16(2): 137–49.
Harnack L, Stang J, Story M. 1999. Soft drink consumption among US children and adolescents: nutritional consequences. Journal of the American Dietetic Association 99(4): 436–41.
Horta BL, Loret de Mola C, Victora CG. 2015. Long-term consequences of breastfeeding on cholesterol, obesity, systolic blood pressure and type 2 diabetes: a systematic review and meta-analysis. Acta Paediatrica Suppl 104: 30–7.
Miller S, Connolly P, Maguire L. 2013. Wellbeing, academic buoyancy and educational achievement in primary school students. International Journal of Educational Research 62: 239–48.
Ministry of Health. 2012. Food and Nutrition Guidelines for Healthy Children and Young People (Aged 2–18 years): A background paper. Partial revision February 2015. Wellington: Ministry of Health.
Ministry of Health. 2014. Diabetes in Pregnancy: Quick reference guide for health professionals on the screening, diagnosis and treatment of gestational diabetes in New Zealand. Wellington: Ministry of Health.
Ministry of Health. 2015. Physical activity. URL: http://www.health.govt.nz/our-work/preventative-health-wellness/physical-activity (accessed 18 April 2017).
Children and young people living well and staying well 41

Ministry of Health. 2016a. Clinical Guidelines for Weight Management in New Zealand Children and Young People. Wellington: Ministry of Health.
Ministry of Health. 2016b. Methodology Report 2015/16: New Zealand Health Survey. Wellington: Ministry of Health.
Ministry of Health. 2016c. Indicators for the Well Child/Tamariki Ora Quality Improvement Framework: March 2016. Wellington: Ministry of Health.
Ministry of Health. 2016d. Annual Update of Key Results 2015/16: New Zealand Health Survey. Wellington: Ministry of Health.
Ministry of Transport. 2015. Cycling New Zealand Household Travel Survey 2011–2014: September 2015. Wellington: Ministry of Transport.
Mrdjenovic G, Levitsky DA. 2003. Nutritional and energetic consequences of sweetened drink consumption in 6- to 13-year old children. Journal of Paediatrics 142(6): 604–10.
Pizarro AN, Ribeiro JC, Marques EA, et al. 2013. Is walking to school associated with improved metabolic health? International Journal of Behavioral Nutrition and Physical Activity 10: 12.
Sarmiento OL, Lemoine P, Gonzalez SA, et al. 2015. Relationships between active school transport and adiposity indicators in school-age children from low-, middle- and high-income countries. International Journal of Obesity Supplements 5: S107–14.
Schmid SM, Hallschmid M, Schultes B. 2015. The metabolic burden of sleep loss. Lancet Diabetes and Endocrinology 3: 52–62.
Shochat T, Cohen-Zion M, Tzischinsky O. 2014. Functional consequences of inadequate sleep in adolescents: a systematic review. Sleep Medicine Reviews 18(1): 75–87.
Singhal A, Wells J, Cole TJ, et al. 2003. Programming of lean body mass: a link between birth weight, obesity, and cardiovascular disease? American Journal of Clinical Nutrition 77(3): 726–30.
Suhrcke M, de Paz Nieves, C. 2011. The impact of health and health behaviours on educational outcomes in high-income countries: a review of the evidence. Copenhagen: World Health Organization Regional Office for Europe.
Taylor R, Scragg R, Quigley R. 2005. Do sugary drinks contribute to obesity in children? A report prepared by the Scientific Committee of the Agencies for Nutrition Action. Wellington: Agencies for Nutrition Action.
Vartanian LR, Schwartz MB, Brownell KD. 2007. Effects of soft drink consumption on nutrition and health: a systematic review and meta-analysis. American Journal of Public Health 97(4): 667–75.
WHO. 2016. Report of the Commission on Ending Childhood Obesity. World Health Organization: Geneva, Switzerland.
WHO, UNICEF. 2004. Low Birthweight: Country, regional and global estimates. New York: United Nations Children’s Fund.
World Cancer Research Fund, American Institute for Cancer Research. 2007. Food, Nutrition, Physical Activity, and the Prevention of Cancer: A global perspective. Washington DC: World Cancer Research Fund, American Institute for Cancer Research.
42 Children and Young People Living Well and Staying Well