Embed Size (px)
Citation preview

Children 2020: Cost-Benefit Analysis
November 2011
Goodbody Economic Consultants Ballsbridge Park, Ballsbridge, Dublin 4
Tel: 353-1-6410482 Fax: 353-1-6682388 www.goodbody.ie/consultants/ e-mail – [email protected]

Table of Contents
Executive Summary ................................................................................................................................ 1
1. Introduction ..................................................................................................................................... 5
2. The Benefits of Quality Early Care and Education ......................................................................... 7
3. Effectiveness of Programmes ........................................................................................................ 14
4. The Economic Return of ECCE .................................................................................................... 17
5. Professionalising the Workforce and Extending Pre-School Provision ........................................ 23
6. Introducing Paid Parental Leave and Paid Paternity Leave .......................................................... 32
ANNEX: Costings of Proposals in Children 2020 ................................................................................ 37
Annex 1. Identifying Policy Recommendations for Costing ............................................................ 37
Annex 2. Professionalising the Workforce ....................................................................................... 38
Annex 3. Extending the Free Pre-School Year ................................................................................. 53
Annex 4. Extending Paid Parental Leave ......................................................................................... 60
Annex 5. Introducing Paid Paternity Leave ...................................................................................... 66
Annex 6. Developing Early Childhood Hubs ................................................................................... 68
Bibliography ......................................................................................................................................... 70

1
Executive Summary
1. Introduction
Start Strong‟s Children 2020 project is working to encourage the development of a national plan to
bring early care and education in Ireland up to the highest standards. The first phase of the project
culminated in Children 2020: Planning Now for the Future, a report published by Start Strong at the
end of 2010, which sets out a vision for children‟s early care and education in Ireland. The report also
set out a number of policy recommendations.
At any time, but especially when the public finances are in such difficulty, policy decisions are
informed by economic analysis. For this reason, it was essential that the overall project incorporated a
cost-benefit analysis of the policy recommendations made. Start Strong commissioned Goodbody
Economic Consultants to carry out this analysis on their behalf.
The policy recommendations made by Start Strong fall into two categories: immediate actions that
require little or no short-term expenditure; and recommendations for plans and commitments that the
Government should make for the future. This cost-benefit analysis focuses only on the
recommendations that could result in significant costs to the Government:
Professionalising the workforce as a means of raising the quality of provision.
Extending the Free Pre-School Year to a second year and more weeks per year.
Introducing paid parental leave to cover the first twelve months for every child.
Introducing two weeks‟ paid paternity leave.
The benefits of pre-school provision will be somewhat dependent on the quality of the workforce. The
benefits of extended pre-school provision are therefore considered in tandem with those relating to
professionalisation of the workforce.
2. The Benefits of Quality Early Care and Education
One of the biggest difficulties that arise when trying to identify the benefits of an early childhood care
and education (ECCE) programme is how to isolate the benefits that arose as a result of the
programme from the effects of these other influencing factors in a child‟s life. The most
comprehensive approach is to carry out a longitudinal study that measures the life outcomes of a
group of programme participants and compares them to those of a control group of individuals who
did not participate in any ECCE. Three programmes from the USA that have been evaluated in this
way are: the High/Scope Perry Pre-School Project in Michigan; the Abecedarian Early Intervention
Project in North Carolina; and the Chicago Child-Parent Centre Programme.
A particular focus was put on these projects because each had been subject to an appraisal that
attempted to provide a monetary valuation of the benefits arising to ECCE. Other projects, such as the
EPPE study in the UK, although providing valuable analysis and insights, have not as yet provided
monetary estimates of the returns to ECCE interventions.
The various benefits that are commonly identified and reported in evaluations of good quality ECCE
programmes tend to fall under the following headings:
Education. The obvious and most immediate educational benefit of a good quality ECCE is
the effect that it can have on a child‟s cognitive skills. Studies indicate that this benefit

2
persists into teenage years at least. Other commonly observed benefits are a reduction in the
need for remedial educational services and higher rates of school completion or graduation.
Improved Health and Social Wellbeing. Outcomes of ECCE recorded in the longitudinal
studies include a reduction in the number of cases of child neglect and maltreatment, lower
proportions of smokers and drug users, lower proportions of people reporting health
problems, and reduced incidences of teenage pregnancy.
Increased Earnings and Labour-force Participation. Some of the longer-term effects of
participation in a good quality ECCE programme relate to future employment opportunities
that improve, not only as a result of better education attainment, but also as a result of
improved non-cognitive skills that are often a determinant of socio-economic success. In the
shorter term, ECCE programmes also improve the employment opportunities of parents of
participants.
Reduced Welfare Dependency and Increased Exchequer Returns. Both the short and long-
term impacts on earnings and labour force participation also result in reduced dependency on
social welfare supports, having the potential to bring about significant public savings.
Another spill-over effect of ECCE relates to the increase in exchequer returns (taxes) that
arises from increased earnings, from parents in the short term and from programme
participants in the long term.
Reduced Crime Rates. Crime is another area that is reported to benefit from the long-term
impacts and spill-over effects of ECCE. The reduction in crime brings about public savings in
the form of lower criminal justice system costs. It also brings about other savings to society in
the form of material losses and pain and suffering avoided.
3. Effectiveness of Programmes
The short- and long-term effectiveness of any programme of childcare and early education is
dependent on a number of different variables including:
Early versus late intervention. Where the nature of programmes has allowed comparative
research to be carried out, it has been found that programmes of child care and education tend
to be more effective if they are delivered at an earlier age.
Duration of programme. Studies suggest that part-time attendance at pre-school for a longer
period of time might be more beneficial than full-time attendance over a shorter period.
Programme quality. The quality of an ECCE programme is a key determinant of its
effectiveness.
Parental involvement. The involvement of parents in an ECCE programme creates the
potential for the home environment to be impacted which in turn contributes to the longer
term effects.
Universal versus targeted. Many ECCE programmes have been specifically targeted at
children from disadvantaged backgrounds and as such they tend to have high success rates.
Universal provision has a large number of advantages, however: it overcomes the problem of
children falling in and out of eligibility over time, it removes the negative stigma associated
with targeted programmes, and it ensures that all eligible children are included.
4. The Economic Return of ECCE
As well as gauging the impacts of the various programmes of ECCE, the longitudinal studies referred
to in this report have also made estimates of the economic return that such programmes can offer by
putting monetary values on the benefits thereby enabling comparison with implementation costs.

3
While each of the analyses suggests a significant rate of return, the results vary not only by
programme but also according to the cost-benefit methodologies employed. Methodologically, the
more benefits that have monetary values assigned to them, the higher the rate of return will be.
It should be mentioned that where the bulk of programme costs are attributable from the very start of
a programme, the benefits take time to manifest while children progress through the education system
before entering adulthood with greater employment and earning potential. This means that a
significant proportion of the benefits included in a cost-benefit model have to be based on estimates of
the extent to which measured benefits continue into the future.
For illustrative purposes, the findings of two cost-benefit analyses are presented in detail:
The Chicago Child-Parent Centres Programme. The most recent analysis of this
programme was developed using life outcome data that was collected when the participants
were 26 years of age. The benefit-cost ratio is 11:1, suggesting a significant return on the
initial investment.
The Perry Pre-School Project. With follow-up data collected up to the age of 40,
significantly more data is available on the life outcomes of the Perry Pre-School Project
participants, enabling an even more detailed cost-benefit model. The benefit-cost ratio is 16:1,
and includes values for reduced pain and suffering as a result of reduced crime levels.
5. Professionalising the Workforce and Extending Pre-School Provision
In carrying out a cost-benefit analysis, we have drawn on the longitudinal research from the USA, but
there are difficulties in transferring the evidence to Ireland. In particular, by far the most substantial
benefits that have arisen relate to crime reduction and increased educational achievement. Putting firm
figures on the degree to which these benefits would arise in the Irish context would involve
assumptions that could be easily contested.
We have therefore adopted a cautious approach. In terms of costs, we have used high-cost scenarios.
In terms of benefits, we have made estimates that are at the low end of what is likely, and we have not
attempted to estimate the value of some potentially large benefits.
The Annex includes cost estimates for a number of different scenarios, in terms of both the
professionalisation of the workforce and the extension of pre-school provision. The cost-benefit
analysis presented here considers the most costly scenario in each instance as this is an indication of
the maximum costs that might be involved. The total costs of professionalising the workforce and
extending pre-school provision is therefore estimated at €624m or €8,905 per child.
Even just by taking the more tangible benefits into account – the reduction of childcare costs to
parents, reduced need for children to repeat a school year, and earnings benefits for children growing
up in consistent poverty – these costs are shown to be offset by some €178m in benefits. In our
calculations, we also make a conservative estimate that half the earnings benefit would accrue to an
additional 25 per cent of children from relatively disadvantaged backgrounds. This increases the total
benefits to €320 million. Evidence from the EPPE study in the UK suggests that children from all
social backgrounds benefit from ECCE provided it is of high quality, so if the workforce were
professionalised in the way proposed as a means of raising quality, the earnings benefit might extend
well beyond this figure.
Significant reductions in crime rates are a major source of benefits of ECCE that have been observed
in the studies in the USA. We have not attempted to estimate the benefits that would arise in Ireland,
but we do note that if just 1 per cent of the annual costs of Ireland‟s criminal justice system were

4
saved by the proposed ECCE interventions – a conservative estimate, given the scale of benefits from
ECCE seen in the USA – then the whole cost of the Children 2020 proposal would be covered by
savings in the criminal justice system alone.
We have not attempted to estimate the benefits arising from increased educational achievement.
Evidence from the USA suggests these benefits could also be substantial.
In conclusion, even with conservative assumptions about the transferability of research from the USA
to Ireland, it is reasonable to conclude that the Children 2020 proposals for professionalising the
workforce and extending pre-school provision would result in benefits that readily exceed the rate of
return required by the Department of Finance in project or programme evaluations. Less cautious
assumptions would result in estimates of benefits that far outweigh the costs, as has been noted in
other cost-benefits analyses of ECCE.
6. Introducing paid parental leave and paid paternity leave
Paid parental leave. With regard to the introduction of paid parental leave for the first twelve months
of a child‟s life, this recommendation would effectively see a doubling of the current provision of paid
leave. The cost estimates are based on the assumption that parental leave would be paid at the same
rate as currently applies to maternity benefit.
While there are some tangible benefits that can be associated with paid parental leave (childcare
savings and additional income for parents), the majority of benefits are intangible and as such cannot
have monetary values assigned to them. Although the tangible benefits of paid parental leave do not
quite match the costs in monetary terms, when they are combined with the intangible benefits that can
arise, there is a very strong argument for introducing paid parental leave on the scale being
recommended by Start Strong. There is a growing body of research on the benefits that extended
periods of paid parental leave can bring about for children, for parents and for society as a whole:
Child development benefits. A significant field of research has shown that extended periods
of paid parental leave that enable parents to care for their children full-time during the first
twelve months can impact on both the cognitive and non-cognitive development of a child,
although non-cognitive outcomes have been shown to be stronger than cognitive outcomes.
Health benefits. Mostly these benefits relate to increased health screening and immunisation,
as well as better nutrition.
Labour force benefits. There is a considerable body of research that indicates that better
parental leave arrangements promote parents‟ retention in the workforce.
Socio-economic benefits. Paid parental leave offers increased financial security to parents
and acts as an anti-poverty tool for children. Unpaid leave, on the other hand, does not help
low- or middle-income families, as they cannot afford to take it. In the EU, paid maternity and
parental leaves are seen to be necessary contributors to increasing women‟s employment,
facilitating work-family balance, and encouraging couples to have children, thereby
countering falling fertility rates which threaten future economic productivity.
Paid paternity leave. Paid paternity leave gives rise to minimal costs which can easily be rationalised
by the intangible benefits that can come about, particularly in relation to father-child bonding and
gender equality. If this comparatively inexpensive policy recommendation was to be implemented it
would also bring Ireland in line with a significant proportion of other EU member states.

5
1. Introduction
1.1 Background
Start Strong‟s Children 2020 project is working to encourage the development of a ten-year national
plan to bring early care and education in Ireland up to the highest standards.
The first phase of the project culminated in Children 2020: Planning Now for the Future, a report
published by Start Strong at the end of 2010, which sets out a vision for children‟s early care and
education in Ireland. The vision was developed based on the findings of an extensive work process
that included:
A review of the international research and literature on child development, on early childhood
education and care, and on policy effectiveness in services and supports for young children
and their families;
An analysis of national and international benchmarks and standards; and,
An extensive consultation process involving more than 200 individuals representing every
aspect of early care and education, including parents of young children, service providers,
academic researchers, Government officials, County Childcare Committees, professional
bodies, and NGOs, among others.
The report also set out a number of policy recommendations for Government that would help to make
this vision a reality by moving Ireland towards ensuring that quality early care and education
opportunities are available to all young children and families.
At any time, but especially when the public finances are in such difficulty, policy decisions are
informed by economic analysis. For this reason, it was essential that the overall project incorporated a
cost-benefit analysis of the policy recommendations made. Start Strong commissioned Goodbody
Economic Consultants to carry out this analysis on their behalf.
1.2 Identifying Policy Recommendations for Analysis
The policy recommendations made by Start Strong fall into two categories: immediate actions that
require little or no short-term expenditure; and recommendations for plans and commitments that the
Government should make for the future. Some of the recommendations relate to simple policy or
legislative changes, such as the amendment of the Childcare (Pre-School Services) Regulations to
require all early care and education services to have, or have access to, outdoor play areas. Other
recommendations relate to the use of existing resources in a slightly different manner as opposed to
the provision of entirely new resources. For these reasons, the cost estimates - which appear in the
Annex to this report – focus only on the recommendations that could result in significant costs to the
Government. These recommendations as they are set out in Children 2020: Planning Now for the
Future are as follows:
Achieve substantial progress towards a fully professional workforce in services for young
children, with ambitious targets for the proportion of staff qualified to third level, with plans
to ensure that all childminders have appropriate qualifications, and with plans to provide
relevant early years training to inspectors, to those in advisory roles and to staff in training
institutions.
Extend the entitlement to free provision that began with the Free Pre-School Year to a second,
earlier year, to at least 48 weeks of the year, and to at least 3.5 hours per day.

6
Incrementally introduce payment for parental leave so that paid leave is available for the
critical first twelve months for every child.
Introduce legislation to provide for at least two weeks‟ paid paternity leave for fathers.
Although each of these proposals will make their own contribution to a much higher quality of early
childhood care and education (ECCE) for children in Ireland, the benefits of pre-school provision will
be somewhat dependent on the quality of the workforce. The benefits of the proposal relating to
extended pre-school provision should therefore be considered in tandem with those relating to the
professionalisation of the workforce. In the same vein, it is also appropriate to consider the benefits
that might arise from the implementation of paid paternity leave in tandem with those for paid
parental leave.
1.3 Structure of this Report
Owing to the significant combined costs that would arise from the professionalisation of the
workforce, both in terms of training costs and incremental employment costs, as well as the extension
of the current Free Pre-School Year from one year to two, and from 38 weeks per year to 48, a key
requirement of this report is to define and describe the benefits that have been shown to arise from
existing programmes of ECCE. With this in mind, Sections 2, 3 and 4 draw on the literature to present
a synopsis of the findings of the various evaluation and cost-benefit studies that have been carried out
using data gathered by way of three internationally recognised longitudinal studies. Section 2 begins
by considering the short- and long-term benefits that have been variously attributed to programmes of
ECCE and Section 3 then goes on to highlight the specific characteristics of ECCE programmes that
are believed to contribute to their level of effectiveness. Section 4 examines the extent to which
monetary values may be put on benefits by drawing on two examples of cost-benefit analyses. Having
established the extent to which the various benefits have been shown to arise, Section 5 then considers
the cost estimates made for the implementation of Start Strong‟s policy recommendations with regard
to the professionalisation of the workforce and the extension of the Free Pre-School Year in the
context of these potential benefits. An estimate is made of the scale of benefits that would need to
arise from the implementation of these policies to at least off-set these costs.
The focus of the report then turns to the benefits that can arise from paid parental leave, with Section
6 taking account of the tangible benefits that can arise in terms of childcare savings. The much more
significant intangible benefits of both paid parental leave and paid paternity leave are also discussed.
The Annex presents in detail the estimated costs that might be associated with implementing the
various policies being examined.
A full bibliography is attached at the end of this report.

7
2. The Benefits of Quality Early Care and Education
2.1 Drawing on Longitudinal Studies
The provision of early childhood care and education (ECCE) is just one of a number of different
factors that can contribute to the social and psychological development of a child. The other key
factors relate to:
Family and the various aspects of family life including the emotional, educational,
financial and psychological wellbeing of the family as well as its ethnic background and
the neighbourhood in which it lives.
Other educational and developmental services and extracurricular activities
experienced by the child, including the quality of their primary and secondary education.
Genetics and the inherent abilities and emotional make-up that a child is born with.
As a child matures into adulthood, participation in third-level education as well as the training and
other opportunities offered by employers will also contribute to the development of that individual‟s
human capital.
One of the biggest difficulties that arises when trying to identify the benefits of an ECCE programme
is how to isolate the benefits that arose as a result of the programme from the effects of these other
influencing factors in a child‟s life. The most comprehensive approach is to carry out a longitudinal
study that measures the life outcomes of a group of programme participants and compares them to
those of a control group of individuals who did not participate in any ECCE. Despite its flaws, which
largely relate to the selection of the control group, this is the most effective approach.
Although ECCE programmes are becoming a more widely occurring phenomenon, the number of
longitudinal studies that have been carried out to measure their effect, and that have covered a
sufficient timeframe to date, is limited. Data in this regard have been collected in relation to a number
of ECCE programmes, particularly in the United States, and a number of analyses have been carried
out to calculate the value of the benefits comparative to the costs of implementing the programmes.
Three programmes that have been evaluated in this way are:
1. The High/Scope Perry Pre-School Project in Michigan;
2. The Abecedarian Early Intervention Project in North Carolina; and,
3. The Chicago Child-Parent Centre Programme.
A particular focus was put on these projects because each had been subject to an appraisal that
attempted to provide a monetary valuation of the benefits arising to ECCE. Other projects, such as the
EPPE study in the UK (see below), although providing valuable analysis and insights, have not as yet
provided monetary estimates of the returns to ECCE interventions. As the purpose of a cost-benefit
approach is to monetise benefits as far as is possible, emphasis was placed on projects that supported
such an approach.
The Perry Pre-School Project
This local pre-school educational project aimed at three- and four-year olds operated under the aegis
of the High/Scope programme of education in America between 1962 and 1967. The Perry Pre-School
Project, located in Michigan, was a two-year programme that targeted disadvantaged African-
American children. With a focus on the intellectual development of its participants, the programme

8
involved attendance by the children at the pre-school five mornings a week, and a weekly afternoon
home visit to each mother and child, the intention being to involve the mother in the education
process.
The evaluation process saw the collection of data on the educational and life outcomes of a sample of
123 children – 58 who had taken part in the project over five different waves between 1962 and 1967,
and a control group of 65. Data were collected annually from when the children were three years old
until they were eleven, and again when they were aged fourteen, fifteen, nineteen, twenty-seven and
forty, making this the most longitudinal study of the three.
The Abecedarian Early Intervention Project
The Abecedarian Early Intervention Project, located in North Carolina, was a five-year early
intervention programme involving 111 deprived children born between 1972 and 1977, with an
average starting-age of 4.4 months. The programme saw the delivery of high-quality childcare for
between six and eight hours a day, five days a week. Educational activities were play-based with an
emphasis on language and social development, and participants also received medical and nutritional
services. During the first three primary school years, a home-school teacher would meet with the
parents providing them with supplemental educational activities for home.
Of the 111 participants, 57 were given access to the programme for five years and the remaining 54
acted as a control group. The control group was provided with the same nutritional supplements,
social services, and health care as the main group, to ensure that these factors did not skew the
findings of the evaluation. Data were collected when the participants were aged three, four, five, six-
and-a-half, eight, twelve, fifteen and twenty-one years. The areas of focus for data collection included
cognitive functioning, academic skills, educational attainment, employment, parenthood and social
adjustment.
The Chicago Child-Parent Centre Programme
The Chicago Child-Parent Centre Programme has been in operation since 1967 providing educational
and family support services in local schools for low income children aged between three and nine
years. Each Child-Parent Centre has a staffed parent resource room and provides school-community
outreach activities and health services. On completion of pre-school and kindergarten, the school-age
programme in the elementary school provides reduced class sizes, teacher aides for each class, and
continued parent involvement activities. The emphasis of the programme is on basic language and
reading skills as well as social and psychological development.
The longitudinal evaluation study saw the collection of data on 1,539 children, all born in 1980. Of
this study group, 989 children attended Child-Parent Centre pre-schools and kindergartens between
1983 and 1986. The control group of 550 children had all enrolled in a kindergarten programme but
less than 25.0 per cent attended a pre-school. Data were collected on an ongoing basis by way of
school records, family and youth surveys, and court records, with the latest data collected when the
study group were 26 years old.

9
The Effective Provision of Pre-School Education Project (EPPE)
EPPE is a large study of the developmental trajectories of between 2,400 and 3,000 children in
England from age 3.1 The project set out to explain some of the reasons behind these different
developmental trajectories.
A developmental profile for each child including cognitive and language assessments (standardised
assessments), social and emotional assessments (carried out by key pre-school and school staff) and
self-reports completed by the children themselves. These longitudinal assessments have so far been
undertaken at ages 3, 5, 6, 7, 10, 11 and 14. Parental interviews and questionnaires to find out about
the child‟s history from birth and family demographic characteristics were used.
The benefits of pre-school education were found to persist to age 14. Both academic and
social/behavioural outcomes were evident. The quality of pre-schooling was found to have a profound
effect, with poor quality schooling showing little in the way of benefits. Disadvantaged children were
found to benefit particularly from good quality pre-schooling and if the childcare settings included
children from mixed social backgrounds, they fared even better.
2.2 Identifying the Benefits
The various benefits of good quality ECCE can be classified in a number of different ways. Some are
short-term, having a more immediate impact, and others are longer-term, only manifesting themselves
a number of years after an individual has completed a programme of ECCE. Benefits can also be
classified as being „direct‟, impacting on programme participants and their families, or as having a
„spill-over‟ effect, bringing about gains to the wider society.
There is also a cumulative effect in that the shorter term gains act as a foundation for the longer term
gains. To take an example of some of the short- and long-term direct impacts that can arise in this
way, increased levels of school readiness and achievement motivation in young children can lead to
increased levels of school achievement in older children, which in turn can result in higher levels of
educational attainment, and ultimately a higher earning potential for the individual as an adult.
The various benefits that are commonly identified and reported in evaluations of good quality ECCE
programmes tend to fall under the following headings:
Education;
Improved Health and Social Wellbeing;
Increased Earnings and Labour-force Participation;
Reduced Welfare Dependency and Increased Exchequer Returns; and,
Reduced Crime Rates.
It should be noted that there is an underlying assumption in the literature that any ECCE programme
that has the potential to give rise to these benefits is a „good quality‟ programme. The characteristics
that increase the effectiveness of a programme, including those that determine its quality, are
discussed in more detail in Section 3 below. Furthermore, the extent to which realistic monetary
values can be put on the various benefits identified below is examined in more detail in Section 4.
1 Sylva et al. Final Report from the Primary Phase: Pre School and Family Influences on Children‟s
Development During Key Stage 2. Research Report no.2, 2008

10
2.3 Education
The obvious and most immediate educational benefit of a good quality ECCE is the effect that it can
have on a child‟s cognitive skills. Studies indicate that this benefit persists into teenage years at least
(see the EPPE project, for example).
Another common benefit of ECCE is a reduction in the need for remedial educational services for
children who attend pre-schools. The Abecedarian Project recorded a 47 per cent reduction in the
placement of children in such services and the Chicago Child-Parent Centres recorded a reduction of
41 per cent.2 It has also been found that participants in programmes of ECCE are also less likely to
need to repeat a school year – just 23.0 per cent of participants in the Chicago Child-Parent Centres
project had to repeat a year compared to 38.4 per cent of their control group counterparts, which is an
overall reduction of 40 per cent.
ECCE programme participants also tend to have higher rates of school completion or graduation. The
Perry Pre-School Project saw 71 per cent of its participants graduating from high-school, compared to
54 per cent of the control group. Similar findings were recorded for the Abecedarian Project (67 per
cent compared to 51 per cent) and the Chicago Child-Parent Centres (65 per cent compared to 54 per
cent). The Perry Pre-School Project also recorded that its participants completed on average almost
one full year of schooling more than members of its control group – 11.9 years compared to 11 years.
In terms of further education, the Abecedarian project recorded a higher participation rate in third
level education with 36 per cent of those who had attended pre-school ultimately enrolling in college
compared to 13 per cent of the control group.
The Abecedarian project also found that where mothers of programme participants were under 18
years old, they themselves were more likely to graduate from school than their control group
counterparts.
2.4 Improved Health & Social Benefits
One recorded outcome of the Chicago Child-Parent Centres project was a reduction in the number of
cases of child neglect and maltreatment – the occurrence rate of such incidences was 5 per cent in the
main group compared to 10 per cent in the control group. Over the longer term, the Perry Pre-School
Project recorded lower proportions of smokers and soft-drug users in the programme group than in the
control group at age 40. Furthermore, lower proportions of the programme group reported having a
health problem (20 per cent compared to 29 per cent) or of having to stop work for health reasons (43
per cent compared to 55 per cent). These kinds of differences in health status may result in a lower
need for social welfare support, which is a benefit for society generally, but they could also mean real
differences in the quality of life for the individuals concerned.
Good quality programmes of ECCE also bring about certain social benefits. Both the Perry Pre-
School project and the Abecedarian project recorded reduced incidences of teenage pregnancy. The
Perry Pre-School project recorded 1.2 teenage pregnancies per control group female compared to 0.6
teenage pregnancies per programme participant, which is a reduction of 50 per cent. The Abecedarian
project noted a reduction of 42 per cent with 26 per cent of pre-schoolers going on to become teenage
2 Just 25 per cent of participants in the Abecedarian Project required special education compared to 47 per cent
of the control group. For the Chicago Parent-Child Centres project 14.4 per cent of participants required special
education compared to 24.6 per cent of the control group.

11
parents compared to 45 per cent of the control group. The Perry Pre-School project made a number of
additional observations in this regard: the proportion of births that were out of wedlock was lower
among programme participants than the control group (57 per cent compared to 83 per cent); and the
proportion of fathers that went on to raise their own children was higher (57 per cent compared to 30
per cent). The implication of this is a reduced need for welfare assistance for lone parents and teenage
parents. Although not limited to this particular cohort of welfare recipients, the Perry Pre-School
project did find that while 59 per cent of programme participants had been in receipt of Government
assistance by the age of 27, this compared to 80 per cent of the control group.
2.5 Increased Earnings & Labour Force Participation
Some of the longer-term effects of participation in a good quality ECCE programme relate to future
employment opportunities that improve, not only as a result of better education attainment, but also as
a result of improved non-cognitive skills that are often a determinant of socio-economic success.
The Abecedarian project found that almost half (47 per cent) of its pre-school participants were
employed in high skill jobs by the age of 21, compared to 27 per cent of control group members.
Collecting data over a longer period, the Perry Pre-School Project found that 70 per cent of its
participants were in employment at the age of 40, compared to 50 per cent of its control group
members.
This in turn gives rise to better earning potential. The Perry Pre-School project also found that 29 per
cent of its participants had monthly earnings in excess of $2,000 at the age of 27 compared to just 7
per cent of the control group. The difference was even starker when the monthly earnings of male
participants only were compared, with 42 per cent earning in excess of $2,000 per month compared to
a mere 6 per cent of the control group. Furthermore, the median monthly income of project
participants at 40 years of age was found to be $1,856 for pre-school attendees, 42 per cent more than
the $1,308 recorded for the control group.
Such increases in the net earnings potential of participants obviously enable a better quality of life.
Data collected by the Perry Pre-School project indicate that by the age of 27 years, 36 per cent of
participants owned their own homes compared to just 13 per cent of the control group. The proportion
of those that owned a second car was also significantly higher – 30 per cent compared to 13 per cent.
It should also be noted that, in the shorter term, ECCE programmes also improve the employment
opportunities of parents of participants who are provided with alternative care for their children,
enabling them to maximise their participation in the labour-force.
At first glance, increased labour-force participation, improved employment opportunities, and higher
earning potential seem to be direct impacts that are only of benefit to programme participants and
their families. However, these impacts also result in a reduced dependency on social welfare supports,
having the potential to bring about significant public savings in this regard. The additional exchequer
returns that they also bring about are discussed further in Section 2.7 below.
2.6 Crime Reduction
Crime is another area that is reported to benefit from the long-term impacts and spill-over effects of
ECCE. The Perry Pre-School project for example found that programme participants had a lower
arrest rate for violent crimes than their control group counterparts (32 per cent at the age of 40
compared to 48 per cent). Programme participants were also less likely to have served time in prison
than members of the control group (28 per cent compared to 52 per cent).

12
The Chicago Child-Parent Centres project also saw a reduction in crime with 9.0 per cent of
programme participants having been arrested for a violent crime by the age of 20 compared to 15.3
per cent of the control group. The rate of juvenile arrest for the programme group was also found to
be 33 per cent lower than that for the control group. This reduction in crime brings about public
savings in the form of lower criminal justice system costs. It also brings about other savings to society
in the form of material losses and pain and suffering avoided.
2.7 Exchequer Returns
Another spill-over effect of ECCE relates to the increase in exchequer returns that arises from
increased earnings. In the shorter term, there is a potential tax gain from parents of programme
participants who might be unable to participate in the labour force in the absence of the day care that
such a programme provides for their children.
In the longer term there are the increased exchequer returns that arise from a higher rate of labour
force participation by ECCE programme participants as adults. The tax gain from programme
participants is further enhanced by their potential to earn higher salaries than they might have done.
2.8 Summary
Table 2.1 below summarises each of the various benefits identified according to their area of benefit,
and whether they are a direct benefit or the result of a spill-over effect.

13
Table 2.1: Summary of the Benefits of good quality ECCE
Area of
Benefit
Direct Benefits
(to participants and their families)
Spill-Over Effects
(gains to society)
Education Increase in cognitive skills, increasing
school readiness
Reduced expenditure on remedial
educational services
Increase in achievement motivation &
school participation
Reduced expenditure on „repeat years‟
of school services
Higher levels of educational attainment
Higher levels of educational attainment
for young mothers of programme
participants
Health Education for parents on the benefits of
health services and good nutrition
Reduced dependency on welfare
Reduced public health costs
Fewer cases of neglect and
maltreatment
Fewer incidences of teenage pregnancy
Employment Enables parents to participate in
labour-force while child is in day care
Reduced welfare
Increased labour-force participation in
adulthood
Increased exchequer returns
Increased earnings capacity in
adulthood
Crime Reduced criminal justice system costs
Reduced tangible expenditures to
potential victims of crime
Reduced pain and suffering for
potential victims of crime

14
3. Effectiveness of Programmes
3.1 Introduction
The short- and long-term effectiveness of any programme of childcare and education is dependent on
a number of different variables including:
the age at which the child participates;
the duration of the programme;
the quality of the programme;
whether the programme is universal or targeted at a specific cohort of the child population;
and,
the extent to which parents are involved.
3.2 Early versus Late Intervention
Where the nature of programmes has allowed comparative research to be carried out, it has been
found that programmes of child care and education tend to be more effective if they are delivered at
an earlier age.
The Chicago Child-Parent Centres research for example, indicated that where pre-school participation
was associated with nearly all child outcomes up to age 20, school-age participation was associated
with fewer child and youth outcomes. Pre-school participants had greater cognitive skills at
kindergarten entry, higher levels of school achievement, less of a need for special educational
services, lower rates of delinquency and juvenile arrest, and higher rates of school completion. By
comparison, while school-age participants also had higher levels of school achievement and a reduced
need for special educational services, there was no notable difference in the rates of juvenile arrest
recorded or levels of school completion.
Similarly, the Abecedarian Project found that participation in the five-year programme which
included pre-school attendance was positively associated with higher cognitive ability and school
achievement as well a reduced need to repeat a year or receive special educational supports. This
compared with participation in the three-year programme, which did not include pre-school, and
which was found only to have the limited effect of higher reading achievement at the age of fifteen.
The EPPE study in the UK 3 also found that children who start pre-school at a younger age (between 2
and 3 years) experience a cognitive boost, which remains evident up to the end of primary school.
Earlier intervention programmes are also more likely to involve parents meaning that there is also
potential for the family environment to be impacted which might in turn contribute to the longer term
effects. The involvement of parents is discussed further in Section 3.5 below.
3.3 Duration of Programme
3 The Effective Provision of Pre-School Education (EPPE) Project: Final Report from the Primary Phase,
Kathy Sylva, Edward Melhuish, Pam Sammons, Iram Siraj-Blatchford & Brenda Taggart (Department for
Education & Skills, 2008).

15
The EPPE study in the UK also found that the duration of pre-school was strongly linked to the
progress of the children involved: “The duration of attendance is important with every month of pre-
school experience after age 2 years linked to better intellectual development and improved
independence, concentration and sociability”.4 Of particular interest is the finding that although a
longer period of months of preschool experience was associated with better gains, there was no
evidence that full-time provision resulted in better outcomes than part-time provision. This suggests
therefore that part-time attendance at pre-school for a longer period of time might be more beneficial
than full-time attendance over a shorter period.
The findings of the Perry Pre-school Project, which provided classes for two-and-a-half hours each
morning, five days a week, suggest that children get more benefit from two school years of pre-school
than from one, although the benefits gained in the second year are smaller than those gained in the
first.
3.4 Programme Quality
The quality of an ECCE programme is a key determinant of its effectiveness. Quality in this instance
is usually defined by the various characteristics of a programme both in terms of its structural
dimensions and its delivery.
The structural dimensions of good quality ECCE include characteristics such as high staff-child ratios,
smaller group sizes, well-qualified staff, good management structures, and a safe physical
environment. These are the characteristics that tend to be of most interest to policy-makers as these
are the characteristics that can be monitored and regulated.
However, there are other aspects of good quality ECCE that relate to its delivery and the pedagogical
methods employed. Such programme characteristics are not as easily monitored but make a
significant difference to the overall quality of the programme delivered. These include the level and
warmth of adult-child interaction, the successful integration of care and education, and the extent to
which the pedagogical approach taken actively involves the child in the learning process.
3.5 Parental Involvement
As already mentioned in Section 3.2 above, the involvement of parents in an ECCE programme
creates the potential for the home environment to be impacted which in turn contributes to the longer
term effects. The home learning environment in early childhood impacts on children‟s intellectual and
social development. The EPPE study in the UK has found that “what parents do is more important
than who they are”, and that parent support and parent education can therefore impact on the home
learning environment.
The five-year programme of the Chicago Child-Parent Centres project included parental attendance in
the centres, resulting in a higher level of parental involvement, whereas the three-year programme,
delivered at school age, did not have the same level of involvement. The research found that
participation in the five-year programme resulted in significantly lower levels of child maltreatment,
whereas participation in the three-year programme did not bring about any notable change in this
regard.
4 Idem, p.2.

16
The Perry Pre-School project involved parents in the educational process by way of a weekly ninety
minute home visit by the teacher thereby promoting long-term improvements in the home
environment that would carry over to the child long after the programme ended. The project also
recorded an improvement in the parents‟ education and labour force activity which in themselves are
motivating factors for a child‟s successful development.
3.6 Universal versus Targeted
Many ECCE programmes have been specifically targeted at children from disadvantaged
backgrounds. As such they tend to have particularly high success rates, having been shown to
effectively promote learning and the associated longer-term benefits and life chances.
It has been argued that a more universal provision of quality ECCE is desirable, in part to enable
greater female participation in the labour force. The universal approach does have a large number of
advantages over the targeted approach. In the first instance, changes in a child‟s home environment
may result in them falling in and out of eligibility over time. In addition to this, targeted programmes
may have a negative stigma attached which could impact on participation rates. Eligibility criteria
may be confusing, which would also impact on participation rates, or could be inefficient, meaning
that children who would genuinely benefit from a programme could be excluded. A universal
approach would also mean that the additional administrative costs associated with determining
eligibility for a targeted programme are avoided.
However, because female labour force participation is correlated with education, more educated
parents may make more use of a universally available programme of ECCE than those from
disadvantaged backgrounds. Thus, the children of more educated parents, who already have greater
advantage in their development, would also live in families with higher disposable income, as well as
benefiting developmentally from the ECCE. As such, the inequality of opportunities that already
exists for children of different backgrounds could be widened where ECCE is made available on a
universal basis.5 This possibility is dependent on the extent to which universally available
programmes are taken up. If there is comprehensive take-up, then disadvantaged children will have
the same participation rate as children from advantaged backgrounds and on average will have more
to gain than their more advantaged counterparts.
An alternative approach is to have a universal but compulsory programme of ECCE from which
parents can not opt out, meaning that all children benefit from the direct effects of ECCE. With UK
research6 indicating that disadvantaged children do better in settings with a mixture of children from
different social backgrounds, this kind of approach would also enable a better social mix. Such an
approach could incorporate targeted measures, such as familial or other supports, to ensure that the
potential benefits of ECCE are optimised for disadvantaged participants.
5 The Economics of Early Childhood Care and Education, Dr. Arnaud Chevalier, Ms. Claire Finn, Prof. Colm
Harmon & Dr. Tarja Viitnen (National Economic and Social Forum, 2006). 6 The Effective Provision of Pre-School Education (EPPE) Project: Final Report, Kathy Sylva, Edward
Melhuish, Pam Sammons, Iram Siraj-Blatchford & Brenda Taggart (Department for Education & Skills, 2004).

17
4. The Economic Return of ECCE
4.1 Introduction
As well as gauging the impacts and benefits of the various programmes of ECCE, the longitudinal
studies referred to in this Report have also made estimates of the economic return that such
programmes can offer by putting monetary values on the benefits thereby enabling comparisons to be
drawn with implementation costs.
While each of the analyses suggests a significant rate of return, the results vary not only by
programme but also according to the cost-benefit methodologies employed. Methodologically, the
more benefits that have monetary values assigned to them, the higher the rate of return will be. The
actual monetary values assigned to each benefit will obviously have an impact as well.
It should be mentioned that where the bulk of programme costs are attributable from the very start of
a programme, the benefits take time to manifest while children progress through the education system
before entering adulthood with greater employment and earning potential. This means that a
significant proportion of the benefits included in a cost-benefit model have to be based on estimates of
the extent to which measured benefits continue into the future.
For illustrative purposes, the findings of two cost-benefit analyses are presented below: one of the
Chicago Child-Parent Centres Programme and one of the Perry Pre-School Project. Where available,
additional detail is given to illustrate how such cost-benefit analyses tend to be applied in practice.
4.2 Chicago Child-Parent Centres Programme7
The most recent analysis of this Programme analysis was developed using life outcome data that was
collected when the participants were 26 years of age. It begins by identifying the programme costs per
participant: the total annual costs of implementing a project were calculated and then divided by the
number of programme participants for that year to derive an annual cost per participant. Because
participation in this particular programme exceeded a year, this annual cost per child was adjusted to
reflect the cost per participant for the full duration of the programme.
The costs, thus estimated, were put at $8,512 in 2007 prices.
Having calculated an average programme cost per child, the analysis goes on to estimate benefit
values on a “per participant” basis, thereby enabling comparisons to be drawn. Two sets of values
were developed – one relating to the measured effects of the programme and the other relating to the
projected effects. The measured effects relate to the different life outcomes recorded for programme
participants when compared to their control group counterparts. It should be noted that the measured
effects data used in this analysis were collected when the participants were aged 26. The measured
effects include savings associated with a reduced need for special education services, or savings
associated with reduced rates of juvenile crime and delinquency, depression and substance abuse. The
projected effects then relate to the extent to which the measured effects might continue into the future
and include estimates of increased earnings and the resultant higher tax take. Because the anticipated
increase in tax receipts has been recorded as a separate benefit and given a monetary value as such,
the associated increase in earnings for the individual were adjusted accordingly to avoid double-
7 Age 26 Cost-Benefit Analysis of the Child-Parent Center Early Education Program (A. J. Reynolds et al.)

18
counting. Projected effects also include estimates of savings associated with reduced rates of adult
crime that are derived from the measured reduction in juvenile crime.
This cost-benefit analysis also separates the values according to whether they benefit the individual
participant or the wider society, with the result that the benefits to society far outweigh the benefits to
the programme participants.
Table 4.1 below sets out the various programme benefits identified and the values assigned to each
one. In this instance the benefits, both measured and projected, include victim savings brought about
by reduced child abuse/neglect and reduced crime rates. It should be noted that these victim savings
relate to tangible victim costs saved and as such do not take account of the reduced pain and suffering.
Table 4.1: Estimated Benefits of the Chicago Child-Parent Centre Pre-School
Programme per Participant (2007 prices, discounted at 3%)
Benefit and Cost Categories
Value $
Education
Earnings
Tax contributions
Juvenile crime
Adult crime
Child abuse
Child care
College expenditures
Adult depression
Substance misuse
Total
6,197
22,445
6,399
24,241
18,222
7,330
4,387
(294)
494
2,800
92,220
Source: Age 26 Cost-Benefit Analysis of the Child-Parent Center Early Education Program
When the total benefits listed in Table 4.1 are compared to the total costs, the benefit-cost ratio is
10.8:1, suggesting a significant return on the initial investment. If the benefits were to include values
for reduced pain and suffering, this rate of return would be higher again. Furthermore, although the
measured effects listed do include the benefit of the childcare itself to the parents of participants, they
do not take account of the increased earnings for parents and resultant tax gain that this benefit might
also bring about. Nor do they include the longer term benefits that might accrue for the offspring of
programme participants as a result of their parents‟ higher educational attainment and associated
economic well-being.

19
4.3 Perry Pre-School Project8
This cost-benefit analysis of the High/Scope Perry Pre-School Project includes a significant level of
detail, particularly in relation to the calculation of benefit values. The cost per participant of the Perry
Pre-School Project was calculated to be $15,166 in discounted 2000 prices. This comprised operating
costs (instructional staff salaries, administrative and support staff salaries, overheads, supplies and
developmental screening) and capital costs (classroom and facilities). The costing data was derived
from actual school district budgets as well as the programme administration unit records.
With follow-up data collected from participants at the age of 27 and again at the age of 40,
significantly more data is available on the life outcomes of the Perry Pre-School Project participants
enabling an even more detailed cost-benefit model. Thus, there are two sets of measured effects: one
up to the age of 27 years; and another from the age of 28 years to 40 years. The projected effects are
those anticipated thereafter, between the ages of 41 years and 65 years. For added clarity, the various
measurable benefits are collated for each area of impact:
Childcare;
Education;
Increased earnings;
Tax gain;
Reduced crime; and,
Reduced welfare dependency.
Childcare and Education
The monetary value of the childcare that the Perry Pre-School project provided while participants
were in pre-school was estimated to be worth $906 to their parents.
The values assigned to the educational benefits were derived by comparing the level and extent of
educational services provided to participants against those provided to members of the control group.
Essentially the benefits comprise the savings that came about as a result of the reduced need for
special educational services and the reduced incidence of the children needing to repeat a school year.
These savings were then adjusted to reflect the comparatively low but additional costs that arose as a
result of participants staying in the education system for longer and availing of adult education
courses. This cost-benefit analysis assumed that participants would not go on to avail of any further
education after the age of 40.
Increased Earnings and Tax Gain
The values assigned to the increase in earnings and associated tax gains are derived using self-
reported data. The data collected was used to calculate lifetime economic differences between
participants and their control group counterparts.
The data collected at age 27 and again at age 40 were used to calculate differences over the two
periods, „up to age 27‟ and „ages 28 to 40‟. These data were then adjusted to reflect the lack of
stability in some participants‟ careers as well as their sometimes intermittent levels of employment
8 The High/Scope Perry Preschool Program: Cost-Benefit Analysis using data from the Age-40 Follow-Up (C.
R. Belfield et al.)

20
over the periods concerned. The analysis then used these data sets to extrapolate future earnings data
for the period when the participants are between the ages of 41 and 65.
A proportion of these increased earnings are attributable as a benefit to the general public in the form
of income and employment taxes. This cost-benefit model applied an income tax rate of 15 per cent,
which was the U.S. marginal income tax rate for a married couple with taxable income in the
corresponding years. Additional calculations were also made to take account of the FICA
(employment tax), payable by both employers and employees.
Reduced Crime
The values estimated to reflect the beneficial effects of the reduction in crime rates took account of a
number of different factors: criminal justice system costs for policing, arrest, and sentencing;
incarceration and probation costs; and, victims‟ costs. Both tangible and intangible victims‟ costs
were estimated to take account of medical expenses, property replacement and reduced productivity,
as well as pain and suffering. The values of the savings that arise as a result of reduced criminal
activity vary according to the severity of the criminal activity. The analysis therefore estimated
separate costs for eleven different categories of crime ranging in severity from a violent assault felony
to a driving misdemeanour.
The criminal incidence data relating to the participants was then compared to that for the control
group. The data were adjusted to take account of three key factors:
1. Firstly, there was a recorded difference in murder rates between the programme group and the
control group. Because murder imposes such high victim costs, there was the chance that it
would dominate the overall results. To avoid this and also because of some data limitations,
murder was included in the criminal category of „violent assault‟.
2. Secondly, because there are many more crimes than arrests, the arrest data was factored up
using data from the Bureau of Justice Statistics and the FBI to ensure that the model gave a
better reflection of actual crime levels.
3. Thirdly, in extrapolating criminal behaviours beyond the age of 40, the model took account of
other pieces of research that indicate that arrest rates decline with age.
The resultant crime incidence data was then multiplied out by the average costs per crime for each
category, to derive an estimate of the total savings made.
Reduced Welfare Dependency
Again, this analysis used comparative data on the programme participants and the control group to
derive estimates of the number and value of payments made to each group over the two timeframes,
„up to age 27‟ and „ages 28 to 40‟, and to extrapolate data for when participants are aged between 41
and 65 years. These data on incidence and values were then used to estimate total welfare funding.
Essentially this translated into a reduction in benefits to programme participants but a gain to the
general public in terms of welfare payments saved.
The savings to the general public must be also be adjusted to reflect the costs usually involved in
administering welfare payments. Using Michigan state data, this particular analysis assumed these
costs to be 29.7 per cent of total disbursements made. An average rate of 6.4 per cent was then applied
on top of this to allow for over-payments and payments to ineligible families. In this model, all of this
amounts to a cost to the general public of 38 cents for every dollar of welfare disbursed.

21
Overall Findings
Table 4.2 below sets out the findings of the analysis described above. Benefits are presented both
according to the category in which they fall and according to the underlying beneficiary, be it the
programme participant or the general public. When combined, the total benefit-cost ratio of the Perry
Pre-School Project is estimated to be 16:1, giving a very significant return.
Table 4.2: Lifetime Cost-Benefit Analysis of the Perry Pre-School Project
Benefits/Costs Attributed to
Participants ($)
Attributed to
General Public ($) Total ($)
Childcare 906 - 906
Education:
K-12 education - 8,343 8,343
Up to age 27 - (719) (719)
Ages 28-40 (160) (412) (572)
Ages 41-65 - - -
Total Education (160) 7,212 7,052
Earnings:
Up to age 27 15,855 4,611 20,466
Ages 28-40 24,146 7,022 31,168
Ages 41-65 10,447 2,445 12,892
Total Earnings 50,448 14,078 64,526
Crime:
Up to age 27 - 93,285 93,285
Ages 28-40 - 61,477 61,477
Ages 41-65 - 16,711 16,711
Total Crime - 171,473 171,473
Welfare:
Up to age 27 (2,793) 3,854 1,061
Ages 28-40 810 (1,117) (307)
Ages 41-65 (22) 31 9
Total Welfare (2,005) 2,768 763
Total Benefits 49,189 195,531 244,720
Total Costs - 15,166 15,166
Benefit : Cost Ratio 13:1 16:1
Source: The High/Scope Perry Preschool Program: Cost-Benefit Analysis using data from the Age-40
Follow-Up
Note: Data are presented in 2000 prices using a discount rate of 3 per cent.

22
The greatest proportion of the benefits included relate to savings brought about as a result of reduced
crime rates. It should be mentioned that a high proportion of these savings are intangible, relating as
they do to reduced victim costs in terms of pain and suffering avoided. As noted above, these savings
were not included in the analysis of the Chicago Child-Parent Centre Programme described above,
which gave rise to a benefit-cost ratio of just under 11:1.
The authors of the Perry Pre-School Project cost-benefit analysis highlight the fact that their model
does not take account of some immeasurable but none the less notable benefits. These benefits relate
to improved health status which may result in better quality of lives and lower mortality rates; and the
intergenerational effects of the project that have not yet been determined.
4.4 Differences Arising
Both of these examples took a similar approach to developing cost-benefit analyses of the ECCE
programmes concerned in that they used data on recorded outcomes both to determine the values of
recorded impacts and to extrapolate the values of future impacts. Although both analyses indicated
significant rates of return, the benefit-cost ratio for the Perry Pre-School Project was significantly
higher than that for the Chicago Parent-Child Centres Programme (16:1 compared to 11:1).
While the Perry Pre-School Project analysis had the advantage of a data set that spanned a longer
timeframe, this is not the most significant element in this difference in the findings. The values
assigned to the benefits associated with reduced criminality are significantly higher in the Perry Pre-
School Project analysis, accounting as they do for 70 per cent of all benefits. Conversely, the values
assigned to those benefits associated with lower crime rates account for just 46 per cent of all
monetised benefits in the Chicago Child-Parent Centres Programme analysis. The reason for this is
that the Chicago Child-Parent Centres Programme analysis only includes tangible victim costs such as
medical costs or material costs, whereas the Perry Pre-School Project analysis includes intangible
victim costs associated with pain and suffering.
This is a clear indication of the extent to which the methodology employed can impact on the findings
of a cost-benefit analysis, and the consideration that must be given to both the tangible and intangible
benefits when developing the framework for a cost-benefit model.

23
5. Professionalising the Workforce and Extending Pre-School Provision
5.1 Introduction
This section of the report considers the likely costs and benefits that would arise if two of Start
Strong‟s policy recommendations were to be implemented. These recommendations as they are set
out in Children 2020 are:
Achieve substantial progress towards a fully professional workforce in services for young
children, with ambitious targets for the proportion of staff qualified to third level, with plans
to ensure that all childminders have appropriate qualifications, and with plans to provide
relevant early years training to inspectors, to those in advisory roles and to staff in training
institutions.
Extend the entitlement to free provision that began with the Free Pre-School Year to a second,
earlier year, to at least 48 weeks of the year, and to at least 3.5 hours per day.
Cost-benefit analyses are a tool widely used to promote proposed policy changes or new social
programmes that require Government investment. Not only do they provide clarity on the costs
involved and initial outlays required, but they also quantify the benefits that are expected to arise in
the short- and longer-terms. Essentially, they are intended to identify the economic efficiency of those
benefits.
Where programmes or policy changes are proposed for more ideological or qualitative reasons, it can
appear relatively narrow minded to focus on the economic returns alone. However, it is now
commonplace for the concepts of „transparency‟ and „value for money‟ to form the foundations of
funding and policy decisions at most levels, and cost-benefit analyses are the perfect instrument for
demonstrating the extent to which a new programme or policy can fulfil such requirements.
Where a programme of ECCE is proposed, a cost-benefit model that incorporates the wide range of
benefits that have been identified in the multiple longitudinal studies can be an effective way of
demonstrating the potential return on the investment required. However, in developing such a model,
a number of underlying assumptions need to be made in terms of the values that should be assigned to
the anticipated benefits, to ensure that a solid, dependable set of results are achieved. As already
illustrated in Section 4.4 above, the extent of the assumptions that are made can have a significant
impact on the outcome of the overall analysis. With this in mind, it was decided to take a more
cautious approach that would identify the minimum total benefit required to break even with the
estimated costs involved, and then to consider this overall level of benefit in the context of those
tangible benefits that can be assigned monetary values.
5.2 Summarising the Costs Involved
The Annex to this report sets out estimates of the costs that would arise if Start Strong‟s proposals
were to be implemented. For the purposes of the cost-benefit analysis, it was necessary to use these
total cost estimates to derive an estimated cost per participant. While the Annex includes cost
estimates for a number of different scenarios, both in terms of the professionalisation of the workforce
and the extension of pre-school provision, the cost-benefit analysis presented here considers the most
costly scenario in each instance as this is an indication of the maximum costs that might be involved.
In relation to the professionalisation of the workforce, the assumption is that 33.3 per cent of staff
would be required to have a degree qualification, 33.3 per cent qualified to FETAC 6 and 33.3 per

24
cent qualified to FETAC 5.9 These requirements would give rise to one-off training and education
costs to bring the existing workforce up to this level, as well as increased annual employment costs
for more highly qualified staff. As set out in section A2.2 in the Annex, the maximum total one-off
training and education costs for personnel working in group-based ECCE settings10
were estimated to
be in the region of €71.6 million.
The maximum incremental employment costs that would arise under the same scenario have been
estimated to be in the region of €270 million per annum.
In relation to the extension of pre-school provision, the assumption is that the current provision of 3
hours per day for 38 weeks over one year would be increased to 3.5 hours per day for 48 weeks per
year, for two years. Based on the proposed professional level of the staff delivering the service, it is
also assumed that the maximum pre-school capitation fee currently payable under the Free Pre-School
Year scheme would be payable for every child.11
Under this scenario the average total annual costs
associated with extending pre-school provision in this way are estimated to be in the region of €520
million per year based on an annual throughput of some 70,000 children. When current programme
cost levels at this level of throughput are taken into account (€180m), this suggests average
incremental costs of €340 million per year over the same period or €4,857 per child per annum.
Table 5.1 below summarises each of these incremental cost estimates as costs per child. As the table
indicates, the professionalisation of the workforce combined with the extension of the free pre-school
year, both in terms of day-to-day provision and overall duration, would give rise to maximum
incremental implementation costs of €624m or €8,905 per child.12
9 These are the assumptions embedded in Scenario 3 in our estimates of costs (see section A2.2) in relation to
the qualification levels that might be required if the ECCE workforce were to become more professionalised. 10
Group-based ECCE settings include crèches, playgroups, pre-schools, and Montessori schools. 11
In the majority of instances the current weekly capitation fee is €64.50 per child but this rises to €75 per child
in pre-schools with higher qualified staff – where all pre-school leaders are qualified to FETAC Level 7 and all
pre-school assistants are qualified to FETAC Level 5. 12
The lower figure cited in Appendix 3 (€408.6m incremental cost per annum) is the cost that would arise for
the Exchequer given the current capitation fee structure on the assumption that professionalising the workforce
would cause a higher capitation fee to be paid, whereas the larger figure (€624 m) is the full cost that would be
borne by society (which would involve either some of the higher salary costs being borne by employers, or
alternatively a still higher capitation fee to reflect the higher cost for employers of employing an increased
proportion of graduates.

25
Table 5.1: Estimated Incremental Costs
Overall
Incremental
Cost (€m)
Incremental
Cost per
Child
(€)
Type of Cost
Professionalisation of the workforce
One-off training and education costs
14
201
Incremental employment costs 270 3,847
Pre-School Provision
Additional costs for increased provision
over longer period of time
340 4,857
Total Costs 624 8,905
Source: Goodbody Economic Consultants; Note assumes that one-off training costs recur every five
years.
5.3 Estimating the Minimum Benefit Required
The findings of the longitudinal studies carried out in the USA all indicate that the benefits of ECCE
accrue over long periods of time. In practice, these benefits arise in a lumpy fashion becoming more
substantial as time progresses. In the shorter term, for example, they might arise in the form of
childcare cost savings for parents or public savings as a result of a reduced need for special education
assistance. But in the longer term they have been shown to translate into increased earnings for
participants, giving rise to increased exchequer gains, as well as public savings brought about by
reduced criminality. However, to gain an overall perspective of what the average benefits would need
to be, the consultants have assumed that they would arise in a constant annual fashion.
Drawing on the recorded evidence of the longitudinal studies from the USA, it is assumed that
benefits would continue to accrue for 60 years – from the completion of pre-school right through to
retirement age. The question is: how large would these annual benefits have to be to offset the costs?
One way of estimating this is to make the simplifying assumption that the annual benefits are constant
over the 60 years. The question then reduces to a calculation of the size of the annual benefit amount
that when discounted back to present values and summed equals the incremental cost of childcare of
€8,905 per child.
This is in fact the opposite of a common problem in finance which is to estimate the annuity that
would arise from the investment of a lump sum. With this in mind, the approach taken by the

26
consultants was to use an annuities calculation to derive the scale of benefits required to offset the
initial costs of implementation.13
The interest rate used in the calculation is effectively an Internal
Rate of Return (IRR). This is the discount rate which, when applied to the net benefits of a
programme that accrue over time, sets them equal to the initial investment. In this instance, an IRR of
4 per cent was used, as this is the rate commonly required by the Department of Finance for project or
programme evaluations.
Based on this approach, it is estimated that annual benefits in the order of €394 would need to arise
for each child over a sixty year period in order for the costs to be covered.
5.4 Taking Account of the Irish Context
As indicated in Section 2 above, the benefits of ECCE tend to arise in a number of different areas over
the course of an individual‟s life. However, the extent to which these benefits will arise for each
individual will depend a lot on their underlying familial, social and economic circumstances.
The findings of the American research relate to programmes that specifically target disadvantaged
children whereas pre-school provision for 3-4 year olds in Ireland is universal. With this in mind, a
child that is deemed to be „disadvantaged‟ will likely experience a much higher degree of benefit than
a child that is not, owing to the fact that non-disadvantaged children already have a certain level of
advantage and might attend private pre-schools in the absence of universal, free provision.
The most recent EU Survey on Income and Living Conditions (EU-SILC) indicates that in 2009, 8.7
per cent of all children in Ireland were living in consistent poverty. A further 18.6 per cent were at
risk of poverty, meaning that their family‟s income was less than 60 per cent of the national median
income.14
It should also be noted that the level of impact that the benefits of ECCE might have on disadvantaged
children may not be the same in Ireland as it has been shown to be in America. This is owing to the
fact that there are welfare benefits in Ireland that do not exist in America that might ameliorate some
of the disadvantage for Irish children.
5.5 Considering the Potential Benefits
5.5.1 Introduction
As already discussed, the areas of benefit that are most commonly associated with good quality ECCE
are as follows:
Childcare;
Education;
Earnings;
Taxes on Earnings;
Reduced Welfare; and
Reduced Crime Rate.
13
The calculation used was Pv = B((1-(1/(1+r)^n))/r) where Pv = Present Value of Annuities; B = Benefit; n =
time; r = Internal Rate of Return. 14
Source: Survey on Income and Living Conditions 2009, CSO.

27
It is relatively straight forward to assign approximate monetary values for the first four of these
benefit areas, but a lot more complex to put even approximate values on the welfare or criminal
justice system savings that might arise. Extensive assumptions would need to be made, particularly in
relation to criminal savings, which could distract from the overall findings of the report.
Thus, those benefits that can be considered more readily in a monetary context are discussed in
Section 5.5.2, with other less tangible benefits discussed more qualitatively in Section 5.5.3.
5.5.2 Direct and Tangible Benefits
As already described in Section 5.3 above, average annual benefits in the order of €394 would need to
arise for each child over a sixty year period for this proposed programme of investment to break even.
Childcare The childcare element of ECCE in terms of free pre-school provision would be an immediate
benefit to the parents of all participants, as it would replace the need for private childcare if
the parents are already working, or provide them with the opportunity to take up employment
or other activities if they are not.
To put a minimum monetary value on this benefit, a simple calculation is made that takes the
number of hours that a child would attend the programme each year, and multiplies it by the
national average hourly cost for crèche or Montessori services as recorded by the CSO. The
most recent data, collected in 2007, indicate that this is in the region of €4.80 for pre-school
children.15
However, there is evidence that rates have declined as the lower rate of €4.3
available under the Pre-School scheme impacts on the market. For the purposes of this
exercise, it is assumed that this lower rate applies. Overall, approximately 38 per cent of pre-
school children are in paid childcare. The proportion in paid childcare at earlier ages is likely
to be lower and a figure of 30 per cent or approximately 21,000 children is assumed. The
parents of these children will not have to pay for childcare for the period for which their child
is engaged in the pre-school scheme i.e. 17.5 hours per week. Based on these figures, it is
estimated that there will be an offsetting cost saving to parents of some €76m as a result of
the scheme. This in turn reduces the annual benefits in respect of each child that would have
to arise from other sources to €346 from €394.
Education The educational benefits that ECCE can bring about are four-fold:
Reduced need to repeat a school year;
Reduced need for special education assistance;
Increased educational attainment; and,
Increased college attendance.
Estimates of monetary values may be made for the first two of these benefits as they result in
exchequer savings for the Government where a child does not need to repeat a school year or
avail of special education supports as a result of their participation in ECCE.
15
Source: Quarterly National Household Survey – Special Module on Childcare. CSO, July 2009.

28
The annual cost of primary education per child is estimated to be in the region of €6,550,
based on the Department of Education Statistical Report for 2007/2008.16
The equivalent cost
for secondary education is in the region of €9,300 per child.
The value of this kind of benefit increases again when the educational impact of ECCE results
in a reduced need for special education assistance. It is estimated that the annual costs
associated with providing a child in ordinary school with special education supports lie
somewhere between €8,900 and €12,800. This estimate is derived by taking the annual costs
per child associated with the provision of primary and secondary education and grossing them
up by 38 per cent to reflect the higher cost levels of special education.17
Again, this is not a
benefit that would accrue for many pre-school participants but in instances where it might, it
is far in excess of the minimum annual benefit required of €394.
Taking a conservative view that only 2.5 per cent of children would require a repeat year and
assuming a cost of €8,000 on average, a total cost of €11m can be estimated in present value
terms. This is the benefit that would accrue from this source.
Earnings and Taxes on Earnings Another significant benefit of ECCE relates to the increase in lifetime earnings of programme
participants. The evidence from the American studies suggests that children from
disadvantaged backgrounds could achieve an increase in their gross earnings up to age 65 in
the order of €52,500.18
This figure was based on the finding that the median monthly income
of 40-year-olds who had participated in the Perry Pre-School Programme was 42 per cent
higher than that of the control group. The increased educational attainment that tends to arise
as a result of ECCE participation is a significant factor in these increased earnings. The CSO
collects data on average hourly wages by level of education attained across all age groups.
The most recent data suggest that the average hourly wage for people with a Leaving
Certificate or higher qualification is 43.2 per cent higher than that for people with just a
primary or lower secondary education. For people with a post-Leaving Certificate or higher
qualification the average hourly wage is 40.6 per cent higher than those with a Leaving
Certificate or lower.19
These differentials mirror the findings of the Perry Pre-School Project.
If these additional earnings benefits were to accrue to the 8 per cent of children who are most
at risk of consistent poverty, the estimated additional income for this group amounts to some
€91m when discounted to present values. If an additional 25 per cent of children were to
benefit at half the rate of the most disadvantaged, then the additional income arising would
increase to €233m. This alone represents some 45 per cent of the costs of this initiative.
While the vast bulk of increased earnings will accrue as a benefit to the individual, a
proportion will accrue to the exchequer in the form of increased income tax receipts. Data
published by the Revenue Commissioner allow a calculation of the average rate of tax paid by
employees in Ireland each year, taking account of tax allowances and credits. The most recent
16
The most recent Department of Education Statistical Report relates to 2008/2009 but does not contain the data
required for making this calculation. 17
The scaling up factor reflects the additional costs of education in disadvantaged schools, based on Department
of Education figures. 18
This is the 2010 Euro equivalent of the finding published in The High/Scope Perry Preschool Program: Cost-
Benefit Analysis using data from Age 40 Follow-Up, Clive R. Belfield, Milagros Nores, Steve Barnett, and
Lawrence J. Schweinhart (2007). 19
National Employment Survey, CSO (2007).
29
data available relate to 2006, but an analysis of the data over a five-year period between 2002
and 2006 indicate that the rate does not change significantly from one year to the next. The
average rate over that period as a whole was 15.1 per cent. This suggests that increased
lifetime earnings of €52,500 would accrue to the individual as a net income benefit of
€44,570, with the remaining €7,930 accruing as a tax benefit to the exchequer.
5.5.3 Indirect and Intangible Benefits
As already mentioned, there are a number of additional benefits that cannot have monetary values
assigned to them without making far-reaching assumptions, and there are others that simply cannot
have any value assigned to them at all.
Reduced Welfare A reduced reliance on social welfare payments by ECCE participants when they are adults as
a result of increased employment opportunities is a widely documented benefit of ECCE.
There is also a potential for the parents of ECCE participants to have a reduced need for
welfare support. The practical childcare benefit that ECCE offers, for example, could provide
those parents that might be unemployed with the opportunity to join the labour force, meaning
that they could have a reduced dependency on welfare for the duration of their child‟s
participation. If, for example, a lone parent is unable to work because she or he cannot afford
childcare, (s)he may be in receipt of benefit under the One Parent Family Payment scheme,
which might also be supplemented by the Family Income Supplement. If free childcare
becomes available by way of the Free Pre-School Year, (s)he may take the opportunity to
apply for paid employment, particularly if the pre-school provision is extended as Start Strong
propose. This would reduce reliance on these benefits, both of which are means tested.
However, it is recognised by many that exchequer savings in the form of reduced welfare
payments would be offset in a cost-benefit analysis by an equivalent loss in income for the
individuals concerned. Although there might be a small overall gain to the exchequer in terms
of the administrative costs saved by not having to process the welfare payments, in Ireland
these administrative costs tend to amount to just over 3 per cent of actual welfare payments
made and as such the monetary value of this element of the benefit would be negligible.
Reduced Crime Rate Another benefit that should be taken into account relates to the juvenile crime rate, which has
been recorded to be 20 per cent lower for disadvantaged ECCE participants compared to their
non-participating peers. This benefit gives rise to both exchequer savings in the form of
reduced costs to the criminal justice system, as well as victim savings.
To put a value on the potential for cost savings in the criminal justice system would involve a
detailed analysis of data from the various juvenile crime statistics and associated financial
information as published by An Garda Síochána, the Irish Courts Service, the Irish Youth
Justice Service, and the Department of Education.
Victim savings relate to both tangible and intangible victim costs. Tangible costs might
include the replacement of material goods or property, medical costs and lost earnings.
Intangible costs then relate to the pain and suffering avoided. Cost-benefit analyses that have
put values on these benefits do tend to demonstrate particularly high rates of return, as
illustrated in Section 4 above.

30
While it is not possible to put a definitive figure on all of these costs, it is clear that very
substantial costs do arise. The State incurred current costs of €2.1 billion in 2010 in the
provision of justice and policing. If just 1 per cent of these annual costs were saved by the
proposed ECCE interventions, then the whole cost of the interventions would be covered by
savings in the cost of the criminal justice system.
Other Benefits A number of other intangible benefits have been shown to arise that should also be mentioned
despite the fact that they cannot be monetised.
A child from a disadvantaged background may experience improvements in their home
environment as their parents are given the opportunity to work or train as a result of having
free childcare at their disposal.
As education is directly correlated to earnings, provision of ECCE can bring about improved
social equity, particularly for disadvantaged children.
The enhanced non-cognitive skills that children have been noted to develop as participants of
ECCE may also contribute to their interaction both in society generally and in the workplace
as adults, enhancing their ability to achieve.
Over the longer term, the national accumulation of human capital as more individuals benefit
from ECCE can only contribute to the economic growth of a country. It also improves the
ability of a country to develop, implement and adapt new technologies.
Furthermore, the development of a knowledge-based, high-skilled economy in this way can
only be of benefit to the international competitiveness of the country.
5.5.4 Summary
In carrying out a cost-benefit analysis, we have drawn on longitudinal research from the USA, but
there are difficulties in transferring the evidence to Ireland. In particular, by far the most substantial
benefits that have arisen in the USA relate to crime reduction and increased educational achievement.
Putting firm figures on the degree to which these benefits would arise in the Irish context would
involve assumptions that could be easily contested.
We have therefore adopted a cautious approach. In terms of costs, we have used high-cost scenarios.
In terms of benefits, we have made estimates that are at the low end of what is likely, and we have not
attempted to estimate the value of some potentially large benefits.
The Annex includes cost estimates for a number of different scenarios, in terms of both the
professionalisation of the workforce and the extension of pre-school provision. The cost-benefit
analysis presented here considers the most costly scenario in each instance as this is an indication of
the maximum costs that might be involved. The total costs of professionalising the workforce and
extending pre-school provision is therefore estimated at €624m or €8,905 per child.
Even just by taking the more tangible benefits into account - the reduction of childcare costs to
parents, reduced need for children to repeat a school year, and earnings benefits for children growing
up in consistent poverty - these costs are shown to be offset by some €178m in benefits. In our
calculations, we also make a conservative estimate that half the earnings benefit would accrue to an

31
additional 25 per cent of children from relatively disadvantaged backgrounds. This increases the total
benefits to €320 million. Evidence from the EPPE study in the UK suggests that children from all
social backgrounds benefit from ECCE provided it is of high quality, so if the workforce were
professionalised in the way proposed as a means of raising quality, the earnings benefit might extend
well beyond this figure.
Significant reductions in crime rates are a major source of benefits of ECCE that have been observed
in the studies in the USA. We have not attempted to estimate the benefits that would arise in Ireland,
but we do note that if just 1 per cent of the annual costs of Ireland‟s criminal justice system were
saved by the proposed ECCE interventions – a conservative estimate, given the scale of benefits from
ECCE seen in the USA – then the whole cost of the Children 2020 proposal would be covered by
savings in the criminal justice system alone.
We have not attempted to estimate the benefits arising from increased educational achievement.
Evidence from the USA suggests these benefits could also be substantial.
In conclusion, even with conservative assumptions about the transferability of research from the USA
to Ireland, it is reasonable to conclude that the Children 2020 proposals for professionalising the
workforce and extending pre-school provision would result in benefits that readily exceed the rate of
return required by the Department of Finance in project or programme evaluations. Less cautious
assumptions would result in estimates of benefits that far outweigh the costs, as has been noted in
other cost-benefit analyses of ECCE.
.

32
6. Introducing Paid Parental Leave and Paid Paternity Leave
6.1 Introduction
This section of the report considers the likely costs and benefits that would arise if Start Strong‟s
policy recommendations regarding paid parental leave and paid paternity were to be implemented.
These recommendations as they are set out in Children 2020 are:
Incrementally introduce payment for parental leave so that paid leave is available for the
critical first twelve months for every child.
Introduce legislation to provide for at least two weeks paid paternity leave for fathers.
6.2 Summarising the Costs Involved
Estimations of the annual costs that would be involved if both of these recommendations were to be
implemented are explained in Annex 4 and Annex 5.
Paid Parental Leave With regard to the introduction of paid parental leave for the first twelve months of a child‟s life, paid
maternity leave is already in place for the first six months, so this recommendation would effectively
see a doubling of the current provision of paid leave. The cost estimates are based on the assumption
that parental leave would be paid at the same rate as currently applies to maternity benefit. The rate
payable for maternity benefit is currently calculated according to an individual‟s average weekly
earnings with minimum and maximum cut-off rates. However, the current average weekly payment is
close to the maximum cut-off rate of €262 per week so by assuming that this would be the weekly rate
payable to all parents availing of paid leave, a set of maximum cost estimates were made. These
estimates suggest that the total average costs associated with implementing a scheme of paid parental
leave for the first twelve months of a child‟s life would be in the region of €628.5 million per annum
over the period to 2020, which is effectively an average increase of €314.3 million per annum on the
existing maternity leave scheme. This translates into a maximum cost per parent (mother or father or a
combination of both) of €13,624 per annum, or a maximum increase of €6,812 on the existing
provision for paid maternity leave.
Paid Paternity Leave With regard to the introduction of two weeks paid paternity leave for fathers on the birth of their
children, the costs involved would be considerably lower given that the leave would only span two
weeks. Once again the assumption is made that paternity leave would be paid at the same rate as
currently applies to maternity leave, and by using the maximum weekly threshold of €262, a set of
maximum cost estimates was derived. These estimates suggest that the total average costs associated
with a scheme of paid paternity leave would be in the region of €33.4 million per annum over the
period to 2020. This translates into a cost per father of €524.
6.3 Considering the Potential Benefits
While there are some tangible benefits that can be associated with paid parental leave, the majority of
benefits are intangible and as such cannot have monetary values assigned to them. The benefits
associated with paid paternity leave are all intangible.

33
6.3.1 Tangible Benefits of Paid Parental Leave
The tangible benefits that arise from paid parental leave are those immediate benefits that manifest
themselves in the form of childcare savings as well as the additional income that such a scheme would
provide for parents who might otherwise avail of unpaid leave.
As already mentioned the current provision for paid parental leave in Ireland applies to mothers only
and is for a period of 26 weeks. Mothers are also currently entitled to take additional unpaid leave of
up to 16 weeks, which enables them to postpone the need for paid childcare if they so wish. The
extent to which unpaid leave is currently taken up will have an impact on the overall level of benefit,
both in terms of childcare savings and in terms of the additional income that it would provide for
some.
In the absence of a reliable data source regarding the extent to which the current unpaid leave
entitlement is availed of, three scenarios have been developed whereby it is assumed that 50 per cent
of mothers do not currently avail of any unpaid leave, 25 per cent avail of half of their entitlement (8
weeks) and the remaining 25 per cent avail of their full entitlement (16 weeks). These scenarios are
presented in Table 6.1 below.
Table 6.1: Summary of Scenarios and Assumptions made
Scenario
Assumed
Take-Up
Rate
(%)
Unpaid Leave
Taken
(weeks)
Childcare
Requirements
during First
Year (weeks)
1: Mothers do not avail of any unpaid leave 50.0 0 26
2: Mothers avail of half of unpaid leave (8 wks) 25.0 8 18
3: Mothers avail of all unpaid leave (16 wks) 25.0 16 10
Source: Goodbody Economic Consultants
By using CSO data on the types of childcare used (both paid and unpaid), the proportions of children
in each, and the average costs associated with each, it is estimated that the overall average weekly cost
of childcare is roughly €86 per child. This suggests total childcare costs of €2,244 under the first
Scenario, €1,554 under the second and €863 under the third. These benefit levels then need to be
adjusted to reflect the additional income that paid leave would provide for families who might
otherwise avail of unpaid leave. Because the total costs of the scheme relate to the payment of
benefits to parents, the advantage that this payment would bring about in terms of increased income
should also be taken into account. The resulting total tangible benefits that would arise under each
Scenario on the introduction of an additional 26 weeks‟ paid parental leave are summarised in Table
6.2 below.

34
Table 6.2: Summary of Tangible Benefits
Tangible Benefits Scenario 1
(€)
Scenario 2
(€)
Scenario 3
(€)
Childcare Costs per Child (saved) 2,244 1,554 863
Income for parents not otherwise earned - 2,096 4,192
Total Tangible Benefits per parent 2,244 3,650 5,055
Total Costs per parent 6,812 6,812 6,812
Benefit-Cost Ratio 0.33 0.54 0.74
Source: Goodbody Economic Consultants
It has already been shown that the cost of implementing such a scheme would be in the region of
€6,812 per parent. Table 6.2 above also compares the benefits under each scenario to these costs. The
greatest economic return is achieved under Scenario 3, where childcare cost savings are minimal but
the additional income that the scheme would bring about for parents who would otherwise avail of
unpaid leave gives an overall benefit-cost ratio of 0.74:1.
However, there are a number of additional benefits that simply cannot have monetary values assigned
to them. The intangible benefits of both paid parental leave and paid paternity leave are discussed in
Sections 6.3.2 and 6.3.3 respectively.
6.3.2 Intangible Benefits of Paid Parental Leave
There is a growing body of research on the benefits that extended periods of paid parental leave can
bring about for children, for parents and for society as a whole. These benefits largely relate to child
development, health, and socio-economic well-being.
Child Development Benefits A significant field of research has shown that extended periods of paid parental leave that
enable parents to care for their children full-time during the first twelve months can impact on
both the cognitive and non-cognitive development of a child, although non-cognitive
outcomes have been shown to be stronger than cognitive outcomes. It has been suggested that
this is because infants have the chance to develop more sensitive and responsive relationships
with their parents and/or because the quality of care that they receive at home is better than
they would have received in non-parental child care.20
These findings are further supported by a detailed analysis of Child-Mother data collected for
the American National Longitudinal Survey of Youth in 1996, which found that children
scored better both in tests of cognitive development and tests designed to measure self-esteem
20
Maternity Leave, Early Maternal Employment and Child Health and Development in the US, Berger et al.
(2005) referenced in Benefits of Maternity/Parental Leave in the EU27: A Review of the Literature, Davaki,
Konstantina (London School of Economics and Political Science, 2010).

35
and scholastic competence, in situations where they were cared for on a full-time basis by
their mothers for the first year. Longer periods of full-time parental care were not found to
have any further impact on cognitive development in particular.21
Following an extension of paid parental leave in Canada from six months to one year in
2000/2001, research was carried out on the impact that this extended provision had on the
health and development of children.22
The findings of this analysis also suggest that full-time
care by a parent during the first twelve months has notable effects on the developmental and
care environment of infants, bringing about significant reductions in the age at which certain
developmental milestones are achieved.
Health Benefits A small number of health benefits have also been found to arise for children who are cared for
on a full-time basis by their parents for the first twelve months. Mostly these benefits relate to
increased health screening and immunisation, as well as better nutrition. Where parental leave
is taken by mothers, it has also been shown to bring about benefits in the form of reduced
physical health problems that might otherwise be brought about by stress and fatigue, as well
as mental health benefits. Research has shown that mental health issues in particular are most
likely to arise for working mothers during their transition from leave back into the labour
market owing to the multiple roles that they take on both in work and at home.23
Extended
periods of paid parental leave not only give women a choice in how much leave they take but
also offer the alternative opportunity for fathers to take on a greater role at home as primary
carer.
Labour Force Benefits There is a considerable body of research that indicates that better parental leave arrangements
promote attraction to the workforce. For example, using data from the European Community
Household Panel, Pronzato selected women who had a child in the years of the survey and
who had worked before, and followed them over time. Results suggest that the right to long
and paid leave gives mothers the opportunity to remain at home with the child at a lower cost,
and that lengthy statutory leaves are associated with being more likely to be at work in the
period following the leave.24
Socio-Economic Benefits Another area of benefit that arises from extended periods of paid parental leave relates to the
socio-economic well-being of families. Paid parental leave offers increased financial security
to parents and acts as an anti-poverty tool for children. Unpaid leave, on the other hand, does
not help low- or middle-income families, as they cannot afford to take it. In the EU, paid
maternity and parental leaves are seen to be necessary contributors to strategies aimed at
increasing women‟s employment, facilitating work-family balance, and encouraging couples
21
Early Parental Time Investments in Children‟s Human Capital Development: Effects of Time in the First Year
on Cognitive and non-Cognitive Outcomes, Neidell, M. J. (2000). 22
The Early Development and Health Benefits of Maternity Leave Mandates, Baker, M. & Milligan, K. (2006). 23
Maternity Leave, Role Quality, Work Involvement and Mental Health One Year after Delivery, Klein, M. H.
et al. referenced in Benefits of Maternity/Parental Leave in the EU27: A Review of the Literature, Davaki,
Konstantina (London School of Economics and Political Science, 2010). 24
Pronzato, Chiara (November 2007) „Return to Work after Childbirth: does Parental Leave Matter in Europe?‟
ISER Working Paper 2007-xx. Colchester: University of Essex.

36
to have children, thereby countering falling fertility rates which threaten future economic
productivity.25
6.3.3 Intangible Benefits of Paid Paternity Leave
Owing to the fact that paternity leave schemes tend to be short in duration, the benefits and lasting
impacts that they bring about are on a much lower scale than those resulting from longer parental
leave schemes. However, the costs associated with paid paternity leave are also significantly lower so
the benefits that do arise, however small, are of relevance here.
A right to paternity leave already exists in the majority of EU Member States but the duration and
level of compensation provided for varies from one state to another. Over a third of member states
give an entitlement of ten days leave, and almost half of all member states provide some form of
compensation for the leave. The benefits that have been shown to arise relate to gender equality (both
at home and work), child development, and parental health. Essentially, paid paternity leave is seen to
increase gender equality at work, particularly where full pay is given. However, the impact that it can
have on gender equality in the home is considered to be somewhat limited in comparison. Perhaps
more importantly, paternity leave has been found to enable early bonding between fathers and their
children which is assumed to increase child welfare. It has also been suggested that paid paternity
leave can have positive effects on parental health through a short-term reduction in stress for both
parents.26
One piece of research goes on to suggest that employers increasingly realise that when fathers take
leave they build more skills and have greater potential as workers, especially at the managerial level,
as they become more adept at handling stress, engaging in multiple tasks and responsibilities, and
developing personal abilities.27
6.3.4 Summary
Although the tangible benefits of paid parental leave do not quite match the costs in monetary terms,
when they are combined with the intangible benefits that can arise, there is a very strong argument for
introducing paid parental leave on the scale being recommended by Start Strong.
Paid paternity leave gives rise to minimal costs which can easily be rationalised by the intangible
benefits that can come about, particularly in relation to father-child bonding and gender equality. If
this comparatively inexpensive policy recommendation was to be implemented it would also bring
Ireland in line with a significant proportion of other EU member states.
25
Parental Leave and Gender Equality: lessons from the European Union, Haas, L. (2003) referenced in
Benefits of Maternity/Parental Leave in the EU27: A Review of the Literature, Davaki, Konstantina (London
School of Economics and Political Science, 2010). 26
Fully Paid Paternity Leave of Two Weeks: Impact Assessment, Thomsen, H. & Urth, H. (2010). 27
Haas, L. (2003) idem.

37
ANNEX: Costings of Proposals in Children 2020
Annex 1. Identifying Policy Recommendations for Costing
The policy recommendations made by Start Strong fall into two categories: immediate actions that
require little or no short-term expenditure; and recommendations for plans and commitments that the
Government should make for the future. Some of the recommendations relate to simple policy or
legislative changes, such as the amendment of the Childcare (Pre-School Services) Regulations to
require all early care and education services to have, or have access to, outdoor play areas. Other
recommendations relate to the use of existing resources in a slightly different manner as opposed to
the provision of entirely new resources. For these reasons, this report focuses only on the
recommendations that could result in significant costs to the Government. These recommendations, as
they are set out in Children 2020: Planning Now for the Future, are as follows:
Achieve substantial progress towards a fully professional workforce in services for young
children, with ambitious targets for the proportion of staff qualified to third level, with plans
to ensure that all childminders have appropriate qualifications, and with plans to provide
relevant early years training to inspectors, to those in advisory roles and to staff in training
institutions.
Extend the entitlement to free provision that began with the Free Pre-School Year to a second,
earlier year, to at least 48 weeks of the year, and to at least 3.5 hours per day.
Incrementally introduce payment for parental leave so that paid leave is available for the
critical first twelve months for every child.
Introduce legislation to provide for at least two weeks paid paternity leave for fathers.
Roll out a national programme for the development of early childhood hubs, following a full
evaluation of initial models.
Annex 2 considers the training and education costs and as well as the additional employment costs
that might arise if the early care and education sector were to become more professionalised. Annex 3
then sets out estimates of the additional costs that might arise if the current Free Pre-School Year
Scheme were to be extended to two years. It also considers the costs that might arise if its delivery
were to be extended to cover longer periods during each year. Annex 4 considers the costs that might
arise if a full year of paid parental leave was allowed for parents of newborn children, and Annex 5
considers the costs that might arise if fathers of newborn children were to be granted two weeks of
paid paternity leave. Annex 6 then goes on to discuss the development of Early Childhood Hubs.

38
Annex 2. Professionalising the Workforce
Policy Recommendation: To achieve substantial progress towards a fully professional workforce in
services for young children, with ambitious targets for the proportion of staff qualified to third level,
with plans to ensure that all childminders have appropriate qualifications, and with plans to provide
relevant early years training to inspectors, to those in advisory roles and to staff in training
institutions.
A2.1 Introduction
A key element to Start Strong‟s overall vision is that all early childhood care and education services
for young children should be of a high quality. Children 2020: Planning Now for the Future
highlights that the most important aspect of quality lies in the interactions between staff and children,
and that high quality child-adult interactions are most consistently found where practitioners are
highly qualified, and where wages are sufficiently high to reduce staff-turnover to a low level. Thus,
the professionalisation of the workforce is central to the achievement of high quality services.
However, despite some progress over recent years, much of the workforce remains unqualified or
with a low level of qualifications.28
It should be noted here that the Government recently published a Workforce Development Plan for the
Early Childhood Care and Education Sector29
, which sets out a number of objectives which aim to
up-skill the existing workforce and ensure that those who enter the workforce in the future are
appropriately prepared for their roles. The Plan primarily addresses the need to ensure the future
availability of appropriate, quality courses that are in keeping with the National Framework of
Qualifications, the delivery of which facilitates people who are already in the workforce, and enables
lifelong learning in terms of flexible learning pathways. As such, the Plan sets out a number of actions
for education and training providers, awarding bodies, and the relevant government departments and
agencies. However, despite the significant progress that the Plan represents in terms of supporting the
development of a high quality Early Childhood Care and Education service in Ireland, the Plan also
highlights that,
“There isn‟t a fund available to assist the ECCE workforce to engage in education and training and, in
the current economic climate, resources would have to be diverted from other priorities for such a
fund to be put in place.”
However, the primary costs that might be associated with the professionalisation of the workforce do
not only relate to training and education. Where centre-based childcare is concerned, they also relate
to the increased employment costs that the sector would have to bear if the workforce were to become
more qualified. Section A2.2 considers both the training and education costs and the employment
costs that might arise if childcare workers in centre-based settings are required to increase their
qualification levels. Section A2.3 then considers the training and education costs that might arise if all
paid childminders are also required to have a certain level of accredited training.
28
Developing the Workforce in the Early Childhood Care and Education Sector: Background Discussion Paper.
Department of Education & Science, 2009. 29
Department of Education and Skills, 2010.

39
A2.2 Centre-Based Childcare
A2.2.1 Estimating the Numbers Involved
Before any associated costs can be estimated, it is necessary to establish the existing staffing levels
within the sector and the extent to which these staff are qualified and paid. The official data are
particularly limited although a survey conducted through the City and County Childcare Committees
between November 2007 and February 2008 suggested a total centre-based workforce of almost
21,000.30
For the purposes of this report, it was decided to begin by considering the number of group-based
childcare facilities that are currently providing services and to use this number to derive the number of
staff involved by applying average staffing levels as recorded in various surveys. Group-based
childcare services tend to fall into two categories: community services or private services. Pobal carry
out an annual survey of childcare facilities and in 2009 recorded that community services employ an
average of 8.5 contact staff per facility. The survey also recorded that private services employ an
average of 5.8 contact staff per facility but this data on private services is skewed by an over-
representation of larger facilities. For this reason, this number has been adjusted down to 4.5 to allow
for more of the smaller, locally based play-groups and nurseries.
Based on data on the number of centre-based childcare services currently participating in the Free Pre-
School Year Scheme, the Community Childcare Subvention Scheme, and the Childcare Education
and Training Supports Scheme, it is estimated that there are roughly 4,319 services in operation. Of
these, 1,307 are community services so by applying the average number of staff as recorded by Pobal
(8.5), it is estimated that there are in the region of 11,110 staff working in community childcare
facilities. A further 3,012 are private services so by applying the adjusted average number of staff
employed by private facilities (4.5), it is estimated that there are in the region of 13,526 staff working
in private childcare services. This gives rise to an estimated total workforce of 24,635 which is
roughly in keeping with the findings of the City and County Childcare Committees survey mentioned
above.
These estimations are set out in Table A2.1 below.
30
Developing the workforce in the early childhood care and education sector: Background discussion paper.
Department of Education & Science, 2009.

40
Table A2.1: Estimated Number of Staff working in centre-based childcare services
Description of Estimate Estimated
Number
Total community-based childcare facilities 1,307
Average number of staff per community-based facility 8.5
Estimated total staff working in community-based childcare facilities 11,110
Total private childcare facilities participating in Free Pre-School Year 3,012
Average number of staff per private facility 4.5
Estimated total staff working in private childcare facilities 13,526
Total estimated workforce in group-based childcare services 24,635
Source: Goodbody Economic Consultants Estimates
A2.2.2 Developing Scenarios
Children 2020: Planning Now for the Future does not make specific recommendations in relation to
the level of qualification that childcare workers should attain, other than that service leaders should be
graduates with a third-level early years qualification. Nor does it specify what proportion of staff in a
service unit should be qualified to what level. For these reasons, the consultants have developed three
different scenarios to allow cost estimates to be derived.
In keeping with the average staff numbers recorded in the Pobal data, each scenario is based on a
childcare facility employing six people. Furthermore, the main categories of staff employed include
Childcare Managers, Senior Childcare Supervisors, Childcare Supervisors, and Childcare Assistants.
The scenarios also make use of three different levels of qualification:
FETAC Level 5 – Certificate in Childcare
To receive this qualification in full, a participant must complete eight relevant modules.
Training courses are available that encompass all eight modules, but it is also possible to
complete one module at a time, building up to a full qualification over a longer period of time.
The duration and delivery of courses vary from one college to another.
FETAC Level 6 – Advanced Certificate in Supervision in Childcare
To receive this qualification in full, a participant must complete four mandatory modules as
well as an additional elective FETAC Level 6 module. It is possible to bring forward two
FETAC Level 5 modules as an alternative to completing the elective module. Again, the
duration and delivery of courses vary from one college to another.
FETAC Levels 7 or 8 – BA in Early Childhood Care and Education
This degree programme provides an academic and professional qualification in the care and
education of young children. The programme is available in a number of colleges and
universities and has a duration of between 3 and 6 years depending on the college attended
and the level of qualification attained.

41
Table A2.2 below summarises each of the three scenarios that were developed in terms of the
qualified staff that they would require. As the table indicates every scenario requires that every staff
member has some level of nationally accredited qualification. Furthermore, each job title is associated
with a specific level of qualification.
Table A2.2: Summary of Scenarios
Description of Position and Qualification Required Scenario
1
Scenario
2
Scenario
3
Childcare Manager – FETAC Level 7 or higher 1 1 1
Senior Childcare Supervisor – FETAC Level 7 or higher - 1 1
Childcare Supervisor – FETAC Level 6 1 1 2
Childcare Assistant – FETAC Level 5 4 3 2
Total Staff 6 6 6
Source: Goodbody Economic Consultants Assumptions
Of note is the introduction of Senior Childcare Supervisors under the second and third scenarios and
the fact that they would be required to have a third-level qualification. The recently published
National Standards for Pre-School Services31
, which will be incorporated into pre-school inspections,
recommends that there should be a designated person in charge of a service at all times, with formal
arrangements in place for an individual to deputise in the absence of the designated person in charge.
It is further stated that the person in charge at any time should have all the knowledge and information
required to manage the service. A Senior Childcare Supervisor qualified to third level would be well
placed to carry out these additional deputising duties.
Furthermore, the Department of Children and Youth Affairs make it a pre-requisite of the free pre-
school year scheme that all classes must be led by a pre-school leader with the help of a pre-school
assistant if class numbers exceed a certain amount. It is also a requirement that all pre-school leaders
are qualified to at least FETAC Level 5, with a higher capitation fee being paid to centres where all
pre-school leaders are qualified to FETAC Level 7 and all pre-school assistants are qualified to
FETAC Level 5.
Before the cost implications of each of the scenarios could be fully explored, it was necessary to
establish the extent to which the existing workforce is qualified. The National Children‟s Nursery
Association (NCNA) carries out an annual survey of its members. The most recent NCNA survey
collected data in relation to staff qualifications and found that 9.1 per cent of the workforce are
qualified to FETAC Levels 6 or 7, and a further 54.5 per cent are qualified to or working towards
FETAC Level 5. This suggests that up to 36.4 per cent of the current workforce do not hold a
nationally accredited qualification. These findings are in keeping with the results of the Pobal survey
which found that 66.1 per cent of the workforce was qualified to FETAC Level 5 or higher.
However, the findings of the City and County Childcare Committees survey mentioned above suggest
significantly higher levels of qualification among the existing workforce: 9 per cent qualified to
FETAC Level 7 or higher; 11 per cent qualified to FETAC Level 6; 41 per cent qualified to FETAC
31
Department of Health and Children, 2010.

42
Level 5; 27 per cent with minor qualifications (FETAC Levels 1-4); and just 12 per cent without any
accredited training.
Owing to the discrepancies that arise between these findings and those of the NCNA and Pobal
surveys, particularly in relation to the proportion of the workforce qualified to third level and the
proportion without any accredited training, the consultants decided to derive two sets of training and
education costs using two different baseline scenarios. The first draws on the CCC Survey to give rise
to a set of minimum costs and the second draws on the NCNA data, supported by the Pobal data, to
give rise to a set of maximum costs.
Table A2.3 below sets out the estimated total number of people working in centre-based childcare
services and applies the proportions of qualified staff as recorded by the CCC Survey. Table A2.4
then takes the same approach but this time applies the proportions of qualified staff as recorded in the
NCNA survey to derive estimates of the qualification levels of the workforce as a whole. It should be
noted that some additional assumptions have been made in Table A2.4 with regard to the breakdown
of staff qualified to FETAC Levels 6 and 7, as well as the breakdown of staff qualified to or working
towards FETAC Level 5.
Table A2.3: Qualification Levels of Existing Workforce based on CCC Survey Findings
(giving rise to minimum costs)
Qualification Level Currently Held No.
Estimated Total Workforce 24,635
of which:
9.0 per cent qualified to FETAC Level 7 or higher 2,217
11.0 per cent qualified to FETAC Level 6 2,710
41.0 per cent qualified to FETAC Level 5 10,100
27.0 per cent with Minor Awards (FETAC Levels 1 – 4) 6,651
12.0 per cent unqualified 2,956
Source: Goodbody Economic Consultants Estimates

43
Table A2.4: Qualification Levels of Existing Workforce based on NCNA & Data (giving
rise to maximum costs)
Qualification Level Currently Held No.
Estimated Total Workforce 24,635
of which:
9.1 per cent qualified to FETAC Level 6 or 7 2,242
54.5 per cent qualified to or working towards FETAC Level 5 13,426
36.4 per cent unqualified 8,967
Full Distribution Assumptions:
FETAC Level 7 or higher 739
FETAC Level 6 1,503
FETAC Level 5 (full qualification) 6,713
FETAC Level 5 (part qualification) 6,713
Unqualified 8,967
Source: Goodbody Economic Consultants Estimates
A2.2.3 Training & Education Costs
FETAC Level 5 – Certificate in Childcare The course costs associated with the completion of a FETAC Level 5 qualification can vary
considerably depending on whether the course is completed on a full-time or part-time basis,
whether it is attended by day or by night, and whether it is accessed via an Institute of Further
Education or a private college.32
For example, completion of the course in full over one year
in an Institute of Further Education incurs course costs of roughly €300 for full-time day
students, rising to roughly €930 for students wishing to complete it by night. For a student
wishing to complete the course on a full-time basis in a private college, course costs can be as
high as €1,600.
For the purposes of this costing exercise, it is assumed that members of the existing
workforce will need to complete it by night to allow them to continue working. Thus the unit
cost used in each scenario for an individual looking to gain a full FETAC Level 5
qualification is €930.
For those individuals who have already partly completed the FETAC Level 5 qualification,
the average course cost for each remaining module is €250 depending on the college or
Institute of Further Education attended. Students are required to complete eight modules
before they are awarded the full qualification and it is assumed that those who are already
working towards it have completed an average of four modules, leaving them with four more
to complete. At an average course cost of €250 per module, this would amount to total costs
of €1,000.33
32
A number of organisations in the Community and Voluntary sector also deliver this course. 33
It is most often the case that the completion of an education course over a longer period of time, module by
module, will incur higher costs than those that would arise if the course were completed in one go, which is why
the costs for completing four FETAC 5 modules are higher than those for completing all eight together.

44
FETAC Level 6 – Advanced Certificate in Supervision in Childcare As before, the course costs associated with the completion of a FETAC Level 6 qualification
can vary considerably depending on the way the course is accessed and the type of college
attended. Completion of the course in full over one year in an Institute of Further Education
incurs course costs of roughly €340 for full-time day students, rising to roughly €1,195 for
students wishing to complete it by night. For a student wishing to complete the course on a
full-time basis in a private college, course costs would be higher again.
Once again it is assumed that members of the existing workforce would need to complete this
course by night to allow them to continue working. Thus the unit cost used in each scenario
for an individual looking to gain a full FETAC Level 6 qualification is €1,195.
FETAC Level 7 or higher – BA in Early Childhood Care and Education This degree course is delivered in different ways by different universities and Institutes of
Technology, usually over three or four years. The associated course costs will also vary
according to the college attended, the type of student, and the nature of their attendance.
For example, a first-time undergraduate completing the course on a full-time basis in UCC
will be required to pay an annual registration fee of €2,000 and an annual capitation fee of
€150. The government will also fund annual fees of €4,098, giving rise to total costs of
€6,248 per annum, or €18,744 over the course of three years.
An adult student returning to college in NUI Galway, on the other hand, can complete this
course over four years by way of a blended learning approach that facilitates those with
existing work commitments. The annual tuition fees in this instance would amount to €2,900
giving rise to total costs over four years of €11,600.
Dublin Institute of Technology (DIT) also offers this programme on a flexible basis to
individuals already working in childcare settings but over a three-year period. The fees are
currently €1,800 for the first year, increasing to €2,700 each for the second and third years.
Students are also required to pay an annual part-time capitation fee of €135. This gives rise to
total costs over three years of €7,605.
If it does become a requirement for more staff to be qualified to a higher level, it is inevitable
that this course will become more widely available to meet demand. This will create greater
competition between education providers in terms of the course fees that they charge. It is
also assumed that any of the existing workforce wishing to complete this course will want to
do so on a flexible basis. For these reasons the unit cost used in each scenario for an
individual looking to gain a BA in Early Childhood Care and Education is €7,605.
Summary of Training & Education Costs By taking the qualification data on the existing workforce as set out in Tables 2.3 and 2.4 above, and
comparing them to the training and education requirements that would arise under each of the three
scenarios, it is possible to derive the total training and education costs that would arise for the sector
as a whole in each instance. It should be noted here that the allocation of these costs, in terms of who
should bear them, falls outside the remit of this report.
The cost estimates set out below would be once-off costs that would bring the current workforce up to
a certain level. Going forward, any new recruits to the sector will have already achieved or be
working towards some level of qualification. Thus, there will always be some annual costs as
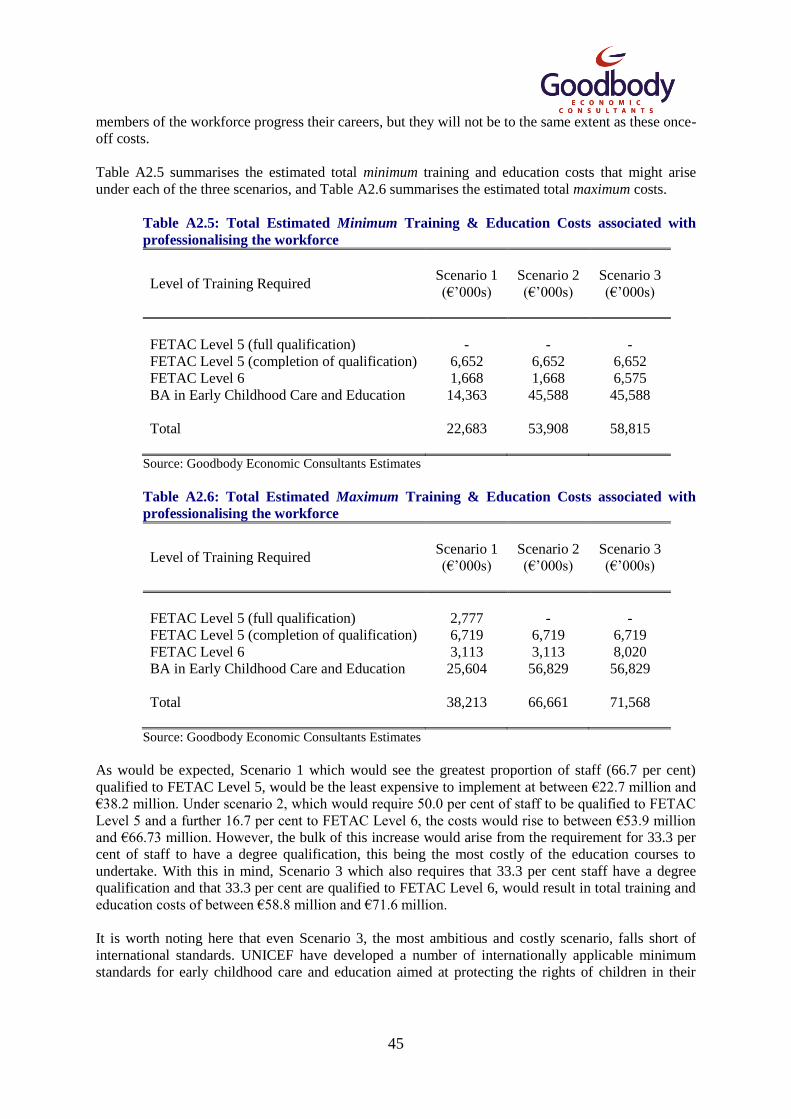
45
members of the workforce progress their careers, but they will not be to the same extent as these once-
off costs.
Table A2.5 summarises the estimated total minimum training and education costs that might arise
under each of the three scenarios, and Table A2.6 summarises the estimated total maximum costs.
Table A2.5: Total Estimated Minimum Training & Education Costs associated with
professionalising the workforce
Level of Training Required Scenario 1
(€‟000s)
Scenario 2
(€‟000s)
Scenario 3
(€‟000s)
FETAC Level 5 (full qualification) - - -
FETAC Level 5 (completion of qualification) 6,652 6,652 6,652
FETAC Level 6 1,668 1,668 6,575
BA in Early Childhood Care and Education 14,363 45,588 45,588
Total 22,683 53,908 58,815
Source: Goodbody Economic Consultants Estimates
Table A2.6: Total Estimated Maximum Training & Education Costs associated with
professionalising the workforce
Level of Training Required Scenario 1
(€‟000s)
Scenario 2
(€‟000s)
Scenario 3
(€‟000s)
FETAC Level 5 (full qualification) 2,777 - -
FETAC Level 5 (completion of qualification) 6,719 6,719 6,719
FETAC Level 6 3,113 3,113 8,020
BA in Early Childhood Care and Education 25,604 56,829 56,829
Total 38,213 66,661 71,568
Source: Goodbody Economic Consultants Estimates
As would be expected, Scenario 1 which would see the greatest proportion of staff (66.7 per cent)
qualified to FETAC Level 5, would be the least expensive to implement at between €22.7 million and
€38.2 million. Under scenario 2, which would require 50.0 per cent of staff to be qualified to FETAC
Level 5 and a further 16.7 per cent to FETAC Level 6, the costs would rise to between €53.9 million
and €66.73 million. However, the bulk of this increase would arise from the requirement for 33.3 per
cent of staff to have a degree qualification, this being the most costly of the education courses to
undertake. With this in mind, Scenario 3 which also requires that 33.3 per cent staff have a degree
qualification and that 33.3 per cent are qualified to FETAC Level 6, would result in total training and
education costs of between €58.8 million and €71.6 million.
It is worth noting here that even Scenario 3, the most ambitious and costly scenario, falls short of
international standards. UNICEF have developed a number of internationally applicable minimum
standards for early childhood care and education aimed at protecting the rights of children in their

46
most vulnerable and formative years. These standards were developed in consultation with
government officials and academic experts in OECD countries in Asia, Europe and North America,
with additional input from both UNICEF and the World Bank.34
One of the standards relates to the
qualification levels of staff working in early childhood care and education services and recommends
that at least 50 per cent of staff working in this sector should have a minimum of three years tertiary
education with a recognised qualification in early childhood studies or a related field. If a fourth,
“International Standard” scenario were to be developed to take account of this international
benchmark, the training and education cost estimates described above would rise to between €83.5
million and €97.9 million.
A2.2.4 Employment Costs
Developing a Baseline Scenario Before employment costs could be estimated, it was necessary to develop a baseline scenario
of existing employment costs against which the proposed scenarios could be compared. In
keeping with the other scenarios, the baseline scenario assumes that the average childcare
centre employs six staff. It also makes the same assumptions as Scenario 1 in relation to the
distribution of staff across the various roles. Thus, the six staff may be broken down into one
childcare manager, one childcare supervisor, and four childcare assistants. Of the four
childcare assistants, one is assumed to work on a part-time basis. It is important to note that
the baseline scenario differs from Scenario 1 in that there are no qualification requirements
attached to the various roles.
With regard to existing pay levels, there are very limited data available. In developing the
baseline scenario, reference was made to A Study of HR Practices in the Childcare Sector35
, a
research document published by the Dublin City Childcare Committee and Dublin Inner City
Partnership in 2005. The research drew on case studies of a number of centre-based childcare
services, some of which gave information on the salary scales that they use.
The baseline scenario assumes that existing childcare assistants are currently paid the
minimum wage as it stood before Budget 2011 (€8.65 per hour). It also assumes that childcare
supervisors are paid in the region of €26,000 per annum, and childcare managers are paid in
the region of €39,000 per annum. These basic salary levels were then adjusted to include
employers‟ PRSI, giving rise to the employment costs as set out in Table A2.7 below.
Table A2.7: Baseline Scenario Employment Costs by Level of Employment
Level of Employment Basic Annual
Salary (€)
Employers‟
PRSI (€)
Total Employment
Costs (€)
Childcare Manager 39,000 4,193 43,193
Childcare Supervisor 26,000 2,795 28,795
Childcare Assistant (full-time) 17,542 1,491 19,033
Childcare Assistant (part-time) 8,771 746 9,517
34
The Child Care Transition: A league table of early childhood education and care in economically advanced
countries. UNICEF, 2008. 35
Dublin City Childcare Committee & Dublin Inner City Partnership, 2005.

47
Source: Goodbody Economic Consultants Estimates
Developing Salary Scales Four salary scales were then developed for each level of employment used in the scenarios:
Childcare Manager; Senior Childcare Supervisor; Childcare Supervisor; and Childcare
Assistant.
In recognition of their proposed third level qualifications, the salary scales developed for
Childcare Managers and Senior Childcare Supervisors drew on the Common Basic Salary
Scale that was agreed for teachers following the public service pay-cut in January 2010. This
salary scale ranges from €30,904 per annum to €59,359 per annum depending on the years of
experience that a teacher has. The scale also allows for an additional special allowance of
€8,749 per annum to be paid to teachers with special duties. For the purposes of this costing
exercise it is assumed that Childcare Managers should be paid the equivalent salary to a
teacher with additional special duties, and Senior Childcare Supervisors should be paid the
same as teachers.
The salary scale for Childcare Assistants was based on the current salary scale used for
Special Needs Assistants employed by the Department of Education, as the basic qualification
requirements are comparable. This salary scale ranges from €23,139 to €37,499 per annum,
depending on the qualifications and experience that an assistant has. 36
The salary scale for Childcare Supervisors was then derived using the mid-points between the
Childcare Assistants‟ salary scale and the Senior Childcare Supervisors‟ salary scale.
To enable the costing exercise, the average annual employment costs used were those payable
to people with five years‟ experience in the sector. They are set out in Table A2.8 below.
Table A2.8: Proposed Employment Costs by Level of Employment
Level of Employment Basic Annual
Salary (€)
Employers‟
PRSI (€)
Total Employment
Costs (€)
Childcare Manager 44,524 4,786 49,310
Senior Childcare Supervisor 35,775 3,846 39,621
Childcare Supervisor 31,630 3,400 35,030
Childcare Assistant (full-time) 27,484 2,955 30,439
Childcare Assistant (part-time) 13,742 1,168 14,910
Source: Goodbody Economic Consultants Assumptions
Summary of Employment Costs By taking the baseline employment costs data as set out in Table A2.7 above, and comparing
it to the proposed employment costs that would arise under each of the three scenarios, it is
36
The 2008 Salary Scale as published on the Department of Education‟s website has been adjusted in
accordance with the public service pay-cut (01/01/2010) that was applied to the Common Basic Salary Scale for
teachers.

48
possible to derive estimates of the incremental employment costs that might arise for the
sector as a whole in each instance. These estimates are summarised in Table A2.9 below. As
before, the allocation of these costs, in terms of who should bear them, falls outside the remit
of this report.
Table A2.9: Total Estimated Incremental Employment Costs associated with
professionalising the workforce
Scenario 1
(€m)
Scenario 2
(€m)
Scenario 3
(€m)
Childcare Managers 25.1 25.1 25.1
Senior Childcare Supervisors - 162.7 162.7
Childcare Supervisors 25.6 25.6 169.4
Childcare Assistants (full-time) 140.5 15.5 -109.5
Childcare Assistants (part-time) 22.2 22.2 22.2
Total 213.4 251.1 269.9
Source: Goodbody Economic Consultants Estimates
As would be expected, Scenario 1, which would see the greatest proportion of staff (66.7 per cent)
employed as Childcare Assistants, would be the least costly with total employment costs for the sector
as a whole increasing by over €213 million per annum. Under Scenario 2, which would require 50.0
per cent of staff to be employed as Childcare Assistants, 16.7 per cent as Childcare Supervisors, and a
further 16.7 per cent as Senior Childcare Supervisors, annual employment costs to the sector as a
whole would rise by just over €251 million. Scenario 3 which requires that 16.7 per cent of staff are
Senior Childcare Supervisors, with a further 33.3 per cent as Childcare Supervisors, leaving just one-
third (33.3 per cent) as Childcare Assistants, would result in increased annual employment costs for
the sector as a whole in the region of €270 million.
Again it is worth noting here that a fourth „International Standard‟ scenario that takes account of
international benchmarks whereby at least 50 per cent of staff would be required to have a third-level
qualification, would give rise to additional annual employment costs in the region of €289 million.
A2.2.5 Support Costs
In addition to the initial training and education costs and the incremental employment costs that would
come about with the professionalisation of the workforce, there is also a need to consider ongoing
support costs.
Business support and support to access funding is currently offered to the Early Childhood Care and
Education sector by the various City and County Childcare Committees, who also offer certain
training courses. Support in relation to quality assurance will increase over time when more funding
becomes available to further implement the National Quality Framework for Early Childhood
Education by increasing the number of Síolta co-ordinators to work directly with individual services.
However, to maintain the quality of ECCE in Ireland in terms of the professional level of the
workforce, it will also be necessary to promote and support the continuing professional development
of those working within the sector. Continuing professional development is a crucial support for staff

49
working in an area such as ECCE where understandings and insights are constantly evolving. It also
provides staff with the skills necessary to respond appropriately to the needs of children from an
increasingly diverse society.
In 2009, the Department of Education invested €26.2 million in the delivery of in-service
programmes, summer courses, and Education Centre Network courses for 40,000 primary and
secondary teachers. An allocation of €29.8 million was made for the same provision of supports in
2010.37
With this in mind, and with an estimated ECCE workforce in the region of 24,500 people, it
might be appropriate to allow for an annual budget in the region of between €10 million and €15
million for the continuing professional development of ECCE workers.
A2.3 Childminders
A2.3.1 Introduction
Start Strong‟s policy recommendation regarding the professionalisation of the workforce also calls for
it to be a requirement that all childminders have appropriate qualifications. Because childminders are
self-employed, they would not incur any additional employment costs as a result of this
professionalisation, although they may want to increase their rates. They would however incur costs
associated with their own training and education.
For the purposes of this report estimates are made for two training and education cost scenarios. The
first scenario would make it a requirement that all childminders completed the Quality Awareness
Programme, which is a basic introductory course for childminders, as well as a standard occupational
First Aid course. Both of these courses are made available by the City and County Childcare
Committees.
The second scenario would put greater demands on childminders and give rise to higher training costs
by making it a requirement that all childminders complete the FETAC Level 5 Certificate in Childcare
already described in Section A2.2 above.
A2.3.2 Estimating the Numbers Involved
There are even fewer data sources on childminders in Ireland than there are on centre-based childcare
services, as childminders who care for 3 or fewer pre-school children are excluded from legislation So
to get an estimate of the number of childminders, it was decided to begin by estimating the number of
children in this type of care.
The Department of Social Protection publishes annual data on welfare recipients, including recipients
of child benefit. The most recent data relate to 2009 and indicate that just over 400,000 children aged
between 0 and 5 years were in receipt of this payment that year. The CSO then collect data on the use
of childcare services via special modules of the Quarterly National Household Survey. The most
recent data were collected at the end of 2007 and indicate that 12 per cent of pre-school children are in
the care of non-relative, paid childminders.
By applying this proportion to the total number of children mentioned above, it is estimated that just
over 48,000 pre-school children are currently in the care of childminders.
37
Department of Education and Skills Annual Output Statement, 2010.

50
Childminding Ireland is the national representative body for childminders with a current registered
membership base of 818 childminders. Childminding Ireland carries out an annual survey of its
members and the 2009 data indicated that the average number of pre-school children looked after by
survey respondents was 3. It is possible that childminders looking after more children may be more
likely to want to highlight their professionalism and so may be more inclined to register with
Childminding Ireland. With this in mind, the average number of pre-school children in the care of
each childminder has been adjusted down slightly to 2.5. Thus, it is estimated that there are currently
in the region of 19,000 childminders looking after pre-school children, as set out in Table A2.10
below. It should be noted here that a similar number of pre-school children are in the care of relatives
acting as childminders, suggesting that if relatives were to be included in the overall figure, the total
number of childminders could actually be double that set out in Table A2.10.
Table A2.10: Estimated Number of Paid (non-relative) Childminders
Description of Estimate Estimated No.
Total Children aged 0-5 years 401,421
Proportion with paid (non-relative) childminders 12.0%
Estimated number of children with paid (non-relative) childminders 48,171
Average number of children per childminder 2.5
Estimated number of childminders looking after pre-school children 19,268
Source: Goodbody Economic Consultants Estimates
A2.3.3 Training & Education Costs
Before the full cost implications of making it a requirement that all paid childminders have a
recognised qualification could be fully explored, it was necessary to establish the extent to which the
existing workforce of childminders is qualified.
The Childminding Ireland 2009 survey found that 30.1 per cent of its members had a full FETAC
Level 5 qualification; 17.7 per cent had completed one or more modules at FETAC Level 5; 10.6 per
cent had an unspecified nationally recognised qualification; and 3.5 per cent reported having no
qualification at all. This means that the extent to which the remaining 38.1 per cent are qualified is
unknown.
It would be improper however to simply apply these proportions to the estimated total number of
childminders in Ireland, as registered members of Childminding Ireland comprise less than 5.0 per
cent of all childminders. It is likely that members of Childminding Ireland are more likely to view
their roles as being more professional and as such would be more likely to have undertaken some
form of training already.
The Quality Awareness Programme, which would be a training requirement under Scenario 1, was
launched in 2004 and the total number of people who have completed this course to date is in the
region of 6,000.38
It is further assumed, for the purposes of this costing exercise, that just 1.5 per cent
of all childminders hold a full FETAC Level 5 qualification, reflecting the Childminding Ireland
survey results, as these individuals are most likely to have registered with Childminding Ireland. The
38
Source: estimates from Pobal.

51
remaining assumption is that 13.5 per cent of childminders have completed one or more modules at
FETAC Level 5. This baseline of qualifications is summarised in Table A2.11 below.
Table A2.11: Estimated Qualification Levels of existing Childminders
Qualification Level Currently Held No.
Estimated Total Childminders 19,268
of which:
1.5 per cent FETAC Level 5 (full qualification) 289
13.5 per cent FETAC Level 5 (part qualification) 2,601
Quality Awareness Programme & First Aid Training 6,133
Unqualified 10,245
The Quality Awareness Programme is delivered over two half-days or five evenings and costs roughly
€100 per participant. A standard Occupational First Aid course costs in the region of €160 per
participant, giving rise to total training and education costs of €260 for each unqualified childminder
under the first Scenario.
For the second Scenario, the unit costs for completing FETAC Level 5 as used in Section A2.2.3
above are employed again as it is assumed that existing childminders will have to complete their
training by night. Thus, the average cost for completing FETAC Level 5 in full is assumed to be €930,
rising to €1,000 for childminders who have already completed half of the required modules making it
necessary to complete the course on a module-by-module basis.
The total training and education costs that would arise under each scenario are presented in Table
A2.12 below. Under the first scenario, which would require all childminders to complete the Quality
Awareness Programme and First Aid training, costs are estimated to be in the region of €2.7 million.
These costs would increase substantially to €17.8 million under Scenario 2, which would require all
existing childminders to be qualified to FETAC Level 5.
Table A2.12: Estimated Training & Education Costs associated with the
professionalisation of Childminders (Scenario 1)
Additional Training Required Average Unit
Costs (€)
No. Existing
Childminders
requiring training
Total Costs
(€‟000s)
Scenario 1:
Quality Awareness Programme &
First Aid
260 10,245 2,663.7
None - 9,023 -
Total Costs under Scenario 1 19,268 2,663.7
Scenario 2:
FETAC Level 5 (in full) 930 16,378 15,231.5
FETAC Level 5 (in part) 1,000 2,601 2,601.0
None - 289 -
Total Costs under Scenario 2 19,268 17,832.5

52
Source: Goodbody Economic Consultants Estimates

53
Annex 3. Extending the Free Pre-School Year
Policy Recommendation: To extend the entitlement to free provision that began with the Free Pre-
School Year to a second, earlier year, to at least 48 weeks of the year, and to at least 3.5 hours per
day.
A3.1 Introduction
The vision of Start Strong is that high quality care and education services should be available free for
all children, on at least a part-time basis, from the age of two, because of the compelling evidence of
the benefits of such services. This would involve extending the principle of free education, already
established in primary schools and now in the Free Pre-School Year, to an earlier year.
The primary purpose of this change would be to enable children to gain the extensive benefits
associated with high quality care and education services, rather than to facilitate their parents‟
employment. The high take-up rate (94 per cent) of the Free Pre-School Year in its first year of
operation is clear evidence that most parents want their children to take part in early education,
regardless of whether they themselves are at work or at home.
A3.2 Current Pre-School Provision
Under the current scheme, children aged between 3 years 2 months and 4 years 7 months in the
September of a given year are currently entitled to one free year of pre-school.
In the majority of instances, services provide 3 hours of pre-school each day, 5 days per week over the
course of a 38 week pre-school year in return for a weekly capitation fee of €64.50 per child39
. These
38 weeks are in keeping with the current primary school year.
Certain services which are unable to open 5 days per week (for planning permission reasons for
example), are allowed to open 4 days per week, operating 3.5 hours per day, over a 41 week pre-
school year, for the same annual capitation fee.
Where children attend a service such as a crèche which is open for 50 weeks of the year, they are
entitled to a free pre-school session for 2 hours 15 minutes each day, with their crèche fees being
reduced by €48.50 per week for each of the 50 weeks. The service then receives this amount back by
way of an adjusted capitation fee. Where a child attends a crèche on a part-time basis, but receives at
least 3 pre-school sessions of 3 hours 45 minutes each week, the same capitation and fee reduction is
applied.
A3.3 The Costs to the Exchequer of Extending the Scheme
A3.3.1 General Approach
The current scheme provides annual capitation fees that vary from €2,425 for a child receiving pre-
school sessions in a crèche over 50 weeks of the year, to €2,451 for a child attending a pre-school for
39
The weekly capitation fee of €64.50 per child can rise to €75 per child in pre-schools with higher qualified
staff, where all pre-school leaders are qualified to FETAC Level 7 and all pre-school assistants are qualified to
FETAC Level 5.

54
38 weeks of the year, to €2,850 for a child attending a pre-school with higher qualified staff for 38
weeks of the year. The original budget set out for the first year of the scheme was €170m but
information from the Department of Children and Youth Affairs, which administers the scheme,
suggests that actual costs for 2010 amounted to roughly €155m. If the take-up rate for 2010 of 94 per
cent is applied to the total number of births that occurred in 2006, this suggests an average annual
capitation fee of €2,565 per child, which is in keeping with the range of annual capitation fees
mentioned above.
An extension of the scheme to two years provision would suggest a doubling of these costs. However,
annual costs will fluctuate each year according to the number of eligible children in a given year.
Furthermore, under the current scheme, this number relates to the number of births that occurred in
the year four years prior to the take-up year. If the scheme is extended to include an additional earlier
year of free pre-school provision, the number of births that occurred in the year three years prior to the
take-up year will also need to be taken into consideration.
Thus, before any cost estimates can be made, it is necessary to establish birth forecasts which in turn
will facilitate the estimation of participant forecasts.
A3.3.2 Birth Forecasts
The CSO maintain population projections that are based on the most recent Census results. They
incorporate fertility rates that take account of the effects that increased educational attainment and
labour force participation of women have on fertility. The population projections are made for a
number of different scenarios. The F1M0 scenario assumes that the overall fertility rate will remain at
its 2006 level for the lifetime of the projections. It also assumes zero net migration with inflows being
offset by equivalent annual outflows for the lifetime of the projections, which is in keeping with
current migration patterns in Ireland.
Table A3.1 below sets out the annual growth rates in the number of births each year to 2020, as
forecast in the CSO projections. These growth rates are then applied to the total number of births
recorded in 2009 to derive forecasts that are in keeping with more recently recorded data. As the table
indicates, actual births are forecast to decline marginally over the coming years with the rate of
decline increasing slightly as the years go on.

55
Table A3.1: Forecast Number of Births, 2010-2020
Year Forecast Annual Change as per CSO
F1M0 Scenario (%)
Forecast Number of Births
2006 64,237*
2007 70,620*
2008 75,065*
2009 74,278*
2010 0.1 74,375
2011 -0.1 74,311
2012 -0.2 74,186
2013 -0.4 73,894
2014 -0.8 73,311
2015 -1.2 72,464
2016 -1.5 71,403
2017 -1.6 70,289
2018 -1.7 69,098
2019 -1.9 67,785
2020 -2.1 66,329
Source: CSO
*Note: Births recorded for 2006, 2007, 2008 and 2009 are actual data.
A3.3.3 Forecast Participation in the Scheme
As already mentioned above, the take-up rate for the current scheme in the first year of its operation
was 94 per cent and it is assumed for the purposes of this report that this take-up rate will remain
constant over the coming years. Thus, Table A3.2 below sets out the number of children that are
expected to participate in the current scheme each year for the next ten years.
Table A3.2: Forecast Scheme Participants
Year beginning
Participation in Current
Scheme
Year of Birth Estimated No of
Participants
(94% participation rate)
2011 2007 66,383
2012 2008 70,561
2013 2009 69,821
2014 2010 69,912
2015 2011 69,853
2016 2012 69,735
2017 2013 69,460
2018 2014 68,912
2019 2015 68,116
2020 2016 67,118

56
A3.3.4 Costs to the Exchequer As already discussed, annual capitation fees vary from €2,425 to €2,850 according to the type of pre-
school service that a child receives. For this reason, the cost estimates presented in Table A3.3 below
assume an average annual capitation fee of €2,565 per child as described in Section A3.3.1 above.
The table sets out cost estimates for the continuation of just one year of free pre-school provision as
well as cost estimates for a two-year scheme. This gives rise to estimates of the incremental costs that
could arise if the current scheme were to be extended to include a second earlier year.
As the table indicates, the additional costs that could arise if this policy recommendation were to be
implemented would be in the region of €180m per annum over the next five years. If the number of
births does decline in line with the CSO F1M0 forecasts, these additional annual costs would fall back
to just over €170m by 2020.
Table A3.3: Estimated Costs to the Exchequer based on Current Service Levels
Current One-Year Provision Proposed Two-Year Provision Increment
(€) Year Estimated
Participants
Total Costs
(€m)
Estimated
Participants
Total Costs
(€m)
2012 70,561 181.0 140,382 360.1 179.1
2013 69,821 179.1 139,734 358.4 179.3
2014 69,912 179.3 139,765 358.5 179.2
2015 69,853 179.2 139,587 358.0 178.9
2016 69,735 178.9 139,195 357.0 178.2
2017 69,460 178.2 138,372 354.9 176.8
2018 68,912 176.8 137,028 351.5 174.7
2019 68,116 174.7 135,234 346.9 172.2
2020 67,118 172.2 134,236 344.3 172.2
Source: Goodbody Economic Consultants
It should be noted that these costs are based on the current basic requirement that pre-school services
are provided for 3 hours each day, 5 days per week over the course of a 38 week pre-school year. Start
Strong‟s ultimate vision is that the same services would be provided for 3.5 hours each day, 5 days
per week over the course of a 48 week year. When current annual capitation fees are adjusted to
reflect this increased level of service they rise to between €3,600 and €4,200 per child depending on
the qualification levels of the staff providing the service. When the relationship that exists between
the current average annual capitation fee and the current minimum and maximum fees payable is
applied to these figures, it gives rise to an estimated average annual capitation fee of €3,795 per child.
The total estimated costs that could be involved if services were also extended in this way are set out
in Table A3.4 below. If the current provision of just one year of free pre-school were to continue but
with levels of provision increased from 3 hours to 3.5 hours per day and from 38 weeks to 48 weeks
each year, the annual costs would increase by over 50 per cent each year, giving rise to estimated
costs of €265m in 2015 and €255m in 2020. If this level of pre-school service were to be provided for
two years for each child, it is estimated that annual costs would amount to €530m in 2015 and €510m
in 2020.

57
Table A3.4: Estimated Costs to the Exchequer based on Increased Service Levels
One-Year Provision Proposed Two-Year Provision
Year Estimated
Participants
Total Costs
(€m)
Increment on
Existing Costs
(€m)
Estimated
Participants
Total Costs
(€m)
Increment on
Existing Costs
(€m)
2012 70,561 267.8 86.8 140,382 532.8 351.8
2013 69,821 265.0 85.9 139,734 530.3 351.2
2014 69,912 265.3 86.0 139,765 530.4 351.1
2015 69,853 265.1 85.9 139,587 529.7 350.6
2016 69,735 264.6 85.8 139,195 528.2 349.4
2017 69,460 263.6 85.4 138,372 525.1 347.0
2018 68,912 261.5 84.8 137,028 520.0 343.3
2019 68,116 258.5 83.8 135,234 513.2 338.5
2020 67,118 254.7 82.6 134,236 509.4 337.3
Source: Goodbody Economic Consultants
A3.4 The Impact of Professionalising the Workforce on Exchequer Costs
In light of Section A2 above, which set out the additional employment costs that would arise if the early childhood care and education workforce were
to up-skill and increase its overall level of qualification, it is appropriate to consider the impact that this kind of up-skilling would also have on the costs
of the Free Pre-School Year scheme.
As already mentioned above, the current weekly capitation fee paid for each child is €64.50 in the majority of cases, but can rise to €75 per child in pre-
schools where all pre-school leaders are qualified to FETAC Level 7 and all pre-school assistants are qualified to FETAC Level 5. In the estimates
calculated in Section A3.3.4 above, the average weekly capitation fee used was €67.50. If the sector is to become more professional in terms of the
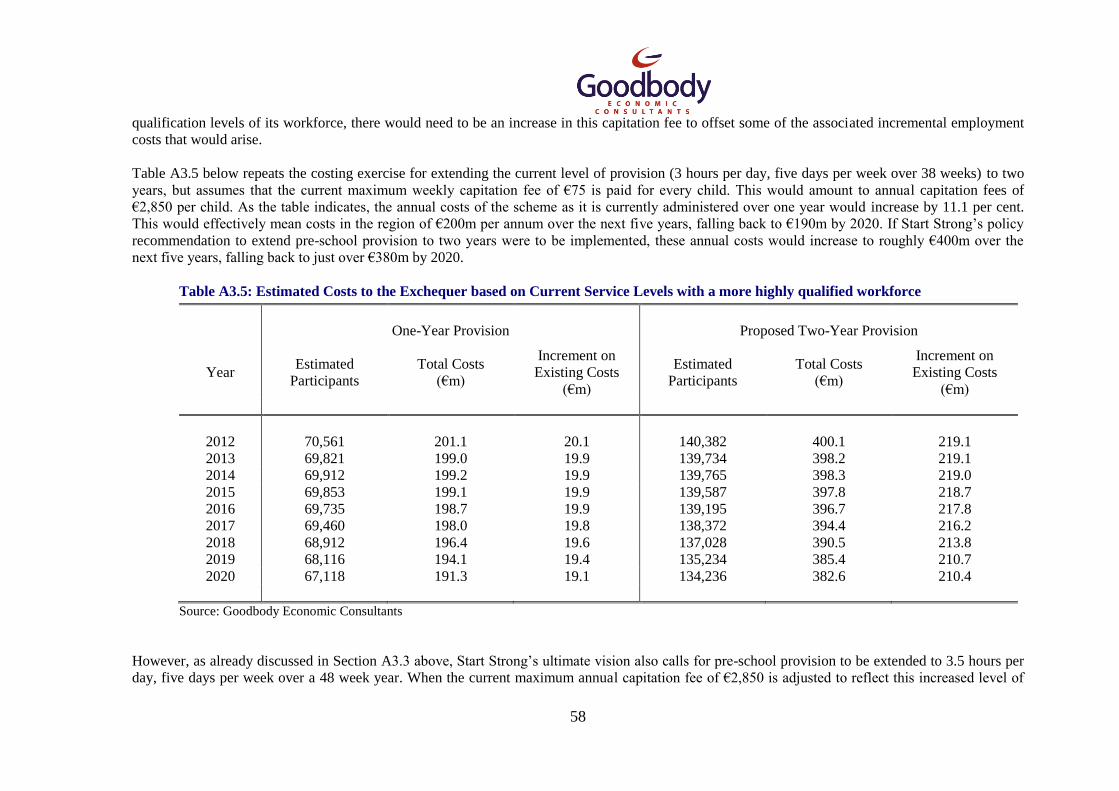
58
qualification levels of its workforce, there would need to be an increase in this capitation fee to offset some of the associated incremental employment
costs that would arise.
Table A3.5 below repeats the costing exercise for extending the current level of provision (3 hours per day, five days per week over 38 weeks) to two
years, but assumes that the current maximum weekly capitation fee of €75 is paid for every child. This would amount to annual capitation fees of
€2,850 per child. As the table indicates, the annual costs of the scheme as it is currently administered over one year would increase by 11.1 per cent.
This would effectively mean costs in the region of €200m per annum over the next five years, falling back to €190m by 2020. If Start Strong‟s policy
recommendation to extend pre-school provision to two years were to be implemented, these annual costs would increase to roughly €400m over the
next five years, falling back to just over €380m by 2020.
Table A3.5: Estimated Costs to the Exchequer based on Current Service Levels with a more highly qualified workforce
One-Year Provision Proposed Two-Year Provision
Year Estimated
Participants
Total Costs
(€m)
Increment on
Existing Costs
(€m)
Estimated
Participants
Total Costs
(€m)
Increment on
Existing Costs
(€m)
2012 70,561 201.1 20.1 140,382 400.1 219.1
2013 69,821 199.0 19.9 139,734 398.2 219.1
2014 69,912 199.2 19.9 139,765 398.3 219.0
2015 69,853 199.1 19.9 139,587 397.8 218.7
2016 69,735 198.7 19.9 139,195 396.7 217.8
2017 69,460 198.0 19.8 138,372 394.4 216.2
2018 68,912 196.4 19.6 137,028 390.5 213.8
2019 68,116 194.1 19.4 135,234 385.4 210.7
2020 67,118 191.3 19.1 134,236 382.6 210.4
Source: Goodbody Economic Consultants
However, as already discussed in Section A3.3 above, Start Strong‟s ultimate vision also calls for pre-school provision to be extended to 3.5 hours per
day, five days per week over a 48 week year. When the current maximum annual capitation fee of €2,850 is adjusted to reflect this increased level of

59
service, it rises to €4,200 per child. Table A3.6 below sets out the estimated annual costs of providing this level of service for both one and two years in
the event that the workforce meets the qualification criteria currently set by the Department of Children and Youth Affairs.
As the table indicates, annual costs for one year of provision would rise to over €290m for the next five years, falling back to €280m by 2020. If the
same level of service were to be provided to each child for two years, these annual costs would amount to almost €590m over the next five years falling
back to €565m by 2020.
Table A3.6: Estimated Costs to the Exchequer based on Increased Service Levels with a more highly qualified workforce
One-Year Provision Proposed Two-Year Provision
Year Estimated
Participants
Total Costs
(€m)
Increment on
Existing Costs
(€m)
Estimated
Participants
Total Costs
(€m)
Increment on
Existing Costs
(€m)
2012 70,561 296.4 115.4 140,382 589.6 408.6
2013 69,821 293.2 114.2 139,734 586.9 407.8
2014 69,912 293.6 114.3 139,765 587.0 407.7
2015 69,853 293.4 114.2 139,587 586.3 407.1
2016 69,735 292.9 114.0 139,195 584.6 405.7
2017 69,460 291.7 113.6 138,372 581.2 403.0
2018 68,912 289.4 112.7 137,028 575.5 398.8
2019 68,116 286.1 111.4 135,234 568.0 393.3
2020 67,118 281.9 109.7 134,236 563.8 391.6
Source: Goodbody Economic Consultants

60
Annex 4. Extending Paid Parental Leave
Policy Recommendation: To incrementally introduce payment for parental leave so that paid leave is
available for the critical first twelve months for every child.
A4.1 Introduction
The only form of paid parental leave currently available in Ireland is maternity leave. Maternity
Benefit is payable to women who have a certain number of paid PRSI contributions on their social
insurance record and who are in insurable employment up to the first day of their maternity leave.
Maternity Benefit is currently paid for 26 weeks. Maternity leave may be taken up to 16 weeks before
the end of the week that the baby is due, and it must be taken at least 2 weeks before.
The vision of Start Strong is that public support should make it possible for children to be primarily
cared for at home by a parent or guardian for the first year or more of their lives. Research evidence
suggests that children benefit where a parent is enabled to remain at home with a child for the first
year through paid parental leave. It is essential that this parental leave is paid if it is to be
economically feasible for a parent to remain at home for this critical period.
To achieve this, the current provision of six months‟ maternity leave should be followed by at least
six further months of paid parental leave, which could be taken by either parent, to ensure a minimum
entitlement of twelve months at home for each child.
For the purposes of this report, the term „parental leave‟ as it is used herein includes the current
provision for maternity leave.
A4.2 Current Scheme Costs
The weekly rate of maternity benefit payable is calculated as 80 per cent of an individual‟s average
gross weekly income as earned in the second last complete income tax year, with minimum and
maximum cut-off points. The current maximum weekly rate is €262 and the minimum is €217.80 but
individuals who are already on certain other social welfare payments40
receive maternity benefit at
half these rates. For individuals with qualified dependants, the rate of Maternity Benefit is compared
to the rate of Illness Benefit that the individual would be paid if they were absent from work through
illness, and the higher of the two rates is paid. In such instances the rate of Maternity Benefit payable
may exceed the €262 threshold.41
In March 2006 the maximum duration of Maternity Benefit was increased from 18 to 22 weeks. It was
increased again to 26 weeks in March 2007. This means that annual data are only fully comparable
from 2008 onwards. It should also be noted that the minimum and maximum rates have changed over
the last four years, as indicated in Table A4.1 below.
40
These other social welfare payments include: One-Parent Family Payment; Widow‟s Pension (contributory or
non-contributory); Deserted Wife‟s Benefit; Prisoner‟s Wife‟s Allowance; Deserted Wife‟s Allowance; and
Death Benefit by way of Widow‟s/Widower‟s or Dependent Parents‟ Pension. 41
For example, a woman with two children whose partner is unemployed and signing on for unemployment
credits, would receive a weekly Maternity Benefit payment of €385.70, which includes an increase for a
qualified adult and an increase for two qualified children.

61
Table A4.1: Minimum and Maximum Weekly Rates of Maternity Benefit, 2008-2010
Year Minimum Weekly Rate (€) Maximum Weekly Rate (€)*
2008 221.80 280.00
2009 230.30 280.00
2010 225.80 270.00
2011 217.80 262.00
Source: Department of Social Protection
*Note: The Maximum Weekly Payment may be exceeded if the individual has qualified dependents.
As data on maternity benefit paid in 2010 are not yet available, Table A4.2 below sets out the data on
benefit paid in 2008 and 2009. The total number of awards made in each year exceeded 48,000, but
with Maternity Benefit only being payable for 26 weeks, the average number of weekly recipients was
21,240 in 2008, increasing to 23,728 in 2009. Total exchequer expenditure on the scheme amounted
to €315.9m in 2008 and €331.3m in 2009, with average weekly payments of €286 and €268.52
respectively. The average weekly payment of €286 in 2008 seems high as it exceeds the maximum
weekly rate of €280 for that year, but it is possible that there was a higher proportion than usual of
recipients with qualified dependents that year, who might have received equivalent increases in their
rates.
Table A4.2: Total Annual Expenditure on Maternity Benefit, 2008 & 2009
Year Total Claims
Awarded
Average No. of
weekly Recipients
Average Weekly
Payment (€)
Total Annual
Expenditure
(€‟000s)
2008 48,037 21,240 286.00 315,878
2009 48,367 23,728 268.52 331,319
Source: Department of Social Protection Statistics
A4.3 The Costs to the Exchequer of Extending the Scheme
A4.3.1 General Approach
To estimate the exchequer costs that would arise if the current scheme of paid maternity leave were to
be extended to 52 weeks of paid parental leave, it is necessary to consider a number of factors. In the
first instance, there is a need to establish forecasts of the number of births that are likely to occur over
the coming years. These data will then give rise to forecasts of the number of parents who may claim
a benefit for parental leave, which when applied to estimates of average weekly payments, will give
rise to forecasts of overall exchequer costs.
The same forecasts of births as used in Section A3.3 above are employed here, derived using the
annual growth rates in the number of births as forecast in the CSO F1M0 projections and the total
number of births recorded in 2009. They are set out in Table A4.3 below.

62
Table A4.3: Forecast Number of Births, 2010-2020
Year Forecast Number of Births
2010 74,375
2011 74,311
2012 74,186
2013 73,894
2014 73,311
2015 72,464
2016 71,403
2017 70,289
2018 69,098
2019 67,785
2020 66,329
Source: CSO
A4.3.2 Forecast Parental Leave Benefit Claims
The data for 2008 and 2009 indicate that Maternity Benefit awards accounted for roughly 65 per cent
of births, which is in keeping with current labour force participation rates for married women of
typical child-bearing age in Ireland.
Table A4.4: Maternity Benefit Awards as a percentage of Total Births, 2008 & 2009
Year Number of Births Maternity Benefit
Awards Made
Benefit Awards as a
percentage of Births (%)
2008 75,065 48,037 64.0
2009 74,278 48,367 65.1
Source: CSO; Department of Social Protection
If it is assumed that this rate of 65.0 per cent will remain fairly constant over the next ten years, it is
possible to derive estimates of the number of parental leave benefit awards that might be made.

63
Table A4.5: Estimated Number of Maternity Benefit Awards, 2015-2020
Year Forecast Number
of Births
Proportion of births that
will relate to a Parental
Leave Benefit Award
(%)
Forecast Number
of Parental Leave
Awards
2012 74,186 65.0 48,221
2013 73,894 65.0 48,031
2014 73,311 65.0 47,652
2015 72,464 65.0 47,102
2016 71,403 65.0 46,412
2017 70,289 65.0 45,688
2018 69,098 65.0 44,914
2019 67,785 65.0 44,060
2020 66,329 65.0 43,114
Source: Goodbody Economic Consultants
A4.3.3 The Costs to the Exchequer
For the purposes of this report it is assumed that parental leave would be paid at the same rate as
currently applies to maternity benefit. The average weekly Maternity Benefit payment made in 2009
amounted to €268.52 per recipient. It should be noted that the minimum and maximum rates in 2009
were €230.30 and €280 respectively, but have both since been reduced to €217.80 and €262.
However, the method for calculating an individual‟s entitlement remains the same. For this reason,
two estimates of average weekly rates are applied in the calculations below giving rise to low and
medium forecasts of total exchequer costs.
The first approach relates the average weekly payment in 2009 to the upper threshold of €280 for that
year and applies this relationship to the current upper threshold of €262, giving rise to a forecast
weekly payment of €251.26. The second approach assumes that the average weekly payment will
reach the current threshold of €262 because the method for calculating an entitlement remains
unchanged and the majority of payments received tend to be at the higher end of the payment scale
and so wouldn‟t be greatly affected by the reduced lower threshold.
These average weekly rates are then multiplied out by the number of forecast beneficiaries and the
total number of weeks for which the payments are made. As tables A4.6 and A4.7 indicate, the
additional annual costs associated with extending the current provision of 26 weeks to 52 weeks of
parental benefit would be in the region of €308m to €321m in 2015. If the birth rate does decline as
assumed in the population forecasts, these additional costs would fall back to between €282m and
€294m by 2020.

64
Table A4.6: Low Scenario Forecasts of Exchequer Costs
Year Forecast Number of
Parental Leave
Benefit Recipients
Average Weekly
Payment
(€)
Current Cost
@ 26 weeks
(€‟m)
Cost @ 52
weeks
(€‟m)
2012 48,221 251.26 315.0 630.0
2013 48,031 251.26 313.8 627.5
2014 47,652 251.26 311.3 622.6
2015 47,102 251.26 307.7 615.4
2016 46,412 251.26 303.2 606.4
2017 45,688 251.26 298.5 596.9
2018 44,914 251.26 293.4 586.8
2019 44,060 251.26 287.8 575.7
2020 43,114 251.26 281.7 563.3
Source: Goodbody Economic Consultants
Table A4.7: Medium Scenario Forecasts of Exchequer Costs
Year Forecast Number of
Parental Leave
Benefit Recipients
Average Weekly
Payment
(€)
Current Cost
@ 26 weeks
(€‟m)
Cost @ 52
weeks
(€‟m)
2012 48,221 262.00 328.5 657.0
2013 48,031 262.00 327.2 654.4
2014 47,652 262.00 324.6 649.2
2015 47,102 262.00 320.9 641.7
2016 46,412 262.00 316.2 632.3
2017 45,688 262.00 311.2 622.5
2018 44,914 262.00 306.0 611.9
2019 44,060 262.00 300.1 600.3
2020 43,114 262.00 293.7 587.4
Source: Goodbody Economic Consultants
It is worth noting that these cost estimates assume the same take-up rate for the proposed 52 weeks of
parental leave as currently applies to the existing provision of 26 weeks of maternity leave. As such,
the estimates reflect the upper end of the proposed scheme‟s potential costs as the level of take-up in
the second six months may transpire to be lower than that in the first six months.
A4.4 Meeting International Standards
As already described in Section A2.2.3, UNICEF have developed a number of internationally
applicable minimum standards for early childhood care and education aimed at protecting the rights of
children in their most vulnerable and formative years. One of these standards relates to the provision
of paid parental leave of one year at a rate of 50 per cent of a parent‟s salary. With this in mind,
estimates have also been made to give an indication of the costs that would be involved if this
standard were to be met in Ireland.

65
The CSO collect data on average earnings on a quarterly basis by way of the Earnings, Hours and
Employment Costs Survey (EHECS), which covers all sectors of employment. The most recent data
relates to the third quarter of 2010 and suggests that average weekly earnings currently stand at
€685.10 per employee. If parental leave were to be paid at 50 per cent of a parent‟s salary, this would
suggest an average weekly rate of €342.55, which is 30 per cent more than the current maximum
weekly payment. Table A4.8 repeats the cost estimates for a full year of leave but at this higher rate of
payment.
As the table suggests, a full year of parental leave payable at 50 per cent of a parent‟s salary would
amount to estimated total annual costs in the region of €850m over the period to 2015, falling back to
€770m by 2020.
Table A4.8: Forecasts of Exchequer Costs if International Standards on Paid Parental
Leave were to be met
Year Forecast Number of
Parental Leave Benefit
Recipients
Average Weekly
Payment
(€)
Cost @ 52 weeks
(€‟m)
2012 48,221 342.55 858.9
2013 48,031 342.55 855.6
2014 47,652 342.55 848.8
2015 47,102 342.55 839.0
2016 46,412 342.55 826.7
2017 45,688 342.55 813.8
2018 44,914 342.55 800.0
2019 44,060 342.55 784.8
2020 43,114 342.55 768.0
Source: Goodbody Economic Consultants

66
Annex 5. Introducing Paid Paternity Leave
Policy Recommendation: To introduce legislation to provide for at least two weeks‟ paid paternity
leave for fathers.
A5.1 Introduction A number of policy-related barriers currently exist that prevent men from realising the full potential of
their caring roles. For instance, many fathers who would like to take up more active parenting roles
are constrained by expectations within the workplace that men should not take up work-life balance
opportunities. Such expectations can be changed by altering incentives, for instance by providing paid
parental leave opportunities as described in Section A4.1 above, and by introducing a period of paid
paternity leave at the time of the birth of the child.
The State does not currently make any provisions for paid paternity leave for the fathers of newborn
children. Some employers do have a policy of providing special paid leave that is in addition to
annual leave but this is provided at the discretion of the employers who also bear the full associated
costs.
A5.2 Forecasting Paternity Benefit Claims
To estimate the annual exchequer costs that would arise if legislation were introduced providing for 2
weeks‟ paid paternity leave for fathers, a number of factors need to be considered. In addition to the
forecast number of births, there is a need to consider what proportion of fathers would be in paid
employment as only men who have paid PRSI contributions on their social insurance record and who
are in insurable employment would be entitled to the benefit.
The same forecasts of births as used in Sections A3.3 and A4.3 above are employed here, derived
using the annual growth rates in the number of births as forecast in the CSO F1M0 projections and the
total number of births recorded in 2009. These data are used as an indication of the potential number
of paternity benefit awards that might arise each year.
Then by applying forecast rates of employment to these numbers, it is possible to derive estimates of
the number of fathers that would be entitled to paternity benefit.
Table A5.1: Estimated Number of Paternity Benefit Awards, 2015-2020
Year Forecast Number of
Fathers
Employment Rate*
(%)
Forecast Number
of Paternity Benefit Awards
2012 74,186 86.9 64,468
2013 73,894 87.8 64,879
2014 73,311 88.6 64,954
2015 72,464 89.4 64,783
2016 71,403 90.1 64,334
2017 70,289 90.7 63,753
2018 69,098 91.3 63,087
2019 67,785 91.9 62,294
2020 66,329 92.5 61,354
Source: Goodbody Economic Consultants
*Note: This includes both employed and self-employed persons.

67
A5.3 The Costs to the Exchequer
It is reasonable to assume that paternity benefit would be paid at the same rate as maternity benefit,
with entitlements also calculated in the same way. For the purposes of this report the costs are
estimated using the current maximum weekly payment threshold for maternity benefit of €262.00, the
underlying assumption being that men tend to earn higher salaries than women, and as such would be
entitled to a weekly benefit at the upper end of the scale.
As Table A5.2 indicates, the introduction of two weeks‟ paid paternity leave for fathers would result
in exchequer costs in the region of €34m per annum in 2015. If the birth rate does decline as assumed
in the population forecasts, these additional costs would fall marginally to roughly €32.1m per annum
by 2020.
It should be noted that these cost estimates are a maximum as they are based on the assumption that
all fathers are carers of their children and as such would be entitled to paid paternity leave if they were
employed. They also assume a 100 per cent take-up rate by working fathers which may not turn out to
be the case.
Table A5.2: Forecasts of Exchequer Costs
Year Forecast Number
of Paternity Benefit Awards
Average Weekly
Payment
(€)
Cost @ 2 weeks
(€‟m)
2012 64,468 262.00 33.8
2013 64,879 262.00 34.0
2014 64,954 262.00 34.0
2015 64,783 262.00 34.0
2016 64,334 262.00 33.7
2017 63,753 262.00 33.4
2018 63,087 262.00 33.1
2019 62,294 262.00 32.6
2020 61,354 262.00 32.1
Source: Goodbody Economic Consultants

68
Annex 6. Developing Early Childhood Hubs
Policy Recommendation: To roll out a national programme for the development of early childhood
hubs, following a full evaluation of initial models.
A6.1 Introduction
The Children 2020 Report identifies early childhood hubs as a possible model for improving
accessibility to and expanding the range of services for children and their parents.
It is envisaged that the hubs would build on the work already done at local level by organisations such
as the Family Resource Centres and at county level by County and City Children‟s Services
Committees and County and City Childcare Committees.
In order to establish indicative costs for such hubs it is necessary to identify the scale at which these
hubs would be provided, the mechanism for their delivery and the services that they would provide.
This is turn raises the following issues:
What are the objectives set for development of ECEC services?
What are the gaps in provision through existing mechanisms?
What are the options available to meet these gaps? and
If childcare hubs are the solution, what are the services that they should provide and on what
scale should they be instituted?
This Section of the Report sets out to begin the process of clarifying these issues.
A6.2 Objectives
For the purposes of examining the need for a Hub system, a number of objectives may be identified
from the Children 2020 report as follows:
Integration: a need is identified to provide a more integrated set of services for children. Integration
implies logistically and or physically proximate delivery of services while co-ordination refers to
separate service providers working together to deliver services. An aspect of co-ordination is the
signposting of services so that clients can readily access all the services that they require.
Access: Children 2020 emphasises the need for access to services at a local level and for universal
provision.
Holistic Approach: the need for the seamless delivery of services to children as they advance through
the life cycle is identified as well as the linkage of supports for parents and children.
High Level of Provision of Quality Services: The provision of services must reflect societal needs
and be of high quality.
A6.3 Existing Institutional Provision
The services to be integrated or co-ordinated include childcare, early education, health, child
protection and parental supports. There are a number of dimensions to service provision: information,
advice, advocacy and service delivery.

69
There a number of institutions already engaged in service delivery in some or all these areas. These
are:
The Public Health system;
Family Resource Centres;
County and City Child Care Committees; and
Children‟s Services Committees.
A6.4 Elaborating the Proposal for Early Childhood Hubs
The proposal to develop early childhood hubs aims to address a gap in the system at present.
However, in order to cost such an approach it would be necessary to identify a number of aspects as
follows:
The geographical level at which they would be rolled out;
The status of provision: wholly State provided, provided through the voluntary sector or a
mix; and
The services that would be provided.
With regard to the latter, it is not clear that a comprehensive gap analysis has been undertaken to
identify both the type and scale of services that are required. This could be a focus of the further
research that is envisaged in the Children 2020 Report.

70
Bibliography
An Accessible Childcare Model (National Women‟s Council of Ireland, 2005)
Age 26 Cost-Benefit Analysis of the Child-Parent Center Early Education Program, Arthur J
Reynolds et al. in Child Development, vol.82, no.1, (2011).
Benefits, Costs and Explanation of the High/Scope Perry Pre-School Programme, Lawrence J.
Schweinhart (High/Scope Educational Research Foundation, 2003).
The Benefits and Costs of Good Child Care: The Economic Rationale for Public Investment in Young
Children – A Policy Study, Gordon Cleveland & Michael Krashinsky (University of Toronto at
Scarborough, 1998).
Benefits of Maternity/Parental Leave in the EU27: A Review of the Literature, Davaki, Konstantina
(London School of Economics and Political Science), in Costs and Benefits of Maternity and
Paternity Leave, Directorate-General for Internal Policies (European Parliament, 2010).
The Chicago Child-Parent Centres: A Longitudinal Study of Extended Early Childhood Intervention,
Arthur J. Reynolds (Institute for Research on Poverty, 1997).
The Chicago Longitudinal Study: A Study of Children in Chicago Public Schools, Arthur J. Reynolds
(1999).
The Child Care Transition: A league table of early childhood education and care in economically
advanced countries. UnicefUNICEF, 2008
Developing the Workforce in the Early Childhood Care and Education Sector: Background
Discussion Paper. Department of Education & Science, 2009
Early Childhood Development: the best start for all South Australians, Dr. J. Fraser Mustard
(Government of South Australia, 2008).
Early Childhood Education for All: A Wise Investment, Leslie J. Calman & Linda Tarr-Whelan
(Family Initiative, 2005).
The Early Development and Health Benefits of Maternity Leave Mandates, Baker, M. (University of
Toronto and NBER) & Milligan, K. (University of British Columbia and NBER) (2006).
Early Parental Time Investments in Children’s Human Capital Development: Effects of Time in the
First Year on Cognitive and non-Cognitive Outcomes, Neidell, M. J., (UCLA Department of
Economics, 2000 – Working Paper 806).
The Economics of Childcare in Ireland, Goodbody Economic Consultants commissioned by Area
Development Management Ltd on behalf of the Department of Justice, Equality and Law Reform
(1998).
The Economics of Early Childhood Care and Education, Dr. Arnaud Chevalier, Ms. Claire Finn, Prof.
Colm Harmon & Dr. Tarja Viitnen (National Economic and Social Forum, 2006).
The Economics of Investing in Universal Preschool Education in California, Lynn A. Karoly & James
H. Bigelow (2005).

71
The Effective Provision of Pre-School Education (EPPE) Project: Final Report, Kathy Sylva, Edward
Melhuish, Pam Sammons, Iram Siraj-Blatchford & Brenda Taggart (Department for Education &
Skills, 2004).
The Effective Provision of Pre-School Education (EPPE) Project: Final Report, from the Primary
Phase, Kathy Sylva, Edward Melhuish, Pam Sammons, Iram Siraj-Blatchford & Brenda Taggart
(Department for Education & Skills, 2008).
Exceptional Returns: Economic, Fiscal and Social Benefits of Investment in Early Childhood
Development, Robert G. Lynch (Economic Policy Institute, 2004).
Final Report from the Primary Phase: Pre School and Family Influences on Children’s Development
During Key Stage 2. Sylva, K. et al. Research Report no.2, 2008
Fully Paid Paternity Leave of 2 Weeks: Impact Assessment, Thomsen, H. & Urth, H. (RAMBOLL), in
Costs and Benefits of Maternity and Paternity Leave, Directorate-General for Internal Policies
(European Parliament, 2010).
The High/Scope Perry Preschool Program: Cost-Benefit Analysis using data from Age 40 Follow-Up,
Clive R. Belfield, Milagros Nores, Steve Barnett, and Lawrence J. Schweinhart. (2007).
The High/Scope Perry Preschool Study Through Age 40: Summary, Conclusions and Frequently
Asked Questions, Lawrence J. Schweinhart, Ph.D. (2005).
Investing in our Children: What we know and don’t know about the Costs and Benefits of Early
Childhood Interventions, Karoly, L. A., Greenwood, P. W., Everingham, S. S., Hoube, J., Kilburn, M.
R., Rydell, C. P., Sanders, M. & Chiesa, J. (1998).
A New Cost-Benefit and Rate of Return Analysis for the Perry Preschool Programme: A Summary,
Heckmann, J. J., Moon, S. H., Pinto, R., Savelyev, P., and Yavitz, A. (2010).
The Productivity Argument for Investing in Young Children, James J. Heckman & Dimitriy V.
Masterov (2007).
The Rate of Return to the High/Scope Perry Pre-School Programme (UCD Geary Institute Discussion
Paper Series), Heckmann, J. J., Moon, S. H., Pinto, R., Savelyev, P., and Yavitz, A. (2009).
Quality Costs: paying for Early Childhood Education and Care, Kate Goddard & Emma Knights
(Daycare Trust, 2009).
Quarterly National Household Survey – Special Module on Childcare (CSO, July 2009)
Strong Foundations: Early Childhood Care and Education (UNESCO, 2006)
Well-being Matters: A Social Report for Ireland (Volume II) (NESC, 2009)