Embed Size (px)
Citation preview

3
Dental Anthropology 2020 │ Volume 33 │ Issue 01
Childhood Variation in Skeletal and Dental Development
Anna L.M. Rautman1,2* and Heather J.H. Edgar1,2 1 Department of Anthropology, University of New Mexico 2 Office of the Medical Investigator, University of New Mexico School of Medicine, Albu-querque, New Mexico
The skeletal and dental systems have long been subjects of study in humans. Existing studies of the two systems focus either on the sample mean ex-pression or on the correlation between the two sys-tems across the entire sample. This paper examines whether the variation between the systems’ devel-opmental trajectories varies between individuals who were delayed, average, or advanced in their development at an early age. Individuals within the average subgroup are included as a baseline with which to compare how the developmental trajectories of delayed and advanced individuals differ. The general order and timing of how a juvenile develops into an adult is consistent among individ-uals. Here, development is used to refer to the change and refinement in shape of objects from their juvenile form to their completed adult ap-pearance (Greulich & Pyle, 1959; Moorrees, Fan-ning, & Hunt, 1963). This is to differentiate devel-opment from growth, which refers to changes in size (Ogden et al., 2002; WHO Multicenter Growth Reference Study Group, 2006). The overall order of development, the order at which different bones and epiphyses form and fuse or teeth mineralize, is canalized. Canalization refers to the fact that de-
velopmental reactions “adjust so as to bring about one definite end-result regardless of minor varia-tions in conditions during the course of the reac-tion” (Waddington, 1942:563). The canalization of the skeletal and dental systems has long lent these systems to being used to estimate chronological age (Greulich & Pyle, 1959; Moorrees, Fanning, & Hunt, 1963; Tanner, 1978). As the development of the skeletal and dental systems roughly correspond to chronological age, it follows that the two systems should be correlat-ed. The correlation is not perfect due to variation between, and even within, individuals. Variation within and between individuals is inherent to can-alization (Flatt, 2005; Waddington, 1942). A pletho-
ABSTRACT The existing research comparing variation in developmental timing of skeletal and dental systems has focused on cross-sectional correlations of group means throughout late childhood. We used a longitudinal sample of 100 White American girls to compare developmental variation from 3-12 years to improve our understanding of developmental variation. The sample was divided into two sets (dental and skeletal) of three subgroups (delayed, average, or advanced) based on development at age three. Repeated measure ANOVA and Tukey’s HSD analyses examined the longitudinal maturation of: 1) skeletal development of skeletal subgroups, 2) dental development of skeletal subgroups, 3) dental development of dental subgroups, and 4) skeletal development of dental subgroups. The four models demonstrated significant differences between subgroup developmental trajectories. Pairwise comparisons of same-system development (analyses 1 and 3) found all comparisons to be sig-nificant; this was not the case for pairwise comparisons across systems (analyses 2 and 4). Only the ad-vanced group was consistently different across all combinations. Results suggest that the pace of development differs among delayed, average, and advanced individu-als, and between dental and skeletal systems. Therefore, to fully explore the relationship between the systems, the full range of variation in the timing of development is required.
*Correspondence to: Anna L.M. Rautmann Department of Anthropology University of New Mexico Albuquerque, New Mexico [email protected] This paper was the recipient of the Albert A. Dahlberg prize awarded by the Dental Anthropology Association in 2019.
Keywords: dental development, skeletal development, inter-individual variation

4
Dental Anthropology 2020 │ Volume 33 │ Issue 01
ra of environmental, genetic, and epigenetic factors contributes to the range of variation. Regardless of the cause or influence, the entire range of skeletal and dental developmental variation between peo-ple is the inter-individual variation in develop-
mental timing (IVDT). The environment can influence IVDT either as developmental stressors (nutritional or pathologi-cal) or via developmental plasticity. Developmen-tal plasticity is the phenotypic response to the envi-ronment given an individual’s genetic and epige-netic profile (Hochberg et al., 2011; Houston & McNamara, 1992; Kuzawa, 2012; Wang et al., 2014). Genetic variation and developmental plastic varia-tion are susceptible to evolutionary forces, referred to at the inter-species level as heterochrony (Bogin, 1997; Love, 2014). An example of genetic and epi-genetic differences in IVDT include the known dif-ference between the sexes (Badyaev, 2002; Ogden et al., 2002); males are known to develop more slowly on average than females (Badyaev, 2002; Greulich & Pyle, 1959). Differences in ancestry also must be considered when using developmental timing standards, as a method developed for one population may not be accurate for another population. This can result in either under or overestimation of an individual’s developmental age (Haiter-Neto, Kurita, Menezes, & Casanova, 2006; Zhang, Sayre, Vachon, Liu, & Huang, 2009). Additionally, differences in popula-tion histories (e.g. famine or slavery) can delay or slow the development of disadvantaged groups(Jasienska, 2013; Ribot & Roberts, 1996). Non-evolutionary related variation over time also can occur. This is secular change, which is of-ten associated with variation in environments such as improved nutrition and increased caloric intake (Garn, 1987). While the effects of secular change on the skeletal system and on total body size have been known for well over a century (Boas, 1912), the possibility of secular change affecting the den-tal system is a more recent field of study (Cardoso, Heuze, & Julio, 2010; Nadler, 1998; Rautman & Ed-gar, 2013). Regardless of the many causes, origins, and types, the entire range of variation is included in IVDT. When the two systems are compared to each other, rather than to chronological age, a common finding is that the skeletal system is more suscepti-ble to environmental and developmental stressors than is the dental (Cardoso, 2007b, 2007a; Demi-rjian, Buschang, Tanguay, & Kingnorth Patterson, 1985; Flores-Mir, Mauicio, Orellena, & Major, 2005; Lewis & Garn, 1960). Large discrepancies between
chronological age and either skeletal or dental age may be an indicator of an underlying disease or condition or of some other developmental stressor. Numerous studies of the skeletal and dental systems have considered the systems individually and together (Cardoso, 2007b; Hunt & Gleiser, 1955; Lauterstein, 1961; Lewis & Garn, 1960). Exist-ing studies comparing the development primarily focus on mean/median/modal developmental phenotype, or else the correlation across the entire sample. The mean (most commonly reported) phe-notype is crucial to understanding the develop-ment of that phenotype. However, the mean ex-pression is not informative about the range of pos-sible variation. Such studies assume that the ap-proach to development is the same across the range of IVDT, and that the mean expression is sufficient. By reporting or considering standard deviation in addition to the mean, more focus is placed on the range of variation (Al-Juboori, Sa-loom, & Al-Bustani, 2012; Bagherpour, Pousti, & Adelianfar, 2014; Gupta, Divyashree, Abhilash, Bijle, & Murali, 2013; Sachan, Sharma, & Tandon, 2011). Similarly, studies which utilize correlations do consider the entire range of variation (Anderson, Thompson, & Popovich, 1975; Arora, 2009; Bagherpour et al., 2014; Lauterstein, 1961; Saglam & Gazilerli, 2002). Such studies assume that the skeletal and dental correlation is the same across the entire range of IVDT. They ignore the possibility that the relationship between the sys-tems may vary through the IVDT range. The current research considers whether the rela-tive relationship between the skeletal and dental systems is the same throughout the range of IVDT by comparing the correlation of skeletal and dental development between subgroups whose skeletal or dental development was delayed, average, or ad-vanced early in life. Subgroups are here defined independently by either the completed skeletal or dental development at age three. The entire sample was divided into subgroups each with 20% of the total IVDT. Of the resulting five quantiles per sys-tem (five skeletal and five dental), only three per system were considered in the subsequent analy-sis. These three were those 20% who were delayed; those who were average, the middle 20%; and those 20% who were advanced, all at age three. The delayed, average, and advanced skeletal quan-tiles were based on percentage of completed skele-tal development at age three; while the delayed, average, and advanced dental quantiles were based on percentage of completed dental develop-ment at age three. The subsequent skeletal and

5
Dental Anthropology 2020 │ Volume 33 │ Issue 01
dental development of each quantile were com-pared. The null hypothesis was that the relation-ship would be the same between the three skeletal quantiles and between the three dental quantiles. However, we predicted that the developmental trajectories would vary between those who were delayed, average, or advanced at age three. If the developmental trajectories were to vary between the three quantiles per system’s IVDT, this would indicate that the relationship between the skeletal and dental systems is more complicated than is understood from the general assumption based on a consideration only of means or total sample cor-relations. This analysis of IVDT does not address the cause of the observed variation, nor should the findings be interpreted as being the result of a spe-cific cause of variation. Materials and Methods The sample consists of 100 healthy females from the Bolton-Brush Growth Study, who were de-scribed by the study designers as White, of seem-ingly normal development, and who were without known major pathological conditions. Only one sex was considered for this study to avoid poten-tial complication based on known sex differences in rates of development (Greulich & Pyle, 1959; Stinson, 1985). In order to remove sex as a con-founding variable females were chosen as they de-velop more quickly than males (Greulich & Pyle, 1959; Humphrey, 1998). The Bolton-Brush Growth Study is a combina-tion of two related studies, the Brush Inquiry and Broadbent-Bolton Study, both of which began in the late 1920s in Cleveland, Ohio. The Brush In-quiry began in 1926 (Nelson, Hans, Broadbent Jr., & Dean, 2000) (or 1928 (Behrents, 1984)) in order to study how healthy, normal children grew and de-veloped (Nelson et al., 2000). Included among the data from this study are radiographs of the post-cranial skeleton, information on the mental and physical health and growth of the child, and infor-mation about the child’s family and home environ-ment (Nelson et al., 2000). In 1929, the Broadbent-Bolton Study began with the initial purpose of un-derstanding the dentofacial growth and develop-ment of normal, healthy children (Hans, Broadbent Jr., & Nelson, 1994). This study included radio-graphs of the head and the hand-wrist, dental casts, and information on the health and develop-mental environment of each child. Although the two studies were independent, many participants were included in both studies. Of those individuals in the Brush Inquiry, 73% also participated in the
Broadbent-Bolton Study, while 67% of those in the Broadbent-Bolton Study were also in the Brush Inquiry (Hans et al., 1994; Nelson et al., 2000). Not all participants joined the studies at the same age. However, participants were seen every three months when less than one-year-old, every six months from one to five years old, and once a year after age five. The selection criteria for the present study were that each girl must have been seen within three months of her third, sixth, ninth, and 12th birthday. In cases in which pairs of sisters were seen at all four ages, only one sister was included. Birth dates ranged from January 1928 to May 1934 and were distributed as evenly as possible during this win-dow. For each visit, the lateral cranial and hand-wrist radiographs were used to measure skeletal and dental development. Skeletal and Dental Development The level of skeletal development was determined by visual observation of left hand-wrist radio-graphs. The stage of development of 15 bones at 11 sites was determined using Greulich and Pyle’s atlas of hand and wrist development (Greulich & Pyle, 1959) to quantify the development of carpals, metacarpals, the radius, and ulna (Table 1). When a bone (e.g. trapezium) or epiphysis (e.g. first meta-carpal) had not yet begun ossification, it was scored “1” (Greulich & Pyle, 1959). When assign-ment to Greulich and Pyle’s Stage 1 stated that os-sification had already begun (e.g. scaphoid: “Stage 1: ossification usually begins from a single center, pg. 201), radiographs that showed no sign of ossifi-cation were scored as zero. Radiographs that were too blurry or out of focus to determine the devel-
Development Site Range of
Stages
Number of Stages
Proximal 1st phalanx 1 to 10 10
Distal 2nd – 4th metacarpals 1 to 9 9
Distal 5th metacarpal 1 to 9 9
Trapezium & 1st metacarpal 1 to 12 12
Trapezoid & 2nd metacarpal 1 to 10 10
Capitate & Hamate 0 to 10 11
Scaphoid 0 to 8 9
Lunate 0 to 8 9
Triquetral & Pisiform 0 to 8 9
Radius 1 to 11 11
Ulna 1 to 11 11
Table 1. Skeletal development sites (Greulich and Pyle, 1959) with the range of ordinal stages and the total number of stages used to calculate obtained level of development. Stage “0” was added and defined as pri-
or to the beginning of ossification.

6
Dental Anthropology 2020 │ Volume 33 │ Issue 01
opment at a site were scored as “non-observable” and excluded from further analysis. One author (ALMR) determined the level of attained dental development by visual examina-tion of the permanent dentition as observed from lateral radiographs. The presence or absence of each tooth was noted, as was the stage of develop-ment. Stages were determined using Moorrees et al. (1963) stages from AlQahtani et al.’s (2010)dental age estimation chart (Table 2). Due to the nature of lateral radiographs, differentiating the central versus lateral incisor was complicated and was solved by scoring only one, presumably the first central incisor in both the maxilla and mandi-ble. Although orthopantomograms are better suit-ed for observing individual tooth development, the Moorrees et al. (1963) method was developed based on lateral radiographs. Furthermore, or-thopantomograms are a more recent technological image and not commonly available in longitudinal studies such as the Bolton-Brush Growth Study. Additional teeth scored included maxillary and mandibular canines, third and fourth premolars, as well as first, second, and third molars. Siding was not possible, but only one tooth at each position was scored. When the quality of the radiograph or the angle prevented positively identifying a specif-
ic tooth, the tooth was scored as “non-observable.” Intra-Observer Error To test for consistent scoring, a subset of 20% of the radiographs were randomly selected to form an intra-observer data subset. This subset of 78 hand-wrist radiographs and 80 lateral cephalograms were then scored a second time. The numeric and “non-observable” scores per hand-wrist location and tooth were included. All scores within the in-tra-observer subset were compared between rounds of observations using a weighted Cohen’s Kappa test (Viera & Garrett, 2005) using the statis-tical package R x64 3.2.3. Data from repeat obser-vations were used only for the intra-observer test and were not included in further analyses. Developmental Level Scoring At each age, a composite score of percentage of attained skeletal and dental development was cal-culated for each individual. Hand-wrist radio-graphs with fewer than seven scored sites were excluded from analysis. Skeletal ordinal stages were converted into numbered levels (see Table 1). Ratios per site of percent development obtained were calculated based on the sites’ number of stag-es and then a composite score of average skeletal
Stage Description Stage Description
A-NP 0
Tooth absent, formation not yet begun. Com-parison between ages was used to distinguish
from congenitally absent teeth.
Crc
6
Crown complete with defined pulp roof
Ci 1
Initial cusp formation
Ri 7
Initial root formation
Cco 2
Coalescence of cusps
R ¼
8
Root length less than crown length. Poste-rior teeth have visible bifurcation area.
Coc 3
Cusp outline complete
R ½
9
Root length equals crown length
Cr ½ 4
Crown half complete with dentine formation
R ¾
10
Three quarters of root length developed with diverge ends
Cr ¾ 5
Crown three quarters complete
Rc+
12
Root length complete. With parallel ends or closed apex.
Table 2. Dental development stages (Moorrees et al., 1963; AlQahtani et al., 2010) and their description. The num-ber in the Stage column is the number used to calculate level of obtained development.

7
Dental Anthropology 2020 │ Volume 33 │ Issue 01
development was calculated. Similarly, lateral ra-diographs with fewer than eight scored teeth were excluded from analysis. The ordinal stages of den-tal development were converted into numbered levels (see Table 2), ranging from zero for teeth whose formation had yet to begin, to 12 for com-pletely formed teeth. Numeric levels were then converted to percentages of completed develop-ment and a composite score of average dental de-velopment was calculated. The final sample sizes of usable radiographs per age varied from 92 to 97 for skeletal development and 90 to 97 for dental development (Table 3a). Determining Quantile Subgroups: Delayed, Average, and Advanced Quantiles used for analysis included individuals who were delayed, average, or advanced in their skeletal or dental development at age three, repre-senting the range of normal variation. To define these quantiles, we divided the entire sample into two matched sets of five subgroups. Each set of quantiles was defined either by the percentage of completed skeletal development (skeletal quan-tiles) or the percentage of completed dental devel-opment (dental quantiles) at age three. When de-fining each set of quantiles, the systems were con-sidered independently. Therefore, an individual’s ranking of skeletal development influenced only their classification in the skeletal quantiles and did not influence the placement in the dental quantiles, and vice versa. The delayed quantile includes those individuals who had achieved the least amount of development, those in the lowest 20th percentile. The average quantile included individu-als in the middle quantile, those whose develop-ment was between the 40th and 60th percentiles. The advanced quantile contained the most develop-mentally advanced individuals, those in the high-est 20th percentile. Subsequent analyses comparing developmental trajectories were based on two sets of three quan-tiles: delayed, average, and advanced skeletal devel-opment quantiles; and delayed, average, and ad-vanced dental quantiles. All six quantiles were of similar size (Table 3b). Although quantiles were defined based on one system at a time, some indi-viduals fell in quantiles of interest for both systems (Table 3c). By using these six quantiles, four ques-tions could be examined: For quantiles based on skeletal development:
1) How do the skeletal developmental trajectories compare between skeletal quantiles?
2) How do the dental developmental trajectories compare between skeletal quantiles? For quantiles based on dental development:
1) How do the dental developmental trajectories compare between dental quantiles? 2) How do the skeletal developmental trajectories compare between dental quantiles? Statistical Analysis Descriptive statistics were calculated for the total original sample and for each quantile of interest at all four ages. Additionally, attained development composite scores were plotted against exact chron-ological age. For each plot, logistic growth curves (Fox & Weisberg, 2010) were calculated and added to the plots. Repeated measure ANOVA was used to test the significance of statistical models based on each question. These statistical models incorpo-rated the composite score of obtained development
(a) Sample pre-quantiles assigned
Age Dental Skeletal Both
3 90 92 84
6 93 97 90
9 97 97 95
12 97 95 92
all ages 83 84 72
(b) Per quantile of interest by system
Delayed Mean Advanced
Skeletal development based quantiles (skeletal quantiles)
18 18 18
Dental development based quantiles (dental quantiles)
19 18 19
(c) Per quantiles of interest for both systems Skeletal quantiles
Delayed Mean Advanced
Dental quan-tiles
Advanced 3 6 4
Mean 3 1 4
Delayed 5 1 5
Table 3. Sample sizes after percent of obtained develop-ment was calculated. (a) Total sample size of usable radiographs prior to quantile assignment. (b) Sample size per skeletal and dental quantiles of interest. (c) Sample size of individuals who were in the quantiles of interest in both systems.

8
Dental Anthropology 2020 │ Volume 33 │ Issue 01
for a given system (Development) as the dependent variable and individual (Pt.ID), chronological age (Age), baseline quantile group (Q.subgroup), and the interaction of age and baseline quantile group as the independent variables, with repeated measures by individual (Pt. ID).
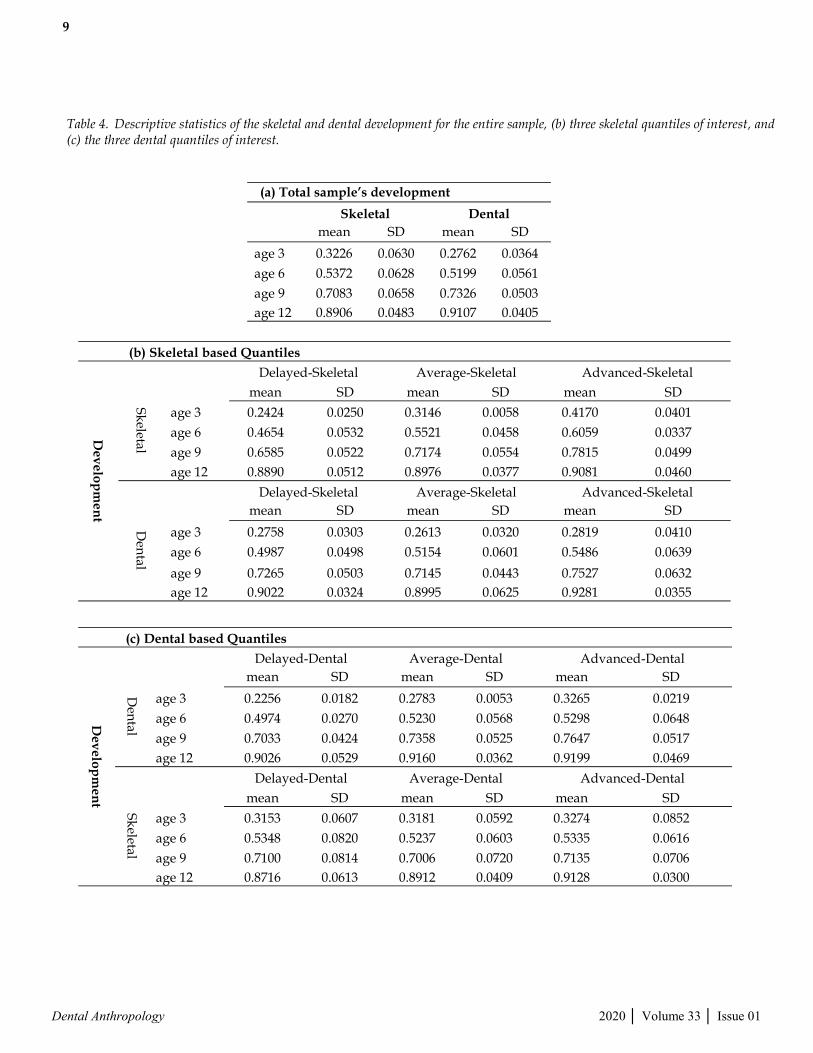
Development ~ Pt.ID +Age+ Q.subgroup Model 1 corresponds with the first question: How do the skeletal developmental trajectories compare between skeletal quantiles? Therefore, in Model 1 the dependent developmental variable is skeletal development, and the Q.subgroup are the three skeletal baseline quantile groups. Model 2 corresponds to the second question and uses den-tal development for the dependent variable, and uses the same three skeletal baseline quantile groups for the Q.subgroup. This pattern continues through the remaining two questions. When the repeated measure ANOVA showed the statistical model to be significant, a Tukey’s HSD (honest significant difference) test was run for pairwise comparison of quantile groups. Analyses were completed using R x64 3.2.3 and STATA/IC 11.2 statistical programs. Results Weighted Cohen’s Kappa test (Viera & Garrett, 2005) of intra-observer error showed consistent agreement in development scores. For dental de-velopment, the weighted Cohen’s Kappa was 0.811, demonstrating almost perfect agreement, while the weighted Cohen’s Kappa for skeletal de-velopment was 0.792, demonstrating substantial agreement and falling just below the 0.81 cutoff for almost perfect agreement (Landis & Koch, 1977). In agreement with previous studies (Cardoso, 2007b; Flores-Mir et al., 2005; Lewis & Garn, 1960), descriptive statistics show that, overall (Table 4a), skeletal development is more variable than dental development at all ages (Table 5a). However, this difference did not hold up for all quantiles of inter-est, as for some quantiles, the variation in dental development was greater than for skeletal. Results for Quantiles Based on Skeletal Development For skeletal based quantiles, the descriptive statis-tics (Table 4b) fail to demonstrate consistently greater skeletal development variation than dental (Table 5b). At age three, the reverse is true for all three quantiles. The dental development continues to be more variable at age six for the average and advanced quantiles. At age nine, the dental varia-
tion is greater only for the advanced quantile, but at age 12, only the average quantile demonstrates higher dental variation than skeletal. These differ-ences suggest that there are differences in skeletal and dental development between those who were delayed, average, or advanced in their skeletal de-velopment at age three. Model 1: Skeletal Developmental Trajectories of Skeletal Quantiles Figure 1a depicts skeletal developmental trajecto-ries of the three skeletal quantiles versus exact chronological age. The three lines represent the logistic growth curves per skeletal quantile. The difference in mean age per quantile decreases con-tinuously between the delayed and advanced quantiles as the individuals age. Despite the nar-rowing differences, the three quantiles continue to follow their own trajectories. A repeated measure ANOVA was run on Model 1, comparing the skele-tal developmental trajectories of the three skeletal quantiles (Table 6a). The model was found to be significant (F=179.43; p<0.0001). Age, as well as the interaction of age and skeletal quantile, was also significant. The R-squared value for the model was 0.9869. Based on the model’s significance, a Tuk-ey’s HSD pairwise comparison was run to test the effect each quantile’s pairing had on the complete model (Table 6b). This test demonstrated that all three comparisons between the skeletal quantiles were significantly different in their mean scores.
Model 2: Dental Developmental Trajectories of Skeletal Quantiles Figure 1a and 1b depict the developmental trajecto-ries versus exact chronological age of the same in-dividuals within the skeletal quantiles of interest. However, while Figure 1a compares the skeletal development, Figure 1b compares the dental devel-opment. The trajectories of the delayed and aver-age quantiles are similar and, in fact, cross over each other. A repeated measure ANOVA was run on Model Q2, comparing the dental development of the three skeletal quantiles (Table 7a). The mod-el was significant (F=128.47; p<0.0001). The influ-ence of age was significant in Model 2, as it was in Model 1. However, unlike Model 1, the interaction between age and the skeletal quantiles was not significant (p=0.4578). The R-squared was 0.9822, which is slightly lower than that for Model 1 yet still a high value. Because the model was signifi-cant, a Tukey’s HSD pairwise comparison was run (Table 7b). The results of this test differ from those of Model 1 in that not all the pairwise comparisons
9
Dental Anthropology 2020 │ Volume 33 │ Issue 01
Table 4. Descriptive statistics of the skeletal and dental development for the entire sample, (b) three skeletal quantiles of interest, and (c) the three dental quantiles of interest.
(a) Total sample’s development
Skeletal Dental
mean SD mean SD
age 3 0.3226 0.0630 0.2762 0.0364
age 6 0.5372 0.0628 0.5199 0.0561
age 9 0.7083 0.0658 0.7326 0.0503
age 12 0.8906 0.0483 0.9107 0.0405
(b) Skeletal based Quantiles
De
ve
lop
me
nt
Delayed-Skeletal Average-Skeletal Advanced-Skeletal
Sk
eletal
mean SD mean SD mean SD
age 3 0.2424 0.0250 0.3146 0.0058 0.4170 0.0401
age 6 0.4654 0.0532 0.5521 0.0458 0.6059 0.0337
age 9 0.6585 0.0522 0.7174 0.0554 0.7815 0.0499
age 12 0.8890 0.0512 0.8976 0.0377 0.9081 0.0460
Delayed-Skeletal Average-Skeletal Advanced-Skeletal
Den
tal
mean SD mean SD mean SD
age 3 0.2758 0.0303 0.2613 0.0320 0.2819 0.0410
age 6 0.4987 0.0498 0.5154 0.0601 0.5486 0.0639
age 9 0.7265 0.0503 0.7145 0.0443 0.7527 0.0632
age 12 0.9022 0.0324 0.8995 0.0625 0.9281 0.0355
(c) Dental based Quantiles
De
ve
lop
me
nt
Delayed-Dental Average-Dental Advanced-Dental
Den
tal mean SD mean SD mean SD
age 3 0.2256 0.0182 0.2783 0.0053 0.3265 0.0219
age 6 0.4974 0.0270 0.5230 0.0568 0.5298 0.0648
age 9 0.7033 0.0424 0.7358 0.0525 0.7647 0.0517
age 12 0.9026 0.0529 0.9160 0.0362 0.9199 0.0469
Delayed-Dental Average-Dental Advanced-Dental
Sk
eletal
mean SD mean SD mean SD
age 3 0.3153 0.0607 0.3181 0.0592 0.3274 0.0852
age 6 0.5348 0.0820 0.5237 0.0603 0.5335 0.0616
age 9 0.7100 0.0814 0.7006 0.0720 0.7135 0.0706
age 12 0.8716 0.0613 0.8912 0.0409 0.9128 0.0300

10
Dental Anthropology 2020 │ Volume 33 │ Issue 01
Table 5. Calculated difference of the variation (as measured by standard deviation) between skeletal and dental development.
a) SD: TS – TS
Total sample: skeletal develop. – dental develop.
Age 3 0.0266
Age 6 0.0066
Age 9 0.0155
Age 12 0.0078
(b) SD: Q2 – Q3
Skeletal quantiles: skeletal develop. – dental develop.
Delayed Average Advanced
Age 3 -0.0053 -0.0261 -0.0009
Age 6 0.0034 -0.0144 -0.0303
Age 9 0.0018 0.0111 -0.0132
Age 12 0.0188 -0.0247 0.0104
(c) SD: Q4 – Q1
Dental quantiles: skeletal develop. – dental develop.
Delayed Average Advanced
Age 3 0.0426 0.0539 0.0632
Age 6 0.0549 0.0035 -0.0032
Age 9 0.0390 0.0196 0.0189
Age 12 0.0084 0.0048 -0.0169
Table 6. Model 1: Skeletal development between skeletal quantiles. Pt.ID: individual; Age: patient’s chronological age; Skeletal.Q: patient’s skeletal quantile.
(a) Repeat Measure ANOVA
Number of observations =218 R-squared = 0.9869
Root MSE = 0.0305 Adj R-squared = 0.9814
Source Partial SS df MS F Prob > F
Model 10.7138 64 0.1674 179.43 0
Pt.ID 0.5387 55 0.0098 10.5 0
Age 9.7514 3 3.2505 3483.98 0
Skeletal.Q 0 0 Age # Skel-etal.Q 0.1280 6 0.0213 22.87 0
Residual 0.1427 153 0.0009
Total 10.8565 217 0.0500
Between-subjects error term: Age # Skeletal.Q
Levels: 12 (6df)
Lowest b.s.e. variable: Age
Covariance pooled over: Skeletal.Q (for repeated variable)
Repeated variable: Pt.ID
(b) Tukey’s HSD
studentized range critical value (.05, 3, 153) = 3.3472
uses harmonic mean sample size = 72.608
quantile vs quantile quantile means mean dif HSD-test
delayed vs average 0.5563 0.6174 0.0612 17.0724*
delayed vs advanced 0.5563 0.6767 0.1205 33.6101*
average vs advanced 0.6174 0.6767 0.0593 16.5377*
Figure 1. Logistic growth curves of skeletal quantiles: chronological age versus development. Plots of chronological age by proportion of completed skeletal (a) or dental (b) development based on skeletal development at age three, the de-layed, average, and advanced skeletal quantiles. Logistic growth curves depict the developmental trajectories taken by those within each quantile.
11
Dental Anthropology 2020 │ Volume 33 │ Issue 01
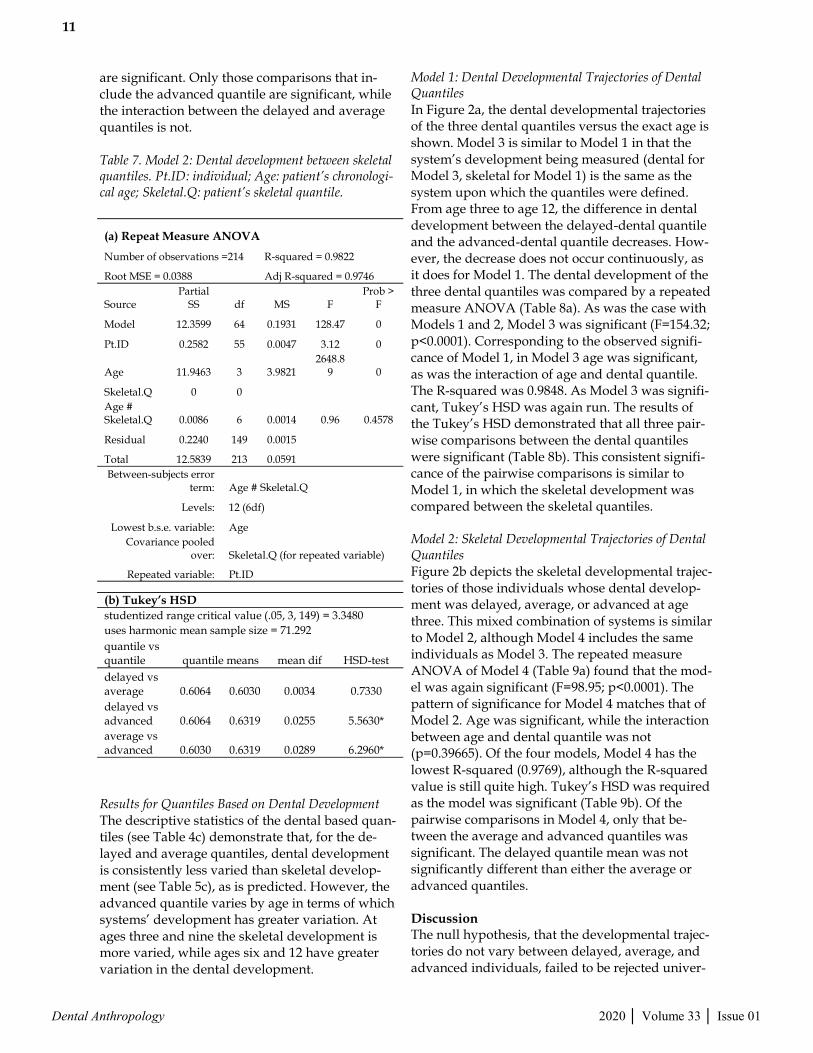
are significant. Only those comparisons that in-clude the advanced quantile are significant, while the interaction between the delayed and average quantiles is not.
Results for Quantiles Based on Dental Development The descriptive statistics of the dental based quan-tiles (see Table 4c) demonstrate that, for the de-layed and average quantiles, dental development is consistently less varied than skeletal develop-ment (see Table 5c), as is predicted. However, the advanced quantile varies by age in terms of which systems’ development has greater variation. At ages three and nine the skeletal development is more varied, while ages six and 12 have greater variation in the dental development.
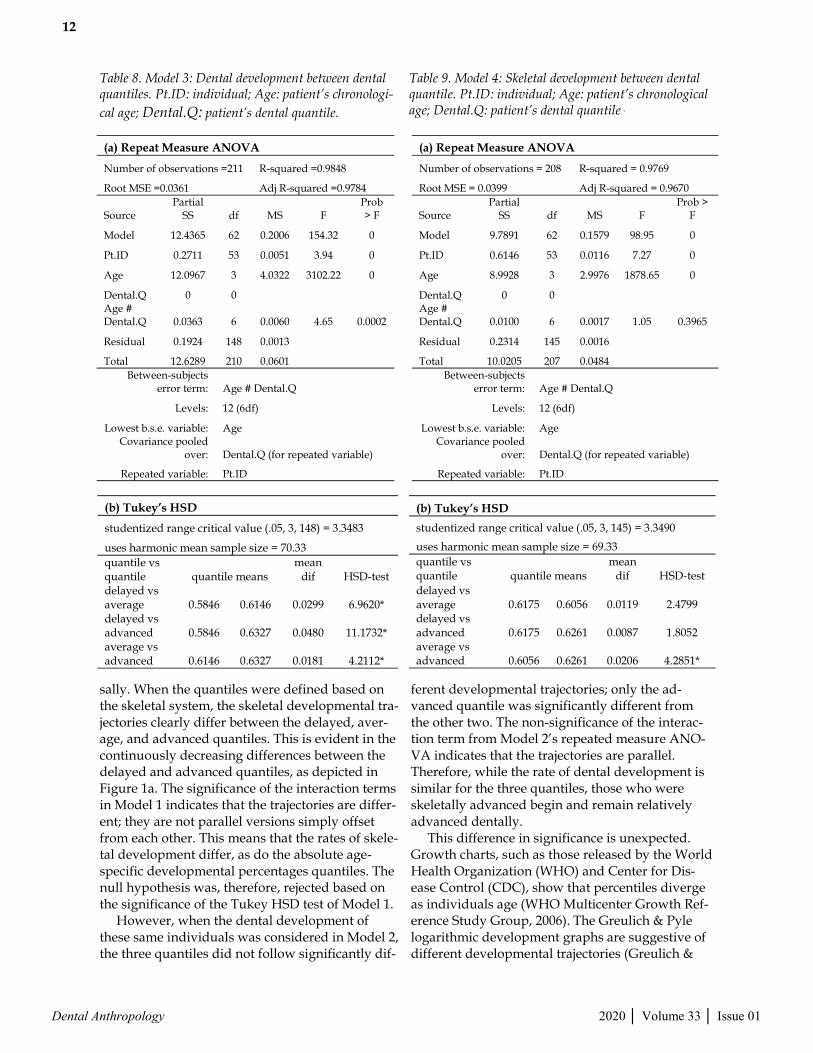
Model 1: Dental Developmental Trajectories of Dental Quantiles In Figure 2a, the dental developmental trajectories of the three dental quantiles versus the exact age is shown. Model 3 is similar to Model 1 in that the system’s development being measured (dental for Model 3, skeletal for Model 1) is the same as the system upon which the quantiles were defined. From age three to age 12, the difference in dental development between the delayed-dental quantile and the advanced-dental quantile decreases. How-ever, the decrease does not occur continuously, as it does for Model 1. The dental development of the three dental quantiles was compared by a repeated measure ANOVA (Table 8a). As was the case with Models 1 and 2, Model 3 was significant (F=154.32; p<0.0001). Corresponding to the observed signifi-cance of Model 1, in Model 3 age was significant, as was the interaction of age and dental quantile. The R-squared was 0.9848. As Model 3 was signifi-cant, Tukey’s HSD was again run. The results of the Tukey’s HSD demonstrated that all three pair-wise comparisons between the dental quantiles were significant (Table 8b). This consistent signifi-cance of the pairwise comparisons is similar to Model 1, in which the skeletal development was compared between the skeletal quantiles.
Model 2: Skeletal Developmental Trajectories of Dental Quantiles Figure 2b depicts the skeletal developmental trajec-tories of those individuals whose dental develop-ment was delayed, average, or advanced at age three. This mixed combination of systems is similar to Model 2, although Model 4 includes the same individuals as Model 3. The repeated measure ANOVA of Model 4 (Table 9a) found that the mod-el was again significant (F=98.95; p<0.0001). The pattern of significance for Model 4 matches that of Model 2. Age was significant, while the interaction between age and dental quantile was not (p=0.39665). Of the four models, Model 4 has the lowest R-squared (0.9769), although the R-squared value is still quite high. Tukey’s HSD was required as the model was significant (Table 9b). Of the pairwise comparisons in Model 4, only that be-tween the average and advanced quantiles was significant. The delayed quantile mean was not significantly different than either the average or advanced quantiles. Discussion The null hypothesis, that the developmental trajec-tories do not vary between delayed, average, and advanced individuals, failed to be rejected univer-
Table 7. Model 2: Dental development between skeletal quantiles. Pt.ID: individual; Age: patient’s chronologi-cal age; Skeletal.Q: patient’s skeletal quantile.
(a) Repeat Measure ANOVA
Number of observations =214 R-squared = 0.9822
Root MSE = 0.0388 Adj R-squared = 0.9746
Source
Partial SS df MS F
Prob > F
Model 12.3599 64 0.1931 128.47 0
Pt.ID 0.2582 55 0.0047 3.12 0
Age 11.9463 3 3.9821
2648.89 0
Skeletal.Q 0 0
Age # Skeletal.Q 0.0086 6 0.0014 0.96 0.4578
Residual 0.2240 149 0.0015
Total 12.5839 213 0.0591
Between-subjects error term: Age # Skeletal.Q
Levels: 12 (6df)
Lowest b.s.e. variable: Age
Covariance pooled over: Skeletal.Q (for repeated variable)
Repeated variable: Pt.ID
(b) Tukey’s HSD
studentized range critical value (.05, 3, 149) = 3.3480
uses harmonic mean sample size = 71.292
quantile vs quantile quantile means mean dif HSD-test
delayed vs average 0.6064 0.6030 0.0034 0.7330
delayed vs advanced 0.6064 0.6319 0.0255 5.5630*
average vs advanced 0.6030 0.6319 0.0289 6.2960*
12
Dental Anthropology 2020 │ Volume 33 │ Issue 01
sally. When the quantiles were defined based on the skeletal system, the skeletal developmental tra-jectories clearly differ between the delayed, aver-age, and advanced quantiles. This is evident in the continuously decreasing differences between the delayed and advanced quantiles, as depicted in Figure 1a. The significance of the interaction terms in Model 1 indicates that the trajectories are differ-ent; they are not parallel versions simply offset from each other. This means that the rates of skele-tal development differ, as do the absolute age-specific developmental percentages quantiles. The null hypothesis was, therefore, rejected based on the significance of the Tukey HSD test of Model 1. However, when the dental development of these same individuals was considered in Model 2, the three quantiles did not follow significantly dif-
ferent developmental trajectories; only the ad-vanced quantile was significantly different from the other two. The non-significance of the interac-tion term from Model 2’s repeated measure ANO-VA indicates that the trajectories are parallel. Therefore, while the rate of dental development is similar for the three quantiles, those who were skeletally advanced begin and remain relatively advanced dentally. This difference in significance is unexpected. Growth charts, such as those released by the World Health Organization (WHO) and Center for Dis-ease Control (CDC), show that percentiles diverge as individuals age (WHO Multicenter Growth Ref-erence Study Group, 2006). The Greulich & Pyle logarithmic development graphs are suggestive of different developmental trajectories (Greulich &
Table 8. Model 3: Dental development between dental quantiles. Pt.ID: individual; Age: patient’s chronologi-
cal age; Dental.Q: patient’s dental quantile.
(a) Repeat Measure ANOVA
Number of observations =211 R-squared =0.9848
Root MSE =0.0361 Adj R-squared =0.9784
Source Partial
SS df MS F Prob > F
Model 12.4365 62 0.2006 154.32 0
Pt.ID 0.2711 53 0.0051 3.94 0
Age 12.0967 3 4.0322 3102.22 0
Dental.Q 0 0 Age # Dental.Q 0.0363 6 0.0060 4.65 0.0002
Residual 0.1924 148 0.0013
Total 12.6289 210 0.0601 Between-subjects
error term: Age # Dental.Q
Levels: 12 (6df)
Lowest b.s.e. variable: Age Covariance pooled
over: Dental.Q (for repeated variable)
Repeated variable: Pt.ID
(b) Tukey’s HSD
studentized range critical value (.05, 3, 148) = 3.3483
uses harmonic mean sample size = 70.33 quantile vs quantile quantile means
mean dif HSD-test
delayed vs average 0.5846 0.6146 0.0299 6.9620* delayed vs advanced 0.5846 0.6327 0.0480 11.1732* average vs advanced 0.6146 0.6327 0.0181 4.2112*
Table 9. Model 4: Skeletal development between dental quantile. Pt.ID: individual; Age: patient’s chronological age; Dental.Q: patient’s dental quantile .
(a) Repeat Measure ANOVA
Number of observations = 208 R-squared = 0.9769
Adj R-squared = 0.9670 Root MSE = 0.0399
Source Partial
SS df MS F Prob >
F
Model 9.7891 62 0.1579 98.95 0
Pt.ID 0.6146 53 0.0116 7.27 0
Age 8.9928 3 2.9976 1878.65 0
Dental.Q 0 0 Age # Dental.Q 0.0100 6 0.0017 1.05 0.3965
Residual 0.2314 145 0.0016
Total 10.0205 207 0.0484 Between-subjects
error term: Age # Dental.Q
Levels: 12 (6df)
Lowest b.s.e. variable: Age Covariance pooled
over: Dental.Q (for repeated variable)
Repeated variable: Pt.ID
(b) Tukey’s HSD
studentized range critical value (.05, 3, 145) = 3.3490
uses harmonic mean sample size = 69.33 quantile vs quantile quantile means
mean dif HSD-test
delayed vs average 0.6175 0.6056 0.0119 2.4799 delayed vs advanced 0.6175 0.6261 0.0087 1.8052 average vs advanced 0.6056 0.6261 0.0206 4.2851*

13
Dental Anthropology 2020 │ Volume 33 │ Issue 01
Pyle, 1959), which also influenced the hypothe-sized difference between quantiles. If the two sys-tems are correlated, and the body’s approach to the development of both systems is the same, then it would be expected that the developmental trajecto-ries of the dental system would also be significant-ly different, given the skeletal system’s trajectories. That the dental system in general varies less than the skeletal system does not seem to be sufficient explanation for why the advanced quantile fol-lowed significantly different developmental trajec-tories than the delayed and average quantiles. From the analysis of dental quantiles, the null hypothesis again was rejected as the dental devel-opmental trajectories (Tukey HSD test of Model 3) were all significantly different and not parallel. As with Model 1, this finding is consistent with exist-ing maturation charts such as those by Moorrees et al. (1963). It is interesting and noteworthy that while the dental developmental trajectories of the dental quantiles (Model 3) are all significantly dif-ferent from one another, the delayed and average skeletal quantiles (Model 2) do not follow signifi-cantly different dental developmental trajectories. Differences in skeletal development among the dental quantiles also reject the null hypothesis, alt-hough only the average and advanced dental quantiles followed significantly different skeletal developmental trajectories from each other. As the
interaction term from Model 4 was not significant, it is apparent that these two quantiles followed different, yet parallel, trajectories. As depicted in Figure 2b, the difference between the average and advanced quantiles, while significant, is not great. Given this small difference, the variation of the delayed quantile shows an erratic pattern between the other two quantiles without being significantly different from either. While the advanced subgroup is the only one that was consistently different throughout the analyses, these four models demonstrate that the relative relationship between the skeletal and den-tal systems are not the same throughout the range of IVDT. This study did not take into consideration possi-ble stressors that might influence the skeletal or dental development. It is possible that future re-search that considers such stressors will offer in-sight into possible tradeoffs occurring between the systems that might explain these unexpected re-sults from skeletal based quantiles. Conclusions This research has demonstrated the importance of considering the possibility that those individuals towards the extremes of normal IVDT may follow different developmental trajectories than is fully characterized by the sample mean. We have shown
Figure 2. Logistic growth curves of dental quantiles: chronological age versus development. Plots of chronological age by proportion of completed dental (a) or skeletal (b) development based on dental development at age three, the delayed, average, and advanced dental quantiles. Logistic growth curves depict the developmental trajectories tak-en by those within each quantile.

14
Dental Anthropology 2020 │ Volume 33 │ Issue 01
that for skeletal and dental development, the tra-jectories are significantly different between those who are delayed, average, and advanced early in life. That this significance varies, and that the tra-jectories are occasionally parallel when the oppo-site system is considered, suggests that the rela-tionship between the development of the skeletal and dental systems is more complicated than has been previously explored. It is important to note that while the skeletal and dental quantiles were assigned independently, there are 32 individuals who fall into the quantiles of interest for both systems (see Table 3c). Of these individuals, less than a third were classified in the same level of quantile for both systems (5 delayed, 1 average, 4 advanced). Slightly over a quarter of the individuals who were delayed in one system were advanced in the other (3 delayed skeletal, 5 delayed dental). Based on the plethora of research finding a positive, and often significant, correlation between the systems, this discrepancy of a quarter of the individuals is surprising and warrants fur-ther investigation. The variation between the systems’ develop-mental trajectories has been shown to vary be-tween individuals who were delayed, average, or advanced in their development at an early age, and additional research is needed to further explore the full range of IVDT. Acknowledgments The authors would like to thank the Bolton-Brush Growth Study for access to their collection. This research was funded by the University of New Mexico’s Evolutionary Anthropology’s Research Development Grant, and the Office of Graduate Studies Research, Project, and Travel Grant. The authors declare no potential conflicts of inter-est with respect to the authorship and/or publica-tion of this article. REFERENCES Al-Juboori, H. A., Saloom, H. F., & Al-Bustani, A.
(2012). Estimation of pubertal growth using Hand-Wrist radiographs and Orthopantomo-graphs (prospective study). Mustansiria Dental Journal, 9(1), 22–31.
AlQahtani, S., Hector, M., & Liversidge, H. (2010). Brief communication: The London atlas of hu-man tooth development and eruption. Ameri-can Journal of Physical Anthropology, 142(3), 481–490.
Anderson, D. L., Thompson, G. W., & Popovich, F. (1975). Interrelationships of dental maturity,
skeletal maturity, height and weight from 4 to 14 years. Growth, 39, 453–462.
Arora, V. (2009). Assessment of Dental and Skeletal Age by Radiographic Method in Subjects Between 9-16 Years (Doctoral Dissertation). K.L.E. Uni-versity, Belgaum, Karnataka.
Badyaev, A. V. (2002). Growing apart: An ontoge-netic perspective on the evolution of sexual size dimorphism. Trends in Ecology & Evolution, 17(8), 369–378.
Bagherpour, A., Pousti, M., & Adelianfar, E. (2014). Hand skeletal maturity and its correlation with mandibular dental development. Journal of Clinical and Experimental Dentistry, 6(3), e275–e279.
Behrents, R. G. (1984). In search of truth for the great-er good of man: A chronological account of the Bol-ton-Brush growth studies. Case Western Reserve University.
Boas, F. (1912). Changes in the bodily form of de-scendants of immigrants. American Anthropolo-gist, 14(3), 530–562.
Bogin, B. (1997). Evolutionary hypotheses for hu-man childhood. Yearbook of Physical Anthropolo-gy, 40, 63–89.
Cardoso, H. F. V. (2007a). Differential sensitivity in growth and development of dental and skeletal tissue to environmental quality. ArquiMed, 21(1), 19–23.
Cardoso, H. F. V. (2007b). Environmental effects on skeletal versus dental development: Using a documented subadult skeletal sample to test a basic assumption in human osteological re-search. American Journal of Physical Anthropolo-gy, 132(2), 223–233.
Cardoso, H. F. V., Heuze, Y., & Julio, P. (2010). Sec-ular change in the timing of dental root matu-ration in Portuguese boys and birls. American Journal of Human Biology, 22(6), 791–800.
Demirjian, A., Buschang, P. H., Tanguay, R., & Kingnorth Patterson, D. (1985). Interrelation-ships among measures of somatic, skeletal, dental, and sexual maturity. American Journal of Orthodontics, 88(5), 433–438.
Flatt, T. (2005). The evolutionary genetics of canali-zation. The Quarterly Review of Biology, 80(3), 287–316.
Flores-Mir, C., Mauicio, F. R., Orellena, M. F., & Major, P. W. (2005). Association between growth stunting with dental development and skeletal maturation stage. Angle Orthodontist, 75(6), 935–940.
Fox, J., & Weisberg, S. (2010). Nonlinear regression and nonlinear least squares in R. In An Appen-

15
Dental Anthropology 2020 │ Volume 33 │ Issue 01
dix to An R Companion to Applied Regression (Second). Retrieved from http://www.stat.wvu.edu/~jharner/courses/stat512/docs/Nonlinear-Regression.pdf
Garn, S. M. (1987). The secular trend in size and maturation timing and its implications for nu-tritional assessment. The Journal of Nutrition, 117(5), 817–823.
Greulich, W. W., & Pyle, S. I. (1959). Radiographic atlas of skeletal development of the hand and wrist (2nd Edition). Stanford, Calif: Stanford Univer-sity Press.
Gupta, M., Divyashree, R., Abhilash, P. R., Bijle, M. N. A., & Murali, K. V. (2013). Correlation be-tween chronological age, dental age and skele-tal age among monozygotic and dizygotic twins. Journal of International Oral Health, 5(1), 16–22.
Haiter-Neto, F., Kurita, L. M., Menezes, A. V., & Casanova, M. S. (2006). Skeletal age assess-ment: A comparison of 3 methods. American Journal of Orthodontics and Dentofacial Orthope-dics, 130(4), 435.e15-435.e20.
Hans, M. G., Broadbent Jr., B. H., & Nelson, S. S. (1994). The Broadbent-Bolton Growth study — past, present, and future. American Journal of Orthodontics and Dentofacial Orthopedics, 105(6), 598–603.
Hochberg, Z., Feil, R., Constancia, M., Fraga, M., Junien, C., Carel, J.-C., … Albertsson-Wikland, K. (2011). Child health, developmental plastici-ty, and epigenetic programming. Endocrine Re-views, 32(2), 159–224.
Houston, A. I., & McNamara, J. M. (1992). Pheno-typic plasticity as a state-dependent life-history decision. Evolutionary Ecology, 6(3), 243–253.
Humphrey, L. T. (1998). Growth patterns in the modern human skeleton. American Journal of Physical Anthropology, 105(1), 57–72.
Hunt, E. E. Jr., & Gleiser, I. (1955). The estimation of age and sex of preadolescent children from bones and teeth. American Journal of Physical Anthropology, 13(3), 479–487.
Jasienska, G. (2013). The fragile wisdom: An evolu-tionary view on women’s biology and health. Cam-bridge, Massachusetts: Harvard University Press.
Kuzawa, C. W. (2012). Why evolution needs devel-opment, and medicine needs evolution. Inter-national Journal of Epidemiology, 41(1), 223–339.
Landis, J. R., & Koch, G. G. (1977). The measure-ment of observer agreement for categorical data. Biometrics, 33(1), 159–174.
Lauterstein, A. M. (1961). A cross-sectional study
in dental development and skeletal age. Journal of the American Dental Association, 62(2), 161–167.
Lewis, A. B., & Garn, S. M. (1960). The relationship between tooth formation and other matura-tional factors. The Angle Orthodontist, 30(2), 70–77.
Love, A. C. (Ed.). (2014). Conceptual change in biolo-gy: Scientific and philosophical perspectives on evo-lution and development. New York: Springer.
Moorrees, C. F. A., Fanning, E. A., & Hunt, E.E. Jr. (1963). Age variation of formation stages for ten permanent teeth. Journal of Dental Research, 42(6), 1490–1502.
Nadler, G. L. (1998). Earlier dental maturation: Fact or fiction? The Angle Orthodontist, 68(6), 535–538.
Nelson, S., Hans, M. G., Broadbent Jr., B. H., & Dean, D. (2000). The brush inquiry: An oppor-tunity to investigate health outcomes in a well-characterized cohort. American Journal of Hu-man Biology, 12(1), 1–9.
Ogden, C. L., Kuczmarski, R. J., Flegal, K. M., Mei, Z., Guo, S., Wei, R., … Johnson, C. L. (2002). Centers for disease control and prevention 2000 growth charts for the United States: Im-provements to the 1977 National Center for Health Statistics version. Pediatrics, 109(1), 45–60.
Rautman, A. L. M., & Edgar, H. J. H. (2013). Secular change in dental development in New Mexican females. Dental Anthropology, 26(3), 31–37.
Ribot, I., & Roberts, C. (1996). A study of non-specific stress indicators and skeletal growth in two mediaeval subadult populations. Journal of Archaeological Science, 23, 67–79.
Sachan, K., Sharma, V., & Tandon, P. (2011). A cor-relative study of dental age and skeletal matu-ration. Indian Journal of Dental Research, 22(6), 882.
Saglam, A. M. S., & Gazilerli, Ü. (2002). The rela-tionship between dental and skeletal maturity. Journal of Orofacial Orthopedics, 63, 454–462.
Stinson, S. (1985). Sex differences in environmental sensitivity during growth and development. Yearbook of Physical Anthropology, 28, 123–147.
Tanner, J. M. (1978). Fetus into man: Physical growth from conception to maturity. Cambridge, Massa-chusetts: Harvard University Press.
Viera, A. J., & Garrett, J. M. (2005). Understanding interobserver agreement: The Kappa statistic. Family Medicine, 37(5), 360–363.
Waddington, C. H. (1942). Canalization of develop-ment and the inheritance of acquired charac-

16
Dental Anthropology 2020 │ Volume 33 │ Issue 01
ters. Nature, 150(3811), 563–565. Wang, Z., Pang, X., Wu, W., Wang, J., Wang, Z., &
Wu, R. (2014). Modeling phenotypic plasticity in growth trajectories: A statistical framework. Evolution, 68(1), 81–91.
WHO Multicenter Growth Reference Study Group. (2006). WHO Child growth standards: Length/height-for-age, weight-for-age, weight-for-length, weight-for-height and body mass index-for-age: Methods and development. (p. 312) [Technical]. Retrieved from World Health Organization website: http://www.who.int/childgrowth/standards/technical_report/en/
Zhang, A., Sayre, J. W., Vachon, L., Liu, B. J., & Huang, H. K. (2009). Racial differences in growth patterns of children assessed on the basis of bone age. Radiology, 250(1), 228–235.