Embed Size (px)
Citation preview

Demographic and Health Surveys Comparative Studies No. 22
Childhood Immunization: 1990-1994
A. ELISABETH SOMMERFELT ANDREA L. PIANI
Macro International Inc. Calverton, Maryland USA
March 1997

Recommended citation:
Sommerfelt, A. Elisabeth and Andrea L. Piani. 1997. Childhood Immunization: 1990-1994. DHS Comparative Studies No. 22. Calverton, Maryand: Macro International Inc.

Contents
Preface ......................................... v
Acknowledgments ............................... vi
Executive Summary . . . . . . . . . . . . . . . . . . . . . . . . . . . . .. vii
Introduction ................................ .
2 DHS Information on Immunization . . . . . . . . . . . . . .. 2 2.1 Sample of children ....................... 2 2.2 Summary of immunization information . . . . . .. 2 2.3 Methodology............................ 6
3 Sources of Vaccination Data .................... 8 3.1 Availability of health cards ................. 8 3.2 Health card differentials .................. 10
4 Children Ever Vaccinated ..................... 14 4.1 Vaccination status and possession of
a health card ........................... 14 4.2 Children ever vaccinated according to
health card status ....................... 14
5 Vaccination Coverage Rates ................... 16 5.1 Vaccination coverage for specific vaccines
by time of interview ..................... 16 5.2 Vaccination coverage for specific vaccines
in the first year of life . . . . . . . . . . . . . . . . . . .. 20 5.3 Polio vaccination at birth ................. 22 5.4 Vaccination against yellow fever
and hepatitis ........................... 23 5.5 Age at vaccination ...................... 25 5.6 Interval between doses ................... 26 5.7 Missed opportunities for measles
vaccination ............................ 27 5.8 Concordance between DPT and polio
vaccines .............................. 28 5.9 Drop-out rates for multiple dose vaccines .... 29
6 Differentials in Vaccination Coverage . . . . . . . . . . .. 31 6.1 Urban-rural residence . . . . . . . . . . . . . . . . . . .. 31 6.2 Mother's level of education ............... 31 6.3 Mother's age at delivery .................. 38 6.4 Sex of child ............................ 38 6.5 Birth order of child . . . . . . . . . . . . . . . . . . . . .. 39 6.6 Length of the preceding birth interval ....... 39 6.7 Radio in the household ................... 39
7 Secular Trends in Vaccination Coverage .......... 40
8 Summary and Conclusions ..................... 43
References ..................................... 45
Appendix A
Summary ofDHS-I, DHS-II, and DHS-II1 Surveys, 1985-1996 ................................. 46

Tables
2.1 Characteristics of surveys ...................... 3
2.2 Summary of immunization information . . . . . . . . . . . . 4
3.1 Health card status ............................. 8
3.2 Health card possession ........................ 10
3.3 Health card possession by background characteristics . . . . . . . . . . . . . . . . . . . . . . . . . . . . . .. 12
4.1 Children ever vaccinated ...................... 14
4.2 Children ever vaccinated by health card status ..... 15
5.1 Immunization coverage for specific vaccinations ... 16
5.2 Immunization coverage during infancy ........... 20
5.3 Polio vaccination at birth ...................... 23
5.4 Vaccination against yellow fever ................ 24
5.5 Immunization coverage by age ................. 25
5.6 Interval between DPT vaccinations .............. 27
5.7 Missed opportunities for measles vaccination ...... 28
5.8 Dual vaccination of DPT and polio .............. 28
5.9 Drop-out rates for DPT and polio ............... 30
6.1 Immunization coverage of BCG by background characteristics . . . . . . . . . . . . . . . . . . . . . 32
6.2 Immunization coverage of polio 1 by background characteristics ..................... 33
6.3 Immunization coverage of poli03 by background characteristics . . . . . . . . . . . . . . . . . . . . . 34
6.4 Immunization coverage against measles by background characteristics . . . . . . . . . . . . . . . . . . . . . 35
6.5 Full immunization coverage by background characteristics . . . . . . . . . . . . . . . . . . . . . . . . . . . . . . . 36
6.6 Lack of immunization coverage by background characteristics ..................... 37
7.1 Immunization trends .......................... 40
7.2 Immunization trends for infants ................. 42
Figures
3.1 Percentage of children age 12-23 months whose immunization card was seen by the interviewer ..... 9
5.1a Immunization coverage of BCG among children age 12-23 months, according to source of information . . . . . . . . . . . . . . . . . . . . . . . . . . . . . . . .. 17
iv p
5.1 b Immunization coverage of poli03 among children age 12-23 months, according to source of information . . . . . . . . . . . . . . . . . . . . . . . .. 18
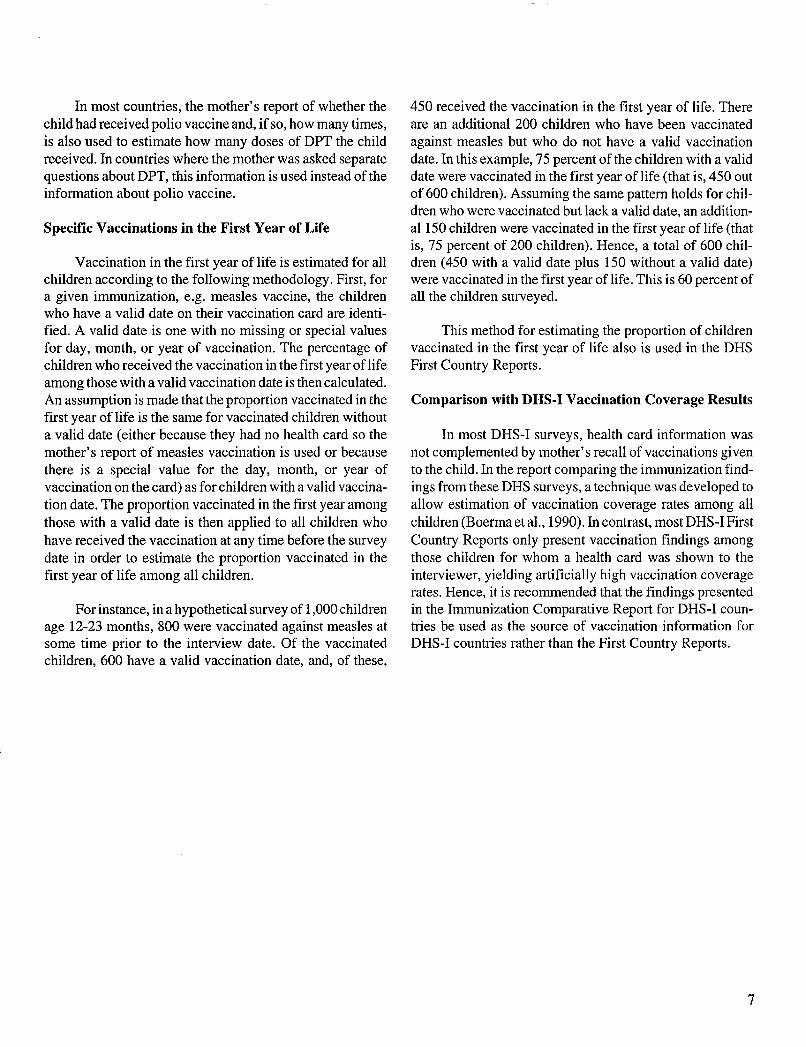
5.1 c Immunization coverage of measles among children age 12-23 months. according to source of information . . . . . . . . . . . . . . . . . . . . . . . .. 19
5.1d Full immunization coverage among children age 12-23 months, according to source of information .............................. 19
5.2 Among children age 12-23 months vaccinated against measles in the first year of life, the percent vaccinated before age 8 months, at age 8 months, and at age 9-11 months . . . . . . . . . . 26
5.3 Percentage of children with valid immunization dates for DPTl according to whether a polio vaccination was received on the same day ......... 29
7.1 Trends in immunization coverage and percentage of cards seen by an interviewer among children age 12-23 months for countries with two DHS surveys .................................... 41

Preface
One of the most significant contributions of the DHS program is the creation of an internationally comparable body of data on the demographic and health characteristics of populations in developing countries. The DHS Comparative Studies series and the DHS Analytical Reports series examine these data across countries in a comparative framework, focusing on specific topics.
The objectives of DHS comparative research are: to describe similarities and differences between countries and regions, to highlight subgroups with specific needs, to provide information for policy formulation at the international level, and to examine individual country results in an international context. While Comparative Studies are primarily descriptive, Analytical Reports utilizes a more analytical approach.
The comparative analysis of DHS data is carried out primarily by staff at the DHS headquarters in Calverton, Maryland. The topics covered are selected by staff in conjunction with the DHS Scientific Advisory Committee and USAID.
The Comparative Studies are based on a variable number of data sets reflecting the number of countries for which data were available at the time the report was prepared. Each report provides detailed tables and graphs for countries in four regions: sub-Saharan Africa, the Near East and North Africa, Asia, and Latin America and the Caribbean. Survey-related issues such as questionnaire comparability, survey procedures, data quality, and methodological approaches are addressed in each report, as necessary. Where appropriate, data from previous DHS surveys are used to evaluate trends over time.
Comparative Studies published under the current phase of the DHS program (DHS-III) are, in some cases, updates and expansions of reports published earlier in the series. Other reports, however, will cover new topics that reflect the expanded substantive scope ofthe DHS program.
It is anticipated that the availability of comparable information for a large number of developing countries will have longterm usefulness for analysts and policymakers in the fields of international population and health.
Martin Vaessen Project Director
v

Acknowledgments
The authors thank Anne Cross and Jacob Adetunji for their careful reviews of earlier drafts of this report and for their helpful comments and suggestions. We appreciate that the data processing staff was available to us whenever we requested their input. We also thank Adrienne Kols and Trina Yanni cos for their editorial work, Kaye Mitchell for report production, and Jonathan Dammons for graphics work.
Vi~

Executive Summary
Immunization against childhood diseases contributes to reductions in mortality, morbidity, and permanent disability among children. The Expanded Program on Immunization, initiated in 1974 by the World Health Assembly, has helped focus the efforts of public health programs in developing countries and of donor organizations (Henderson et al., 1988) on the importance of vaccination services. The 1989 World Health Assembly and the 1990 World Summit for Children set the goal of achieving 90 percent vaccination coverage by the year 2000 (WHO and UNICEF, 1985).
An assessment of immunization coverage rates provides information on various aspects of whether a health care system is successful in providing vaccination services to children. The proportion of children who have received at least one vaccination demonstrates the extent to which there is any contact at all with vaccination services. On the other hand, sustained contact is required in order to provide full protection against all immunizable diseases. In addition to looking at absolute coverage levels, it is important to note whether improvement or deterioration has occurred; studying secular trends in immunization coverage indicates whether there are changes in the performance of the health care system. Monitoring and evaluation is required, even in countries with high coverage levels, in order to know whether the immunization services reach children with the needed vaccinations.
This report aims to present comparative survey findings related to childhood vaccination against six diseasestuberculosis, diphtheria, whooping cough (pertussis), tetanus, poliomyelitis and measles-using data from the US AID-funded Demographic and Health Surveys (DHS) program. The DHS surveys embody a dependable source of vaccination coverage information for developing countries and use a consistent approach to yield comparable results across countries and over time. The surveys provide nationally representative estimates of vaccination coverage using rigorous sampling techniques in the selection of respondents. In addition to providing overall vaccination coverage rates, the information collected also allows analyses that can be used to identify subgroups of children who are at high risk of not being vaccinated or of recei ving suboptimal vaccination services. Some of these possible analyses of the DHS data are presented in this report, focusing on differences between children according to urban-rural place of residence, whether there is a radio in the household, moth-
er's level of education, mother's age, sex of the child, length of the preceding birth interval, and child's birth order. The analyses in this report are based on data from 28 countries that participated in the worldwide DHS program from 1990 to 1994: 14 countries in sub-Saharan Africa, 4 in North Africa and the Middle East, 4 in Asia, and 6 in Latin America and the Caribbean.
Whenever possible, the vaccination information in this report is derived from the child's written vaccination record or health card. The mother's recall is used when there is no written record of a vaccination given to the child. Most of the coverage levels are reported for children 12-23 months of age. Overall coverage rates are shown using separate estimates for (1) vaccination coverage by the time of the survey, and (2) vaccinations received before the child's first birthday.
The proportion of children for whom the interviewer saw a written vaccination record ranged from 35 percent in Niger and Nigeria to 89 percent in Rwanda. The highest card rates were found for sub-Saharan African countries, and Asian countries tended to have the lowest rates. There are large differences in vaccination coverage rates across countries. For example, vaccination against measles in the first year of life exceeds 75 percent only in three countries (Jordan, Kenya, and Rwanda). In contrast, only one-third to one-half of children in 10 countries (Bolivia, Burkina Faso, Cameroon, the Dominican Republic, Indonesia, Madagascar, Pakistan, Paraguay, Senegal, and Sudan) receive a measles vaccine before their first birthday. In Niger and Nigeria, coverage rates are even lower-only 1 in 5 and 1 in 3 children, respectively, are vaccinated against measles. In the remaining 13 countries, one-half to three-quarters of the children receive a measles vaccination in the first year of life (Bangladesh, Northeast Brazil, Colombia, Egypt, Ghana, Malawi, Morocco, Namibia, Peru, the Philippines, Tanzania, Turkey, and Zambia).
The drop-out rates between the first and third doses of the multiple dose vaccines (DPT and polio) indicate the proportion of children who initiated the series of vaccinations but did not complete them. Relatively low drop-out rates (less than 10 percent) are seen in only three countries (Jordan, Malawi and Rwanda). Drop-out rates are high (25 to 50 percent) in 10 countries (Bolivia, Burkina Faso, Cameroon, the Dominican Republic, Madagascar, Niger,
Vll

Nigeria, Pakistan, Paraguay, and Peru); while intennediate drop-out rates of 10 to 25 percent are seen in the remaining 15 countries.
An examination of secular trends indicates that vaccination coverage rates are increasing. There has been a clear increase in immunization coverage levels in all eight countries that had a previous DHS survey. 1 The smallest increase is observed for Kenya where coverage levels were already relatively high in the previous survey, and the largest change is in Senegal where coverage rates have increased dramatically, although there continues to be room for further improvement.
In addition to looking at overall vaccination coverage rates, these analyses also examine differentials in the rates for different population subgroups in order to identify groups that are underserved. There are clear coverage differentials in most countries with urban children having higher coverage rates than their rural counterparts. Children from households with a radio tend to have higher coverage rates than those from households without a radio, reflecting primarily differences in socioeconomic status, but possibly also a difference in the mother's exposure to broadcast messages about the importance of childhood vaccinations. The largest differentials are seen in mother's level of education. Children whose mothers have no fonnal schooling have consistently lower vaccination coverage levels than those whose mothers have at least completed primary education. There are much smaller differentials according to the child's birth order or the length of the preceding birth interval, with lower order births and children born after longer birth intervals tending to have somewhat better vaccination coverage rates. Similar differentials are noted according to the mother's age at delivery. The pattern of differentials is not consistent across countries; however, there is a tendency toward higher coverage rates among children of mothers in the middle age group (20-34 years). The smallest differences are according to the sex of the child; there do not appear to be consistent differences in vaccination coverage rates between boys and girls.
1 It is recommended that the immunization coverage estimates which are presented in the first comparative report on immunization (Boerma et aI., 1990) be used for DHS surveys conducted from 1986 to 1989 rather than the rates published in most ofthe individual first country reports for these surveys.
Vlll
The following recommendations will facilitate monitoring and evaluation of the performance of vaccination services:
•
•
•
•
•
•
In countries with high or relatively high coverage rates, continuing support for vaccination services will ensure continued high coverage rates for most children. Particular emphasis should be placed on reaching children at high risk of not being vaccinated and extending vaccination services to underserved population subgroups.
Countries with low or relatively low vaccination coverage levels need increased support for vaccination services, with primary emphasis on providing all children with vaccination services.
The need to expand the list of recommended vaccines for young children should be explored.
For countries that are already succeeding in providing vaccination services to infants, the next step is to extend the emphasis of vaccination programs beyond the first year of life.
Vaccination coverage rates should be monitored with consistent methodology.
Survey results should report at least the following minimal infonnation:
(i) Percent of children 12-23 months of age for whom a written vaccination record was seen by the interviewer.
(ii) Percent of all children age 12-23 months who received each of the following vaccinations by the time of the survey among children 12-23 months of age: BCG, DPTl, DPT2, DPT3, polio 1 , poli02, poli03, and measles vaccine.2
2 It is important to include both of the following measures of vaccination status when reporting the results of coverage surveys: (1) vaccination status by the time of the survey among children 12-23 months of age, and (2) vaccination status in the first 12 months oflife among children 12-23 months of age. Vaccination status by the time of the survey is simple to calculate from the survey data. Vaccination by the first birthday gives an indication of the timeliness of vaccination; however, the calculations are more complex (leaving the potential for errors) and require a number of assumptions (see Methodology, Section 2.3).

(iii) Percent of all children age 12-23 months who received each of the following vaccinations by their first birthday: BCG, DPTl, DPT2, DPT3, polio1, polio2, polio3, and measles vaccine.2
Attaining the goal of the World Summit for Children of 90 percent vaccination coverage by the year 2000 is a realistic possibility for a few of the countries included in this report. However, for many countries, making this goal a reality represents an enormous challenge which would require a large and determined effort.
ix

1 Introduction
Immunization against childhood diseases is an important component of efforts to improve children's health and to reduce mortality, morbidity, and permanent disability among children. The Expanded Program on Immunization (EPI), initiated in 1974 by the World Health Assembly, has helped focus the efforts of public health programs in developing countries and of donor organizations (Henderson et aI., 1988). The 1989 World Health Assembly and the 1990 World Summit for Children set the goal of achieving 90 percent vaccination coverage by the year 2000 (WHO and UNICEF,1985).
Immunization coverage rates provide information on various aspects of how successful a health care system is in providing vaccination services to children. The proportion of children who have received at least one vaccination demonstrates the extent to which children have any contact with vaccination services. Sustained contact, however, is required to provide full protection against all the immunizable diseases. Also important is whether coverage rates have improved or deteriorated; secular trends in immunization coverage indicate changes in the performance of the health care system. Frequent monitoring is required, even in countries with high coverage levels, to determine whether immunization services are reaching children with the needed vaccinations. This analysis also examines differentials in vacci-
nation coverage rates in order to identify population subgroups that are underserved.
The Demographic and Health Surveys (DHS) Program provides a consistent source of data for countries in Africa, Asia, and Latin America and the Caribbean. This comparative report, covering 28 countries, focuses on survey findings related to childhood vaccinations against tuberculosis, diphtheria, whooping cough (pertussis), tetanus, poliomyelitis, and measles. All but one of the surveys conducted during the second phase ofthe program (DHS-II, 1988-93) are included; the Yemen standard recode file was not available for analysis. In addition, findings are presented for six surveys conducted during the current 5-year phase of the program (DHS-III, 1992-1997). The findings from the Sudan survey, which was carried out during the first phase of the program (DHS-I, 1984-1989), are also included in this report because they were not ready for inclusion in the comparative report that summarized the findings for DHS-I countries (Boerma et al., 1990). The comparative analyses presented here cover 14 developing countries in sub-Saharan Africa, 4 in the Near East and North Africa, 4 in Asia, and 6 in Latin America and the Caribbean. DHS standard recode data files were used for the analyses presented here. The raw data files were used for tables on polio at birth and yellow fever vaccination.
1

2 DHS Information on Immunization
2.1 SAMPLE OF CHILDREN
Information about the vaccination status of young children is obtained from cross-sectional surveys where the respondents are women of reproducti ve age. The 0 HS surveys provide nationally representative vaccination coverage estimates in all countries but Brazil and Sudan. In the 1991 Brazil DHS, only the Northeast region was surveyed. Ongoing civil conflict in Sudan limited the 1989/90 DHS survey to the northern part of that country. The samples comprise women age 15-49 years in the households selected for participation in the survey. In countries in sub-Saharan Africa and in Latin America and the Caribbean, as well as in Morocco and the Philippines, all women in the selected households, regardless of their marital status, were identified as respondents. In the remaining Asian and North African countries, only ever-married women were interviewed. For most countries in this report, the analyses are based on children of women who slept in the households the night before the interview (de facto sample). The exceptions are Jordan and Indonesia where the samples consisted of the household's usual residents (de jure sample).
Information about vaccinations was obtained for all of the DHS respondents' children born following a specified cut-off date. Vaccination information was obtained for children under 5 years of age in all countries except Bangladesh, Bolivia, and Ghana, where information was collected only for children under 3 years of age. Most of the analyses in this report focus on the findings for children age 12-23 months at the time of the survey. The mother was asked about the child's month and year of birth. This information, combined with the month and year of interview, is used to calculate the child's age.
DHS surveys use either self-weighted samples or samples where some geographic areas are over-sampled in order to ensure that the number of respondents is sufficient to obtain more accurate estimates. More detailed descriptions of the sampling design for each country can be found in the DHS Final Report for each survey. The analyses presented in this report use the weighted data.
The number of respondents ranges from approximately 4,000 women in Cameroon to almost 23,000 women in Indonesia, with the number of living children available for
2
analysis ranging from 2,056 children age 0-35 months in Ghana to 13,393 children age 0-59 months in Indonesia (Table 2.1). The number of children 12-23 months of age ranges from 579 in Northeast Brazil to 2,670 in Indonesia.
2.2 SUMMARY OF IMMUNIZATION INFORMATION
The 28 DHS surveys covered in this report asked respondents about written vaccination records and immunization coverage for children born in the five-year period preceding the survey. In three of the more recent surveys (Bangladesh, Bolivia, and Ghana), these questions were limited to children born in the three-year period preceding the survey. Table 2.2 presents the immunization information collected in each country.
Guidelines from the W orId Health Organization (WHO) for many years have recommended a schedule of eight basic vaccinations in the first year of life for children in developing countries (WHO, 1989). These recommendations also emphasize that children should be vaccinated even if they are ill with common childhood diseases in order to utilize all opportunities for immunization and increase coverage rates (Steinhoff et aI., 1985). The schedule includes a dose of BCG (bacille Calmette-Guerin) soon after the child's birth to protect against tuberculosis; three doses of polio vaccine to protect against poliomyelitis; three doses of a triple vaccine (DPT) to protect against diphtheria, whooping cough (pertussis), and tetanus; and a vaccination against measles. It is recommended that DPT and polio vaccines be given at 6,10, and 14 weeks of age and that measles vaccine be given at 9 months. Information was collected for each of these basic vaccinations in all of the countries profiled in this report. In recent years, the international recommendations have been expanded to include a fourth dose of polio vaccine, with the additional dose to be given soon after birth. Most countries used the live attenuated oral polio vaccine (OPV), while a few countries used both OPV and killed, inactivated polio vaccine. The latter was administered in a combined injection with OPT (DPTP). In some countries, it is recommended that infants also be given vaccines against other diseases, such as yellow fever or hepatitis.

Table 2.1 Characteristics of surveys
Survey sample information and other characteristics, Demographic and Health Surveys, 1990-1994
Sample Number of Number of children
Country Date of fieldwork weights respondents 0-59 months 12-23 months
Sub-Saharan Africa Burkina Faso Dec-Mar 1992/93 W 6,354 5,545 1,104 Cameroon Apr-Sep 1991 W 3,871 3,189 663 Ghana Sep-Dec 1993 SW 4,562 2,056a 651 Kenya Feb-Aug 1993 W 7,540 5,650 1,124 Madagascar May-Nov 1992 W 6,260 5,013 1,072 Malawi Sep-Nov 1992 W 4,850 3,789 774 Namibia Jul-Nov 1992 W 5,421 3,602 788 Niger Mar-Jun 1992 W 6,503 5,717 1,087 Nigeria Apr-Oct 1990 W 8,781 7,107 1,380 Rwanda Jun-Oct 1992 W 6,551 5,042 1,010 Senegal Nov-Aug 1992/93 SW 6,310 5,124 959 Sudan Nov-May 1989190 SW 5,860 6,062 1,150 Tanzania Oct-Mar 1991/92 W 9,238 7,257 1,616 Zambia Jan-May 1992 W 7,060 5,396 1,123
Near EastINorth Africa Egypt Nov-Dec 1992 W 9,864 8,089 1,594 Jordan Oct-Dec 1990 W 6,461 7,963 1,615 Morocco Jan-Apr 1992 SW 9,256 4,853 985 Turkey Aug-Oct 1993 W 6,519 3,532 716
Asia Bangladesh Nov-Mar 1993/94 W 8,989 3,601 a 1,174 Indonesia May-Ju11991 W 22,909 13,393 2,670 Pakistan Dec-May 1990/91 W 6,611 5,860 1,215 Philippines Apr-Jun 1993 W 15,029 8,512 1,742
Latin America/Caribbean Bolivia Nov-May 1993/94 W 8,603 3,335a 1,111 Brazil (NE) Sep-Dec 1991 W 6,222 3,163 579 Colombia May-Aug 1990 W 8,644 3,659 748 Dominican Republic. Jul-Nov 1991 W 7,320 3,660 815 Paraguay May-Aug 1990 W 5,827 3,834 791 Peru Oct-Mar 1991/92 W 15,882 7,999 1,509
W = weighted sample; SW = self-weighted sample a 0-35 months
3

Table 2.2 Summa!l of immunization information
Immunization questions included in the survey, according to type of vaccine, Demographic and Health Surveys, 1990-1994
Basic DPT Yellow DPT & polio Source of Country questions PolioO Imovax recall fever Hepatitis boosters vaccination
Sub-Saharan Africa Burkina Faso yes yes! yes no yes! no no no Cameroon yes no no yes yes no no no Ghana yes no no no no no no no Kenya yes yes l no no no no no no Madagascar yes yes! no no no no no no Malawi yes no no no no no no no Namibia yes yes! no no no no no no Niger yes yes! yes no yes! no no no Nigeria yes no no no no no no no Rwanda yes yes! no no no no yes no Senegal yes no no no yes no no no Sudan yes2•3•4 no no yes no no no yes Tanzania yes no no no no no no no Zambia yes no no yes no no no no
Near East/North Africa Egypt yes no no yes no yes no no Jordan yes2.3 no no no no no yes no Morocco yes no no no no no no no Turkey yes no no yes no no no yes
Asia Bangladesh yes no no yes no no no no Indonesia yes no no no no no no yes Pakistan yes yes! no no no no no no Philippines yes no no yes no no no no
Latin America/Caribbean Bolivia yes4 yes no yes no no no no Brazil (NE) yes no no yes no no no no Colombia yes no no no no no no no Dominican Republic yes yes! no no no no no no Paraguay yes no no no no no no no Peru yes yes no yes no no no yes
! Card information only 2 If a mother reported that a child did not have a card, she was not asked if the child ever had one. 3 Mothers who presented health cards for children were not probed for additional vaccination information beyond what was recorded on the health card. 4 The ever-vaccinated question preceding the mother's report of specific vaccines was not asked.
DRS immunization information comes from two sources: vaccination dates entered on written vaccination records or health cards and mothers' reports of vaccinations received. The health card is the preferred source of immunization data; it is considered to be of higher quality than the mother's report, and the recorded vaccination dates allow the timing of vaccinations to be examined. The mother's recall of vaccinations was elicited if a written record was not shown to the interviewer.
4
The following series of basic immunization questions was asked of respondents in each of the 28 countries.
• First, the mother was asked if the child had a card where his or her vaccinations were written down. I The interviewer documented whether the child had such a health card and whether the card was seen. For children who did not have a card, the interviewer asked if the child ever had one.
1 In Egypt, vaccination information is recorded on birth certificates.

• If the respondent presented a health card to the interviewer, vaccination dates were copied from the card onto the questionnaire. If the card indicated that a vaccination was given but no date was recorded, the interviewer entered a special code on the questionnaire. The interviewer also probed the respondent to find out if the child had received other vaccinations that were not listed on the card.
• If the respondent was unable to present a health card to the interviewer, immunization information was based entirely on the mother's recall of vaccinations. The interviewer asked if the child had ever received any vaccinations to prevent him or her from getting diseases. If the mother said yes, she was asked to recall specific immunizations: namely BCG, polio vaccine (including the number of doses), and measles vaccine.
Surveys in seven countries (Colombia, Ghana, Malawi, Morocco, Nigeria, Paraguay, and Tanzania) followed this format without deviation. Most of these questions plus some additional ones were asked in Bolivia, Jordan, and Sudan. In Jordan and Sudan, for example, the surveys did not ask whether the child ever had a health card; therefore, no distinction can be made between children who no longer had a card and those who never had one. Also in Jordan and Sudan, mothers who presented health cards for children were not probed for additional vaccination information beyond that recorded on the card. Finally, the surveys in Bolivia and Sudan did not ask respondents who could not produce a health card whether the child was ever vaccinated before inquiring about specific vaccines.
In the remaining countries, questions were added to collect information on a variety of topics including polio vaccine soon after birth, combined injections of DPT and inactivated, killed polio vaccine, booster doses of DPT and polio vaccine given after the first birthday, vaccinations against yellow fever and hepatitis, and maternal recall of DPT. The source of vaccination also was of interest in several countries. These additional immunization questions are described below.
Ten countries collected information on the polio vaccination given at the time a child is born, which is known as "polio at birth" or "polioO." Six of these countries are in sub-Saharan Africa (Burkina Faso, Kenya, Madagascar, Namibia, Niger, and Rwanda), one is in Asia (Pakistan), and three are in Latin America and the Caribbean (Bolivia, the
Dominican Republic, and Peru). Health card information is available for polioO in all 10 countries. Only in 2 ofthe 10 countries were mothers specifically asked to recall whether the child had received a dose of polio vaccine when he or she was born. Mothers in Peru were asked a direct question on whether the child had received this initial polio vaccination. In Bolivia, after asking about the number of polio doses, the interviewer asked if the first dose was given at the time of birth or later.
In Burkina Faso and Niger, DPT and polio vaccine are sometimes given in the same injection (DPTP) which is known as Imovax. Information on DPTP coverage is collected from both the health card and from the mother's report; mothers were asked a general question about whether the child had received an injection and the number of doses received.
In most countries, mothers were not asked to report if the child had received DPT vaccine. The vaccination history for DPT was assumed to be the same as for polio vaccine because in most cases it is recommended that DPT and polio vaccinations be given on the same day. In the following 10 countries, however, mothers were asked to report on DPT as well as polio vaccinations: Bangladesh, Bolivia, Northeast Brazil, Cameroon, Egypt, Peru, Philippines, Sudan, Turkey, and Zambia.
Four West African countries (Burkina Faso, Cameroon, Niger, and Senegal) gathered information about a vaccination to prevent yellow fever. Health card information is available in all four countries, but only in Cameroon and Senegal were mothers asked to recall whether the child had been vaccinated against yellow fever.
Egypt recently added a vaccine against hepatitis to its immunization recommendations. Health card information was recorded for up to three doses of the hepatitis vaccine. If there was no vaccination record, mothers were asked to recall whether the child had received hepatitis vaccine and, if so, the number of doses.
In Jordan and Rwanda, questions also were asked about DPT and polio boosters, that is, vaccines given after 1 year of age.
Surveys in Indonesia, Peru, Sudan, and Turkey inquired about the place where vaccinations were administered. In Sudan, mothers reported where most of the vaccines had been received, while in Peru and Turkey
5
mothers reported the site of the most recent or last vaccination. In Indonesia, the source of vaccination was documented for each vaccination recorded on the health card.
A change from earlier DRS surveys is that, in all but three countries featured in this report, immunization information was collected for all children regardless of survival status. Bangladesh, Bolivia, and Sudan are the exceptions; here immunization information was collected only for surviving children. The analyses in this report are for children alive at the time of the survey.
Another change from the standard questions used in DRS-I surveys is the recall information provided by mothers about vaccinations not recorded on a health or vaccination card.
2.3 METHODOLOGY
Some measures of vaccination status correspond directly to the response categories for one or more of the survey questions. The various health card categories are examples of this. Other variables require more careful definition and are described below.
Ever Vaccinated
In this report, children for whom a health card was shown to the interviewer are defined as ever vaccinated if at least one vaccination was recorded on their health card or if the mother reported that the child had received one of the vaccinations. Children without a written vaccination record are defined as ever vaccinated if the mother reported that the child had ever received a vaccination to prevent disease. In Bolivia and Sudan, the two countries where mothers were not asked this general question, children are defined as ever vaccinated if the mother reported that the child had received at least one of the specific vaccinations inquired about.
Specific Vaccinations by the Interview Date
For BCG and measles vaccine, a child is considered to have been vaccinated if one of the following three conditions is met: a date is recorded on the health card, the card indicates that the vaccination was given although no date is shown, or the mother reports that the vaccination was received.
6
Anyone with experience in exammmg children's vaccination records in the field knows that occasionally the records are not clear. For example, a vaccination may be recorded in the wrong space, or the health provider recording a second dose may think that the child has already received the first dose but forget to indicate this on the card. One approach to analyzing immunization information is to summarize the number of children with recorded vaccinations for each dose of a multiple dose vaccine such as DPT. Using this approach, children with records of DPT2 and DPT3, but not DPTl, would contribute to the percentages of children who have received the second and third doses of the vaccine but not to the percentage who have received the first dose. A second approach is to count the number of doses that the child is documented to have received. This approach would credit the child described above with the first and second doses of DPT, but not the third dose. In other words, the analysis would assume that the first dose of DPT vaccine was erroneously written in the space for DPT2 and that the second dose was wrongly recorded in the space for DPT3. When there are few missing values for the vaccination variables, these two approaches result in no substantive differences.
The analyses in this report follow the second approach, which also is the approach used in the DRS country reports. Thus the number of doses of DPT and polio vaccines received are counted, as opposed to tabulating the frequency of responses for each of the three doses in the series. Because there are few missing values for these variables, there are no substantive differences between these two approaches to estimating vaccination coverage (data not shown).
If a card was not shown to the interviewer, the mother's report that the child had received, for example, polio vaccine indicates that at least one dose was given. The mother's response to the question about how many times the child was given polio vaccine determines whether the child is also considered to have received poli02 (if the mother said "two times") or poli03 (if the mother said "three times" or more). The value "8" for this variable is considered a "don't know" response, and the child is judged to have received only one dose of the vaccine. The value "8" ("98" and "998" in the case of two- and three-digit variables, respectively) is commonly used to denote a "don't know" response in the DRS questionnaires. Because children are unlikely to have received eight doses of polio vaccine in the surveys included in this report, it is reasonable to consider this code a "don't know" response.
In most countries, the mother's report of whether the child had received polio vaccine and, if so, how many times, is also used to estimate how many doses of DPT the child received. In countries where the mother was asked separate questions about DPT, this information is used instead of the information about polio vaccine.
Specific Vaccinations in the First Year of Life
Vaccination in the first year of life is estimated for all children according to the following methodology. First, for a given immunization, e.g. measles vaccine, the children who have a valid date on their vaccination card are identified. A valid date is one with no missing or special values for day, month, or year of vaccination. The percentage of children who received the vaccination in the first year of life among those with a valid vaccination date is then calculated. An assumption is made that the proportion vaccinated in the first year of life is the same for vaccinated children without a valid date (either because they had no health card so the mother's report of measles vaccination is used or because there is a special value for the day, month, or year of vaccination on the card) as for children with a valid vaccination date. The proportion vaccinated in the first year among those with a valid date is then applied to all children who have received the vaccination at any time before the survey date in order to estimate the proportion vaccinated in the first year of life among all children.
For instance, in a hypothetical survey of 1 ,000 children age 12-23 months, 800 were vaccinated against measles at some time prior to the interview date. Of the vaccinated children, 600 have a valid vaccination date, and, of these,
450 received the vaccination in the first year of life. There are an additional 200 children who have been vaccinated against measles but who do not have a valid vaccination date. In this example, 75 percent of the children with a valid date were vaccinated in the first year of life (that is, 450 out of 600 children). Assuming the same pattern holds for children who were vaccinated but lack a valid date, an additionalI50 children were vaccinated in the first year of life (that is, 75 percent of 200 children). Hence, a total of 600 children (450 with a valid date plus 150 without a valid date) were vaccinated in the first year of life. This is 60 percent of all the children surveyed.
This method for estimating the proportion of children vaccinated in the first year of life also is used in the DHS First Country Reports.
Comparison with DHS-I Vaccination Coverage Results
In most DHS-I surveys, health card information was not complemented by mother's recall of vaccinations given to the child. In the report comparing the immunization findings from these DHS surveys, a technique was developed to allow estimation of vaccination coverage rates among all children (Boerma et al., 1990). In contrast, most DHS-I First Country Reports only present vaccination findings among those children for whom a health card was shown to the interviewer, yielding artificially high vaccination coverage rates. Hence, it is recommended that the findings presented in the Immunization Comparative Report for DHS-I countries be used as the source of vaccination information for DHS-I countries rather than the First Country Reports.
7

3 Sources of Vaccination Data
3.1 A V AILABILITY OF HEALTH CARDS
The health card was the dominant source of immunization data in most surveys; mothers presented cards to an interviewer for over 50 percent of children age 12-23 months in 19 countries (Table 3.1). Because the health card provides a documented record of a child's immunization history, it is considered to be a more reliable source of information than the mother's report of vaccinations. Two questions were asked of respondents in order to determine the
Table 3.1 Health card status
health card status of a child. The first question determined whether the child had a health card and if it was seen by an interviewer. The second question asked if children without a card had ever had one. Responses to these two questions allowed the children to be categorized into four different groups: (i) children who had a health card that was seen by an interviewer; (ii) children who had a card, but it was not seen by an interviewer; (iii) children who no longer had a card; and (iv) children who never received a card.2
2 In Jordan and Sudan, respondents whose children did not have a card were not asked if these children ever had a card. Because this second question was not included in the questionnaire, no distinction can be made between children who no longer had a card and those who never had a card.
Percent distribution of children age 12-23 months according to health card status, Demographic and Health Surveys, 1990-1994
8
Does not currently Currently has a card have a card
Had card Never had Missing Number of Country Card seen Card not seen earlier a card information Total children
Sub-Saharan Africa Burkina Faso 72.7 11.8 2.1 12.6 0.8 100.0 1,104 Cameroon 52.1 25.2 2.3 20.1 0.2 100.0 663 Ghana 68.2 18.3 1.8 11.7 0.0 100.0 651 Kenya 69.2 27.7 0.5 2.4 0.3 100.0 1,124 Madagascar 59.1 21.0 6.3 13.6 0.0 100.0 1,072 Malawi 86.4 11.0 0.4 2.1 0.2 100.0 774 Namibia 70.1 26.2 1.1 1.7 0.9 100.0 788 Niger 35.3 9.0 4.8 50.2 0.6 100.0 1,087 Nigeria 34.7 31.2 1.3 32.6 0.1 100.0 1,380 Rwanda 87.8 7.0 2.5 2.5 0.1 100.0 1,010 Senegal 64.4 18.0 2.2 15.1 0.2 100.0 959 Sudan 46.2 30.3 23.6a 0.0 100.0 1,150 Tanzania 78.1 17.7 1.6 2.2 0.3 100.0 1,616 Zambia 75.7 19.5 1.2 3.6 0.0 100.0 1,123
Near EastINorth Africa Egypt 55.2 42.1 0.1 2.5 0.0 100.0 1,594 Jordan 64.0 34.0 2.0a 0.0 100.0 1,615 Morocco 65.4 18.1 8.2 8.1 0.2 100.0 985 Turkey 41.6 38.5 5.3 14.7 0.0 100.0 716
Asia Bangladesh 45.5 27.6 9.3 17.5 0.1 100.0 1,174 Indonesia 35.2 37.4 1.4 25.8 0.2 100.0 2,670 Pakistan 29.6 36.5 3.4 30.3 0.3 100.0 1,215 Philippines 35.1 53.6 1.2 9.9 0.2 100.0 1,742
Latin America/Caribbean Bolivia 35.1 41.8 2.6 19.7 0.9 100.0 1,111 Brazil (NE) 68.4 20.6 1.4 9.5 0.2 100.0 579 Colombia 59.3 36.5 2.0 2.1 0.1 100.0 748 Dominican Republic 61.3 27.2 8.9 2.5 0.1 100.0 815 Paraguay 51.3 24.9 3.7 19.2 0.9 100.0 791 Peru 51.0 42.6 2.1 4.3 0.1 100.0 1,509
a Respondents with children who did not have a card were not asked if the child ever had a card. No distinction can be made between children who did not have a card but had one earlier and children who never had a card.

The proportion of children with cards seen by an interviewer varies greatly across countries in this analysis. Figure 3.1 shows a regional ranking of the countries surveyed by the proportion of cards that were seen by an interviewer. In 8 of the 14 sub-Saharan African countries the interviewer saw health cards for at least two-thirds of children, and in Malawi and Rwanda interviewers saw cards for close to 90 percent of children. A smaller proportion of children showed health cards in Cameroon, Madagascar, Senegal, and Sudan (between 46 and 64 percent). In Niger and Nigeria, immunization data from cards were available only for one-third of children.
Of the four countries surveyed in North Africa and the Near East, health cards were seen for 42 percent of children in Turkey and 55 percent of children in Egypt. Jordan and Morocco have the highest proportion of cards seen in this region, about two-thirds.
Among countries surveyed in Asia-and across all 28 countries in this study-Pakistan has the lowest proportion of cards seen: 30 percent. Approximately one-third of children in Indonesia and the Philippines and almost one-half of
children in Bangladesh had cards that were seen by an interviewer.
Considerable variation in health card status is also found in Latin America and the Caribbean. The proportion of cards seen in this region is lowest in Bolivia (35 percent) and highest in Northeastern Brazil (68 percent). Respondents presented cards for over half of all children in Colombia, the Dominican Republic, Paraguay, and Peru.
The proportion of children with a card that was not seen by an interviewer ranges from a low of 7 percent in Rwanda to a high of 54 percent in the Philippines. Thirty percent or more of children in 11 countries, 6 of which are located in Asia, the Near East, or North Africa, had a card that was not seen by an interviewer. In a report on the data quality of DHS immunization data, Boerma and Bicego (1993) discussed several reasons why an interviewer might not see a card for a child. One possibility is that the card was kept at another location, perhaps at a health facility or in another household. Another possibility is that the respondent could not find the card in the house during the interview or was reluctant to search for it. The interviewer also may not have insisted on seeing the card.
Figure 3.1 Percentage of children age 12-23 months whose immunization card was seen by the interviewer, Demographic and Health Surveys, 1990-1994
Sub-Saharan Africa Rwanda Malawi
Tanzania Zambia
Burkina Faso Namibia
Kenya Ghana
Senegal Madagascar
Cameroon Sudan Niger
Nigeria Near East/North Africa
Morocco !55555555=~ Jordan Egypt
Turkey Asia
Bangladesh 5555i:-Indonesia Philippines
Pakistan Latin America/Caribbean
Brazil (NE) i§§§§§~~~~~ ____ J Dominican Rep. Colombia Paraguay
Peru Bolivia
o 20 40 60 80 100
Percent
9

The percentage of children who once possessed a health card but no longer have it ranges from 0.1 percent in Egypt to 9 percent in Bangladesh and the Dominican Republic. In most countries, less than 5 percent of children fall into this category. Greater variation is found in the proportion of children who never received a health card. Niger has the highest proportion of children (50 percent) who never had a health card, followed by Nigeria (33 percent), PaIdstan (30 percent), and Indonesia (26 percent). In 11 coun
tries, between 10 and 20 percent of children never received
a health card. In all but one (Morocco) of 11 other countries, less than 5 percent of children never had a health card. In Jordan and Sudan, where the questionnaires did not distinguish between children who never had a health card and children who used to have such a card, 2 percent and 24 percent of children, respectively, did not have a written immunization record. Less than 1 percent of children in all countries have missing health card information.
Table 3.2 Health card Qossession
3.2 HEALTH CARD DIFFERENTIALS
Child's Age
Table 3.2 shows the percentage of children under 5 years of age for whom a health card was presented by age group.3 Generally, cards are seen most often among children age 6-11 months and children age 12-23 months. The lowest card levels usually are found among older children
(those between 48 and 59 months of age). At one point these
children may have had a card, but over time the cards may have been misplaced or discarded. Lower card rates among older children might also result from recent improvements in immunization services. In seven countries, however,
3 Health card information is available only for children 0-35 months in Bangladesh, Bolivia, and Ghana.
Percentage of children under age five for whom a health card was presented, by age of child in months, Demographic and Health Surveys, 1990-1994
Age of child (months) Number of
Country 0-5 6-11 12-23 24-35 36-47 48-59 Total children
Sub-Saharan Africa Burkina Faso 49.4 67.4 72.7 70.0 61.6 57.7 63.7 5,545 Cameroon 37.7 50.3 52.1 40.8 37.0 32.8 41.7 3,189 Ghana 51.4 65.8 68.2 58.7 a a 61.6 2,056 Kenya 65.6 73.8 69.2 62.7 57.5 52.7 62.4 5,650 Madagascar 40.4 51.6 59.1 58.3 51.3 48.2 52.5 5,013 Malawi 65.4 85.9 86.4 71.3 56.5 44.8 67.8 3,789 Namibia 83.1 82.6 70.1 57.7 54.8 50.4 64.3 3,602 Niger 21.5 33.2 35.3 34.1 31.2 28.6 31.0 5,717 Nigeria 28.7 39.0 34.7 29.3 25.3 16.2 28.1 7,107 Rwanda 80.5 89.6 87.8 80.9 76.3 67.4 79.6 5,042 Senegal 41.0 63.2 64.4 52.5 43.8 39.0 50.0 5,124 Sudan 27.6 47.8 46.2 33.0 30.4 23.6 34.0 6,062 Tanzania 67.6 85.2 78.1 69.1 61.2 48.0 63.6 8,489 Zambia 57.3 80.8 75.7 69.4 58.9 55.0 66.4 5,396
Near EastlNorth Africa Egypt 46.7 57.6 55.2 50.3 45.9 42.3 49.0 8,089 Jordan 30.9 64.2 64.0 57.6 56.5 50.4 55.5 7,963 Morocco 64.7 75.9 65.4 58.0 50.2 42.4 57.1 4,853 Turkey 35.2 55.7 41.6 26.7 19.0 15.1 29.9 3,532
Asia Bangladesh 35.4 57.5 45.5 26.8 a a 39.4 3,601 Indonesia 23.8 44.6 35.2 23.8 16.2 11.7 24.4 13,393 Pakistan 27.4 39.1 29.6 20.2 13.9 11.7 22.4 5,860 Philippines 34.6 49.3 35.1 29.1 24.4 17.5 29.9 8,512
Latin America/Caribbean Bolivia 28.0 38.4 35.1 29.0 a a 32.5 3,335 Brazil (NE) 46.0 71.7 68.4 67.0 67.4 63.2 64.9 3,163 Colombia 60.4 68.1 59.3 42.2 46.6 38.3 50.6 36,585 Dominican Republic 53.5 60.5 61.3 47.1 29.8 25.7 45.1 3,660 Paraguay 39.0 51.4 51.3 45.7 46.3 38.5 44.2 4,257 Peru 53.4 55.8 51.0 46.0 44.1 37.7 46.6 7,999
a Immunization questions only asked for children 0-35 months
10

including Bolivia and Ghana, children under age 6 months have the lowest proportion of cards seen by an interviewer. Many of these children probably have not made contact with the health care system and hence would not have had the opportunity to receive a vaccination card. Namibia and Peru also exhibit a different pattern from most countries: card levels are highest among children age 0-11 months and begin to decline as the age of the child increases.
Socio-Demographic Characteristics
Table 3.3 presents health card levels for children age 12-23 months by five background characteristics: urban-rural place of residence, educational level of the mother, birth order of the child, mother's age at the time of delivery, and sex of the child.
Urban-rural place of residence. In general, the proportion of children with health cards seen by an interviewer is higher among urban than rural children. In most countries, the difference between children living in urban and rural areas ranges from 1 to 12 percentage points. Differentials by place of residence are much greater, however, in Niger where health cards were seen for 79 percent of urban children compared to only 26 percent of their rural counterparts. A similar but less pronounced difference is found in Turkey: 52 percent of children in urban areas compared to 27 percent of children in rural areas presented cards. In five countries (Colombia, the Dominican Republic, Kenya, Namibia, and Rwanda), cards were seen among a higher proportion of rural than urban children.
Mother's level of education. In all but four countries, health card levels are higher among children of mothers who attained secondary or higher levels of education compared to children of uneducated mothers. In some countries, such as Cameroon, the Dominican RepUblic, Ghana, Nigeria, Paraguay, and Turkey, differences in health card levels between children of the most and least educated mothers reach 20 percentage points or more.
Children of mothers who completed primary school have health card levels similar to those of children of mothers who had some primary schooling in most sub-Saharan African countries, in one North African country (Egypt) and in three Asian countries (Bangladesh, Indonesia, and the Philippines). In Bolivia, Colombia, Ghana, Paraguay, Peru, Senegal, and Turkey, cards are more likely to be seen if the child's mother completed primary school than if the child's mother attended but did not complete this level of school-
ing. In contrast, in Northeast Brazil, the Dominican Republic, Jordan, Morocco, Namibia, Nigeria, and Pakistan, card levels are significantly higher for children of mothers who did not complete primary school compared to children of mothers who completed their primary education.
Although the lowest card levels most often are found among children of uneducated mothers, the highest card levels are not always found among children of the most educated mothers, that is, the ones with secondary school education or more. The highest card levels also are found among children of mothers who completed primary school and among children of mothers who attended but did not complete primary school.
Birth order. There is some evidence of a relationship between health card levels and a child's birth order. Generally, children of higher birth orders (6 or more) have lower card levels than children of lower birth orders. The greatest variation in card levels by birth order is found in Indonesia and Turkey. In both these countries, about 50 percent of first births had health cards compared to only 20 percent of children of birth orders of 6 or more.
Mother's age at the time of delivery. In 15 countries, most of them in sub-Saharan Africa, health card levels are highest for children born to mothers age 20-34 years; in some of these countries, the lowest card levels are found among children delivered by younger mothers (less than 20 years) and in other countries among children delivered by older mothers (35 years or more). Kenya and Turkey show the greatest differences in health card levels by mother's age at delivery. In Kenya interviewers saw cards for 72 percent of children whose mothers were age 20-34 years, 67 percent of children whose mothers were less than 20 years of age, and 56 percent of children whose mothers were age 35 or more at delivery. The corresponding proportions in Turkey are 44 percent, 40 percent, and 24 percent.
In seven countries (Bolivia, Northeast Brazil, Egypt, Indonesia, Jordan, Peru, and the Philippines), children born to the youngest mothers had the highest health card levels. In Bolivia, Egypt, Indonesia, and Jordan, card levels decrease as the age of the mother increases. In Northeast Brazil, Peru, and the Philippines, there is little difference in card levels between children born to mothers age 20-34 years and those born to mothers age 35 years or more.
In five remaining countries (Colombia, the Dominican Republic, Namibia, Niger, and Zambia), health card levels
11

..... N
Table 3.3 Health card I:!ossession by back~ound characteristics
Percentage of children age 12-23 months for whom a health card was shown, by selected background characteristics, Demographic and Health Surveys, 1990-1994
Education
Residence Less Second- Birth order Mother's age at birth Sex Number than ary or of
Country Urban Rural None primary Primary higher 2-3 4-5 6+ <20 20-34 35+ Male Female Total children
Sub-Saharan Africa Burkina Faso 81.0 71.2 72.1 73.1 (71.3) (88.5) 74.3 69.5 74.7 73.3 71.5 73.1 71.9 70.7 74.7 72.7 1,104 Cameroon 57.5 48.5 40.0 57.2 55.7 61.6 57.8 54.7 47.0 49.2 53.8 51.2 54.1 56.9 46.9 52.1 663 Ghana 75.1 65.2 57.4 67.1 76.5 (82.2) 76.0 66.1 67.3 63.6 66.3 69.7 62.9 69.2 67.1 68.2 651 Kenya 58.7 71.1 58.6 73.6 72.4 66.6 70.1 65.4 78.9 64.9 66.9 71.8 56.0 68.3 70.1 69.2 1,124 Madagascar 65.0 58.2 50.6 59.2 (61.9) 65.8 64.9 58.3 57.1 57.5 57.0 61.4 52.6 62.0 56.1 59.1 1,072 Malawi U U 86.5 85.7 87.6 (88.2) 88.7 86.9 85.7 85.0 84.2 87.8 83.8 84.7 88.2 86.4 774 Namibia 58.9 75.8 74.0 75.1 63.6 63.6 68.9 69.0 70.4 73.2 64.3 70.6 73.6 70.3 69.9 70.1 788 Niger 78.6 26.0 32.4 56.8 * * 34.7 41.3 33.7 31.7 33.0 35.2 38.6 33.7 37.2 35.3 1,087 Nigeria 43.9 32.3 25.7 54.0 45.5 49.3 35.5 35.9 30.7 36.2 33.5 35.5 32.3 30.9 38.5 34.7 1,380 Rwanda 84.6 87.9 85.8 89.3 91.3 87.8 87.1 88.2 88.8 87.0 81.3 88.3 88.1 88.1 87.4 87.8 1,010 Senegal 72.2 60.1 62.8 64.6 74.3 (76.6) 68.8 68.5 61.1 61.5 60.3 65.4 64.1 63.8 65.2 64.4 959 Sudan 52.8 42.4 40.9 50.2 53.3 51.9 54.1 44.1 44.7 43.9 44.9 47.0 42.3 47.7 44.6 46.2 1,150 Tanzania 82.4 77.0 74.2 79.5 80.9 (72.2) 74.8 77.9 79.3 80.4 76.8 78.7 77.3 79.4 76.9 78.1 1,616 Zambia 76.9 74.7 71.3 74.5 77.5 77.9 73.3 75.9 79.1 74.8 74.1 76.0 76.4 75.3 76.0 75.7 1,123
Near Eastl North Africa Egypt 57.3 54.0 53.7 58.7 (60.7) 54.7 58.4 56.1 53.8 51.4 60.3 55.2 51.2 55.6 54.8 55.2 1,594 Jordan 66.0 59.3 55.8 68.3 60.3 66.1 70.0 65.1 62.5 61.3 68.9 65.3 55.4 63.7 64.4 64.0 1,615 Morocco 72.8 61.6 64.6 79.7 58.9 67.0 67.0 66.9 67.3 61.2 63.6 67.1 60.6 66.0 64.8 65.4 985 Turkey 51.7 27.1 28.3 (19.7) 48.9 49.7 50.6 43.1 28.1 20.1 39.8 43.6 24.1 43.4 39.4 41.6 716
Asia Bangladesh 50.5 44.9 44.1 46.2 47.8 48.2 44.7 45.5 48.9 42.2 44.5 45.8 45.7 48.2 42.7 45.5 1,174 Indonesia 42.7 31.9 26.4 32.2 35.2 44.5 47.6 33.7 29.9 21.6 42.2 34.4 30.8 37.2 33.3 35.2 2,670 Pakistan 34.7 27.3 29.2 (37.1) 25.2 32.6 29.2 30.0 31.1 28.3 25.3 31.5 21.8 30.7 28.7 29.6 1,215 Philippines 35.8 34.4 (20.4) 36.2 34.4 35.8 41.8 36.3 30.9 30.2 36.1 34.9 35.4 34.8 35.4 35.1 1,742
Latin Americal Caribbean Bolivia 39.5 30.5 22.7 31.2 39.5 40.8 39.4 36.3 29.2 33.4 38.5 35.4 30.4 38.6 31.7 35.1 1,111 Brazil (NE) 70.5 66.1 66.2 70.7 (50.3) 69.4 70.7 68.3 67.4 67.0 71.7 67.6 68.4 68.8 67.9 68.4 579 Colombia 57.3 63.2 (61.6) 53.8 72.6 57.4 55.0 61.1 64.9 60.7 54.9 59.8 62.1 55.5 63.4 59.3 748 Dominican Republic 59.7 63.4 41.7 68.5 50.3 61.7 60.4 61.9 62.9 59.0 45.7 64.1 (68.1) 60.4 62.2 61.3 815 Paraguay 55.3 48.0 (30.9) 42.1 59.2 61.0 51.6 58.8 47.8 44.1 45.8 52.9 49.1 50.4 52.4 5t.3 791 Peru 51.6 50.0 53.3 52.2 58.5 47.4 49.8 50.9 53.0 50.8 52.9 50.5 51.5 51.1 50.8 51.0 1,509
U = Unknown (not available) Note: An asterisk indicates that a figure is based on fewer than 25 unweighted cases and has been suppressed. Figures in parentheses are based on 25-49 unweighted cases.

increase with the age of the mother. In Cameroon, card levels are similar for children born to the oldest and youngest mothers and are only slightly lower for children born to mothers age 20-34 years.
Sex of child. In 16 countries, male children are more likely than female children to have a health card that was seen by an interviewer. The difference in card levels between male and female children is greatest in Cameroon
where interviewers saw the cards of 57 percent of male children compared to 47 percent of female children. Differences of 5 percentage points or more are found in Bangladesh, Bolivia, and Madagascar.
In the other 12 countries, female children had higher card levels than male children. In Colombia and Nigeria, there is an 8-percentage-point difference in card levels between male and female children.
13

4 Children Ever Vaccinated
4.1 VACCINATION STATUS AND POSSESSION Table 4.1 Children ever vaccinated
OF A HEALTH CARD
Table 4.1 combines two types of data: the source of Percent distribution of children age 12-23 months according to vaccination status, including source of immunization information,
immunization information for each child and whether the Demographic and Health Surveys, 1990-1994
child had ever been vaccinated. Based on these data, chil-dren age 12-23 months are divided into three groups: (i) a Children ever
vaccinated Children health card was seen by the interviewer and the child had re- never Number ceived at least one vaccination; (ii) the mother's report was Health Maternal vacci- of
the sole source of vaccination information and she reported Country card recall nated Missing Total children
that the child had been vaccinated; and (iii) the child had Sub-Saharan never been vaccinated (regardless of whether a card was Africa
shown to the interviewer). Burkina Faso 72.7 14.7 11.9 0.8 100.0 1,104 Cameroon 52.1 26.3 20.5 1.1 100.0 663 Ghana 68.2 17.8 13.2 0.8 100.0 651
A comparison of Tables 3.1 and 4.1 shows the ex- Kenya 69.0 27.8 2.9 0.3 100.0 1,124
pected relationships between vaccination status and the pos- Madagascar 59.1 21.3 19.5 0.1 100.0 1,072 Malawi 86.4 Il.l 2.2 0.3 100.0 774
session of a health card. The percentage of children with at Namibia 69.5 25.8 3.6 1.2 100.0 788
least one vaccination according to a written record of vacci- Niger 32.3 8.7 58.0 0.9 100.0 1,087
nation closely approximates the percentage of children for Nigeria 34.7 29.3 34.7 1.2 100.0 1,380 Rwanda 87.8 9.5 2.5 0.3 100.0 1,010
whom a card was shown. The percentage of children who Senegal 64.4 20.5 14.7 0.3 100.0 959
were ever vaccinated based on the mother's recall is roughly Sudanl 46.1 32.9 21.0 0.0 100.0 1,150 Tanzania 77.9 18.5 3.2 0.4 100.0 1,616
equivalent to the sum of two health card categories: children Zambia 75.3 20.6 4.1 0.0 100.0 1,123
who have a card that the interviewer did not see and chil-dren who no longer have a card. Finally, the percentage of Near Eastl
North Africa children never vaccinated is generally similar to the percent- Egypt 54.4 41.8 3.7 0.1 100.0 1,594
age of children who reported never having a health card. Jordan 64.0 34.1 1.9 100.0 1,615 Morocco 65.4 28.3 5.9 0.4 100.0 985
There are a few exceptions. In Madagascar and Niger, the Turkey 41.6 55.5 2.9 100.0 716 percentage never vaccinated is higher than the percentage
Asia who never had a card by 6 and 8 percentage points, respec-Bangladesh 45.5 40.7 13.7 0.2 100.0 1,174
tively, indicating that some children are not vaccinated at all Indonesia 34.8 41.4 22.6 1.2 100.0 2,670 even though they have been given a card. In Bolivia, North- Pakistan 29.6 42.5 26.9 0.9 100.0 1,215
east Brazil, Paraguay, and Turkey, the proportion never Philippines 35.1 58.2 6.3 0.4 100.0 1,742
vaccinated is smaller-by 5 to 12 percentage points-than Latin Americal
the proportion who never had a card, suggesting that in Caribbean Bolivial 34.9 49.6 14.6 0.9 100.0 1,111
these countries some children are vaccinated without re- Brazil (NE) 68.4 28.5 2.4 0.7 100.0 579 ceiving a health card. Colombia
Dominican 59.3 39.7 0.9 0.1 100.0 748
Republic 61.3 37.9 0.7 0.2 100.0 815 Paraguay 50.0 40.2 8.9 0.9 100.0 791
4.2 CHILDREN EVER VACCINATED ACCORDING Peru 50.8 45.4 3.5 0.3 100.0 1,509
TO HEALTH CARD STATUS 1 The question on whether a child ever had a vaccination was not
There are clear differences in the percentage of chil-included in Sudan or Bolivia. If the mother reported that a child had received a specific vaccination, BCG, polio, or measles, the
dren age 12-23 months who were ever vaccinated according child was counted as ever vaccinated.
to the four health card categories (Table 4.2). As expected,
14

almost all the children for whom a written vaccination record was shown to the interviewer had received at least one vaccination (99 to 100 percent). There are only two exceptions, Niger and Paraguay, where only 92 percent and 97 percent, respectively, of children who presented cards had ever been vaccinated. Children whose mothers said that they had a card for the child but were unable to show it to the interviewer also tend to have high ever-vaccinated levels, although slightly lower than among children for whom a card was actually seen. The main exception is Niger, where a surprisingly low percentage of these children are vaccinated (56 percent). In six countries (Burkina Paso, Cameroon, Ghana, Namibia, Nigeria, and Tanzania), between 82 and 95 percent of these children have ever been vaccinated. In the remaining 21 countries, 95 to 100 percent of the children in this category have received at least one vaccination.
In 13 countries there are enough children who used to have a health card, but no longer do so, to allow an examination of the ever-vaccinated rate for this group. In most of these countries (Bangladesh, the Dominican Republic, Morocco, Paraguay, Peru, Rwanda, Tanzania, and Turkey), the ever-vaccinated coverage rate for children who no longer have a card is about the same as for children who currently have a card. In Bolivia, Indonesia, and Pakistan, the rate for children who no longer have a card is 5 to 17 percentage points lower than for children with a card. In Madagascar and Niger, the rate is far lower for these children than for children who currently have a card.
Among children who never had a health card, the evervaccinated rates are generally much lower than for children with a card. In four countries (Northeast Brazil, Egypt, Paraguay, and Turkey), vaccination rates are about 60 to 80 percent among these children. In the remaining 20 countries with a sufficient number of children in this category (including Jordan and Sudan), only 5 to 39 percent have ever been vaccinated.
These differences in the ever-vaccinated rates according to children's health card status are to be expected. It is interesting, however, that there are such large differences in coverage rates between children who, according to their mothers, never had a card and children whose mothers claimed that they had had a card in the past or that they had a card but could not show it to the interviewer. Although the mother's report of vaccinations had to be relied upon for the children in all these categories, the fact that vaccination coverage rates are much lower for children who never had a written vaccination record suggests that mothers are able to recall whether their children have been vaccinated.
Table 4.2 Children ever vaccinated by health card status
Percentage of children age 12-23 months ever vaccinated according to health card status, Demographic and Health Surveys, 1990-1994
Does not currently Currently have a card has a card
Had Never Number Card Card card had a of
Country seen not seen earlier card Total children
Sub-Saharan Africa Burkina Faso 100.0 92.1 * 13.7 87.5 1,104 Cameroon 100.0 93.5 * 5.0 78.4 663 Ghana 100.0 82.4 * 10.5 86.0 651 Kenya 99.8 97.6 * 10.8 96.8 1,124 Madagascar 100.0 96.5 0.0 8.0 80.4 1,072 Malawi 100.0 96.9 * * 97.5 774 Namibia 99.1 91.6 * * 95.4 788 Niger 91.6 55.7 27.6 4.8 41.3 1,087 Nigeria 100.0 82.6 * 7.7 64.1 1,380 Rwanda 100.0 96.8 100.0 4.5 97.2 1,010 Senegal 100.0 96.0 * 13.8 85.1 959 Sudan 99.8 98.3 13.3 a 79.0 1,150 Tanzania 99.6 94.7 98.0 6.2 96.4 1,616 Zambia 99.5 97.9 * 9.9 95.9 1,123
Near East/ North Africa Egypt 98.6 95.0 * 66.5 96.2 1,594 Jordan 100.0 99.5 11.6a 98.1 1,615 Morocco 100.0 98.3 96.3 32.5 93.9 985 Turkey 100.0 99.6 100.0 81.3 97.1 716
Asia Bangladesh 100.0 98.1 100.0 24.2 86.2 1,174 Indonesia 98.9 95.8 82.4 17.3 76.3 2,670 Pakistan 100.0 96.5 92.6 13.8 72.2 1,215 Philippines 100.0 99.2 * 38.6 93.3 1,742
Latin America! Caribbean Bolivia 99.6 98.5 93.9 30.8 84.9 1,111 Brazil (NE) 100.0 99.5 a 70.7 96.9 579 Colombia 100.0 99.4 a a 99.9 748 Dominican Republic 100.0 99.4 99.6 a 99.2 815
Paraguay 97.4 100.0 98.4 60.9 90.9 791 Peru 99.8 99.4 100.0 22.4 96.3 1,509
Note: An asterisk indicates that a figure is based on fewer than 25 unweighted cases and has been suppressed. a Respondents with children who did not have a card were not asked if the child ever had a card. No distinction can be made between children who did not have a card but had one earlier and children who never had a card.
15

5 Vaccination Coverage Rates
5.1 VACCINATION COVERAGE FOR SPECIFIC VACCINES BY TIME OF INTERVIEW
Table 5.1 presents coverage levels for vaccinations received any time before the interview among children age 12-23 months. These coverage estimates include information from both written vaccination records and mothers' reports, and they show coverage rates for BeG, up to three doses of OPT and polio vaccine, measles vaccination, full immunization, and no vaccinations. The first four figures in
Table 5.1 Immunization coverage for sQecific vaccinations
this chapter show the coverage levels for BeG, three doses of polio vaccine, measles vaccination, and full immunization, respectively, for children age 12-23 months by the source of the information. "Full" vaccination coverage is defined as BeG, three doses of OPT and polio vaccine, and measles vaccine.4 Only in Northeast Brazil are there substantial differences in the coverage rates for the two multiple dose vaccines, with polio vaccination rates being 6 to 10 percentage points higher than those for OPT. In most countries, the proportion of children who have received OPT
4 BCG is not required for "full" vaccination status in Jordan.
Percentage of children age 12-23 months who received specific vaccinations based on health card information and maternal recall by the time of the survey, Demographic and Health Surveys, 1990-1994
Percent DPT Polio with Number
vaccina- of Country BCG 2 3 2 3 Measles All None tion card children
Sub-Saharan Africa Burkina Faso 85.4 79.1 64.9 40.6 81.0 66.2 41.0 59.6 34.6 13.1 72.7 1,104 Cameroon 75.5 70.1 59.1 47.4 73.2 62.7 48.7 56.0 40.0 21.6 52.1 663 Ghana 83.1 81.7 73.1 62.4 81.9 73.7 62.4 64.4 54.8 15.2 68.2 651 Kenya 96.2 95.9 92.6 86.8 95.4 92.4 85.7 83.8 78.2 3.3 69.2 1,124 Madagascar 75.0 76.5 66.3 53.8 76.5 66.3 53.8 54.0 43.4 20.0 59.1 1,072 Malawi 97.0 97.0 94.3 88.6 97.0 94.2 88.2 85.9 81.8 2.5 86.4 774 Namibia 91.2 92.5 82.4 69.5 92.5 82.4 69.5 75.6 57.8 4.8 70.1 788 Niger 39.9 36.3 24.2 20.3 35.8 24.4 20.1 27.8 17.4 58.8 35.3 1,087 Nigeria 60.6 62.6 46.5 32.9 63.0 46.7 32.9 45.6 29.0 35.9 34.7 1,380 Rwanda 96.9 96.3 95.4 91.2 96.3 95.4 91.2 89.8 86.3 2.9 87.8 1,010 Senegal 83.6 77.0 68.8 58.8 78.2 69.3 59.3 57.2 49.1 15.2 64.4 959 Sudan 76.2 76.6 68.5 59.3 76.6 69.2 60.9 61.2 51.6 21.0 46.2 1,150 Tanzania 95.4 94.3 90.4 79.8 93.8 89.1 77.1 81.2 71.2 5.2 78.1 1,616 Zambia 95.1 93.8 87.5 76.8 93.9 87.9 76.4 77.0 66.6 4.1 75.7 1,123
Near EastJ North Africa Egypt 89.5 93.1 87.8 76.4 95.0 90.1 78.9 81.5 67.4 3.8 55.2 1,594 Jordan! 16.8 97.5 96.7 94.8 97.8 97.1 95.3 89.4 87.9 2.1 64.0 1,615 Morocco 93.4 91.8 86.5 79.4 91.8 86.5 79.4 79.8 75.7 6.2 65.4 985 Turkey 89.1 94.6 88.4 77.6 94.4 87.9 77.2 77.9 64.2 3.1 41.6 716
Asia Bangladesh 85.5 84.0 77.6 66.1 84.8 78.0 66.9 68.8 59.1 14.9 45.5 1,174 Indonesia 73.6 72.6 65.4 55.8 72.6 65.4 56.1 57.5 48.3 24.0 35.2 2,670 Pakistan 69.7 67.1 60.0 42.7 67.8 60.5 42.9 50.2 35.1 28.2 29.6 1,215 Philippines 91.2 91.2 87.9 79.9 91.0 86.2 78.2 81.4 71.5 6.8 35.1 1,742
Latin America! Caribbean Bolivia 76.9 76.5 60.0 42.8 79.0 62.5 38.9 55.7 31.2 15.1 35.1 1,111 Brazil (NE) 76.1 89.6 80.8 68.0 95.2 90.0 78.1 83.1 56.0 3.1 68.4 579 Colombia 94.4 98.2 90.8 82.0 98.8 91.7 83.2 82.4 68.3 1.0 59.3 748 Dominican Republic 69.5 95.5 84.8 64.5 97.2 87.7 66.9 69.6 36.7 0.8 61.3 815 Paraguay 67.3 89.1 76.4 53.0 88.7 76.1 53.3 58.1 34.2 9.1 51.3 790 Peru 90.6 92.2 82.1 68.1 93.6 86.0 69.9 74.0 57.7 4.1 51.0 1,509
! BCG is not included in the calculation of full immunization in Jordan, because it is not required by the immunization program.
16

and the corresponding dose of polio vaccine are similar. Hence, coverage levels for OPT and polio are discussed together in this section: for example, if the coverage level for either DPTI or polio 1 has reached a given coverage level, e.g., 75 percent, the coverage for the first dose of these vaccines is said to be 75 percent.
BCG. BCG vaccination, usually given soon after birth, constitutes part of the national vaccination program in all but one of the countries surveyed. In Jordan, some children receive BCG although it is not a required part of the national program. Subsequently in this report, Jordan will not be included in discussions related to BCG vaccine. In five countries (Kenya, Malawi, Rwanda, Tanzania, and Zambia), at least 95 percent of children received BCG (Figure 5.1a). Between half and three-quarters of children were vaccinated with BCG in the Dominican Republic, Indonesia, Nigeria, Pakistan, and Paraguay, while Niger has the lowest BCG coverage levels, with only two children in five receiving the vaccine. In the remaining 16 countries, BCG coverage levels vary from 75 to 95 percent.
DPTl and poliol. The coverage rates for the first dose of OPT and/or polio vaccines are generally slightly lower than those for BCG. Coverage levels are high, 95 percent or greater, for the first dose of at least one of the multiple dose vaccines in eight surveys (Northeast Brazil, Colombia, the Dominican Republic, Egypt, Jordan, Kenya, Malawi, and Rwanda). In four countries (Cameroon, Indonesia, Nigeria, and Pakistan), only one-half to three-quarters of children received the first dose of the multiple dose vaccines, while only about one-third of children in Niger received these vaccinations. Coverage levels in the remaining 15 countries fall between 75 and 95 percent.
DPT2 and polio2. There are only two countries where at least 95 percent of children received the second dose of OPT and/or polio vaccine: Rwanda and Jordan. One-half to three-quarters of children received the second dose in nine countries (Bolivia, Burkina Faso, Cameroon, Ghana, Indonesia, Madagascar, Pakistan, Senegal, and Sudan). Somewhat less than half the children in Nigeria and about one-quarter of the children in Niger were given the second dose. In the remaining 15 countries, coverage levels range between 75 and 95 percent.
Figure 5.la Immunization coverage of BCG among children age 12-23 months, according to source of information, Demographic and Health Surveys, 1990-1994
Sub-Saharan Africa Malawi
Rwanda Kenya
Tanzania Zambia
Namibia Burkina Faso
Senegal Ghana Sudan
Cameroon Madag?lsc~r
rlllgena Niger
Morocco !55P====iiiiiiiii: Egypt Turkey n Jordan
Asia
Philippines i55555iia§iiii=::m-Bangladesh «, Inaonesia Pakistan
Latin America/Caribbean
Colombia i§§§§§i§i~i~~~:::J Peru Bolivia ,'1'1'
Brazil (NE) Dominican Rep.
Paraguay
o 20 40 60 80 100
Percent
I ilI!iI BCG CARD 1m BCG RECALL I
17

DPT3 and polio3. Jordan is the only country where the coverage rate for the third dose of the mUltiple dose vaccines reaches 95 percent. In 10 countries (Bangladesh, the Dominican Republic, Ghana, Indonesia, Madagascar, Namibia, Paraguay, Peru, Senegal, and Sudan), between half and three-quarters of children received the third dose. In four countries, coverage levels for the third dose are between roughly 40 and 50 percent (Bolivia, Burkina Faso, Cameroon, and Pakistan). About one-third of children in Nigeria and only one-fifth in Niger received the third dose. Coverage levels for the third dose of the multiple dose vaccines are between 75 and 95 percent in the remaining 11 countries. Figure 5.1b shows the coverage levels for the third dose of polio vaccine only.
Measles vaccine. Measles vaccination coverage does not reach 95 percent in any country (Figure 5.lc). The coverage rates range from just 28 percent in Niger and 46 percent in Nigeria to a high of 90 percent in Rwanda. Between one-half and three-quarters of children age 12-23 months were vaccinated against measles in 13 countries (Bangladesh, Bolivia, Burkina Faso, Cameroon, the Dominican Republic, Ghana, Indonesia, Madagascar, Pakistan, Paraguay, Peru, Senegal, and Sudan). Coverage levels are between 75 and 90 percent in another 13 countries (Northeast Brazil, Colombia, Egypt, Jordan, Kenya, Malawi, Morocco, Namibia, the Philippines, Rwanda, Tanzania, Turkey, and Zambia).
Full vaccination. The percentage of children age 12-23 months who are fully vaccinated ranges from 17 percent in Niger to a high of just 88 percent in Jordan (Figure 5.1d). At least three-quarters of children are fully vaccinated in only five countries (Jordan, Kenya, Malawi, Morocco, and Rwanda). One-third to one-half of the children are fully vaccinated in eight countries (Burkina Faso, Cameroon, the Dominican Republic, Indonesia, Madagascar, Pakistan, Paraguay, and Senegal). Less than one-third of the children have received all the vaccinations in Bolivia, Niger, and Nigeria. In the remaining 12 countries, between one-half and three-quarters of the children have received all vaccinations.
No vaccinations. The percentage of children age 12-23 months who have received none of the eight vaccinations ranges from 59 percent in Niger to less than 1 percent in the Dominican RepUblic. In 13 countries, between 5 and 24 percent of children have not received any vaccinations (Bangladesh, Bolivia, Burkina Faso, Cameroon, Ghana, Indonesia, Madagascar, Morocco, Paraguay, the Philippines, Senegal, Sudan, and Tanzania). In Niger, Nigeria, and Pakistan, large proportions of children received no vaccinations: about three-fifths, one-third, and one-quarter, respectively. In the remaining 12 countries, at most 5 percent of children have never been vaccinated.
Figure 5.1 b Immunization coverage of poli03 among children age 12-23 months, according to source of information, Demographic and Health Surveys, 1990-1994
18
Sub-Saharan Africa Rwanda Malawi Kenya
Tanzania Zambia
Namibia Ghana Sudan
Senegal Madagascar
Cameroon Burkina Faso
Nigeria Nil:ler
Near East/North Africa
Jordan 155555555i5EE§:1 ml __ Morocco !~,
Egypt Turkey
Asia
Philippines ;555iii"iWi=EP:::FI2l Bangladesh Indonesia ,,"~iinb Pakistan 11
Latin America/Caribbean
Colombia i§§§§§§~~~~~~~~ __ J Brazil ~~~ ii "l'("'" Dominican Rep.
Paraguay Bolivia
o 20 40 60 80 100
Percent
j_POLl03 CARD mPOLl03 RECALL j
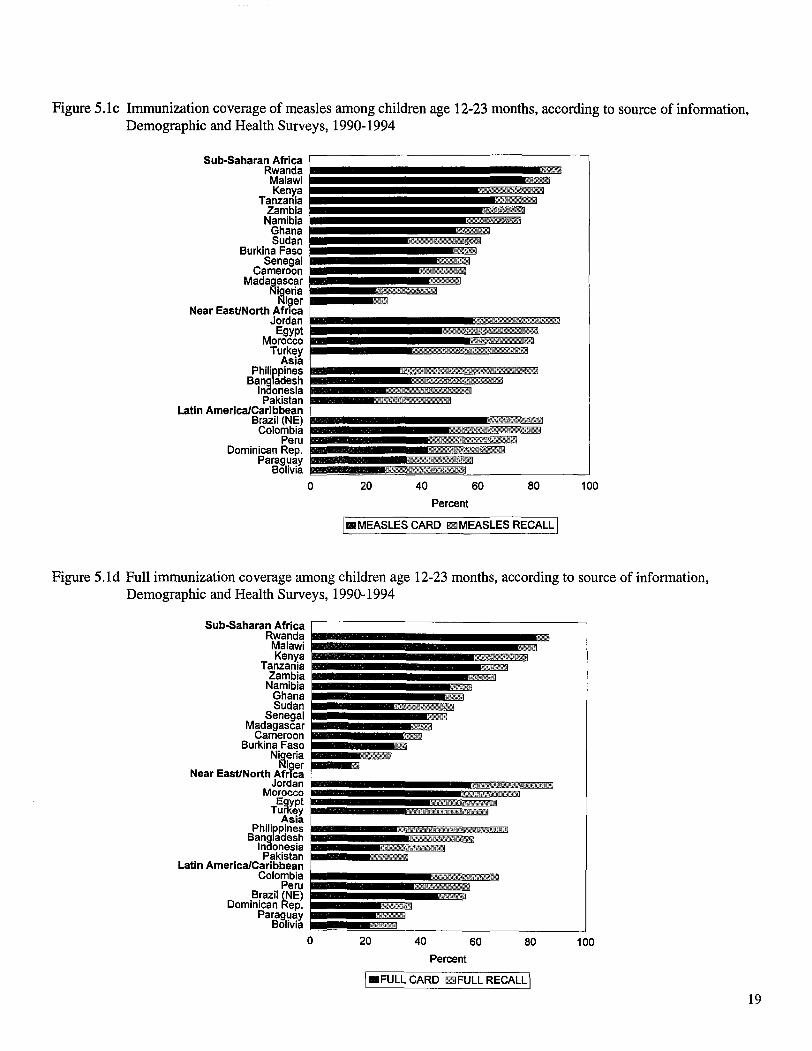
Figure 5.1c Immunization coverage of measles among children age 12-23 months, according to source of information, Demographic and Health Surveys, 1990-1994
Sub-Saharan Africa Rwanda Malawi Ken},a
Tanzania Zambia
Namibia Ghana Sudan
Senegal Cameroon
Madag?lsc~r t'hg~na
NIQer
Near East/North Africa !5555555555§5§§~:"'. Jordan " Egypt
Morocco Turkey
ASia
Bangladesh Inaonesia Pakistan
Philippines i5555555ai51=::::",_m
Latin America/Caribbean i§§ii§ii§ii~~~~~~ __ _ Brazil (NE) , ~ Colombia
Peru Dominican Rep.
Paraguay Bolivia
o 20 40 60 80 100
Percent
I II1II MEASLES CARD IllillMEASLES RECALL I
Figure 5.1 d Full immunization coverage among children age 12-23 months, according to source of information, Demographic and Health Surveys, 1990-1994
Sub-Saharan Africa ,---------------------Rwanda Malawi Kenya
Tanzania Zambia
Namibia Ghana Sudan
Senegal Madagascar
Cameroon Burkina Faso
Nig~ria Rlger
Near East/North Africa
Jordan E§§§§§§§§iiEi=P:nI!Di!!!ill!!i Morocco Egypt
TurKey Asia
Philippines !§5555i~===::-1!Di! Bangladesh Inaonesia Pakistan
Latin America/Caribbean
Colombia i§§§§§~~:::~~~ ____ J Peru Brazil (NE)
Dominican Rep. Paraguay
Bolivia
o 20 40 60 80 100
Percent
I_FULL CARD IllillFULLRECALLI
19
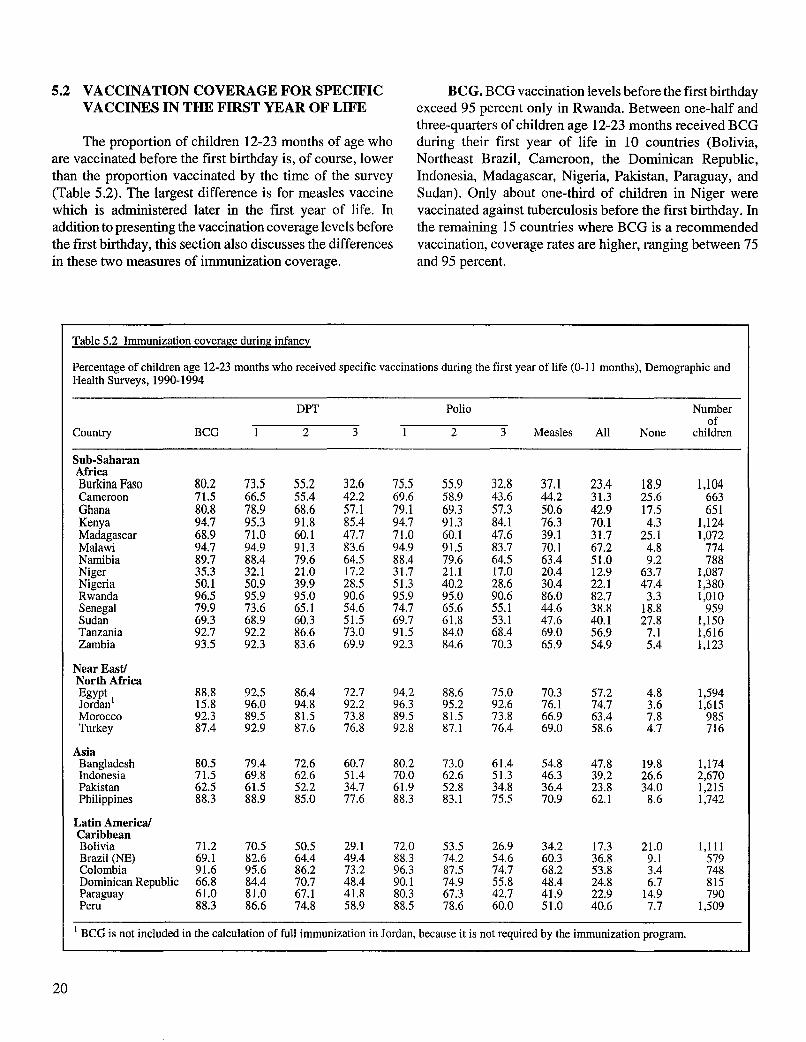
5.2 VACCINATION COVERAGE FOR SPECIFIC VACCINES IN THE FIRST YEAR OF LIFE
The proportion of children 12-23 months of age who are vaccinated before the first birthday is, of course, lower than the proportion vaccinated by the time of the survey (Table 5.2). The largest difference is for measles vaccine which is administered later in the first year of life. In addition to presenting the vaccination coverage levels before the first birthday, this section also discusses the differences in these two measures of immunization coverage.
Table 5.2 Immunization coverage during infancy
BCG. BCG vaccination levels before the first birthday exceed 95 percent only in Rwanda. Between one-half and three-quarters of children age 12-23 months received BCG during their first year of life in 10 countries (Bolivia, Northeast Brazil, Cameroon, the Dominican Republic, Indonesia, Madagascar, Nigeria, Pakistan, Paraguay, and Sudan). Only about one-third of children in Niger were vaccinated against tuberculosis before the first birthday. In the remaining 15 countries where BCG is a recommended vaccination, coverage rates are higher, ranging between 75 and 95 percent.
Percentage of children age 12-23 months who received specific vaccinations during the first year of life (0-11 months), Demographic and Health Surveys, 1990-1994
DPT Polio Number of
Country BCG 2 3 2 3 Measles All None children
Sub-Saharan Africa Burkina Faso 80.2 73.5 55.2 32.6 75.5 55.9 32.8 37.1 23.4 18.9 1,104 Cameroon 71.5 66.5 55.4 42.2 69.6 58.9 43.6 44.2 31.3 25.6 663 Ghana 80.8 78.9 68.6 57.1 79.1 69.3 57.3 50.6 42.9 17.5 651 Kenya 94.7 95.3 91.8 85.4 94.7 91.3 84.1 76.3 70.1 4.3 1,124 Madagascar 68.9 71.0 60.1 47.7 71.0 60.1 47.6 39.1 31.7 25.1 1,072 Malawi 94.7 94.9 91.3 83.6 94.9 91.5 83.7 70.1 67.2 4.8 774 Namibia 89.7 88.4 79.6 64.5 88.4 79.6 64.5 63.4 51.0 9.2 788 Niger 35.3 32.1 21.0 17.2 31.7 21.1 17.0 20.4 12.9 63.7 1,087 Nigeria 50.1 50.9 39.9 28.5 51.3 40.2 28.6 30.4 22.1 47.4 1,380 Rwanda 96.5 95.9 95.0 90.6 95.9 95.0 90.6 86.0 82.7 3.3 1,010 Senegal 79.9 73.6 65.1 54.6 74.7 65.6 55.1 44.6 38.8 18.8 959 Sudan 69.3 68.9 60.3 51.5 69.7 61.8 53.1 47.6 40.1 27.8 1,150 Tanzania 92.7 92.2 86.6 73.0 91.5 84.0 68.4 69.0 56.9 7.1 1,616 Zambia 93.5 92.3 83.6 69.9 92.3 84.6 70.3 65.9 54.9 5.4 1,123
Near Eastl North Africa Egypt 88.8 92.5 86.4 72.7 94.2 88.6 75.0 70.3 57.2 4.8 1,594 Jordan 1 15.8 96.0 94.8 92.2 96.3 95.2 92.6 76.1 74.7 3.6 1,615 Morocco 92.3 89.5 81.5 73.8 89.5 81.5 73.8 66.9 63.4 7.8 985 Turkey 87.4 92.9 87.6 76.8 92.8 87.1 76.4 69.0 58.6 4.7 716
Asia Bangladesh 80.5 79.4 72.6 60.7 80.2 73.0 61.4 54.8 47.8 19.8 1,174 Indonesia 71.5 69.8 62.6 51.4 70.0 62.6 51.3 46.3 39.2 26.6 2,670 Pakistan 62.5 61.5 52.2 34.7 61.9 52.8 34.8 36.4 23.8 34.0 1,215 Philippines 88.3 88.9 85.0 77.6 88.3 83.1 75.5 70.9 62.1 8.6 1,742
Latin America! Caribbean Bolivia 71.2 70.5 50.5 29.1 72.0 53.5 26.9 34.2 17.3 21.0 1,111 Brazil (NE) 69.1 82.6 64.4 49.4 88.3 74.2 54.6 60.3 36.8 9.1 579 Colombia 91.6 95.6 86.2 73.2 96.3 87.5 74.7 68.2 53.8 3.4 748 Dominican Republic 66.8 84.4 70.7 48.4 90.1 74.9 55.8 48.4 24.8 6.7 815 Paraguay 61.0 81.0 67.1 41.8 80.3 67.3 42.7 41.9 22.9 14.9 790 Peru 88.3 86.6 74.8 58.9 88.5 78.6 60.0 51.0 40.6 7.7 1,509
1 BCG is not included in the calculation of full immunization in Jordan, because it is not required by the immunization program.
20

For BCG, the difference between the percentage vaccinated before the first birthday and the percentage vaccinated before the date of the interview ranges from less than 1 to 11 percentage points. The difference is less than 3 percentage points in half the surveys. It is 5 percentage points or more in nine countries (Bangladesh, Bolivia, Northeast Brazil, Burkina Faso, Madagascar, Nigeria, Pakistan, Paraguay, and Sudan) and reaches 11 percentage points in Nigeria.
DPTl and poliol. In Colombia, Jordan, Kenya, and Rwanda, over 95 percent of children received the first doses of DPT and/or polio during the first year of life. There are six other countries with fairly high coverage rates for these vaccinations before the first birthday: the Dominican Republic, Egypt, Malawi, Tanzania, Turkey, and Zambia all have coverage rates between 90 and 95 percent. In eight countries (Bolivia, Cameroon, Indonesia, Madagascar, Nigeria, Pakistan, Senegal, and Sudan), between one-half and three-quarters of children received at least the first dose of the multiple dose vaccines in the first year of life, while in Niger only about one-third of children did so. In the remaining nine countries, between 75 and 90 percent of the children have received the first dose of at least one of these vaccines by their first birthday.
For the first doses of DPT and polio vaccine, the difference between the percentages vaccinated before the first birthday and by the time of the survey are similar to those seen for BCG. The difference is less than 4 percentage points in half the surveys. In 10 surveys (Bolivia, Northeast Brazil, Burkina Faso, the Dominican Republic, Madagascar, Nigeria, Pakistan, Paraguay, Peru, and Sudan), the difference is at least 5 percentage points, and it reaches 11 and 12 percentage points, respectively, in the Dominican Republic and Nigeria.
DPT2 and polio2. Coverage levels for the second dose of at least one of the multiple dose vaccines exceed 95 percent in Jordan and Rwanda, while the levels are between 90 and 95 percent in Kenya and Malawi. Between 75 and 90 percent of children received the second dose of these vaccines during their first year of life in nine countries (Colombia, Egypt, Morocco, Namibia, Peru, the Philippines, Tanzania, Turkey, and Zambia). In Nigeria, only two children in five and, in Niger, only one child in five received the second dose. Between one-half and three-quarters of children received the second dose of these vaccines by their first birthday in the remaining 13 countries.
For the second dose of the multiple dose vaccines, the difference between the percentage vaccinated by the first birthday and the percentage vaccinated by the time of the survey ranges from less than 1 to 16 percentage points; the median difference is 4 percentage points. There are 13 countries with a difference of at least 5 percentage points (Bangladesh, Bolivia, Northeast Brazil, Burkina Faso, the Dominican Republic, Madagascar, Morocco, Nigeria, Pakistan, Paraguay, Peru, Sudan, and Tanzania). The difference exceeds 10 percentage points in Northeast Brazil, Burkina Faso, and the Dominican Republic.
DPT3 and polio3. The coverage rate by the first birthday for the third dose ofDPTand/orpolio vaccines does not reach 95 percent in any country. Jordan and Rwanda have the highest coverage levels, 93 percent and 91 percent, respectively. In five countries (Egypt, Kenya, Malawi, the Philippines, and Turkey), 75 to 85 percent of children received the third dose of at least one of the vaccines. In four countries (Cameroon, Madagascar, Pakistan, and Paraguay), only between one-third and one-half of the children were given the third dose. Coverage rates for these vaccinations in the first year of life are even lower in another four countries (Bolivia, Burkina Faso, Niger, and Nigeria), ranging from 17 to 33 percent. In the remaining 13 countries, between half and three-quarters of children received the third dose.
Not surprisingly, the differences are somewhat larger for the third dose of the multiple dose vaccines than for the first and second doses when comparing vaccination coverage by the first birthday to vaccination coverage by the time of the interview. The difference in these coverage rates ranges from less than 1 percentage point for both vaccines to a high of 19 percentage points for DPT3 and a high of 24 percentage points for poli03. Across all the countries, the median difference between the percentage of children vaccinated by the first birthday and the percentage vaccinated any time before the survey is 5 percentage points. The difference exceeds 10 percentage points in four Latin American countries (Bolivia, Northeast Brazil, the Dominican Republic, and Paraguay), indicating that the third dose of the vaccines often is not given to these children until after their first birthday.
Measles vaccine. Measles vaccination coverage levels by the first birthday are highest in Jordan, Kenya, and Rwanda (76 to 86 percent). In contrast, only one-third to
21

one-half of children have been vaccinated against measles by their first birthday in 10 countries (Bolivia, Burkina Faso, Cameroon, the Dominican Republic, Indonesia, Madagascar, Pakistan, Paraguay, Senegal, and Sudan). Only one child in five in Niger and only one child in three in Nigeria received measles vaccine before their first birthday. In the remaining 13 countries, between one-half and about threequarters of children have been vaccinated against measles by their first birthday.
As expected, measles vaccine coverage by the first birthday is considerably lower than coverage by the time of the survey because there is little time between the recommended age at vaccination (9 months) and the first birthday. Coverage by the first birthday is at least 13 percentage points less than coverage by the time of the survey in half the countries. The difference ranges from a low of 4 percentage points in Rwanda to a high of 23 percentage points in Northeastern Brazil and Burkina Faso. The difference is between 10 and 20 percentage points in 19 countries and between 20 and 23 percentage points in five countries, four of which are in Latin America (Bolivia, Northeast Brazil, Burkina Faso, the Dominican Republic, and Peru).
Full vaccination. The highest coverage levels for having received all six vaccinations by the first birthday are seen in Rwanda and Jordan (83 percent and 75 percent, respectively). Only between one-third and one-half of children were fully vaccinated by the first birthday in seven countries (Bangladesh, Northeast Brazil, Ghana, Indonesia, Peru, Senegal, and Sudan). Nine countries have even lower coverage rates for full vaccination: fewer than one-third of children have received all the vaccinations in Bolivia, Burkina Faso, Cameroon, the Dominican Republic, Madagascar, Niger, Nigeria, Pakistan, and Paraguay. Coverage rates of 50 to 70 percent are found in the 10 remaining countries.
The difference between those fully vaccinated by the first birthday and by the interview date is less than 11 percentage points in half the countries. Nowhere does the difference exceed 20 percentage points.
No vaccinations. Less than 5 percent of children did not receive any vaccinations by their first birthday in seven countries (Colombia, Egypt, Jordan, Kenya, Malawi, R wanda, and Turkey). Between 5 and 10 percent of children were not vaccinated during the first year of life in another eight countries. In six countries (Bangladesh, Bolivia, Burkina Faso, Ghana, Paraguay, and Senegal), the rate for no vaccinations by the first birthday is considerably higher,
22
between 15 and 21 percent, and in another six countries (Cameroon, Indonesia, Madagascar, Nigeria, Pakistan, and Sudan), between one-quarter and one-half of the children had no vaccinations by the first birthday. The situation in Niger is even worse: almost two-thirds of children received no vaccines by the first birthday.
The median difference between the percentage of children who have received no vaccinations by their first birthday and by the day of the interview is 4 percentage points across all countries, ranging from less than 1 to 12 percentage points. The difference exceeds 10 percentage points in only one country (Nigeria), and it falls between 5 and 9 percentage points in eight countries. Differences tend to be larger in Latin American countries.
5.3 POLIO VACCINATION AT BIRTH
Surveys in the ten countries of Bolivia, Burkina Faso, the Dominican Republic, Kenya, Madagascar, Namibia, Niger, Pakistan, Peru, and Rwanda collected data on polioO. It is recommended that this initial dose of polio be given at birth; it was added to the series of polio doses (polio 1 , poli02, and poli03) when the recommended number of doses needed to vaccinate a child against polio was increased from three to four.
Prevalence levels of polioO reflect the recent introduction and promotion of this vaccination in a number of countries. For example, the promotion of polioO in Rwanda began during the interval when children age 12-23 months would have been born. Because of this, the proportion of children vaccinated with polioO does not represent equal probabilities of exposure to the vaccine in this country and in many of the other countries that have recently added this dose of polio to the immunization schedule.
As shown in Table 5.3, coverage levels for polioO among children age 12-23 months are lowest in Pakistan (11 percent), Niger (14 percent), and Madagascar (19 percent). One-third of children in Bolivia, Burkina Faso, and the Dominican Republic and almost two-thirds of children in Kenya, Namibia, and Rwanda received a dose of polio at the time of birth. Coverage of polioO is highest in Peru, where 82 percent of children received polioO.
The health card is the major source of polioO immunization information in all countries with the exception of Peru. Because mothers were not asked specifically about
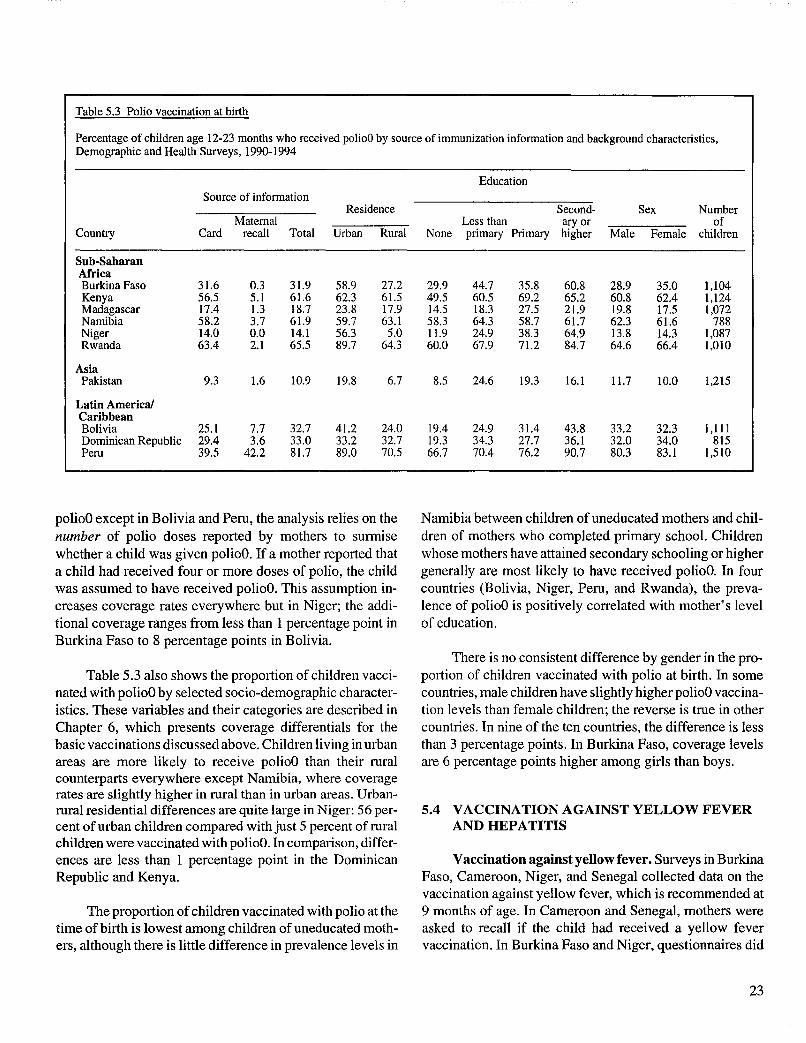
polioO except in Bolivia and Peru, the analysis relies on the number of polio doses reported by mothers to surmise whether a child was given polioO. If a mother reported that a child had received four or more doses of polio, the child was assumed to have received polioO. This assumption increases coverage rates everywhere but in Niger; the additional coverage ranges from less than 1 percentage point in Burkina Faso to 8 percentage points in Bolivia.
Table 5.3 also shows the proportion of children vaccinated with polioO by selected socio-demographic characteristics. These variables and their categories are described in Chapter 6, which presents coverage differentials for the basic vaccinations discussed above. Children living in urban areas are more likely to receive polioO than their rural counterparts everywhere except Namibia, where coverage rates are slightly higher in rural than in urban areas. Urbanrural residential differences are quite large in Niger: 56 percent of urban children compared with just 5 percent of rural children were vaccinated with polioO. In comparison, differences are less than I percentage point in the Dominican Republic and Kenya.
The proportion of children vaccinated with polio at the time of birth is lowest among children of uneducated mothers, although there is little difference in prevalence levels in
Namibia between children of uneducated mothers and children of mothers who completed primary school. Children whose mothers have attained secondary schooling or higher generally are most likely to have received polioO. In four countries (Bolivia, Niger, Peru, and Rwanda), the prevalence of polioO is positively correlated with mother's level of education.
There is no consistent difference by gender in the proportion of children vaccinated with polio at birth. In some countries, male children have slightly higher polioO vaccination levels than female children; the reverse is true in other countries. In nine of the ten countries, the difference is less than 3 percentage points. In Burkina Faso, coverage levels are 6 percentage points higher among girls than boys.
5.4 VACCINATION AGAINST YELLOW FEVER AND HEPATITIS
Vaccination against yellow fever. Surveys in Burkina Faso, Cameroon, Niger, and Senegal collected data on the vaccination against yellow fever, which is recommended at 9 months of age. In Cameroon and Senegal, mothers were asked to recall if the child had received a yellow fever vaccination. In Burkina Faso and Niger, questionnaires did
23

not seek maternal recall of yellow fever vaccinations; instead, the surveys presumed that children were vaccinated against yellow fever depending upon the number of doses mothers reported for oral polio vaccine and the number of vaccination injections the child had been given. If a mother reported two doses of oral polio and three or more injections, the child was considered to have been vaccinated against yellow fever; the two doses of oral polio represented poliol and poli02 and the three injections were assumed to represent poli03 (as DPTP), measles vaccine, and yellow fever, in that order. Based on similar logic, if a mother reported that the child had received three doses of oral polio and two or more injections, the three doses of polio reflected polio!, poli02 and poli03, respectively, with the injections representing vaccinations against measles and yellow fever. This assumption expanded coverage levels for yellow fever in Burkina Faso and Niger by about 1 percent. Yellow fever vaccination information comes primarily from the health card. While mothers in Senegal reported that 11 percent of children age 12-23 months had received the yellow fever
vaccination, in Burkina Paso, Cameroon, and Niger, only 2 percent of children or less were reported to have received this vaccine.
Coverage of the yellow fever vaccination among children is fairly high in Burkina Faso and Senegal: about onehalf of children age 12-23 months received this vaccination (Table 5.4). Coverage is lower in Niger (22 percent) and extremely low in Cameroon (2 percent). Among children with health cards in Cameroon, less than 1 percent have been vaccinated against yellow fever, indicating that this vaccine is not reaching the children it is intended for, perhaps because the vaccine has only recently been added to the immunization program.
Table 5.4 Vaccination against yellow fever
The proportion of children vaccinated against yellow fever is also shown for a broader age group of children, those 12-59 months of age. When older children are included in the analysis, the percentage vaccinated against yellow fever is higher, especially in Senegal where coverage increases from 55 percent of children age 12-23 months to 68 percent of children age 12-59 months.
Table 5.4 also presents yellow fever vaccination coverage by selected socio-demographic characteristics (see Chapter 6 for a description of the variables). Urban-rural differences in the proportion of children vaccinated against yellow fever are quite prominent in Burkina Faso, Niger, and Senegal. The largest residential differences appear in Niger where 52 percent of urban children, but only 16 percent of rural children, received a yellow fever vaccination. Burkina Faso has an I1-percentage-point difference in yellow fever vaccination coverage levels between urban and rural children; the difference in Senegal is 20 percentage points. In Burkina Faso, Niger and Senegal, children of
uneducated mothers are the least likely to receive a yellow fever vaccination, and coverage increases with the level of mother's education. In all countries, female children are slightly more likely than male children to have received a vaccination to prevent yellow fever.
Vaccination against hepatitis. Information about hepatitis vaccination was collected in Egypt. Because this vaccination was recently added to the immunization program, only a small proportion of children had received this vaccine: 4 percent of children age 12-23 months received the first dose of hepatitis vaccine, and less than 1 percent received the second and third doses (findings not shown).
Percentage vaccinated against yellow fever among children age 12-23 months by source of immunization information and characteristics, and percentage vaccinated among children 12-59 months of age, Demographic and Health Surveys, 1990-1994
12-23 months of age
Source of information Education
Age Residence Less Second- Sex Number 12-59
Maternal than aryor of months Country Card recall Total Urban Rural None primary Primary higher Male Female children total
Sub-Saharan Africa Burkina Faso 49.1 1.2 50.3 59.6 48.7 48.8 51.5 55.2 82.9 48.4 52.3 1,104 56.0 Cameroon 0.3 2.0 2.3 2.3 2.3 2.2 1.1 3.0 3.2 2.2 2.4 663 5.0 Niger 21.3 0.6 21.9 52.2 15.5 19.7 36.3 38.3 63.8 20.4 23.8 1,087 25.4 Senegal 44.5 10.5 55.1 68.1 47.8 50.1 67.7 75.7 89.4 53.4 56.8 959 67.7
24

5.5 AGE AT VACCINATION
Table 5.5 summarizes the age at vaccination among children 12-23 months of age. The table focuses on the proportion of children who received their vaccinations at the recommended ages, that is, 0-3 months for BCG, 2-4 months for DPT1, and 4-6 months for DPT3. For measles vaccination, three ages at vaccination are examined: less than 8 months, 8 months, and the recommended age of 9-11 months. The recommended age for measles vaccination represents a balance. Children who are vaccinated too young may not develop antibodies to the measles virus because of the presence of maternal antibodies which are passively transferred to the child in utero. Waiting too long to vaccinate children, however, exposes them to the risk of developing measles, which, in tum, increases their susceptibility to other infections, such as tuberculosis, diarrheal illnesses, and pneumonia, and increases their risk of becoming undernourished and of dying. Hence information about the age at measles vaccination is of interest to immunization programs.
In order to examine the timeliness of these vaccinations, the findings in Table 5.5 are compared with those in Table 5.2. In other words, the proportion of children vaccinated at the recommended age is compared with the proportion vaccinated at any time during the first year of life. The discussion revolves around what percentage of first-year vaccinations were administered at the optimal time.
In eight of the countries where BCG is included in the immunization program (Northeast Brazil, Indonesia, Madagascar, Niger, Nigeria, Pakistan, Paraguay, and Sudan), fewer than half the children vaccinated against tuberculosis in the first year were given BCG during the first four months of life. Between half and almost three-quarters of the children vaccinated received BCG at the recommended age in another eight countries (Bangladesh, Bolivia, Burkina Faso, Cameroon, the Dominican RepUblic, Ghana, the Philippines, and Senegal). Over three-quarters of the children vaccinated were given BeG in the first four months of life in the remaining 11 countries.
Between 75 and 90 percent of children given DPTl in the first year of life received the vaccination at the age of 2-4 months in seven countries (Colombia, Egypt, Jordan, the Philippines, Peru, Turkey, and Zambia). In the remaining 21 countries, a lower proportion of vaccinated children received DPTI at the recommended age, ranging from a little more than half the children in Nigeria to 70 percent in several countries.
The proportions of vaccinated children who received DPT3 on time (age 4-6 months) are quite similar to the proportions calculated for on-time administration ofDPTl with the exception of six countries. In Northeast Brazil, Bolivia, Colombia, the Dominican Republic, Egypt, and Zambia, a considerably smaller proportion of DPT3 vaccinations than of DPT1 vaccinations were administered at the recommended ages, suggesting that DPT3 vaccinations are not given on time in these countries.
Table 5.5 Immunization coverage by age
Among children age 12-23 months, the percentage who were vacci-nated at about the recommended age (in months) with BeG, DPTl, DPT3, and measles vaccine, Demographic and Health Surveys, 1990-1994
BCG DPTI DPT3 Measles vaccination
Country 0-3 2-4 4-6 <8 8 9-11
Sub-Saharan Africa Burkina Paso 64.7 47.6 19.3 1.3 2.3 33.5 Cameroon 57.0 41.9 27.5 3.9 3.0 37.3 Ghana 61.8 50.3 33.0 6.0 1.9 42.6 Kenya 89.3 60.1 58.1 4.l 6.5 65.8 Madagascar 45.8 38.9 27.5 2.5 2.6 34.0 Malawi 84.2 69.5 54.7 4.7 3.3 62.2 Namibia 84.3 53.3 40.5 6.3 2.8 54.3 Niger 24.5 19.2 11.6 5.7 1.5 13.2 Nigeria 36.3 27.5 18.7 3.1 1.9 25.4 Rwanda 94.l 66.2 65.2 5.3 2.9 77.9 Senegal 65.8 46.1 34.6 4.2 3.8 36.6 Sudan 41.2 39.5 30.7 7.7 6.6 33.2 Tanzania 79.1 50.4 39.3 6.0 7.9 55.2 Zambia 77.3 74.2 45.3 4.1 6.5 55.3
Near Eastl North Africa Egypt 83.6 83.0 46.0 2.2 4.4 63.6 Jordan 14.8 85.0 72.6 2.8 1.9 71.3 Morocco 87.3 57.5 53.2 1.2 3.7 62.0 Turkey 76.7 79.5 53.6 3.6 4.7 60.8
Asia Bangladesh 50.9 50.0 37.0 3.3 3.8 47.6 Indonesia 46.5 45.9 27.4 5.5 5.8 35.0 Pakistan 40.3 37.0 20.9 2.3 1.7 32.4 Philippines 69.6 71.5 56.3 5.9 1.7 63.2
Latin America! Caribbean Bolivia 52.8 41.1 8.0 2.0 2.1 30.0 Brazil (NE) 46.4 56.1 11.6 1.9 1.6 56.8 Colombia 77.3 73.7 26.3 4.8 4.2 59.3 Dominican Republic 57.0 60.8 21.4 1.8 0.6 45.9
Paraguay 44.5 49.4 23.2 5.0 1.7 35.2 Peru 79.5 68.3 35.7 2.7 2.7 45.5
25
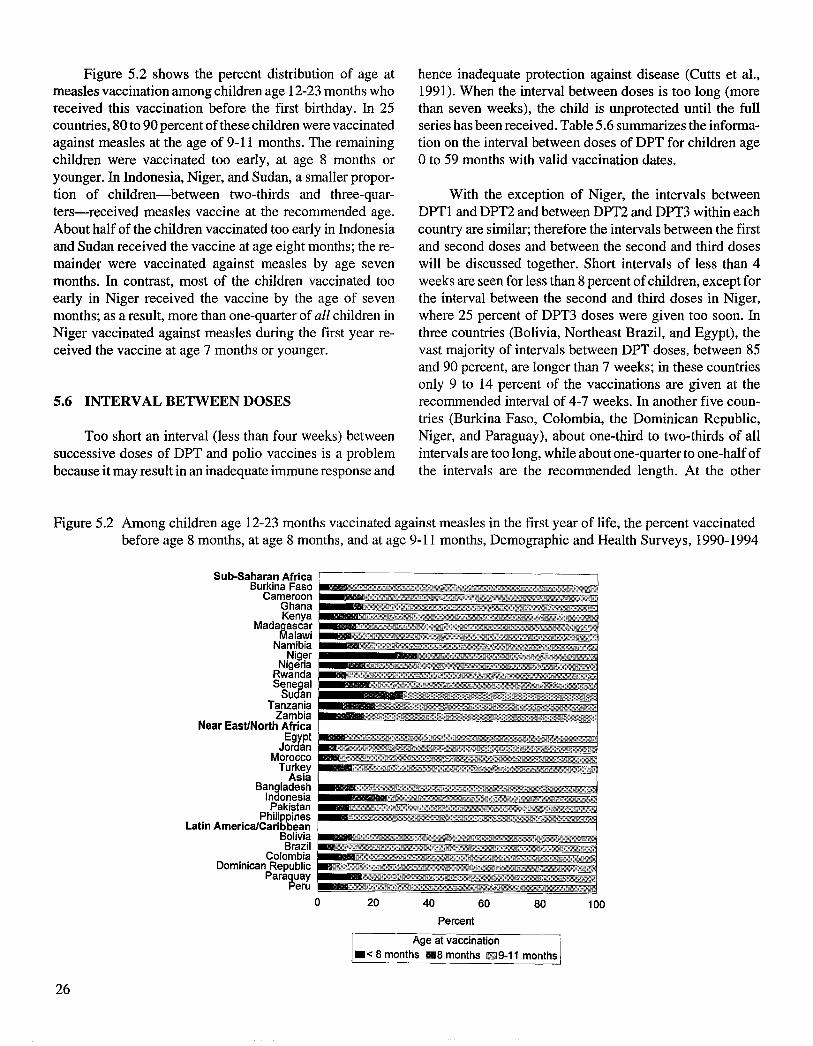
Figure 5.2 shows the percent distribution of age at measles vaccination among children age 12-23 months who received this vaccination before the first birthday. In 25 countries, 80 to 90 percent of these children were vaccinated against measles at the age of 9-11 months. The remaining children were vaccinated too early, at age 8 months or younger. In Indonesia, Niger, and Sudan, a smaller proportion of children-between two-thirds and three-quarters-received measles vaccine at the recommended age. About half of the children vaccinated too early in Indonesia and Sudan received the vaccine at age eight months; the remainder were vaccinated against measles by age seven months. In contrast, most of the children vaccinated too early in Niger received the vaccine by the age of seven months; as a result, more than one-quarter of all children in Niger vaccinated against measles during the first year received the vaccine at age 7 months or younger.
5.6 INTERVAL BETWEEN DOSES
Too short an interval (less than four weeks) between successive doses of DPT and polio vaccines is a problem because it may result in an inadequate immune response and
hence inadequate protection against disease (Cutts et al., 1991). When the interval between doses is too long (more than seven weeks), the child is unprotected until the full series has been received. Table 5.6 summarizes the information on the interval between doses of DPT for children age o to 59 months with valid vaccination dates.
With the exception of Niger, the intervals between DPTl and DPT2 and between DPT2 and DPT3 within each country are similar; therefore the intervals between the first and second doses and between the second and third doses will be discussed together. Short intervals of less than 4 weeks are seen for less than 8 percent of children, except for the interval between the second and third doses in Niger, where 25 percent of DPT3 doses were given too soon. In three countries (Bolivia, Northeast Brazil, and Egypt), the vast majority of intervals between DPT doses, between 85 and 90 percent, are longer than 7 weeks; in these countries only 9 to 14 percent of the vaccinations are given at the recommended interval of 4-7 weeks. In another five countries (Burkina Faso, Colombia, the Dominican Republic, Niger, and Paraguay), about one-third to two-thirds of all intervals are too long, while about one-quarter to one-half of the intervals are the recommended length. At the other
Figure 5.2 Among children age 12-23 months vaccinated against measles in the first year of life, the percent vaccinated before age 8 months, at age 8 months, and at age 9-11 months, Demographic and Health Surveys, 1990-1994
Sub-Saharan Africa Burkina Faso c': ,(
Cameroon ;;: Ghana t'> 1
Kenya : ~'" < ,;'
Mada~ascar J.~l ~; ~
alawi ,.: Namibia
Niger ~Hi , ;; " Nigeria \\
Rwanda :; ~
sen~al Su an 8r L p l'
Tanzania u ~Kf'
Zambia %yn~·~@:ji
Near East/North Africa '% ," '{'< m
EY;Pt j?:;"
Jar an lJ 1 'tM, 'jf\
Morocco /1
Turkey ! ' , A
Asia Bangladesh > A
j, / , ';," <
Indonesia Pakistan ii: '" h.' ,,'
Philig~nes ~),"
Latin America/Cari ean Bolivia 5 5l~
Brazil Colombia
Dominican Republic ~ ,~tAf
Para~uay eru H" ,
0 20 40 60 80 100
Percent
Age at vaccination .< 8 months I11III8 months 1llEJ9-11 months
26

Table 5.6 Interval between DPT vaccinations
Percent distribution of children age 0-59 months with valid immunization dates for DPTl, DPT2 and DPT3, by length of interval between doses, Demographic and Health Surveys, 1990-1994
Interval between DPT1 and DPT2 Interval between DPT2 and DPT3
<4 4-7 >7 <4 4-7 >7 Country weeks weeks weeks Total Number weeks weeks weeks Total Number
Sub-Saharan Africa Burkina Faso 4.7 35.0 60.3 100.0 2,625 4.6 44.1 51.3 100.0 1,744 Cameroon 5.3 68.5 26.1 100.0 1,027 5.5 66.9 27.7 100.0 880 Ghanal 3.0 61.4 35.6 100.0 1,023 2.6 58.1 39.3 100.0 855 Kenya 4.7 81.3 14.0 100.0 3,010 6.0 77.3 16.8 100.0 2,836 Madagascar 7.0 73.2 19.8 100.0 2,149 5.3 70.6 24.1 100.0 1,879 Malawi 4.5 62.9 32.7 100.0 2,209 3.6 57.2 39.2 100.0 2,015 Namibia 4.8 61.2 34.0 100.0 1,617 4.8 64.8 30.4 100.0 1,428 Niger 4.0 48.3 47.7 100.0 953 25.1 45.2 29.8 100.0 793 Nigeria 6.7 67.3 26.0 100.0 1,314 7.6 64.8 27.6 100.0 972 Rwanda 3.8 87.7 8.5 100.0 3,636 3.5 84.8 11.7 100.0 3,488 Senegal 6.3 64.6 29.1 100.0 2,085 6.6 60.3 33.1 100.0 1,825 Sudan 2.9 72.0 25.1 100.0 1,652 3.4 73.0 23.6 100.0 1,358 Tanzania 6.3 60.4 33.3 100.0 4,190 6.0 56.7 37.3 100.0 3,777 Zambia 4.8 64.6 30.6 100.0 2,961 3.4 64.4 32.2 100.0 2,667
Near Eastl North Africa Egypt 1.4 14.1 84.5 100.0 3,115 1.1 14.2 84.7 100.0 2,762 Jordan 3.0 83.8 13.2 100.0 4,263 2.8 81.3 15.9 100.0 4,120 Morocco 2.2 77.8 20.0 100.0 2,343 1.6 75.5 22.9 100.0 2,203 Turkey 2.9 76.9 20.2 100.0 916 3.3 74.4 22.2 100.0 833
Asia BangladeshI 5.7 67.8 26.5 100.0 1,133 4.7 67.2 28.2 100.0 976 Indonesia 4.9 58.4 36.6 100.0 2,497 5.7 55.9 38.4 100.0 2,195 Pakistan 4.9 70.7 24.5 100.0 1,037 3.7 69.6 26.7 100.0 897 Philippines 5.7 71.0 23.3 100.0 2,104 4.7 70.1 25.2 100.0 1,892
Latin America! Caribbean Bolivial 2.7 11.5 85.9 100.0 685 2.l 11.8 86.0 100.0 504 Brazil (NE) 1.3 8.8 89.8 100.0 1,752 0.9 10.8 88.3 100.0 1,573 Colombia 6.5 27.0 66.5 100.0 1,432 8.0 26.5 65.5 100.0 1,284 Dominican Republic 3.8 41.7 54.6 100.0 1,018 4.5 38.4 57.2 100.0 859 Paraguay 8.4 48.0 43.6 100.0 1,216 8.0 47.6 44.4 100.0 993 Peru 4.2 57.3 38.6 100.0 2,973 4.7 52.9 42.4 100.0 2,699
I Children age 0-35 months
end of the spectrum are five countries (Jordan, Kenya, and Pison, 1994; Kahn et aI., 1995). Missed opportunities Morocco, Rwanda, and Turkey) where 75 to 88 percent of are particularly unfortunate when a child receives one all intervals are of the recommended length. In these coun-· needed vaccination but, at the same time, is not given tries, only 9 to 23 percent of the intervals are longer than 7 another vaccination for which he or she also is eligible. weeks. In the remaining 15 countries, between half and three-quarters of the intervals are 4-7 weeks and between 20 Table 5.7 presents the number of children age 12-23 and 42 percent are longer than 7 weeks. months with a health card who received a dose of DPT,
polio, or BeG at 9-11 months of age and, of these, the pro-portion who did not receive a measles vaccination. In most
5.7 MISSED OPPORTUNITIES FOR MEASLES countries, between 10 and 20 percent of opportunities to VACCINATION vaccinate against measles were missed, with slightly more
missed opportunities in Indonesia, Morocco, Pakistan, Vaccination coverage could be increased if all oppor- Senegal, and Turkey. The Dominican Republic shows the
tunities to vaccinate eligible children were utilized (du Lou highest proportion of missed opportunities, 34 percent. In
27
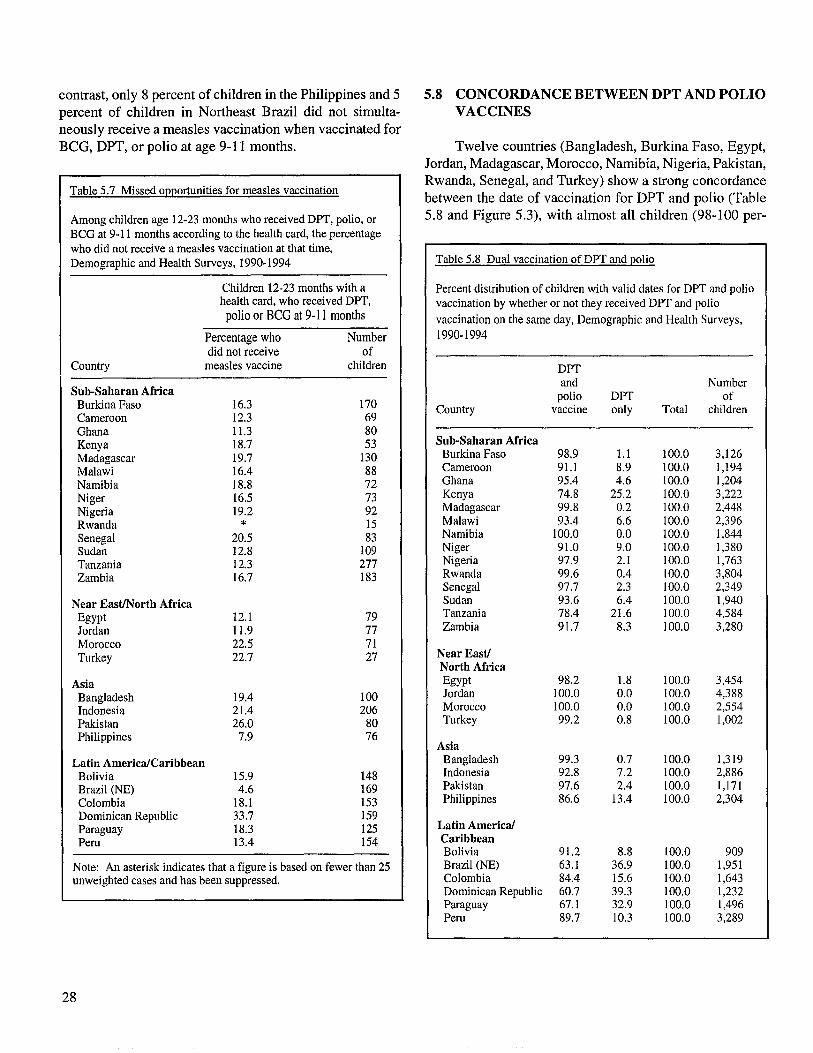
contrast, only 8 percent of children in the Philippines and 5 5.8 CONCORDANCE BETWEEN DPT AND POLIO percent of children in Northeast Brazil did not simulta- VACCINES neously receive a measles vaccination when vaccinated for BeG, DPT, or polio at age 9-11 months. Twelve countries (Bangladesh, Burkina Faso, Egypt,
Jordan, Madagascar, Morocco, Namibia, Nigeria, Pakistan,
Table 5.7 Missed opportunities for measles vaccination Rwanda, Senegal, and Turkey) show a strong concordance between the date of vaccination for DPT and polio (Table
Among children age 12-23 months who received DPT, polio, or 5.8 and Figure 5.3), with almost all children (98-100 per-BCG at 9-11 months according to the health card, the percentage who did not receive a measles vaccination at that time, Demographic and Health Surveys, 1990-1994 Table 5.8 Dual vaccination of DPT and polio
Children 12-23 months with a Percent distribution of children with valid dates for DPT and polio health card, who received DPT, vaccination by whether or not they received DPT and polio
polio or BeG at 9-11 months vaccination on the same day, Demographic and Health Surveys,
Percentage who Number 1990-1994 did not receive of
Country measles vaccine children DPT
Sub-Saharan Africa and Number
Burkina Faso 16.3 170 polio DPT of
Cameroon 12.3 69 Country vaccine only Total children
Ghana 11.3 80 Kenya 18.7 53 Sub-Saharan Africa
Madagascar 19.7 130 Burkina Faso 98.9 1.1 100.0 3,126
Malawi 16.4 88 Cameroon 91.1 8.9 100.0 1,194
Namibia 18.8 72 Ghana 95.4 4.6 100.0 1,204
Niger 16.5 73 Kenya 74.8 25.2 100.0 3,222
Nigeria 19.2 92 Madagascar 99.8 0.2 100.0 2,448
Rwanda * 15 Malawi 93.4 6.6 100.0 2,396
Senegal 20.5 83 Namibia 100.0 0.0 100.0 1,844
Sudan 12.8 109 Niger 91.0 9.0 100.0 1,380
Tanzania 12.3 277 Nigeria 97.9 2.1 100.0 1,763
Zambia 16.7 183 Rwanda 99.6 0.4 100.0 3,804 Senegal 97.7 2.3 100.0 2,349
Near EastINorth Africa Sudan 93.6 6.4 100.0 1,940
Egypt 12.1 79 Tanzania 78.4 21.6 100.0 4,584
Jordan 11.9 77 Zambia 91.7 8.3 100.0 3,280
Morocco 22.5 71 Turkey 22.7 27 Near East!
North Africa
Asia Egypt 98.2 1.8 100.0 3,454
Bangladesh 19.4 100 Jordan 100.0 0.0 100.0 4,388
Indonesia 21.4 206 Morocco 100.0 0.0 100.0 2,554
Pakistan 26.0 80 Turkey 99.2 0.8 100.0 1,002
Philippines 7.9 76 Asia
Latin America!Caribbean Bangladesh 99.3 0.7 100.0 1,319
Bolivia 15.9 148 Indonesia 92.8 7.2 100.0 2,886
Brazil (NE) 4.6 169 Pakistan 97.6 2.4 100.0 1,171
Colombia 18.1 153 Philippines 86.6 13.4 100.0 2,304
Dominican Republic 33.7 159 Paraguay 18.3 125 Latin America!
Peru 13.4 154 Caribbean Bolivia 91.2 8.8 100.0 909
Note: An asterisk indicates that a figure is based on fewer than 25 Brazil (NE) 63.1 36.9 100.0 1,951 unweighted cases and has been suppressed. Colombia 84.4 15.6 100.0 1,643
Dominican Republic 60.7 39.3 100.0 1,232 Paraguay 67.1 32.9 100.0 1,496 Peru 89.7 10.3 100.0 3,289
28

Figure 5.3 Percentage of children with valid immunization dates for DPTI according to whether a polio vaccination was received on the same day, Demographic and Health Surveys, 1990-1994
Sub-Saharan Africa
Cameroon Ghana Kenya
Madagascar Malawi
Namibia Niger
Nigeria Rwanda Senegal
Sudan Tanzania
Zambia Near East/North Africa
Egypt !5555555555555555i Jordan Morocco
Turkey Asia
Bangladesh !555555555555555§5l Indonesia Pakistan
Philippines Latin America/Caribbean
Bolivia i§§§§§§§§§§!§§§iii Brazil Colombia '1p
Dominican Republic ' ' , Paraquay
Peru
o 20 40 60 80 100
Percent
~and Polio UDPT only I
cent) receiving polio and DPT vaccines on the same day. In contrast, there are eight countries where DPT and polio vaccine often are not given together; in these countries, between 10 and almost 40 percent of children vaccinated with DPT were not given polio vaccine at the same time. Aside from Kenya, the Philippines, and Tanzania, all of these countries are in Latin America, probably reflecting the fact that the drive to eradicate poliomyelitis in Latin America often employs campaigns in which only polio vaccine is administered; hence many children are given DPT at another time (without polio vaccine). In Northeast Brazil, the Dominican Republic, and Paraguay one-third or more of the children were not given polio vaccine at the same time as they were given DPT. In Colombia and Peru, the proportions are somewhat lower: 16 and 10 percent, respectively. Intermediate percentages of children (5 to 9 percent) not receiving polio vaccine when they are given DPT are seen in the remaining 8 countries (Bolivia, Cameroon, Ghana, Indonesia, Malawi, Niger, Sudan, and Zambia).
5.9 DROP-OUT RATES FOR MULTIPLE DOSE VACCINES
Table 5.9 shows the drop-out rates for DPT and polio. The drop-out rate is calculated as the percentage point difference between successive doses of a vaccine, expressed as a percentage of the first dose: (DPTl - DPT2)100 / DPTl. In Burkina Faso, for example, the difference between DPTl and DPT2 coverage is 14 percentage points (79 percent minus 65 percent), which gives a drop-out rate of 18 percent.
The drop-out rate between the first and third doses of a vaccine indicates the proportion of children who initiated, but did not complete, the series of vaccinations. The dropout rate between the first and third doses for both DPT and polio vaccines is less than 10 percent in only three countries: Jordan, Malawi, and Rwanda. High drop-out rates of 25 to 50 percent are seen in 10 countries (B oli via,
29

Burkina Faso, Cameroon, the Dominican Republic, Mada-Table 5.9 Drop-out rates for DPT and polio
gascar, Niger, Nigeria, Pakistan, Paraguay, and Peru). Inter-mediate drop-out rates of 10 to 25 percent for at least one of Percentage of children age 12-23 months who receive a given the two vaccines are seen in the remaining 15 countries. vaccination but who do not go on to receive the subsequent dose,
Demographic and Health Surveys, 1990-1994
Drop-out rates for DPT are generally similar to those Drop-out rates 1
for polio. The largest difference between the drop-out rates for DPT and polio vaccines is seen in Northeast Brazil, DPT Polio Number
where the drop-out rate between the first and third doses of of Country 1-2 2-3 1-3 1-2 2-3 1-3 children
DPT is 24 percent, compared with 18 percent for polio. Not surprisingly, the drop-out rate between the second and third Sub-Saharan doses of the vaccines is always greater than the drop-out Africa
rate between the first and second doses, with the exception Burkina Faso 17.9 37.4 48.6 18.2 38.1 49.3 1,104 Cameroon 15.6 19.9 32.4 14.4 22.4 33.5 663
of Niger. Ghana 10.5 14.7 23.7 9.9 15.4 23.8 651 Kenya 3.4 6.2 9.4 3.1 7.2 10.2 1,124 Madagascar 13.2 18.8 29.6 13.3 18.8 29.7 1,072 Malawi 2.7 6.1 8.6 2.8 6.4 9.1 774 Namibia 11.0 15.6 24.9 11.0 15.6 24.9 788 Niger 33.3 16.1 44.0 32.0 17.5 43.9 1,087 Nigeria 25.8 29.3 47.5 25.9 29.5 47.8 1,380 Rwanda 0.9 4.4 5.3 0.9 4.4 5.3 1,010 Senegal 10.6 14.5 23.6 11.3 14.4 24.1 959 Sudan 10.6 13.5 22.6 9.6 12.1 20.5 1,150 Tanzania 4.1 11.7 15.3 4.9 13.5 17.8 1,616 Zambia 6.7 12.2 18.1 6.4 13.2 18.7 1,123
Near Eastl North Africa Egypt 5.7 13.0 17.9 5.1 12.4 16.9 1,594 Jordan 0.8 2.0 2.7 0.7 1.9 2.6 1,615 Morocco 5.8 8.2 13.5 5.8 8.2 13.5 985 Turkey 6.6 12.1 17.9 6.9 12.1 18.2 716
Asia Bangladesh 7.5 14.8 21.3 8.0 14.2 2Ll 1,174 Indonesia 9.9 14.7 23.2 9.9 14.2 22.7 2,670 Pakistan 10.7 28.8 36.4 10.8 29.0 36.7 1,215 Philippines 3.6 9.1 12.4 5.3 9.3 14.1 1,742
Latin America! Caribbean Bolivia 21.6 28.6 44.1 19.3 28.1 42.0 1,111 Brazil (NE) 9.9 15.8 24.2 5.5 13.2 17.9 579 Colombia 7.5 9.7 16.5 7.2 9.2 15.7 748 Dominican Republic ILl 24.0 32.5 9.7 23.7 3Ll 815
Paraguay 14.2 30.6 40.5 14.2 29.9 39.9 791 Peru 11.0 17.1 26.2 8.2 18.7 25.4 1,509
1 Drop-out rate: Between DPTI and OPT2: (OPTI - DPT2) * 100 I OPTI Between OPT2 and OPT3: (DPT2 - DPT3) * 100 I OPT2 Between DPTI and DPT3: (DPTI - OPT3) * 100 I OPT3
30

6 Differentials in Vaccination Coverage
Tables 6.1 through 6.6 show socio-demographic differentials in six different measures of vaccination coverage: the percentage of children who received BCG, the first dose of polio vaccine, the third dose of polio vaccine, measles vaccine, full vaccination, and no vaccinations. The tables show the differences in coverage rates according to urban-rural place of residence, mother's education, mother's age at the time of delivery, child's birth order, child's sex, length of the preceding birth interval, and presence of a radio in the household.
6.1 URBAN-RURAL RESIDENCE
The de Jacto place of residence is used in the analyses presented here. Because urban-rural place of residence reflects the classification used by the census organization in each country, the size of cities and towns defined as urban may differ from country to country. Urban-rural place of residence is not available for analysis of the Malawi data.
Urban children have a clear advantage over rural children with regard to vaccination coverage rates. This holds true for almost all vaccinations across all countries. There is only one exception: in Colombia, the measles vaccination rate is 8 percentage points lower in urban than in rural areas. Not surprisingly, the urban advantage tends to be greater when national, or overall, coverage rates are lower. Generally, the largest differences are seen for the third dose of polio vaccine, measles vaccine, and/or full vaccination.
In five countries (Jordan, Kenya, Namibia, the Philippines, and Rwanda), there is only a small urban advantage, and differences are relatively modest (less than 10 percentage points) for all six measures of vaccination coverage. Large differences, ranging from 20 to about 60 percentage points, are seen for at least one measure of vaccination coverage in 11 countries (Burkina Faso, Ghana, Indonesia, Morocco, Niger, Nigeria, Pakistan, Paraguay, Peru, Senegal, and Turkey). Urban-rural differences are intermediate in size, reaching from 10 to 20 percentage points for at least one measure of vaccination coverage, in the remaining 10 countries (Bolivia, Northeast Brazil, Cameroon, Colombia, the Dominican Republic, Egypt, Madagascar, Sudan, Tanzania, and Zambia).
The proportion of children who have received no vaccinations is higher in rural than in urban areas in almost all of the surveys. In 14 countries, at most 3 percent of urban children reportedly never received any vaccinations. In the remaining countries, 5 to 16 percent of urban children were never vaccinated. In contrast, the proportion of rural children who were never vaccinated is very high in many countries, especially in Niger, where two out of every three rural children have never been vaccinated; in Nigeria, where two out of every five rural children have received no vaccines; and in Pakistan, where one out of every three rural children has never been vaccinated. Between 14 and 30 percent of rural children have never received any vaccinations in 10 countries (Bangladesh, Bolivia, Burkina Faso, Cameroon, Ghana, Indonesia, Madagascar, Paraguay, Senegal, and Sudan). In the rural areas of the remaining countries, between 1 and 9 percent of children were never vaccinated (Northeast Brazil, Colombia, the Dominican Republic, Egypt, Jordan, Kenya, Morocco, Namibia, Peru, the Philippines, Rwanda, Tanzania, Turkey, and Zambia).
More than three-quarters of urban children are fully vaccinated in only six countries: Egypt, Kenya, Jordan, Morocco, Rwanda, and Tanzania. In a further four countries, one in Asia (Pakistan) and three in Latin America (Bolivia, the Dominican Republic, and Paraguay), less than half of urban children have received all the vaccinations. In the remaining 17 countries, between half and three-quarters of children are fully vaccinated. The situation in rural areas is quite different. Three-quarters or more of rural children are fully vaccinated only in Jordan, Kenya, and Rwanda. Between half and three-quarters of rural children are fully vaccinated in nine countries (Bangladesh, Colombia, Egypt, Morocco, Namibia, the Philippines, Tanzania, Turkey, and Zambia), while less than half of rural children have received all vaccinations in the remaining 15 countries.
6.2 MOTHER'S LEVEL OF EDUCATION
The mother's level of education is examined because it is expected that vaccination levels would be higher among children of better educated mothers. Four education categories are used: (i) those who received no formal schooling; (ii) those who began but did not complete their primary
31

W tv
Table 6.1 Immunization coverage of BCG by background characteristics
Percentage of children age 12-23 months who were vaccinated with BCG, based on health card information and maternal recall, by selected background characteristics, Demographic and Health Surveys, 1990-1994
Education Mother's age
Residence Less Second- Birth order at delivery Sex Birth interval (months) Radio Number than Pri- ary or of
Country Urban Rural None primary mary higher 2-3 4-5 6+ <20 20-34 35+ Male Female <24 24-35 36-47 48+ No Yes children
Sub-Saharan Africa Burkina Faso 95.8 83.6 84.6 88.5 88.5 100.0 87.7 86.8 84.6 83.1 87.6 85.8 81.8 83.5 87.4 84.6 83.8 85.9 86.1 80.3 90.3 1,104 Cameroon 85.3 68.8 58.2 79.0 85.9 91.1 79.7 78.6 75.4 69.3 75.7 75.8 73.6 76.4 74.6 70.7 75.5 75.8 73.7 65.2 80.8 663 Ghana 93.4 78.6 73.4 81.7 89.9 100.0 88.0 83.3 85.3 73.7 82.0 84.7 76.3 84.6 81.4 68.1 77.4 82.8 90.0 78.6 88.9 651 Kenya 98.9 95.8 89.0 96.9 98.8 98.0 96.1 97.6 99.0 91.9 94.3 97.4 92.1 96.6 95.9 96.8 96.1 95.8 96.6 95.0 97.2 1,124 Madagascar 87.5 73.2 63.7 75.3 87.5 82.4 81.2 75.9 73.8 71.2 75.6 75.4 72.6 78.7 71.1 73.0 77.3 70.0 70.5 71.1 82.5 1,072 Malawi U U 95.4 98.5 99.0 100.0 99.6 98.5 96.3 94.8 97.6 97.4 95.1 95.8 98.3 97.2 96.2 97.0 95.7 95.9 98.5 774 Namibia 92.9 90.4 82.2 90.9 95.0 94.9 90.6 91.6 89.8 92.8 87.1 92.1 91.7 91.7 90.7 89.2 91.6 94.3 91.3 88.9 92.3 788 Niger 89.4 29.3 36.8 59.8 100.0 94.7 44.3 44.1 36.4 37.0 40.4 39.6 40.6 38.0 42.2 31.8 44.5 37.7 38.9 32.8 49.1 1,087 Nigeria 81.3 55.0 46.2 74.1 81.2 91.9 58.4 62.9 63.5 57.0 52.6 62.7 60.9 59.5 61.7 62.0 64.3 57.3 57.8 49.0 70.0 1,380 Rwanda 98.5 96.8 96.4 96.7 99.4 100.0 98.8 97.9 96.4 95.2 98.3 96.9 96.3 97.5 96.3 96.5 97.4 96.7 93.6 95.5 99.2 1,010 Senegal 93.3 78.3 81.3 87.7 95.7 97.9 88.8 86.9 80.3 80.9 80.1 85.1 81.0 81.0 86.5 75.0 84.9 81.0 85.3 77.1 86.0 959 Sudan 85.3 71.0 67.4 79.9 82.8 92.4 85.6 77.3 74.8 69.8 79.6 76.6 70.1 77.5 74.7 73.5 72.0 79.2 72.7 65.7 83.8 1,150 Tanzania 99.3 94.4 90.9 94.7 98.7 100.0 97.5 96.4 94.8 93.0 98.9 95.3 91.8 95.5 95.4 97.6 95.2 95.0 92.0 94.0 97.7 1,616 Zambia 98.3 92.4 87.1 93.6 97.8 99.2 97.1 96.4 95.1 92.0 95.2 95.5 92.5 95.7 94.5 91.8 94.2 96.6 95.3 92.0 98.8 1,123
Near Eastl North Africa Egypt 94.0 86.7 85.0 88.3 98.1 97.3 94.7 91.6 88.1 80.8 92.3 90.2 81.6 89.0 89.9 87.7 87.5 86.6 89.8 86.8 91.2 1,594 Jordan 20.4 8.3 14.4 19.0 18.3 16.8 16.4 16.8 16.7 17.0 19.3 16.3 17.5 16.8 16.8 17.0 16.3 21.2 13.4 16.4 16.8 1,615 Morocco 99.7 90.2 91.7 100.0 100.0 100.0 92.7 95.7 92.9 91.7 94.8 94.1 90.8 94.4 92.4 93.9 92.6 93.7 94.7 91.0 93.9 985 Turkey 93.2 83.2 72.6 91.8 96.0 99.1 91.9 92.1 79.1 79.4 85.7 90.3 83.5 87.0 91.6 82.6 85.2 86.4 93.8 83.1 91.3 716
Asia Bangladesh 91.3 84.9 80.3 89.2 92.6 96.0 87.7 86.4 86.2 79.0 83.7 86.1 86.0 88.5 82.5 82.5 84.0 87.8 84.3 83.7 91.4 1,174 Indonesia 86.2 68.0 54.2 66.0 77.8 90.1 82.0 76.5 68.5 54.8 75.9 74.0 68.0 74.8 72.4 65.0 64.7 69.8 76.5 66.1 79.7 2,670 Pakistan 84.2 62.9 62.9 81.8 94.1 93.1 76.6 71.4 65.4 66.4 62.0 71.7 63.4 72.8 66.7 69.0 71.0 62.5 66.7 65.7 76.4 1,215 Philippines 93.0 89.4 51.2 83.1 92.1 95.0 96.2 93.6 89.2 83.1 91.1 91.9 87.7 91.5 90.8 89.6 87.7 91.6 91.5 a a 1,742
Latin America! Caribbean Bolivia 86.3 67.2 61.6 74.7 66.3 85.9 84.1 80.7 71.6 67.2 76.3 78.9 68.2 78.7 75.2 76.3 71.9 73.0 78.1 65.4 80.2 1,111 Brazil (NE) 84.3 67.1 60.8 77.2 93.5 96.1 90.0 78.0 68.2 65.5 81.7 78.4 63.9 78.3 73.7 70.5 72.1 70.7 73.8 69.8 80.0 579 Colombia 94.3 94.5 89.8 94.5 97.0 93.7 95.1 95.6 88.7 95.6 92.2 94.8 94.6 94.9 93.8 94.2 96.8 92.0 92.4 90.9 95.3 748 Dominican Republic 77.7 58.5 46.0 67.5 80.5 73.6 75.9 72.8 63.6 43.6 66.1 70.4 66.8 66.2 73.1 69.3 62.8 64.0 69.0 63.5 74.4 815 Paraguay 86.0 52.0 33.7 50.7 76.8 89.6 80.5 73.0 60.3 52.1 62.0 70.2 59.6 67.4 67.3 61.2 60.2 56.5 73.8 50.5 71.2 790 Peru 95.5 83.2 78.0 82.8 87.8 96.8 93.0 93.1 90.8 80.5 88.4 91.6 87.5 90.3 90.9 89.3 88.3 89.5 91.6 83.4 92.3 1,509
U = Unknown (not available) a Question not asked in the Philippines

Table 6.2 Immunization coverage of ~olio 1 by background characteristics
Percentage of children age 12-23 months who were vaccinated with poliol, based on health card information and maternal recall, by selected background characteristics, Demographic and Health Surveys, 1990-1994
Education Mother's age
Residence Less Second- Birth order at delivery Sex Birth interval (months) Radio Number than Pri- ary or of
Country Urban Rural None primary mary higher 2-3 4-5 6+ <20 20-34 35+ Male Female <24 24-35 36-47 48+ No Yes children
Sub-Saharan Africa Burkina Faso 92.4 79.0 80.2 79.3 87.4 98.6 80.4 83.1 80.8 79.3 76.7 83.1 76.7 79.1 82.9 81.5 80.2 80.6 83.5 75.6 86.3 1,104 Cameroon 81.9 67.3 55.1 78.1 85.1 87.5 78.7 77.6 71.4 65.9 74.2 74.3 65.2 73.6 72.8 71.9 73.8 70.2 67.6 64.3 77.8 663 Ghana 92.4 77.3 70.7 79.3 90.7 97.8 87.3 83.3 81.4 72.9 77.5 84.3 74.2 82.3 81.4 66.0 76.3 80.6 89.3 77.0 88.2 651 Kenya 98.6 94.8 87.0 95.7 98.3 98.4 96.5 97.2 96.9 90.5 94.1 96.4 91.1 95.2 95.7 94.8 96.0 92.6 95.7 93.6 96.8 1,124 Madagascar 86.3 75.1 62.8 77.6 87.5 83.9 84.2 75.5 76.2 72.8 75.2 77.3 74.8 79.0 73.8 74.1 75.9 72.2 76.0 72.5 84.0 1,072 Malawi U U 94.8 99.1 99.0 100.0 99.6 98.5 96.3 94.6 97.6 97.8 93.8 95.8 98.2 97.2 95.9 97.6 95.3 95.8 98.5 774 Namibia 93.3 92.1 83.6 92.7 95.0 95.8 92.8 93.2 93.7 89.7 90.2 93.4 91.2 92.5 92.5 87.3 95.5 94.2 91.8 89.7 94.1 788 Niger 79.5 26.5 32.4 57.6 100.0 96.2 40.4 41.2 33.9 30.9 36.1 36.0 34.5 33.5 38.6 29.4 39.7 32.6 34.8 28.8 44.8 1,087 Nigeria 83.7 57.4 49.6 75.4 81.7 92.8 59.7 64.5 66.1 61.1 55.2 64.9 64.3 61.4 64.6 66.3 65.1 60.4 61.5 51.7 72.2 1,380 Rwanda 97.8 96.2 95.4 96.6 99.4 97.9 97.0 97.9 96.4 94.4 98.3 96.3 95.7 97.0 95.6 96.5 97.3 96.7 91.8 95.0 98.8 1,010 Senegal 90.1 71.6 75.2 80.0 95.7 100.0 85.0 82.9 73.6 74.4 77.9 78.4 77.7 76.5 80.0 71.7 79.2 73.3 80.0 67.6 82.1 959 Sudan 86.0 71.3 67.2 80.3 82.8 94.8 86.5 78.9 73.6 70.1 78.9 77.0 71.5 77.0 76.2 74.3 72.5 78.6 72.7 66.7 83.8 1,150 Tanzania 97.2 92.9 88.4 93.3 97.5 100.0 95.7 96.0 91.3 91.3 97.5 93.8 89.1 94.7 92.8 93.1 93.4 93.8 92.2 92.1 96.6 1,616 Zambia 96.4 91.8 85.4 91.1 97.4 99.2 97.0 95.9 93.3 89.9 95.3 94.2 90.2 95.1 92.8 88.5 94.5 93.4 93.1 91.0 97.5 1,123
Near East! North Africa Egypt 96.7 93.9 93.0 94.9 99.2 98.0 98.4 95.5 95.0 89.8 95.9 95.3 92.0 95.1 94.8 95.0 90.9 94.3 97.2 93.6 95.8 1,594 Jordan 97.8 97.7 95.1 95.0 99.5 99.0 97.7 99.5 98.0 96.5 98.0 98.3 95.6 97.4 98.2 98.2 97.0 98.0 98.4 95.6 98.2 1,615 Morocco 99.7 87.8 89.6 100.0 100.0 100.0 90.5 94.4 91.6 89.9 89.6 93.0 88.5 93.4 90.2 92.8 90.1 93.7 93.5 88.2 92.5 985 Turkey 94.3 94.5 87.4 95.6 97.3 98.6 95.0 97.2 87.1 90.1 92.2 95.0 92.6 94.4 94.4 90.4 94.2 94.5 97.0 93.1 94.9 716
Asia Bangladesh 91.0 84.1 79.2 88.4 92.8 95.9 87.2 85.8 85.4 77.5 84.3 85.0 83.9 87.5 82.0 80.6 81.8 88.6 84.1 82.3 92.4 1,174 Indonesia 85.7 66.8 55.9 67.2 73.6 88.6 81.4 75.1 69.2 51.8 73.7 73.7 63.7 73.1 72.1 66.3 61.3 69.1 75.8 64.9 78.9 2,670 Pakistan 84.2 60.2 60.5 86.0 93.8 91.7 72.5 69.3 67.3 63.2 60.1 69.7 62.8 70.3 65.4 71.6 66.4 63.5 64.0 63.8 75.1 1,215 Philippines 92.9 89.1 51.2 83.0 92.3 94.6 95.6 93.0 89.6 83.6 91.2 91.9 86.5 91.0 91.0 90.2 88.0 91.0 90.2 a a 1,742
Latin America! Caribbean Bolivia 87.3 70.5 66.3 75.0 72.6 90.7 82.8 82.6 77.1 70.6 77.2 81.6 69.3 82.2 76.0 77.1 77.7 76.8 79.7 73.0 80.8 1,111 Brazil (NE) 96.9 93.3 88.5 97.3 100.0 98.9 98.5 95.5 97.5 90.1 94.9 96.2 91.8 95.7 94.7 93.0 93.8 92.2 97.4 93.9 96.0 579 Colombia 98.7 98.8 93.6 98.3 98.9 99.6 98.9 99.2 98.0 97.9 97.4 99.0 99.4 98.7 98.8 100.0 97.9 97.4 98.7 97.6 99.1 748 Dominican Republic 97.7 96.4 84.3 98.7 98.5 98.0 98.0 97.6 96.9 92.6 98.0 97.6 88.2 96.3 98.1 96.4 94.9 96.2 99.7 96.7 97.6 815 Paraguay 95.4 83.2 67.5 82.3 93.0 97.8 90.8 92.3 84.8 85.0 89.4 88.6 88.8 87.7 89.9 86.3 86.4 88.2 93.1 85.5 89.5 790 Peru 96.8 88.8 86.5 87.9 93.2 97.3 96.4 95.4 92.4 86.4 94.1 94.2 90.1 94.3 93.0 93.3 92.3 92.2 92.1 89.9 94.6 1,509
U = Unknown (not available) a Question not asked in the Philippines
\.N \.N
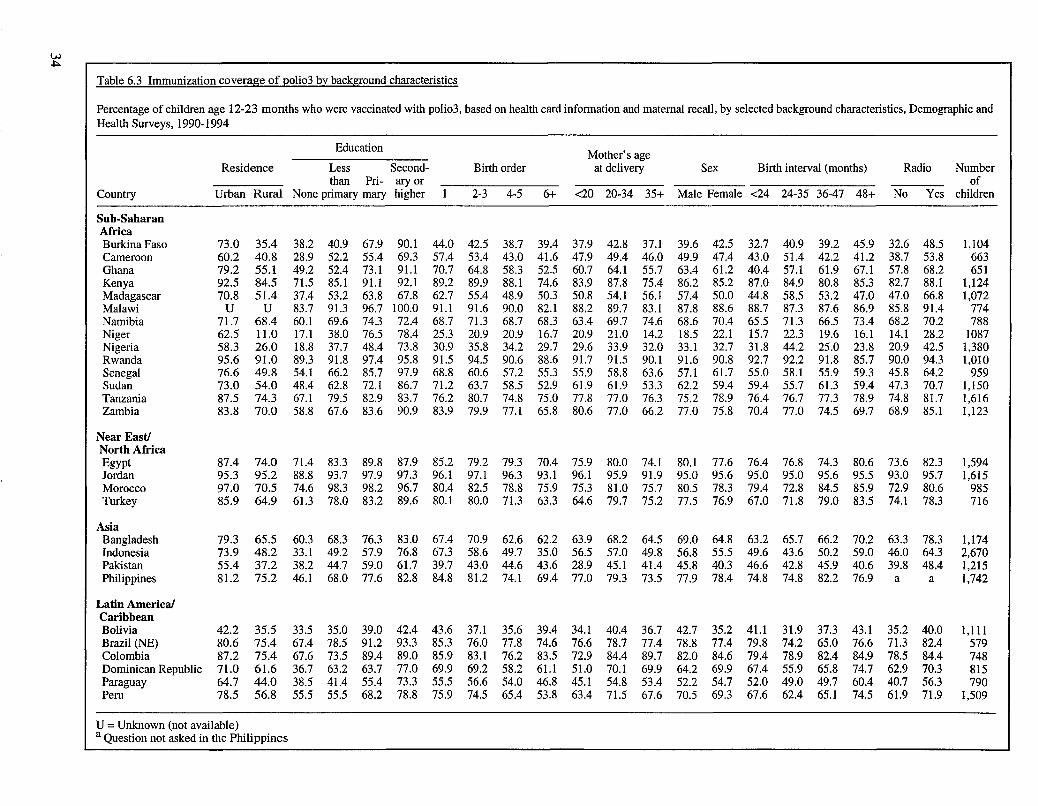
w .j:>.
Table 6.3 Immunization coverage of :Qoli03 by background characteristics
Percentage of children age 12-23 months who were vaccinated with poli03, based on health card information and maternal recall, by selected background characteristics, Demographic and Health Surveys, 1990-1994
Education Mother's age
Residence Less Second- Birth order at delivery Sex Birth interval (months) Radio Number than Pri- ary or of
Country Urban Rural None primary mary higher 2-3 4-5 6+ <20 20-34 35+ Male Female <24 24-35 36-47 48+ No Yes children
Sub-Saharan Africa Burkina Faso 73.0 35.4 38.2 40.9 67.9 90.1 44.0 42.5 38.7 39.4 37.9 42.8 37.1 39.6 42.5 32.7 40.9 39.2 45.9 32.6 48.5 1,104 Cameroon 60.2 40.8 28.9 52.2 55.4 69.3 57.4 53.4 43.0 41.6 47.9 49.4 46.0 49.9 47.4 43.0 51.4 42.2 41.2 38.7 53.8 663 Ghana 79.2 55.1 49.2 52.4 73.1 91.1 70.7 64.8 58.3 52.5 60.7 64.1 55.7 63.4 61.2 40.4 57.1 61.9 67.1 57.8 68.2 651 Kenya 92.5 84.5 71.5 85.1 91.1 92.1 89.2 89.9 88.1 74.6 83.9 87.8 75.4 86.2 85.2 87.0 84.9 80.8 85.3 82.7 88.1 1,124 Madagascar 70.8 51.4 37.4 53.2 63.8 67.8 62.7 55.4 48.9 50.3 50.8 54.1 56.l 57.4 50.0 44.8 58.5 53.2 47.0 47.0 66.8 1,072 Malawi U U 83.7 91.3 96.7 100.0 91.1 91.6 90.0 82.1 88.2 89.7 83.1 87.8 88.6 88.7 87.3 87.6 86.9 85.8 91.4 774 Namibia 71.7 68.4 60.1 69.6 74.3 72.4 68.7 71.3 68.7 68.3 63.4 69.7 74.6 68.6 70.4 65.5 71.3 66.5 73.4 68.2 70.2 788 Niger 62.5 11.0 17.1 38.0 76.5 78.4 25.3 20.9 20.9 16.7 20.9 21.0 14.2 18.5 22.l 15.7 22.3 19.6 16.1 14.l 28.2 1087 Nigeria 58.3 26.0 18.8 37.7 48.4 73.8 30.9 35.8 34.2 29.7 29.6 33.9 32.0 33.1 32.7 31.8 44.2 25.0 23.8 20.9 42.5 1,380 Rwanda 95.6 91.0 89.3 91.8 97.4 95.8 91.5 94.5 90.6 88.6 91.7 91.5 90.1 91.6 90.8 92.7 92.2 91.8 85.7 90.0 94.3 1,010 Senegal 76.6 49.8 54.1 66.2 85.7 97.9 68.8 60.6 57.2 55.3 55.9 58.8 63.6 57.1 61.7 55.0 58.1 55.9 59.3 45.8 64.2 959 Sudan 73.0 54.0 48.4 62.8 72.1 86.7 71.2 63.7 58.5 52.9 61.9 61.9 53.3 62.2 59.4 59.4 55.7 61.3 59.4 47.3 70.7 1,150 Tanzania 87.5 74.3 67.1 79.5 82.9 83.7 76.2 80.7 74.8 75.0 77.8 77.0 76.3 75.2 78.9 76.4 76.7 77.3 78.9 74.8 81.7 1,616 Zambia 83.8 70.0 58.8 67.6 83.6 90.9 83.9 79.9 77.1 65.8 80.6 77.0 66.2 77.0 75.8 70.4 77.0 74.5 69.7 68.9 85.1 1,123
Near Eastl North Africa Egypt 87.4 74.0 71.4 83.3 89.8 87.9 85.2 79.2 79.3 70.4 75.9 80.0 74.l 80.l 77.6 76.4 76.8 74.3 80.6 73.6 82.3 1,594 Jordan 95.3 95.2 88.8 93.7 97.9 97.3 96.1 97.1 96.3 93.1 96.l 95.9 91.9 95.0 95.6 95.0 95.0 95.6 95.5 93.0 95.7 1,615 Morocco 97.0 70.5 74.6 98.3 98.2 96.7 80.4 82.5 78.8 75.9 75.3 81.0 75.7 80.5 78.3 79.4 72.8 84.5 85.9 72.9 80.6 985 Turkey 85.9 64.9 61.3 78.0 83.2 89.6 80.1 80.0 71.3 63.3 64.6 79.7 75.2 77.5 76.9 67.0 71.8 79.0 83.5 74.1 78.3 716
Asia Bangladesh 79.3 65.5 60.3 68.3 76.3 83.0 67.4 70.9 62.6 62.2 63.9 68.2 64.5 69.0 64.8 63.2 65.7 66.2 70.2 63.3 78.3 1,174 Indonesia 73.9 48.2 33.l 49.2 57.9 76.8 67.3 58.6 49.7 35.0 56.5 57.0 49.8 56.8 55.5 49.6 43.6 50.2 59.0 46.0 64.3 2,670 Pakistan 55.4 37.2 38.2 44.7 59.0 61.7 39.7 43.0 44.6 43.6 28.9 45.1 41.4 45.8 40.3 46.6 42.8 45.9 40.6 39.8 48.4 1,215 Philippines 81.2 75.2 46.1 68.0 77.6 82.8 84.8 81.2 74.1 69.4 77.0 79.3 73.5 77.9 78.4 74.8 74.8 82.2 76.9 a a 1,742
Latin America! Caribbean Bolivia 42.2 35.5 33.5 35.0 39.0 42.4 43.6 37.1 35.6 39.4 34.1 40.4 36.7 42.7 35.2 41.1 31.9 37.3 43.1 35.2 40.0 1,111 Brazil (NE) 80.6 75.4 67.4 78.5 91.2 93.3 85.3 76.0 77.8 74.6 76.6 78.7 77.4 78.8 77.4 79.8 74.2 65.0 76.6 71.3 82.4 579 Colombia 87.2 75.4 67.6 73.5 89.4 89.0 85.9 83.1 76.2 83.5 72.9 84.4 89.7 82.0 84.6 79.4 78.9 82.4 84.9 78.5 84.4 748 Dominican Republic 71.0 61.6 36.7 63.2 63.7 77.0 69.9 69.2 58.2 61.1 51.0 70.1 69.9 64.2 69.9 67.4 55.9 65.8 74.7 62.9 70.3 815 Paraguay 64.7 44.0 38.5 41.4 55.4 73.3 55.5 56.6 54.0 46.8 45.1 54.8 53.4 52.2 54.7 52.0 49.0 49.7 60.4 40.7 56.3 790 Peru 78.5 56.8 55.5 55.5 68.2 78.8 75.9 74.5 65.4 53.8 63.4 71.5 67.6 70.5 69.3 67.6 62.4 65.1 74.5 61.9 71.9 1,509
U = Unknown (not available) a Question not asked in the Philippines

Table 6.4 Immunization coverage against measles by background characteristics
Percentage of children age 12-23 months who were vaccinated with measles, based on health card information and maternal recall, by selected background characteristics, Demographic and Health Surveys, 1990-1994
Education Mother's age
Residence Less Second- Birth order at delivery Sex Birth interval (months) Radio Number than Pri- ary or of
Country Urban Rural None primary mary higher 2-3 4-5 6+ <20 20-34 35+ Male Female <24 24-35 36-47 48+ No Yes children
Sub·Saharan Africa Burkina Faso 77.4 56.4 58.0 54.0 75.8 95.7 65.9 58.8 60.6 55.3 53.9 61.3 58.2 58.0 61.I 52.3 61.2 54.2 59.8 50.9 67.5 1,104 Cameroon 63.2 51.0 35.2 61.0 66.4 74.6 64.2 60.5 53.9 46.8 58.3 55.2 55.8 58.0 53.8 47.3 53.0 63.5 52.7 45.2 61.5 663 Ghana 80.2 57.5 52.3 59.8 72.4 93.3 73.3 67.8 59.0 53.4 64.0 65.6 58.8 62.5 66.4 51.I 59.9 58.2 70.0 59.5 70.7 651 Kenya 84.0 83.7 68.8 81.5 88.4 93.7 89.9 89.6 83.3 70.5 86.0 84.6 74.8 83.2 84.4 82.7 81.0 80.8 84.9 78.5 87.8 1,124 Madagascar 66.7 52.2 41.3 53.6 66.2 64.2 65.0 56.5 48.7 48.5 54.4 55.9 45.9 55.5 52.4 48.9 56.0 51.2 46.2 47.0 67.3 1,072 Malawi U U 79.7 90.8 96.7 98.2 96.5 88.5 83.4 79.6 90.3 86.8 78.9 86.3 85.4 84.2 81.9 87.1 83.3 78.9 86.0 774 Namibia 77.8 74.4 59.6 74.8 80.2 83.0 80.3 80.2 73.2 63.3 79.2 75.6 71.9 76.8 74.3 72.0 73.3 76.7 73.9 69.3 78.5 788 Niger 63.5 20.2 25.2 43.8 61.7 78.4 34.9 31.6 27.2 22.2 32.6 27.4 23.4 25.5 30.6 21.8 29.1 28.5 26.0 23.9 33.1 1,087 Nigeria 67.7 39.7 33.8 50.0 61.3 77.3 44.4 47.0 51.9 39.5 40.8 46.6 47.8 45.1 46.2 45.7 49.6 40.7 44.0 34.3 54.7 1,380 Rwanda 94.1 89.6 87.5 90.8 91.3 99.3 92.7 92.6 88.1 86.8 90.1 90.8 86.6 90.3 89.3 91.2 88.6 91.3 85.7 87.9 94.1 1,010 Senegal 70.5 49.9 52.4 66.2 80.0 91.5 65.0 58.6 58.2 52.1 53.7 57.3 59.8 55.7 58.9 50.8 54.5 54.9 63.3 44.3 61.9 959 Sudan 69.9 56.3 50.3 63.2 68.9 84.8 73.4 64.7 58.1 52.0 65.3 60.9 59.1 62.2 60.1 58.6 56.3 61.3 58.7 49.8 69.5 1,150 Tanzania 91.6 78.5 70.5 81.7 88.0 93.8 88.2 83.7 75.6 76.7 84.2 80.9 79.0 81.3 8l.I 79.0 78.1 80.5 80.4 79.4 84.6 1,616 Zambia 81.3 73.4 68.2 70.4 79.0 90.4 84.9 79.8 75.7 68.6 80.8 78.0 66.1 77.2 76.9 71.0 75.8 74.3 76.0 72.0 83.0 1,123
Near East! North Africa Egypt 87.7 77.9 74.9 82.5 88.6 91.8 87.4 85.1 79.4 70.4 80.1 82.8 74.2 81.7 81.2 78.8 79.1 83.1 78.8 77.0 84.4 1,594 Jordan 88.5 91.6 84.8 88.0 92.9 90.7 91.4 91.0 87.8 88.2 90.1 89.8 87.1 89.4 89.5 88.1 88.4 92.5 91.9 83.7 90.4 1,615 Morocco 93.7 72.8 76.0 94.9 94.6 93.4 83.8 82.1 78.3 75.9 81.8 81.2 74.8 79.7 79.9 81.1 75.6 78.2 83.5 78.5 80.1 985 Turkey 82.1 71.9 63.0 77.1 83.5 89.3 81.6 82.4 64.5 62.7 73.3 79.2 72.9 77.8 78.0 74.7 71.4 73.3 81.0 74.9 78.9 716
Asia Bangladesh 77.9 67.7 61.0 72.3 77.7 87.2 72.7 71.4 65.3 60.8 69.1 68.4 72.3 72.4 65.1 65.7 66.0 70.6 67.7 64.8 81.7 1,174 Indonesia 74.0 50.2 34.1 51.8 59.8 76.0 66.5 61.4 52.0 35.3 61.6 57.4 52.6 57.0 58.0 52.3 46.1 52.1 60.9 39.6 55.4 2,670 Pakistan 64.6 43.6 43.6 73.2 61.1 76.5 57.0 50.6 48.4 46.5 41.2 52.9 41.4 54.6 46.1 54.2 49.0 43.3 45.5 45.1 59.2 1,215 Philippines 83.7 79.2 48.2 70.9 81.1 86.2 86.5 84.2 78.2 74.3 77.4 82.7 77.5 81.4 81.5 77.9 81.0 82.6 80.6 a a 1,742
Latin America! Caribbean Bolivia 60.4 51.1 40.2 48.0 49.2 68.4 63.1 58.9 50.5 46.5 53.4 58.4 45.2 60.4 51.1 56.2 48.7 50.8 59.0 43.9 59.1 1,111 Brazil (NE) 87.1 78.8 79.3 81.9 79.8 96.3 93.2 82.9 74.8 79.3 88.9 83.0 79.1 80.5 86.1 77.1 80.5 71.3 88.7 79.7 85.2 579 Colombia 79.7 87.7 76.2 82.0 92.3 79.2 86.0 83.6 78.0 68.9 83.8 83.6 71.5 81.7 83.1 79.3 76.6 84.9 81.4 82.0 82.5 748 Dominican Republic 75.9 61.2 53.4 62.3 64.4 80.6 78.6 72.3 52.3 56.6 75.1 69.3 59.1 66.1 73.4 66.2 60.7 64.1 71.3 64.2 73.9 815 Paraguay 65.0 52.4 31.8 50.3 61.4 71.1 67.7 58.0 56.5 49.7 59.2 58.2 56.7 55.5 61.2 55.7 51.2 51.5 59.3 52.8 59.3 790 Peru 78.9 66.4 66.2 65.4 75.0 78.4 79.0 77.1 70.8 61.6 65.9 76.4 68.4 72.4 75.6 71.0 72.6 69.1 73.3 67.8 75.5 1,509
U = Unknown (not available) a Question not asked in the Philippines
\,N VI
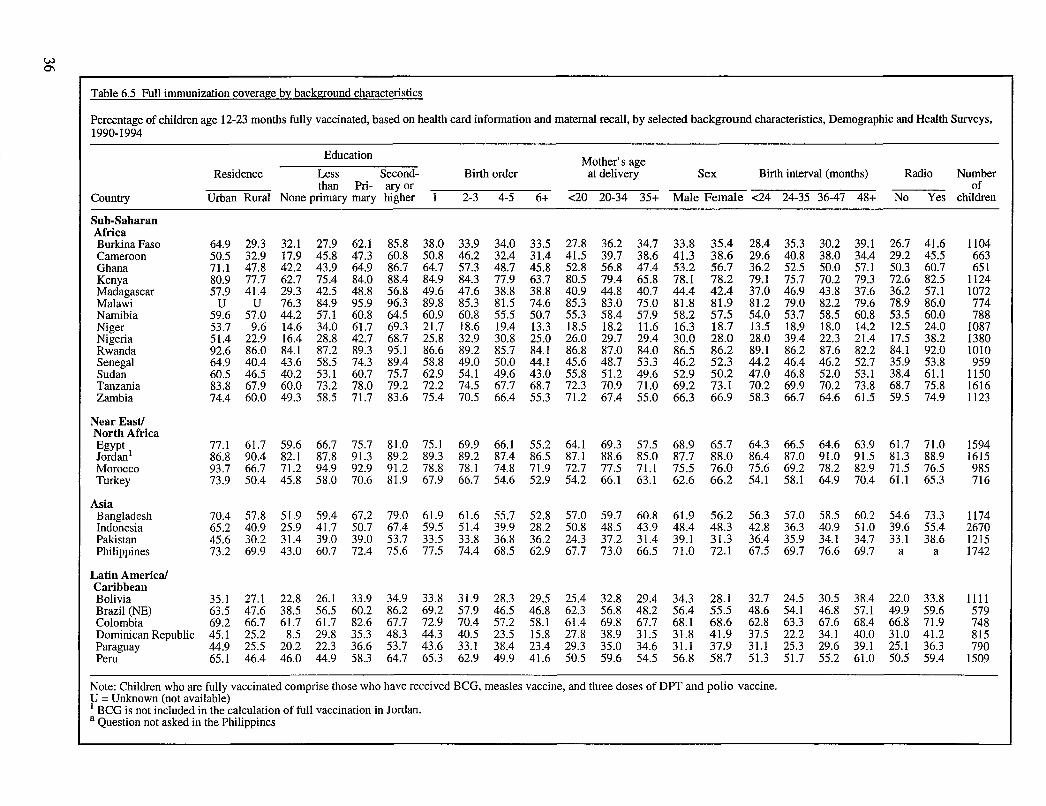
W 0'1
Table 6.5 Full immunization coverage by background characteristics
Percentage of children age 12-23 months fully vaccinated, based on health card information and maternal recall, by selected background characteristics, Demographic and Health Surveys, 1990-1994
Education Mother's age Residence Less Second- Birth order at delivery Sex Birth interval (months) Radio Number
than Pri- ary or of Country Urban Rural None primary mary higher 2-3 4-5 6+ <20 20-34 35+ Male Female <24 24-35 36-47 48+ No Yes children
Sub-Saharan Africa Burkina Faso 64.9 29.3 32.1 27.9 62.1 85.8 38.0 33.9 34.0 33.5 27.8 36.2 34.7 33.8 35.4 28.4 35.3 30.2 39.1 26.7 41.6 1104 Cameroon 50.5 32.9 17.9 45.8 47.3 60.8 50.8 46.2 32.4 31.4 41.5 39.7 38.6 41.3 38.6 29.6 40.8 38.0 34.4 29.2 45.5 663 Ghana 71.1 47.8 42.2 43.9 64.9 86.7 64.7 57.3 48.7 45.8 52.8 56.8 47.4 53.2 56.7 36.2 52.5 50.0 57.1 50.3 60.7 651 Kenya 80.9 77.7 62.7 75.4 84.0 88.4 84.9 84.3 77.9 63.7 80.5 79.4 65.8 78.1 78.2 79.1 75.7 70.2 79.3 72.6 82.5 1124 Madagascar 57.9 41.4 29.3 42.5 48.8 56.8 49.6 47.6 38.8 38.8 40.9 44.8 40.7 44.4 42.4 37.0 46.9 43.8 37.6 36.2 57.1 1072 Malawi U U 76.3 84.9 95.9 96.3 89.8 85.3 81.5 74.6 85.3 83.0 75.0 81.8 81.9 81.2 79.0 82.2 79.6 78.9 86.0 774 Namibia 59.6 57.0 44.2 57.1 60.8 64.5 60.9 60.8 55.5 50.7 55.3 58.4 57.9 58.2 57.5 54.0 53.7 58.5 60.8 53.5 60.0 788 Niger 53.7 9.6 14.6 34.0 61.7 69.3 21.7 18.6 19.4 13.3 18.5 18.2 11.6 16.3 18.7 13.5 18.9 18.0 14.2 12.5 24.0 1087 Nigeria 51.4 22.9 16.4 28.8 42.7 68.7 25.8 32.9 30.8 25.0 26.0 29.7 29.4 30.0 28.0 28.0 39.4 22.3 21.4 17.5 38.2 1380 Rwanda 92.6 86.0 84.1 87.2 89.3 95.1 86.6 89.2 85.7 84.1 86.8 87.0 84.0 86.5 86.2 89.1 86.2 87.6 82.2 84.1 92.0 1010 Senegal 64.9 40.4 43.6 58.5 74.3 89.4 58.8 49.0 50.0 44.1 45.6 48.7 53.3 46.2 52.3 44.2 46.4 46.2 52.7 35.9 53.8 959 Sudan 60.5 46.5 40.2 53.1 60.7 75.7 62.9 54.1 49.6 43.0 55.8 51.2 49.6 52.9 50.2 47.0 46.8 52.0 53.1 38.4 61.1 1150 Tanzania 83.8 67.9 60.0 73.2 78.0 79.2 72.2 74.5 67.7 68.7 72.3 70.9 71.0 69.2 73.1 70.2 69.9 70.2 73.8 68.7 75.8 1616 Zambia 74.4 60.0 49.3 58.5 71.7 83.6 75.4 70.5 66.4 55.3 71.2 67.4 55.0 66.3 66.9 58.3 66.7 64.6 61.5 59.5 74.9 1123
Near East! North Africa Egypt 77.1 61.7 59.6 66.7 75.7 81.0 75.1 69.9 66.1 55.2 64.1 69.3 57.5 68.9 65.7 64.3 66.5 64.6 63.9 61.7 71.0 1594 Jordan l 86.8 90.4 82.1 87.8 91.3 89.2 89.3 89.2 87.4 86.5 87.1 88.6 85.0 87.7 88.0 86.4 87.0 91.0 91.5 81.3 88.9 1615 Morocco 93.7 66.7 71.2 94.9 92.9 91.2 78.8 78.1 74.8 71.9 72.7 77.5 71.1 75.5 76.0 75.6 69.2 78.2 82.9 71.5 76.5 985 Turkey 73.9 50.4 45.8 58.0 70.6 81.9 67.9 66.7 54.6 52.9 54.2 66.1 63.1 62.6 66.2 54.1 58.1 64.9 70.4 61.1 65.3 716
Asia Bangladesh 70.4 57.8 51.9 59.4 67.2 79.0 61.9 61.6 55.7 52.8 57.0 59.7 60.8 61.9 56.2 56.3 57.0 58.5 60.2 54.6 73.3 1174 Indonesia 65.2 40.9 25.9 41.7 50.7 67.4 59.5 51.4 39.9 28.2 50.8 48.5 43.9 48.4 48.3 42.8 36.3 40.9 51.0 39.6 55.4 2670 Pakistan 45.6 30.2 31.4 39.0 39.0 53.7 33.5 33.8 36.8 36.2 24.3 37.2 31.4 39.1 31.3 36.4 35.9 34.1 34.7 33.1 38.6 1215 Philippines 73.2 69.9 43.0 60.7 72.4 75.6 77.5 74.4 68.5 62.9 67.7 73.0 66.5 71.0 72.1 67.5 69.7 76.6 69.7 a a 1742
Latin America! Caribbean Bolivia 35.1 27.1 22.8 26.1 33.9 34.9 33.8 31.9 28.3 29.5 25.4 32.8 29.4 34.3 28.1 32.7 24.5 30.5 38.4 22.0 33.8 1111 Brazil (NE) 63.5 47.6 38.5 56.5 60.2 86.2 69.2 57.9 46.5 46.8 62.3 56.8 48.2 56.4 55.5 48.6 54.1 46.8 57.1 49.9 59.6 579 Colombia 69.2 66.7 61.7 61.7 82.6 67.7 72.9 70.4 57.2 58.1 61.4 69.8 67.7 68.1 68.6 62.8 63.3 67.6 68.4 66.8 71.9 748 Dominican Republic 45.1 25.2 8.5 29.8 35.3 48.3 44.3 40.5 23.5 15.8 27.8 38.9 31.5 31.8 41.9 37.5 22.2 34.1 40.0 31.0 41.2 815 Paraguay 44.9 25.5 20.2 22.3 36.6 53.7 43.6 33.1 38.4 23.4 29.3 35.0 34.6 31.1 37.9 31.1 25.3 29.6 39.1 25.1 36.3 790 Peru 65.1 46.4 46.0 44.9 58.3 64.7 65.3 62.9 49.9 41.6 50.5 59.6 54.5 56.8 58.7 51.3 51.7 55.2 61.0 50.5 59.4 1509
Note: Children who are fully vaccinated comprise those who have received BCG, measles vaccine, and three doses of DPT and polio vaccine. U = Unknown (not available) 1 BCG is not included in the calculation of full vaccination in Jordan. a Question not asked in the Philippines
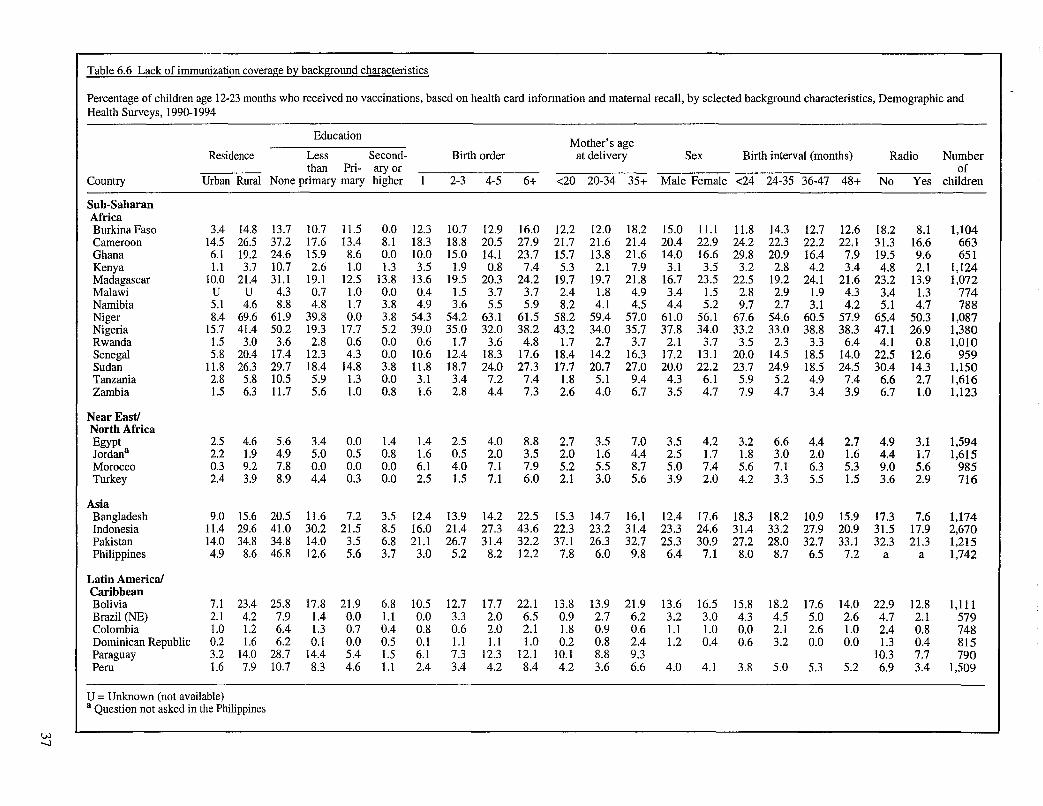
Table 6.6 Lack of immunization coverage by background characteristics
Percentage of children age 12-23 months who received no vaccinations, based on health card information and maternal recall, by selected background characteristics, Demographic and Health Surveys, 1990-1994
Education Mother's age
Residence Less Second- Birth order at delivery Sex Birth interval (months) Radio Number than Pri- ary or of
Country Urban Rural None primary mary higher 2-3 4-5 6+ <20 20-34 35+ Male Female <24 24-35 36-47 48+ No Yes children
Sub-Saharan Africa Burkina Faso 3.4 14.8 13.7 10.7 11.5 0.0 12.3 10.7 12.9 16.0 12.2 12.0 18.2 15.0 11.1 11.8 14.3 12.7 12.6 18.2 8.1 1,104 Cameroon 14.5 26.5 37.2 17.6 13.4 8.1 18.3 18.8 20.5 27.9 21.7 21.6 21.4 20.4 22.9 24.2 22.3 22.2 22.1 31.3 16.6 663 Ghana 6.1 19.2 24.6 15.9 8.6 0.0 10.0 15.0 14.1 23.7 15.7 13.8 21.6 14.0 16.6 29.8 20.9 16.4 7.9 19.5 9.6 651 Kenya 1.1 3.7 10.7 2.6 1.0 1.3 3.5 1.9 0.8 7.4 5.3 2.1 7.9 3.1 3.5 3.2 2.8 4.2 3.4 4.8 2.1 1,124 Madagascar 10.0 21.4 31.1 19.1 12.5 13.8 13.6 19.5 20.3 24.2 19.7 19.7 21.8 16.7 23.5 22.5 19.2 24.1 21.6 23.2 13.9 1,072 Malawi U U 4.3 0.7 1.0 0.0 0.4 1.5 3.7 3.7 2.4 1.8 4.9 3.4 1.5 2.8 2.9 1.9 4.3 3.4 1.3 774 Namibia 5.1 4.6 8.8 4.8 1.7 3.8 4.9 3.6 5.5 5.9 8.2 4.1 4.5 4.4 5.2 9.7 2.7 3.1 4.2 5.1 4.7 788 Niger 8.4 69.6 61.9 39.8 0.0 3.8 54.3 54.2 63.1 61.5 58.2 59.4 57.0 61.0 56.1 67.6 54.6 60.5 57.9 65.4 50.3 1,087 Nigeria 15.7 41.4 50.2 19.3 17.7 5.2 39.0 35.0 32.0 38.2 43.2 34.0 35.7 37.8 34.0 33.2 33.0 38.8 38.3 47.1 26.9 1,380 Rwanda 1.5 3.0 3.6 2.8 0.6 0.0 0.6 1.7 3.6 4.8 1.7 2.7 3.7 2.1 3.7 3.5 2.3 3.3 6.4 4.1 0.8 1,010 Senegal 5.8 20.4 17.4 12.3 4.3 0.0 10.6 12.4 18.3 17.6 18.4 14.2 16.3 17.2 13.1 20.0 14.5 18.5 14.0 22.5 12.6 959 Sudan 11.8 26.3 29.7 18.4 14.8 3.8 11.8 18.7 24.0 27.3 17.7 20.7 27.0 20.0 22.2 23.7 24.9 18.5 24.5 30.4 14.3 1,150 Tanzania 2.8 5.8 10.5 5.9 1.3 0.0 3.1 3.4 7.2 7.4 1.8 5.1 9.4 4.3 6.1 5.9 5.2 4.9 7.4 6.6 2.7 1,616 Zambia 1.5 6.3 11.7 5.6 1.0 0.8 1.6 2.8 4.4 7.3 2.6 4.0 6.7 3.5 4.7 7.9 4.7 3.4 3.9 6.7 1.0 1,123
Near EastJ North Africa Egypt 2.5 4.6 5.6 3.4 0.0 1.4 1.4 2.5 4.0 8.8 2.7 3.5 7.0 3.5 4.2 3.2 6.6 4.4 2.7 4.9 3.1 1,594 Jordana 2.2 1.9 4.9 5.0 0.5 0.8 1.6 0.5 2.0 3.5 2.0 1.6 4.4 2.5 1.7 1.8 3.0 2.0 1.6 4.4 1.7 1,615 Morocco 0.3 9.2 7.8 0.0 0.0 0.0 6.1 4.0 7.1 7.9 5.2 5.5 8.7 5.0 7.4 5.6 7.1 6.3 5.3 9.0 5.6 985 Turkey 2.4 3.9 8.9 4.4 0.3 0.0 2.5 1.5 7.1 6.0 2.1 3.0 5.6 3.9 2.0 4.2 3.3 5.5 1.5 3.6 2.9 716
Asia Bangladesh 9.0 15.6 20.5 11.6 7.2 3.5 12.4 13.9 14.2 22.5 15.3 14.7 16.1 12.4 17.6 18.3 18.2 10.9 15.9 17.3 7.6 1,174 Indonesia 11.4 29.6 41.0 30.2 21.5 8.5 16.0 21.4 27.3 43.6 22.3 23.2 31.4 23.3 24.6 31.4 33.2 27.9 20.9 31.5 17.9 2,670 Pakistan 14.0 34.8 34.8 14.0 3.5 6.8 21.1 26.7 31.4 32.2 37.1 26.3 32.7 25.3 30.9 27.2 28.0 32.7 33.1 32.3 21.3 1,215 Philippines 4.9 8.6 46.8 12.6 5.6 3.7 3.0 5.2 8.2 12.2 7.8 6.0 9.8 6.4 7.1 8.0 8.7 6.5 7.2 a a 1,742
Latin America! Caribbean Bolivia 7.1 23.4 25.8 17.8 21.9 6.8 10.5 12.7 17.7 22.1 13.8 13.9 21.9 13.6 16.5 15.8 18.2 17.6 14.0 22.9 12.8 1,111 Brazil (NE) 2.1 4.2 7.9 1.4 0.0 1.1 0.0 3.3 2.0 6.5 0.9 2.7 6.2 3.2 3.0 4.3 4.5 5.0 2.6 4.7 2.1 579 Colombia 1.0 1.2 6.4 1.3 0.7 0.4 0.8 0.6 2.0 2.1 1.8 0.9 0.6 1.1 1.0 0.0 2.1 2.6 1.0 2.4 0.8 748 Dominican Republic 0.2 1.6 6.2 0.1 0.0 0.5 0.1 1.1 1.1 1.0 0.2 0.8 2.4 1.2 0.4 0.6 3.2 0.0 0.0 1.3 0.4 815 Paraguay 3.2 14.0 28.7 14.4 5.4 1.5 6.1 7.3 12.3 12.1 10.1 8.8 9.3 10.3 7.7 790 Peru 1.6 7.9 10.7 8.3 4.6 1.1 2.4 3.4 4.2 8.4 4.2 3.6 6.6 4.0 4.1 3.8 5.0 5.3 5.2 6.9 3.4 1,509
U = Unknown (not available) a Question not asked in the Philippines
Vol -...J
education; (iii) those who completed the primary level of education but did not progress further; and (iv) those who attended school at the secondary level or beyond. Primary education was defined as the number of years of schooling prescribed by the country for this level of education; in most countries, this corresponds to five to seven years of schooling.
There is a strong association between maternal education and children's vaccination coverage. Children of un educated mothers have the lowest vaccination coverage levels; the only exceptions are Burkina Faso and Peru where full vaccination levels are lowest among children whose mothers have incomplete primary education. In a few instances, vaccination coverage levels are equally low among children of mothers with some primary education and among children of mothers with no education. In most countries, however, all six measures of vaccination coverage are lowest among children of uneducated mothers followed by children of mothers with some primary education. The highest vaccination coverage levels are found either among children whose mothers have completed primary school or among children whose mothers have gone on to secondary school. Coverage differentials by mother's education are almost always largest for measles, poli03, and/or full vaccination.
Differences in vaccination coverage levels by mother's education generally are large; in 25 of 28 surveys, more than 20 percentage points separate the groups with the lowest and highest coverage for at least one measure of vaccination. Differences are smallest in Jordan (less than 10 percentage points) and in Malawi and Rwanda (a maximum difference of 10-20 percentage points). In 10 of the remaining countries (Bangladesh, Burkina Faso, Cameroon, the Dominican Republic, Ghana, Indonesia, Niger, Nigeria, Senegal, and Sudan), the differentials exceed 40 percentage points.
Among children whose mothers have no education, one-third to one-quarter have never been vaccinated in Bolivia, Cameroon, Ghana, Madagascar, Pakistan, Paraguay, and Sudan. In Indonesia, Niger, Nigeria, and the Philippines, an even higher proportion of these children have not received any vaccinations: from two-fifths to two-thirds. In the remaining 17 countries, between 4 and 21 percent of children of uneducated mothers have never been vaccinated. In contrast, the proportion who have never been vaccinated among children of the educational group with the highest coverage rates ranges from less than 1 to 14 percent.
38
6.3 MOTHER'S AGE AT DELIVERY
The mother's age at delivery is calculated from the dates of birth of the mother and the child. Three categories are used: under 20 years, 20-34 years, and 35 years or older. There does not appear to be a strong relationship between the mother's age at delivery and vaccination coverage levels, although there is a trend towards higher coverage levels among children whose mothers are in the two younger age groups. The lowest coverage levels tend to be among children born to women age 35 years or older and sometimes among those with mothers below 20 years. Only in a few instances are the lowest levels seen among children of mothers in the middle age group (20-34 years of age).
Differentials by mother's age tend to be relatively small; they are less than 20 percentage points for all measures of vaccination coverage in all countries. In 11 countries, the differences are less than 10 percentage points for every measure of vaccination coverage. In the remaining 17 countries, at least one measure shows a differential of 10 to 20 percentage points, although most measures in most of these countries have differentials of less than 10 percentage points.
6.4 SEX OF CHILD
The child's gender is included as an independent variable in order to assess whether there is differential treatment of boys and girls. Child's gender, however, shows smaller differentials in vaccination coverage than any of the other socioeconomic and bio-demographic variables examined here. Seen across all surveys and all six measures of vaccination coverage, there are generally very small differences in vaccination coverage among girls compared to boys.
Across all the countries there might be a slight tendency for vaccination coverage to be somewhat higher among girls than among boys. There are nine countries where differences between boys and girls reach as high as 5 to 10 percentage points. In about half of these countries (Bangladesh, Northeast Brazil, Bolivia, Madagascar, and Pakistan), vaccination coverage levels are higher for boys than girls, while the reverse is true in the other countries (the Dominican Republic, Niger, Paraguay, and Senegal).
6.5 BIRTH ORDER OF CIDLD
Birth order is divided into four categories: (i) first, (ii) second or third, (iii) fourth or fifth; and (iv) sixth or higher. There are several possible explanations for differences in vaccination coverage by birth order. On the one hand, mothers may be more concerned about first-born children and hence more likely to see that they are vaccinated; also mothers with many children may have less time to make sure that their children are vaccinated properly. On the other hand, more experienced mothers-as reflected in a higher birth order for the child-may be more aware of recommended childhood vaccinations and hence more likely to obtain them. Aside from these considerations, children of higher birth order are more likely to be of lower socioeconomic status than children of the lowest birth orders.
In most countries, vaccination coverage levels tend to be lowest for children of higher birth orders and higher for children of lower birth orders. This pattern is particularly clear for measles vaccination and full vaccination coverage, for which, with only a few exceptions, first-born children have the highest coverage levels while children of birth order six or more have the lowest coverage levels. Birth order differentials in vaccination coverage between the categories with the lowest and highest levels are below 10 percentage points in only three countries: Jordan, Morocco, and Rwanda. In 17 countries, these differentials range from 10 to 20 percentage points, and they exceed 20 percentage points in the remaining nine surveys (Northeast Brazil, the Dominican Republic, Indonesia, Kenya, Malawi, Paraguay, Peru, Sudan, and Zambia).
6.6 LENGTH OF THE PRECEDING BIRTH INTERVAL
The length of the birth interval preceding each child's birth is derived from the birth history given by the mother. While the birth interval per se probably does not influence vaccination coverage rates, it may serve as another indicator of how occupied the mother is in caring for small children.
There is no consistent pattern in vaccination coverage levels according to the length of the preceding birth interval. In some countries and for some measures of vaccination, however, there is a tendency toward higher vaccination coverage levels among children born after longer intervals. Only in Ghana and Nigeria do the differentials between the categories with the lowest and highest coverage rates ever exceed 20 percentage points. In 14 countries, the difference in at least one measure of vaccination falls between 10 and 20 percentage points, while in the remaining 12 countries the differences for all measures are less than 10 percentage points.
6.7 RADIO IN THE HOUSEHOLD
Vaccination coverage is also examined according to whether the child lived in a household with a radio. The presence of a radio is related to socioeconomic status, but, over and above this, mothers who live in a household with a radio may be exposed to messages about the importance of vaccinating their children. If the child's mother was a visitor in the household, she was asked whether there was a radio in her usual household of residence and this information was used rather than the information about the household in which she was interviewed.
As expected, children from households with a radio consistently have higher vaccination coverage rates than children from households without a radio. This relationship holds true across all six measures of vaccination and across all countries. In most countries, larger differences are seen for poli03, measles and full vaccination. In 10 countries (Colombia, Egypt, Jordan, Malawi, Morocco, Namibia, Peru, Rwanda, Tanzania, and Turkey), the difference between children from households with and without a radio is less than 10 percentage points for all six measures of vaccination coverage. In four countries (Madagascar, Nigeria, Sudan, and Paraguay), the differential exceeds 20 percentage points for at least one of the six measures. In the remaining 13 countries, differences range from 10 to 20 percentage points.
39

7 Secular Trends in Vaccination Coverage
Eight of the countries included in this report had a previous DHS survey about five years before the current survey. Table 7.1 and Figure 7.1 compare the coverage rates from the previous survey to the findings presented in this report for BCG, the third doses of DPT and polio vaccines, measles vaccine, full immunization, and whether the interviewer saw a health card. Coverage rates increased for all these measures in all countries with two exceptions: measles vaccination in Bolivia, which fell by 2 percentage points, and health cards shown to the interviewer in Egypt, which
Table 7.1 Immunization trends
dropped by 6 percentage points. Kenya shows the smallest improvement, with increases in coverage ranging from 3 percentage points for BCG to 15 percentage points for full vaccination. This is not surprising since Kenya already had relatively high levels of vaccination coverage at the time of the first survey. Senegal shows the greatest change, with increases of 18 percentage points in measles vaccination coverage and 45 percentage points in the third doses of DPT and polio.
Percentage of children age 12-23 months who received specific vaccinations by the time of the survey for selected countries with two DHS surveys, Demographic and Health Surveys, 1986-1994
Percent Number of Country Survey phase and year BCG DPT3 Polio3 Measles All with card children
Sub-Saharan Africa Ghana DHS-I 1988 69 42 41 51 31 40 782
DHS-III 1993 83 62 62 64 55 68 651
Kenya DHS-I 1988/89 93 82 82 72 63 61 1,315 DHS-III 1993 96 87 86 84 78 69 1,124
Senegal DHS-I 1986 54 14 12 39 10 30 791 DHS-I1 1992/93 84 59 59 57 49 64 959
Near East/North Africa Egypt DHS-I 1988/89 70 66 66 76 54 61 1,579
DHS-I1 1992 90 76 79 82 67 55 1,594
Morocco DHS-I 1987 83 63 63 58 53 50 1,101 DHS-I1 1992 93 79 79 80 76 65 985
Latin America/Caribbean Bolivia DHS-I 1989 55 28 38 58 18 23 1,108
DHS-III 1994 77 43 39 56 31 35 1, III
Colombia DHS-I 1986 85 72 72 64 54 55 556 DHS-I1 1990 94 82 83 82 68 59 748
Peru DHS-I 1986 57 58 57 72 36 43 526 DHS-II 1991192 91 68 70 74 58 51 1509
40
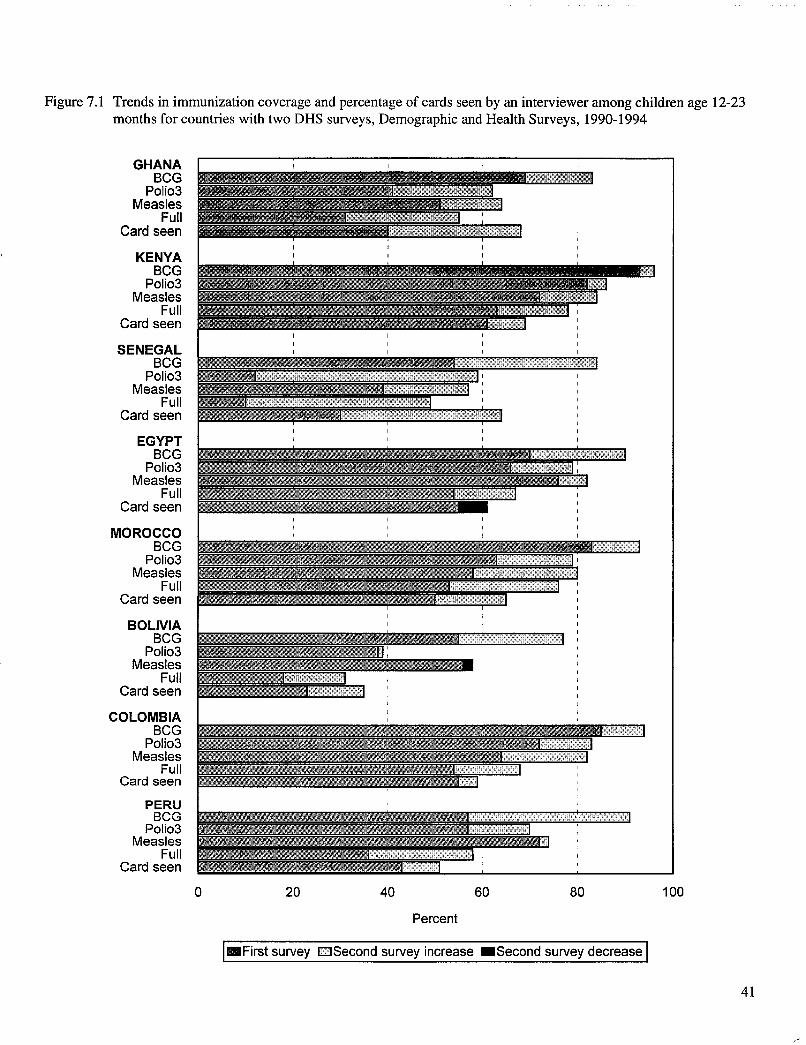
Figure 7.1 Trends in immunization coverage and percentage of cards seen by an interviewer among children age 12-23 months for countries with two DHS surveys, Demographic and Health Surveys, 1990-1994
GHANA BCG
Polio3 Measles
Full Card seen
KENYA BCG
Polio3 Measles
Full Card seen
SENEGAL BCG
Polio3 Measles
Full Card seen
EGYPT BCG
Polio3 Measles
Full Card seen
MOROCCO BCG
Polio3 Measles
Full Card seen
BOLIVIA BCG
Polio3 Measles
Full Card seen
COLOMBIA BCG
Polio3 Measles
Full Card seen
PERU BeG
Polio3 Measles
Full Card seen
0 20 40 60 80 100
Percent
I_First survey DSecond survey increase _Second survey decrease I
41

Table 7.2 summarizes changes in vaccination by the first birthday for BCG, polio3, and measles vaccine. Increases in BCG coverage range from 11 percentage points in Kenya to 36 percentage points in Peru. In Bolivia, there are only small increases in the polio3 coverage rate (7 percentage points) and measles coverage rate (l percentage point). In other countries, improvements are larger, peaking in an increase of 43 percentage points for polio3 in Senegal.
Table 7.2 Immunization trends for infants
Percentage of children age 12-23 months who received specific vaccinations in the first year of life for selected countries with two DHS surveys, Demographic and Health Surveys, 1986-1994
Vaccination received Number Survey phase of
Country and year BCG Polio3 Measles children
Sub-Saharan Africa Ghana DHS-I 1988 64 32 35 782
DHS-I1I 1993 81 57 51 651
Kenya DHS-I 1988/89 84 75 60 1,315 DHS-I1I 1993 95 84 76 1,124
Senegal DHS-I 1986 49 12 24 791 DHS-II 1992193 80 55 45 959
Near East! North Africa Morocco DHS-I 1987 77 54 45 1,101
DHS-II 1992 92 74 67 985
Latin America! Caribbean Bolivia DHS-I 1989 37 20 33 1,108
DHS-III 1994 71 27 34 1,111
Colombia DHS-I 1986 76 57 45 556 DHS-II 1990 92 75 68 748
Peru DHS-I 1986 52 35 38 526 DHS-II 1991/92 88 60 51 1,509
42

8 Summary and Conclusions
DRS surveys provide a dependable source of vaccination coverage information for developing countries; they use a consistent approach to provide comparable results across countries and over time. The surveys provide nationally representative estimates of vaccination coverage using rigorous sampling techniques in the selection of respondents. In addition to providing overall vaccination coverage rates, the information collected also allows analyses to identify subgroups of children who are at high risk of not being vaccinated or of receiving suboptimal vaccination services. Some of these possible analyses of the DRS data are presented here, focusing on differences between children according to urban-rural residence, mother's level of education, the sex of the child, the length of the preceding birth interval, and the child's birth order.
The vaccination information in this report is derived from the child's written vaccination record or health card whenever the mother could show this to the interviewer. The mother's recall of a child's vaccinations is used when she could not show a card to the interviewer. Most of the coverage levels are reported for children age 12-23 months. Overall rates are calculated both for vaccination coverage by the time of the survey and for vaccinations received before the child's first birthday. There are large differences in coverage rates across countries. For example, vaccination against measles in the first year of life exceeds 75 percent in three countries: Jordan, Kenya, and Rwanda. In contrast, only one-third to one-half of children in Bolivia, Burkina Faso, Cameroon, the Dominican Republic, Indonesia, Madagascar, Pakistan, Paraguay, Senegal, and Sudan received measles vaccine before their first birthday. Coverage rates are even lower in Niger and Nigeria, where only 20 percent and 30 percent of children, respectively, were vaccinated against measles during the first year of life.
An examination of secular trends indicates that vaccination coverage rates are increasing. In all eight ofthe countries included in this report that have had a previous DHS survey, there has been a clear increase in immunization coverage levels. The smallest increase is seen in Kenya, where coverage levels were already relatively high in the previous survey, while the largest change took place in Senegal. There coverage rates have increased dramatically, although there continues to be room for further improvement.
There are clear differentials in coverage in most countries, with urban children having higher coverage rates
than their rural counterparts. Children from households with a radio also tend to have higher coverage rates than children from households without one, primarily reflecting differences in socioeconomic status but possibly also reflecting differential exposure to broadcast messages about the importance of childhood vaccinations. The largest differentials are associated with the mother's level of education. Children whose mothers have no formal schooling consistently have lower vaccination coverage levels than do children of mothers who have at least completed primary education. There are much smaller differentials according to the child's birth order or the length of the preceding birth interval, with children of lower birth order and born after longer intervals tending to have somewhat better vaccination coverage rates. The smallest differences are seen for the child's gender; there do not appear to be consistent differences in vaccination coverage rates between boys and girls.
The following recommendations will facilitate recommended vaccinations for young children and will allow continued monitoring of the performance of vaccination serVices:
• In countries with high or relatively high coverage rates, continuing support for vaccination services will ensure continued high coverage rates for most children. Particular emphasis should be placed on reaching children at high risk of not being vaccinated and extending vaccination services to underserved population subgroups.
• Countries with low or relatively low vaccination coverage levels need increased support for vaccination services, with the primary emphasis on reaching all children with vaccination services.
• The need to expand the list of recommended vaccines for young children should be explored.
• For countries that already are succeeding in providing vaccination services to infants, the next step is to expand the emphasis of vaccination programs beyond the first year of life.
• Vaccination coverage rates should be monitored with consistent methodology.
43
• Survey results should report at least the following minimal information:
(i) Percent of children age 12-23 months for whom a written vaccination record was seen by the interviewer.
(ii) Percent of all children age 12-23 months who received each of the following vaccinations by the time of the survey: BCG; DPTl, DPT2, and DPT3; poliol, poli02, and poli03; and measles vaccine.5
5 It is important to include both of these measures of vaccination status when reporting the results of coverage surveys. Vaccination status by the time of the survey is simple to calculate from the survey data. Vaccination by the first birthday gives an indication of the timeliness of vaccinations, but the calculations are more complex and require a number of assumptions to be made.
44
(iii) Percent of all children age 12-23 months who received each of the following vaccinations by their first birthday: BCG; DPTl, DPT2, and DPT3; poliol, poli02, and polio3; and measles vaccine.5
Attaining the goal of the World Summit for Children-90 percent vaccination coverage by the year 2000-is a realistic possibility for a handful of the countries included in this report. For many of the countries, it represents an enormous challenge which can only be met if a large effort is made to make this goal a reality.

References
Boerma, J. T., A.E. Sommerfelt, S .0. Rutstein, and G. Rojas. 1990. Immunization: Levels, trends and differentials. DHS Comparative Studies, No. 1. Columbia, Maryland: Institute for Resource DevelopmentlMacro Systems Inc.
Boerma, J.T.and G.T. Bicego. 1993. The quality of data on child immunization in DHS-I surveys. In An assessment of the quality of health data in DHS-I surveys. DHS Methodological Reports, No.2. Calverton, Maryland: Macro International Inc. 79-93.
Cutts, F., E.R. Zell, A.c. Soares, and S. Diallo. 1991. Obstacles to achieving immunization for all 2000: Missed immunization opportunities and inappropriately timed immunizations. Journal of Tropical Pediatrics 37(4): 153-158.
du Lou, A.D, and G. Pison. 1994. Barriers to universal child immunization in rural Senegal 5 years after the accelerated expanded program on immunization. Bulletin of the World Health Organization 72(5):751-759.
Henderson, R.H., J. Keja, G. Hayden, A. Galazka, J. Clements, and C. Chan. 1988. Immunizing the children of the world: Progress and prospects. Bulletin of the World Health Organization 66(5):535-543.
Kahn, J.G., A.H. Mokdad, M.S. Deming, J.B. Roungou, A.M. Boby,J.L. Excler, andRJ. Waldman. 1995. Avoiding missed opportunities for immunization in the Central African Republic: Potential impact on vaccination coverage. Bulletin of the World Health Organization 73(1):47-55.
Steinhoff, M.C., P. Cole, A. Cole, TJ. John, and S.M. Pereira. 1985. Evaluation of the opportunity for and contraindications to immunization in a tropical pediatric clinic. Bulletin of the World Health Organization 63:915-18.
UNICEF. 1989. State of the World's Children 1989. Oxford, England: Oxford University Press.
World Health Organization (WHO). 1989. Expanded Program on Immunization. Geneva: WHO.
World Health Organization (WHO) and UNICEF. 1985. Planning Principles for Accelerated Immunization Activities: A Joint WHOIUNICEF Statement. Assignment Children 69/72: 139-154.
45
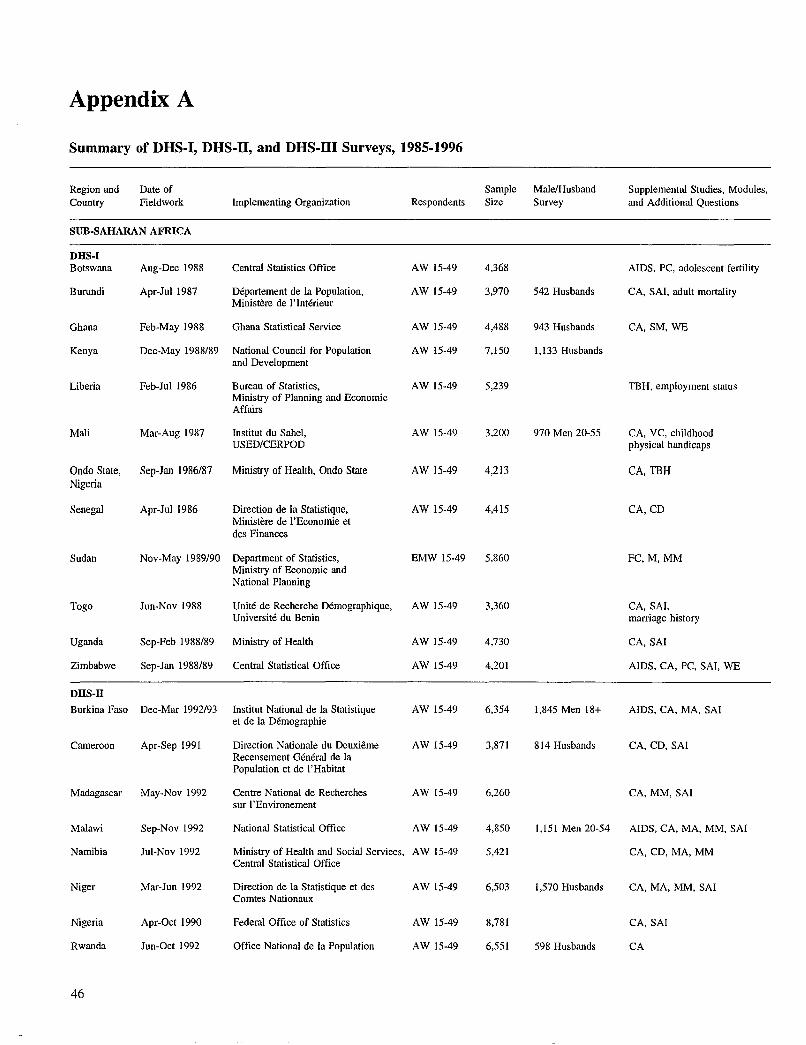
Appendix A
Summary of DHS-I, DHS-I1, and DHS-I1I Surveys, 1985-1996
Region and Date of Sample MalelHusband Supplemental Studies, Modules, Country Fieldwork Implementing Organization Respondents Size Survey and Additional Questions
SUB-SAHARAN AFRICA
DHS-I Botswana Aug-Dec 1988 Central Statistics Office AW 15-49 4,368 AIDS, PC, adolescent fertility
Burundi Apr-Jul 1987 Departement de la Population, AW 15-49 3,970 542 Husbands CA, SAl, adult mortality Ministere de l'Interieur
Ghana Feb-May 1988 Ghana Statistical Service AW 15-49 4,488 943 Husbands CA, SM, WE
Kenya Dec-May 1988/89 National Council for Population AW 15-49 7,150 1,133 Husbands and Development
Liberia Feb-Jul 1986 Bureau of Statistics, AW 15-49 5,239 TBH, employment status Ministry of Planning and Economic Affairs
Mali Mar-Aug 1987 Institut du Sahel, AW 15-49 3,200 970 Men 20-55 CA, VC, childhood USED/CERPOD physical handicaps
Ondo State, Sep-Jan 1986/87 Ministry of Health, Ondo State AW 15-49 4,213 CA, TBH Nigeria
Senegal Apr-luI 1986 Direction de la Statistique, AW 15-49 4,415 CA,CD Ministere de I'Economie et des Finances
Sudan Nov-May 1989/90 Department of Statistics, EMW 15-49 5,860 FC,M,MM Ministry of Economic and National Planning
Togo Jun-Nov 1988 Unite de Recherche Demographique, AW 15-49 3,360 CA, SAl, Universite du Benin marriage history
Uganda Sep-Feb 1988/89 Ministry of Health AW 15-49 4,730 CA, SAl
Zimbabwe Sep-Jan 1988/89 Central Statistical Office AW 15-49 4,201 AIDS, CA, PC, SAl, WE
DHS-II Burkina Faso Dec-Mar 1992/93 lnstitut National de la Statistique AW 15-49 6,354 1,845 Men 18+ AIDS, CA, MA, SAl
et de la Demographie
Cameroon Apr-Sep 1991 Direction Nationale du Deuxieme AW 15-49 3,871 814 Husbands CA, CD, SAl Recensement General de la Population et de I' Habitat
Madagascar May-Nov 1992 Centre National de Recherches AW 15-49 6,260 CA, MM, SAl sur l'Environement
Malawi Sep-Nov 1992 National Statistical Office AW 15-49 4,850 1,151 Men 20-54 AIDS, CA, MA, MM, SAl
Namibia luI-Nov 1992 Ministry of Health and Social Services, AW 15-49 5,421 CA, CD, MA, MM Central Statistical Office
Niger Mar-Jun 1992 Direction de la Statistique et des AW 15-49 6,503 1,570 Husbands CA, MA, MM, SAl Comtes Nationaux
Nigeria Apr-Oct 1990 Federal Office of Statistics AW 15-49 8,781 CA, SAl
Rwanda lun-Oct 1992 Office National de la Population AW 15-49 6,551 598 Husbands CA
46
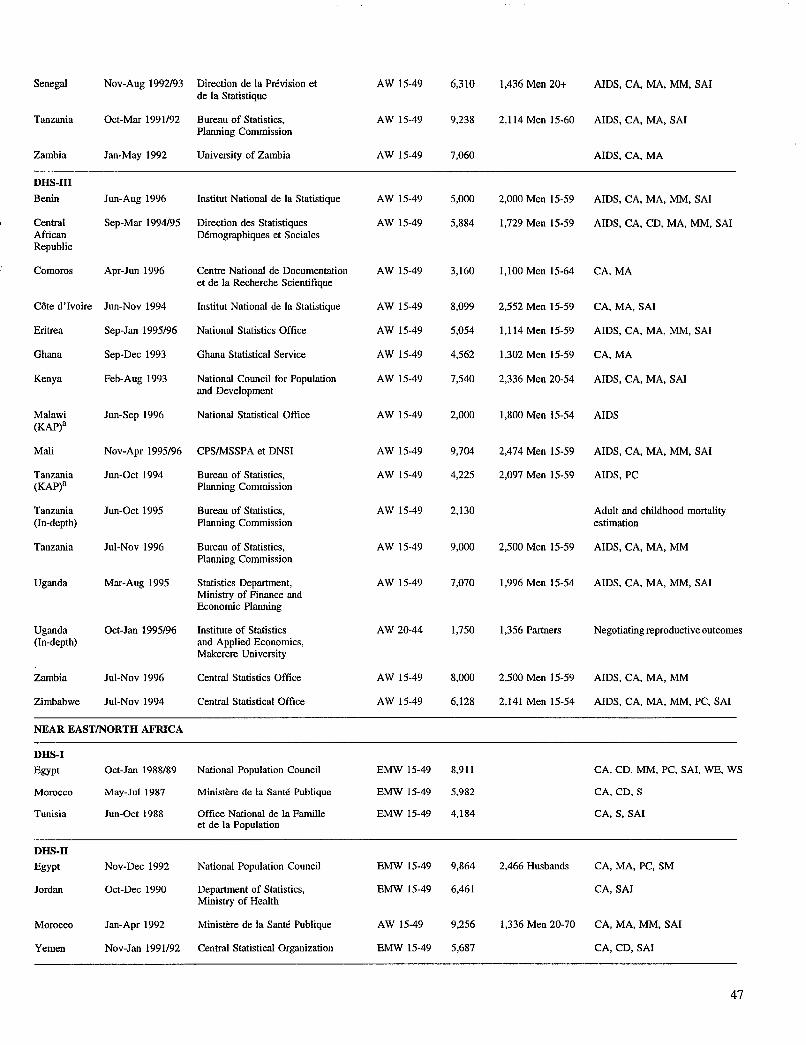
Senegal Nov-Aug 1992/93 Direction de la Prevision et AW 15-49 6,310 1,436 Men 20+ AIDS, CA, MA, MM, SAl de la Statistique
Tanzania Oct-Mar 1991192 Bureau of Statistics, AW 15-49 9,238 2,114 Men 15-60 AIDS, CA, MA, SAl Planning Commission
Zambia Jan-May 1992 University of Zambia AW 15-49 7,060 AIDS, CA, MA
DHS-llI
Benin Jun-Aug 1996 Institut National de la Statistique AW 15-49 5,000 2,000 Men 15-59 AIDS, CA, MA, MM, SAl
Central Sep-Mar 1994/95 Direction des Statistiques AW 15-49 5,884 1,729 Men 15-59 AIDS, CA, CD, MA, MM, SAl African Demographiques et Sociales Republic
Comoros Apr-Jun 1996 Centre National de Documentation AW 15-49 3,160 1,100 Men 15-64 CA,MA et de la Recherche Scientifique
Cote d'lvoire Jun-Nov 1994 Institut National de la Statistique AW 15-49 8,099 2,552 Men 15-59 CA, MA, SAl
Eritrea Sep-Jan 1995/96 National Statistics Office AW 15-49 5,054 1,114 Men 15-59 AIDS, CA, MA, MM, SAl
Ghana Sep-Dec 1993 Ghana Statistical Service AW 15-49 4,562 1,302 Men 15-59 CA,MA
Kenya Feb-Aug 1993 National Council for Population AW 15-49 7,540 2,336 Men 20-54 AIDS, CA, MA, SAl and Development
Malawi Jun-Sep 1996 National Statistical Office AW 15-49 2,000 1,800 Men 15-54 AIDS (KAP)a
Mali Nov-Apr 1995/96 CPSIMSSPA et DNSI AW 15-49 9,704 2,474 Men 15-59 AIDS, CA, MA, MM, SAl
Tanzania Jun-Oct 1994 Bureau of Statistics, AW 15-49 4,225 2,097 Men 15-59 AIDS, PC (KAP)a Planning Commission
Tanzania Jun-Oct 1995 Bureau of Statistics, AW 15-49 2,130 Adult and childhood mortality (In-depth) Planning Commission estimation
Tanzania Jul-Nov 1996 Bureau of Statistics, AW 15-49 9,000 2,500 Men 15-59 AIDS, CA, MA, MM Planning Commission
Uganda Mar-Aug 1995 Statistics Department, AW 15-49 7,070 1,996 Men 15-54 AIDS, CA, MA, MM, SAl Ministry of Finance and Economic Planning
Uganda Oct-Jan 1995/96 Institute of Statistics AW 20-44 1,750 1,356 Partners Negotiating reproductive outcomes (In-depth) and Applied Economics,
Makerere University
Zambia Jul-Nov 1996 Central Statistics Office AW 15-49 8,000 2,500 Men 15-59 AIDS, CA, MA, MM
Zimbabwe Jul-Nov 1994 Central Statistical Office AW 15-49 6,128 2,141 Men 15-54 AIDS, CA, MA, MM, PC, SAl
NEAR EASTINORTH AFRICA
DHS-J
Egypt Oct-Jan 1988/89 National Population Council EMW 15-49 8,911 CA, CD, MM, PC, SAl, WE, WS
Morocco May-Jul 1987 Ministere de la Sante Publique EMW 15-49 5,982 CA, CD, S
Tunisia Jun-Oct 1988 Office National de la Famille EMW 15-49 4,184 CA, S, SAl et de la Population
DRS-IT
Egypt Nov-Dec 1992 National Population Council EMW 15-49 9,864 2,466 Husbands CA, MA, PC, SM
Jordan Oct-Dec 1990 Department of Statistics, EMW 15-49 6,461 CA, SAl Ministry of Health
Morocco Jan-Apr 1992 Ministere de la Sante Publique AW 15-49 9,256 1,336 Men 20-70 CA, MA, MM, SAl
Yemen Nov-Jan 1991/92 Central Statistical Organization EMW 15-49 5,687 CA, CD, SAl
47

DRS-llI
Egypt Nov-Jan 1995/96 National Population Council EMW 15-49 14,779 CA, FC, MA, WS
Morocco Apr-May 1995 Ministere de la Sante Publique AW 15-49 4,753 SAl (Panel)
ASIA
DRS-I
Indonesia Sep-Dec 1987 Central Bureau of Statistics, EMW 15-49 11,884 PC, SM National Family Planning Coordinating Board
Nepal Feb-Apr 1987 New Era CMW 15-49 1,623 KAP-gap survey (In-depth)
Sri Lanka Jan-Mar 1987 Department of Census and Statistics, EMW 15-49 5,865 CA, NFP Ministry of Plan Implementation
Thailand Mar-Jun 1987 Institute of Population Studies EMW 15-49 6,775 CA, S, SAl Chulalongkorn University
DRS-II
Indonesia May-Jul 1991 Central Bureau of Statistics, EMW 15-49 22,909 PC, SM NFPCBIMOH
Pakistan Dec-May 1990191 National Institute of Population EMW 15-49 6,611 1,354 Husbands CA Studies
DHS-llI
Bangladesh Nov-Mar 1993/94 Mitra & Associates/NIPORT EMW 10-49 9,640 3,284 Husbands PC, SAl, SM
Indonesia Jul-Nov 1994 Central Bureau of Statisticsl EMW 15-49 28,168 MM, PC, SAl, SM NFPCB/MOH
Kazakstan May-Aug 1995 Institute of Nutrition, AW 15-49 3,771 CA,MA National Academy of Sciences
Nepal Jan-Jun 1996 Ministry of Health/New ERA EMW 15-49 8,429 CA, MA, MM
Philippines Apr-Jun 1993 National Statistics Office AW 15-49 15,029 MM, SAl
Turkey Aug-Oct 1993 General Directorate of MCHIFP EMW<50 6,519 CA,MA Ministry of Health
Uzbekistan Jun-Sep 1996 Research Institute of AW 15-49 4,000 CA,MA Obstetrics and Gynecology
LATIN AMERICA/CARIBBEAN
DRS·I
Bolivia Feb-Jul 1989 Instituto Nacional de Estadfstica AW 15-49 7,923 CA, CD, MM, PC, S, WE
Bolivia Feb-Jul 1989 Instituto Nacional de Estadfstica AW 15-49 7,923 Health (In-depth)
Brazil May-Aug 1986 Sociedade Civil Bem-Estar AW 15-44 5,892 CA, S, SM, abortion, Familiar no Brasil young adult use of contraception
Colombia Oct-Dec 1986 Corporaci6n Centro Regional de AW 15-49 5,329 CA, PC, S, SAl, SM Poblaci6n, Ministerio de Salud
Dominican Sep-Dec 1986 Consejo Nacional de Poblaci6n AW 15-49 7,649 CA, NFP, S, SAl, family Republic y Familia planning communication
Dominican Sep-Dec 1986 Consejo Nacional de Poblaci6n AW 15-49 3,885 S, SAl Republic y Familia (Experimental)
Ecuador Jan-Mar 1987 Centro de Estudios de Poblaci6n AW 15-49 4,713 CD, SAl, employment y Paternidad Responsable
48

EI Salvador May-Jun 1985 Asociaci6n Demognifica Salvadoreiia AW 15-49 5,207 CA, S, TBH
Guatemala Oct-Dec 1987 Instituto de Nutrici6n de Centro AW 15-44 5,160 CA, S, SAl America y Panama
Mexico Feb-May 1987 Direcci6n General de Planificaci6n AW 15-49 9,310 NFP, S, employment Familiar, Secretaria de Salud
Peru Sep-Dec 1986 Instituto Nacional de Estadfstica AW 15-49 4,999 NFP, employment, cost of family planning
Peru Sep-Dec 1986 Instituto Nacional de Estadfstica AW 15-49 2,534 (Experimental)
Trinidad and May-Aug 1987 Family Planning Association AW 15-49 3,806 CA, NFP, breastfeeding Tobago of Trinidad and Tobago
DBS-II
Brazil (NE) Sep-Dec 1991 Sociedade Civil Bem-Estar Familiar AW 15-49 6,222 1,266 Husbands AIDS,PC no Brasil
Colombia May-Aug 1990 PROFAMILIA AW 15-49 8,644 AIDS
Dominican Jul-Nov 1991 Instituto de Estudios de Poblaci6n AW 15-49 7,320 CA, MA, S, SAl Republic y Desarrollo (PROFAMILIA), Oficina
Nacional de Planificaci6n
Paraguay May-Aug 1990 Centro Paraguayo de Estudios AW 15-49 5,827 CA, SAl de Poblaci6n
Peru Oct-Mar 1991/92 Instituto Nacional de Estadfstica AW 15-49 15,882 CA, MA, MM, SAl e Informatica
DBS-I1I
Bolivia Nov-May 1993/94 Instituto Nacional de Estadfstica AW 15-49 8,603b AIDS, CA, CD, MA, MM, S, SAl
Brazil Mar-Jun 1996 Sociedade Civil Bem-Estar AW 15-49 16,500 3,000 Men 15-59 AIDS, CA, MA, MM, PC, S Familiar no Brasil
Colombia Mar-Jun 1995 PROFAMILIA AW 15-49 11,140 AIDS, CA, MA, PC
Dominican Aug-Oct 1996 CESDEMIPROFAMILIA AW 15-49 8,500 2,000 Men 15-55 CA,MA Republic
Guatemala Jun-Dec 1995 lnstituto Nacional de Estadfstica AW 15-49 12,403 AIDS, CA, MA, MM, S
Haiti Jul-Jan 1994/95 lnstitut Haitien de I'Enfance AW 15-49 5,356 1,610 Men 15-59 AIDS, CA, CD, MA, SAl
Peru Aug-Nov 1996 Instituto Nacional de Estadfstica AW 15-49 33,000 2,500 Men 15-59 CA,MA,MM e Informatica
a No health or birth history section in questionnaire. b Household questionnaire was administered in 26,144 households.
AIDS acquired immune deficiency syndrome FC female circumcision S sterilization AW all women M migration SAl service availability information CA child anthropometry MA maternal anthropometry SM social marketing CD causes of death (verbal reports of symptoms) MM maternal mortality TBH truncated birth history
CMW currently married women NFP natural family planning VC value of children EMW ever-married women PC pill compliance WE women's employment
WS women's status
49