Embed Size (px)
Citation preview
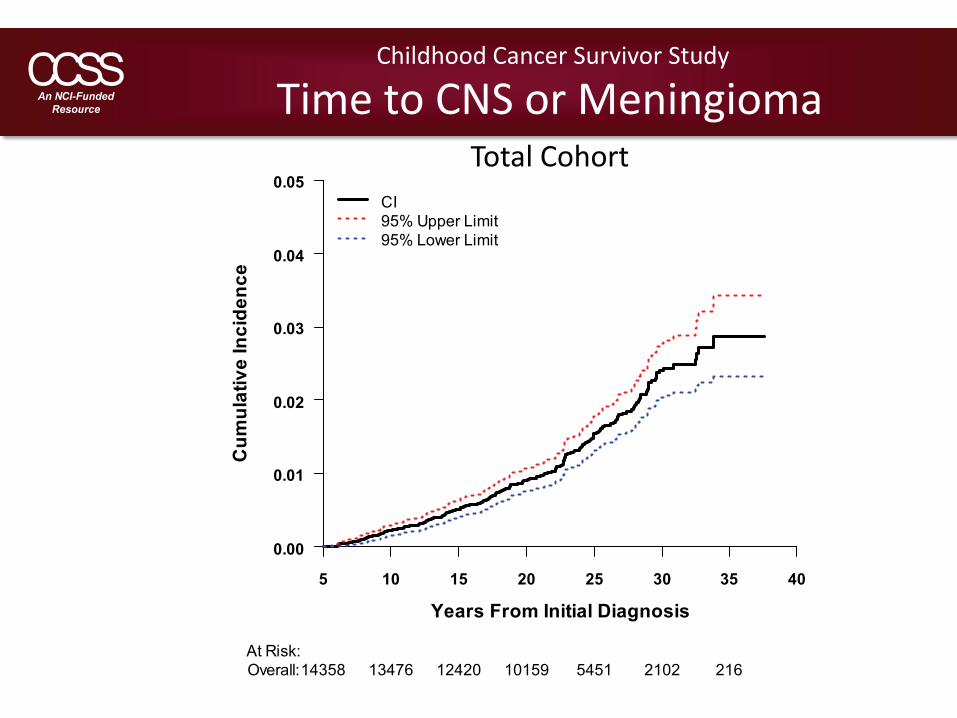
Time to CNS or MeningiomaTotal Cohort
Childhood Cancer Survivor Study
Cum
ulat
ive
Inci
denc
e
Years From Initial Diagnosis
0.00
0.01
0.02
0.03
0.04
0.05
5 10 15 20 25 30 35 40
CI95% Upper Limit95% Lower Limit
At Risk:Overall:14358 13476 12420 10159 5451 2102 216
Childhood Cancer Survivor Study
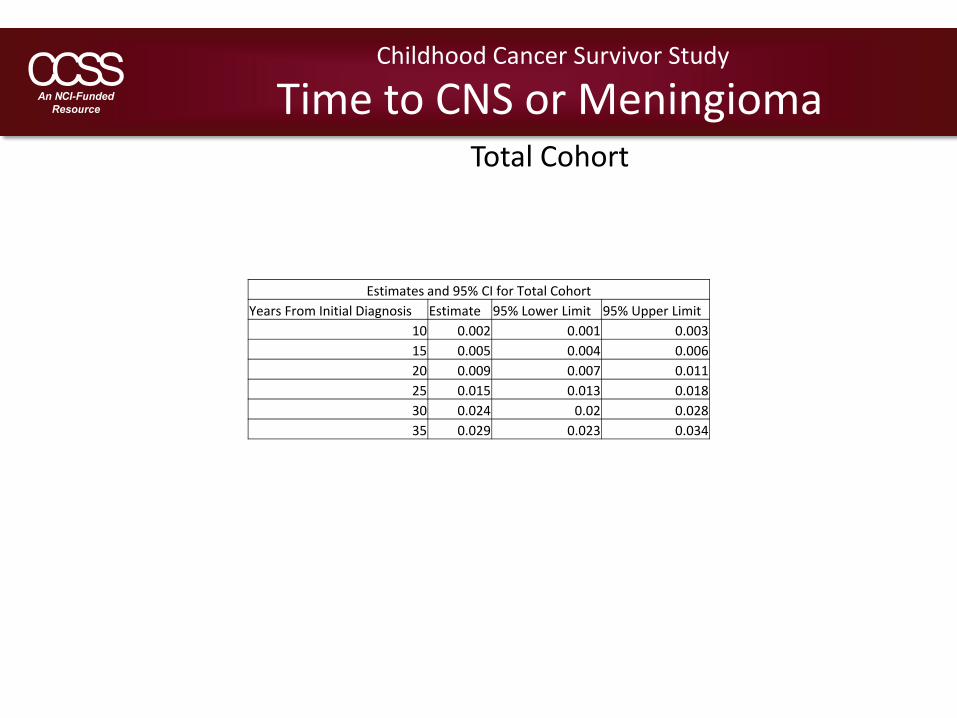
Time to CNS or MeningiomaTotal Cohort
Estimates and 95% CI for Total CohortYears From Initial Diagnosis Estimate 95% Lower Limit 95% Upper Limit
10 0.002 0.001 0.00315 0.005 0.004 0.00620 0.009 0.007 0.01125 0.015 0.013 0.01830 0.024 0.02 0.02835 0.029 0.023 0.034
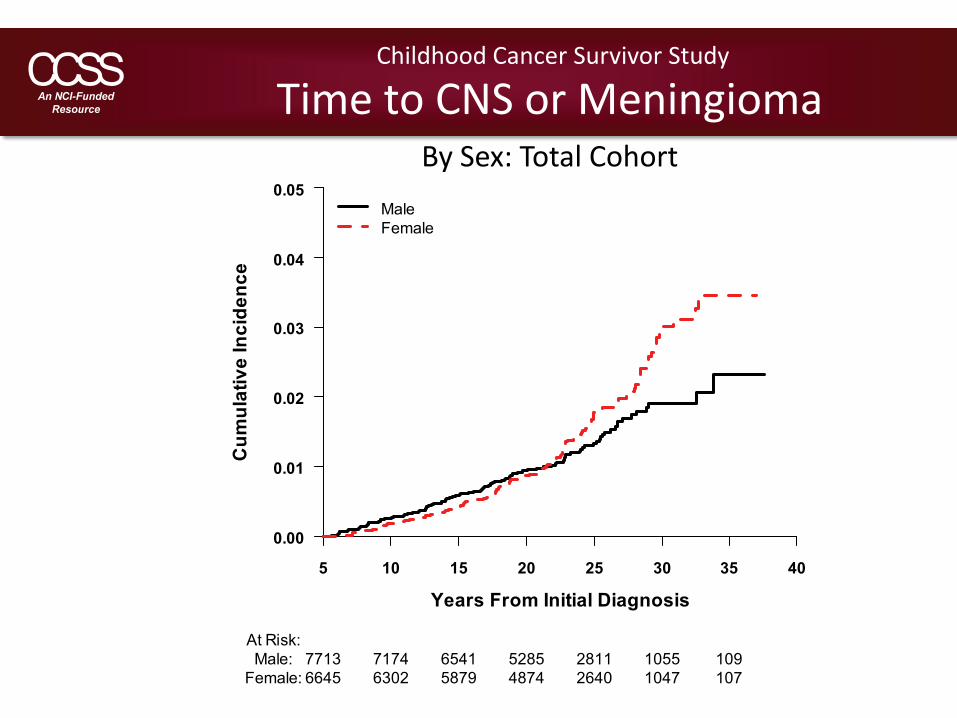
Time to CNS or MeningiomaBy Sex: Total Cohort
Childhood Cancer Survivor Study
Cum
ulat
ive
Inci
denc
e
Years From Initial Diagnosis
0.00
0.01
0.02
0.03
0.04
0.05
5 10 15 20 25 30 35 40
MaleFemale
At Risk:Male: 7713 7174 6541 5285 2811 1055 109
Female: 6645 6302 5879 4874 2640 1047 107

Estimates and 95% CI for MaleYears From Initial Diagnosis Estimate 95% Lower Limit 95% Upper Limit
10 0.002 0.001 0.00415 0.006 0.004 0.00820 0.009 0.007 0.01225 0.013 0.01 0.01630 0.019 0.015 0.02335 0.023 0.016 0.031
Estimates and 95% CI for FemaleYears From Initial Diagnosis Estimate 95% Lower Limit 95% Upper Limit
10 0.002 0.001 0.00315 0.004 0.003 0.00620 0.009 0.006 0.01125 0.018 0.014 0.02130 0.029 0.023 0.03635 0.035 0.026 0.043
Childhood Cancer Survivor Study
Time to CNS or MeningiomaBy Sex: Total Cohort
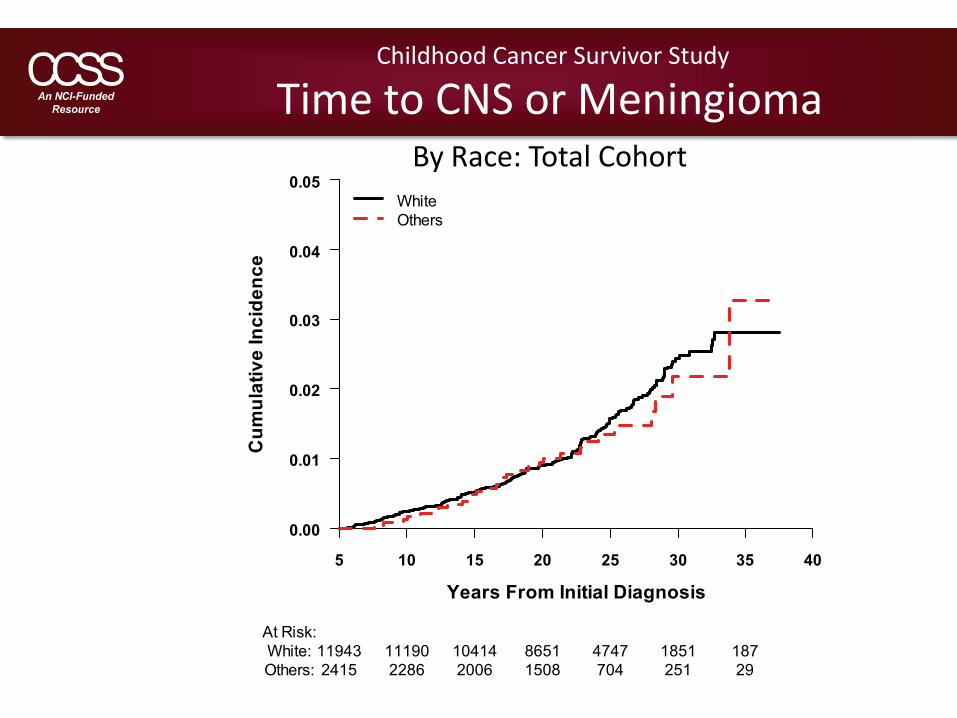
Time to CNS or MeningiomaBy Race: Total Cohort
Childhood Cancer Survivor Study
Cum
ulat
ive
Inci
denc
e
Years From Initial Diagnosis
0.00
0.01
0.02
0.03
0.04
0.05
5 10 15 20 25 30 35 40
WhiteOthers
At Risk:White: 11943 11190 10414 8651 4747 1851 187Others: 2415 2286 2006 1508 704 251 29
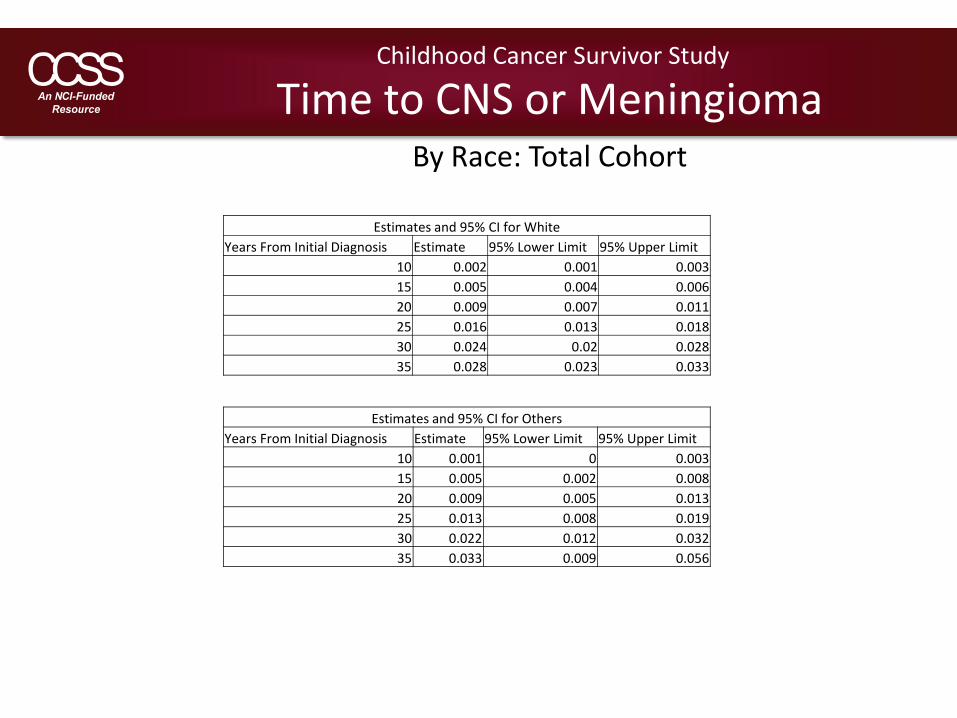
Estimates and 95% CI for WhiteYears From Initial Diagnosis Estimate 95% Lower Limit 95% Upper Limit
10 0.002 0.001 0.00315 0.005 0.004 0.00620 0.009 0.007 0.01125 0.016 0.013 0.01830 0.024 0.02 0.02835 0.028 0.023 0.033
Estimates and 95% CI for OthersYears From Initial Diagnosis Estimate 95% Lower Limit 95% Upper Limit
10 0.001 0 0.00315 0.005 0.002 0.00820 0.009 0.005 0.01325 0.013 0.008 0.01930 0.022 0.012 0.03235 0.033 0.009 0.056
Childhood Cancer Survivor Study
Time to CNS or MeningiomaBy Race: Total Cohort
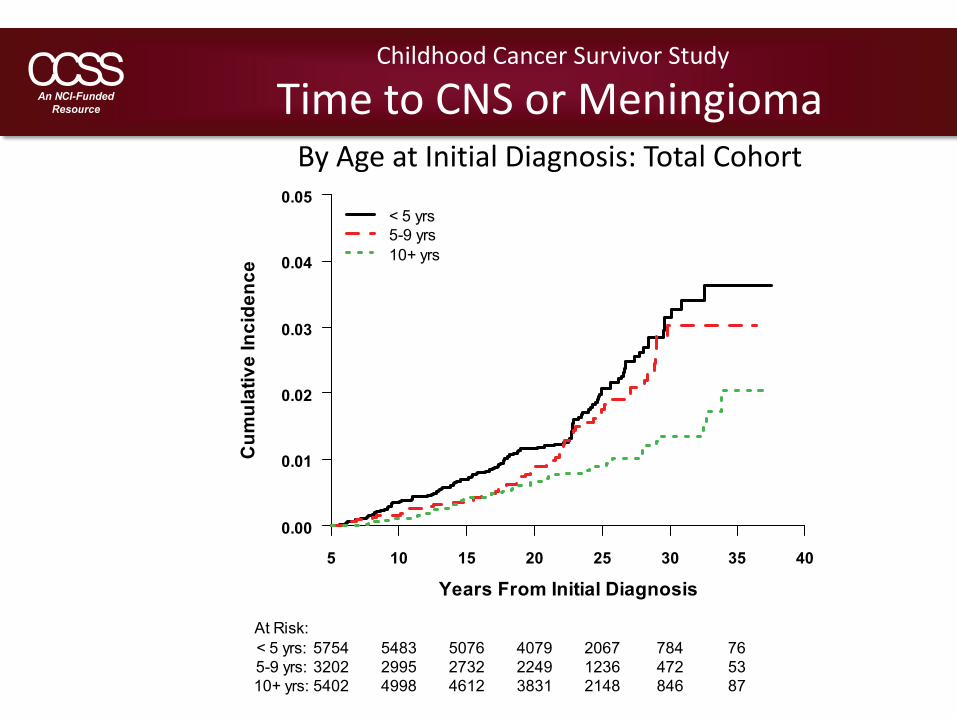
Time to CNS or MeningiomaBy Age at Initial Diagnosis: Total Cohort
Childhood Cancer Survivor Study
Cum
ulat
ive
Inci
denc
e
Years From Initial Diagnosis
0.00
0.01
0.02
0.03
0.04
0.05
5 10 15 20 25 30 35 40
< 5 yrs5-9 yrs10+ yrs
At Risk:< 5 yrs: 5754 5483 5076 4079 2067 784 765-9 yrs: 3202 2995 2732 2249 1236 472 5310+ yrs: 5402 4998 4612 3831 2148 846 87
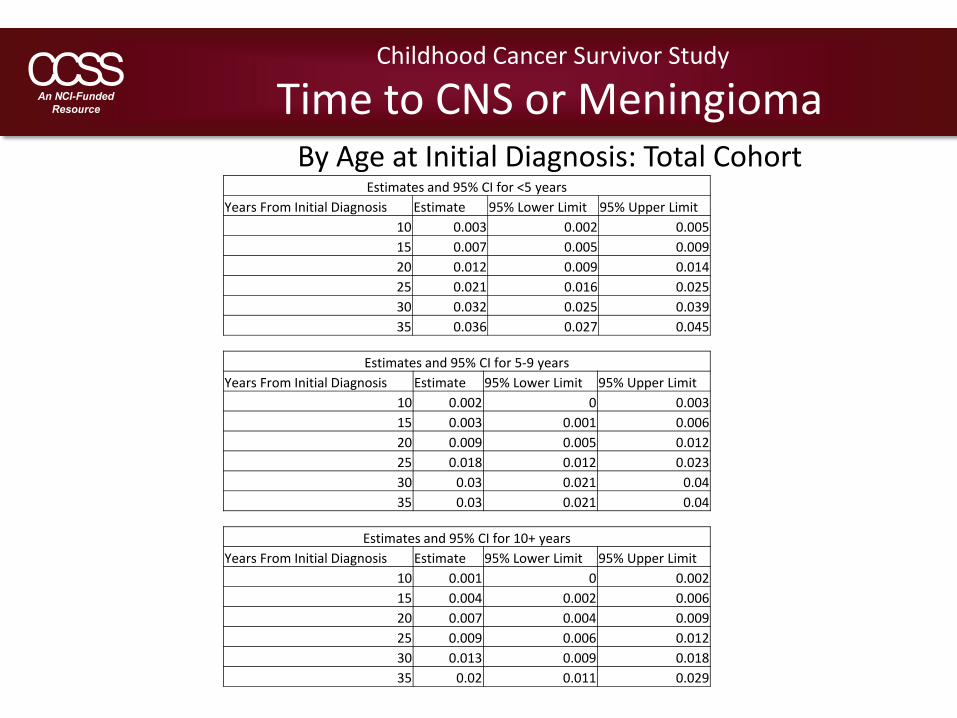
Estimates and 95% CI for <5 yearsYears From Initial Diagnosis Estimate 95% Lower Limit 95% Upper Limit
10 0.003 0.002 0.00515 0.007 0.005 0.00920 0.012 0.009 0.01425 0.021 0.016 0.02530 0.032 0.025 0.03935 0.036 0.027 0.045
Estimates and 95% CI for 5‐9 yearsYears From Initial Diagnosis Estimate 95% Lower Limit 95% Upper Limit
10 0.002 0 0.00315 0.003 0.001 0.00620 0.009 0.005 0.01225 0.018 0.012 0.02330 0.03 0.021 0.0435 0.03 0.021 0.04
Childhood Cancer Survivor Study
Time to CNS or MeningiomaBy Age at Initial Diagnosis: Total Cohort
Estimates and 95% CI for 10+ yearsYears From Initial Diagnosis Estimate 95% Lower Limit 95% Upper Limit
10 0.001 0 0.00215 0.004 0.002 0.00620 0.007 0.004 0.00925 0.009 0.006 0.01230 0.013 0.009 0.01835 0.02 0.011 0.029
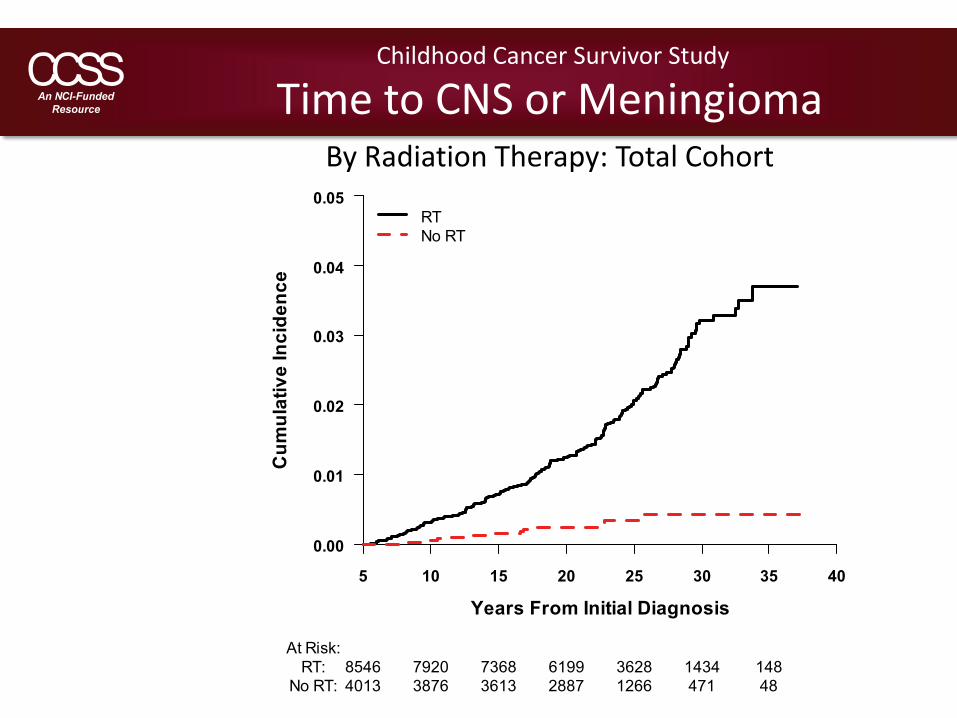
Time to CNS or MeningiomaBy Radiation Therapy: Total Cohort
Childhood Cancer Survivor Study
Cum
ulat
ive
Inci
denc
e
Years From Initial Diagnosis
0.00
0.01
0.02
0.03
0.04
0.05
5 10 15 20 25 30 35 40
RTNo RT
At Risk:RT: 8546 7920 7368 6199 3628 1434 148
No RT: 4013 3876 3613 2887 1266 471 48
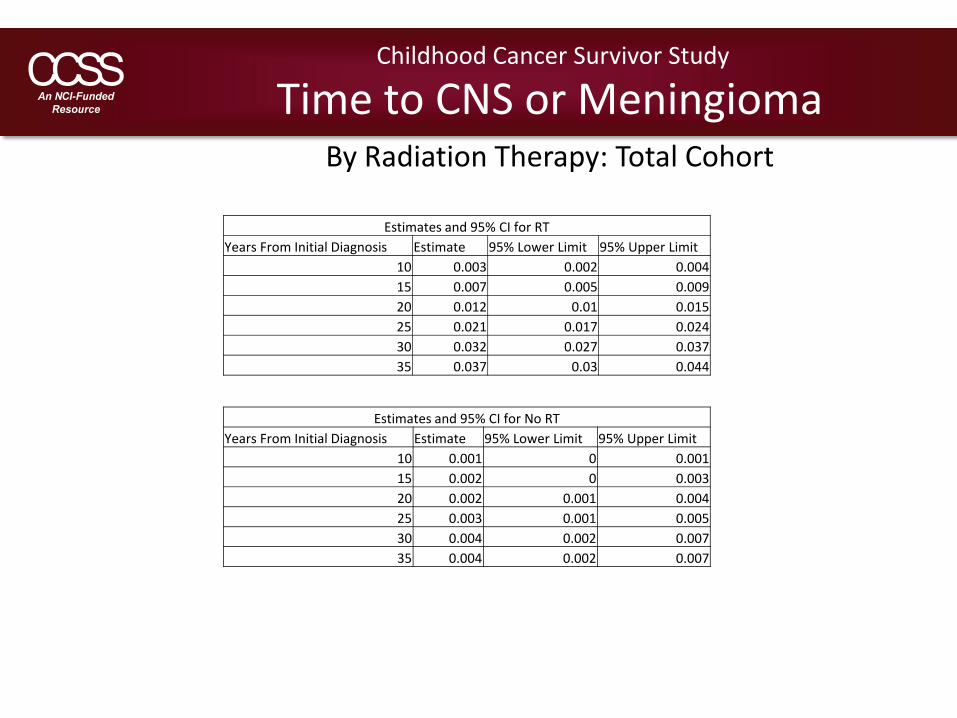
Estimates and 95% CI for RTYears From Initial Diagnosis Estimate 95% Lower Limit 95% Upper Limit
10 0.003 0.002 0.00415 0.007 0.005 0.00920 0.012 0.01 0.01525 0.021 0.017 0.02430 0.032 0.027 0.03735 0.037 0.03 0.044
Estimates and 95% CI for No RTYears From Initial Diagnosis Estimate 95% Lower Limit 95% Upper Limit
10 0.001 0 0.00115 0.002 0 0.00320 0.002 0.001 0.00425 0.003 0.001 0.00530 0.004 0.002 0.00735 0.004 0.002 0.007
Childhood Cancer Survivor Study
Time to CNS or MeningiomaBy Radiation Therapy: Total Cohort
Time to CNS or MeningiomaLeukemia
Childhood Cancer Survivor Study
Cum
ulat
ive
Inci
denc
e
Years From Initial Diagnosis
0.00
0.01
0.02
0.03
0.04
0.05
0.06
0.07
5 10 15 20 25 30 35 40
CI95% Upper Limit95% Lower Limit
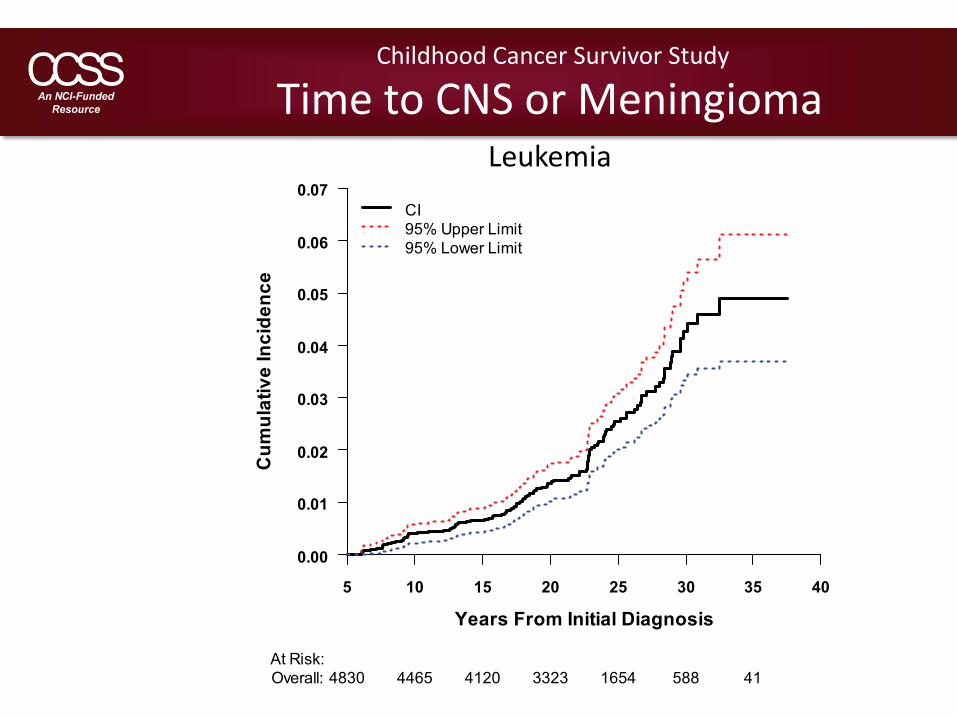
At Risk:Overall: 4830 4465 4120 3323 1654 588 41

Childhood Cancer Survivor Study
Time to CNS or MeningiomaLeukemia
Estimates and 95% CI for LeukemiaYears From Initial Diagnosis Estimate 95% Lower Limit 95% Upper Limit
10 0.004 0.002 0.00615 0.007 0.004 0.00920 0.014 0.01 0.01725 0.025 0.02 0.03130 0.043 0.033 0.05235 0.049 0.037 0.061
Time to CNS or MeningiomaBy Sex: Leukemia
Childhood Cancer Survivor Study
Cum
ulat
ive
Inci
denc
e
Years From Initial Diagnosis
0.00
0.01
0.02
0.03
0.04
0.05
0.06
0.07
5 10 15 20 25 30 35 40
MaleFemale
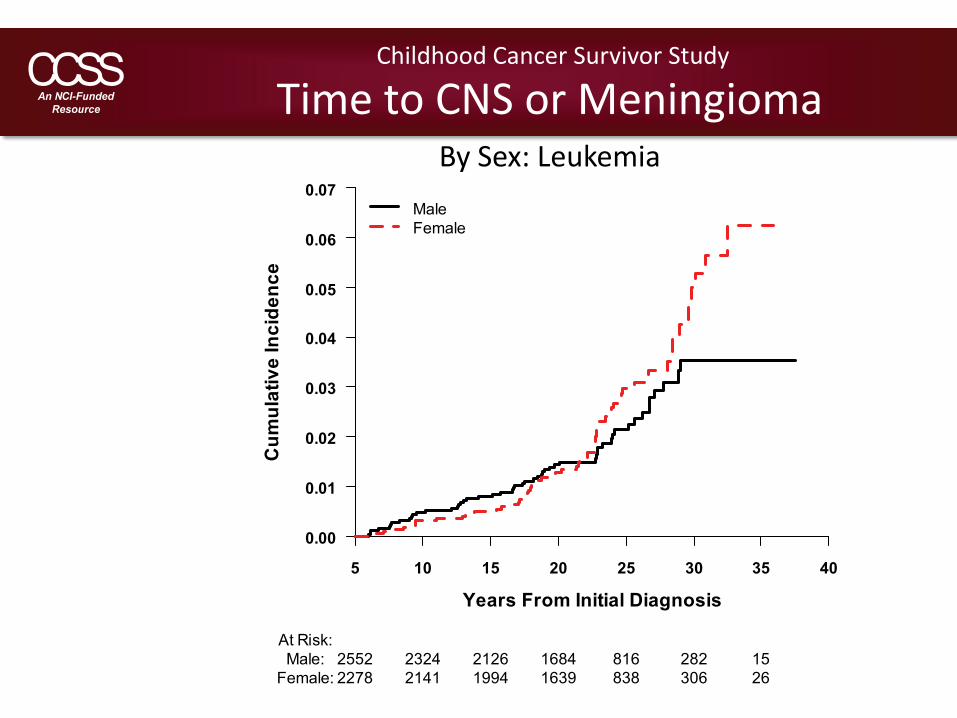
At Risk:Male: 2552 2324 2126 1684 816 282 15
Female: 2278 2141 1994 1639 838 306 26
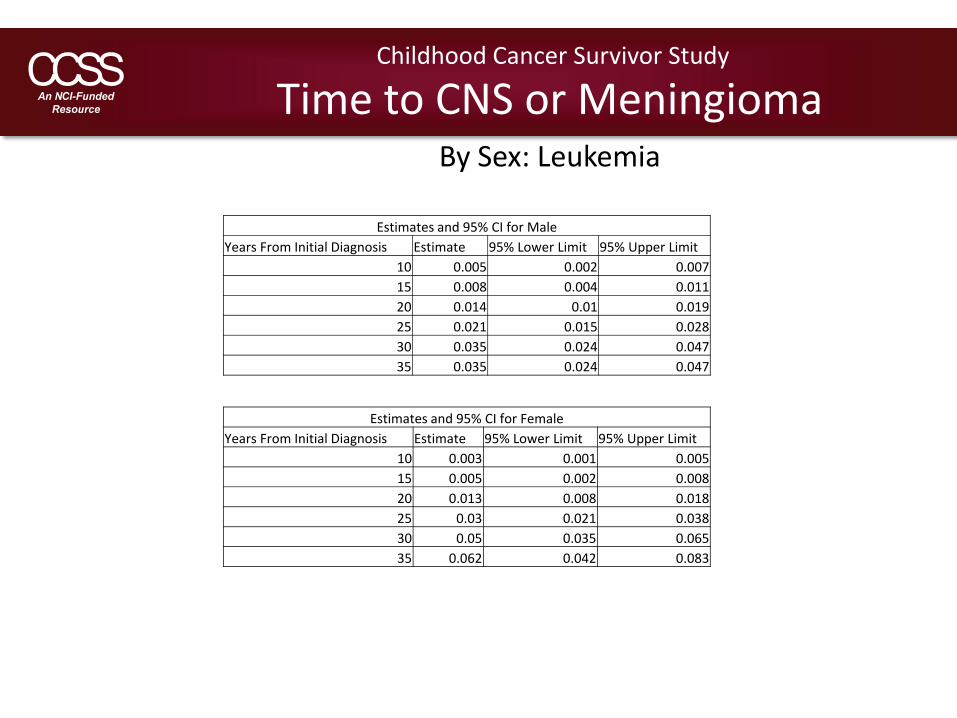
Estimates and 95% CI for MaleYears From Initial Diagnosis Estimate 95% Lower Limit 95% Upper Limit
10 0.005 0.002 0.00715 0.008 0.004 0.01120 0.014 0.01 0.01925 0.021 0.015 0.02830 0.035 0.024 0.04735 0.035 0.024 0.047
Estimates and 95% CI for FemaleYears From Initial Diagnosis Estimate 95% Lower Limit 95% Upper Limit
10 0.003 0.001 0.00515 0.005 0.002 0.00820 0.013 0.008 0.01825 0.03 0.021 0.03830 0.05 0.035 0.06535 0.062 0.042 0.083
Childhood Cancer Survivor Study
Time to CNS or MeningiomaBy Sex: Leukemia
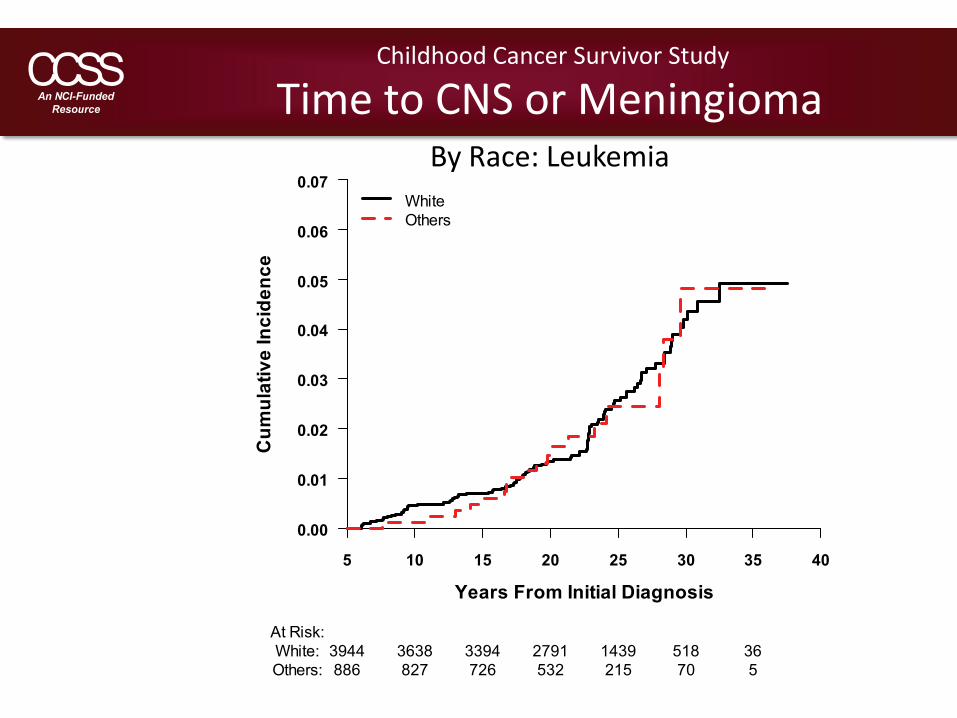
Time to CNS or MeningiomaBy Race: Leukemia
Childhood Cancer Survivor Study
Cum
ulat
ive
Inci
denc
e
Years From Initial Diagnosis
0.00
0.01
0.02
0.03
0.04
0.05
0.06
0.07
5 10 15 20 25 30 35 40
WhiteOthers
At Risk:White: 3944 3638 3394 2791 1439 518 36Others: 886 827 726 532 215 70 5
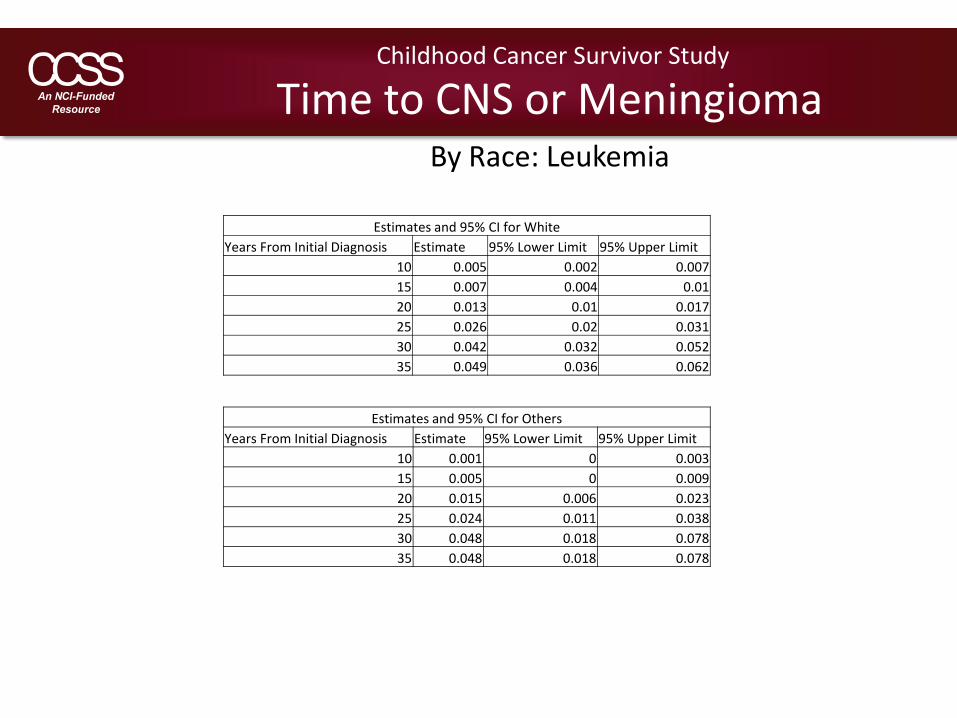
Estimates and 95% CI for WhiteYears From Initial Diagnosis Estimate 95% Lower Limit 95% Upper Limit
10 0.005 0.002 0.00715 0.007 0.004 0.0120 0.013 0.01 0.01725 0.026 0.02 0.03130 0.042 0.032 0.05235 0.049 0.036 0.062
Estimates and 95% CI for OthersYears From Initial Diagnosis Estimate 95% Lower Limit 95% Upper Limit
10 0.001 0 0.00315 0.005 0 0.00920 0.015 0.006 0.02325 0.024 0.011 0.03830 0.048 0.018 0.07835 0.048 0.018 0.078
Childhood Cancer Survivor Study
Time to CNS or MeningiomaBy Race: Leukemia
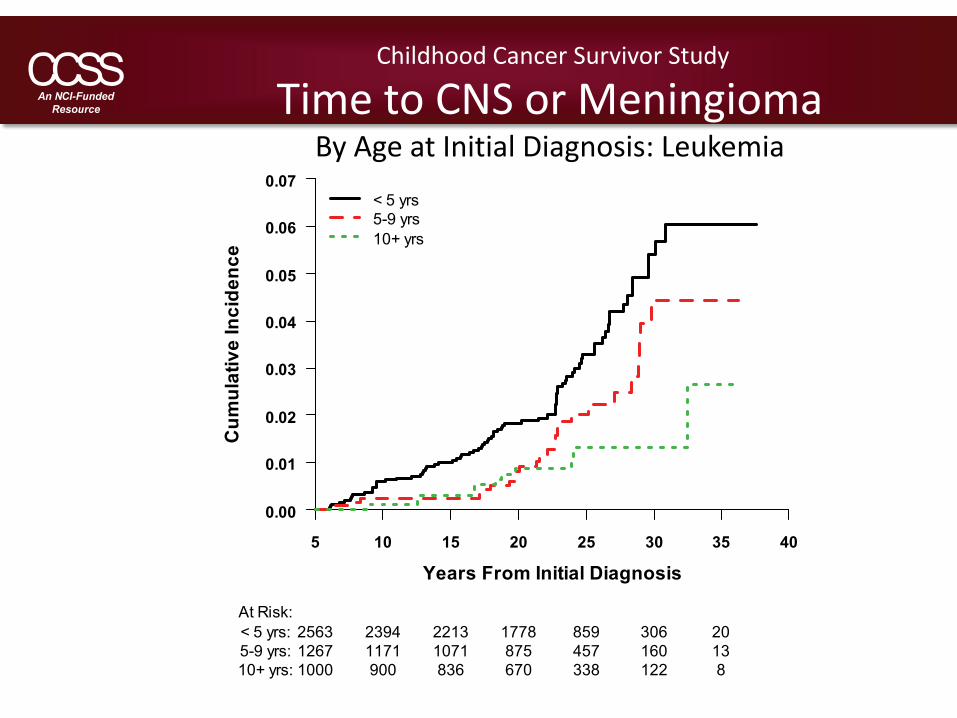
Time to CNS or MeningiomaBy Age at Initial Diagnosis: Leukemia
Childhood Cancer Survivor Study
Cum
ulat
ive
Inci
denc
e
Years From Initial Diagnosis
0.00
0.01
0.02
0.03
0.04
0.05
0.06
0.07
5 10 15 20 25 30 35 40
< 5 yrs5-9 yrs10+ yrs
At Risk:< 5 yrs: 2563 2394 2213 1778 859 306 205-9 yrs: 1267 1171 1071 875 457 160 1310+ yrs: 1000 900 836 670 338 122 8
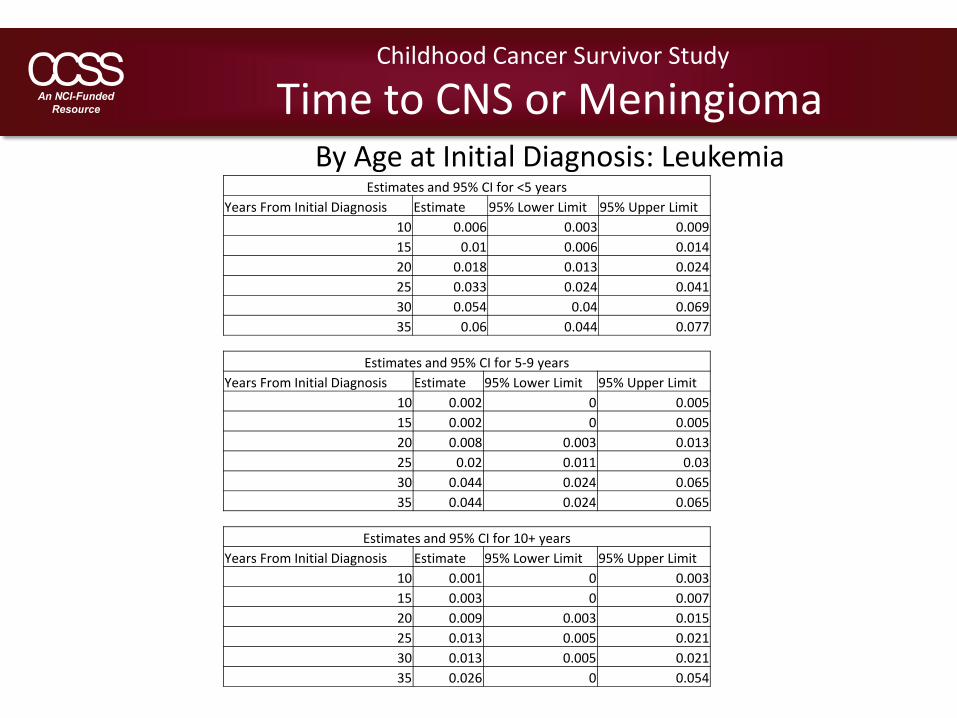
Estimates and 95% CI for <5 yearsYears From Initial Diagnosis Estimate 95% Lower Limit 95% Upper Limit
10 0.006 0.003 0.00915 0.01 0.006 0.01420 0.018 0.013 0.02425 0.033 0.024 0.04130 0.054 0.04 0.06935 0.06 0.044 0.077
Estimates and 95% CI for 5‐9 yearsYears From Initial Diagnosis Estimate 95% Lower Limit 95% Upper Limit
10 0.002 0 0.00515 0.002 0 0.00520 0.008 0.003 0.01325 0.02 0.011 0.0330 0.044 0.024 0.06535 0.044 0.024 0.065
Childhood Cancer Survivor Study
Time to CNS or MeningiomaBy Age at Initial Diagnosis: Leukemia
Estimates and 95% CI for 10+ yearsYears From Initial Diagnosis Estimate 95% Lower Limit 95% Upper Limit
10 0.001 0 0.00315 0.003 0 0.00720 0.009 0.003 0.01525 0.013 0.005 0.02130 0.013 0.005 0.02135 0.026 0 0.054
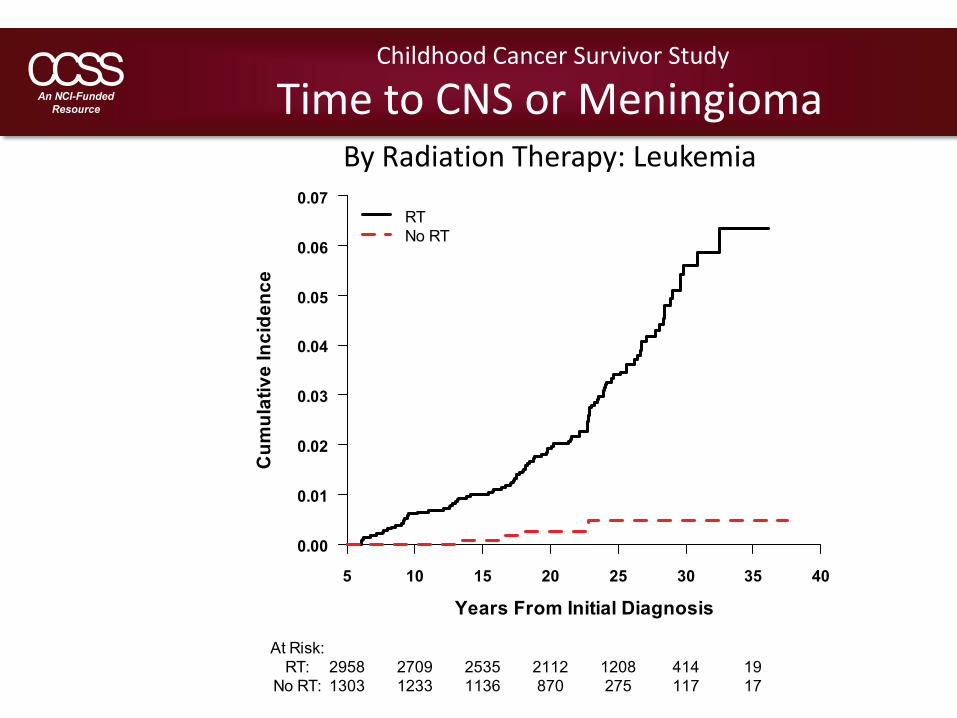
Time to CNS or MeningiomaBy Radiation Therapy: Leukemia
Childhood Cancer Survivor Study
Cum
ulat
ive
Inci
denc
e
Years From Initial Diagnosis
0.00
0.01
0.02
0.03
0.04
0.05
0.06
0.07
5 10 15 20 25 30 35 40
RTNo RT
At Risk:RT: 2958 2709 2535 2112 1208 414 19
No RT: 1303 1233 1136 870 275 117 17
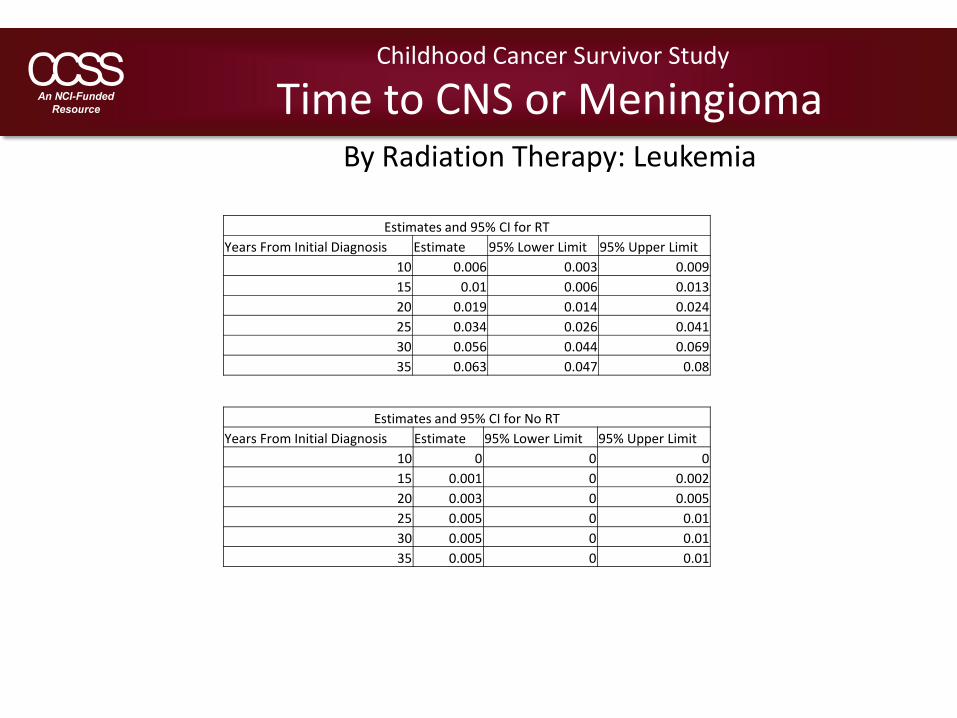
Estimates and 95% CI for RTYears From Initial Diagnosis Estimate 95% Lower Limit 95% Upper Limit
10 0.006 0.003 0.00915 0.01 0.006 0.01320 0.019 0.014 0.02425 0.034 0.026 0.04130 0.056 0.044 0.06935 0.063 0.047 0.08
Estimates and 95% CI for No RTYears From Initial Diagnosis Estimate 95% Lower Limit 95% Upper Limit
10 0 0 015 0.001 0 0.00220 0.003 0 0.00525 0.005 0 0.0130 0.005 0 0.0135 0.005 0 0.01
Childhood Cancer Survivor Study
Time to CNS or MeningiomaBy Radiation Therapy: Leukemia
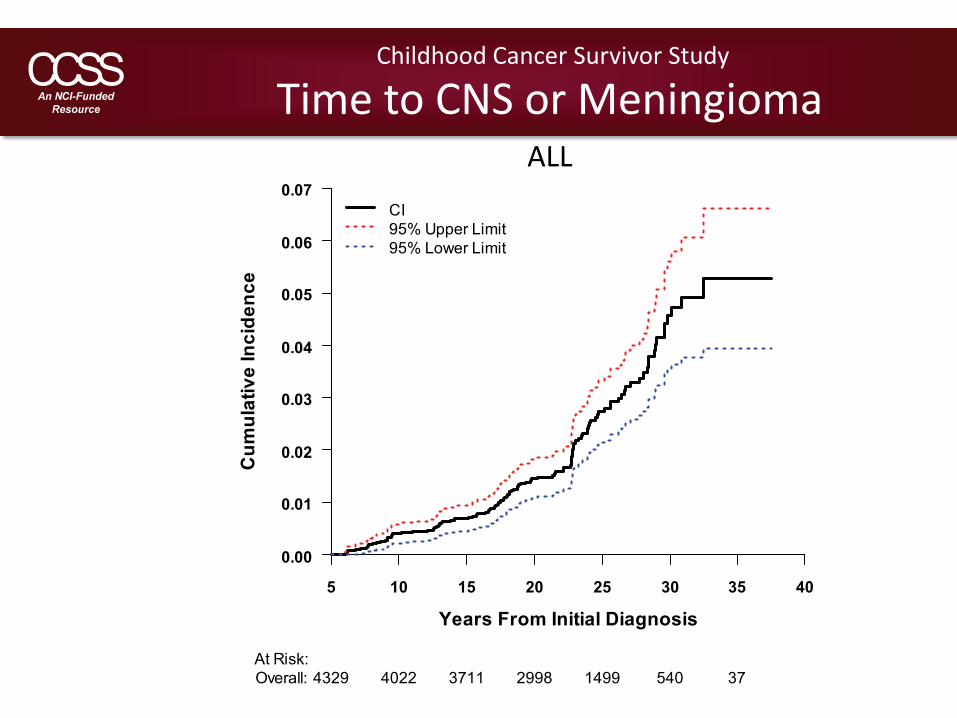
Time to CNS or MeningiomaALL
Childhood Cancer Survivor Study
Cum
ulat
ive
Inci
denc
e
Years From Initial Diagnosis
0.00
0.01
0.02
0.03
0.04
0.05
0.06
0.07
5 10 15 20 25 30 35 40
CI95% Upper Limit95% Lower Limit
At Risk:Overall: 4329 4022 3711 2998 1499 540 37

Childhood Cancer Survivor Study
Time to CNS or MeningiomaALL
Estimates and 95% CI for ALLYears From Initial Diagnosis Estimate 95% Lower Limit 95% Upper Limit
10 0.004 0.002 0.00615 0.007 0.004 0.00920 0.014 0.011 0.01825 0.027 0.021 0.03330 0.046 0.035 0.05635 0.053 0.039 0.066
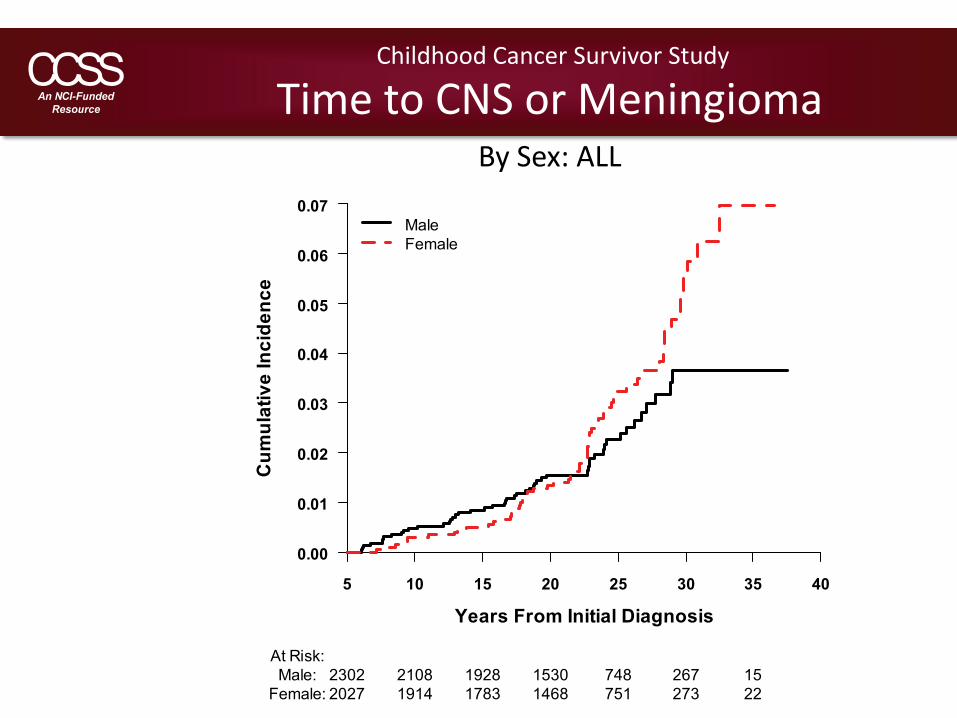
Time to CNS or MeningiomaBy Sex: ALL
Childhood Cancer Survivor Study
Cum
ulat
ive
Inci
denc
e
Years From Initial Diagnosis
0.00
0.01
0.02
0.03
0.04
0.05
0.06
0.07
5 10 15 20 25 30 35 40
MaleFemale
At Risk:Male: 2302 2108 1928 1530 748 267 15
Female: 2027 1914 1783 1468 751 273 22
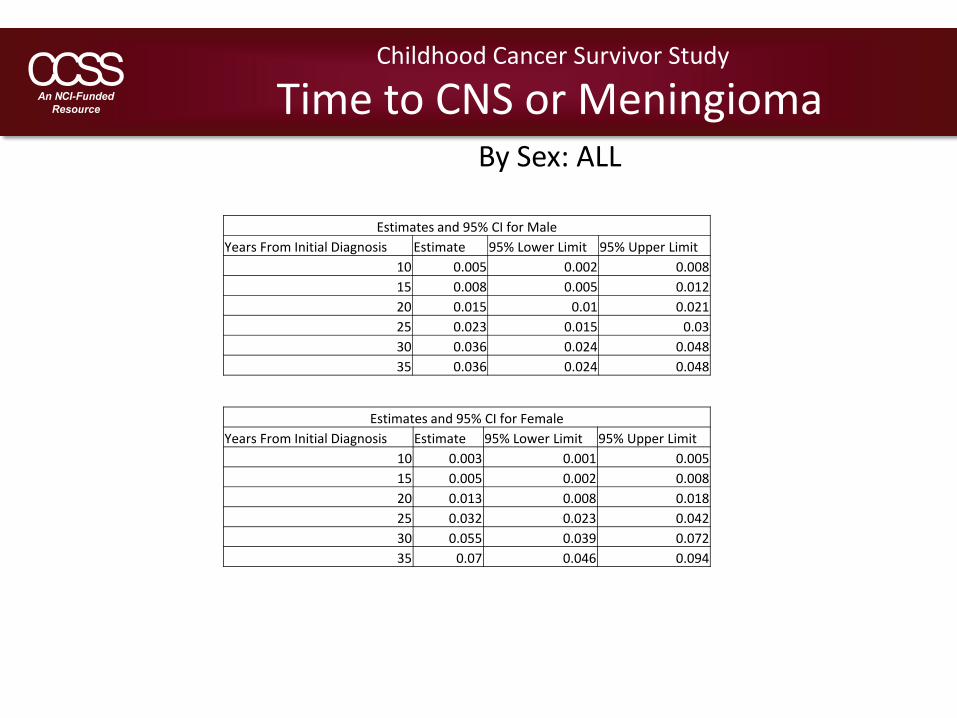
Estimates and 95% CI for MaleYears From Initial Diagnosis Estimate 95% Lower Limit 95% Upper Limit
10 0.005 0.002 0.00815 0.008 0.005 0.01220 0.015 0.01 0.02125 0.023 0.015 0.0330 0.036 0.024 0.04835 0.036 0.024 0.048
Estimates and 95% CI for FemaleYears From Initial Diagnosis Estimate 95% Lower Limit 95% Upper Limit
10 0.003 0.001 0.00515 0.005 0.002 0.00820 0.013 0.008 0.01825 0.032 0.023 0.04230 0.055 0.039 0.07235 0.07 0.046 0.094
Childhood Cancer Survivor Study
Time to CNS or MeningiomaBy Sex: ALL
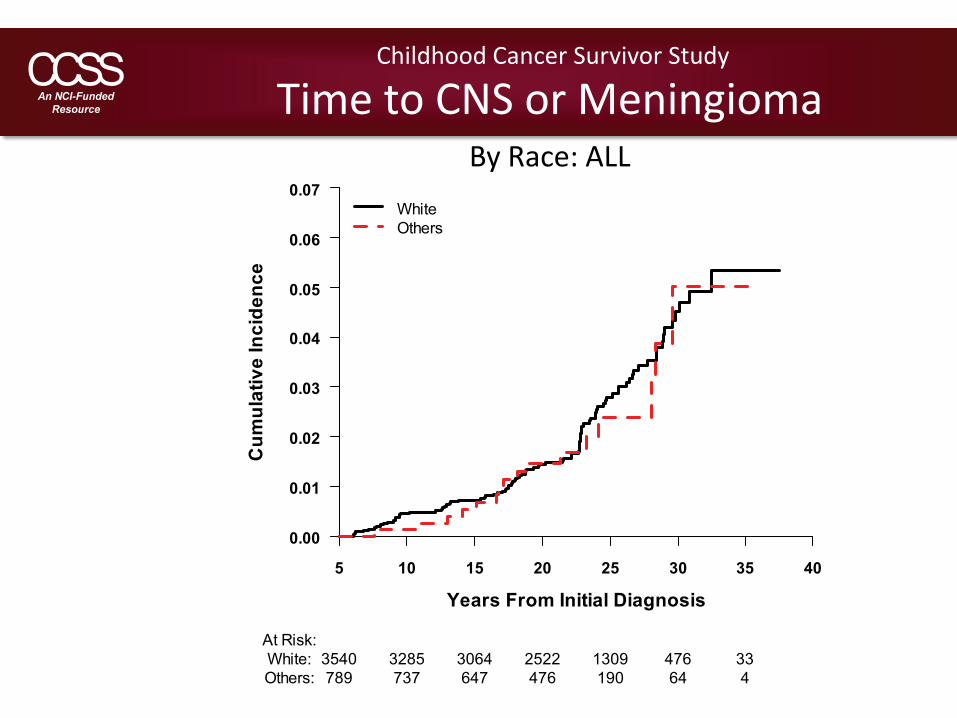
Time to CNS or MeningiomaBy Race: ALL
Childhood Cancer Survivor Study
Cum
ulat
ive
Inci
denc
e
Years From Initial Diagnosis
0.00
0.01
0.02
0.03
0.04
0.05
0.06
0.07
5 10 15 20 25 30 35 40
WhiteOthers
At Risk:White: 3540 3285 3064 2522 1309 476 33Others: 789 737 647 476 190 64 4
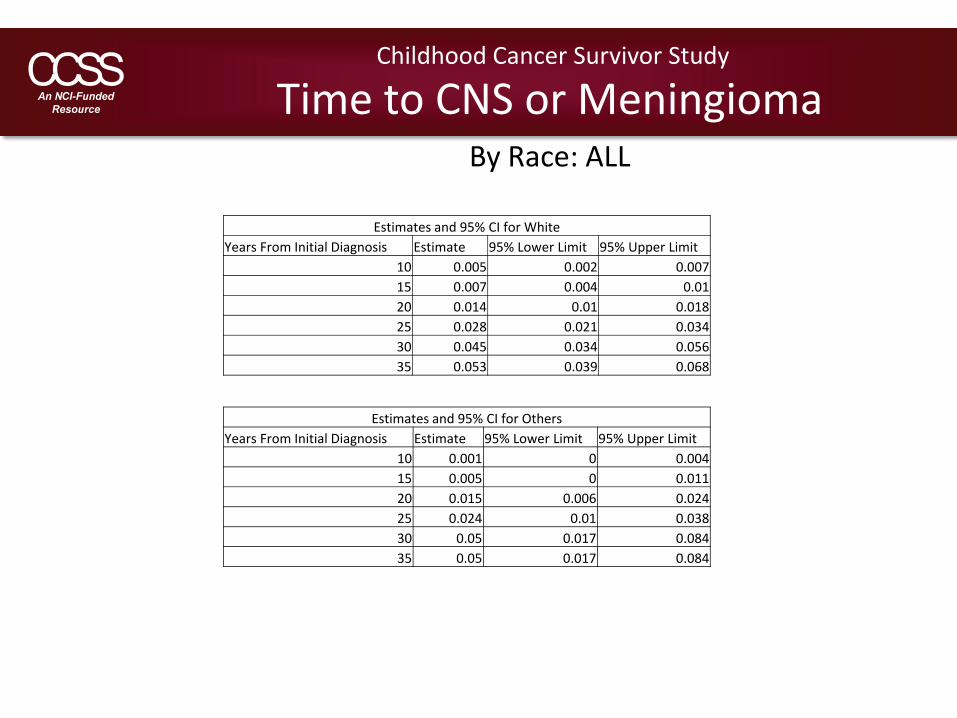
Estimates and 95% CI for WhiteYears From Initial Diagnosis Estimate 95% Lower Limit 95% Upper Limit
10 0.005 0.002 0.00715 0.007 0.004 0.0120 0.014 0.01 0.01825 0.028 0.021 0.03430 0.045 0.034 0.05635 0.053 0.039 0.068
Estimates and 95% CI for OthersYears From Initial Diagnosis Estimate 95% Lower Limit 95% Upper Limit
10 0.001 0 0.00415 0.005 0 0.01120 0.015 0.006 0.02425 0.024 0.01 0.03830 0.05 0.017 0.08435 0.05 0.017 0.084
Childhood Cancer Survivor Study
Time to CNS or MeningiomaBy Race: ALL
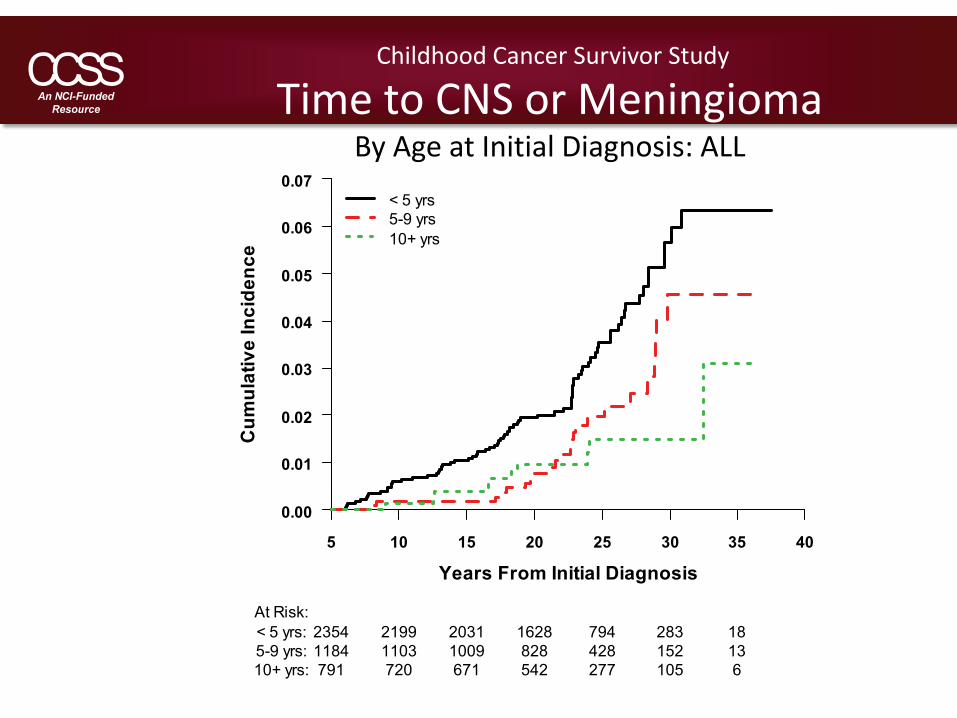
Time to CNS or MeningiomaBy Age at Initial Diagnosis: ALL
Childhood Cancer Survivor Study
Cum
ulat
ive
Inci
denc
e
Years From Initial Diagnosis
0.00
0.01
0.02
0.03
0.04
0.05
0.06
0.07
5 10 15 20 25 30 35 40
< 5 yrs5-9 yrs10+ yrs
At Risk:< 5 yrs: 2354 2199 2031 1628 794 283 185-9 yrs: 1184 1103 1009 828 428 152 1310+ yrs: 791 720 671 542 277 105 6

Estimates and 95% CI for <5 yearsYears From Initial Diagnosis Estimate 95% Lower Limit 95% Upper Limit
10 0.006 0.003 0.00915 0.01 0.006 0.01420 0.019 0.014 0.02525 0.035 0.026 0.04530 0.057 0.041 0.07235 0.063 0.046 0.081
Estimates and 95% CI for 5‐9 yearsYears From Initial Diagnosis Estimate 95% Lower Limit 95% Upper Limit
10 0.002 0 0.00415 0.002 0 0.00420 0.008 0.002 0.01325 0.02 0.01 0.02930 0.046 0.024 0.06735 0.046 0.024 0.067
Childhood Cancer Survivor Study
Time to CNS or MeningiomaBy Age at Initial Diagnosis: ALL
Estimates and 95% CI for 10+ yearsYears From Initial Diagnosis Estimate 95% Lower Limit 95% Upper Limit
10 0.001 0 0.00415 0.004 0 0.00820 0.009 0.002 0.01625 0.015 0.005 0.02530 0.015 0.005 0.02535 0.031 0 0.064
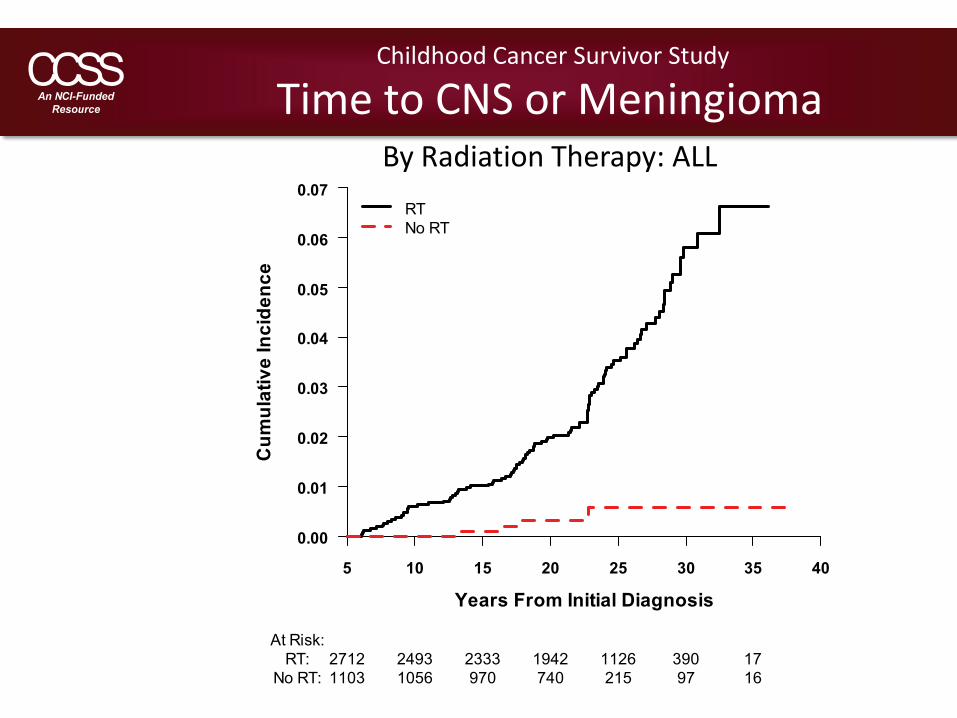
Time to CNS or MeningiomaBy Radiation Therapy: ALL
Childhood Cancer Survivor Study
Cum
ulat
ive
Inci
denc
e
Years From Initial Diagnosis
0.00
0.01
0.02
0.03
0.04
0.05
0.06
0.07
5 10 15 20 25 30 35 40
RTNo RT
At Risk:RT: 2712 2493 2333 1942 1126 390 17
No RT: 1103 1056 970 740 215 97 16
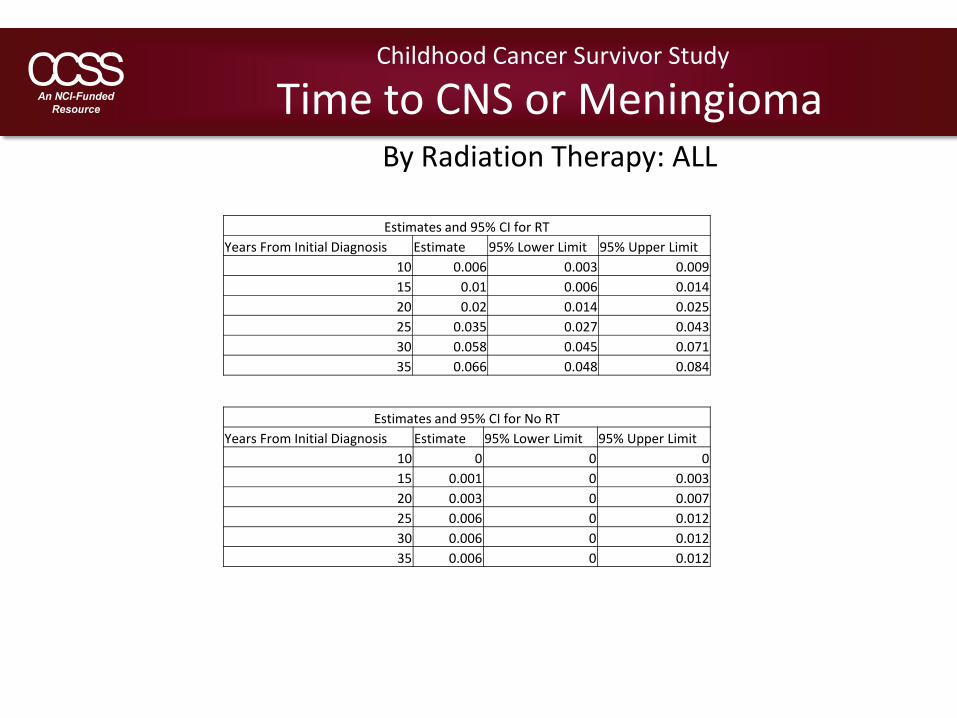
Estimates and 95% CI for RTYears From Initial Diagnosis Estimate 95% Lower Limit 95% Upper Limit
10 0.006 0.003 0.00915 0.01 0.006 0.01420 0.02 0.014 0.02525 0.035 0.027 0.04330 0.058 0.045 0.07135 0.066 0.048 0.084
Estimates and 95% CI for No RTYears From Initial Diagnosis Estimate 95% Lower Limit 95% Upper Limit
10 0 0 015 0.001 0 0.00320 0.003 0 0.00725 0.006 0 0.01230 0.006 0 0.01235 0.006 0 0.012
Childhood Cancer Survivor Study
Time to CNS or MeningiomaBy Radiation Therapy: ALL
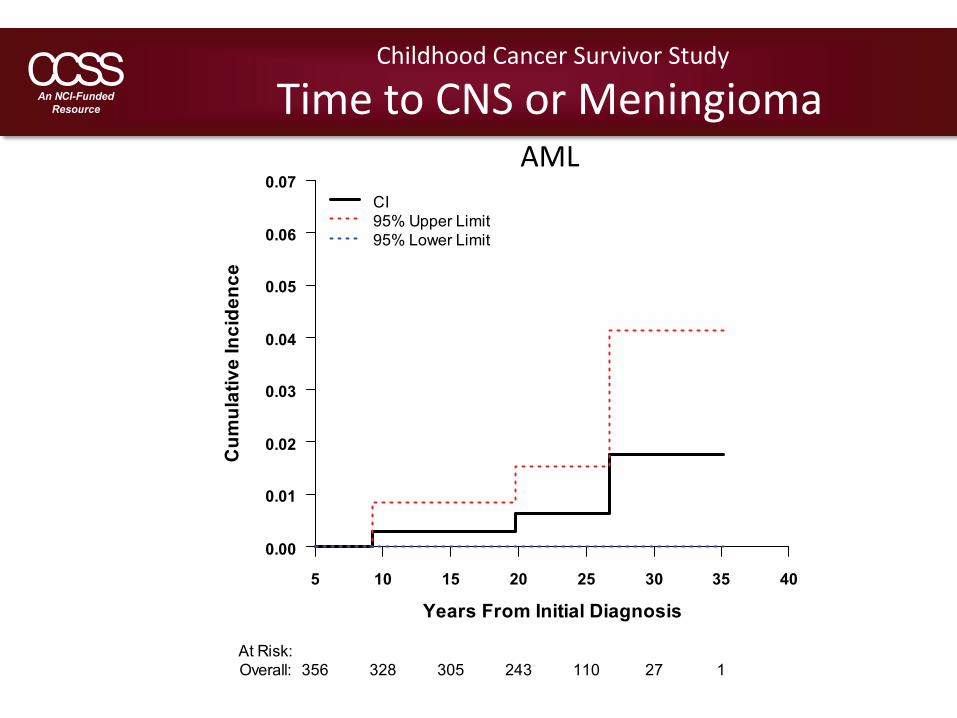
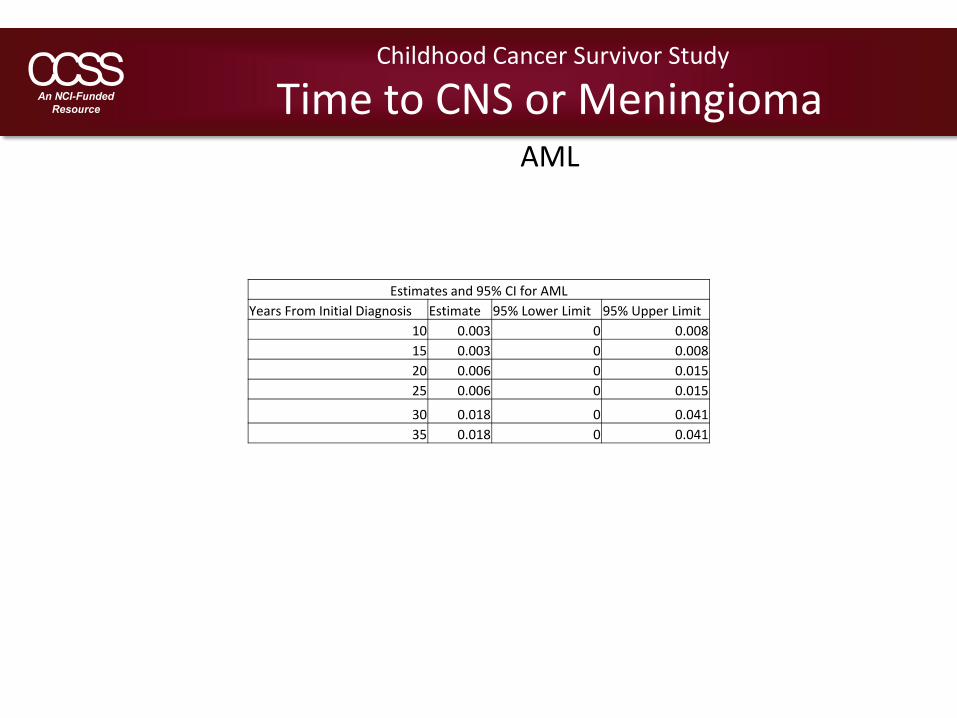
Time to CNS or MeningiomaAML
Childhood Cancer Survivor Study
Cum
ulat
ive
Inci
denc
e
Years From Initial Diagnosis
0.00
0.01
0.02
0.03
0.04
0.05
0.06
0.07
5 10 15 20 25 30 35 40
CI95% Upper Limit95% Lower Limit
At Risk:Overall: 356 328 305 243 110 27 1
Childhood Cancer Survivor Study
Time to CNS or MeningiomaAML
Estimates and 95% CI for AMLYears From Initial Diagnosis Estimate 95% Lower Limit 95% Upper Limit
10 0.003 0 0.00815 0.003 0 0.00820 0.006 0 0.01525 0.006 0 0.015
30 0.018 0 0.04135 0.018 0 0.041
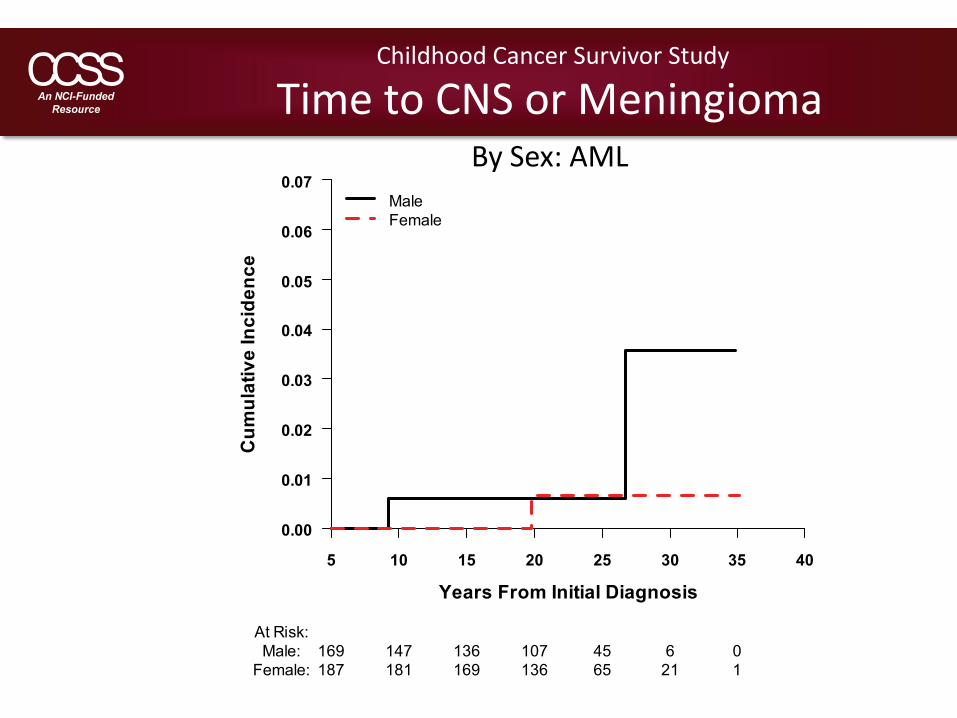
Time to CNS or MeningiomaBy Sex: AML
Childhood Cancer Survivor Study
Cum
ulat
ive
Inci
denc
e
Years From Initial Diagnosis
0.00
0.01
0.02
0.03
0.04
0.05
0.06
0.07
5 10 15 20 25 30 35 40
MaleFemale
At Risk:Male: 169 147 136 107 45 6 0
Female: 187 181 169 136 65 21 1
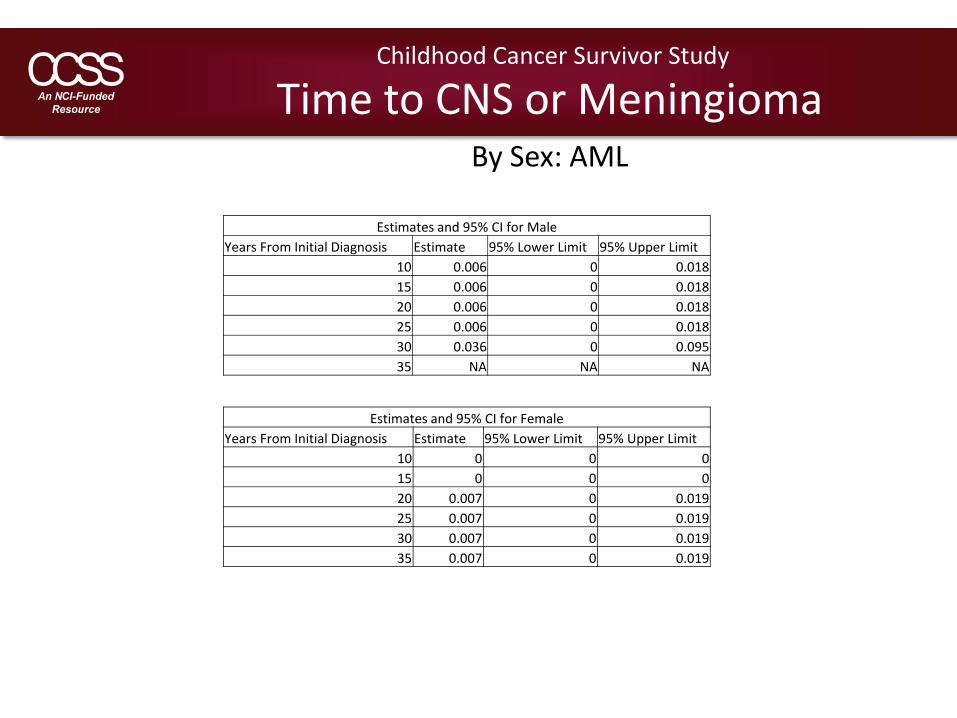
Estimates and 95% CI for MaleYears From Initial Diagnosis Estimate 95% Lower Limit 95% Upper Limit
10 0.006 0 0.01815 0.006 0 0.01820 0.006 0 0.01825 0.006 0 0.01830 0.036 0 0.09535 NA NA NA
Estimates and 95% CI for FemaleYears From Initial Diagnosis Estimate 95% Lower Limit 95% Upper Limit
10 0 0 015 0 0 020 0.007 0 0.01925 0.007 0 0.01930 0.007 0 0.01935 0.007 0 0.019
Childhood Cancer Survivor Study
Time to CNS or MeningiomaBy Sex: AML
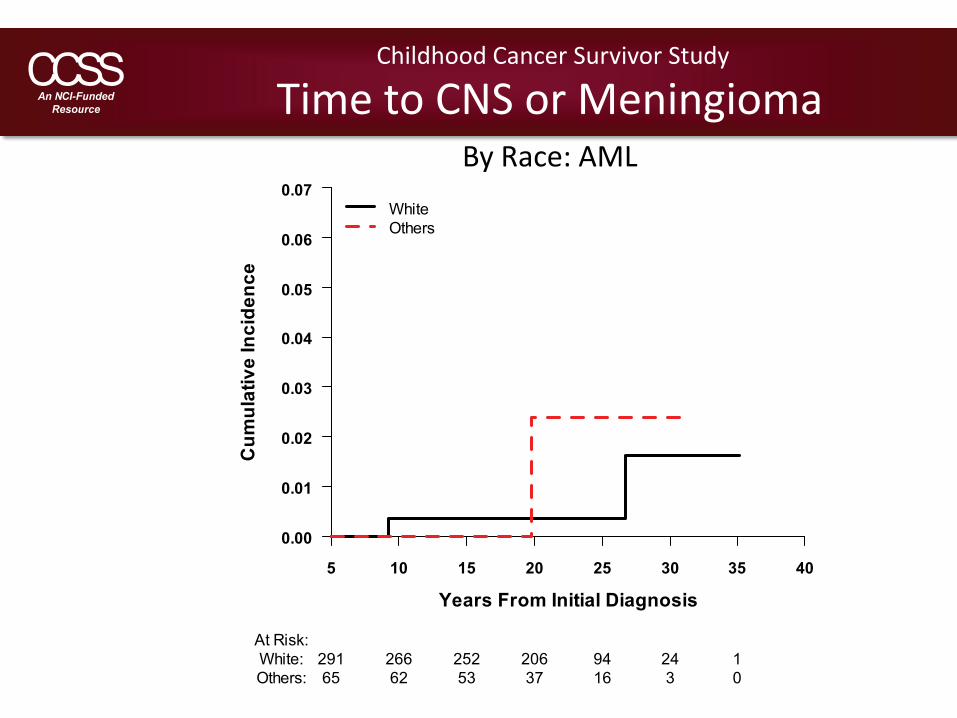
Time to CNS or MeningiomaBy Race: AML
Childhood Cancer Survivor Study
Cum
ulat
ive
Inci
denc
e
Years From Initial Diagnosis
0.00
0.01
0.02
0.03
0.04
0.05
0.06
0.07
5 10 15 20 25 30 35 40
WhiteOthers
At Risk:White: 291 266 252 206 94 24 1Others: 65 62 53 37 16 3 0
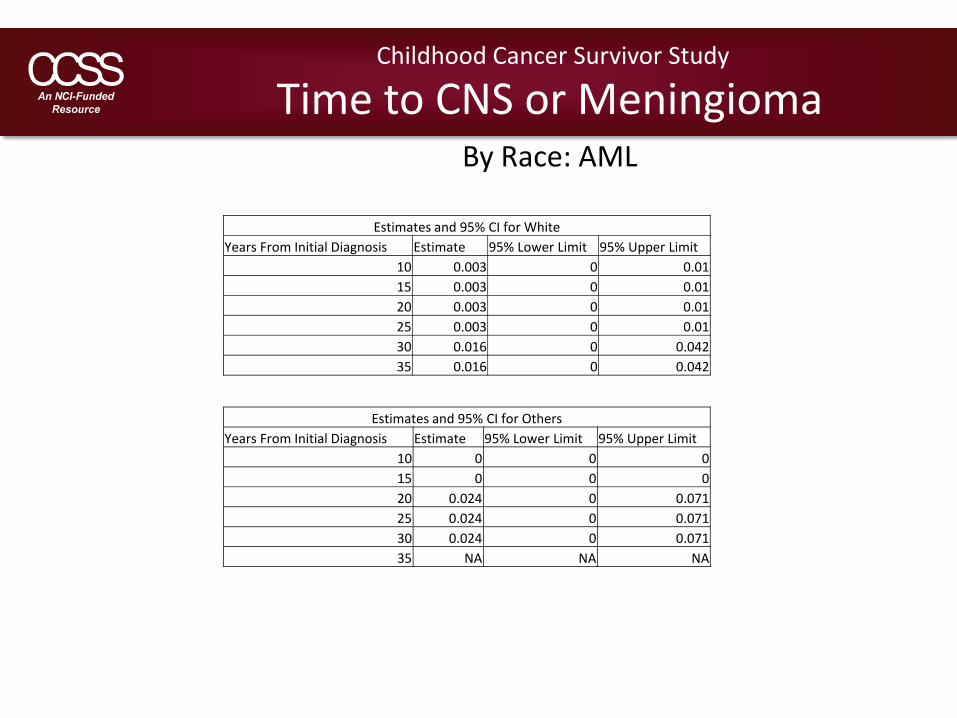
Estimates and 95% CI for WhiteYears From Initial Diagnosis Estimate 95% Lower Limit 95% Upper Limit
10 0.003 0 0.0115 0.003 0 0.0120 0.003 0 0.0125 0.003 0 0.0130 0.016 0 0.04235 0.016 0 0.042
Estimates and 95% CI for OthersYears From Initial Diagnosis Estimate 95% Lower Limit 95% Upper Limit
10 0 0 015 0 0 020 0.024 0 0.07125 0.024 0 0.07130 0.024 0 0.07135 NA NA NA
Childhood Cancer Survivor Study
Time to CNS or MeningiomaBy Race: AML
Time to CNS or MeningiomaBy Age at Initial Diagnosis: AML
Childhood Cancer Survivor Study
Cum
ulat
ive
Inci
denc
e
Years From Initial Diagnosis
0.00
0.01
0.02
0.03
0.04
0.05
0.06
0.07
5 10 15 20 25 30 35 40
< 5 yrs5-9 yrs10+ yrs
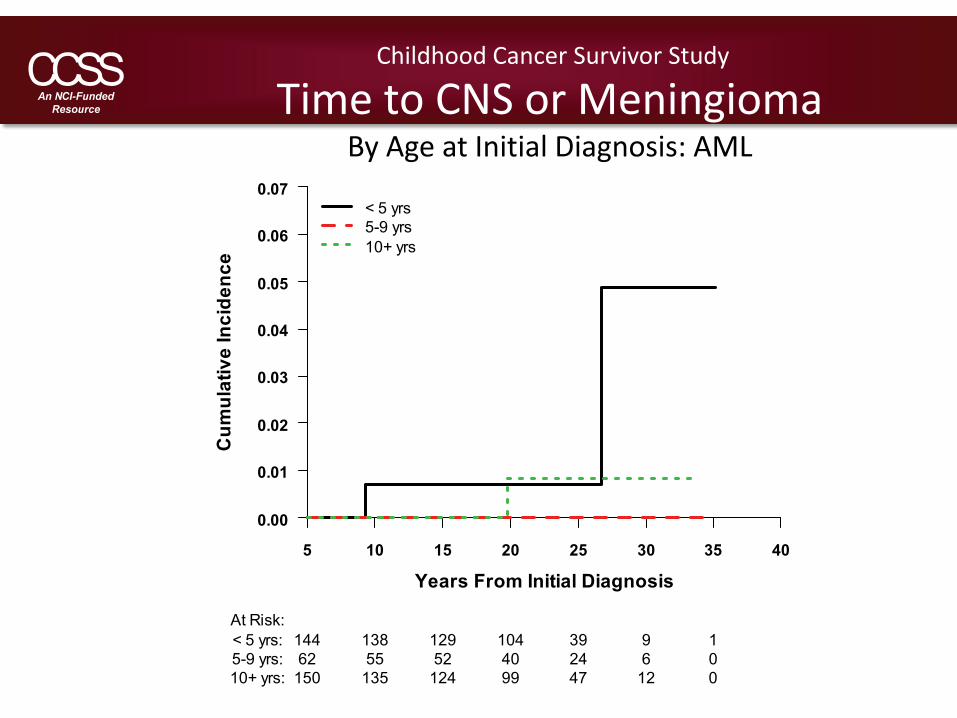
At Risk:< 5 yrs: 144 138 129 104 39 9 15-9 yrs: 62 55 52 40 24 6 010+ yrs: 150 135 124 99 47 12 0
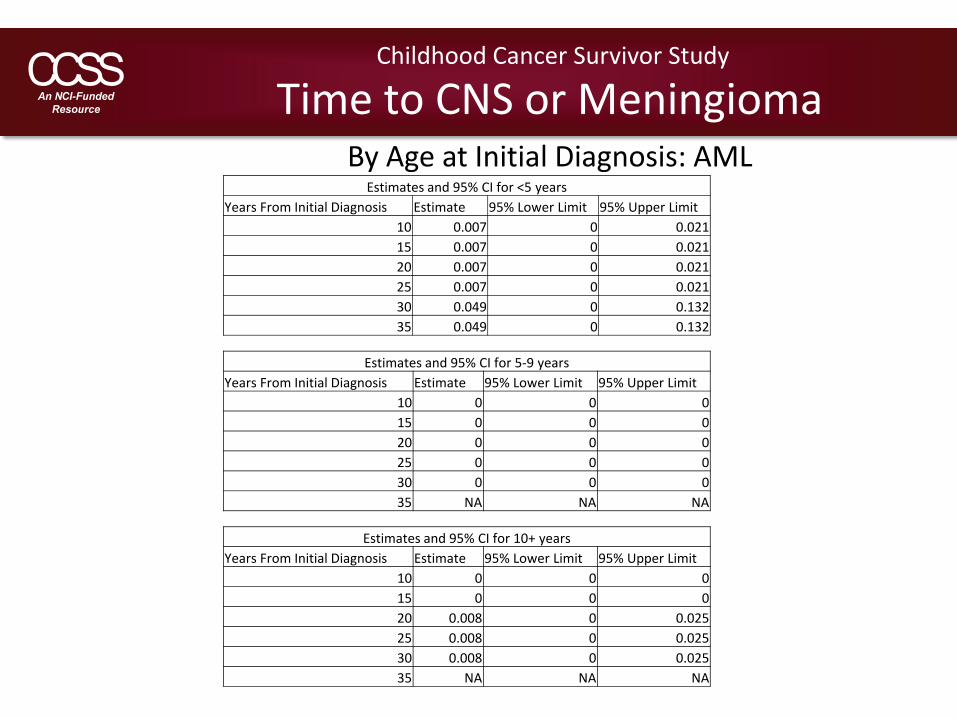
Estimates and 95% CI for <5 yearsYears From Initial Diagnosis Estimate 95% Lower Limit 95% Upper Limit
10 0.007 0 0.02115 0.007 0 0.02120 0.007 0 0.02125 0.007 0 0.02130 0.049 0 0.13235 0.049 0 0.132
Estimates and 95% CI for 5‐9 yearsYears From Initial Diagnosis Estimate 95% Lower Limit 95% Upper Limit
10 0 0 015 0 0 020 0 0 025 0 0 030 0 0 035 NA NA NA
Childhood Cancer Survivor Study
Time to CNS or MeningiomaBy Age at Initial Diagnosis: AML
Estimates and 95% CI for 10+ yearsYears From Initial Diagnosis Estimate 95% Lower Limit 95% Upper Limit
10 0 0 015 0 0 020 0.008 0 0.02525 0.008 0 0.02530 0.008 0 0.02535 NA NA NA
Time to CNS or MeningiomaBy Radiation Therapy: AML
Childhood Cancer Survivor Study
Cum
ulat
ive
Inci
denc
e
Years From Initial Diagnosis
0.00
0.01
0.02
0.03
0.04
0.05
0.06
0.07
5 10 15 20 25 30 35 40
RTNo RT
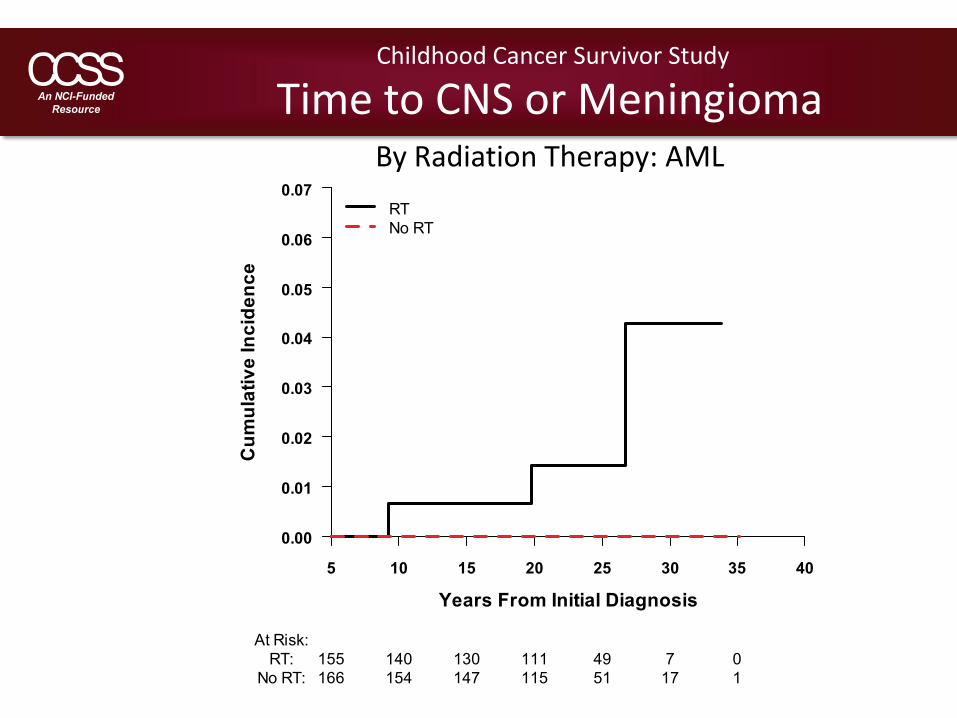
At Risk:RT: 155 140 130 111 49 7 0
No RT: 166 154 147 115 51 17 1

Estimates and 95% CI for RTYears From Initial Diagnosis Estimate 95% Lower Limit 95% Upper Limit
10 0.006 0 0.01915 0.006 0 0.01920 0.014 0 0.03425 0.014 0 0.03430 0.043 0 0.10235 NA NA NA
Estimates and 95% CI for No RTYears From Initial Diagnosis Estimate 95% Lower Limit 95% Upper Limit
10 0 0 015 0 0 020 0 0 025 0 0 030 0 0 035 0 0 0
Childhood Cancer Survivor Study
Time to CNS or MeningiomaBy Radiation Therapy: AML
Time to CNS or MeningiomaCNS
Childhood Cancer Survivor Study
Cum
ulat
ive
Inci
denc
e
Years From Initial Diagnosis
0.00
0.01
0.02
0.03
0.04
0.05
0.06
0.07
0.08
0.09
0.10
0.11
0.12
5 10 15 20 25 30 35 40
CI95% Upper Limit95% Lower Limit
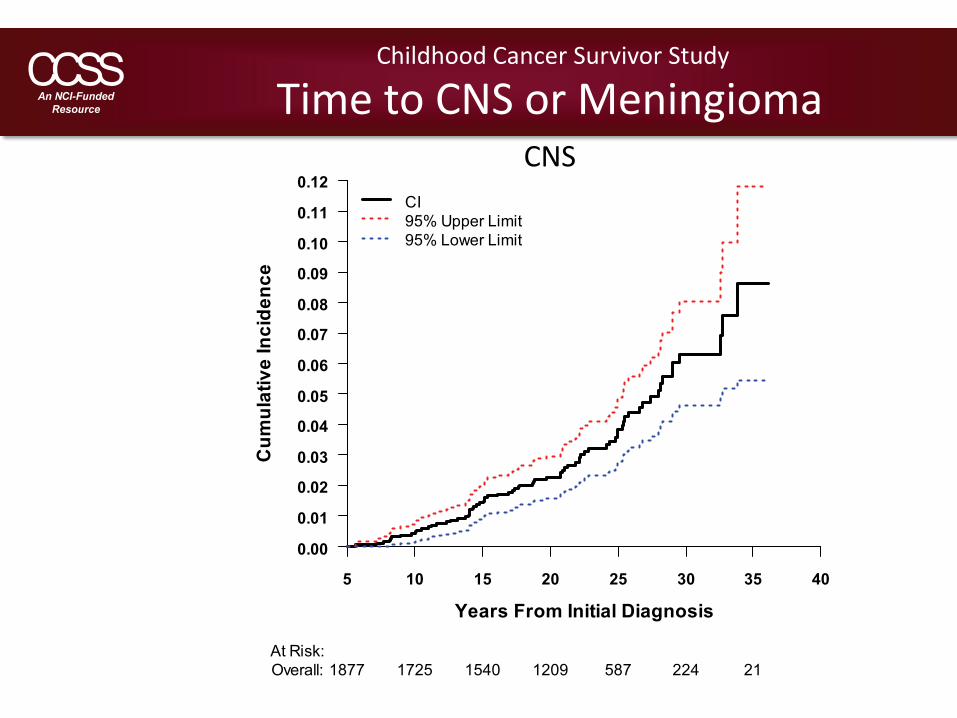
At Risk:Overall: 1877 1725 1540 1209 587 224 21
Childhood Cancer Survivor Study
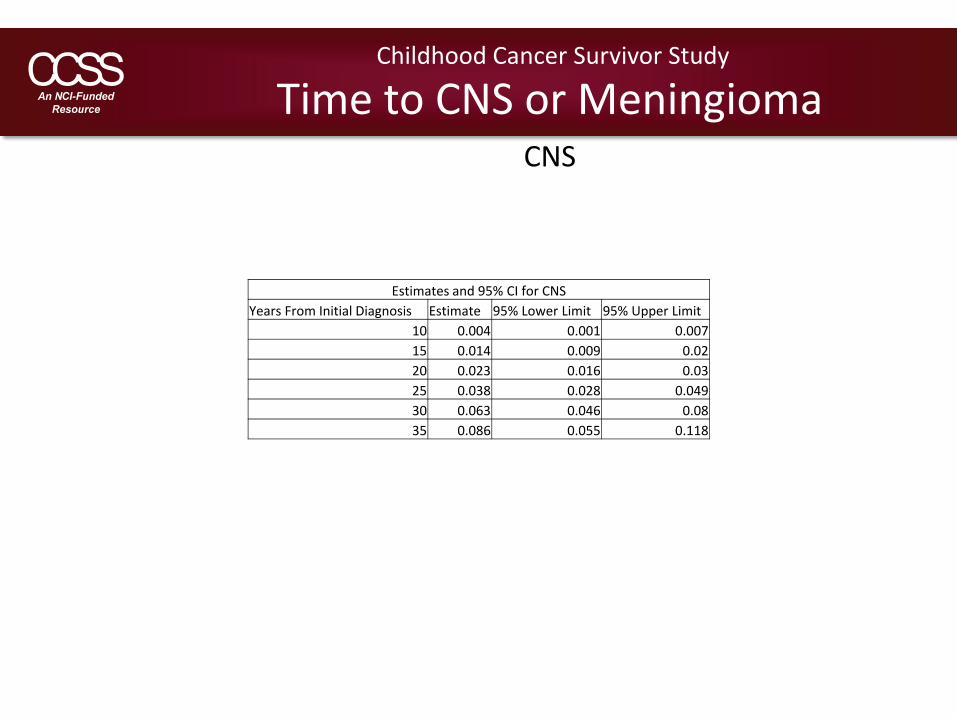
Time to CNS or MeningiomaCNS
Estimates and 95% CI for CNSYears From Initial Diagnosis Estimate 95% Lower Limit 95% Upper Limit
10 0.004 0.001 0.00715 0.014 0.009 0.0220 0.023 0.016 0.0325 0.038 0.028 0.04930 0.063 0.046 0.0835 0.086 0.055 0.118
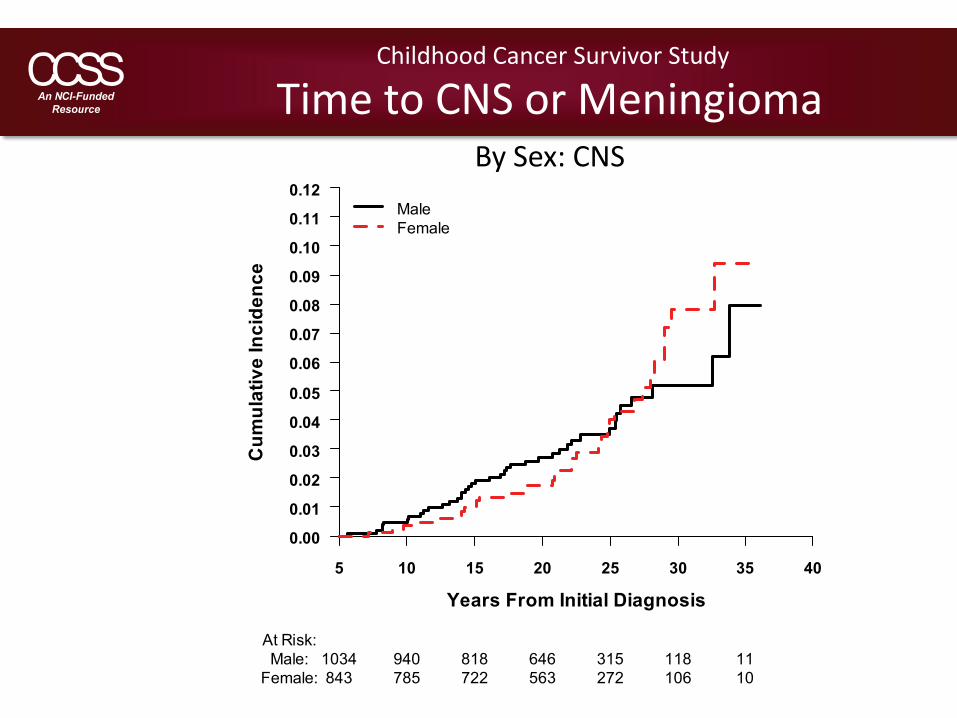
Time to CNS or MeningiomaBy Sex: CNS
Childhood Cancer Survivor Study
Cum
ulat
ive
Inci
denc
e
Years From Initial Diagnosis
0.00
0.01
0.02
0.03
0.04
0.05
0.06
0.07
0.08
0.09
0.10
0.11
0.12
5 10 15 20 25 30 35 40
MaleFemale
At Risk:Male: 1034 940 818 646 315 118 11
Female: 843 785 722 563 272 106 10
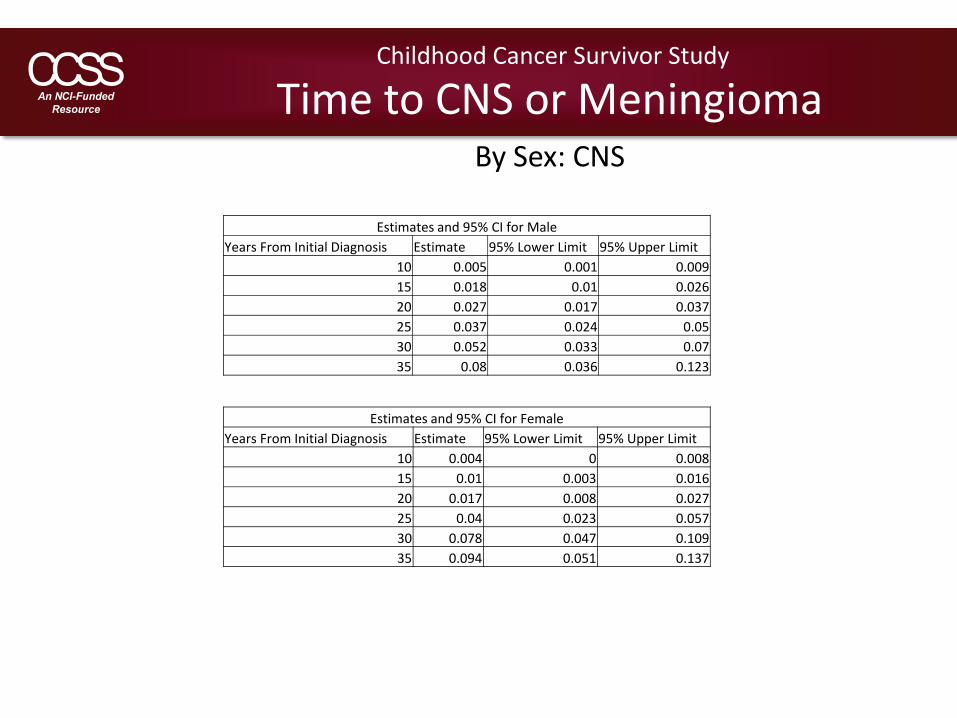
Estimates and 95% CI for MaleYears From Initial Diagnosis Estimate 95% Lower Limit 95% Upper Limit
10 0.005 0.001 0.00915 0.018 0.01 0.02620 0.027 0.017 0.03725 0.037 0.024 0.0530 0.052 0.033 0.0735 0.08 0.036 0.123
Estimates and 95% CI for FemaleYears From Initial Diagnosis Estimate 95% Lower Limit 95% Upper Limit
10 0.004 0 0.00815 0.01 0.003 0.01620 0.017 0.008 0.02725 0.04 0.023 0.05730 0.078 0.047 0.10935 0.094 0.051 0.137
Childhood Cancer Survivor Study
Time to CNS or MeningiomaBy Sex: CNS
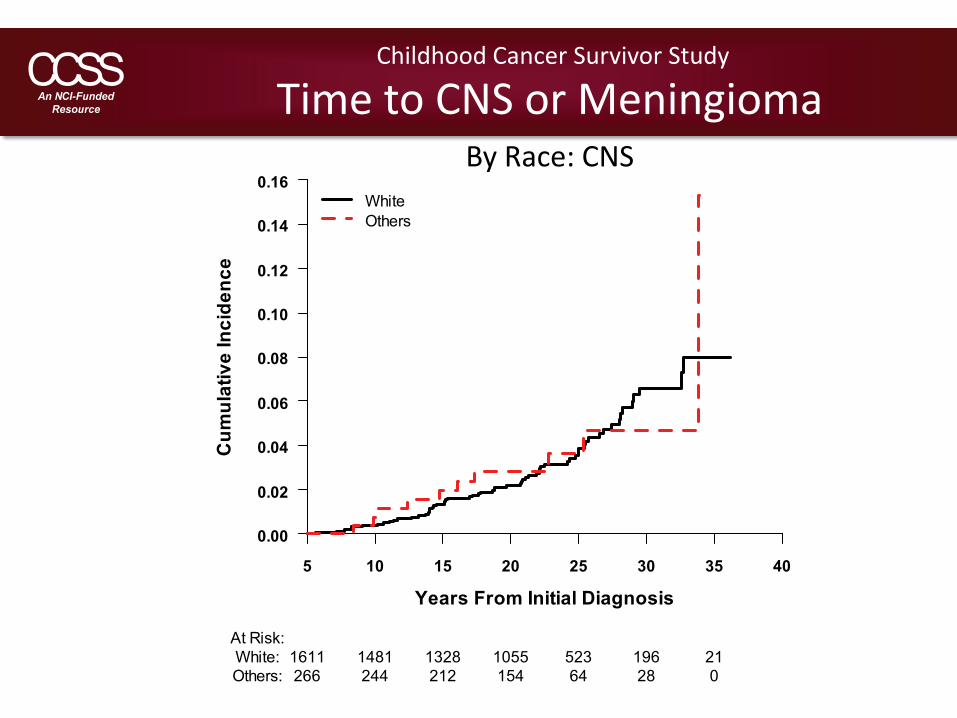
Time to CNS or MeningiomaBy Race: CNS
Childhood Cancer Survivor Study
Cum
ulat
ive
Inci
denc
e
Years From Initial Diagnosis
0.00
0.02
0.04
0.06
0.08
0.10
0.12
0.14
0.16
5 10 15 20 25 30 35 40
WhiteOthers
At Risk:White: 1611 1481 1328 1055 523 196 21Others: 266 244 212 154 64 28 0
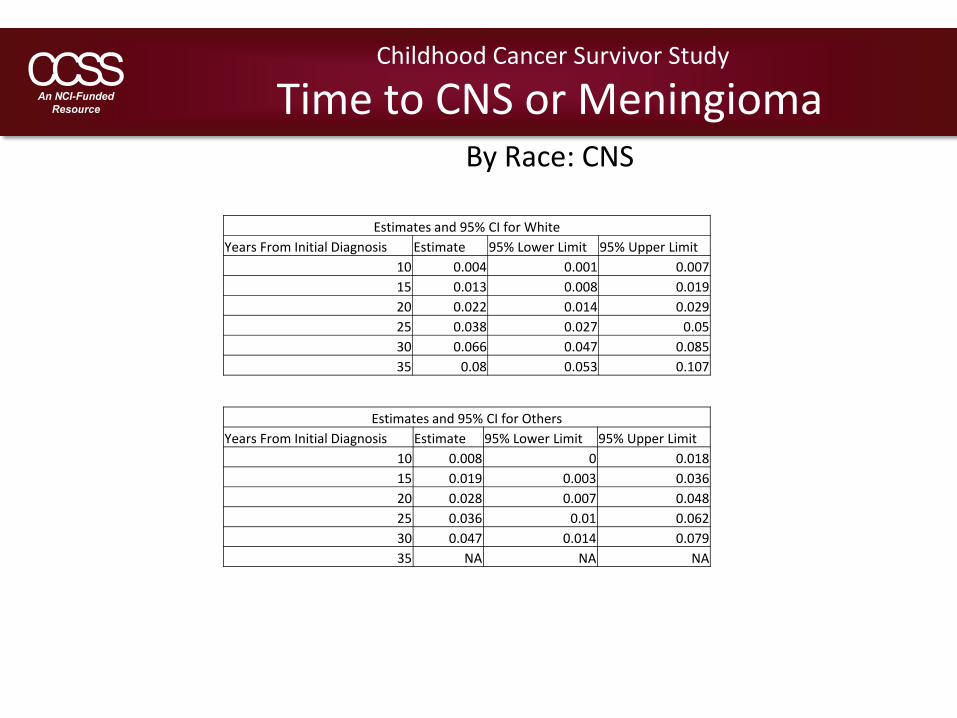
Estimates and 95% CI for WhiteYears From Initial Diagnosis Estimate 95% Lower Limit 95% Upper Limit
10 0.004 0.001 0.00715 0.013 0.008 0.01920 0.022 0.014 0.02925 0.038 0.027 0.0530 0.066 0.047 0.08535 0.08 0.053 0.107
Estimates and 95% CI for OthersYears From Initial Diagnosis Estimate 95% Lower Limit 95% Upper Limit
10 0.008 0 0.01815 0.019 0.003 0.03620 0.028 0.007 0.04825 0.036 0.01 0.06230 0.047 0.014 0.07935 NA NA NA
Childhood Cancer Survivor Study
Time to CNS or MeningiomaBy Race: CNS
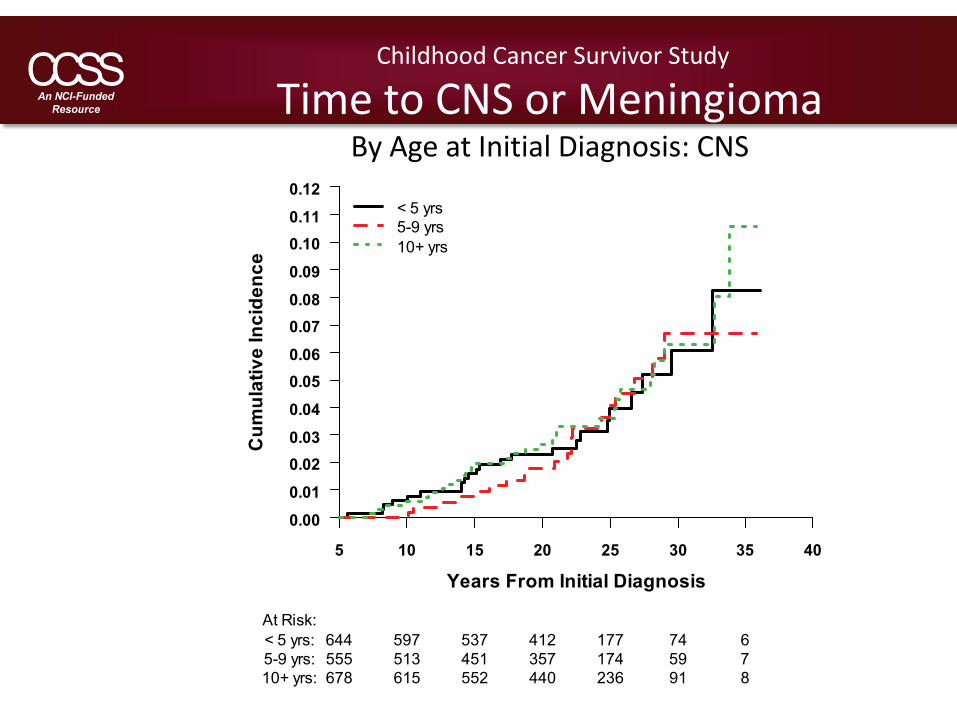
Time to CNS or MeningiomaBy Age at Initial Diagnosis: CNS
Childhood Cancer Survivor Study
Cum
ulat
ive
Inci
denc
e
Years From Initial Diagnosis
0.00
0.01
0.020.03
0.04
0.050.06
0.070.08
0.09
0.100.11
0.12
5 10 15 20 25 30 35 40
< 5 yrs5-9 yrs10+ yrs
At Risk:< 5 yrs: 644 597 537 412 177 74 65-9 yrs: 555 513 451 357 174 59 710+ yrs: 678 615 552 440 236 91 8
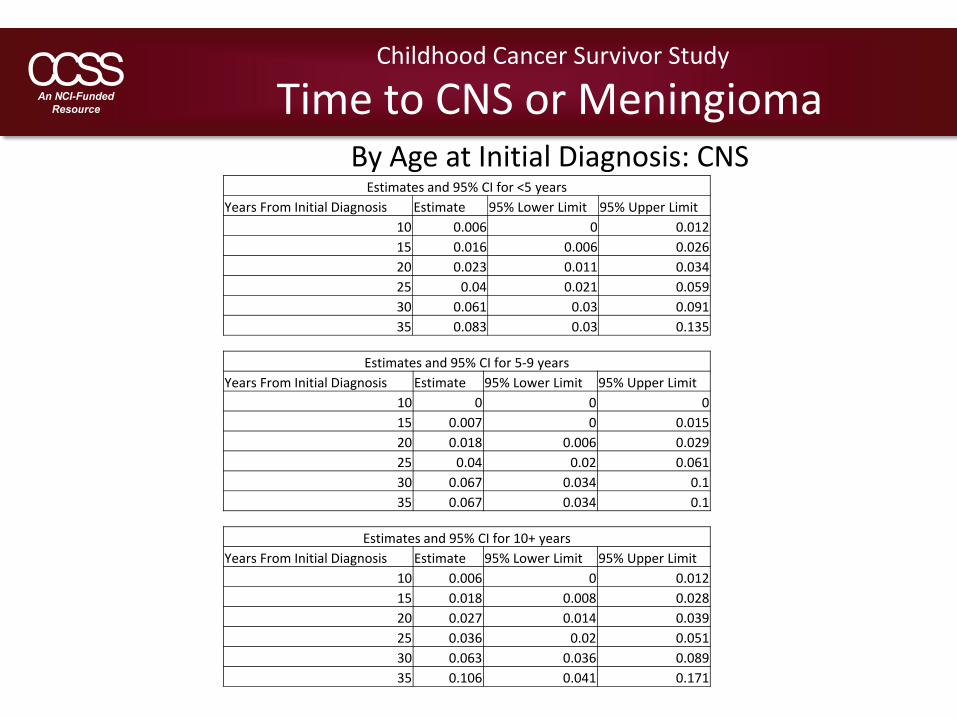
Estimates and 95% CI for <5 yearsYears From Initial Diagnosis Estimate 95% Lower Limit 95% Upper Limit
10 0.006 0 0.01215 0.016 0.006 0.02620 0.023 0.011 0.03425 0.04 0.021 0.05930 0.061 0.03 0.09135 0.083 0.03 0.135
Estimates and 95% CI for 5‐9 yearsYears From Initial Diagnosis Estimate 95% Lower Limit 95% Upper Limit
10 0 0 015 0.007 0 0.01520 0.018 0.006 0.02925 0.04 0.02 0.06130 0.067 0.034 0.135 0.067 0.034 0.1
Childhood Cancer Survivor Study
Time to CNS or MeningiomaBy Age at Initial Diagnosis: CNS
Estimates and 95% CI for 10+ yearsYears From Initial Diagnosis Estimate 95% Lower Limit 95% Upper Limit
10 0.006 0 0.01215 0.018 0.008 0.02820 0.027 0.014 0.03925 0.036 0.02 0.05130 0.063 0.036 0.08935 0.106 0.041 0.171
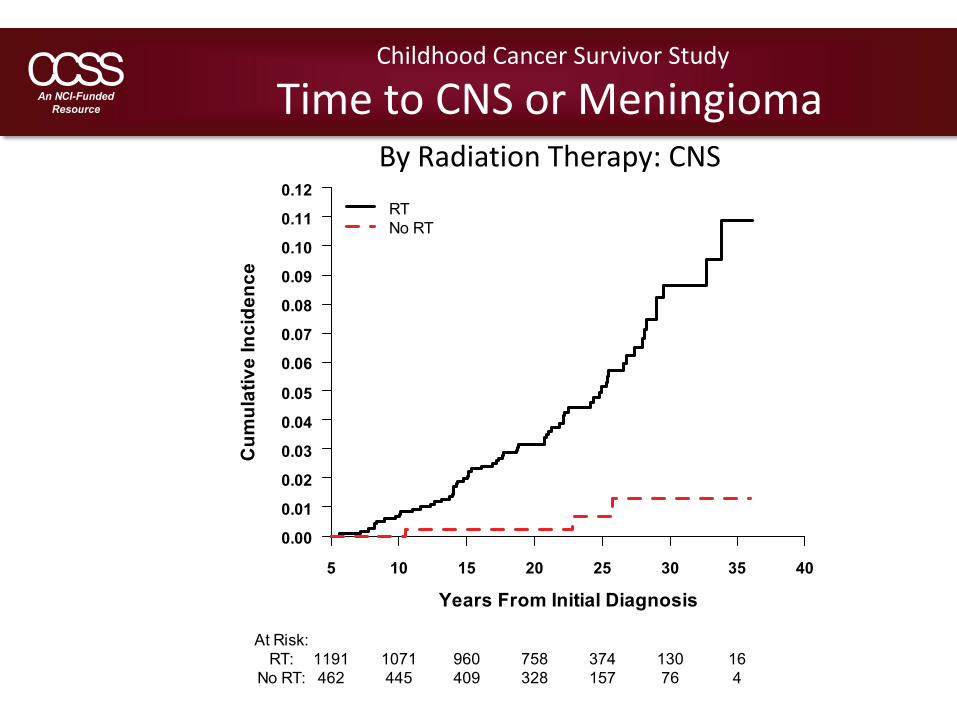
Time to CNS or MeningiomaBy Radiation Therapy: CNS
Childhood Cancer Survivor Study
Cum
ulat
ive
Inci
denc
e
Years From Initial Diagnosis
0.00
0.01
0.02
0.03
0.04
0.05
0.06
0.07
0.08
0.09
0.10
0.11
0.12
5 10 15 20 25 30 35 40
RTNo RT
At Risk:RT: 1191 1071 960 758 374 130 16
No RT: 462 445 409 328 157 76 4
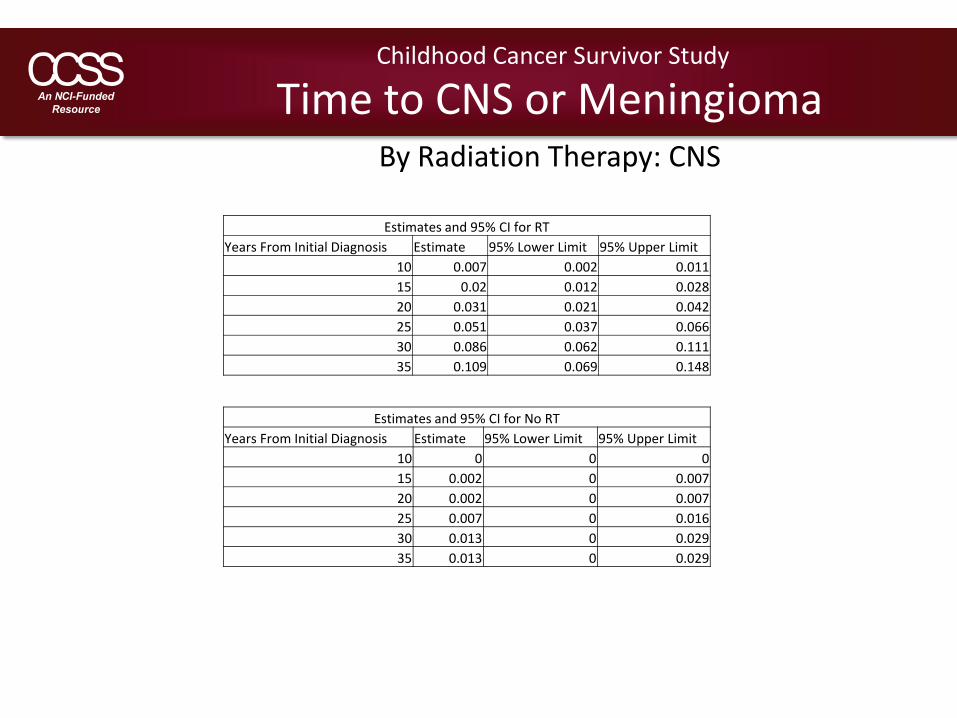
Estimates and 95% CI for RTYears From Initial Diagnosis Estimate 95% Lower Limit 95% Upper Limit
10 0.007 0.002 0.01115 0.02 0.012 0.02820 0.031 0.021 0.04225 0.051 0.037 0.06630 0.086 0.062 0.11135 0.109 0.069 0.148
Estimates and 95% CI for No RTYears From Initial Diagnosis Estimate 95% Lower Limit 95% Upper Limit
10 0 0 015 0.002 0 0.00720 0.002 0 0.00725 0.007 0 0.01630 0.013 0 0.02935 0.013 0 0.029
Childhood Cancer Survivor Study
Time to CNS or MeningiomaBy Radiation Therapy: CNS
Time to CNS or MeningiomaMedullo/PNET
Childhood Cancer Survivor Study
Cum
ulat
ive
Inci
denc
e
Years From Initial Diagnosis
0.00
0.01
0.02
0.03
0.04
0.05
0.06
0.07
0.08
0.09
0.10
0.11
0.12
5 10 15 20 25 30 35 40
CI95% Upper Limit95% Lower Limit
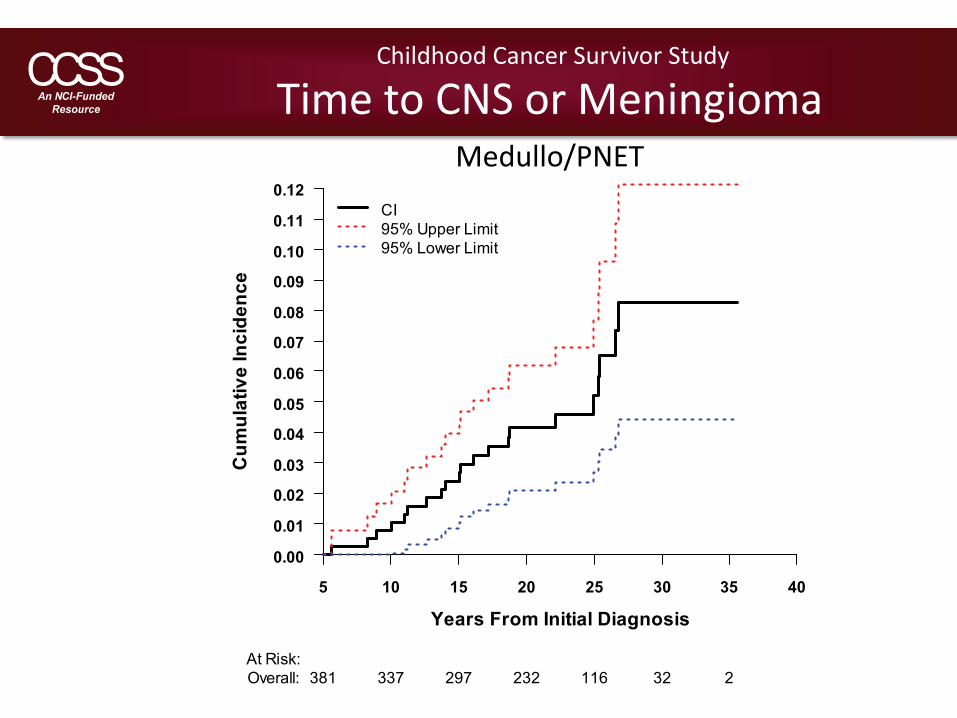
At Risk:Overall: 381 337 297 232 116 32 2
Childhood Cancer Survivor Study
Time to CNS or MeningiomaMedullo/PNET
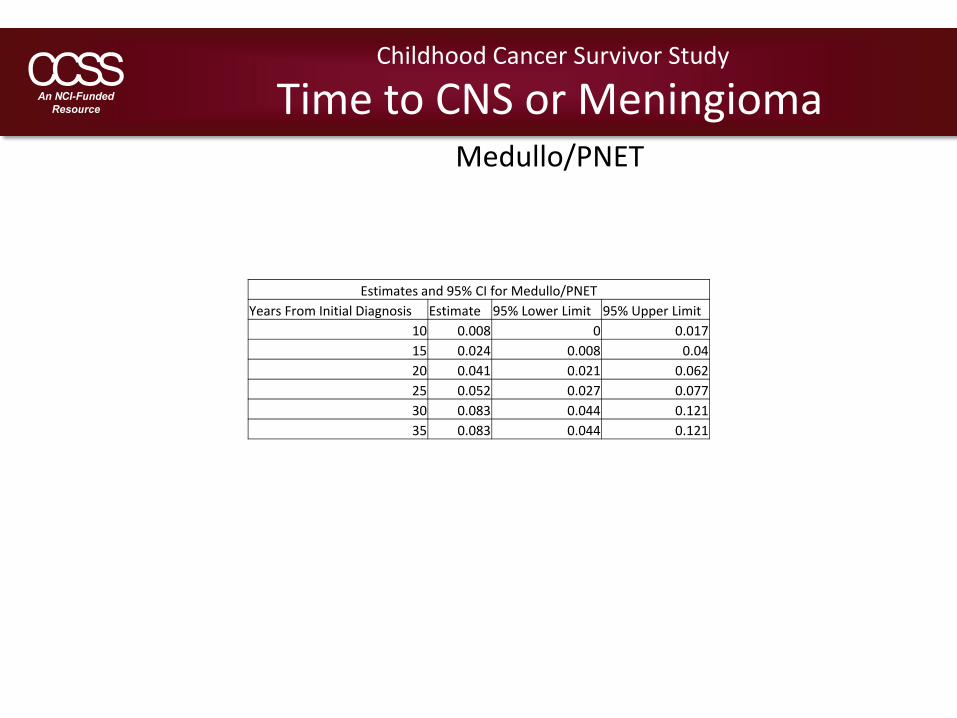
Estimates and 95% CI for Medullo/PNETYears From Initial Diagnosis Estimate 95% Lower Limit 95% Upper Limit
10 0.008 0 0.01715 0.024 0.008 0.0420 0.041 0.021 0.06225 0.052 0.027 0.07730 0.083 0.044 0.12135 0.083 0.044 0.121
Time to CNS or MeningiomaBy Sex: Medullo/PNET
Childhood Cancer Survivor Study
Cum
ulat
ive
Inci
denc
e
Years From Initial Diagnosis
0.00
0.01
0.02
0.03
0.04
0.05
0.06
0.07
0.08
0.09
0.10
0.11
0.12
5 10 15 20 25 30 35 40
MaleFemale
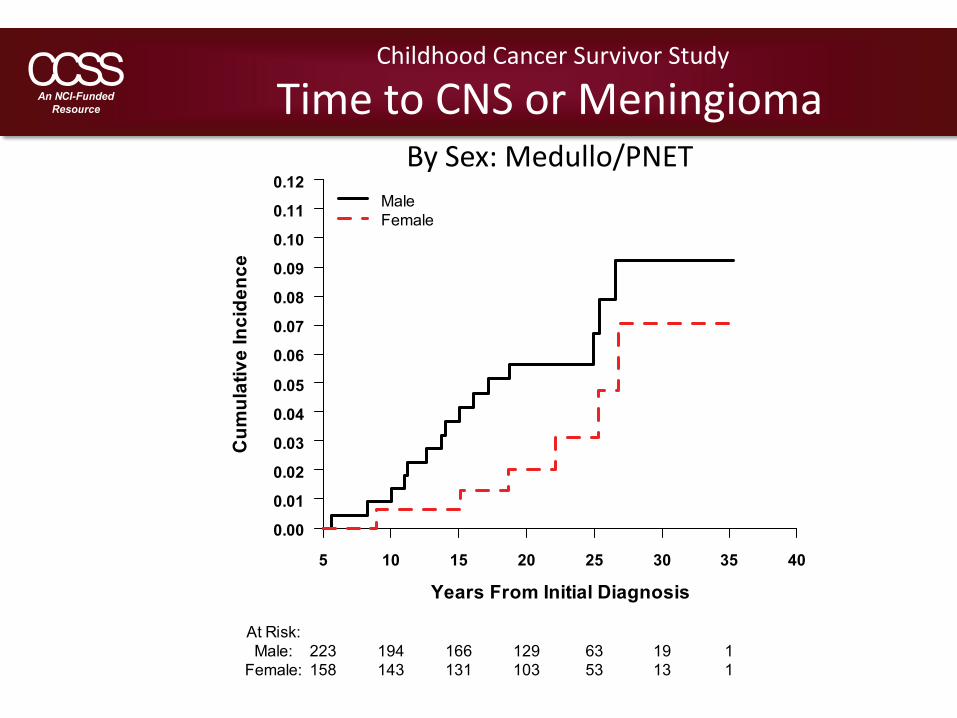
At Risk:Male: 223 194 166 129 63 19 1
Female: 158 143 131 103 53 13 1
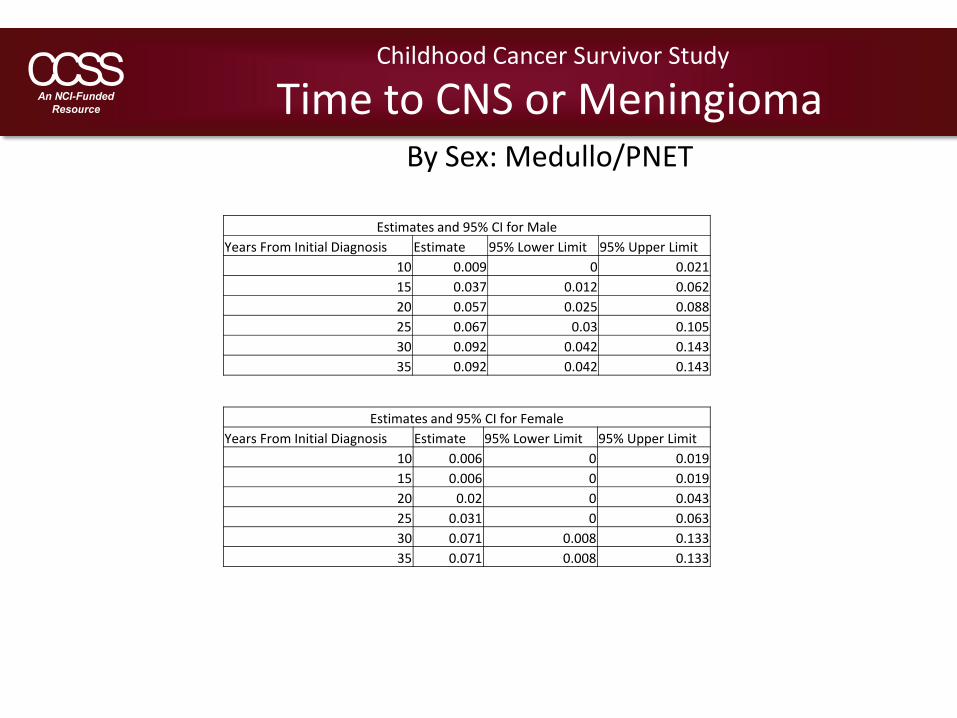
Estimates and 95% CI for MaleYears From Initial Diagnosis Estimate 95% Lower Limit 95% Upper Limit
10 0.009 0 0.02115 0.037 0.012 0.06220 0.057 0.025 0.08825 0.067 0.03 0.10530 0.092 0.042 0.14335 0.092 0.042 0.143
Estimates and 95% CI for FemaleYears From Initial Diagnosis Estimate 95% Lower Limit 95% Upper Limit
10 0.006 0 0.01915 0.006 0 0.01920 0.02 0 0.04325 0.031 0 0.06330 0.071 0.008 0.13335 0.071 0.008 0.133
Childhood Cancer Survivor Study
Time to CNS or MeningiomaBy Sex: Medullo/PNET
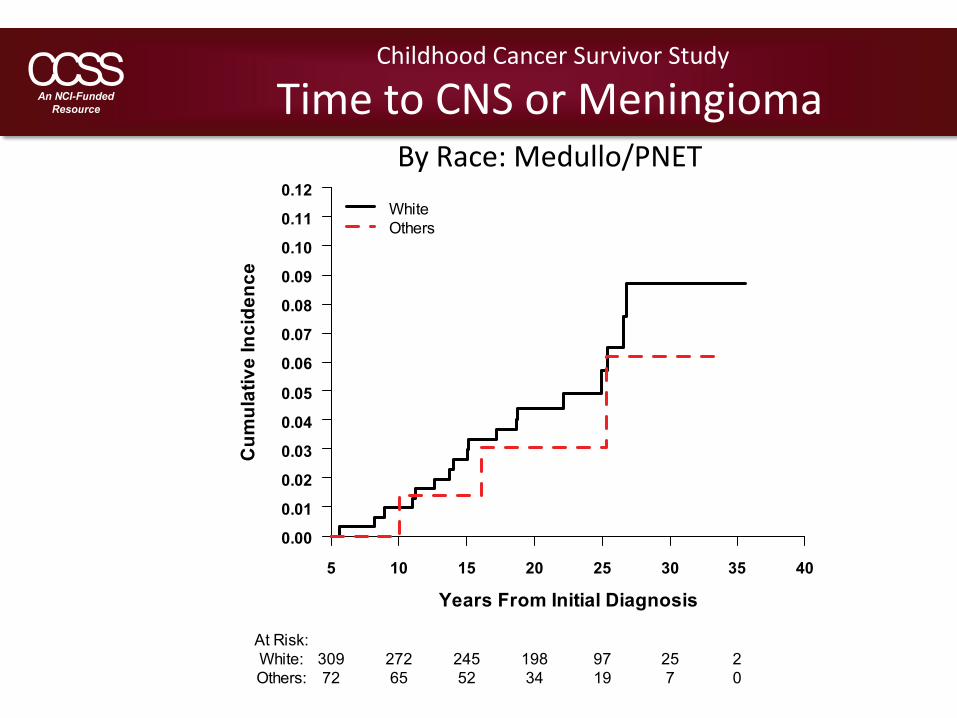
Time to CNS or MeningiomaBy Race: Medullo/PNET
Childhood Cancer Survivor Study
Cum
ulat
ive
Inci
denc
e
Years From Initial Diagnosis
0.00
0.01
0.02
0.03
0.04
0.05
0.06
0.07
0.08
0.09
0.10
0.11
0.12
5 10 15 20 25 30 35 40
WhiteOthers
At Risk:White: 309 272 245 198 97 25 2Others: 72 65 52 34 19 7 0

Estimates and 95% CI for WhiteYears From Initial Diagnosis Estimate 95% Lower Limit 95% Upper Limit
10 0.01 0 0.02115 0.026 0.008 0.04420 0.044 0.02 0.06725 0.057 0.027 0.08630 0.087 0.043 0.13235 0.087 0.043 0.132
Estimates and 95% CI for OthersYears From Initial Diagnosis Estimate 95% Lower Limit 95% Upper Limit
10 0 0 015 0.014 0 0.04120 0.03 0 0.07225 0.03 0 0.07230 0.062 0 0.13635 NA NA NA
Childhood Cancer Survivor Study
Time to CNS or MeningiomaBy Race: Medullo/PNET
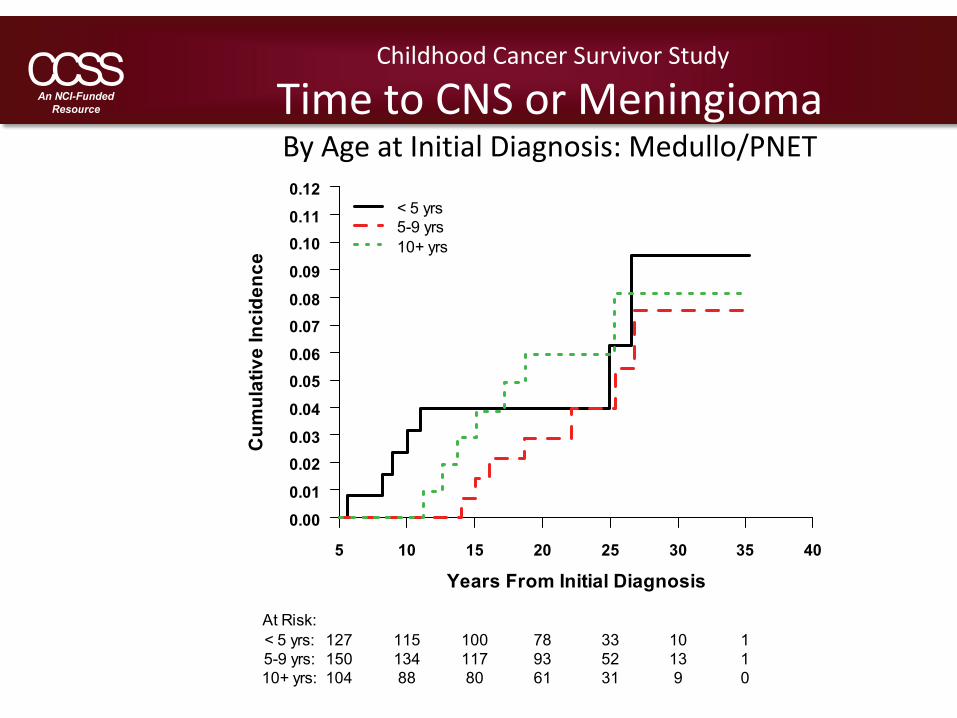
Time to CNS or MeningiomaBy Age at Initial Diagnosis: Medullo/PNET
Childhood Cancer Survivor Study
Cum
ulat
ive
Inci
denc
e
Years From Initial Diagnosis
0.00
0.01
0.020.03
0.04
0.050.06
0.070.08
0.09
0.100.11
0.12
5 10 15 20 25 30 35 40
< 5 yrs5-9 yrs10+ yrs
At Risk:< 5 yrs: 127 115 100 78 33 10 15-9 yrs: 150 134 117 93 52 13 110+ yrs: 104 88 80 61 31 9 0
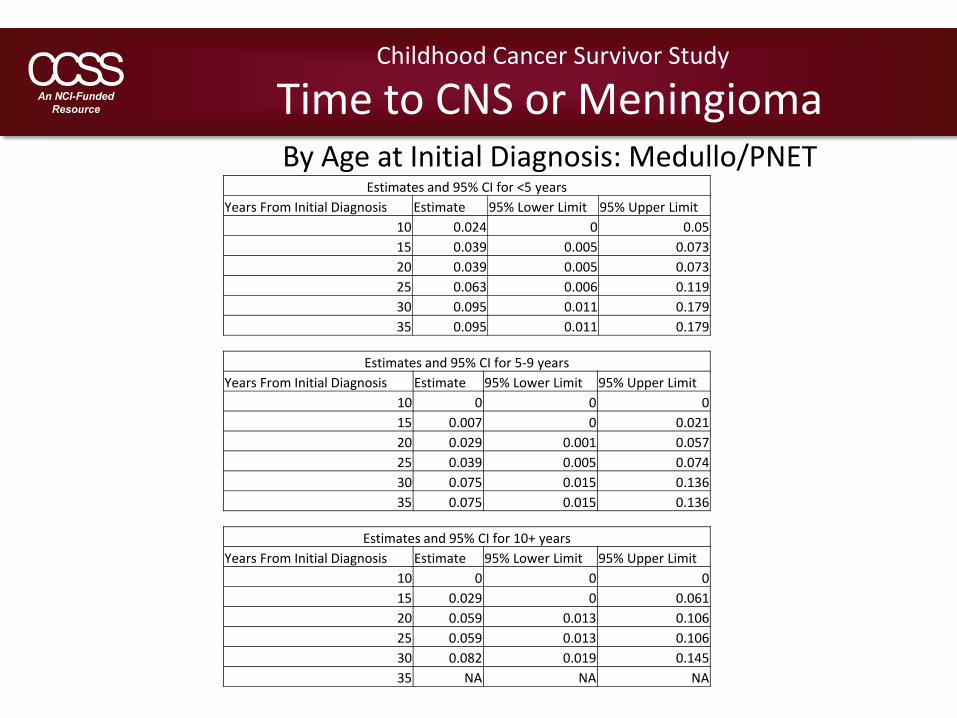
Estimates and 95% CI for <5 yearsYears From Initial Diagnosis Estimate 95% Lower Limit 95% Upper Limit
10 0.024 0 0.0515 0.039 0.005 0.07320 0.039 0.005 0.07325 0.063 0.006 0.11930 0.095 0.011 0.17935 0.095 0.011 0.179
Estimates and 95% CI for 5‐9 yearsYears From Initial Diagnosis Estimate 95% Lower Limit 95% Upper Limit
10 0 0 015 0.007 0 0.02120 0.029 0.001 0.05725 0.039 0.005 0.07430 0.075 0.015 0.13635 0.075 0.015 0.136
Childhood Cancer Survivor Study
Time to CNS or MeningiomaBy Age at Initial Diagnosis: Medullo/PNET
Estimates and 95% CI for 10+ yearsYears From Initial Diagnosis Estimate 95% Lower Limit 95% Upper Limit
10 0 0 015 0.029 0 0.06120 0.059 0.013 0.10625 0.059 0.013 0.10630 0.082 0.019 0.14535 NA NA NA
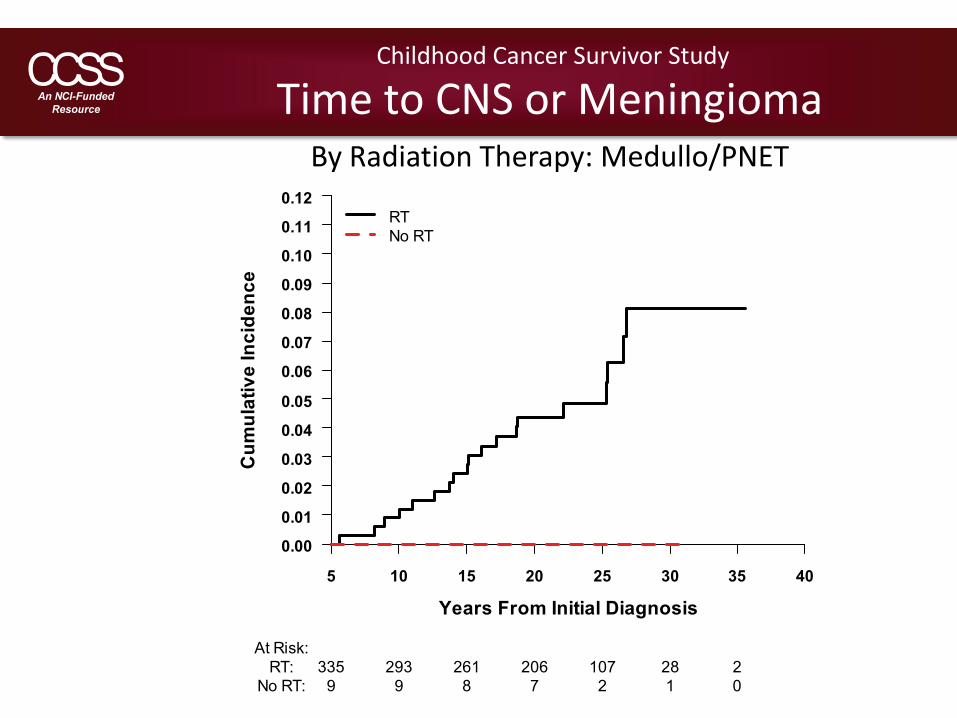
Time to CNS or MeningiomaBy Radiation Therapy: Medullo/PNET
Childhood Cancer Survivor Study
Cum
ulat
ive
Inci
denc
e
Years From Initial Diagnosis
0.00
0.01
0.02
0.03
0.04
0.05
0.06
0.07
0.08
0.09
0.10
0.11
0.12
5 10 15 20 25 30 35 40
RTNo RT
At Risk:RT: 335 293 261 206 107 28 2
No RT: 9 9 8 7 2 1 0
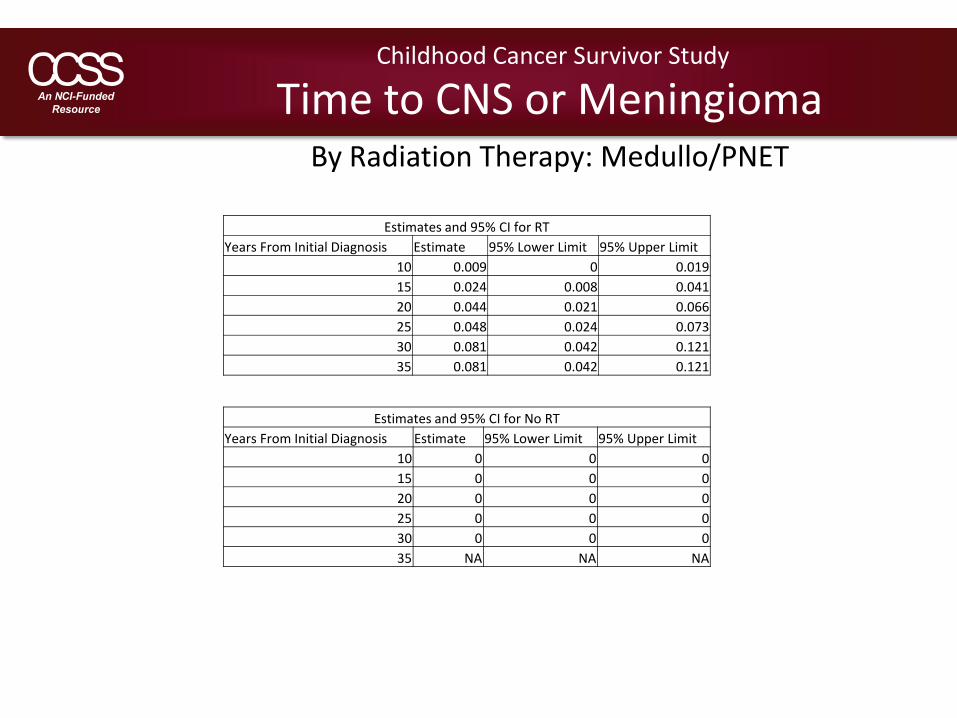
Estimates and 95% CI for RTYears From Initial Diagnosis Estimate 95% Lower Limit 95% Upper Limit
10 0.009 0 0.01915 0.024 0.008 0.04120 0.044 0.021 0.06625 0.048 0.024 0.07330 0.081 0.042 0.12135 0.081 0.042 0.121
Estimates and 95% CI for No RTYears From Initial Diagnosis Estimate 95% Lower Limit 95% Upper Limit
10 0 0 015 0 0 020 0 0 025 0 0 030 0 0 035 NA NA NA
Childhood Cancer Survivor Study
Time to CNS or MeningiomaBy Radiation Therapy: Medullo/PNET
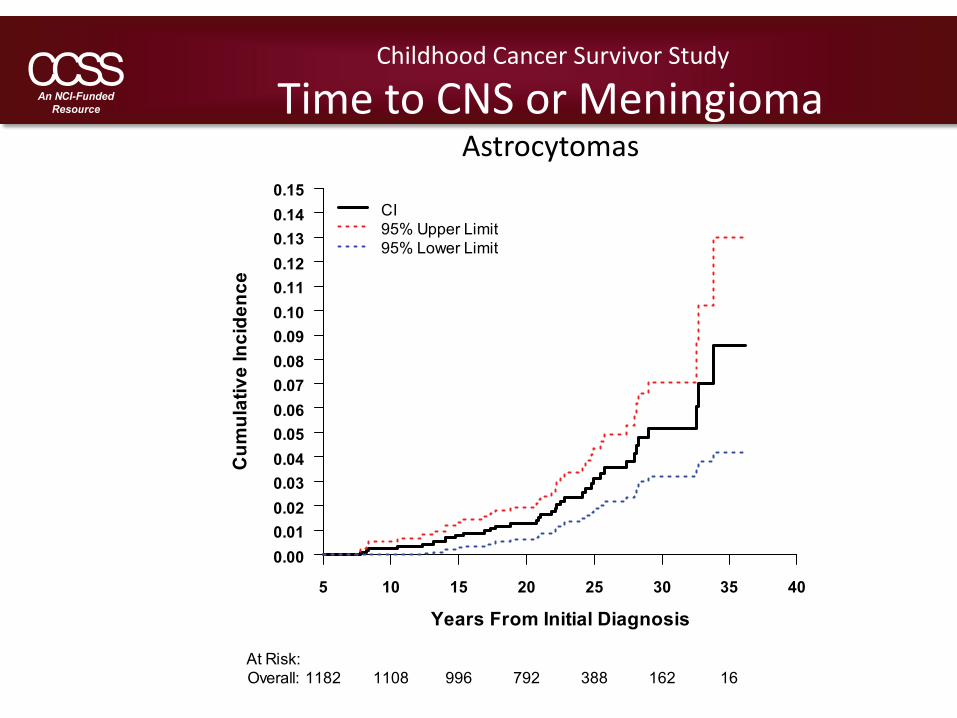
Time to CNS or MeningiomaAstrocytomas
Childhood Cancer Survivor Study
Cum
ulat
ive
Inci
denc
e
Years From Initial Diagnosis
0.000.010.020.030.040.050.060.070.080.090.100.110.120.130.140.15
5 10 15 20 25 30 35 40
CI95% Upper Limit95% Lower Limit
At Risk:Overall: 1182 1108 996 792 388 162 16

Childhood Cancer Survivor Study
Time to CNS or MeningiomaAstrocytomas
Estimates and 95% CI for AstrocytomasYears From Initial Diagnosis Estimate 95% Lower Limit 95% Upper Limit
10 0.003 0 0.00515 0.008 0.003 0.01320 0.013 0.006 0.01925 0.031 0.019 0.04430 0.051 0.032 0.07135 0.086 0.042 0.13
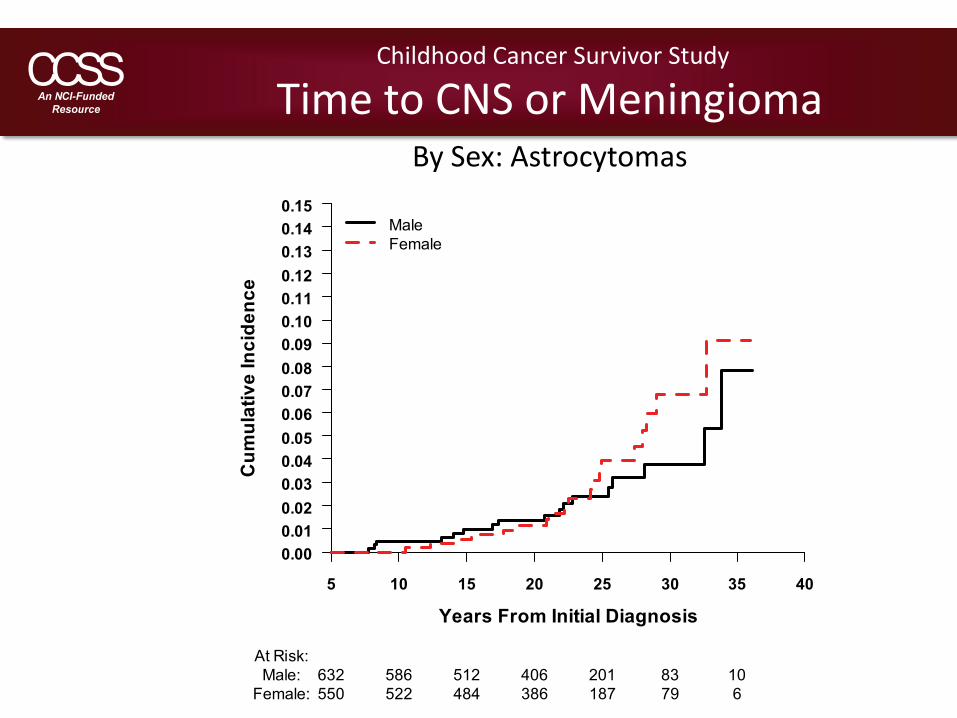
Time to CNS or MeningiomaBy Sex: Astrocytomas
Childhood Cancer Survivor Study
Cum
ulat
ive
Inci
denc
e
Years From Initial Diagnosis
0.000.010.020.030.040.050.060.070.080.090.100.110.120.130.140.15
5 10 15 20 25 30 35 40
MaleFemale
At Risk:Male: 632 586 512 406 201 83 10
Female: 550 522 484 386 187 79 6

Estimates and 95% CI for MaleYears From Initial Diagnosis Estimate 95% Lower Limit 95% Upper Limit
10 0.005 0 0.0115 0.01 0.002 0.01820 0.013 0.004 0.02325 0.024 0.01 0.03830 0.038 0.017 0.05935 0.078 0.018 0.138
Estimates and 95% CI for FemaleYears From Initial Diagnosis Estimate 95% Lower Limit 95% Upper Limit
10 0 0 015 0.006 0 0.01220 0.012 0.002 0.02125 0.039 0.018 0.06130 0.068 0.033 0.10235 0.091 0.034 0.149
Childhood Cancer Survivor Study
Time to CNS or MeningiomaBy Sex: Astrocytomas
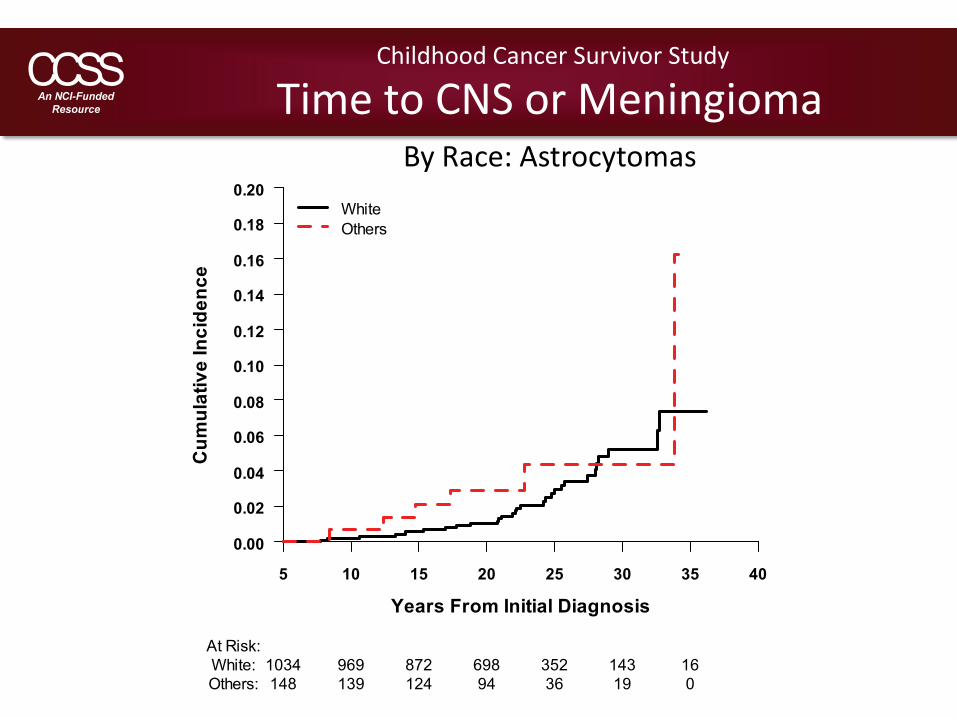
Time to CNS or MeningiomaBy Race: Astrocytomas
Childhood Cancer Survivor Study
Cum
ulat
ive
Inci
denc
e
Years From Initial Diagnosis
0.00
0.02
0.04
0.06
0.08
0.10
0.12
0.14
0.16
0.18
0.20
5 10 15 20 25 30 35 40
WhiteOthers
At Risk:White: 1034 969 872 698 352 143 16Others: 148 139 124 94 36 19 0
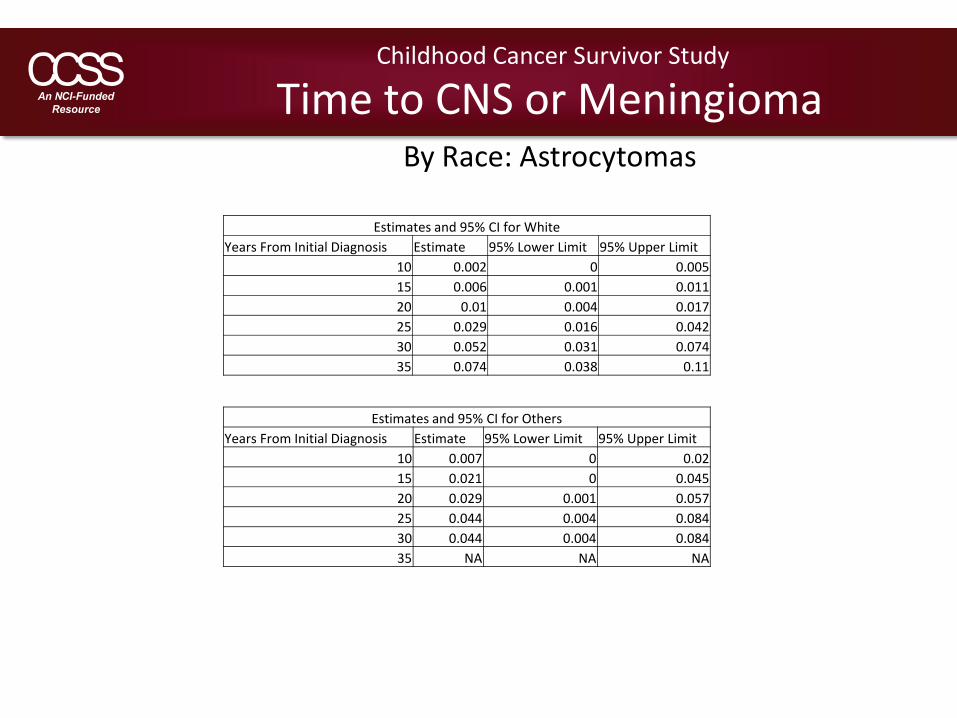
Estimates and 95% CI for WhiteYears From Initial Diagnosis Estimate 95% Lower Limit 95% Upper Limit
10 0.002 0 0.00515 0.006 0.001 0.01120 0.01 0.004 0.01725 0.029 0.016 0.04230 0.052 0.031 0.07435 0.074 0.038 0.11
Estimates and 95% CI for OthersYears From Initial Diagnosis Estimate 95% Lower Limit 95% Upper Limit
10 0.007 0 0.0215 0.021 0 0.04520 0.029 0.001 0.05725 0.044 0.004 0.08430 0.044 0.004 0.08435 NA NA NA
Childhood Cancer Survivor Study
Time to CNS or MeningiomaBy Race: Astrocytomas
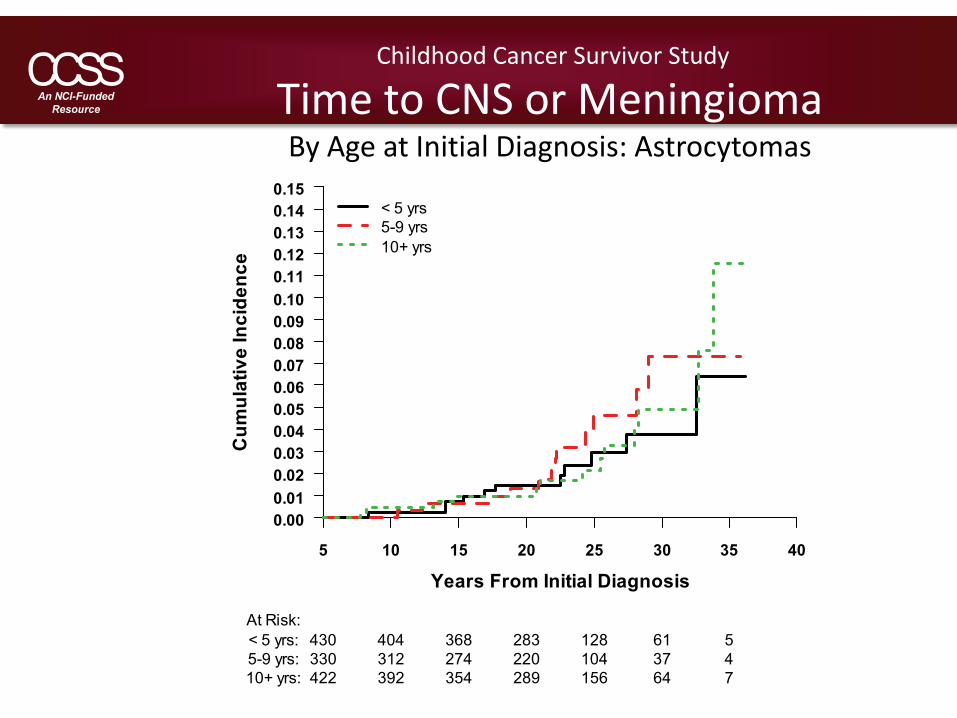
Time to CNS or MeningiomaBy Age at Initial Diagnosis: Astrocytomas
Childhood Cancer Survivor Study
Cum
ulat
ive
Inci
denc
e
Years From Initial Diagnosis
0.000.010.020.030.040.050.060.070.080.090.100.110.120.130.140.15
5 10 15 20 25 30 35 40
< 5 yrs5-9 yrs10+ yrs
At Risk:< 5 yrs: 430 404 368 283 128 61 55-9 yrs: 330 312 274 220 104 37 410+ yrs: 422 392 354 289 156 64 7
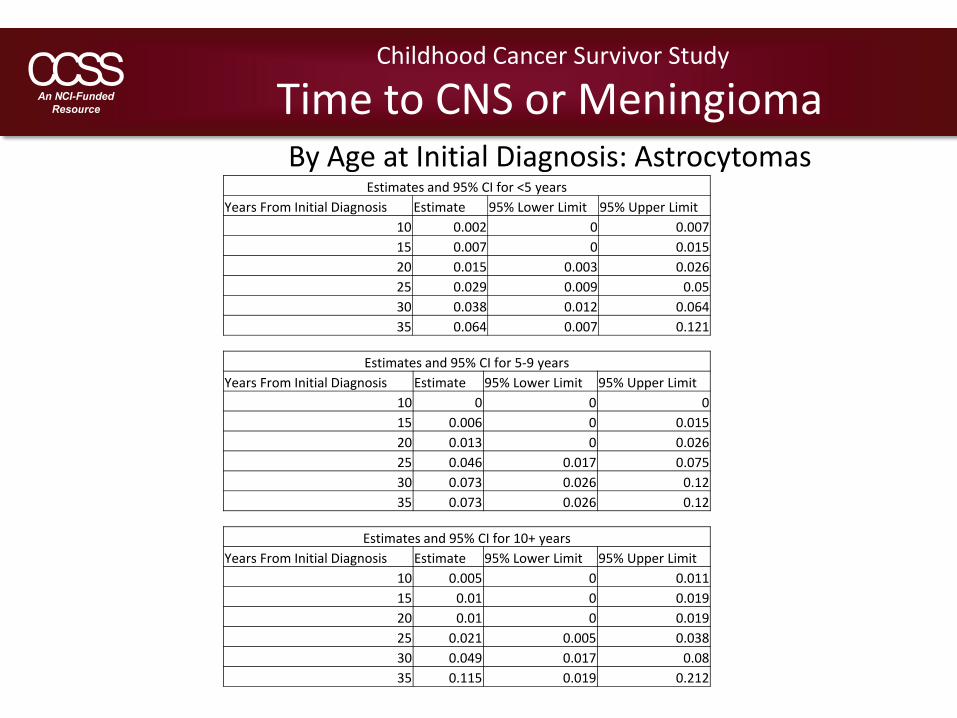
Estimates and 95% CI for <5 yearsYears From Initial Diagnosis Estimate 95% Lower Limit 95% Upper Limit
10 0.002 0 0.00715 0.007 0 0.01520 0.015 0.003 0.02625 0.029 0.009 0.0530 0.038 0.012 0.06435 0.064 0.007 0.121
Estimates and 95% CI for 5‐9 yearsYears From Initial Diagnosis Estimate 95% Lower Limit 95% Upper Limit
10 0 0 015 0.006 0 0.01520 0.013 0 0.02625 0.046 0.017 0.07530 0.073 0.026 0.1235 0.073 0.026 0.12
Childhood Cancer Survivor Study
Time to CNS or MeningiomaBy Age at Initial Diagnosis: Astrocytomas
Estimates and 95% CI for 10+ yearsYears From Initial Diagnosis Estimate 95% Lower Limit 95% Upper Limit
10 0.005 0 0.01115 0.01 0 0.01920 0.01 0 0.01925 0.021 0.005 0.03830 0.049 0.017 0.0835 0.115 0.019 0.212
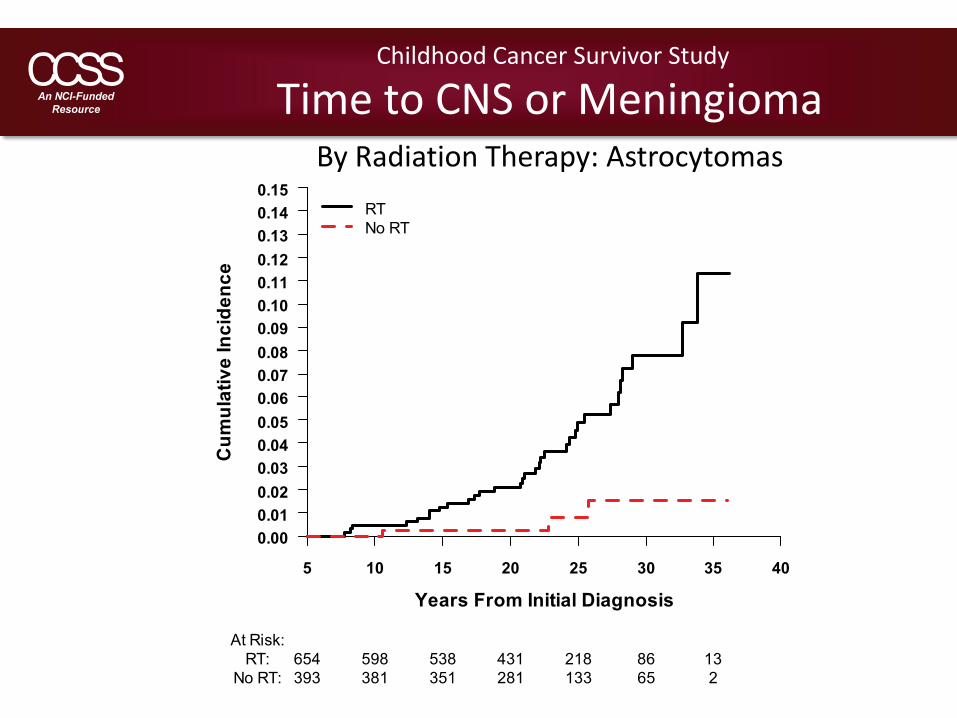
Time to CNS or MeningiomaBy Radiation Therapy: Astrocytomas
Childhood Cancer Survivor Study
Cum
ulat
ive
Inci
denc
e
Years From Initial Diagnosis
0.000.010.020.030.040.050.060.070.080.090.100.110.120.130.140.15
5 10 15 20 25 30 35 40
RTNo RT
At Risk:RT: 654 598 538 431 218 86 13
No RT: 393 381 351 281 133 65 2
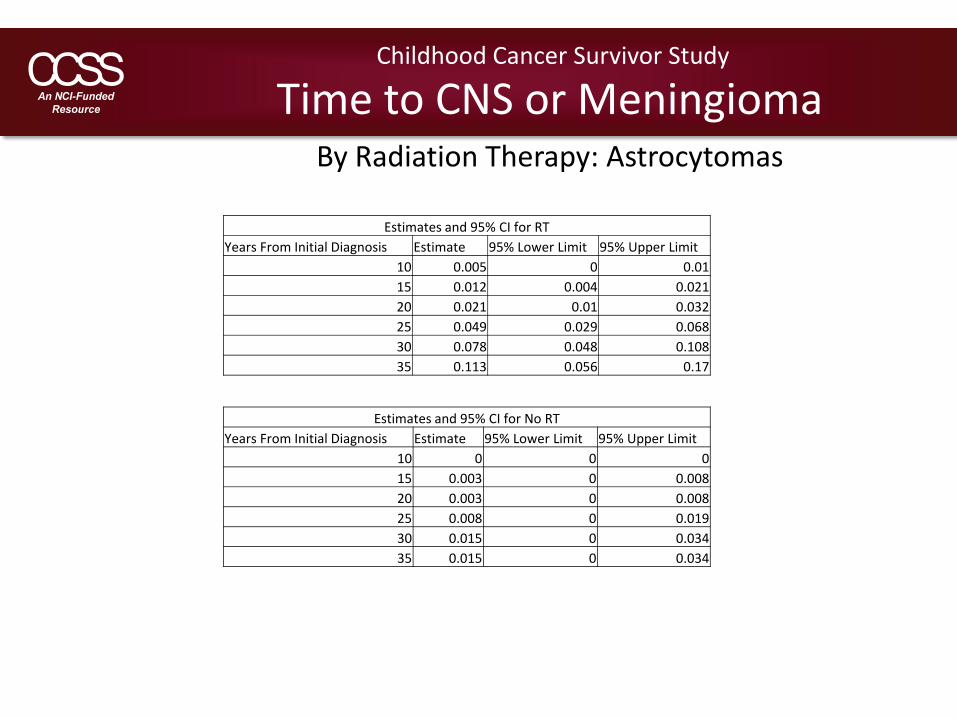
Estimates and 95% CI for RTYears From Initial Diagnosis Estimate 95% Lower Limit 95% Upper Limit
10 0.005 0 0.0115 0.012 0.004 0.02120 0.021 0.01 0.03225 0.049 0.029 0.06830 0.078 0.048 0.10835 0.113 0.056 0.17
Estimates and 95% CI for No RTYears From Initial Diagnosis Estimate 95% Lower Limit 95% Upper Limit
10 0 0 015 0.003 0 0.00820 0.003 0 0.00825 0.008 0 0.01930 0.015 0 0.03435 0.015 0 0.034
Childhood Cancer Survivor Study
Time to CNS or MeningiomaBy Radiation Therapy: Astrocytomas
Time to CNS or MeningiomaHodgkin Lymphoma
Childhood Cancer Survivor Study
Cum
ulat
ive
Inci
denc
e
Years From Initial Diagnosis
0.000
0.002
0.004
0.006
0.008
0.010
0.012
0.014
5 10 15 20 25 30 35 40
CI95% Upper Limit95% Lower Limit
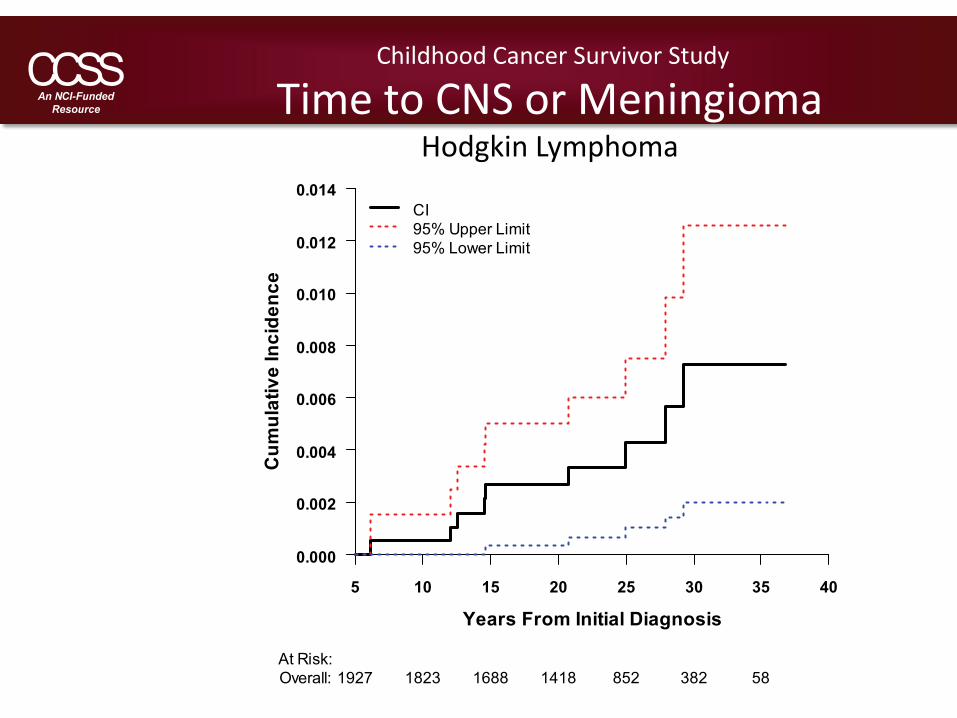
At Risk:Overall: 1927 1823 1688 1418 852 382 58
Childhood Cancer Survivor Study
Time to CNS or MeningiomaHodgkin Lymphoma
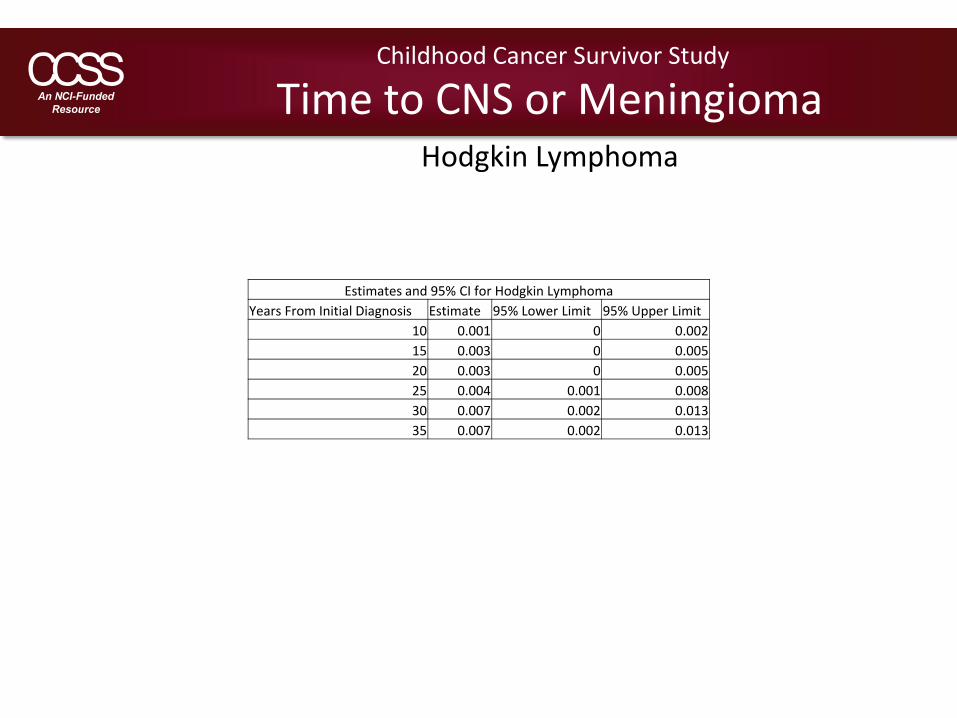
Estimates and 95% CI for Hodgkin LymphomaYears From Initial Diagnosis Estimate 95% Lower Limit 95% Upper Limit
10 0.001 0 0.00215 0.003 0 0.00520 0.003 0 0.00525 0.004 0.001 0.00830 0.007 0.002 0.01335 0.007 0.002 0.013
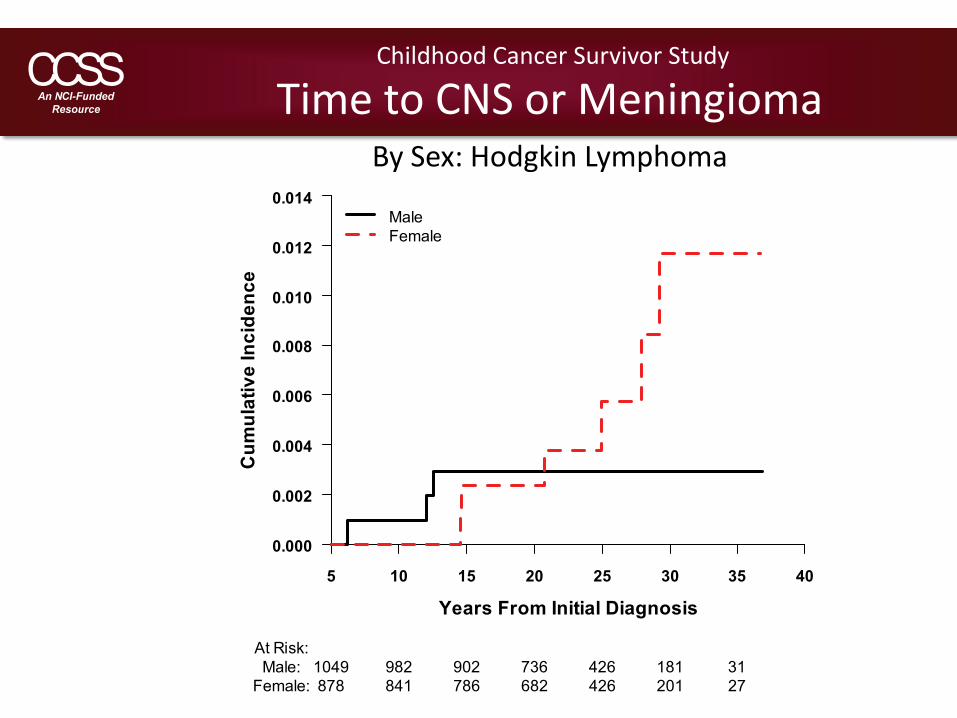
Time to CNS or MeningiomaBy Sex: Hodgkin Lymphoma
Childhood Cancer Survivor Study
Cum
ulat
ive
Inci
denc
e
Years From Initial Diagnosis
0.000
0.002
0.004
0.006
0.008
0.010
0.012
0.014
5 10 15 20 25 30 35 40
MaleFemale
At Risk:Male: 1049 982 902 736 426 181 31
Female: 878 841 786 682 426 201 27

Estimates and 95% CI for MaleYears From Initial Diagnosis Estimate 95% Lower Limit 95% Upper Limit
10 0.001 0 0.00315 0.003 0 0.00620 0.003 0 0.00625 0.003 0 0.00630 0.003 0 0.00635 0.003 0 0.006
Estimates and 95% CI for FemaleYears From Initial Diagnosis Estimate 95% Lower Limit 95% Upper Limit
10 0 0 015 0.002 0 0.00620 0.002 0 0.00625 0.006 0 0.01130 0.012 0.002 0.02235 0.012 0.002 0.022
Childhood Cancer Survivor Study
Time to CNS or MeningiomaBy Sex: Hodgkin Lymphoma
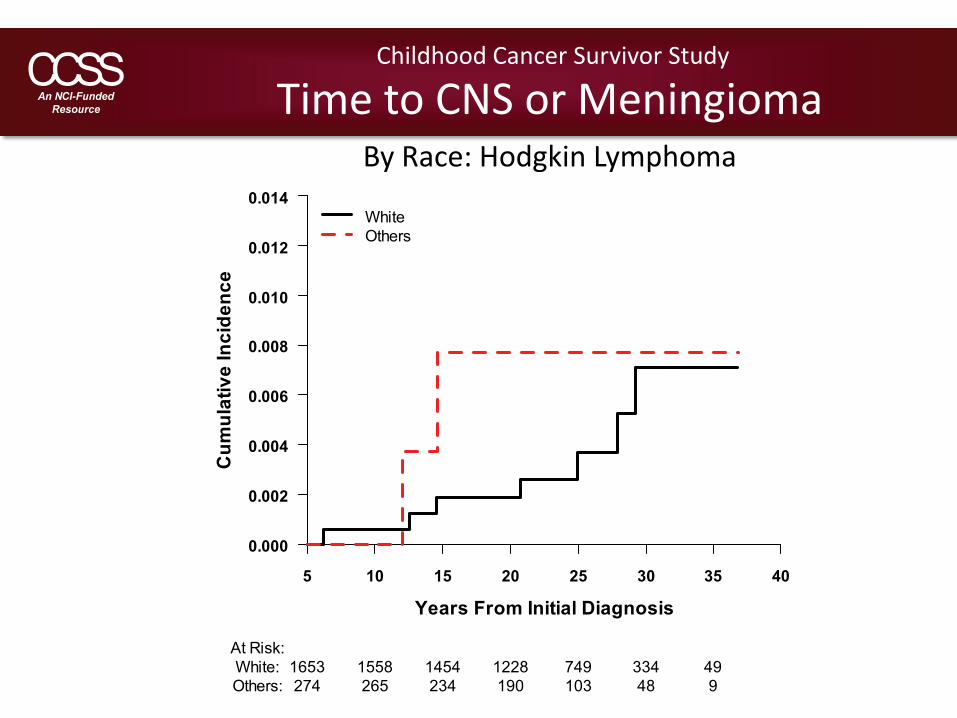
Time to CNS or MeningiomaBy Race: Hodgkin Lymphoma
Childhood Cancer Survivor Study
Cum
ulat
ive
Inci
denc
e
Years From Initial Diagnosis
0.000
0.002
0.004
0.006
0.008
0.010
0.012
0.014
5 10 15 20 25 30 35 40
WhiteOthers
At Risk:White: 1653 1558 1454 1228 749 334 49Others: 274 265 234 190 103 48 9
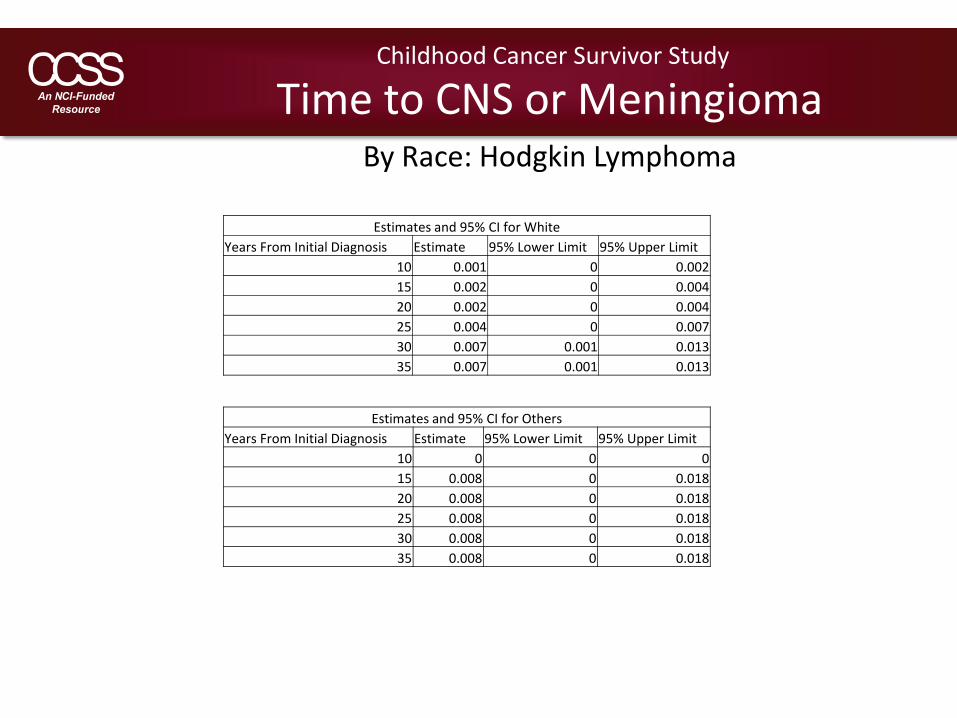
Estimates and 95% CI for WhiteYears From Initial Diagnosis Estimate 95% Lower Limit 95% Upper Limit
10 0.001 0 0.00215 0.002 0 0.00420 0.002 0 0.00425 0.004 0 0.00730 0.007 0.001 0.01335 0.007 0.001 0.013
Estimates and 95% CI for OthersYears From Initial Diagnosis Estimate 95% Lower Limit 95% Upper Limit
10 0 0 015 0.008 0 0.01820 0.008 0 0.01825 0.008 0 0.01830 0.008 0 0.01835 0.008 0 0.018
Childhood Cancer Survivor Study
Time to CNS or MeningiomaBy Race: Hodgkin Lymphoma
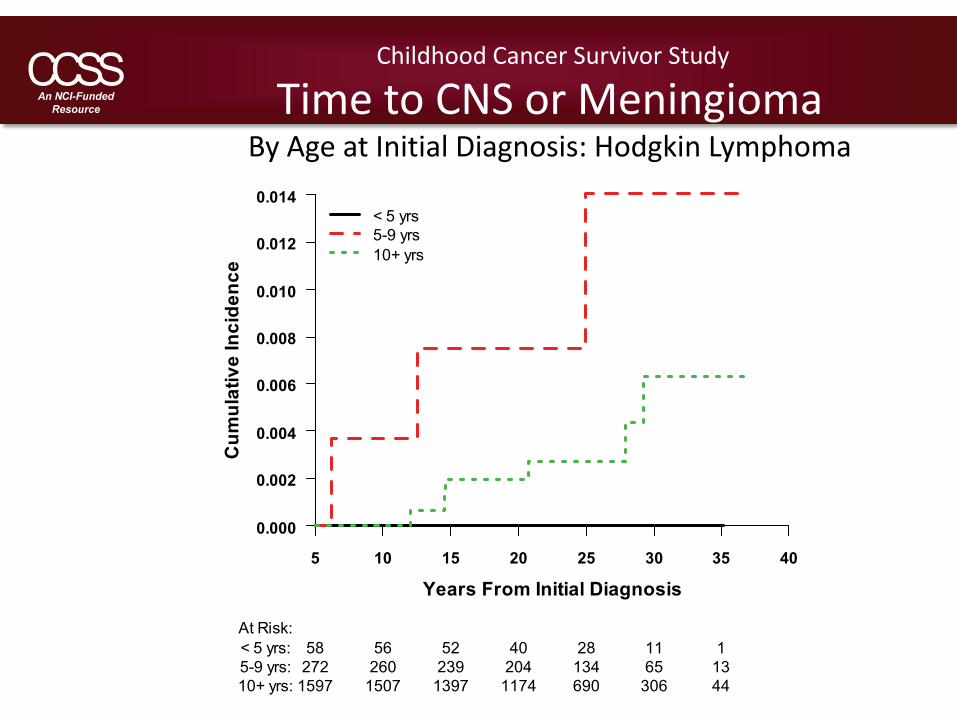
Time to CNS or MeningiomaBy Age at Initial Diagnosis: Hodgkin Lymphoma
Childhood Cancer Survivor Study
Cum
ulat
ive
Inci
denc
e
Years From Initial Diagnosis
0.000
0.002
0.004
0.006
0.008
0.010
0.012
0.014
5 10 15 20 25 30 35 40
< 5 yrs5-9 yrs10+ yrs
At Risk:< 5 yrs: 58 56 52 40 28 11 15-9 yrs: 272 260 239 204 134 65 1310+ yrs: 1597 1507 1397 1174 690 306 44
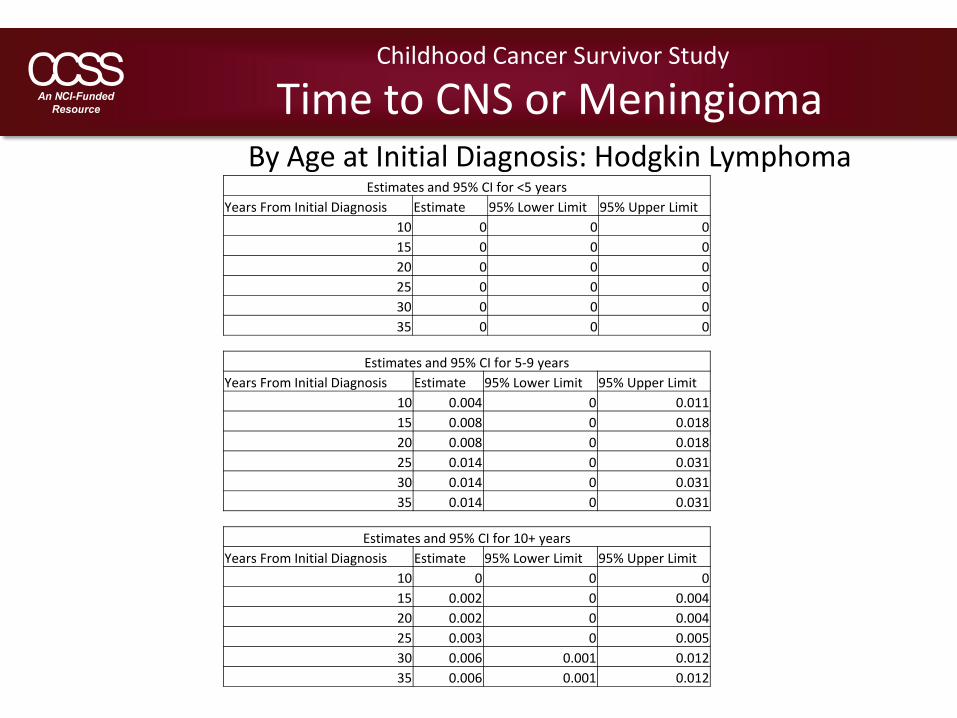
Estimates and 95% CI for <5 yearsYears From Initial Diagnosis Estimate 95% Lower Limit 95% Upper Limit
10 0 0 015 0 0 020 0 0 025 0 0 030 0 0 035 0 0 0
Estimates and 95% CI for 5‐9 yearsYears From Initial Diagnosis Estimate 95% Lower Limit 95% Upper Limit
10 0.004 0 0.01115 0.008 0 0.01820 0.008 0 0.01825 0.014 0 0.03130 0.014 0 0.03135 0.014 0 0.031
Childhood Cancer Survivor Study
Time to CNS or MeningiomaBy Age at Initial Diagnosis: Hodgkin Lymphoma
Estimates and 95% CI for 10+ yearsYears From Initial Diagnosis Estimate 95% Lower Limit 95% Upper Limit
10 0 0 015 0.002 0 0.00420 0.002 0 0.00425 0.003 0 0.00530 0.006 0.001 0.01235 0.006 0.001 0.012
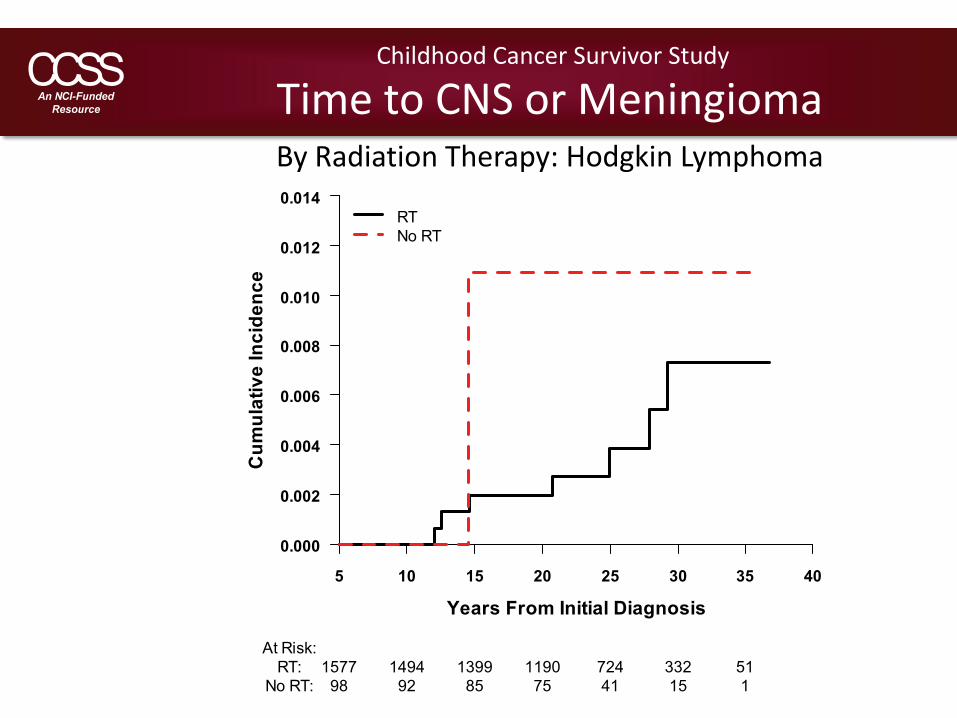
Time to CNS or MeningiomaBy Radiation Therapy: Hodgkin Lymphoma
Childhood Cancer Survivor Study
Cum
ulat
ive
Inci
denc
e
Years From Initial Diagnosis
0.000
0.002
0.004
0.006
0.008
0.010
0.012
0.014
5 10 15 20 25 30 35 40
RTNo RT
At Risk:RT: 1577 1494 1399 1190 724 332 51
No RT: 98 92 85 75 41 15 1
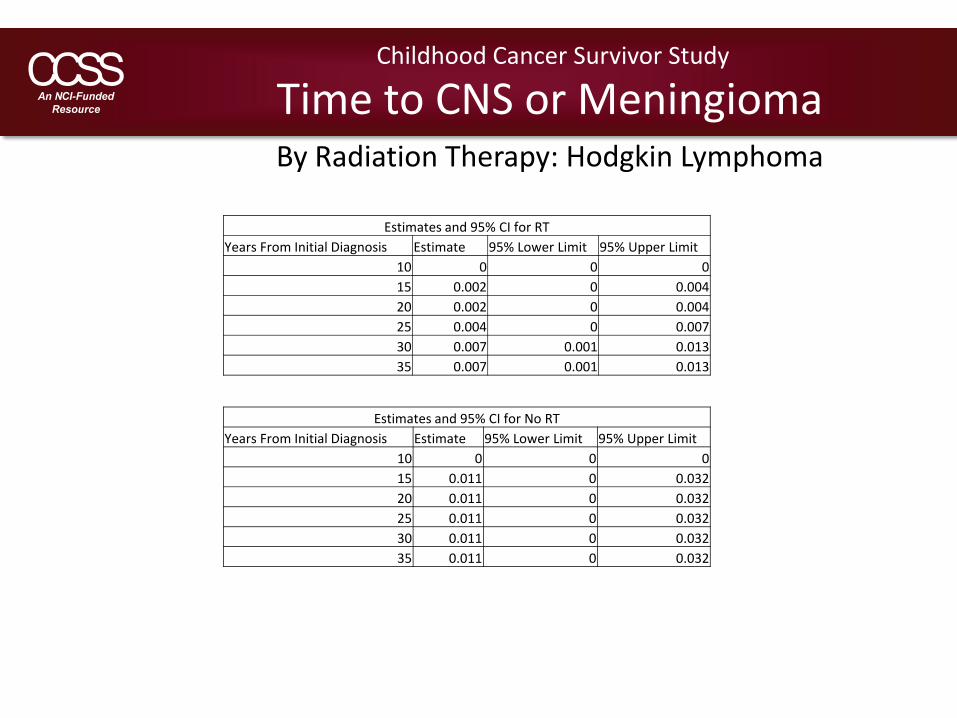
Estimates and 95% CI for RTYears From Initial Diagnosis Estimate 95% Lower Limit 95% Upper Limit
10 0 0 015 0.002 0 0.00420 0.002 0 0.00425 0.004 0 0.00730 0.007 0.001 0.01335 0.007 0.001 0.013
Estimates and 95% CI for No RTYears From Initial Diagnosis Estimate 95% Lower Limit 95% Upper Limit
10 0 0 015 0.011 0 0.03220 0.011 0 0.03225 0.011 0 0.03230 0.011 0 0.03235 0.011 0 0.032
Childhood Cancer Survivor Study
Time to CNS or MeningiomaBy Radiation Therapy: Hodgkin Lymphoma
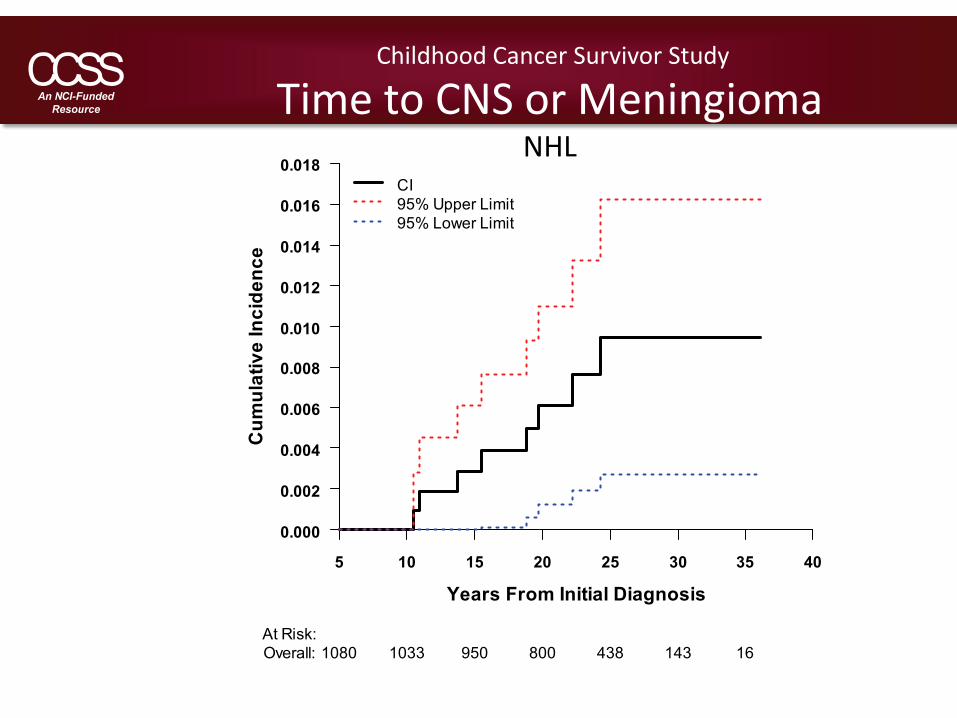
Time to CNS or MeningiomaNHL
Childhood Cancer Survivor Study
Cum
ulat
ive
Inci
denc
e
Years From Initial Diagnosis
0.000
0.002
0.004
0.006
0.008
0.010
0.012
0.014
0.016
0.018
5 10 15 20 25 30 35 40
CI95% Upper Limit95% Lower Limit
At Risk:Overall: 1080 1033 950 800 438 143 16
Childhood Cancer Survivor Study
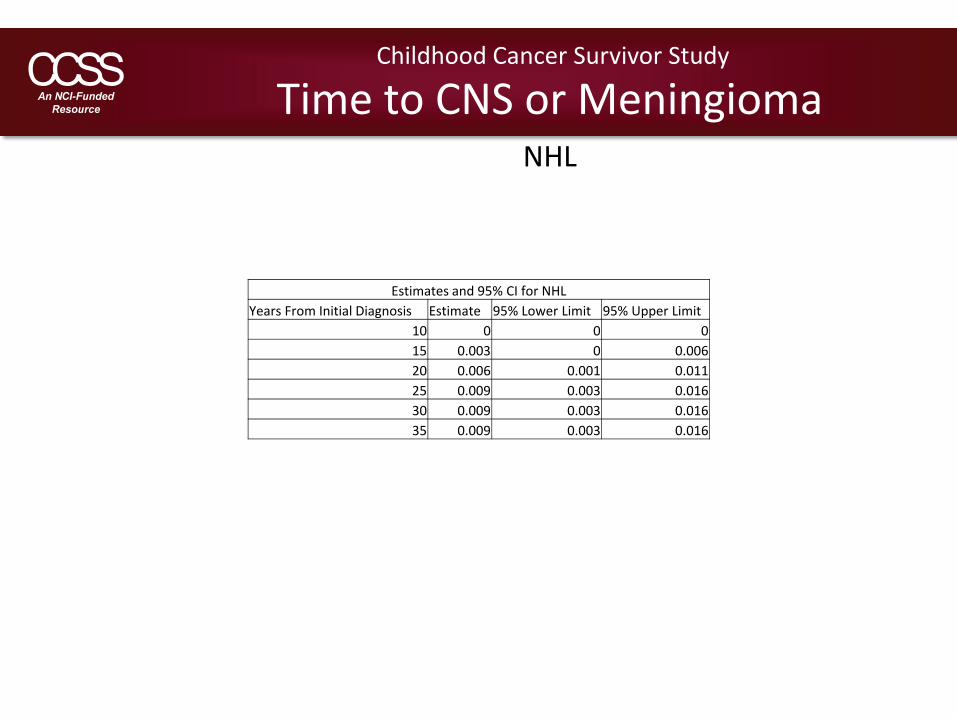
Time to CNS or MeningiomaNHL
Estimates and 95% CI for NHLYears From Initial Diagnosis Estimate 95% Lower Limit 95% Upper Limit
10 0 0 015 0.003 0 0.00620 0.006 0.001 0.01125 0.009 0.003 0.01630 0.009 0.003 0.01635 0.009 0.003 0.016
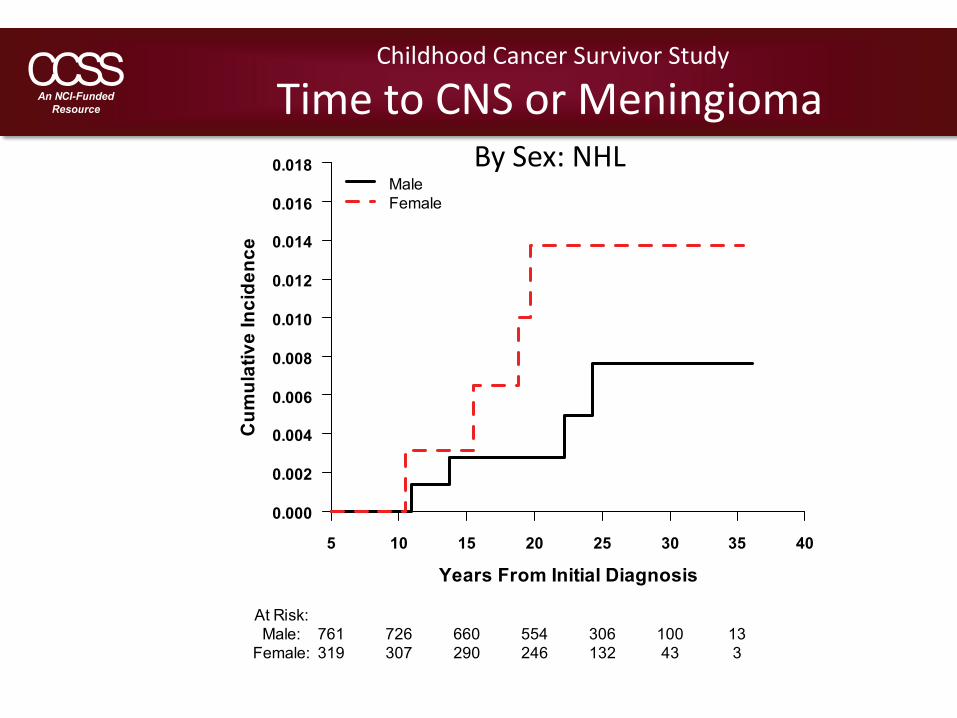
Time to CNS or MeningiomaBy Sex: NHL
Childhood Cancer Survivor Study
Cum
ulat
ive
Inci
denc
e
Years From Initial Diagnosis
0.000
0.002
0.004
0.006
0.008
0.010
0.012
0.014
0.016
0.018
5 10 15 20 25 30 35 40
MaleFemale
At Risk:Male: 761 726 660 554 306 100 13
Female: 319 307 290 246 132 43 3

Estimates and 95% CI for MaleYears From Initial Diagnosis Estimate 95% Lower Limit 95% Upper Limit
10 0 0 015 0.003 0 0.00720 0.003 0 0.00725 0.008 0 0.01530 0.008 0 0.01535 0.008 0 0.015
Estimates and 95% CI for FemaleYears From Initial Diagnosis Estimate 95% Lower Limit 95% Upper Limit
10 0 0 015 0.003 0 0.00920 0.014 0 0.02725 0.014 0 0.02730 0.014 0 0.02735 0.014 0 0.027
Childhood Cancer Survivor Study
Time to CNS or MeningiomaBy Sex: NHL
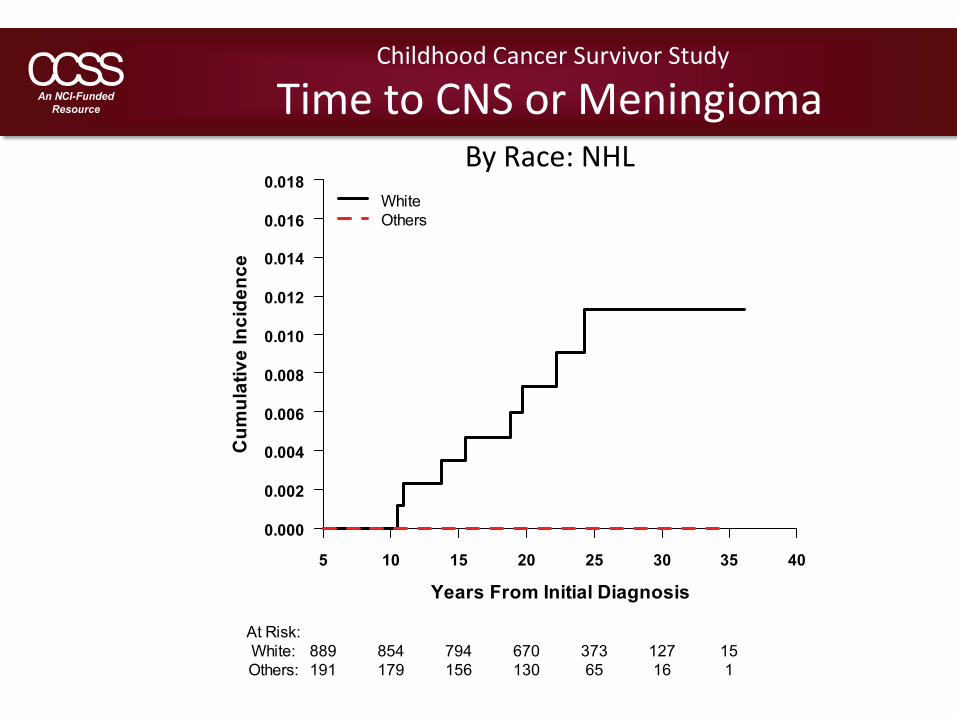
Time to CNS or MeningiomaBy Race: NHL
Childhood Cancer Survivor Study
Cum
ulat
ive
Inci
denc
e
Years From Initial Diagnosis
0.000
0.002
0.004
0.006
0.008
0.010
0.012
0.014
0.016
0.018
5 10 15 20 25 30 35 40
WhiteOthers
At Risk:White: 889 854 794 670 373 127 15Others: 191 179 156 130 65 16 1
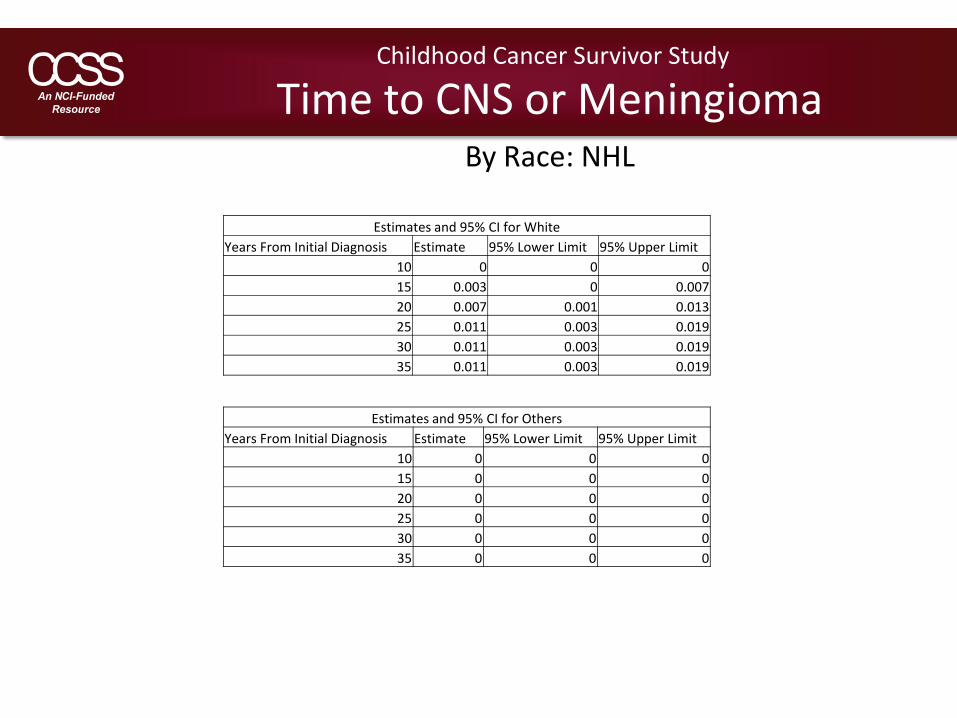
Estimates and 95% CI for WhiteYears From Initial Diagnosis Estimate 95% Lower Limit 95% Upper Limit
10 0 0 015 0.003 0 0.00720 0.007 0.001 0.01325 0.011 0.003 0.01930 0.011 0.003 0.01935 0.011 0.003 0.019
Estimates and 95% CI for OthersYears From Initial Diagnosis Estimate 95% Lower Limit 95% Upper Limit
10 0 0 015 0 0 020 0 0 025 0 0 030 0 0 035 0 0 0
Childhood Cancer Survivor Study
Time to CNS or MeningiomaBy Race: NHL
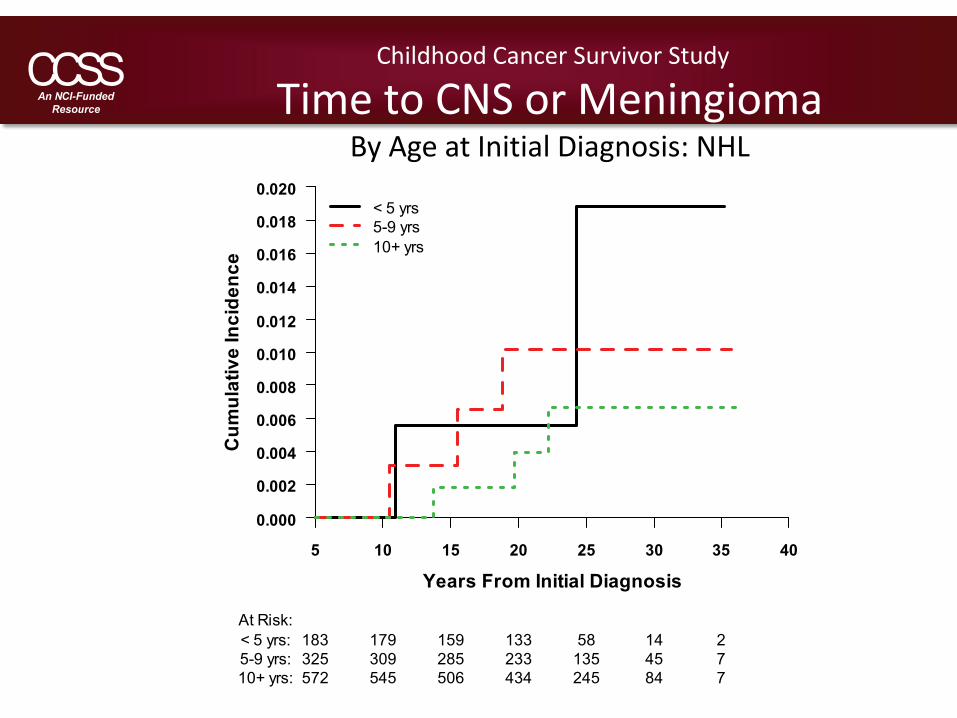
Time to CNS or MeningiomaBy Age at Initial Diagnosis: NHL
Childhood Cancer Survivor Study
Cum
ulat
ive
Inci
denc
e
Years From Initial Diagnosis
0.000
0.002
0.004
0.006
0.008
0.010
0.012
0.014
0.016
0.018
0.020
5 10 15 20 25 30 35 40
< 5 yrs5-9 yrs10+ yrs
At Risk:< 5 yrs: 183 179 159 133 58 14 25-9 yrs: 325 309 285 233 135 45 710+ yrs: 572 545 506 434 245 84 7
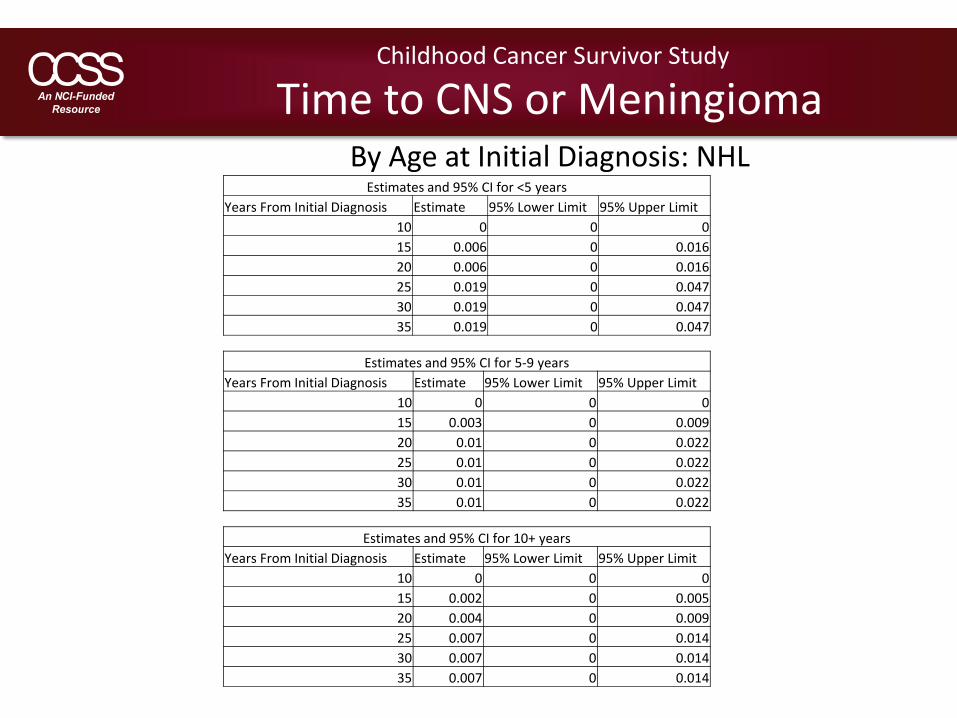
Estimates and 95% CI for <5 yearsYears From Initial Diagnosis Estimate 95% Lower Limit 95% Upper Limit
10 0 0 015 0.006 0 0.01620 0.006 0 0.01625 0.019 0 0.04730 0.019 0 0.04735 0.019 0 0.047
Estimates and 95% CI for 5‐9 yearsYears From Initial Diagnosis Estimate 95% Lower Limit 95% Upper Limit
10 0 0 015 0.003 0 0.00920 0.01 0 0.02225 0.01 0 0.02230 0.01 0 0.02235 0.01 0 0.022
Childhood Cancer Survivor Study
Time to CNS or MeningiomaBy Age at Initial Diagnosis: NHL
Estimates and 95% CI for 10+ yearsYears From Initial Diagnosis Estimate 95% Lower Limit 95% Upper Limit
10 0 0 015 0.002 0 0.00520 0.004 0 0.00925 0.007 0 0.01430 0.007 0 0.01435 0.007 0 0.014
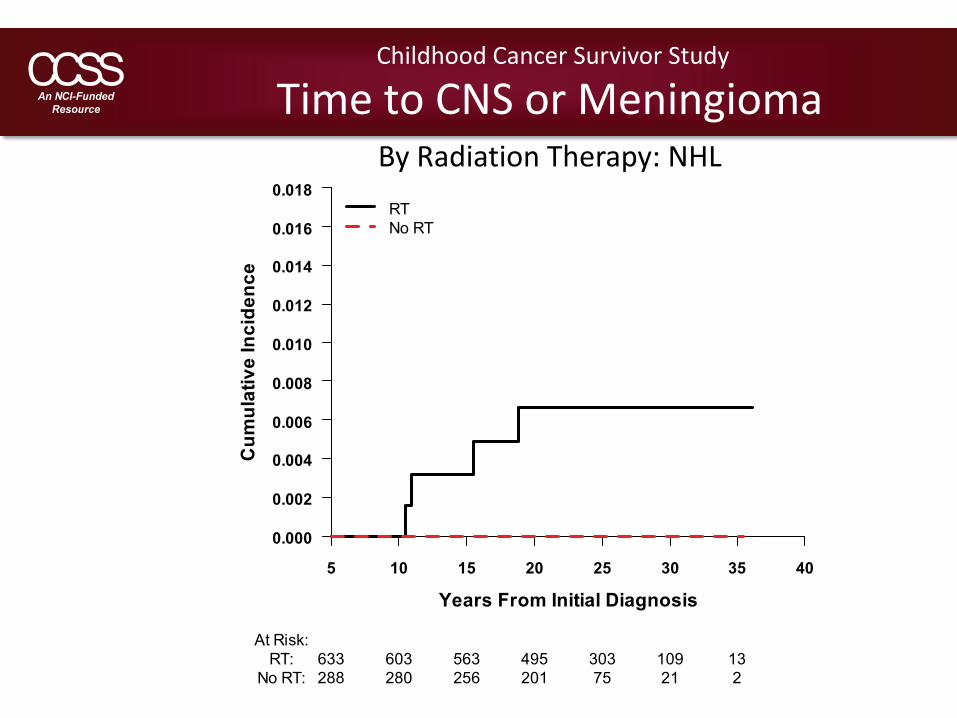
Time to CNS or MeningiomaBy Radiation Therapy: NHL
Childhood Cancer Survivor Study
Cum
ulat
ive
Inci
denc
e
Years From Initial Diagnosis
0.000
0.002
0.004
0.006
0.008
0.010
0.012
0.014
0.016
0.018
5 10 15 20 25 30 35 40
RTNo RT
At Risk:RT: 633 603 563 495 303 109 13
No RT: 288 280 256 201 75 21 2
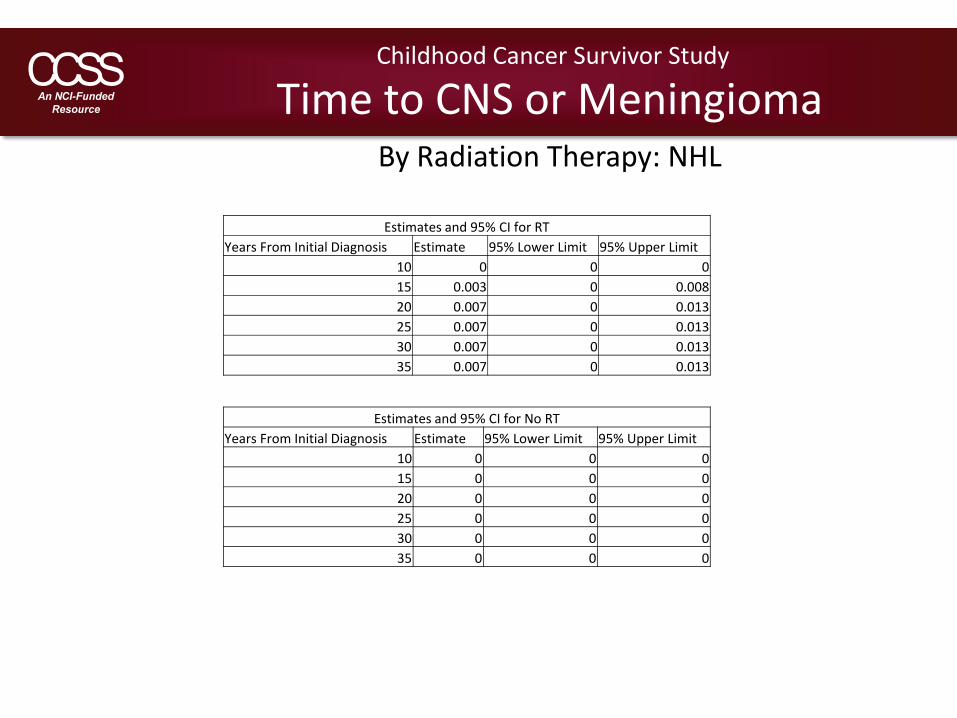
Estimates and 95% CI for RTYears From Initial Diagnosis Estimate 95% Lower Limit 95% Upper Limit
10 0 0 015 0.003 0 0.00820 0.007 0 0.01325 0.007 0 0.01330 0.007 0 0.01335 0.007 0 0.013
Estimates and 95% CI for No RTYears From Initial Diagnosis Estimate 95% Lower Limit 95% Upper Limit
10 0 0 015 0 0 020 0 0 025 0 0 030 0 0 035 0 0 0
Childhood Cancer Survivor Study
Time to CNS or MeningiomaBy Radiation Therapy: NHL
Time to CNS or MeningiomaNeuroblastoma
Childhood Cancer Survivor Study
Cum
ulat
ive
Inci
denc
e
Years From Initial Diagnosis
0.000
0.002
0.004
0.006
5 10 15 20 25 30 35 40
CI95% Upper Limit95% Lower Limit
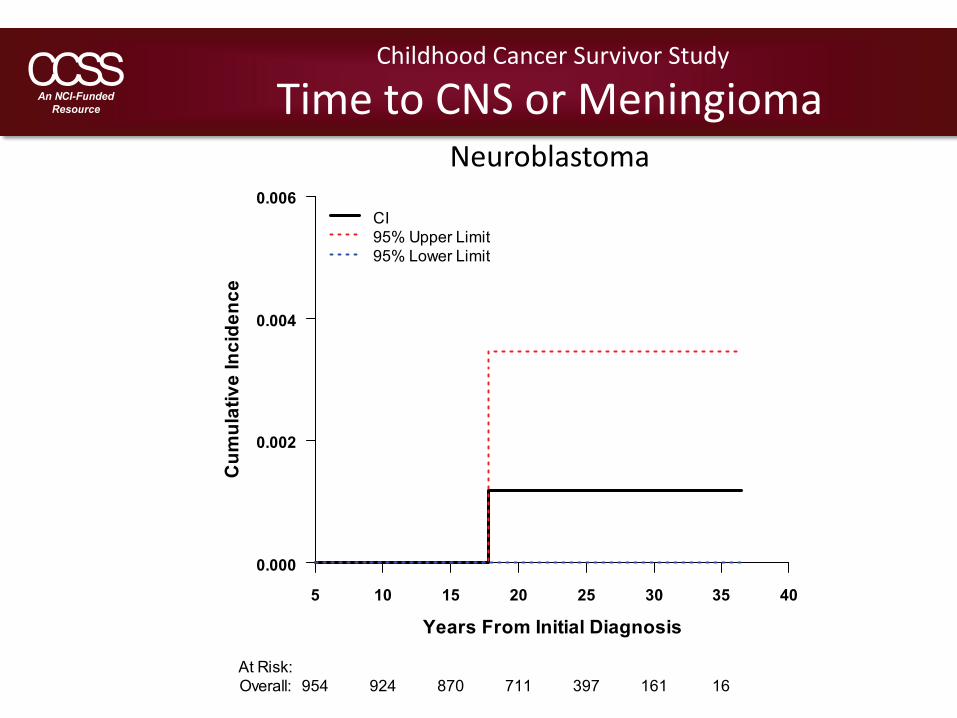
At Risk:Overall: 954 924 870 711 397 161 16

Childhood Cancer Survivor Study
Time to CNS or MeningiomaNeuroblastoma
Estimates and 95% CI for NeuroblastomaYears From Initial Diagnosis Estimate 95% Lower Limit 95% Upper Limit
10 0 0 015 0 0 020 0.001 0 0.00325 0.001 0 0.00330 0.001 0 0.00335 0.001 0 0.003
Time to CNS or MeningiomaBy Sex: Neuroblastoma
Childhood Cancer Survivor Study
Cum
ulat
ive
Inci
denc
e
Years From Initial Diagnosis
0.000
0.002
0.004
0.006
5 10 15 20 25 30 35 40
MaleFemale
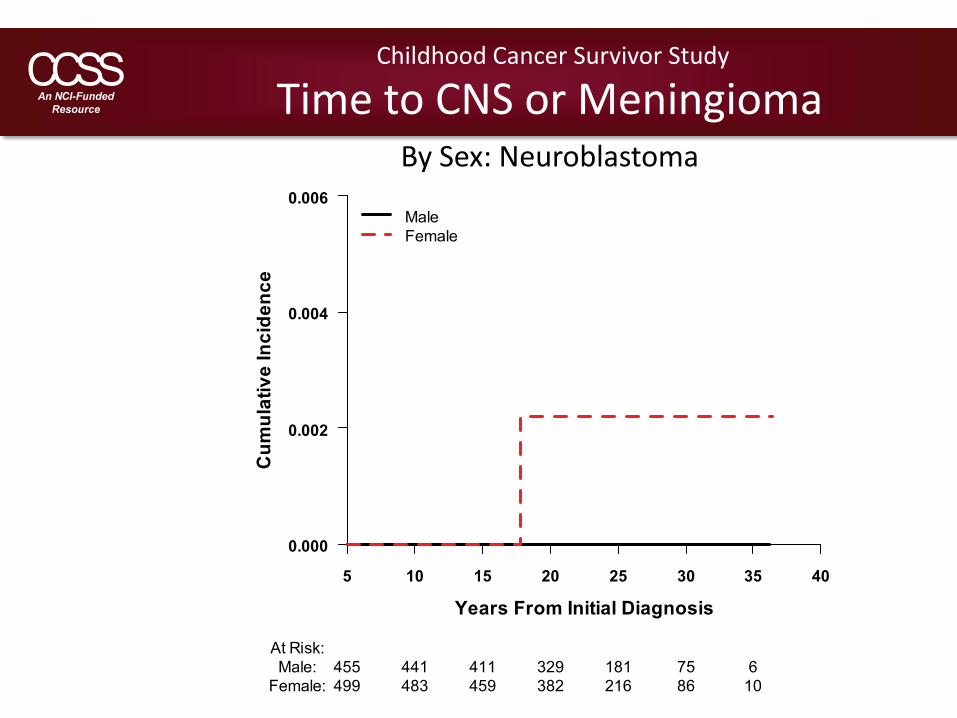
At Risk:Male: 455 441 411 329 181 75 6
Female: 499 483 459 382 216 86 10
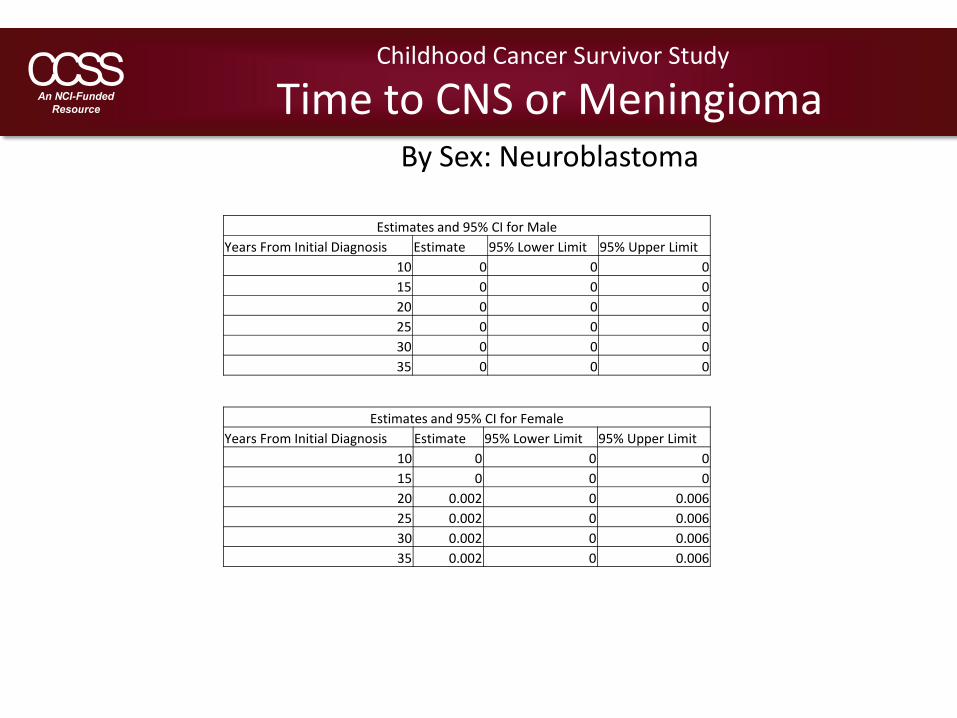
Estimates and 95% CI for MaleYears From Initial Diagnosis Estimate 95% Lower Limit 95% Upper Limit
10 0 0 015 0 0 020 0 0 025 0 0 030 0 0 035 0 0 0
Estimates and 95% CI for FemaleYears From Initial Diagnosis Estimate 95% Lower Limit 95% Upper Limit
10 0 0 015 0 0 020 0.002 0 0.00625 0.002 0 0.00630 0.002 0 0.00635 0.002 0 0.006
Childhood Cancer Survivor Study
Time to CNS or MeningiomaBy Sex: Neuroblastoma
Time to CNS or MeningiomaBy Race: Neuroblastoma
Childhood Cancer Survivor Study
Cum
ulat
ive
Inci
denc
e
Years From Initial Diagnosis
0.000
0.002
0.004
0.006
5 10 15 20 25 30 35 40
WhiteOthers
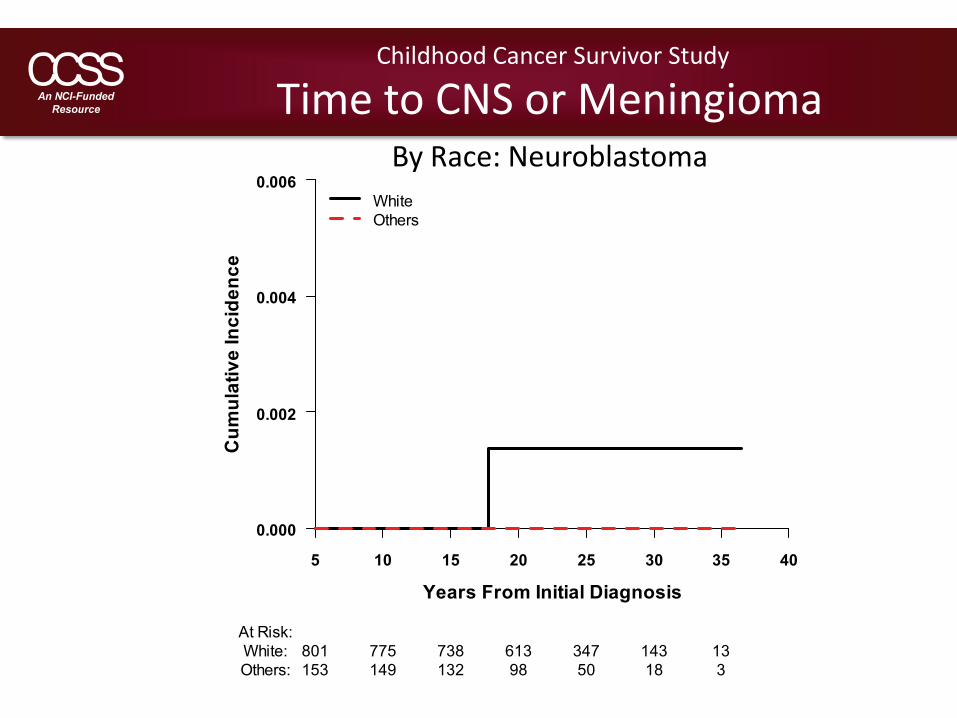
At Risk:White: 801 775 738 613 347 143 13Others: 153 149 132 98 50 18 3
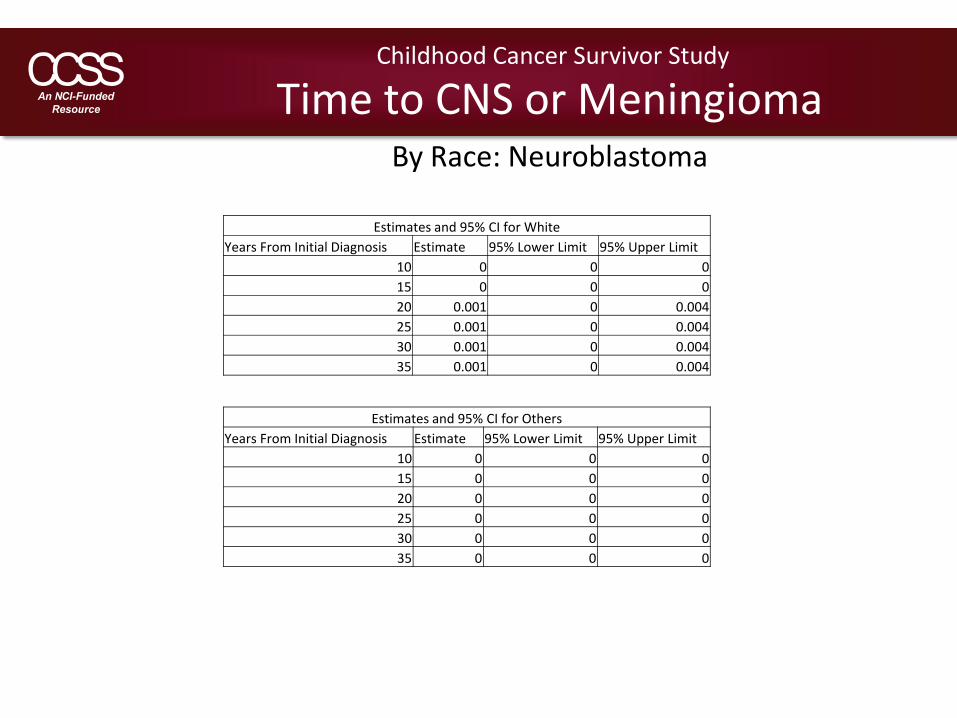
Estimates and 95% CI for WhiteYears From Initial Diagnosis Estimate 95% Lower Limit 95% Upper Limit
10 0 0 015 0 0 020 0.001 0 0.00425 0.001 0 0.00430 0.001 0 0.00435 0.001 0 0.004
Estimates and 95% CI for OthersYears From Initial Diagnosis Estimate 95% Lower Limit 95% Upper Limit
10 0 0 015 0 0 020 0 0 025 0 0 030 0 0 035 0 0 0
Childhood Cancer Survivor Study
Time to CNS or MeningiomaBy Race: Neuroblastoma
Time to CNS or MeningiomaBy Age at Initial Diagnosis: Neuroblastoma
Childhood Cancer Survivor Study
Cum
ulat
ive
Inci
denc
e
Years From Initial Diagnosis
0.000
0.002
0.004
0.006
5 10 15 20 25 30 35 40
< 5 yrs5-9 yrs10+ yrs
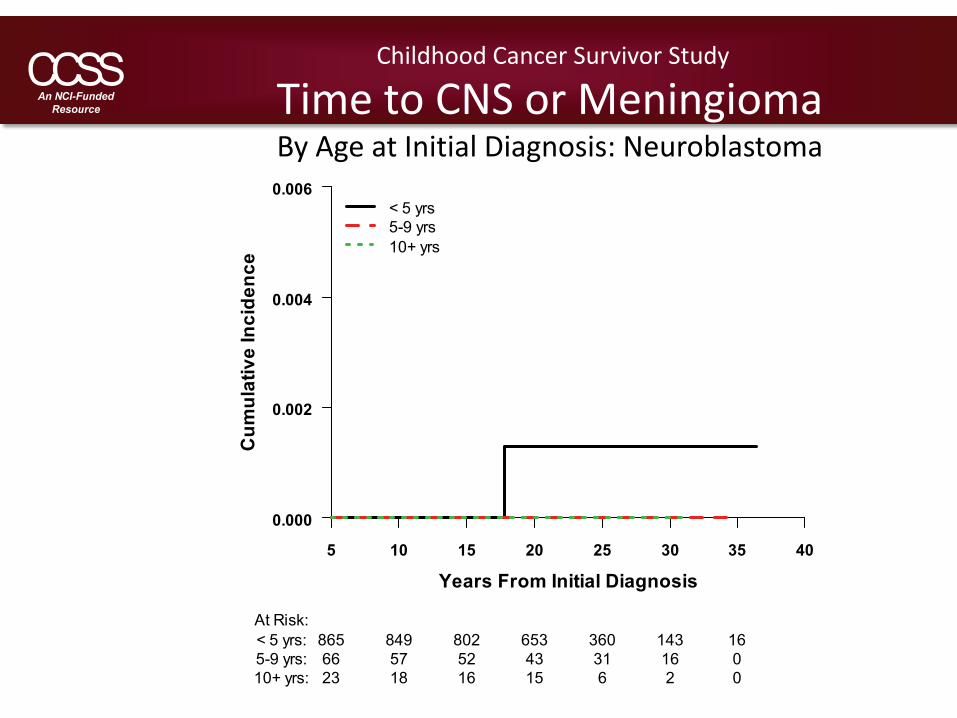
At Risk:< 5 yrs: 865 849 802 653 360 143 165-9 yrs: 66 57 52 43 31 16 010+ yrs: 23 18 16 15 6 2 0
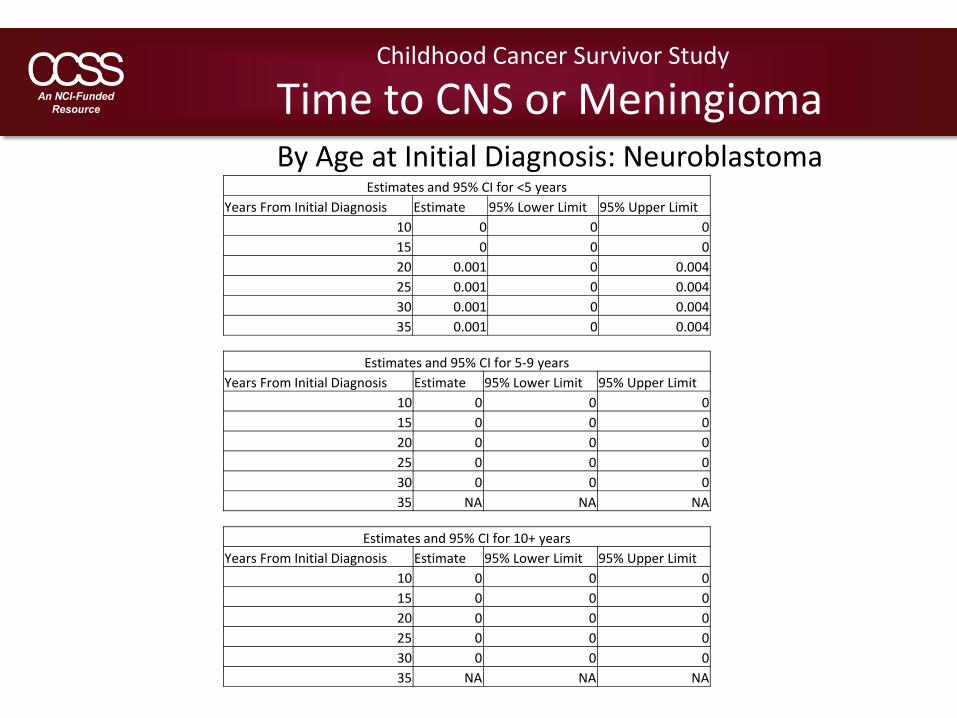
Estimates and 95% CI for <5 yearsYears From Initial Diagnosis Estimate 95% Lower Limit 95% Upper Limit
10 0 0 015 0 0 020 0.001 0 0.00425 0.001 0 0.00430 0.001 0 0.00435 0.001 0 0.004
Estimates and 95% CI for 5‐9 yearsYears From Initial Diagnosis Estimate 95% Lower Limit 95% Upper Limit
10 0 0 015 0 0 020 0 0 025 0 0 030 0 0 035 NA NA NA
Childhood Cancer Survivor Study
Time to CNS or MeningiomaBy Age at Initial Diagnosis: Neuroblastoma
Estimates and 95% CI for 10+ yearsYears From Initial Diagnosis Estimate 95% Lower Limit 95% Upper Limit
10 0 0 015 0 0 020 0 0 025 0 0 030 0 0 035 NA NA NA
Time to CNS or MeningiomaBy Radiation Therapy: Neuroblastoma
Childhood Cancer Survivor Study
Cum
ulat
ive
Inci
denc
e
Years From Initial Diagnosis
0.000
0.002
0.004
0.006
5 10 15 20 25 30 35 40
RTNo RT
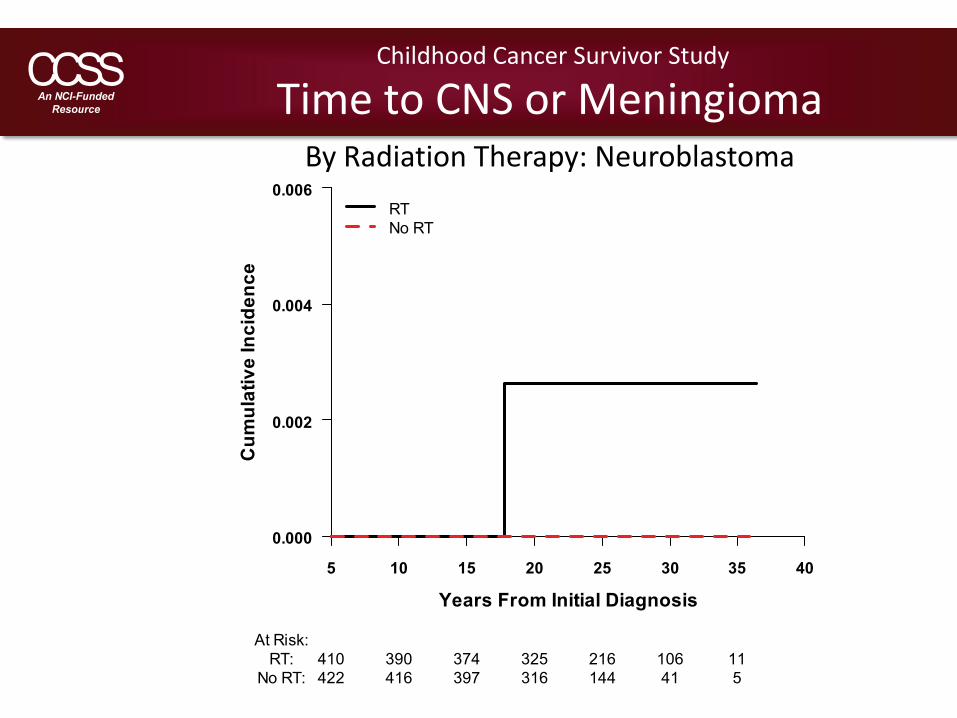
At Risk:RT: 410 390 374 325 216 106 11
No RT: 422 416 397 316 144 41 5

Estimates and 95% CI for RTYears From Initial Diagnosis Estimate 95% Lower Limit 95% Upper Limit
10 0 0 015 0 0 020 0.003 0 0.00825 0.003 0 0.00830 0.003 0 0.00835 0.003 0 0.008
Estimates and 95% CI for No RTYears From Initial Diagnosis Estimate 95% Lower Limit 95% Upper Limit
10 0 0 015 0 0 020 0 0 025 0 0 030 0 0 035 0 0 0
Childhood Cancer Survivor Study
Time to CNS or MeningiomaBy Radiation Therapy: Neuroblastoma
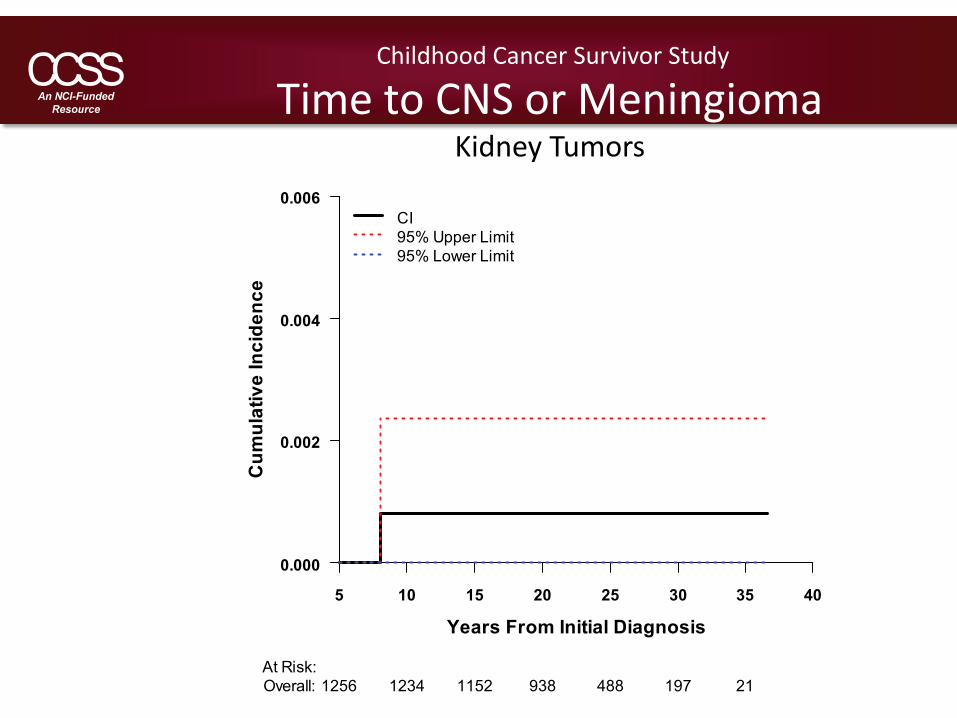
Time to CNS or MeningiomaKidney Tumors
Childhood Cancer Survivor Study
Cum
ulat
ive
Inci
denc
e
Years From Initial Diagnosis
0.000
0.002
0.004
0.006
5 10 15 20 25 30 35 40
CI95% Upper Limit95% Lower Limit
At Risk:Overall: 1256 1234 1152 938 488 197 21

Childhood Cancer Survivor Study
Time to CNS or MeningiomaKidney Tumors
Estimates and 95% CI for Kidney TumorsYears From Initial Diagnosis Estimate 95% Lower Limit 95% Upper Limit
10 0.001 0 0.00215 0.001 0 0.00220 0.001 0 0.00225 0.001 0 0.00230 0.001 0 0.00235 0.001 0 0.002
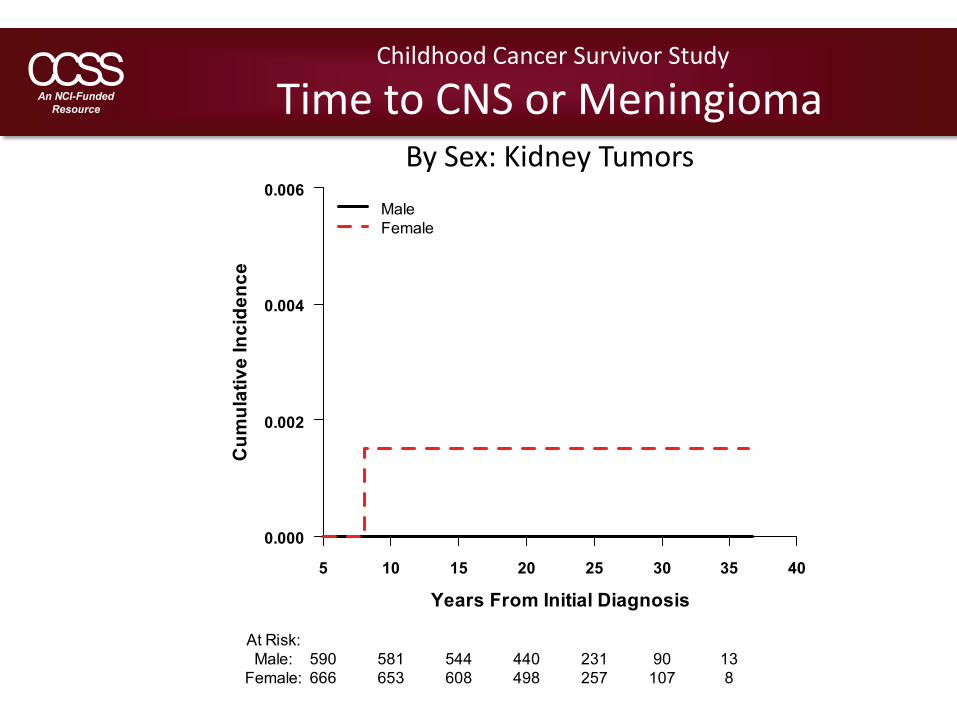
Time to CNS or MeningiomaBy Sex: Kidney Tumors
Childhood Cancer Survivor Study
Cum
ulat
ive
Inci
denc
e
Years From Initial Diagnosis
0.000
0.002
0.004
0.006
5 10 15 20 25 30 35 40
MaleFemale
At Risk:Male: 590 581 544 440 231 90 13
Female: 666 653 608 498 257 107 8

Estimates and 95% CI for MaleYears From Initial Diagnosis Estimate 95% Lower Limit 95% Upper Limit
10 0 0 015 0 0 020 0 0 025 0 0 030 0 0 035 0 0 0
Estimates and 95% CI for FemaleYears From Initial Diagnosis Estimate 95% Lower Limit 95% Upper Limit
10 0.002 0 0.00415 0.002 0 0.00420 0.002 0 0.00425 0.002 0 0.00430 0.002 0 0.00435 0.002 0 0.004
Childhood Cancer Survivor Study
Time to CNS or MeningiomaBy Sex: Kidney Tumors
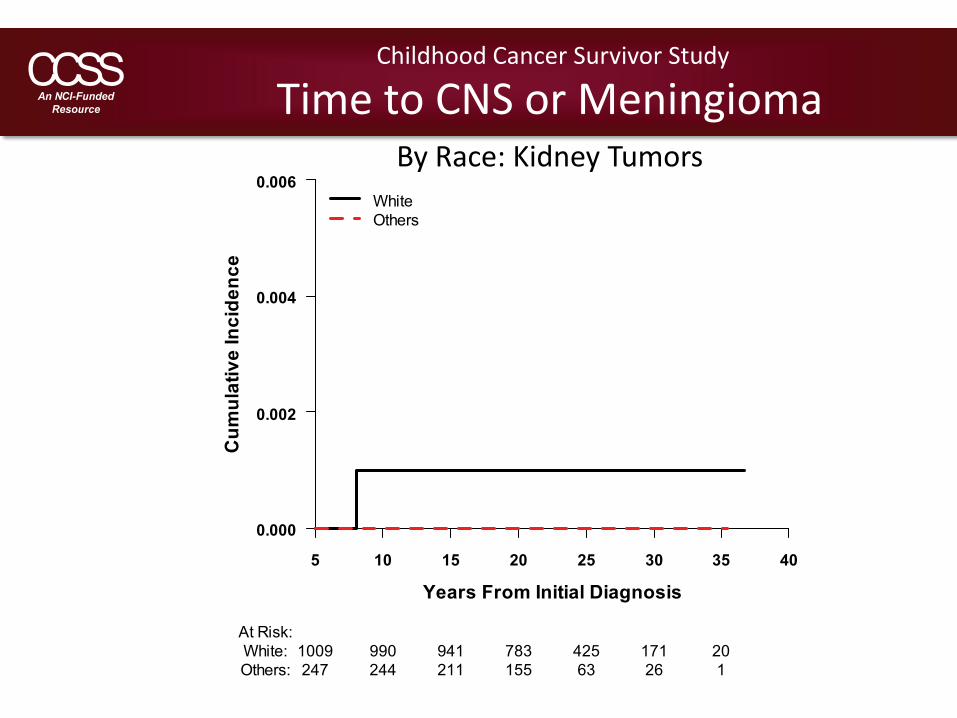
Time to CNS or MeningiomaBy Race: Kidney Tumors
Childhood Cancer Survivor Study
Cum
ulat
ive
Inci
denc
e
Years From Initial Diagnosis
0.000
0.002
0.004
0.006
5 10 15 20 25 30 35 40
WhiteOthers
At Risk:White: 1009 990 941 783 425 171 20Others: 247 244 211 155 63 26 1

Estimates and 95% CI for WhiteYears From Initial Diagnosis Estimate 95% Lower Limit 95% Upper Limit
10 0.001 0 0.00315 0.001 0 0.00320 0.001 0 0.00325 0.001 0 0.00330 0.001 0 0.00335 0.001 0 0.003
Estimates and 95% CI for OthersYears From Initial Diagnosis Estimate 95% Lower Limit 95% Upper Limit
10 0 0 015 0 0 020 0 0 025 0 0 030 0 0 035 0 0 0
Childhood Cancer Survivor Study
Time to CNS or MeningiomaBy Race: Kidney Tumors
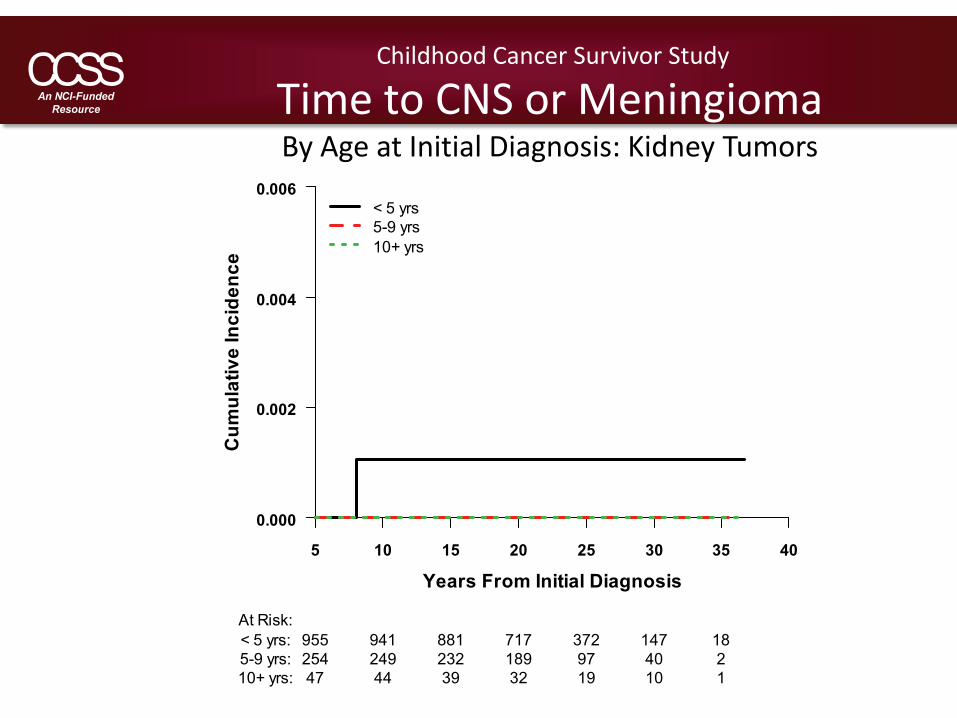
Time to CNS or MeningiomaBy Age at Initial Diagnosis: Kidney Tumors
Childhood Cancer Survivor Study
Cum
ulat
ive
Inci
denc
e
Years From Initial Diagnosis
0.000
0.002
0.004
0.006
5 10 15 20 25 30 35 40
< 5 yrs5-9 yrs10+ yrs
At Risk:< 5 yrs: 955 941 881 717 372 147 185-9 yrs: 254 249 232 189 97 40 210+ yrs: 47 44 39 32 19 10 1
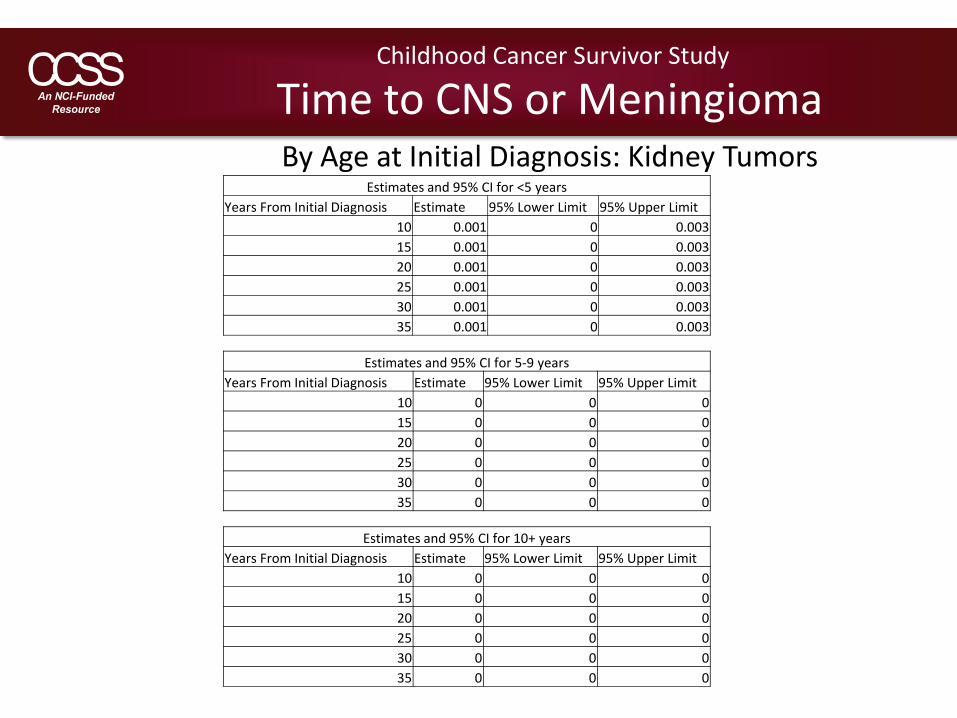
Estimates and 95% CI for <5 yearsYears From Initial Diagnosis Estimate 95% Lower Limit 95% Upper Limit
10 0.001 0 0.00315 0.001 0 0.00320 0.001 0 0.00325 0.001 0 0.00330 0.001 0 0.00335 0.001 0 0.003
Estimates and 95% CI for 5‐9 yearsYears From Initial Diagnosis Estimate 95% Lower Limit 95% Upper Limit
10 0 0 015 0 0 020 0 0 025 0 0 030 0 0 035 0 0 0
Childhood Cancer Survivor Study
Time to CNS or MeningiomaBy Age at Initial Diagnosis: Kidney Tumors
Estimates and 95% CI for 10+ yearsYears From Initial Diagnosis Estimate 95% Lower Limit 95% Upper Limit
10 0 0 015 0 0 020 0 0 025 0 0 030 0 0 035 0 0 0
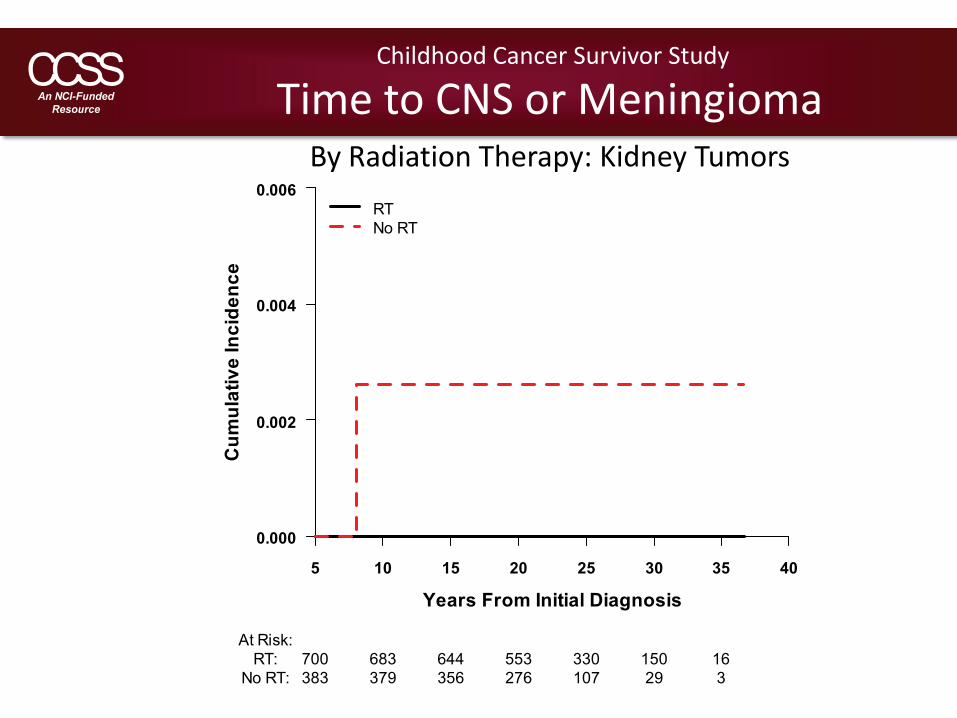
Time to CNS or MeningiomaBy Radiation Therapy: Kidney Tumors
Childhood Cancer Survivor Study
Cum
ulat
ive
Inci
denc
e
Years From Initial Diagnosis
0.000
0.002
0.004
0.006
5 10 15 20 25 30 35 40
RTNo RT
At Risk:RT: 700 683 644 553 330 150 16
No RT: 383 379 356 276 107 29 3
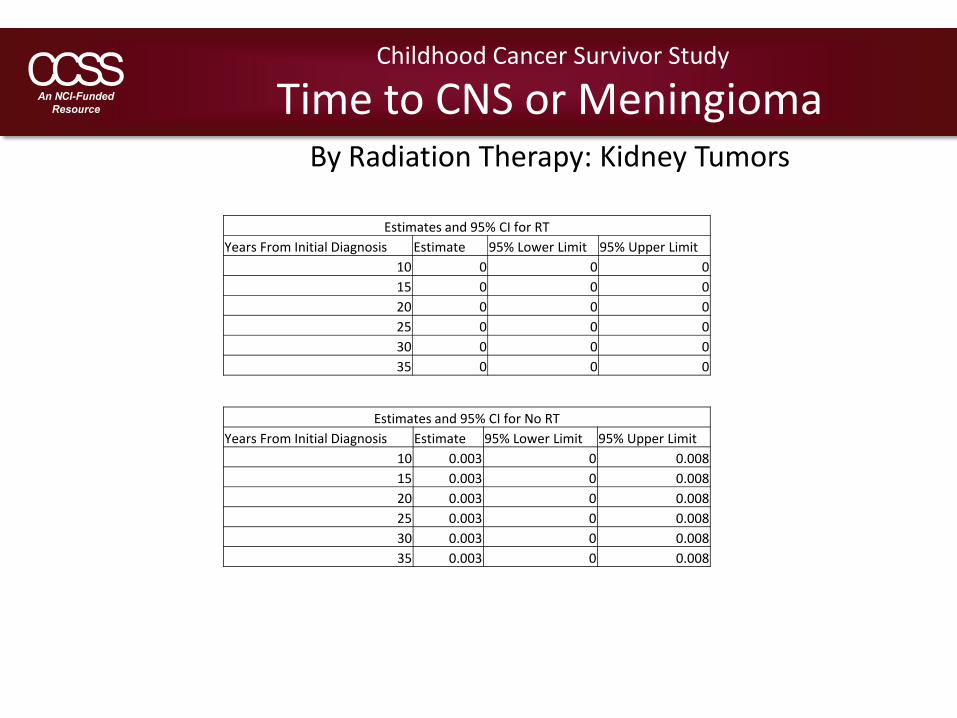
Estimates and 95% CI for RTYears From Initial Diagnosis Estimate 95% Lower Limit 95% Upper Limit
10 0 0 015 0 0 020 0 0 025 0 0 030 0 0 035 0 0 0
Estimates and 95% CI for No RTYears From Initial Diagnosis Estimate 95% Lower Limit 95% Upper Limit
10 0.003 0 0.00815 0.003 0 0.00820 0.003 0 0.00825 0.003 0 0.00830 0.003 0 0.00835 0.003 0 0.008
Childhood Cancer Survivor Study
Time to CNS or MeningiomaBy Radiation Therapy: Kidney Tumors
Time to CNS or MeningiomaSoft Tissue Sarcoma
Childhood Cancer Survivor Study
Cum
ulat
ive
Inci
denc
e
Years From Initial Diagnosis
0.000
0.002
0.004
0.006
0.008
0.010
0.012
5 10 15 20 25 30 35 40
CI95% Upper Limit95% Lower Limit
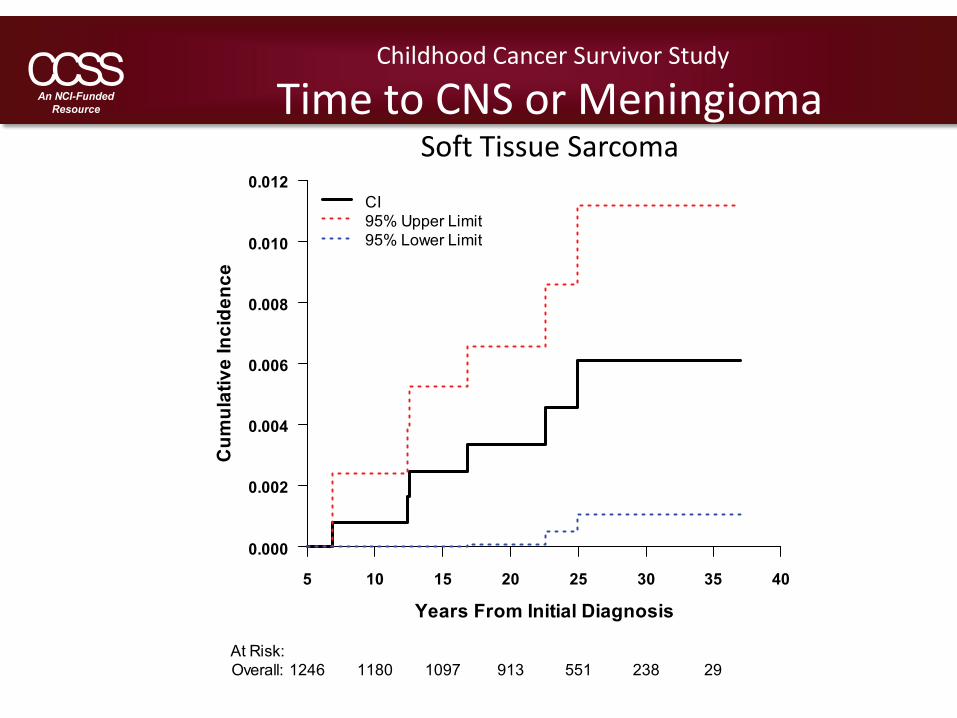
At Risk:Overall: 1246 1180 1097 913 551 238 29
Childhood Cancer Survivor Study
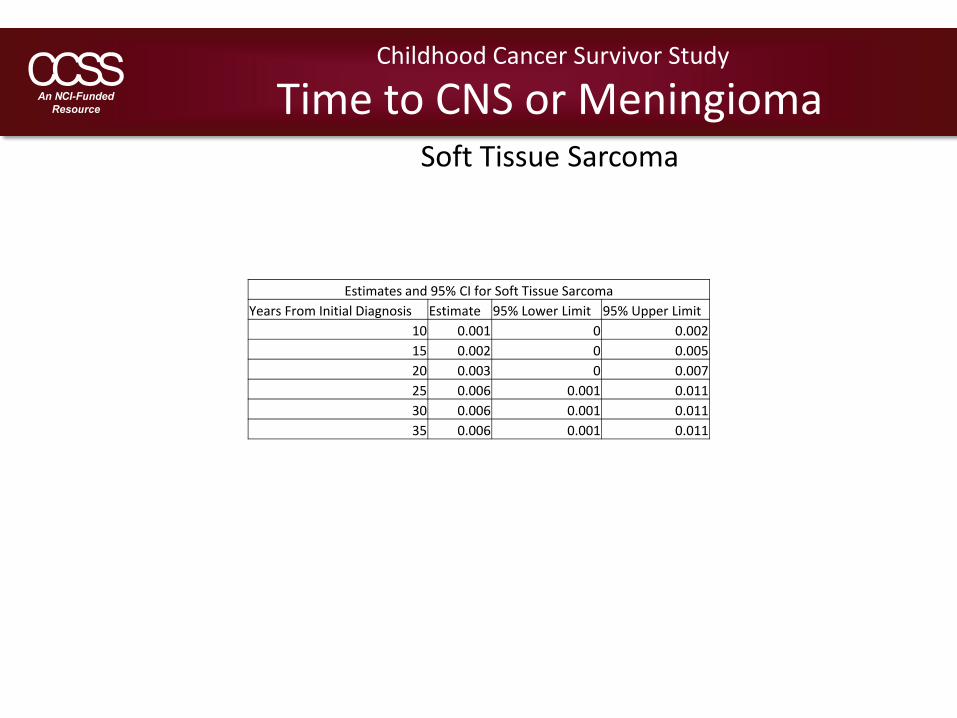
Time to CNS or MeningiomaSoft Tissue Sarcoma
Estimates and 95% CI for Soft Tissue SarcomaYears From Initial Diagnosis Estimate 95% Lower Limit 95% Upper Limit
10 0.001 0 0.00215 0.002 0 0.00520 0.003 0 0.00725 0.006 0.001 0.01130 0.006 0.001 0.01135 0.006 0.001 0.011
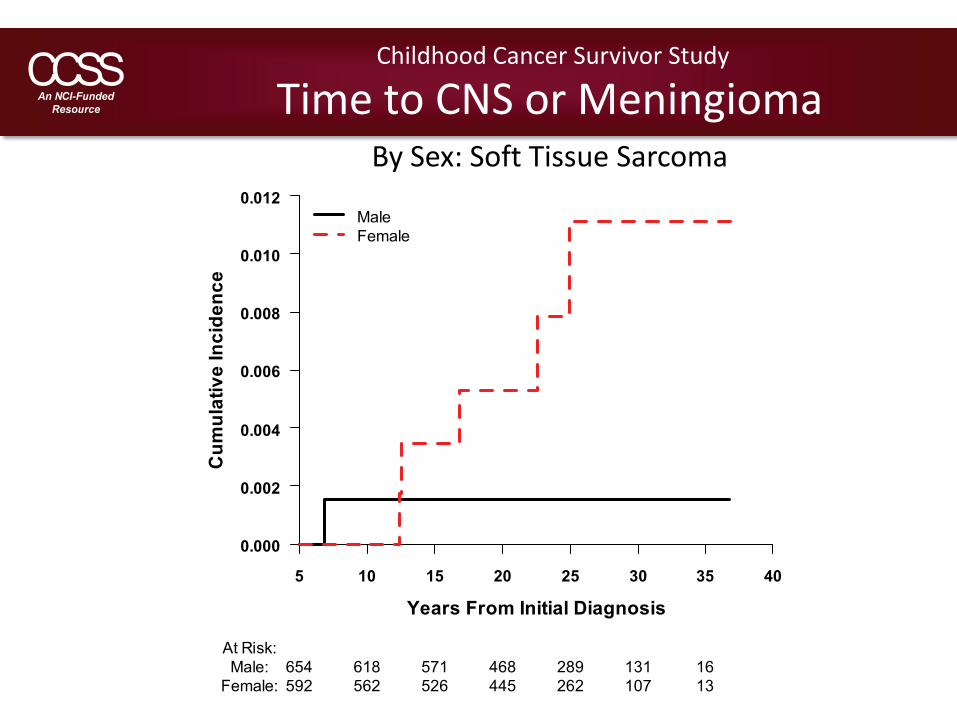
Time to CNS or MeningiomaBy Sex: Soft Tissue Sarcoma
Childhood Cancer Survivor Study
Cum
ulat
ive
Inci
denc
e
Years From Initial Diagnosis
0.000
0.002
0.004
0.006
0.008
0.010
0.012
5 10 15 20 25 30 35 40
MaleFemale
At Risk:Male: 654 618 571 468 289 131 16
Female: 592 562 526 445 262 107 13
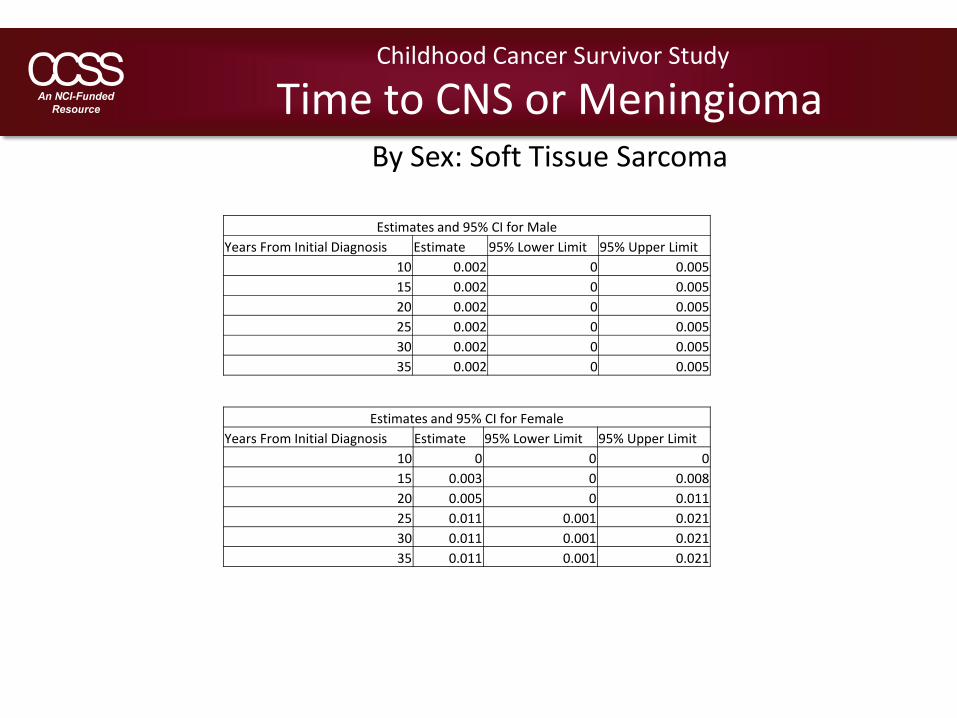
Estimates and 95% CI for MaleYears From Initial Diagnosis Estimate 95% Lower Limit 95% Upper Limit
10 0.002 0 0.00515 0.002 0 0.00520 0.002 0 0.00525 0.002 0 0.00530 0.002 0 0.00535 0.002 0 0.005
Estimates and 95% CI for FemaleYears From Initial Diagnosis Estimate 95% Lower Limit 95% Upper Limit
10 0 0 015 0.003 0 0.00820 0.005 0 0.01125 0.011 0.001 0.02130 0.011 0.001 0.02135 0.011 0.001 0.021
Childhood Cancer Survivor Study
Time to CNS or MeningiomaBy Sex: Soft Tissue Sarcoma
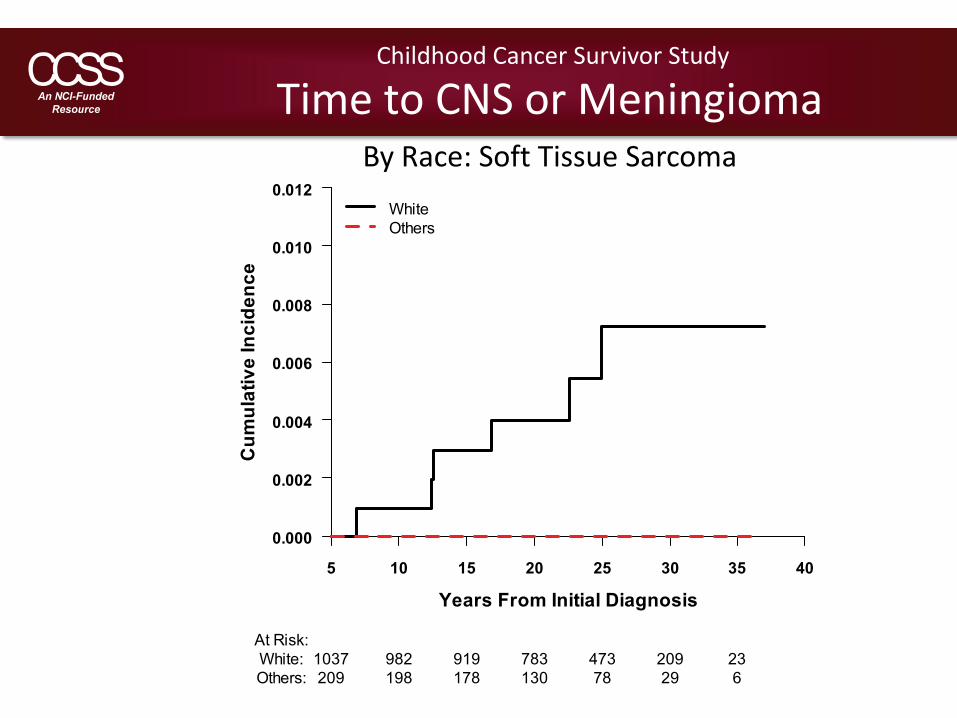
Time to CNS or MeningiomaBy Race: Soft Tissue Sarcoma
Childhood Cancer Survivor Study
Cum
ulat
ive
Inci
denc
e
Years From Initial Diagnosis
0.000
0.002
0.004
0.006
0.008
0.010
0.012
5 10 15 20 25 30 35 40
WhiteOthers
At Risk:White: 1037 982 919 783 473 209 23Others: 209 198 178 130 78 29 6
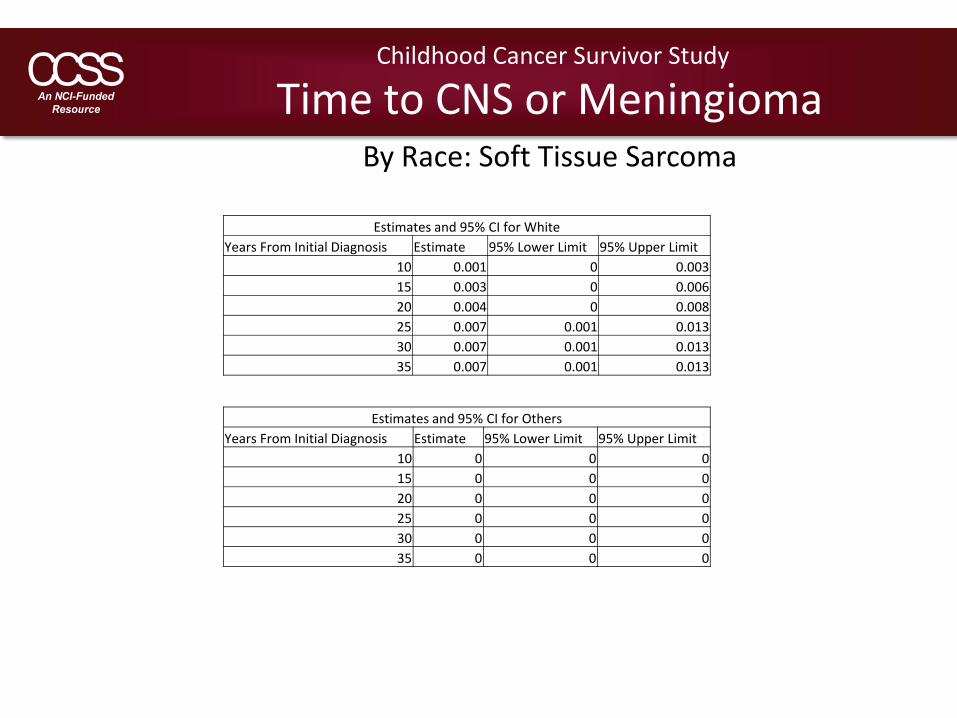
Estimates and 95% CI for WhiteYears From Initial Diagnosis Estimate 95% Lower Limit 95% Upper Limit
10 0.001 0 0.00315 0.003 0 0.00620 0.004 0 0.00825 0.007 0.001 0.01330 0.007 0.001 0.01335 0.007 0.001 0.013
Estimates and 95% CI for OthersYears From Initial Diagnosis Estimate 95% Lower Limit 95% Upper Limit
10 0 0 015 0 0 020 0 0 025 0 0 030 0 0 035 0 0 0
Childhood Cancer Survivor Study
Time to CNS or MeningiomaBy Race: Soft Tissue Sarcoma
Time to CNS or MeningiomaBy Age at Initial Diagnosis: Soft Tissue Sarcoma
Childhood Cancer Survivor Study
Cum
ulat
ive
Inci
denc
e
Years From Initial Diagnosis
0.000
0.002
0.004
0.006
0.008
0.010
0.012
0.014
5 10 15 20 25 30 35 40
< 5 yrs5-9 yrs10+ yrs
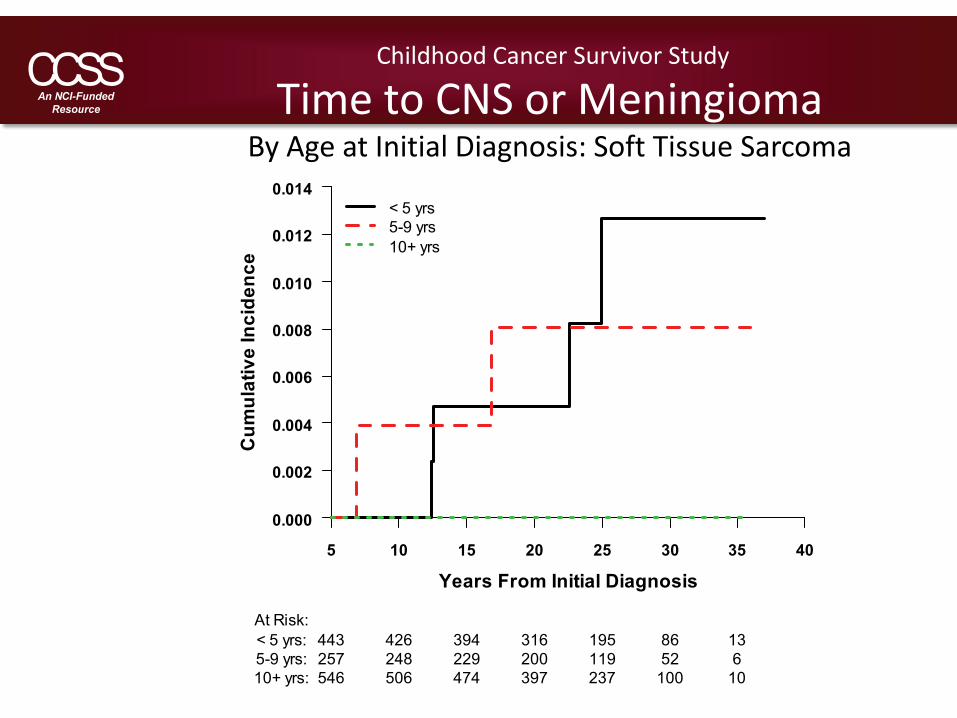
At Risk:< 5 yrs: 443 426 394 316 195 86 135-9 yrs: 257 248 229 200 119 52 610+ yrs: 546 506 474 397 237 100 10
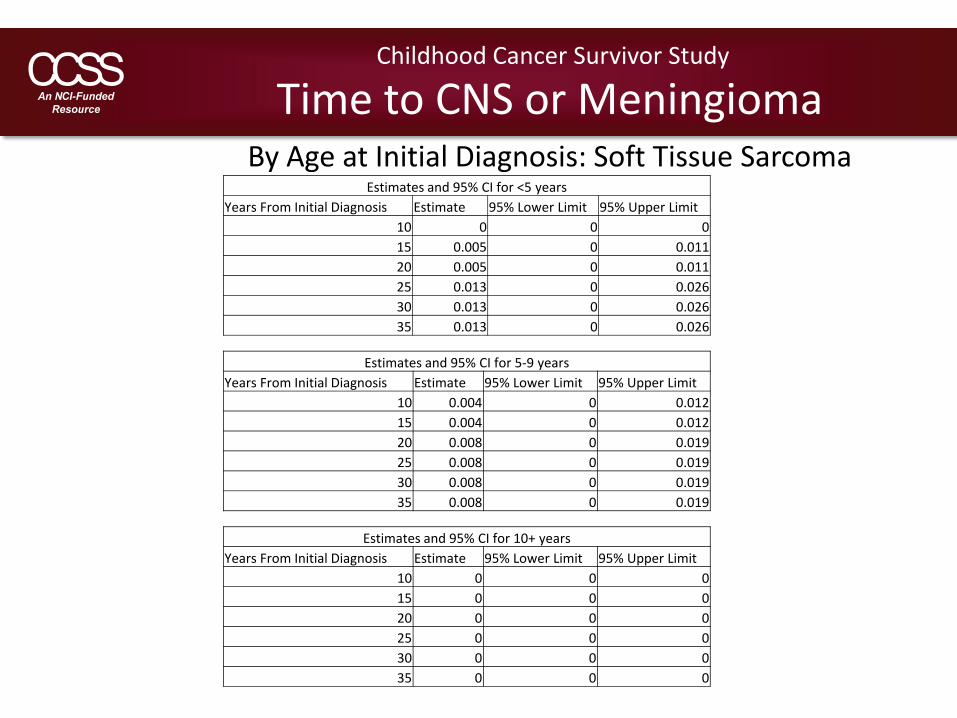
Estimates and 95% CI for <5 yearsYears From Initial Diagnosis Estimate 95% Lower Limit 95% Upper Limit
10 0 0 015 0.005 0 0.01120 0.005 0 0.01125 0.013 0 0.02630 0.013 0 0.02635 0.013 0 0.026
Estimates and 95% CI for 5‐9 yearsYears From Initial Diagnosis Estimate 95% Lower Limit 95% Upper Limit
10 0.004 0 0.01215 0.004 0 0.01220 0.008 0 0.01925 0.008 0 0.01930 0.008 0 0.01935 0.008 0 0.019
Childhood Cancer Survivor Study
Time to CNS or MeningiomaBy Age at Initial Diagnosis: Soft Tissue Sarcoma
Estimates and 95% CI for 10+ yearsYears From Initial Diagnosis Estimate 95% Lower Limit 95% Upper Limit
10 0 0 015 0 0 020 0 0 025 0 0 030 0 0 035 0 0 0
Time to CNS or MeningiomaBy Radiation Therapy: Soft Tissue Sarcoma
Childhood Cancer Survivor Study
Cum
ulat
ive
Inci
denc
e
Years From Initial Diagnosis
0.000
0.002
0.004
0.006
0.008
0.010
0.012
5 10 15 20 25 30 35 40
RTNo RT
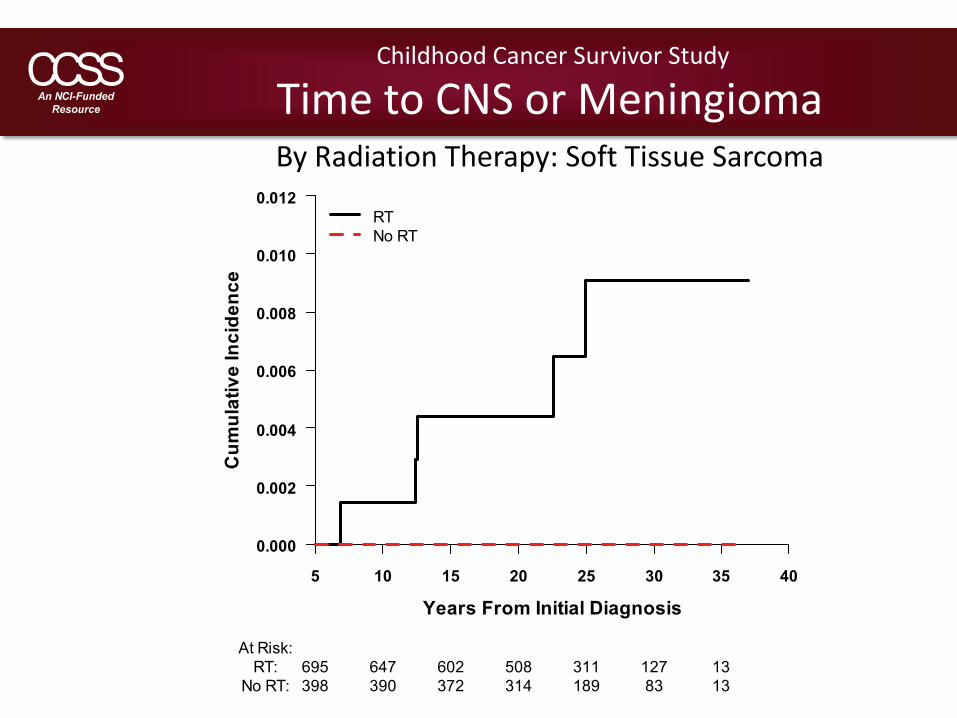
At Risk:RT: 695 647 602 508 311 127 13
No RT: 398 390 372 314 189 83 13
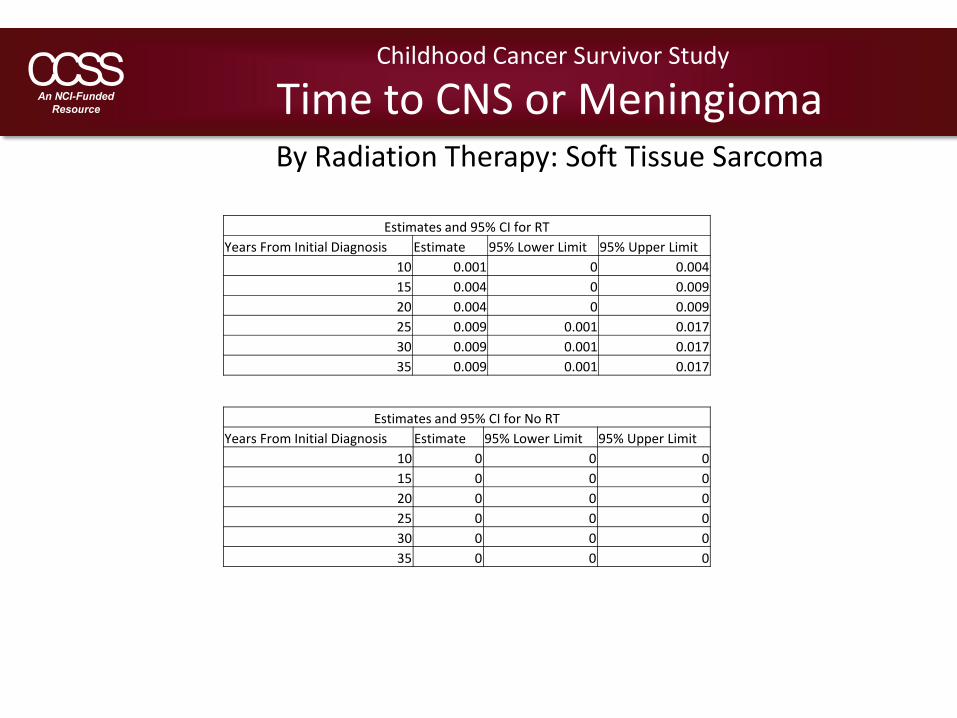
Estimates and 95% CI for RTYears From Initial Diagnosis Estimate 95% Lower Limit 95% Upper Limit
10 0.001 0 0.00415 0.004 0 0.00920 0.004 0 0.00925 0.009 0.001 0.01730 0.009 0.001 0.01735 0.009 0.001 0.017
Estimates and 95% CI for No RTYears From Initial Diagnosis Estimate 95% Lower Limit 95% Upper Limit
10 0 0 015 0 0 020 0 0 025 0 0 030 0 0 035 0 0 0
Childhood Cancer Survivor Study
Time to CNS or MeningiomaBy Radiation Therapy: Soft Tissue Sarcoma
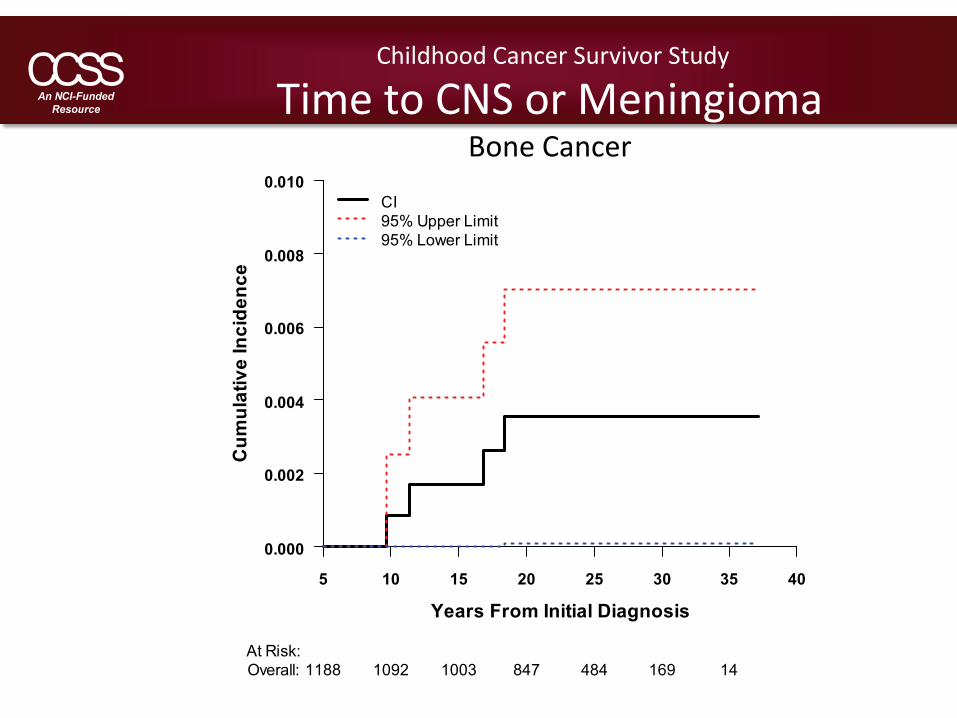
Time to CNS or MeningiomaBone Cancer
Childhood Cancer Survivor Study
Cum
ulat
ive
Inci
denc
e
Years From Initial Diagnosis
0.000
0.002
0.004
0.006
0.008
0.010
5 10 15 20 25 30 35 40
CI95% Upper Limit95% Lower Limit
At Risk:Overall: 1188 1092 1003 847 484 169 14

Childhood Cancer Survivor Study
Time to CNS or MeningiomaBone Cancer
Estimates and 95% CI for Bone CancerYears From Initial Diagnosis Estimate 95% Lower Limit 95% Upper Limit
10 0.001 0 0.00315 0.002 0 0.00420 0.004 0 0.00725 0.004 0 0.00730 0.004 0 0.00735 0.004 0 0.007
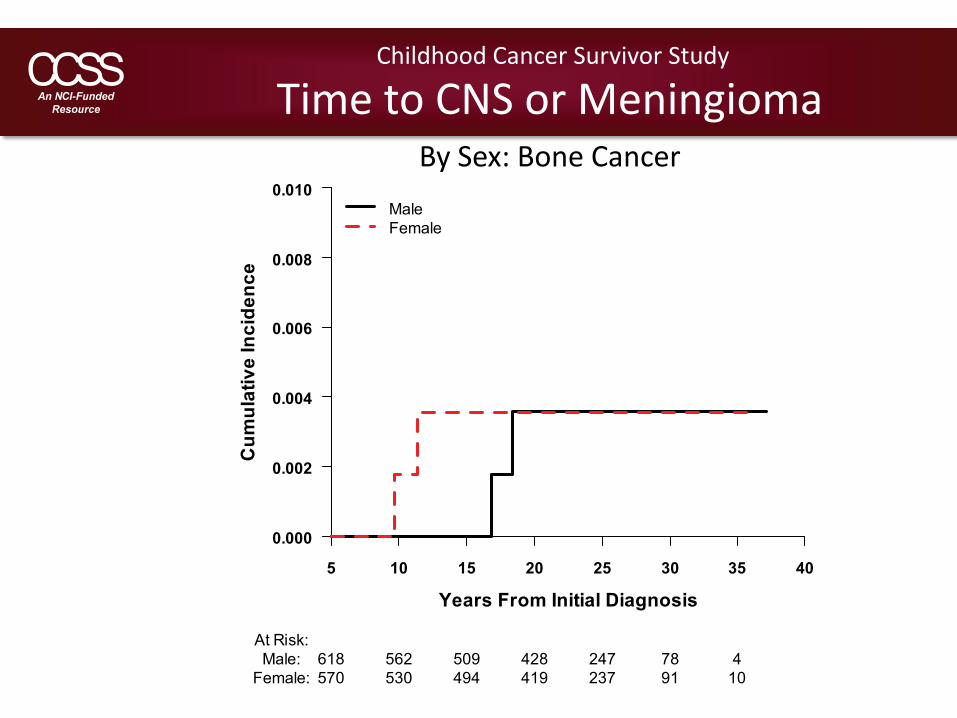
Time to CNS or MeningiomaBy Sex: Bone Cancer
Childhood Cancer Survivor Study
Cum
ulat
ive
Inci
denc
e
Years From Initial Diagnosis
0.000
0.002
0.004
0.006
0.008
0.010
5 10 15 20 25 30 35 40
MaleFemale
At Risk:Male: 618 562 509 428 247 78 4
Female: 570 530 494 419 237 91 10
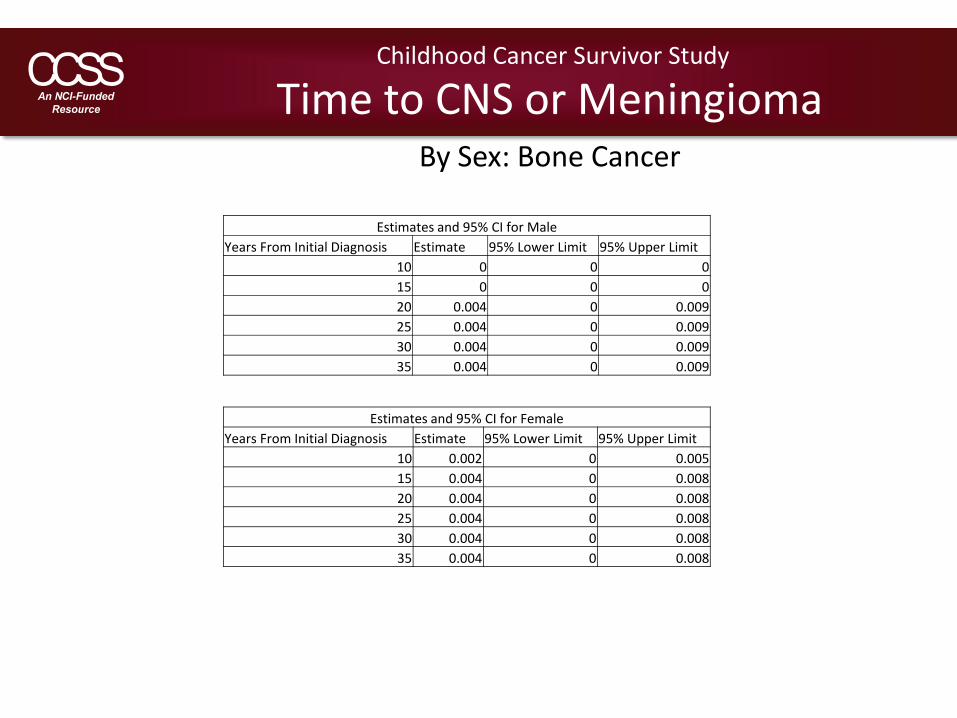
Estimates and 95% CI for MaleYears From Initial Diagnosis Estimate 95% Lower Limit 95% Upper Limit
10 0 0 015 0 0 020 0.004 0 0.00925 0.004 0 0.00930 0.004 0 0.00935 0.004 0 0.009
Estimates and 95% CI for FemaleYears From Initial Diagnosis Estimate 95% Lower Limit 95% Upper Limit
10 0.002 0 0.00515 0.004 0 0.00820 0.004 0 0.00825 0.004 0 0.00830 0.004 0 0.00835 0.004 0 0.008
Childhood Cancer Survivor Study
Time to CNS or MeningiomaBy Sex: Bone Cancer
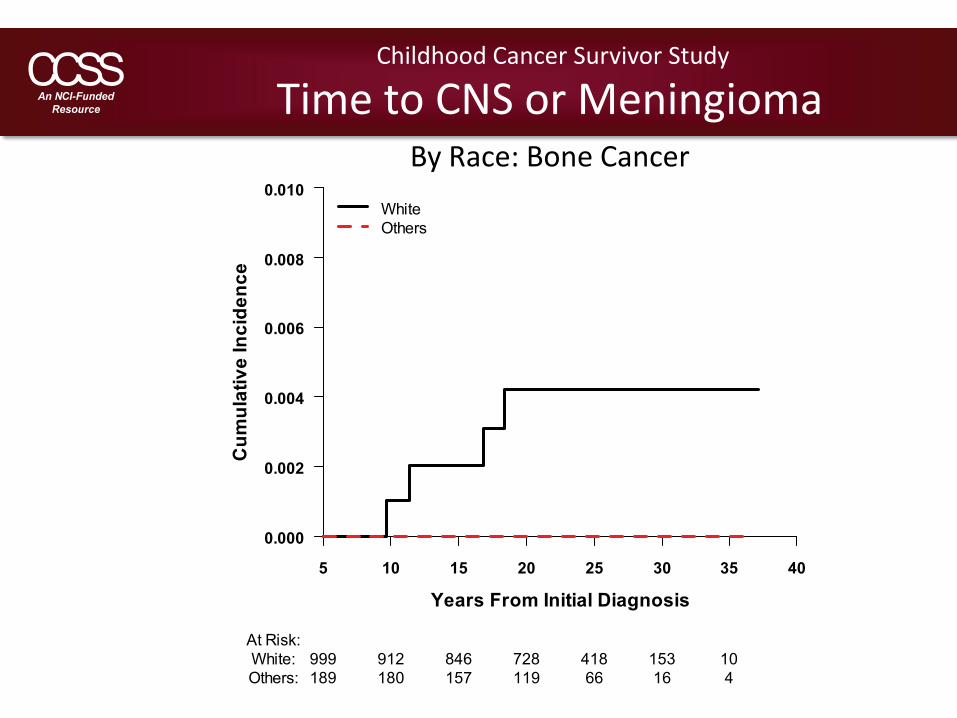
Time to CNS or MeningiomaBy Race: Bone Cancer
Childhood Cancer Survivor Study
Cum
ulat
ive
Inci
denc
e
Years From Initial Diagnosis
0.000
0.002
0.004
0.006
0.008
0.010
5 10 15 20 25 30 35 40
WhiteOthers
At Risk:White: 999 912 846 728 418 153 10Others: 189 180 157 119 66 16 4
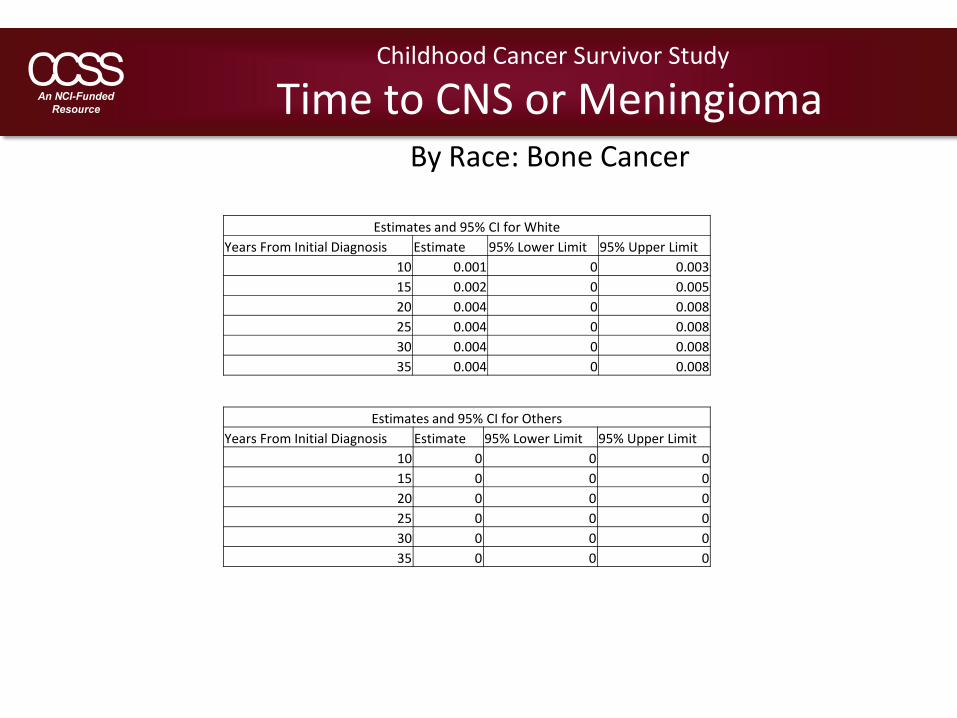
Estimates and 95% CI for WhiteYears From Initial Diagnosis Estimate 95% Lower Limit 95% Upper Limit
10 0.001 0 0.00315 0.002 0 0.00520 0.004 0 0.00825 0.004 0 0.00830 0.004 0 0.00835 0.004 0 0.008
Estimates and 95% CI for OthersYears From Initial Diagnosis Estimate 95% Lower Limit 95% Upper Limit
10 0 0 015 0 0 020 0 0 025 0 0 030 0 0 035 0 0 0
Childhood Cancer Survivor Study
Time to CNS or MeningiomaBy Race: Bone Cancer
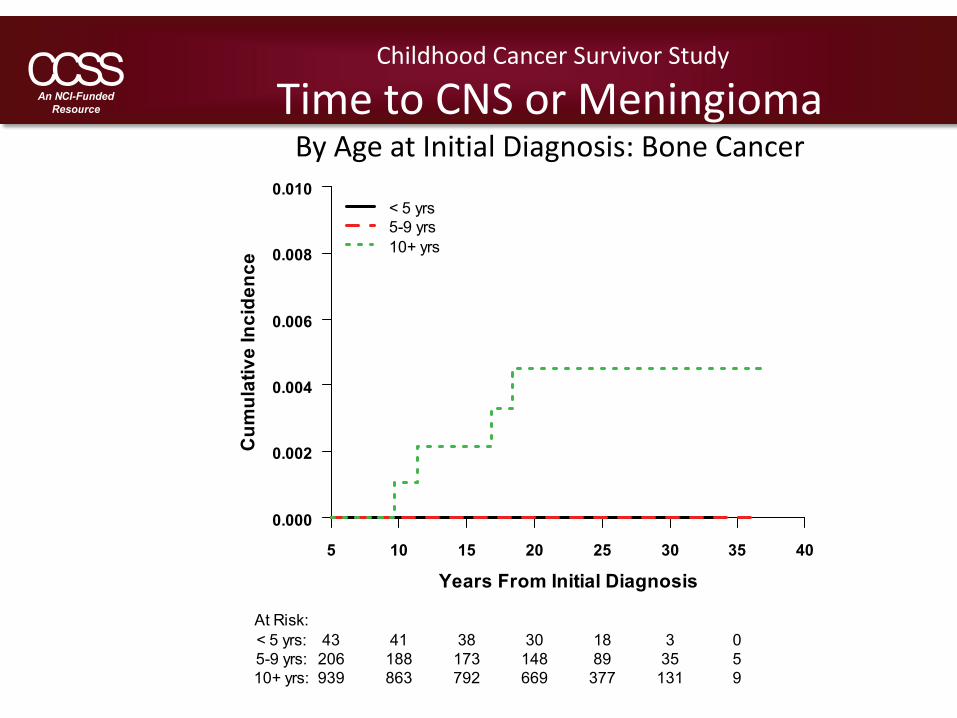
Time to CNS or MeningiomaBy Age at Initial Diagnosis: Bone Cancer
Childhood Cancer Survivor Study
Cum
ulat
ive
Inci
denc
e
Years From Initial Diagnosis
0.000
0.002
0.004
0.006
0.008
0.010
5 10 15 20 25 30 35 40
< 5 yrs5-9 yrs10+ yrs
At Risk:< 5 yrs: 43 41 38 30 18 3 05-9 yrs: 206 188 173 148 89 35 510+ yrs: 939 863 792 669 377 131 9
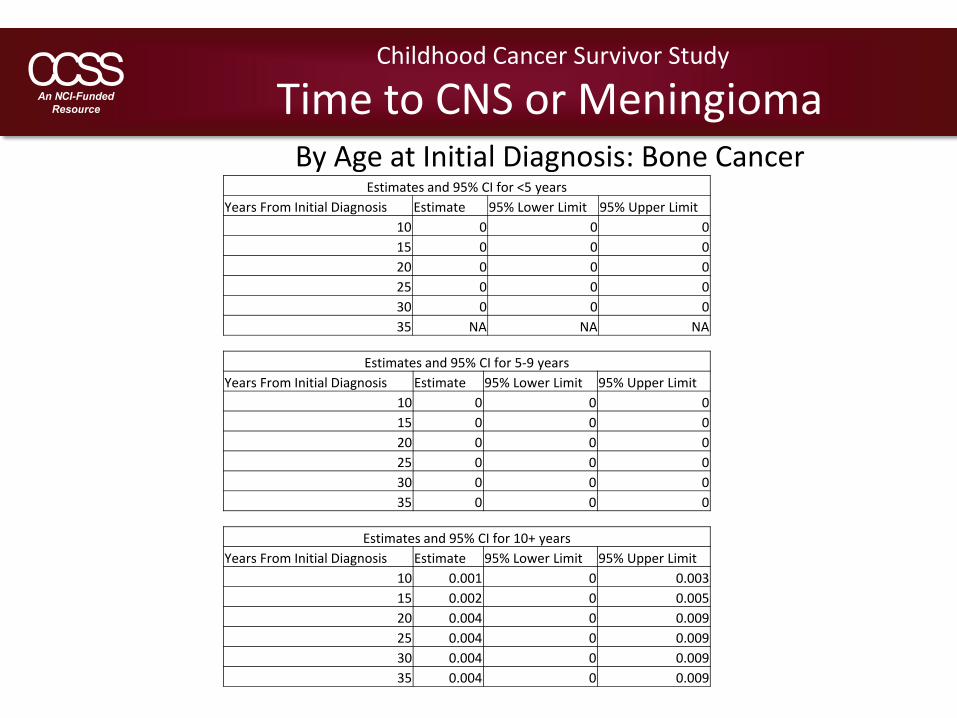
Estimates and 95% CI for <5 yearsYears From Initial Diagnosis Estimate 95% Lower Limit 95% Upper Limit
10 0 0 015 0 0 020 0 0 025 0 0 030 0 0 035 NA NA NA
Estimates and 95% CI for 5‐9 yearsYears From Initial Diagnosis Estimate 95% Lower Limit 95% Upper Limit
10 0 0 015 0 0 020 0 0 025 0 0 030 0 0 035 0 0 0
Childhood Cancer Survivor Study
Time to CNS or MeningiomaBy Age at Initial Diagnosis: Bone Cancer
Estimates and 95% CI for 10+ yearsYears From Initial Diagnosis Estimate 95% Lower Limit 95% Upper Limit
10 0.001 0 0.00315 0.002 0 0.00520 0.004 0 0.00925 0.004 0 0.00930 0.004 0 0.00935 0.004 0 0.009
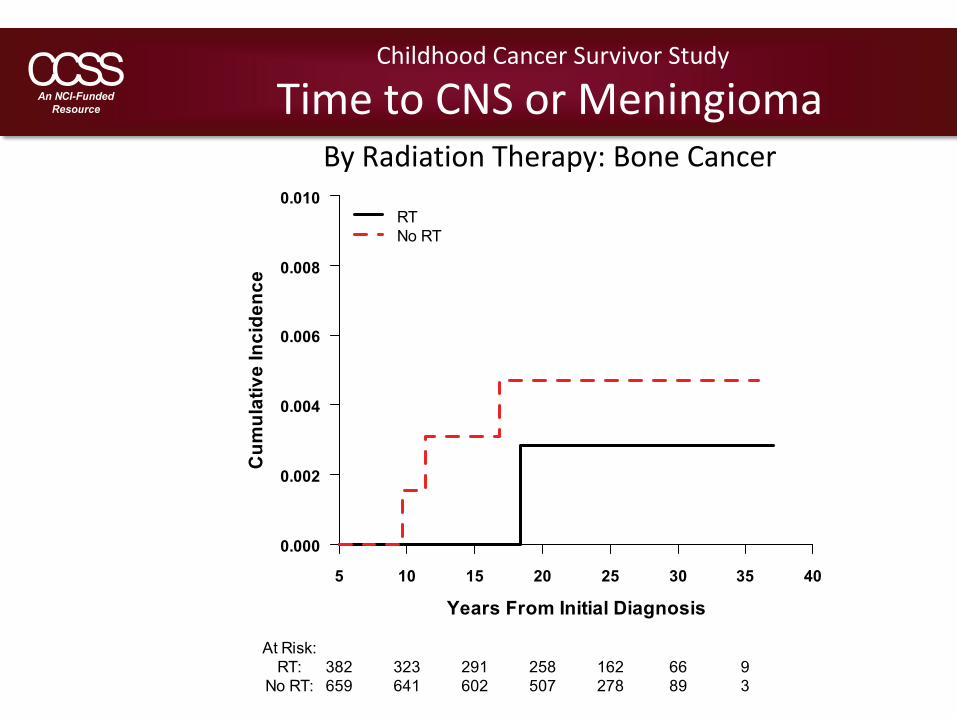
Time to CNS or MeningiomaBy Radiation Therapy: Bone Cancer
Childhood Cancer Survivor Study
Cum
ulat
ive
Inci
denc
e
Years From Initial Diagnosis
0.000
0.002
0.004
0.006
0.008
0.010
5 10 15 20 25 30 35 40
RTNo RT
At Risk:RT: 382 323 291 258 162 66 9
No RT: 659 641 602 507 278 89 3
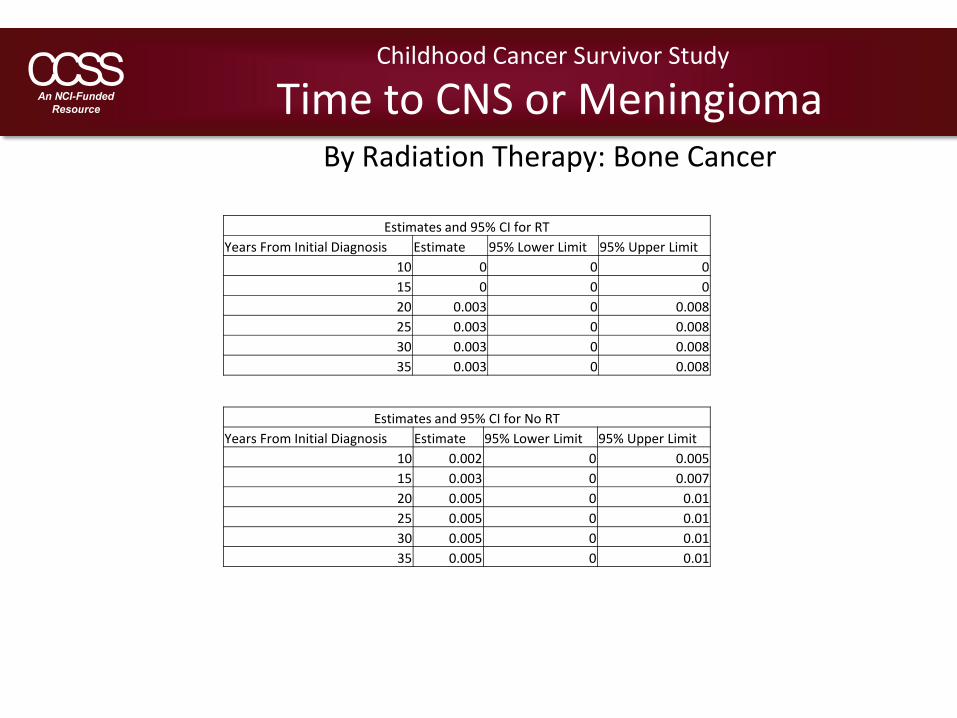
Estimates and 95% CI for RTYears From Initial Diagnosis Estimate 95% Lower Limit 95% Upper Limit
10 0 0 015 0 0 020 0.003 0 0.00825 0.003 0 0.00830 0.003 0 0.00835 0.003 0 0.008
Estimates and 95% CI for No RTYears From Initial Diagnosis Estimate 95% Lower Limit 95% Upper Limit
10 0.002 0 0.00515 0.003 0 0.00720 0.005 0 0.0125 0.005 0 0.0130 0.005 0 0.0135 0.005 0 0.01
Childhood Cancer Survivor Study
Time to CNS or MeningiomaBy Radiation Therapy: Bone Cancer
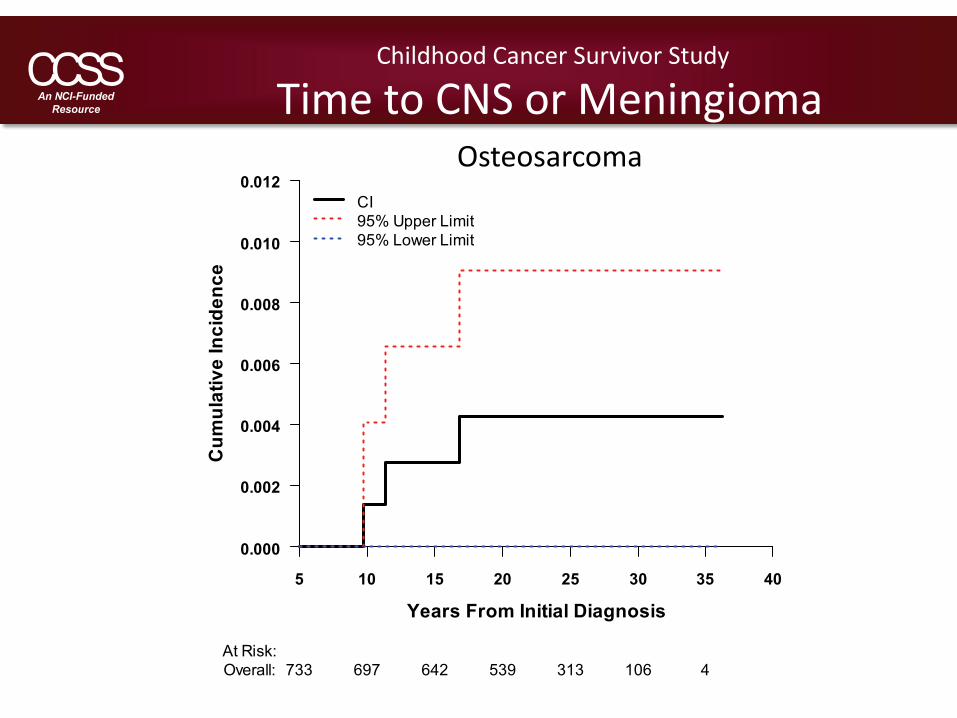
Time to CNS or MeningiomaOsteosarcoma
Childhood Cancer Survivor Study
Cum
ulat
ive
Inci
denc
e
Years From Initial Diagnosis
0.000
0.002
0.004
0.006
0.008
0.010
0.012
5 10 15 20 25 30 35 40
CI95% Upper Limit95% Lower Limit
At Risk:Overall: 733 697 642 539 313 106 4

Childhood Cancer Survivor Study
Time to CNS or MeningiomaOsteosarcoma
Estimates and 95% CI for OsteosarcomaYears From Initial Diagnosis Estimate 95% Lower Limit 95% Upper Limit
10 0.001 0 0.00415 0.003 0 0.00720 0.004 0 0.00925 0.004 0 0.00930 0.004 0 0.00935 0.004 0 0.009
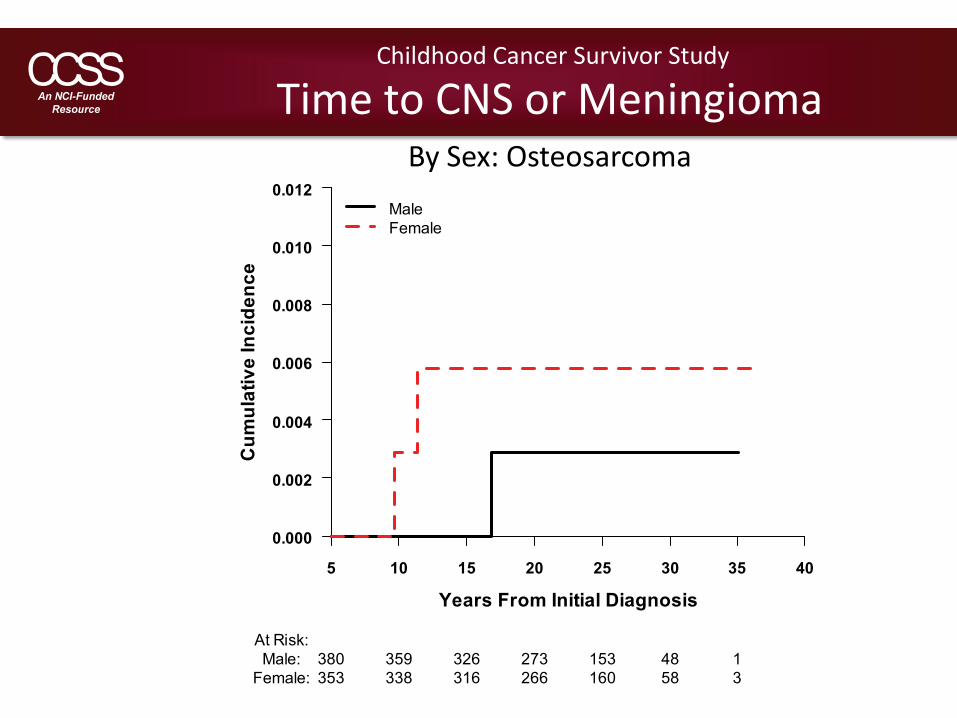
Time to CNS or MeningiomaBy Sex: Osteosarcoma
Childhood Cancer Survivor Study
Cum
ulat
ive
Inci
denc
e
Years From Initial Diagnosis
0.000
0.002
0.004
0.006
0.008
0.010
0.012
5 10 15 20 25 30 35 40
MaleFemale
At Risk:Male: 380 359 326 273 153 48 1
Female: 353 338 316 266 160 58 3
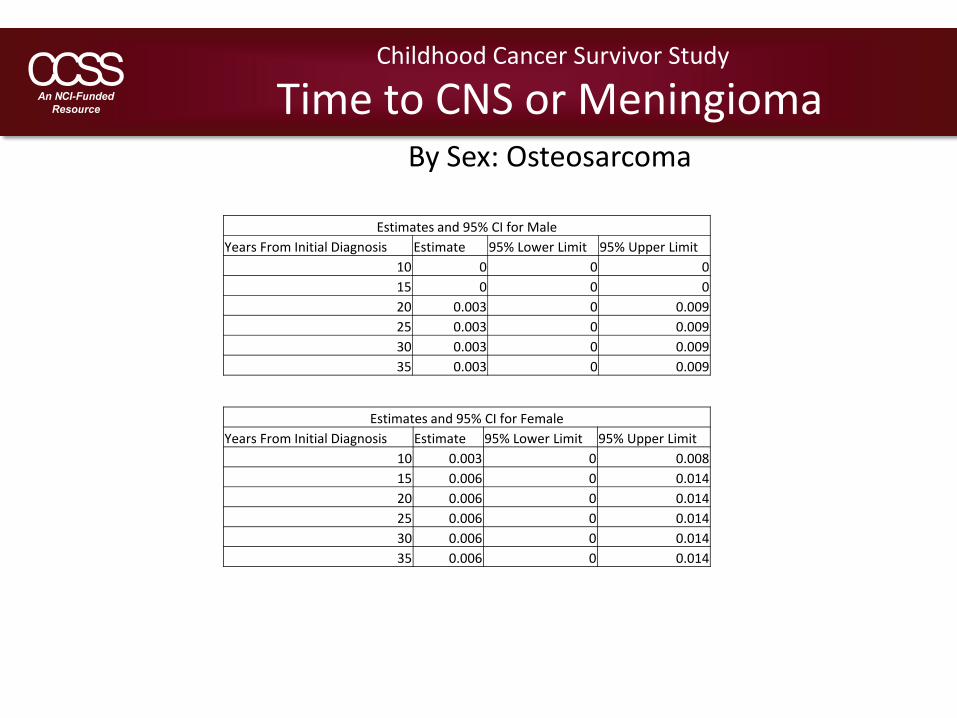
Estimates and 95% CI for MaleYears From Initial Diagnosis Estimate 95% Lower Limit 95% Upper Limit
10 0 0 015 0 0 020 0.003 0 0.00925 0.003 0 0.00930 0.003 0 0.00935 0.003 0 0.009
Estimates and 95% CI for FemaleYears From Initial Diagnosis Estimate 95% Lower Limit 95% Upper Limit
10 0.003 0 0.00815 0.006 0 0.01420 0.006 0 0.01425 0.006 0 0.01430 0.006 0 0.01435 0.006 0 0.014
Childhood Cancer Survivor Study
Time to CNS or MeningiomaBy Sex: Osteosarcoma
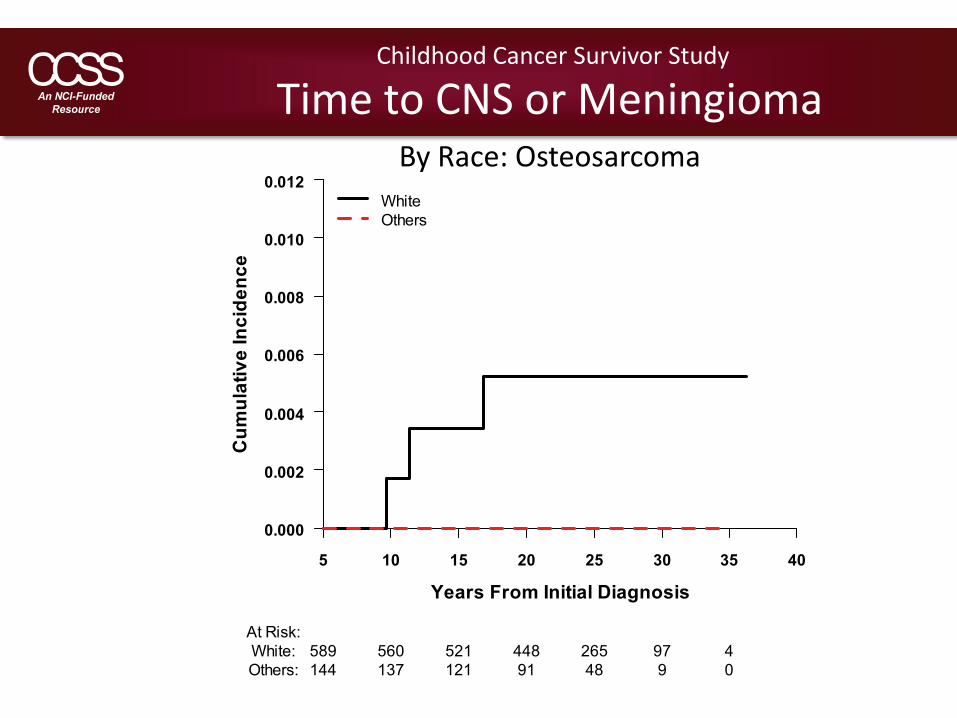
Time to CNS or MeningiomaBy Race: Osteosarcoma
Childhood Cancer Survivor Study
Cum
ulat
ive
Inci
denc
e
Years From Initial Diagnosis
0.000
0.002
0.004
0.006
0.008
0.010
0.012
5 10 15 20 25 30 35 40
WhiteOthers
At Risk:White: 589 560 521 448 265 97 4Others: 144 137 121 91 48 9 0
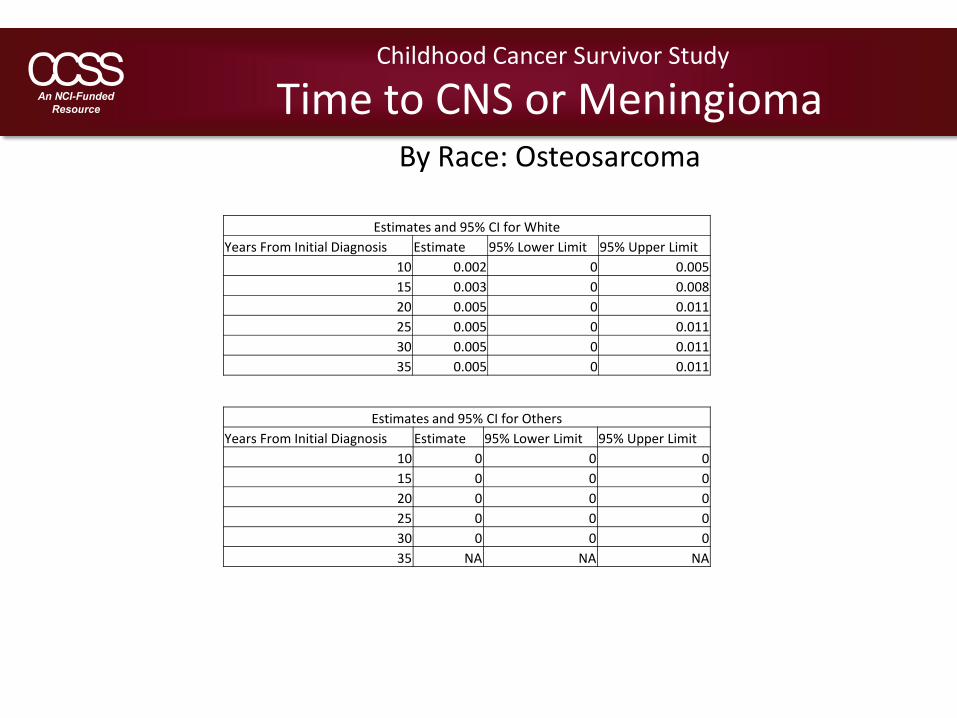
Estimates and 95% CI for WhiteYears From Initial Diagnosis Estimate 95% Lower Limit 95% Upper Limit
10 0.002 0 0.00515 0.003 0 0.00820 0.005 0 0.01125 0.005 0 0.01130 0.005 0 0.01135 0.005 0 0.011
Estimates and 95% CI for OthersYears From Initial Diagnosis Estimate 95% Lower Limit 95% Upper Limit
10 0 0 015 0 0 020 0 0 025 0 0 030 0 0 035 NA NA NA
Childhood Cancer Survivor Study
Time to CNS or MeningiomaBy Race: Osteosarcoma
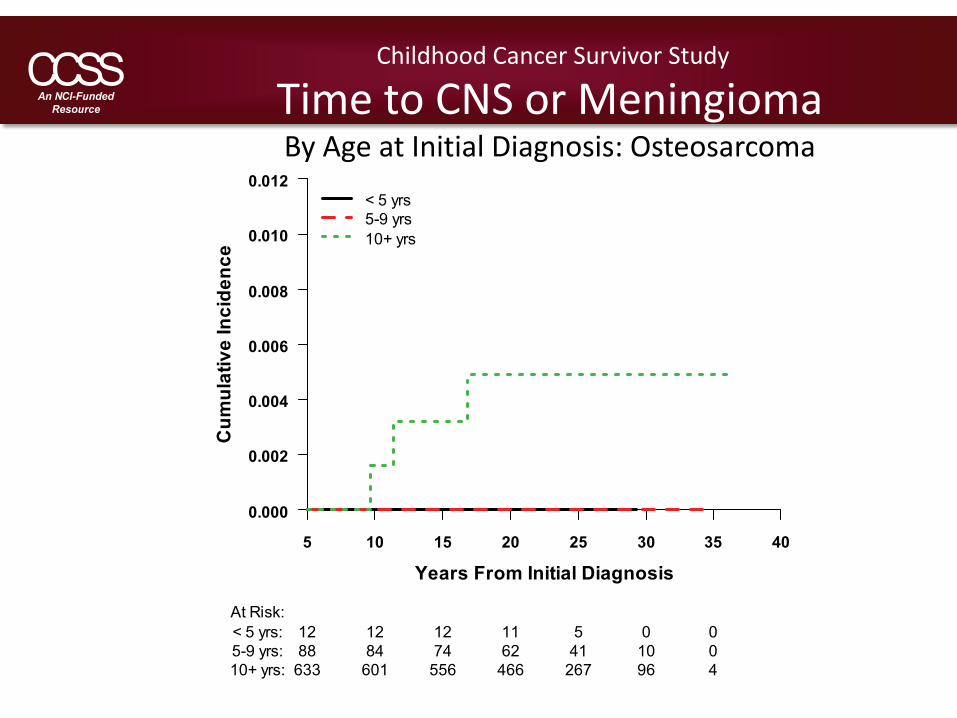
Time to CNS or MeningiomaBy Age at Initial Diagnosis: Osteosarcoma
Childhood Cancer Survivor Study
Cum
ulat
ive
Inci
denc
e
Years From Initial Diagnosis
0.000
0.002
0.004
0.006
0.008
0.010
0.012
5 10 15 20 25 30 35 40
< 5 yrs5-9 yrs10+ yrs
At Risk:< 5 yrs: 12 12 12 11 5 0 05-9 yrs: 88 84 74 62 41 10 010+ yrs: 633 601 556 466 267 96 4
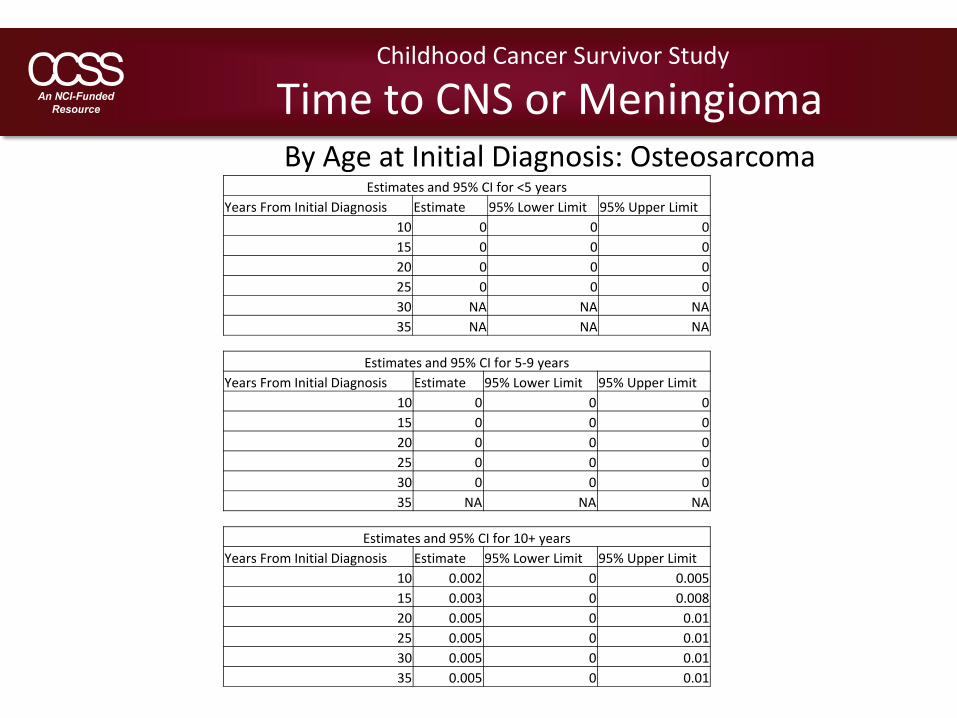
Estimates and 95% CI for <5 yearsYears From Initial Diagnosis Estimate 95% Lower Limit 95% Upper Limit
10 0 0 015 0 0 020 0 0 025 0 0 030 NA NA NA35 NA NA NA
Estimates and 95% CI for 5‐9 yearsYears From Initial Diagnosis Estimate 95% Lower Limit 95% Upper Limit
10 0 0 015 0 0 020 0 0 025 0 0 030 0 0 035 NA NA NA
Childhood Cancer Survivor Study
Time to CNS or MeningiomaBy Age at Initial Diagnosis: Osteosarcoma
Estimates and 95% CI for 10+ yearsYears From Initial Diagnosis Estimate 95% Lower Limit 95% Upper Limit
10 0.002 0 0.00515 0.003 0 0.00820 0.005 0 0.0125 0.005 0 0.0130 0.005 0 0.0135 0.005 0 0.01
Time to CNS or MeningiomaBy Radiation Therapy: Osteosarcoma
Childhood Cancer Survivor Study
Cum
ulat
ive
Inci
denc
e
Years From Initial Diagnosis
0.000
0.002
0.004
0.006
0.008
0.010
0.012
5 10 15 20 25 30 35 40
RTNo RT
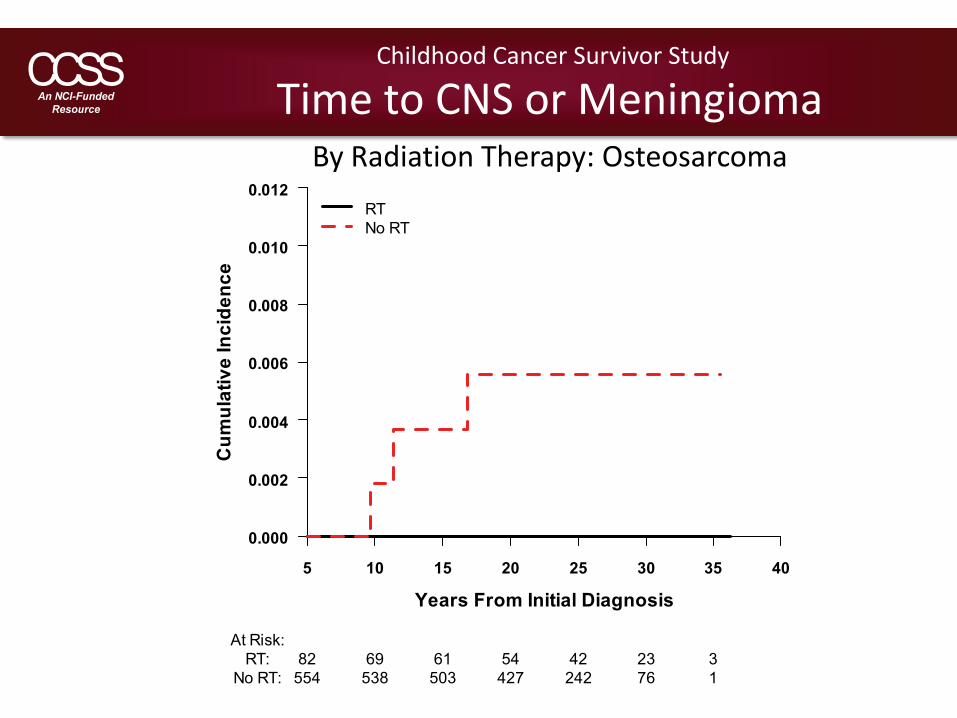
At Risk:RT: 82 69 61 54 42 23 3
No RT: 554 538 503 427 242 76 1

Estimates and 95% CI for RTYears From Initial Diagnosis Estimate 95% Lower Limit 95% Upper Limit
10 0 0 015 0 0 020 0 0 025 0 0 030 0 0 035 0 0 0
Estimates and 95% CI for No RTYears From Initial Diagnosis Estimate 95% Lower Limit 95% Upper Limit
10 0.002 0 0.00515 0.004 0 0.00920 0.006 0 0.01225 0.006 0 0.01230 0.006 0 0.01235 0.006 0 0.012
Childhood Cancer Survivor Study
Time to CNS or MeningiomaBy Radiation Therapy: Osteosarcoma
Time to CNS or MeningiomaEwings Sarcoma
Childhood Cancer Survivor Study
Cum
ulat
ive
Inci
denc
e
Years From Initial Diagnosis
0.000
0.002
0.004
0.006
0.008
0.010
5 10 15 20 25 30 35 40
CI95% Upper Limit95% Lower Limit
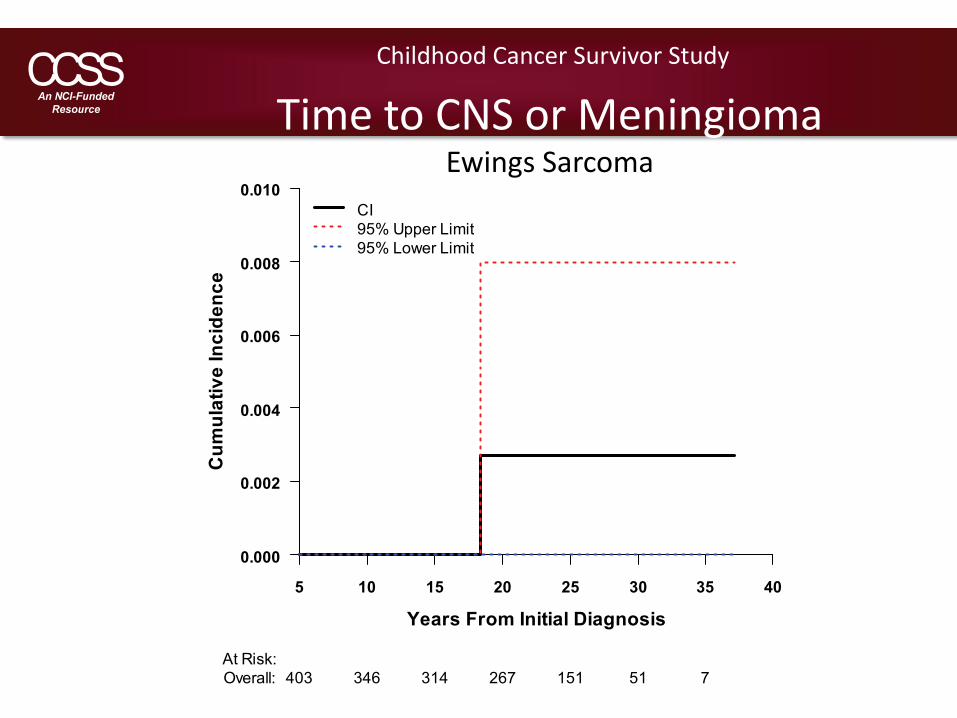
At Risk:Overall: 403 346 314 267 151 51 7
Childhood Cancer Survivor Study
Time to CNS or MeningiomaEwings Sarcoma
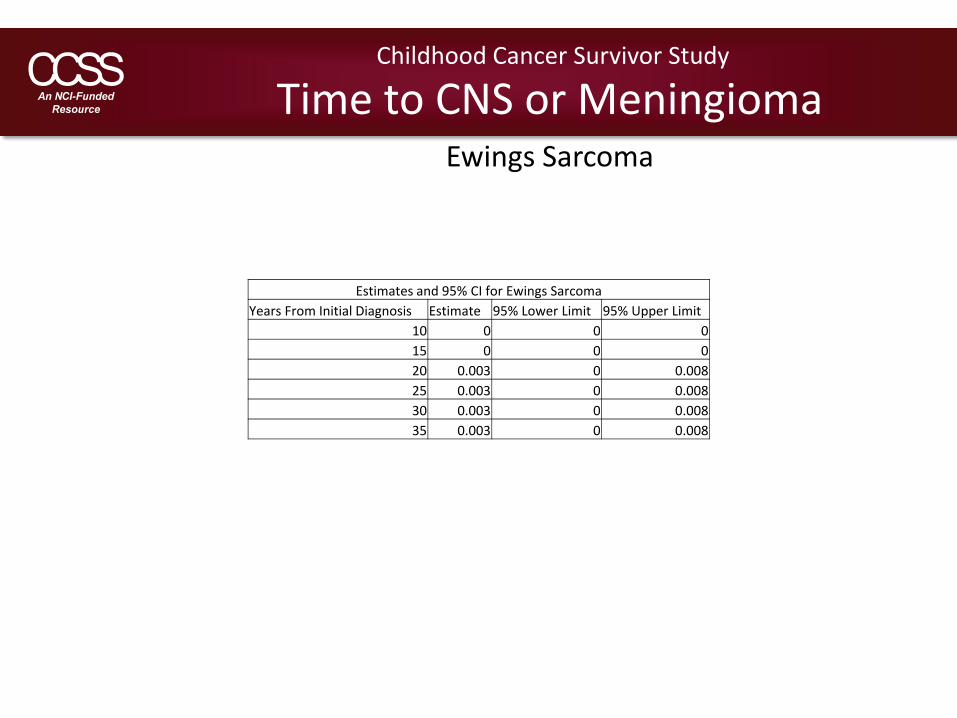
Estimates and 95% CI for Ewings SarcomaYears From Initial Diagnosis Estimate 95% Lower Limit 95% Upper Limit
10 0 0 015 0 0 020 0.003 0 0.00825 0.003 0 0.00830 0.003 0 0.00835 0.003 0 0.008
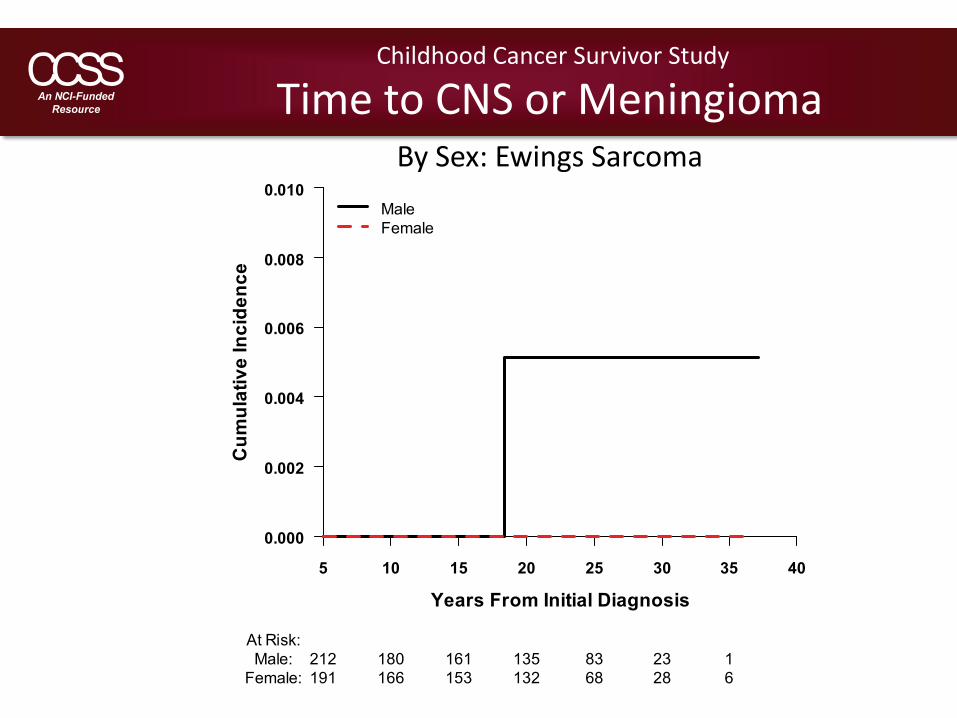
Time to CNS or MeningiomaBy Sex: Ewings Sarcoma
Childhood Cancer Survivor Study
Cum
ulat
ive
Inci
denc
e
Years From Initial Diagnosis
0.000
0.002
0.004
0.006
0.008
0.010
5 10 15 20 25 30 35 40
MaleFemale
At Risk:Male: 212 180 161 135 83 23 1
Female: 191 166 153 132 68 28 6

Estimates and 95% CI for MaleYears From Initial Diagnosis Estimate 95% Lower Limit 95% Upper Limit
10 0 0 015 0 0 020 0.005 0 0.01525 0.005 0 0.01530 0.005 0 0.01535 0.005 0 0.015
Estimates and 95% CI for FemaleYears From Initial Diagnosis Estimate 95% Lower Limit 95% Upper Limit
10 0 0 015 0 0 020 0 0 025 0 0 030 0 0 035 0 0 0
Childhood Cancer Survivor Study
Time to CNS or MeningiomaBy Sex: Ewings Sarcoma
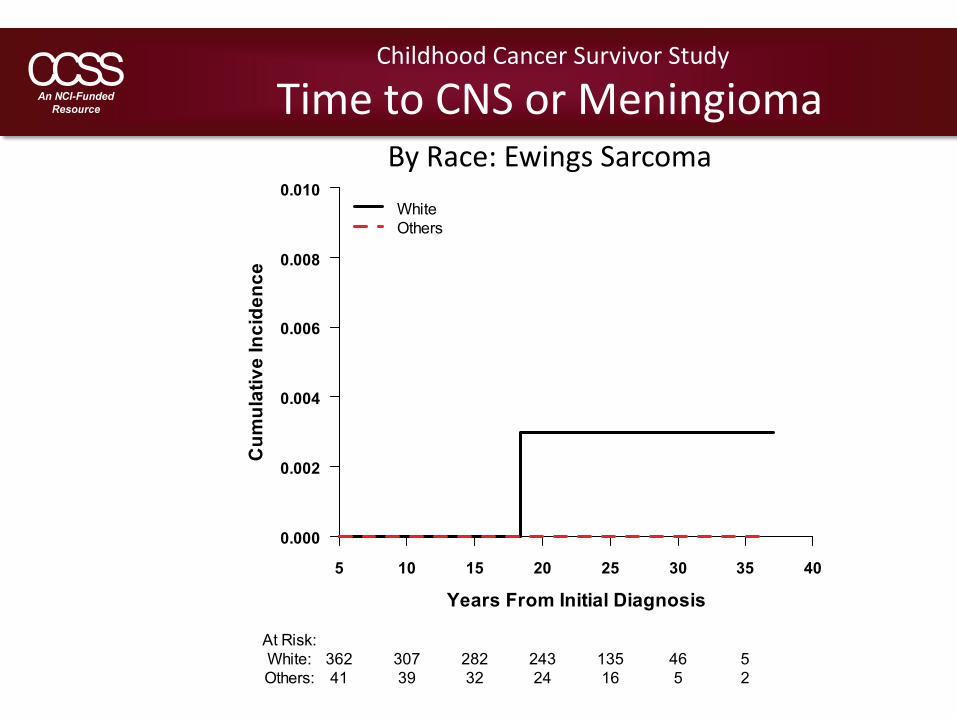
Time to CNS or MeningiomaBy Race: Ewings Sarcoma
Childhood Cancer Survivor Study
Cum
ulat
ive
Inci
denc
e
Years From Initial Diagnosis
0.000
0.002
0.004
0.006
0.008
0.010
5 10 15 20 25 30 35 40
WhiteOthers
At Risk:White: 362 307 282 243 135 46 5Others: 41 39 32 24 16 5 2
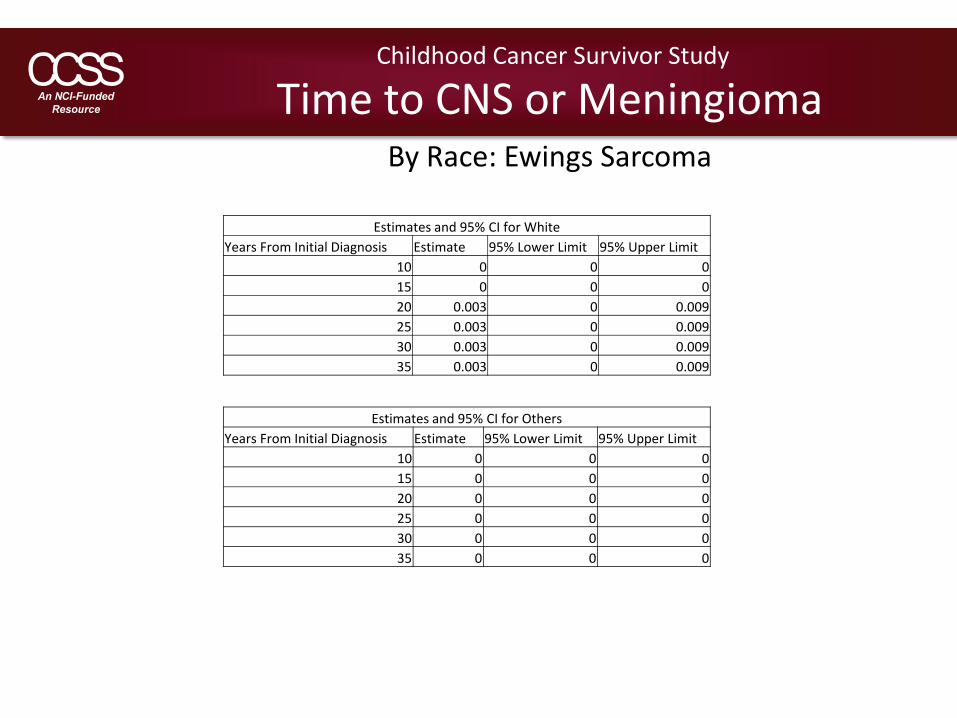
Estimates and 95% CI for WhiteYears From Initial Diagnosis Estimate 95% Lower Limit 95% Upper Limit
10 0 0 015 0 0 020 0.003 0 0.00925 0.003 0 0.00930 0.003 0 0.00935 0.003 0 0.009
Estimates and 95% CI for OthersYears From Initial Diagnosis Estimate 95% Lower Limit 95% Upper Limit
10 0 0 015 0 0 020 0 0 025 0 0 030 0 0 035 0 0 0
Childhood Cancer Survivor Study
Time to CNS or MeningiomaBy Race: Ewings Sarcoma
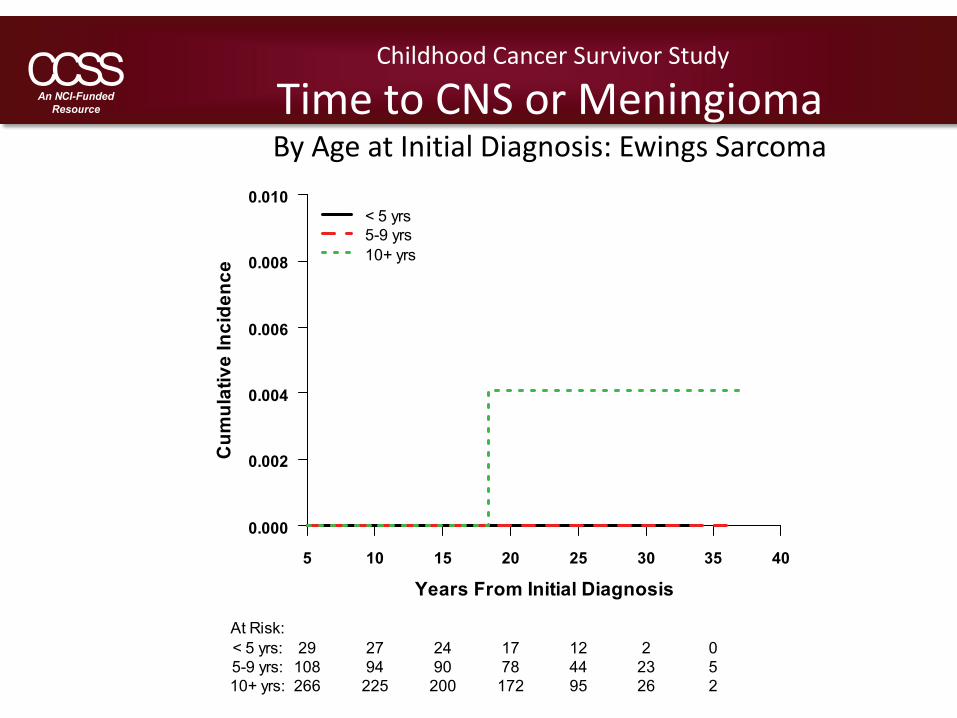
Time to CNS or MeningiomaBy Age at Initial Diagnosis: Ewings Sarcoma
Childhood Cancer Survivor Study
Cum
ulat
ive
Inci
denc
e
Years From Initial Diagnosis
0.000
0.002
0.004
0.006
0.008
0.010
5 10 15 20 25 30 35 40
< 5 yrs5-9 yrs10+ yrs
At Risk:< 5 yrs: 29 27 24 17 12 2 05-9 yrs: 108 94 90 78 44 23 510+ yrs: 266 225 200 172 95 26 2
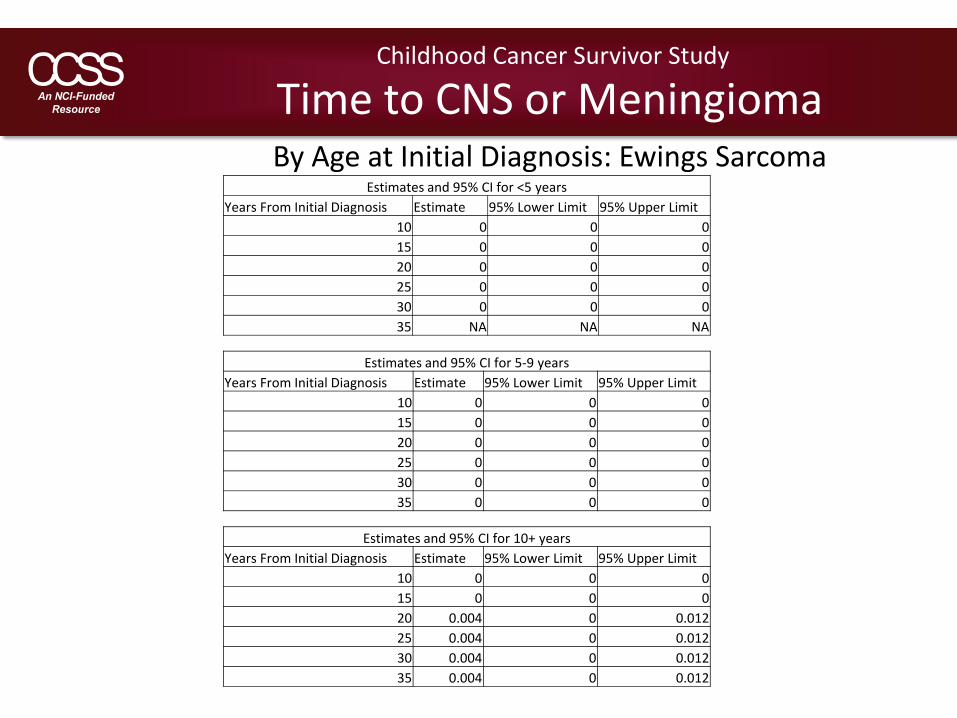
Estimates and 95% CI for <5 yearsYears From Initial Diagnosis Estimate 95% Lower Limit 95% Upper Limit
10 0 0 015 0 0 020 0 0 025 0 0 030 0 0 035 NA NA NA
Estimates and 95% CI for 5‐9 yearsYears From Initial Diagnosis Estimate 95% Lower Limit 95% Upper Limit
10 0 0 015 0 0 020 0 0 025 0 0 030 0 0 035 0 0 0
Childhood Cancer Survivor Study
Time to CNS or MeningiomaBy Age at Initial Diagnosis: Ewings Sarcoma
Estimates and 95% CI for 10+ yearsYears From Initial Diagnosis Estimate 95% Lower Limit 95% Upper Limit
10 0 0 015 0 0 020 0.004 0 0.01225 0.004 0 0.01230 0.004 0 0.01235 0.004 0 0.012
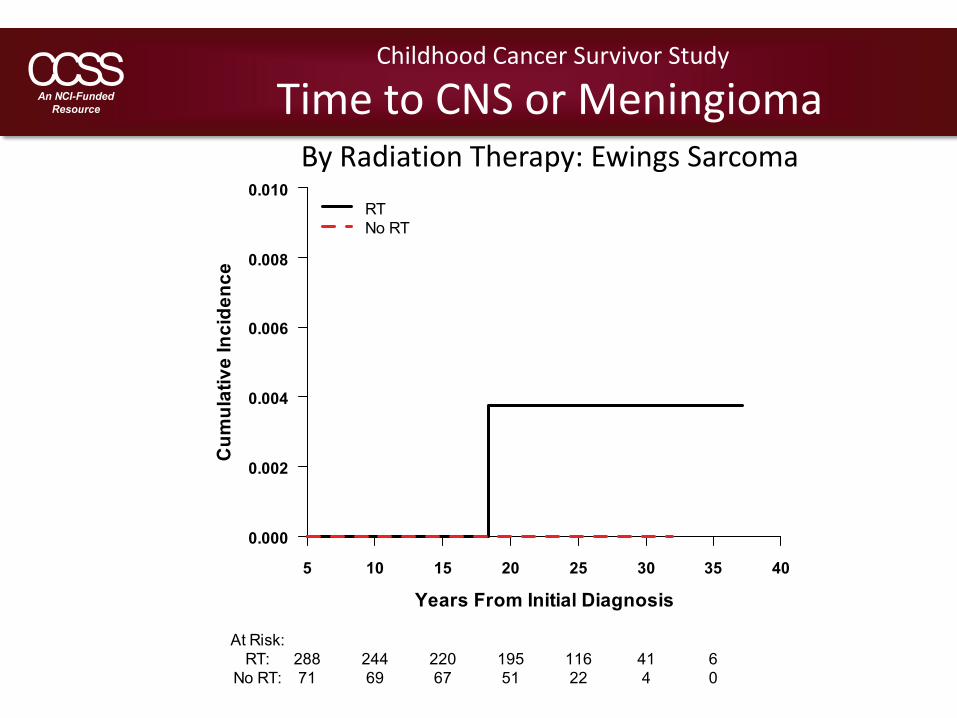
Time to CNS or MeningiomaBy Radiation Therapy: Ewings Sarcoma
Childhood Cancer Survivor Study
Cum
ulat
ive
Inci
denc
e
Years From Initial Diagnosis
0.000
0.002
0.004
0.006
0.008
0.010
5 10 15 20 25 30 35 40
RTNo RT
At Risk:RT: 288 244 220 195 116 41 6
No RT: 71 69 67 51 22 4 0
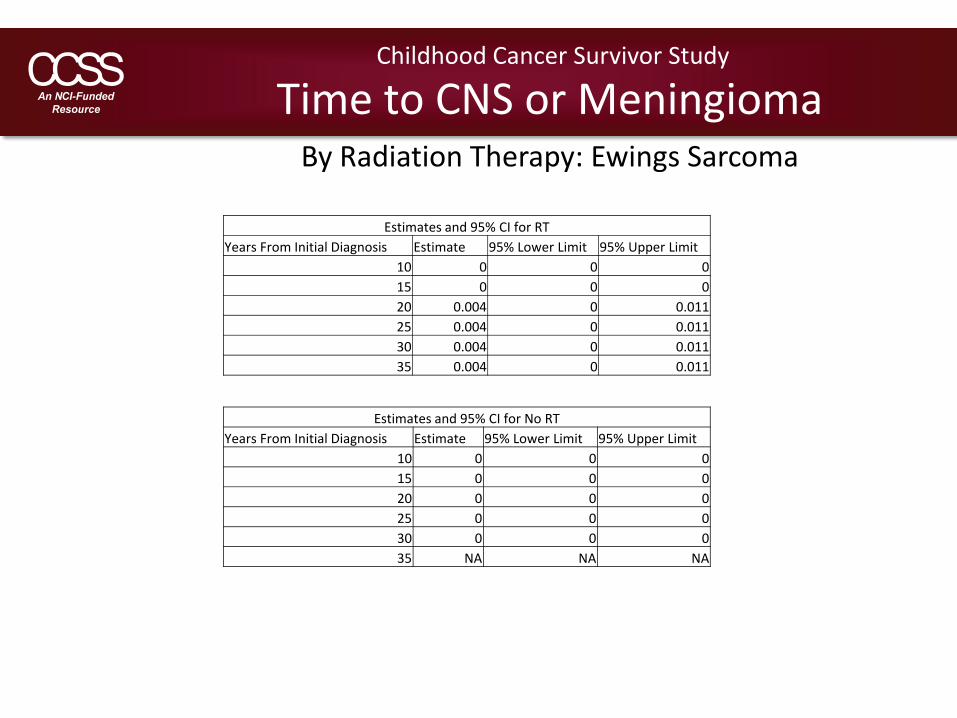
Estimates and 95% CI for RTYears From Initial Diagnosis Estimate 95% Lower Limit 95% Upper Limit
10 0 0 015 0 0 020 0.004 0 0.01125 0.004 0 0.01130 0.004 0 0.01135 0.004 0 0.011
Estimates and 95% CI for No RTYears From Initial Diagnosis Estimate 95% Lower Limit 95% Upper Limit
10 0 0 015 0 0 020 0 0 025 0 0 030 0 0 035 NA NA NA
Childhood Cancer Survivor Study
Time to CNS or MeningiomaBy Radiation Therapy: Ewings Sarcoma


![A Case of Benign Meningioma Presented with Subdural Hemorrhage · Meningioma with Subdural Hemorrhage Martínez-Lage et al. [4] studied 57 cases of meningioma with hemorrhagic onset](https://img.pdfslide.us/doc/110x75/5eca99262fcc5c7ee06897d3/a-case-of-benign-meningioma-presented-with-subdural-hemorrhage-meningioma-with-subdural.jpg)


![Case Report Anaplastic meningioma: a case report and ... · Meningioma is the most common intracranial brain tumor, accounting for over one-third of primary brain neoplasms [3]. Meningioma](https://img.pdfslide.us/doc/110x75/5f0d4eca7e708231d439b3ab/case-report-anaplastic-meningioma-a-case-report-and-meningioma-is-the-most.jpg)