Embed Size (px)
Citation preview

Childcare Choices and Child
Development: a Cross-Country Analysis1
Daniela Del Boca, Christopher Flinn, Daniela Piazzalunga,
Chiara Pronzato, Giuseppe Sorrenti, Matthew Wiswall
Daniela Del Boca, Chiara Pronzato
University of Torino and CHILD-Collegio Carlo Alberto
Christopher Flinn
New York University and CHILD-Collegio Carlo Alberto
Daniela Piazzalunga
FBK-IRVAPP and CHILD-Collegio Carlo Alberto
Giuseppe Sorrenti
University of Zurich and CHILD-Collegio Carlo Alberto
Matthew Wiswall
University of WisconsinMadison and CHILD-Collegio Carlo Alberto
1We acknowledge the support by Fondazione Rodolfo Debenedetti, as well as the comments by LucaFlabbi and Matt Dickson and by participants to the 2016 XVIII European Conference Child Care Policiesin Siracusa. Collegio Carlo Alberto also provided technical and economic support.

Contents
1. Childcare and Child Cognitive Outcomes in the US, the UK and
Italy 1
1.1. Introduction . . . . . . . . . . . . . . . . . . . . . . . . . . . . . . . 1
1.2. The economic approach to childcare . . . . . . . . . . . . . . . . . . 3
1.3. Literature . . . . . . . . . . . . . . . . . . . . . . . . . . . . . . . . 7
1.4. Conclusions and policy implications . . . . . . . . . . . . . . . . . . 11
2. Parental Childcare and Child Development 13
2.1. Introduction . . . . . . . . . . . . . . . . . . . . . . . . . . . . . . . 13
2.2. Parental Time Allocation . . . . . . . . . . . . . . . . . . . . . . . . 14
2.3. Productivity of Parental Time . . . . . . . . . . . . . . . . . . . . . 18
2.4. Policy Analysis . . . . . . . . . . . . . . . . . . . . . . . . . . . . . 23
2.5. Childcare . . . . . . . . . . . . . . . . . . . . . . . . . . . . . . . . 25
2.6. Conclusion . . . . . . . . . . . . . . . . . . . . . . . . . . . . . . . . 29
3. Formal Childcare and Child Outcomes 30
3.1. Introduction . . . . . . . . . . . . . . . . . . . . . . . . . . . . . . . 30
3.2. Methodology . . . . . . . . . . . . . . . . . . . . . . . . . . . . . . 32
3.3. Data . . . . . . . . . . . . . . . . . . . . . . . . . . . . . . . . . . . 35
3.4. Empirical Results . . . . . . . . . . . . . . . . . . . . . . . . . . . . 38
3.5. Conclusion . . . . . . . . . . . . . . . . . . . . . . . . . . . . . . . . 43
Appendix 3.A. The cognitive outcomes . . . . . . . . . . . . . . . . . . . 46
4. Childcare Related Outcomes and the Role of Selection Criteria 48
4.1. Introduction . . . . . . . . . . . . . . . . . . . . . . . . . . . . . . . 48
i

4.2. The Italian childcare system . . . . . . . . . . . . . . . . . . . . . . 49
4.3. Childcare and maternal employment . . . . . . . . . . . . . . . . . 51
4.4. Childcare and children’s outcomes . . . . . . . . . . . . . . . . . . . 53
4.5. The role of selection criteria . . . . . . . . . . . . . . . . . . . . . . 55
4.6. Conclusion . . . . . . . . . . . . . . . . . . . . . . . . . . . . . . . . 66
Appendix 4.A. The public childcare system in Italy . . . . . . . . . . . . 67
Appendix 4.B. Selection criteria in public childcare:
Typology of criteria . . . . . . . . . . . . . . . . . . . . . . . . . . . 68
References 69
ii
1 Childcare and Child Cognitive
Outcomes in the US, the UK
and Italy
Daniela Del Boca
1.1 Introduction
Child development is the outcome of a production process in which the main
inputs come from parents, formal and informal childcare providers, sometimes
relatives, and schools. Especially when children are young, empirical evidence
indicates that mothers’ care is the most valuable input. In the last few decades,
mothers’ employments rate have increased markedly, raising concern that this
may result in decreased time spent with children and lower rates of cognitive
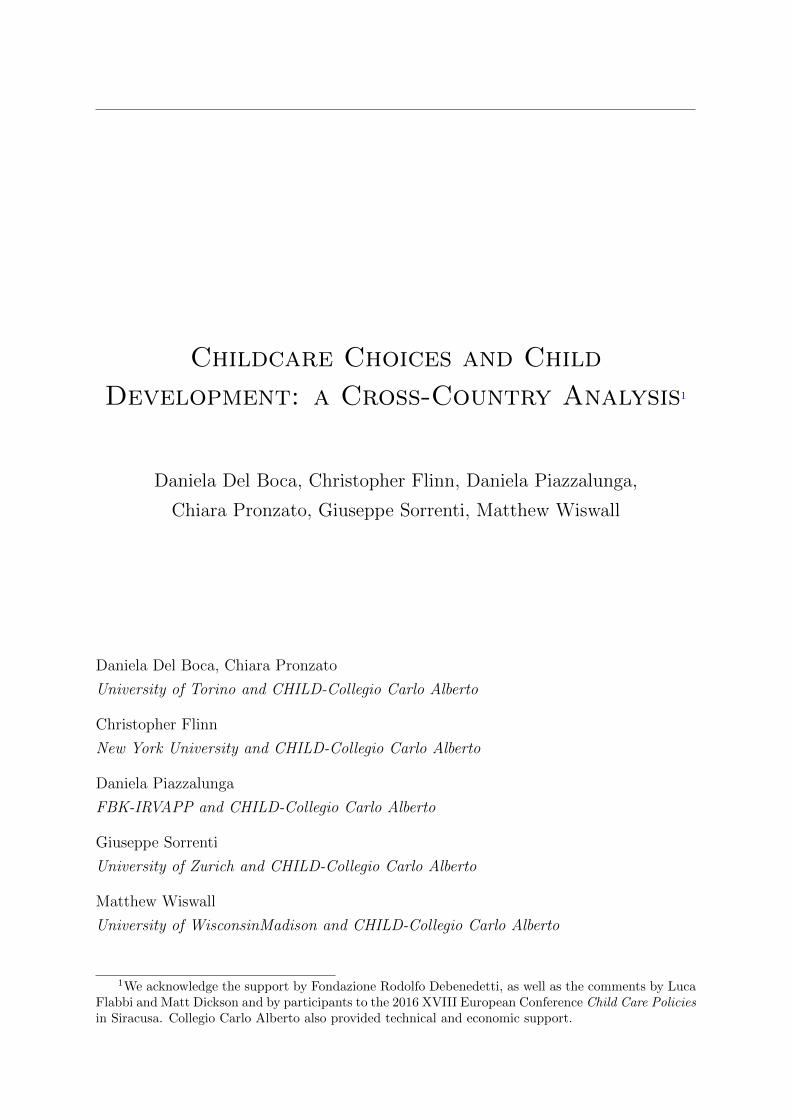
development in young children. Figure 1.1 shows mothers’ employment rates for
a subsample of OECD countries. Denmark, Finland, Netherlands (80%) are the
countries where mothers’ participation rates are highest. The United Kingdom
and the United States exhibit employment rates similar to the OECD average of
68 percent. The Mediterranean countries of Italy, Spain, and Greece have the
lowest rates of maternal employment.
Although there are some fears that high employment rates of mothers may be
associated with poor child outcomes, this is not borne out by crude cross-national
comparisons. One can make some comparisons across countries in cognitive per-
formance of adolescents through the use of the PISA-OECD data. These data con-
tain standardized test scores for adolescents aged 15 in several countries. Figure
1
OECD
010
2030
4050
6070
8090
100
Em
ploy
men
t rat
e (%
)
Denm
ark
Finlan
d
Franc
e
Germ
any
Greec
e
Hunga
ry
Irelan
dIta
ly
Nethe
rland
s
Portu
gal
Spain
United
King
dom
United
Sta
tes
Mothers with at least one child aged 0−14
Figure 1.1: Maternal employment rates
Source: OECD
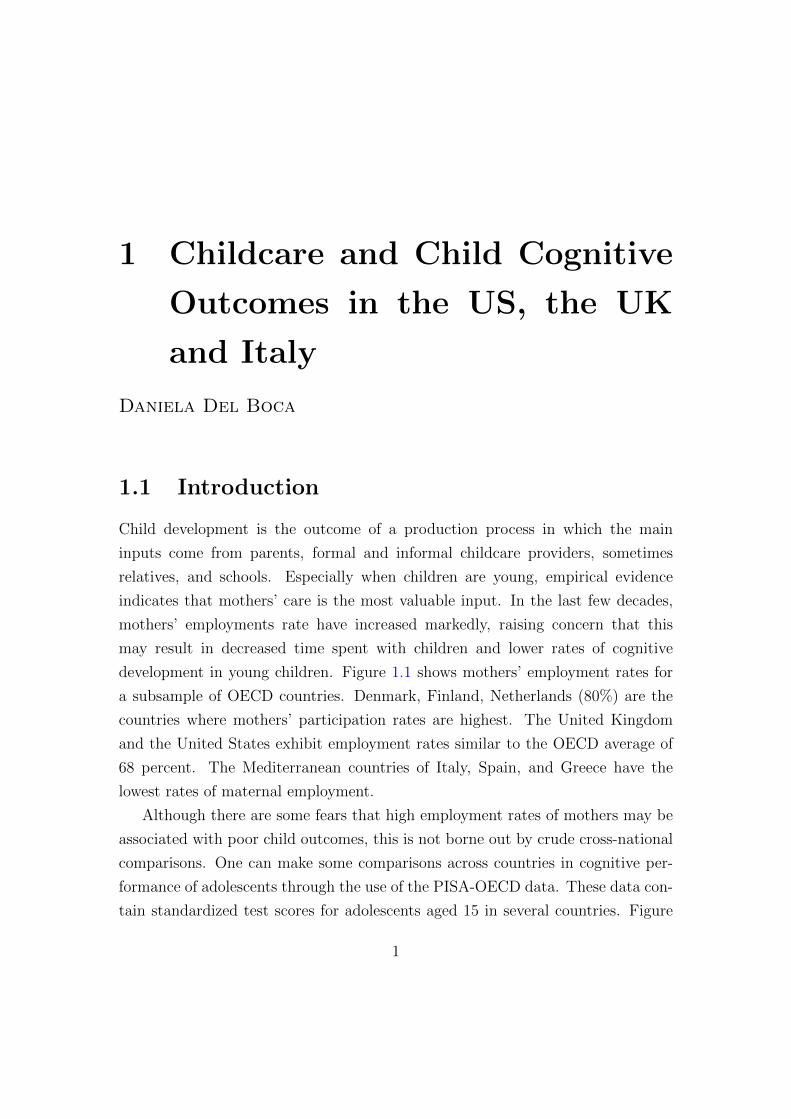
1.2 shows the international comparison in Mathematics and Reading performance
(PISA 2012). Northern European test scores are the highest, while the UK and US
are around the average. Countries with the lowest scores, such as Italy, Spain, and
Greece, are the countries with very low employment rates of mothers. Of course,
these countries vary in a large number of dimensions, not only the employment
rates of mothers.
One potential explanation of these performance differences is the type and
amount of investment in early education across countries. When both parents
work, empirical evidence points to formal childcare as being the best substitute
for parental time investments, especially for children from low-income families. In
some countries the availability of external child care has remained low, especially
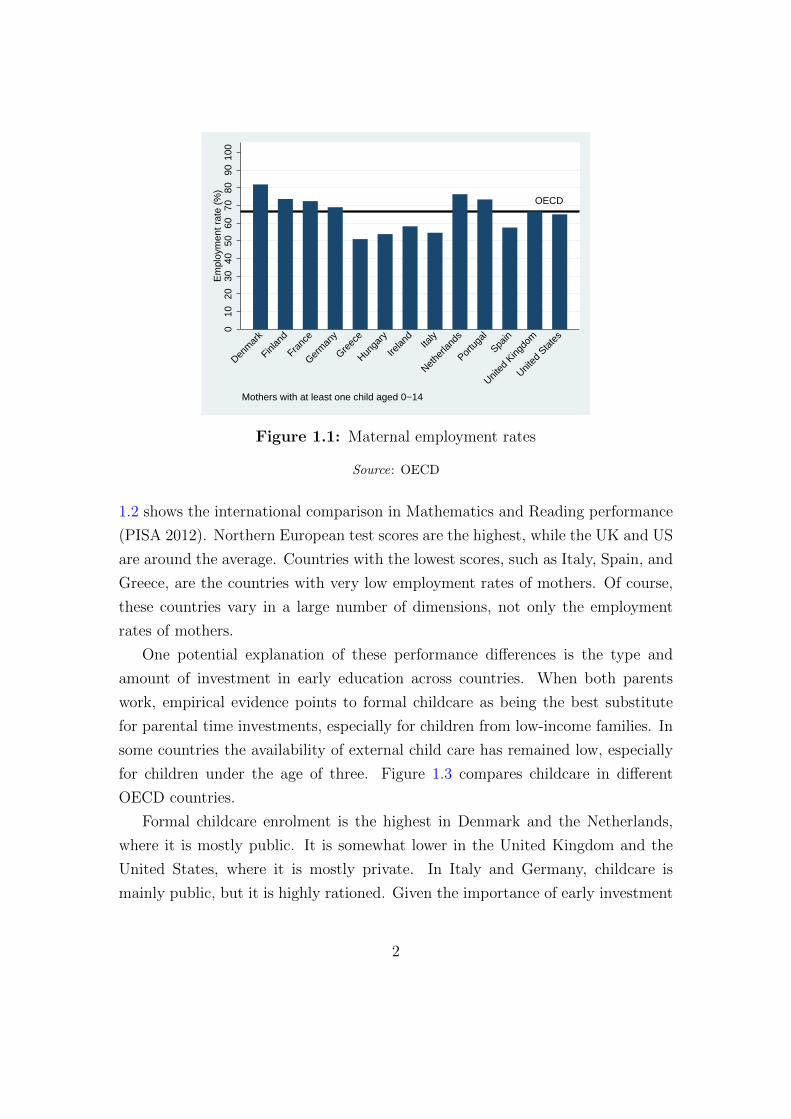
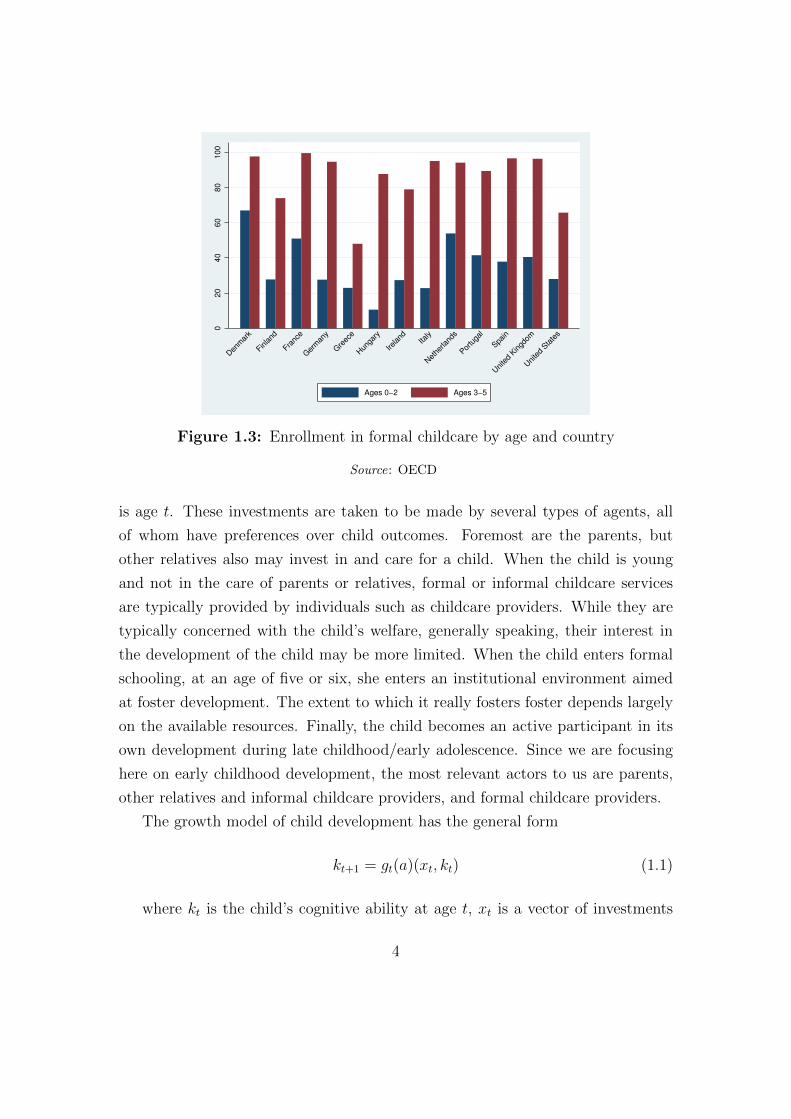
for children under the age of three. Figure 1.3 compares childcare in different
OECD countries.
Formal childcare enrolment is the highest in Denmark and the Netherlands,
where it is mostly public. It is somewhat lower in the United Kingdom and the
United States, where it is mostly private. In Italy and Germany, childcare is
mainly public, but it is highly rationed. Given the importance of early investment
2
OECD
400
425
450
475
500
525
550
Ave
rage
test
sco
re
Denm
ark
Finlan
d
Franc
e
Germ
any
Greec
e
Hunga
ry
Irelan
dIta
ly
Nethe
rland
s
Portu
gal
Spain
United
King
dom
United
Sta
tes
(a) Mathematics
OECD
400
425
450
475
500
525
550
Ave
rage
test
sco
re
Denm
ark
Finlan
d
Franc
e
Germ
any
Greec
e
Hunga
ry
Irelan
dIta
ly
Nethe
rland
s
Portu
gal
Spain
United
King
dom
United
Sta
tes
(b) Reading
Figure 1.2: Performance at standardized tests
Source: PISA (OECD) 2012
in children’s development, intense interest has been generated in the formulation
of policies, such as parental leave, and increasing the availability and quality of
childcare services, a crucial substitute for parental time (Del Boca, 2015a).
In this part of the volume, we will examine the impact of early childcare
(parental inputs and formal childcare) on several child cognitive outcomes. We
will focus on the situation in three different countries, the United Kingdom, the
United States, and Italy. Given the characteristics of the childcare system within
each country and the data available, we focus on different aspects of the link
between childcare and child outcomes in each institutional environment.
1.2 The economic approach to childcare
Since the child development process is inherently dynamic, economists use variants
of a growth model to examine it. Some examples of this can be found in Carneiro
and Heckman (2003), Todd and Wolpin (2003, 2007), and Del Boca, Flinn and
Wiswall (2014). This growth process is considered to be separable over time, with
the level of child development at age t + 1 being a function of the child’s state
of development at the beginning of age t and investments in the child when she
3
020
40
60
80
100
Den
mar
k
Finland
Franc
e
Ger
man
y
Gre
ece
Hun
gary
Ireland
Italy
Net
herla
nds
Portu
gal
Spain
Unite
d Kin
gdom
Unite
d Sta
tes
Ages 0−2 Ages 3−5
Figure 1.3: Enrollment in formal childcare by age and country
Source: OECD
is age t. These investments are taken to be made by several types of agents, all
of whom have preferences over child outcomes. Foremost are the parents, but
other relatives also may invest in and care for a child. When the child is young
and not in the care of parents or relatives, formal or informal childcare services
are typically provided by individuals such as childcare providers. While they are
typically concerned with the child’s welfare, generally speaking, their interest in
the development of the child may be more limited. When the child enters formal
schooling, at an age of five or six, she enters an institutional environment aimed
at foster development. The extent to which it really fosters foster depends largely
on the available resources. Finally, the child becomes an active participant in its
own development during late childhood/early adolescence. Since we are focusing
here on early childhood development, the most relevant actors to us are parents,
other relatives and informal childcare providers, and formal childcare providers.
The growth model of child development has the general form
kt+1 = gt(a)(xt, kt) (1.1)
where kt is the child’s cognitive ability at age t, xt is a vector of investments
4
when the child is age t, and gt is a function that maps the age t investments and
age t ability level at age t+1. Notice that we have allowed the relationship between
the inputs and the previous period’s level of development and the end of period
cognitive level to change with the child’s age. As Del Boca, Flinn, and Wiswall
(2014) found, parental time inputs have different impacts on child development
depending on the age of the child. When she is young, the mother’s time inputs
are particularly valuable. Empirical results in this literature (such as Cunha et
al., 2010) indicate that children are more “malleable” when young.
In this dynamic production function framework, child development is a process,
the outcome of which is determined by heritable endowments and the sequence of
endogenous inputs. The end of the development process depends on the choices
of all agents involved in the child’s development. Family inputs are the most
important in the first few years of a child’s life, since cognitive and non-cognitive
outcomes are largely determined early in life. High-quality childcare programs can
partially substitute parental time when parents are at work and can contribute to
growth in cognitive and non-cognitive outcomes, especially for children from more
disadvantaged backgrounds.
In most of the empirical literature on child development and child outcomes,
attention focuses on simple statistical relationships between observed and unob-
served factors that can influence growth in cognitive and non-cognitive skills and
a small set of measured characteristics. The results reported below largely follow
this approach, and it is important to emphasize how the results we obtain can be
related to an economic framework for looking at child development. This will allow
us to put into context some of the results and to allow the reader to understand
the assumptions being made in conducting the exercises reported below.
The first and most pressing issue is the estimation of the relationship. When
speaking of the productivity of various forms of investment, such as the mother’s
or father’s time or expenditures on goods purchased in the market that may en-
hance child development, it is crucial to obtain “good” estimates of this function.
This is made problematic by two features that virtually every application shares.
The first is that households are extremely heterogeneous, both in terms of observ-
able and unobservable characteristics, so that there are, in fact, many production
technologies to be estimated. In this sense, we should think most probably of a
5
set of production technologies, for each of the households in a sample.
The second issue is that inputs are not chosen randomly by parents and other
agents involved in the child development process. In the economist’s view of things,
they are chosen to maximize the utility of the agent making the investment. Each
individual involved in the development of a child presumably has their own objec-
tives, some purely altruistic, others more goal-oriented for the individual involved.
In the case of parents, they choose inputs carefully to aid in the development of
their child, but child development is clearly not the only thing of relevance in
terms of household welfare. This point is made clear in Del Boca, Flinn Wiswall
(2014), where a distribution of household preferences over parental leisures, house-
hold consumption, and child “quality” is assumed to exist in the population. Their
estimates (obtained under the assumption that all households shared the same pro-
duction technology) indicate substantial dispersion in the sample with regards to
the valuation of these difference components determining parental welfare. Their
results made clear that households with children, on average, are very concerned
with the development of their children, but that there is substantial variation in
the weight given to child development across households.
Heterogeneity in child development technologies, household preferences, and
household resources lead to endogeneity in the choices households make in terms
of inputs in the child development process. Even under the strong assumption
that all households share the same development technology, estimation of this
series of functions using standard regression methods is likely to lead to biases
in the results. This problem can only be dealt with by either having access to
instrumental variables (e.g., Cunha et al., 2010) or by fully modeling the household
investment process as in Del Boca, Flinn, and Wiswall (2014).
The potential impacts of early child investments have important policy im-
plications. If families and institutions intervene early enough, they can positively
influence a child’s cognitive skills, socio-emotional abilities, and health in the short
and long run. Early investments, such as making early childcare more available
and affordable for low-income households, can also promote efficiency and reduce
inequality.
6
1.3 Literature
1.3.1 The role of parental care
Several recent studies (for the United Kingdom, the United States, Germany, Den-
mark, and Norway) have analysed the impact of parental inputs on child outcomes.
The results are often mixed concerning the size and the sign of the impact. The
reasons concern the different methodologies used as well as the different measures
of parental inputs (time and money), and the actors considered in the production
function of cognitive skills and child outcomes considered.
Most socio-economic surveys lack appropriate measures of parental time spent
in childcare, and so researchers have been forced to use proxy measures, such as
mothers’ employment. For example, in a recent analysis of the impact of US moth-
ers’ time on child cognitive outcomes, using data from the National Longitudinal
Survey of Youth 1979 (NLSY79), mothers’ time at work was considered to be
equal to the time not spent with the child (Bernal, 2008). The estimation results
indicate that when a child is quite young, mother’s time in employment and child’s
time in (formal) childcare have a large negative impact on the child’s test scores
on standard cognitive ability tests at the time of entry into formal schooling.
A more accurate measure of parents’ time investments in children is provided by
time diary surveys, which usually contain detailed information about the amount
of time parents spend engaged in various activities with their children. Very few
studies have used direct measures of parents’ time with their children to exam-
ine the relationship between parents’ time investments and children’s cognitive
development. Time diary data show that women’s entry into the labor force is
associated with behavioral changes in time use that make employment status an
inadequate proxy for maternal involvement with children. When time diary inputs
are used in place of mothers’ employment, some results change.
The size of the impact of mothers’ inputs on child cognitive outcomes depends
on the childcare substitutes available to the household. While the mother’s time is
widely recognized as a crucial input to a child’s cognitive development, the father’s
time may be equally productive, especially at some stages of a child’s life. In recent
decades, fathers’ time with their children has increased markedly, partly offsetting
7
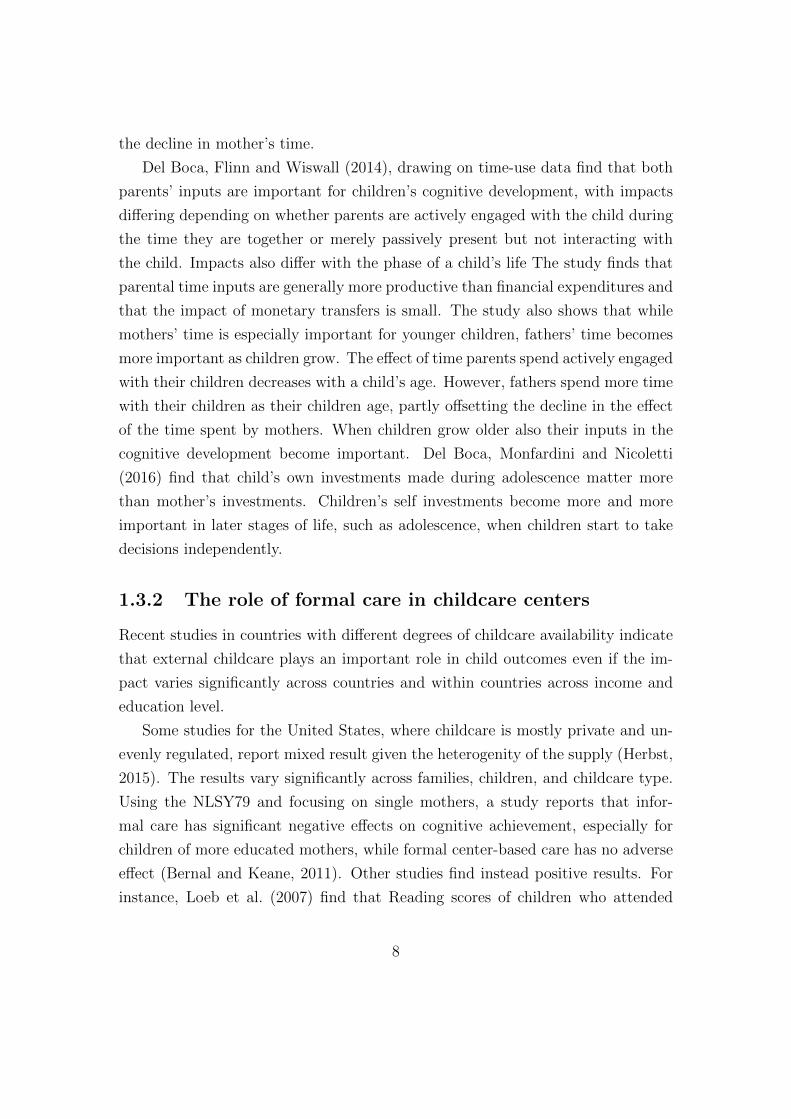
the decline in mother’s time.
Del Boca, Flinn and Wiswall (2014), drawing on time-use data find that both
parents’ inputs are important for children’s cognitive development, with impacts
differing depending on whether parents are actively engaged with the child during
the time they are together or merely passively present but not interacting with
the child. Impacts also differ with the phase of a child’s life The study finds that
parental time inputs are generally more productive than financial expenditures and
that the impact of monetary transfers is small. The study also shows that while
mothers’ time is especially important for younger children, fathers’ time becomes
more important as children grow. The effect of time parents spend actively engaged
with their children decreases with a child’s age. However, fathers spend more time
with their children as their children age, partly offsetting the decline in the effect
of the time spent by mothers. When children grow older also their inputs in the
cognitive development become important. Del Boca, Monfardini and Nicoletti
(2016) find that child’s own investments made during adolescence matter more
than mother’s investments. Children’s self investments become more and more
important in later stages of life, such as adolescence, when children start to take
decisions independently.
1.3.2 The role of formal care in childcare centers
Recent studies in countries with different degrees of childcare availability indicate
that external childcare plays an important role in child outcomes even if the im-
pact varies significantly across countries and within countries across income and
education level.
Some studies for the United States, where childcare is mostly private and un-
evenly regulated, report mixed result given the heterogenity of the supply (Herbst,
2015). The results vary significantly across families, children, and childcare type.
Using the NLSY79 and focusing on single mothers, a study reports that infor-
mal care has significant negative effects on cognitive achievement, especially for
children of more educated mothers, while formal center-based care has no adverse
effect (Bernal and Keane, 2011). Other studies find instead positive results. For
instance, Loeb et al. (2007) find that Reading scores of children who attended
8
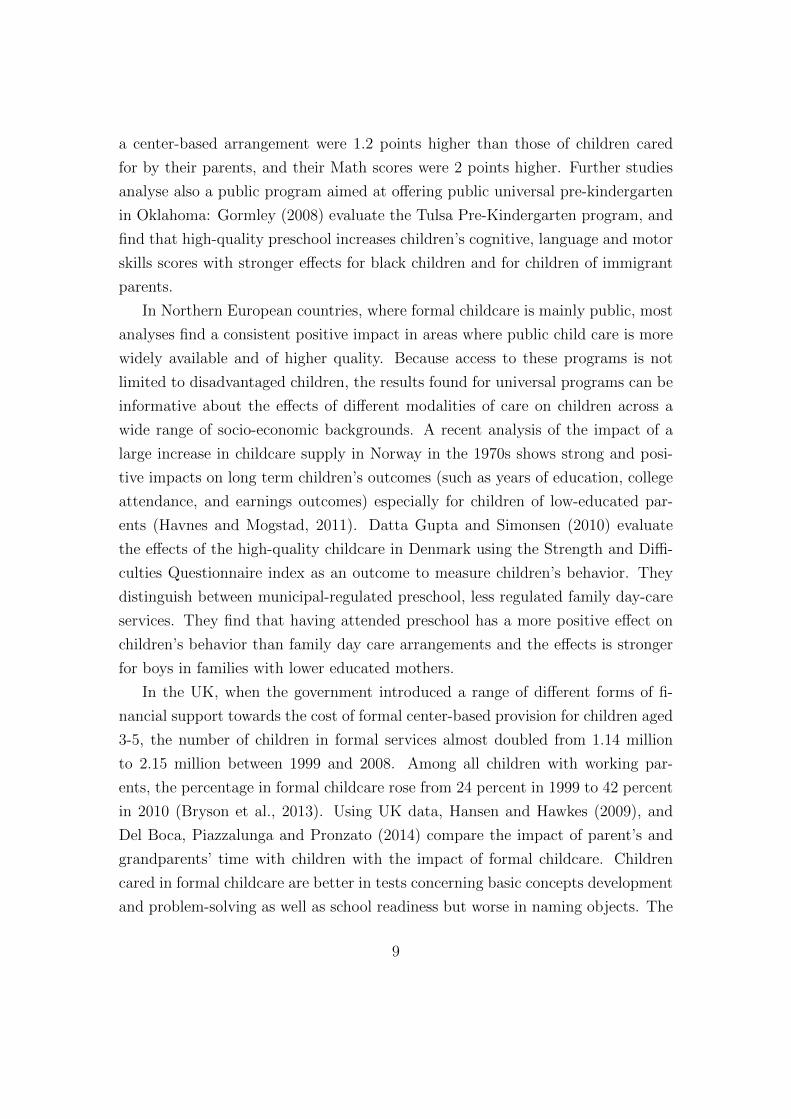
a center-based arrangement were 1.2 points higher than those of children cared
for by their parents, and their Math scores were 2 points higher. Further studies
analyse also a public program aimed at offering public universal pre-kindergarten
in Oklahoma: Gormley (2008) evaluate the Tulsa Pre-Kindergarten program, and
find that high-quality preschool increases children’s cognitive, language and motor
skills scores with stronger effects for black children and for children of immigrant
parents.
In Northern European countries, where formal childcare is mainly public, most
analyses find a consistent positive impact in areas where public child care is more
widely available and of higher quality. Because access to these programs is not
limited to disadvantaged children, the results found for universal programs can be
informative about the effects of different modalities of care on children across a
wide range of socio-economic backgrounds. A recent analysis of the impact of a
large increase in childcare supply in Norway in the 1970s shows strong and posi-
tive impacts on long term children’s outcomes (such as years of education, college
attendance, and earnings outcomes) especially for children of low-educated par-
ents (Havnes and Mogstad, 2011). Datta Gupta and Simonsen (2010) evaluate
the effects of the high-quality childcare in Denmark using the Strength and Diffi-
culties Questionnaire index as an outcome to measure children’s behavior. They
distinguish between municipal-regulated preschool, less regulated family day-care
services. They find that having attended preschool has a more positive effect on
children’s behavior than family day care arrangements and the effects is stronger
for boys in families with lower educated mothers.
In the UK, when the government introduced a range of different forms of fi-
nancial support towards the cost of formal center-based provision for children aged
3-5, the number of children in formal services almost doubled from 1.14 million
to 2.15 million between 1999 and 2008. Among all children with working par-
ents, the percentage in formal childcare rose from 24 percent in 1999 to 42 percent
in 2010 (Bryson et al., 2013). Using UK data, Hansen and Hawkes (2009), and
Del Boca, Piazzalunga and Pronzato (2014) compare the impact of parent’s and
grandparents’ time with children with the impact of formal childcare. Children
cared in formal childcare are better in tests concerning basic concepts development
and problem-solving as well as school readiness but worse in naming objects. The
9
positive association between formal childcare and child outcomes is stronger for
children in more disadvantaged households.
In Italy, public childcare availability is very different across regions, ranging
between values close to 0 in some areas in the South to more than 20 percent
in some areas of the North. Zollino (2008) has shown that here is a positive
correlation between childcare availability and childcare demand, where the demand
of the service is defined as the length of the waiting list; this means that in regions
where childcare availability is higher, the number of applications increases. Brilli
et al. (2016) using INVALSI data estimate the effects of childcare availability
on children’s performances at primary school, measured by Language and Math
scores in second grade. They find a positive and significant effect of childcare
availability on Language test scores, while they do not find any effect on Math.
The authors find a strongest effect in areas where childcare availability is lower
and for households with lower incomes.
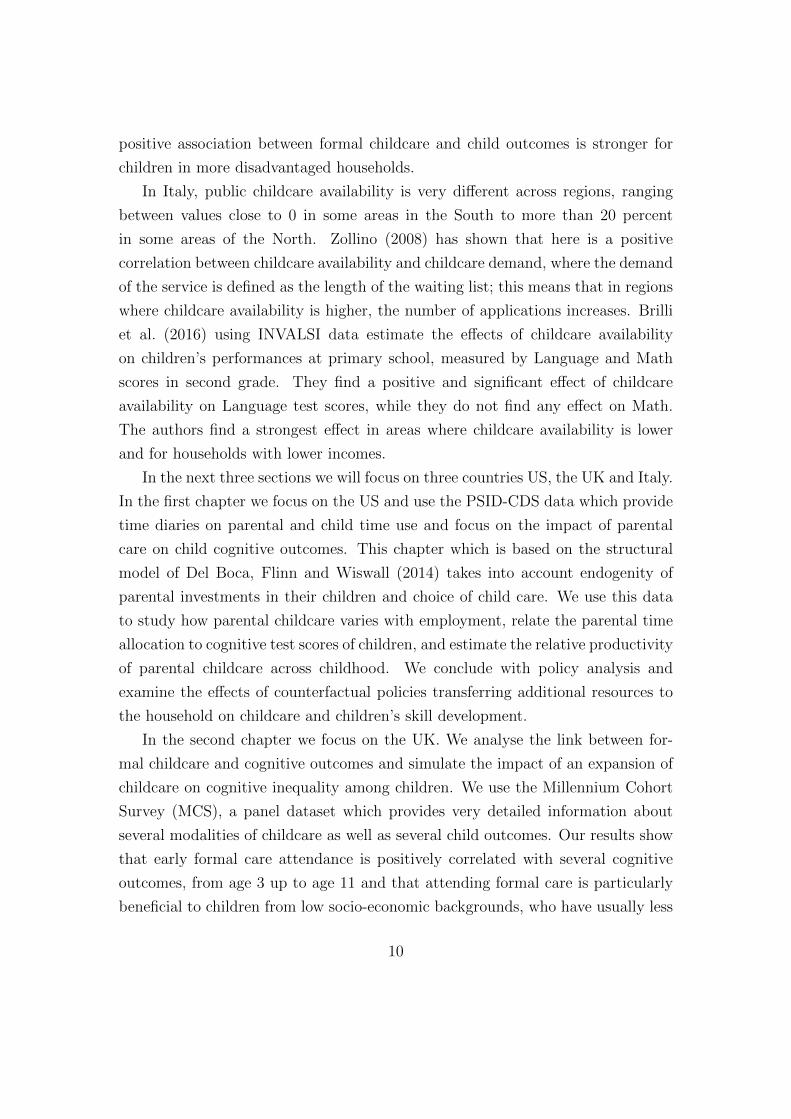
In the next three sections we will focus on three countries US, the UK and Italy.
In the first chapter we focus on the US and use the PSID-CDS data which provide
time diaries on parental and child time use and focus on the impact of parental
care on child cognitive outcomes. This chapter which is based on the structural
model of Del Boca, Flinn and Wiswall (2014) takes into account endogenity of
parental investments in their children and choice of child care. We use this data
to study how parental childcare varies with employment, relate the parental time
allocation to cognitive test scores of children, and estimate the relative productivity
of parental childcare across childhood. We conclude with policy analysis and
examine the effects of counterfactual policies transferring additional resources to
the household on childcare and children’s skill development.
In the second chapter we focus on the UK. We analyse the link between for-
mal childcare and cognitive outcomes and simulate the impact of an expansion of
childcare on cognitive inequality among children. We use the Millennium Cohort
Survey (MCS), a panel dataset which provides very detailed information about
several modalities of childcare as well as several child outcomes. Our results show
that early formal care attendance is positively correlated with several cognitive
outcomes, from age 3 up to age 11 and that attending formal care is particularly
beneficial to children from low socio-economic backgrounds, who have usually less
10
inputs at home. We also simulate the effect that increased attendance of formal
childcare has on differences in children’s cognitive abilities. Our results show that
childcare policies promoting increased attendance of formal childcare would help
reduce disparities between children in term of their cognitive skills.
In the third chapter, we analyse the case of Italy, where the data on child care
use are limited to cross section data. We explore the impact of child care provision
both on mothers’ work and child cognitive outcomes and take into account other
peculiar characteristics of the childcare system related to rationing and selection
criteria which give access to children from households with different characteristics.
The positive impacts of childcare on child outcomes and mothers’ employment
seem to be stronger in municipalities where the selection criteria give priority to
more disadvantaged households
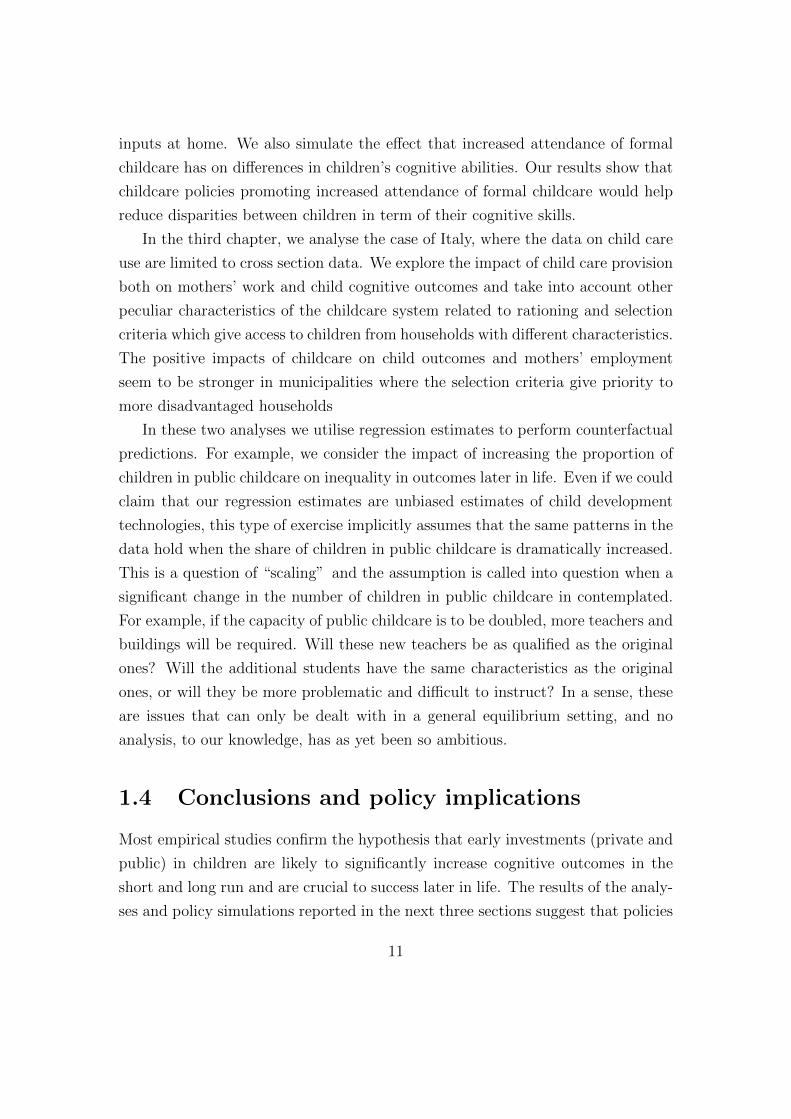
In these two analyses we utilise regression estimates to perform counterfactual
predictions. For example, we consider the impact of increasing the proportion of
children in public childcare on inequality in outcomes later in life. Even if we could
claim that our regression estimates are unbiased estimates of child development
technologies, this type of exercise implicitly assumes that the same patterns in the
data hold when the share of children in public childcare is dramatically increased.
This is a question of “scaling” and the assumption is called into question when a
significant change in the number of children in public childcare in contemplated.
For example, if the capacity of public childcare is to be doubled, more teachers and
buildings will be required. Will these new teachers be as qualified as the original
ones? Will the additional students have the same characteristics as the original
ones, or will they be more problematic and difficult to instruct? In a sense, these
are issues that can only be dealt with in a general equilibrium setting, and no
analysis, to our knowledge, has as yet been so ambitious.
1.4 Conclusions and policy implications
Most empirical studies confirm the hypothesis that early investments (private and
public) in children are likely to significantly increase cognitive outcomes in the
short and long run and are crucial to success later in life. The results of the analy-
ses and policy simulations reported in the next three sections suggest that policies
11
encouraging and supporting parents’ efforts to spend more time with their chil-
dren during early stages of development and policies promoting the development of
high-quality formal childcare have positive impacts on child outcomes. The results
also show that the positive association between formal childcare and positive child
outcomes is stronger for children in more disadvantaged households. Children in
families with higher income and more education already receive substantial early
investments within their families and have more resources and opportunities avail-
able to them. Low-income households often lack the resources needed to support
and stimulate child development, so children in these families are likely to receive
less investment from their families and to have access to fewer resources. Other
characteristics of the childcare system in countries where it is publicly provided and
rationed, such as selection criteria, are likely to impact chid cognitive outcomes in
a similar way.
12
2 Parental Childcare and Child De-
velopment
Daniela Del Boca, Christopher Flinn, Matthew Wiswall
2.1 Introduction
In this chapter, we explore the allocation of parental time and its relationship with
the child’s cognitive test scores using data taken from the Panel Study of Income
Dynamics, and a component of the PSID, the Child Development Study (PSID-
CDS). This dataset provides nationally representative information on parental
employment and earnings combined with detailed time diaries to study the types
of parental care provide to children. These data also include measures of test
performance of the children in the subsample at two or three points in time.
The PSID is a longitudinal study that began in 1968 with a nationally rep-
resentative sample of about 5,000 American families. In 1997, the PSID began
collecting data on a random sample of the PSID families that had children under
the age of 13 in the CDS. Data were collected for up to two children in this age
range per family. The CDS collects information on child development and family
dynamics, including parent-child relationships, home environment, and time use.
The entire CDS sample size in 1997 is approximately 3,500 children residing in
2,400 households. Follow-up data was collected in 2002 and 2007, allowing us to
track the development of children as they age.
We first use this data to study how parental childcare varies with employment.
We then relate the parental time allocation to cognitive test scores of children
and estimate the relative productivity of parental child care across childhood. We
13
conclude this chapter with some policy analysis and examine the effects on child-
care and children’s skill development from counterfactual policies of transferring
additional resources to the household.
While the analysis upon which we draw does not explicitly consider the impacts
of childcare on child outcomes, it does attempt to carefully value the parents’
contributions to child development. Most of the literature on childcare has stressed
the impact that absence from the parents during the day may have on cognitive
and non-cognitive development. The results we present could at least be used to
bound how negative these impacts could be.
2.2 Parental Time Allocation
We first examine the allocation of various types of parental time. We utilize stan-
dard measures of parental labor supply derived from the PSID. For time with
children, we use the CDS, which collected children’s time diaries along with de-
tailed assessments of children’s cognitive development. For two days per week
(one weekday and either Saturday or Sunday), children (with the assistance of the
primary caregiver when the children were very young) filled out a detailed 24 hour
time diary in which they recorded all activities during the day and who else (if
anyone) participated with the child in these activities. At any point in time, the
children recorded the intensity of participation for parents: mothers and fathers
could be actively participating or engaged with the child or simply around the
child but not actively involved. We refer to the first category of time as “active”
time and the second as “passive.” Importantly, our data includes both mother’s
and father’s time with the child, in addition to labor supply information. We can
then study whether an increase in fathers’ active time off-sets the reduction in
mother’s time due to labor supply. Without this time heterogeneity, the trade-off
between time in the market and time with children is much starker.
Table 2.1 breaks down parental labor supply by the age of the child. Mother’s
labor supply, both at the extensive and intensive margins, is related to the age of
children but the father’s labor supply is largely constant throughout the develop-
ment period. For one-child families, the fraction of mothers working at all increases
from 75 percent when the child is age 3 to 82-88 percent for older children. At
14
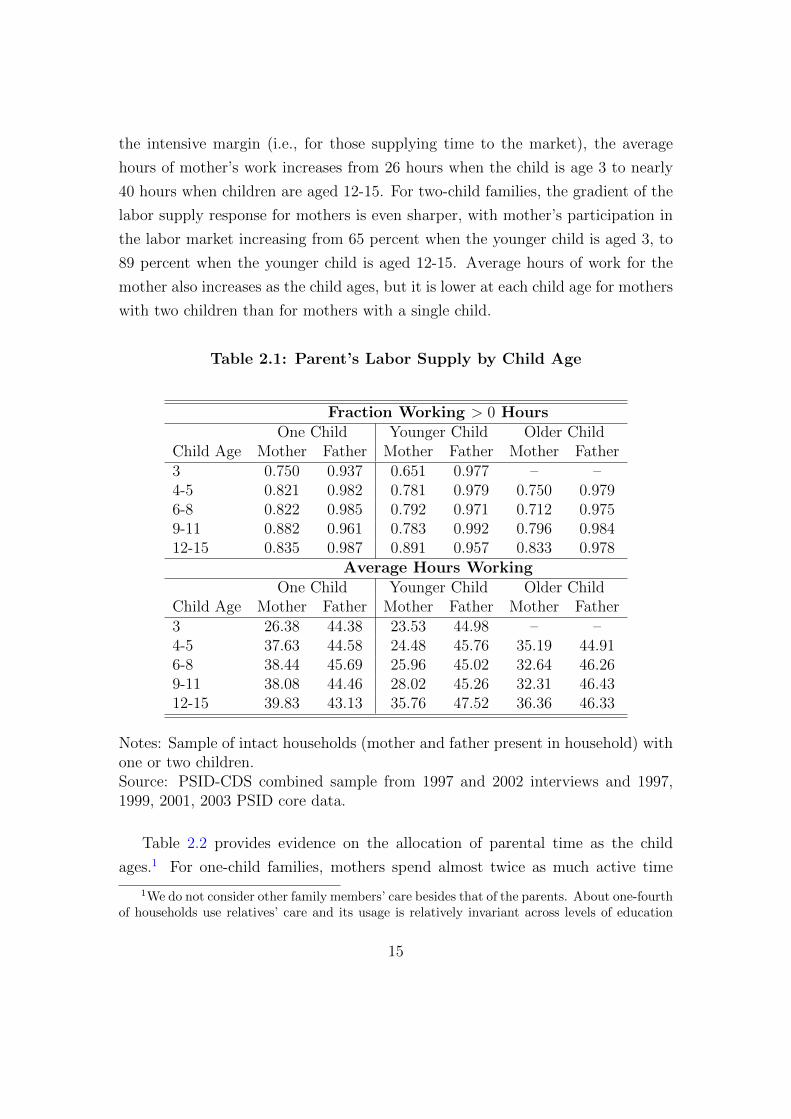
the intensive margin (i.e., for those supplying time to the market), the average
hours of mother’s work increases from 26 hours when the child is age 3 to nearly
40 hours when children are aged 12-15. For two-child families, the gradient of the
labor supply response for mothers is even sharper, with mother’s participation in
the labor market increasing from 65 percent when the younger child is aged 3, to
89 percent when the younger child is aged 12-15. Average hours of work for the
mother also increases as the child ages, but it is lower at each child age for mothers
with two children than for mothers with a single child.
Table 2.1: Parent’s Labor Supply by Child Age
Fraction Working > 0 HoursOne Child Younger Child Older Child
Child Age Mother Father Mother Father Mother Father3 0.750 0.937 0.651 0.977 – –4-5 0.821 0.982 0.781 0.979 0.750 0.9796-8 0.822 0.985 0.792 0.971 0.712 0.9759-11 0.882 0.961 0.783 0.992 0.796 0.98412-15 0.835 0.987 0.891 0.957 0.833 0.978
Average Hours WorkingOne Child Younger Child Older Child
Child Age Mother Father Mother Father Mother Father3 26.38 44.38 23.53 44.98 – –4-5 37.63 44.58 24.48 45.76 35.19 44.916-8 38.44 45.69 25.96 45.02 32.64 46.269-11 38.08 44.46 28.02 45.26 32.31 46.4312-15 39.83 43.13 35.76 47.52 36.36 46.33
Notes: Sample of intact households (mother and father present in household) withone or two children.Source: PSID-CDS combined sample from 1997 and 2002 interviews and 1997,1999, 2001, 2003 PSID core data.
Table 2.2 provides evidence on the allocation of parental time as the child
ages.1 For one-child families, mothers spend almost twice as much active time
1We do not consider other family members’ care besides that of the parents. About one-fourthof households use relatives’ care and its usage is relatively invariant across levels of education
15
with the children as do fathers when the child is aged 3-5. This gap in active time
closes for older children. When the children are young, both mothers and fathers
spend much more of their total child investment time actively interacting with
the child rather than in passive engagement. For older children, the parents are
spending closer to equal amounts of time in passive and active engagement as the
amount of active time declines for both mothers and fathers. Because of the sharp
reduction in active time with the child, the mother’s average total time with the
child declines substantially as the child ages. However, the total time the father
spends with the child increases slightly, which is due entirely to an increase in the
father’s passive time engagement.
For two-child families, Table 2.2 presents descriptive statistics for total active
and passive time, combining all time spent with the child whether or not the
sibling was present and also receiving parental time. We see a similar age profile
in time allocation for active time as in one-child families: both children receive
substantially more active time with the mother and father when young. However,
the amount of active time with the mother and father is lower on average for the
younger child in a two-child family than for the only child in a one-child family.
Given the sample restriction that both children be included in the CDS survey for
two-child households, we do not have older (second born) children less than 4 years
of age in the sample. Examining the patterns in passive time, we see that while
average hours in active time with the younger child at age 3 is less for mothers
with two children, the average amount of passive time is higher. The total time
with the younger child at age 3 (active and passive) is about the same for one-child
and two-child families. For older children (aged 12-15), it is clear that children in
two-child families receive less active and passive contact time from both parents
than do children in one-child families.
Table 2.3 disaggregates parental time allocation for two-child families into var-
ious joint time categories. The top row displays the time spent by mothers and
fathers in active time with the younger child alone (without the other sibling
present). Mothers spend on average 4.5 hours actively engaging with the younger
child alone, and fathers spend on average 2.4 hours in active engagement alone
with the child. By far the largest time investments are made when the children
and income.
16
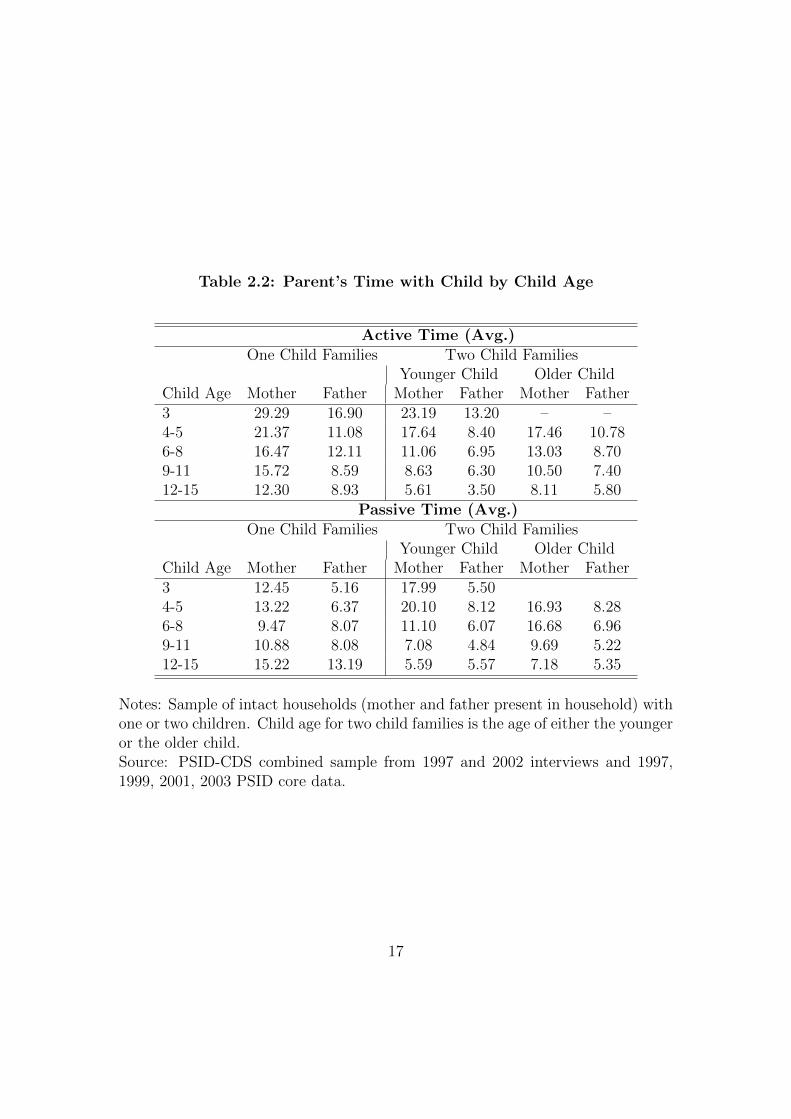
Table 2.2: Parent’s Time with Child by Child Age
Active Time (Avg.)One Child Families Two Child Families
Younger Child Older ChildChild Age Mother Father Mother Father Mother Father3 29.29 16.90 23.19 13.20 – –4-5 21.37 11.08 17.64 8.40 17.46 10.786-8 16.47 12.11 11.06 6.95 13.03 8.709-11 15.72 8.59 8.63 6.30 10.50 7.4012-15 12.30 8.93 5.61 3.50 8.11 5.80
Passive Time (Avg.)One Child Families Two Child Families
Younger Child Older ChildChild Age Mother Father Mother Father Mother Father3 12.45 5.16 17.99 5.504-5 13.22 6.37 20.10 8.12 16.93 8.286-8 9.47 8.07 11.10 6.07 16.68 6.969-11 10.88 8.08 7.08 4.84 9.69 5.2212-15 15.22 13.19 5.59 5.57 7.18 5.35
Notes: Sample of intact households (mother and father present in household) withone or two children. Child age for two child families is the age of either the youngeror the older child.Source: PSID-CDS combined sample from 1997 and 2002 interviews and 1997,1999, 2001, 2003 PSID core data.
17
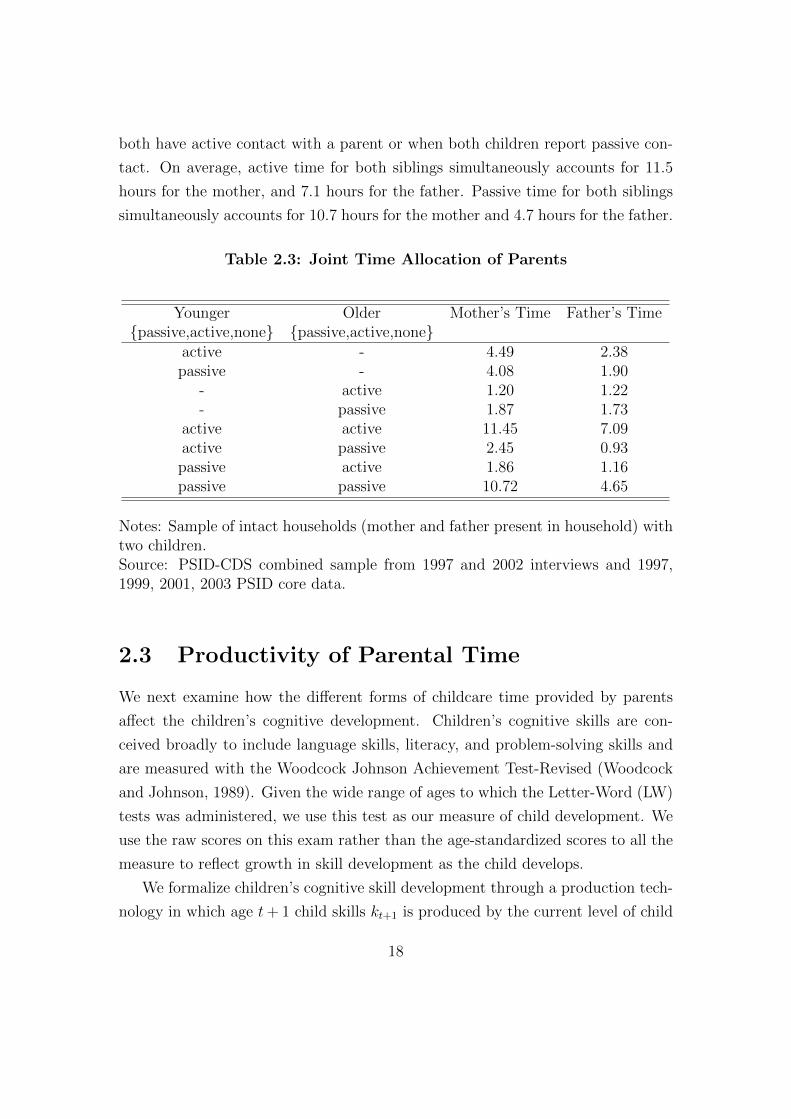
both have active contact with a parent or when both children report passive con-
tact. On average, active time for both siblings simultaneously accounts for 11.5
hours for the mother, and 7.1 hours for the father. Passive time for both siblings
simultaneously accounts for 10.7 hours for the mother and 4.7 hours for the father.
Table 2.3: Joint Time Allocation of Parents
Younger Older Mother’s Time Father’s Time{passive,active,none} {passive,active,none}
active - 4.49 2.38passive - 4.08 1.90
- active 1.20 1.22- passive 1.87 1.73
active active 11.45 7.09active passive 2.45 0.93passive active 1.86 1.16passive passive 10.72 4.65
Notes: Sample of intact households (mother and father present in household) withtwo children.Source: PSID-CDS combined sample from 1997 and 2002 interviews and 1997,1999, 2001, 2003 PSID core data.
2.3 Productivity of Parental Time
We next examine how the different forms of childcare time provided by parents
affect the children’s cognitive development. Children’s cognitive skills are con-
ceived broadly to include language skills, literacy, and problem-solving skills and
are measured with the Woodcock Johnson Achievement Test-Revised (Woodcock
and Johnson, 1989). Given the wide range of ages to which the Letter-Word (LW)
tests was administered, we use this test as our measure of child development. We
use the raw scores on this exam rather than the age-standardized scores to all the
measure to reflect growth in skill development as the child develops.
We formalize children’s cognitive skill development through a production tech-
nology in which age t+ 1 child skills kt+1 is produced by the current level of child
18
quality, kt, parental time investments in the child of the active and passive kind,
and expenditures on the child, all of which are made when the child is age t. The
production function we estimate takes the following form:
ln kt+1 = δ1,t(a) ln τ1,t(a) + δ2,t(a) ln τ2,t(a) + δ1,t(p) ln τ1,t(p)
+ δ2,t(p) ln τ2,t(p) + δ3,t ln et + δ4,t ln kt(2.1)
where τ1,t(a) is active time by the mother, τ1,t(p) is passive time by the mother,
and τ2,t(a) and τ2,t(p) is father’s active and passive time. Goods expenditures on
the child are denoted by et. The δ parameters provide the productivity elasticities
of each type of time, where each parameter indicates by what percent test scores
increase in the next period following a 1 percent increase in the child input. We
estimate the parameters of the model jointly with a function characterizing the
preferences of the household, defined over the parents’ leisure, household consump-
tion, and child quality. In this way we solve the problem of endogeneity of input
choices under the assumption that we have correctly specified the household’s
preferences and constraints.2
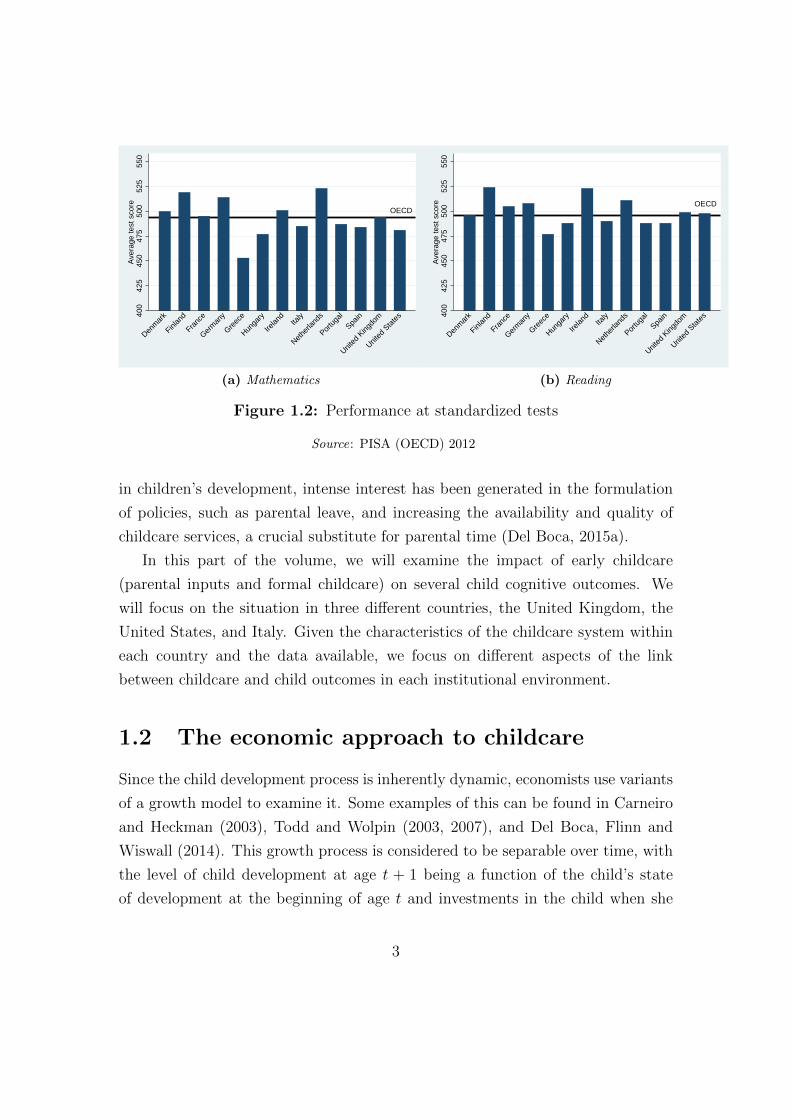
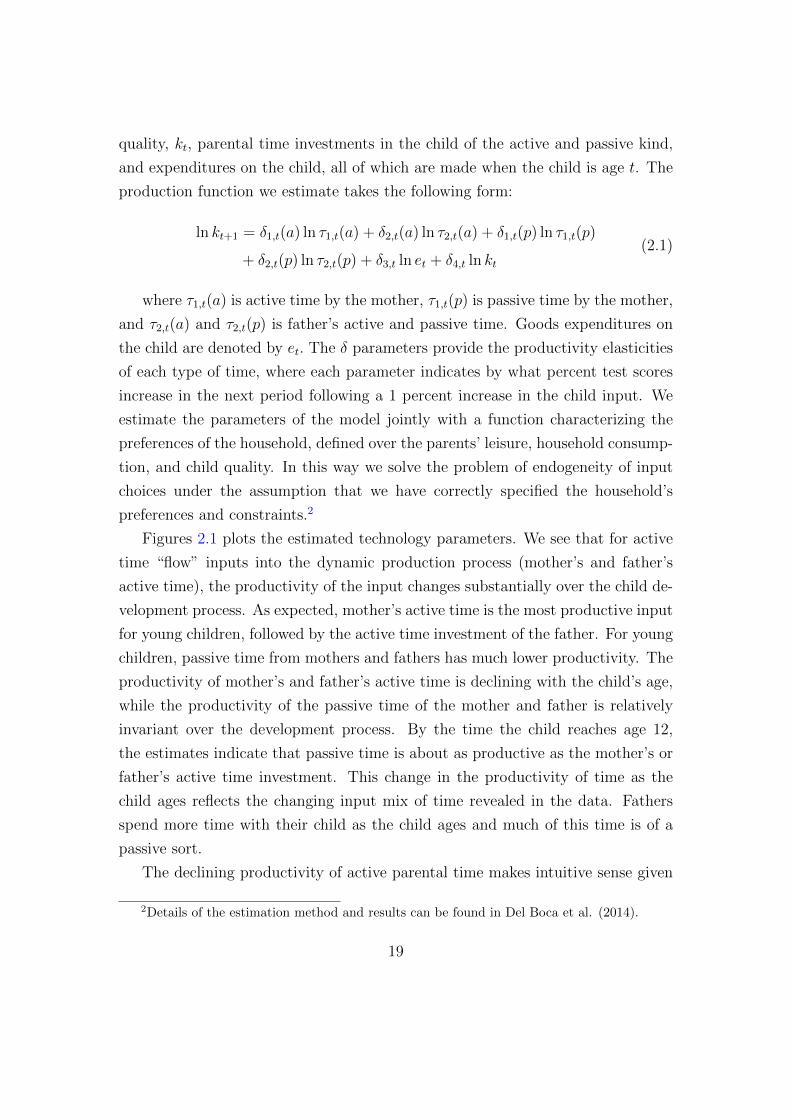
Figures 2.1 plots the estimated technology parameters. We see that for active
time “flow” inputs into the dynamic production process (mother’s and father’s
active time), the productivity of the input changes substantially over the child de-
velopment process. As expected, mother’s active time is the most productive input
for young children, followed by the active time investment of the father. For young
children, passive time from mothers and fathers has much lower productivity. The
productivity of mother’s and father’s active time is declining with the child’s age,
while the productivity of the passive time of the mother and father is relatively
invariant over the development process. By the time the child reaches age 12,
the estimates indicate that passive time is about as productive as the mother’s or
father’s active time investment. This change in the productivity of time as the
child ages reflects the changing input mix of time revealed in the data. Fathers
spend more time with their child as the child ages and much of this time is of a
passive sort.
The declining productivity of active parental time makes intuitive sense given
2Details of the estimation method and results can be found in Del Boca et al. (2014).
19
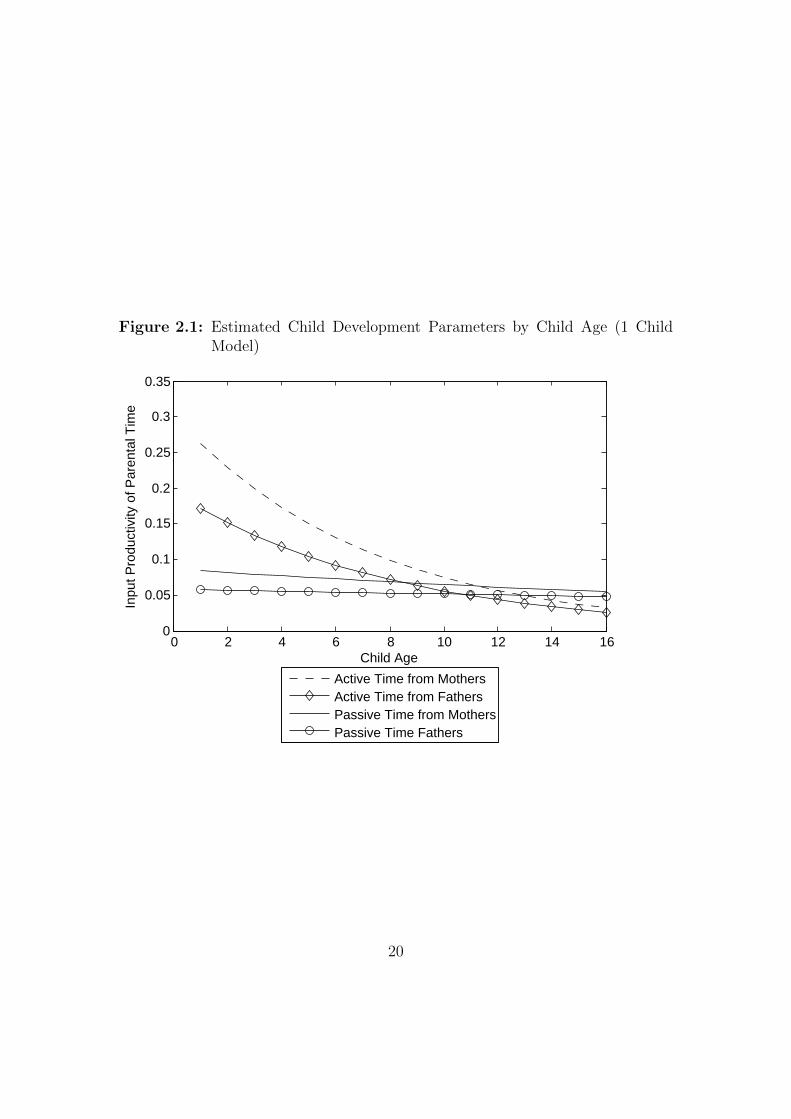
Figure 2.1: Estimated Child Development Parameters by Child Age (1 ChildModel)
0 2 4 6 8 10 12 14 160
0.05
0.1
0.15
0.2
0.25
0.3
0.35
Child Age
Inpu
t Pro
duct
ivity
of P
aren
tal T
ime
Active Time from MothersActive Time from FathersPassive Time from MothersPassive Time Fathers
20
our model specification. Once children attain the age of 5 or 6, they typically leave
the home for significant periods of time each day for formal schooling activities.
This amounts to a large, probably discontinuous, shift in the child quality produc-
tion process. During the period of formal schooling, the child may increasingly be
subject to inputs, both good and bad, from teachers and other students, which
supplant the interactions that the child previously had with the parents. From the
point of view of parental inputs, their input decisions have increasingly smaller
effects on child outcomes as they are “crowded out” by these others.3 While one
could argue about the form of the dependence of the production process on the
age of the child, it is reasonable to think that the impact of parental inputs is, in
general, declining.4
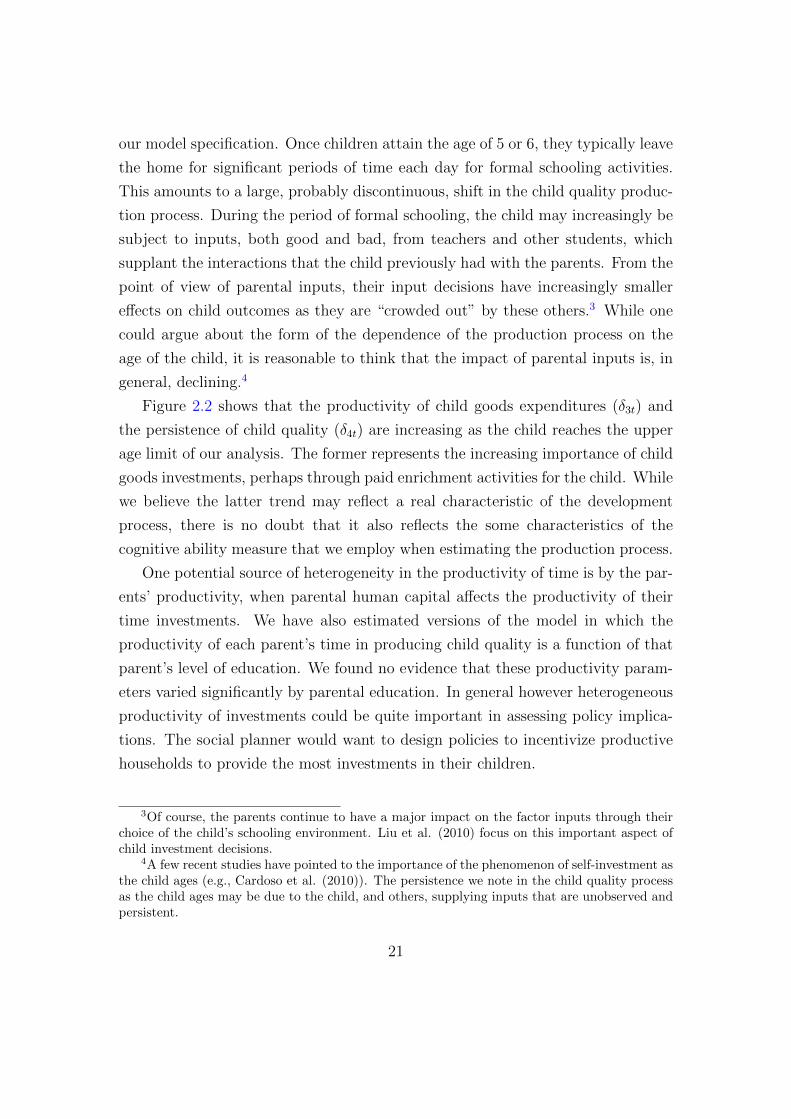
Figure 2.2 shows that the productivity of child goods expenditures (δ3t) and
the persistence of child quality (δ4t) are increasing as the child reaches the upper
age limit of our analysis. The former represents the increasing importance of child
goods investments, perhaps through paid enrichment activities for the child. While
we believe the latter trend may reflect a real characteristic of the development
process, there is no doubt that it also reflects the some characteristics of the
cognitive ability measure that we employ when estimating the production process.
One potential source of heterogeneity in the productivity of time is by the par-
ents’ productivity, when parental human capital affects the productivity of their
time investments. We have also estimated versions of the model in which the
productivity of each parent’s time in producing child quality is a function of that
parent’s level of education. We found no evidence that these productivity param-
eters varied significantly by parental education. In general however heterogeneous
productivity of investments could be quite important in assessing policy implica-
tions. The social planner would want to design policies to incentivize productive
households to provide the most investments in their children.
3Of course, the parents continue to have a major impact on the factor inputs through theirchoice of the child’s schooling environment. Liu et al. (2010) focus on this important aspect ofchild investment decisions.
4A few recent studies have pointed to the importance of the phenomenon of self-investment asthe child ages (e.g., Cardoso et al. (2010)). The persistence we note in the child quality processas the child ages may be due to the child, and others, supplying inputs that are unobserved andpersistent.
21
Figure 2.2: Estimated Child Development Parameters by Child Age (1 ChildModel)
0 2 4 6 8 10 12 14 160
0.05
0.1
0.15
0.2
0.25
0.3
0.35
0.4
0.45
0.5
Child Age
Inpu
t Pro
duct
ivity
Expenditures Previous Child Quality
22
2.4 Policy Analysis
The policies we study provide a transfer amount to a one-child family each year
during at least a portion of the development process. Motivated by the work of
Cunha and Heckman (2008), in which it is argued that child investments in early
years are more productive than are investments made in later years, we look at
the efficacy of making monetary transfers to the household when the child is in
the early stage of the development process as opposed to later years. We consider
the impact on child outcomes at the end of the development process of three
potential transfer patterns: (1) a $500 transfer per week during the first half of
the development process; (2) a $500 transfer per week during the second half of
the development process; and (3) a $250 transfer per week during each week of the
development process. These amounts have been selected so as to equate the total
value of transfers under the three schemes.
We have examined the impact of the transfers using a “restricted” and “unre-
stricted” case. In the first, there is no constraint on how the transfer of x can be
spent by the household. In particular, a household may spend less than x on child
goods investment if it chooses to do so. In the restricted case, the household is
monitored to ensure that at least x dollars are spent on the child. Alternatively,
we could think of these as in-kind transfers that only have a value when used to
increase the child’s cognitive ability.
The results are presented in Table 2.4. The amounts are the percentage change
from baseline for each of the transfer schemes. The first column contains the
results from the unrestricted transfers case, for which we only consider the effect
of a transfer of $250 per week over the entire development period. We see that
the transfers have a small impact on latent ability. However, by far the greatest
impact in the column is associated with the parental labor supplies, which fall
markedly. The time which is taken from labor market activity is spent on time
investments with the child and on parental leisure. The reduction in earned labor
income in the household is not necessarily a bad thing from the point of view of
child development, because we have found that in most periods time expenditures
of whatever type have a larger impact on cognitive improvements than do money
expenditures. The patterns of substitution that are estimated result in relatively
23
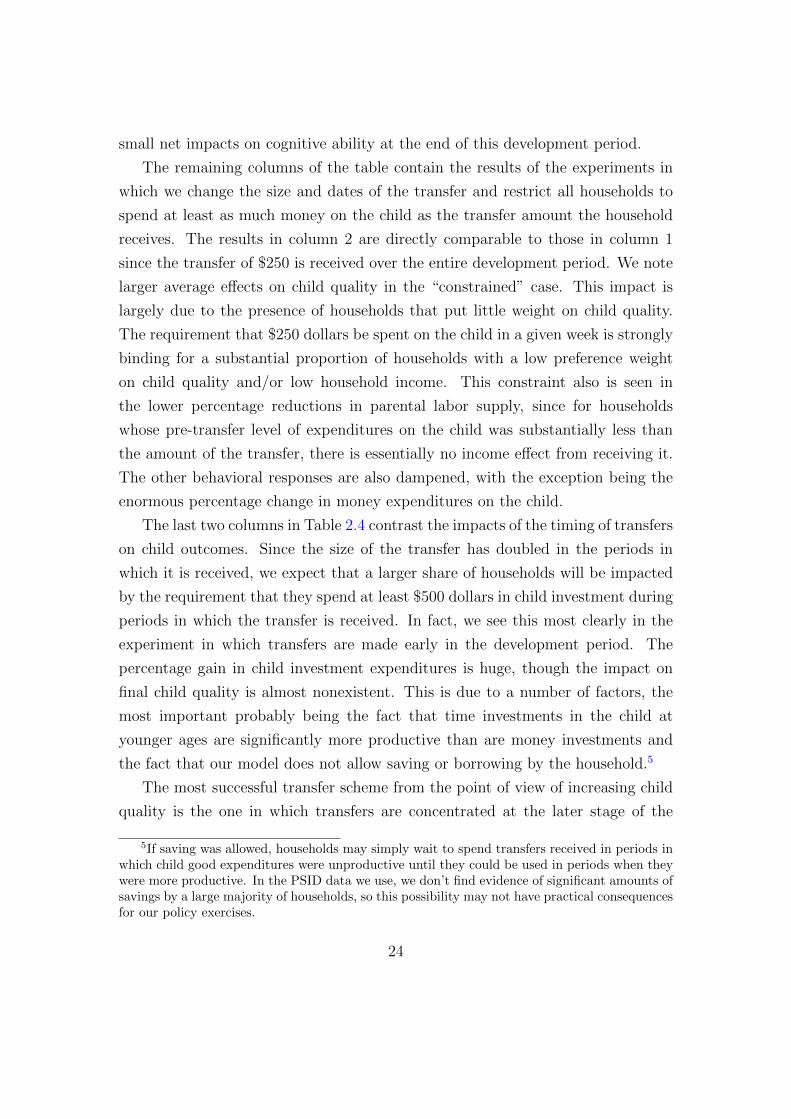
small net impacts on cognitive ability at the end of this development period.
The remaining columns of the table contain the results of the experiments in
which we change the size and dates of the transfer and restrict all households to
spend at least as much money on the child as the transfer amount the household
receives. The results in column 2 are directly comparable to those in column 1
since the transfer of $250 is received over the entire development period. We note
larger average effects on child quality in the “constrained” case. This impact is
largely due to the presence of households that put little weight on child quality.
The requirement that $250 dollars be spent on the child in a given week is strongly
binding for a substantial proportion of households with a low preference weight
on child quality and/or low household income. This constraint also is seen in
the lower percentage reductions in parental labor supply, since for households
whose pre-transfer level of expenditures on the child was substantially less than
the amount of the transfer, there is essentially no income effect from receiving it.
The other behavioral responses are also dampened, with the exception being the
enormous percentage change in money expenditures on the child.
The last two columns in Table 2.4 contrast the impacts of the timing of transfers
on child outcomes. Since the size of the transfer has doubled in the periods in
which it is received, we expect that a larger share of households will be impacted
by the requirement that they spend at least $500 dollars in child investment during
periods in which the transfer is received. In fact, we see this most clearly in the
experiment in which transfers are made early in the development period. The
percentage gain in child investment expenditures is huge, though the impact on
final child quality is almost nonexistent. This is due to a number of factors, the
most important probably being the fact that time investments in the child at
younger ages are significantly more productive than are money investments and
the fact that our model does not allow saving or borrowing by the household.5
The most successful transfer scheme from the point of view of increasing child
quality is the one in which transfers are concentrated at the later stage of the
5If saving was allowed, households may simply wait to spend transfers received in periods inwhich child good expenditures were unproductive until they could be used in periods when theywere more productive. In the PSID data we use, we don’t find evidence of significant amounts ofsavings by a large majority of households, so this possibility may not have practical consequencesfor our policy exercises.
24
development process. The percentage change is over twice as large as the next
best transfer scheme (in this metric), which gives the household half the weekly
transfer over the entire development period. Once again, there is a very large
impact on child good expenditures, but the important thing here is that the relative
productivity of time inputs (with respect to money inputs) is less during this stage
of the development process. While there is substantially more inertia in child
quality at the end of the process, it is also the case that the money expenditures
on child goods at this stage have a more direct impact on the end of process level
of cognitive ability due to their temporal proximity.
2.5 Childcare
We have not explicitly considered the impact of childcare in this modeling and em-
pirical exercise. This framework has been adapted by Brilli (2015) to add childcare
decisions by the mother, although she does not model the father’s contributions to
the child. Her analysis is similar to that of Bernal (2008) in this respect, although
she assumes exogenous wage offers to the mother whereas Bernal allows wage of-
fers to be a function of previous labor supply decisions. Both papers focus on the
early years of development, from ages 0 through 6.
Non-parental childcare is potentially as or more heterogenous than parental
childcare. One source of heterogeneity is the broad array of options available: child-
care can be formally provided in the market or informally provided by relatives
and friends; it can be provided in a center-based setting or through decentralized
home based arrangements. A second source of heterogeneity is the large variation
in quality potentially present within each option.
Bernal concludes the labor market participation of mothers has significant neg-
ative impacts on the child’s cognitive development, since time in child care is es-
timated to be a poor substitute for time with the mother. These results may be
influenced by important assumptions in the model, such as the absence of time
with the father in the production of child quality (and a possible substitute for the
mother’s time). As reported above, we find that father’s time is a good substitute
for the mother’s particularly for children aged 3 and above). Of course, there is a
question of whether the father is available to spend time with the child while the
25

mother is working, something not considered in our framework.
Due to the absence of time budget information, Bernal assumes that all time
the mother does not spend at work is spent in child investment. We find that both
parents consume substantial amounts of leisure time. This means that mothers,
and fathers, have substantial scope for “softening” the impact of employment on
child development by reducing their leisure consumption.
26
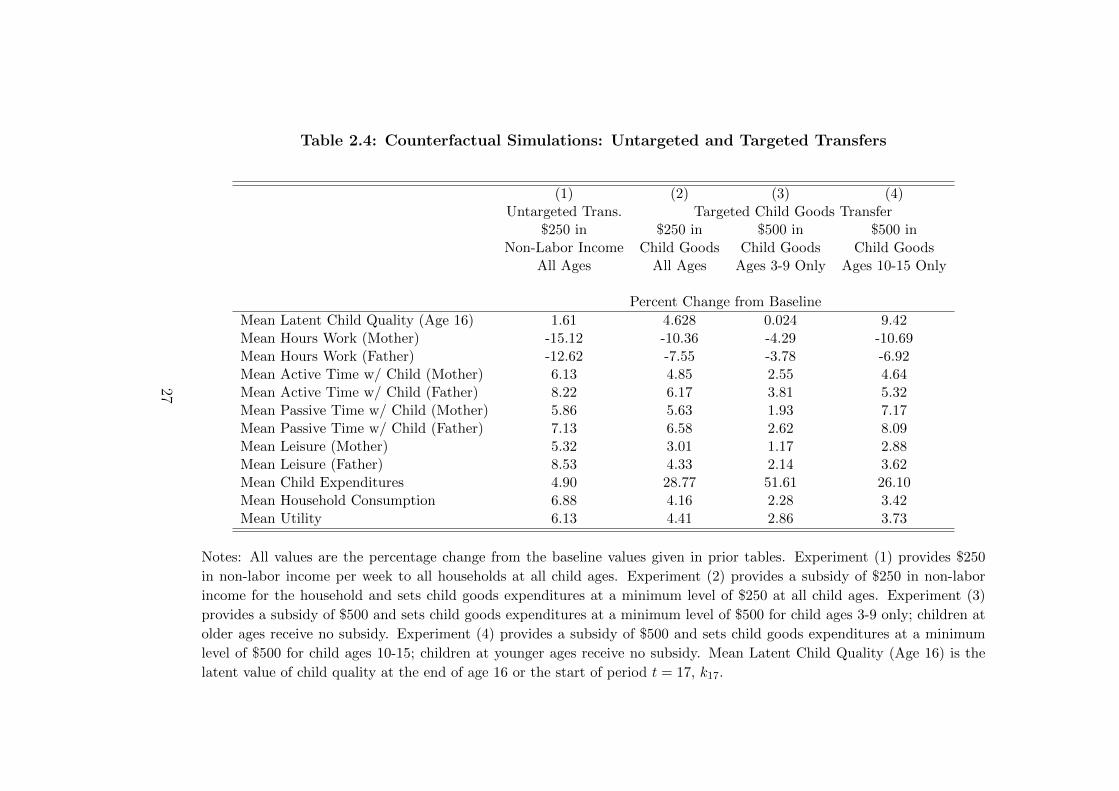
Table 2.4: Counterfactual Simulations: Untargeted and Targeted Transfers
(1) (2) (3) (4)Untargeted Trans. Targeted Child Goods Transfer
$250 in $250 in $500 in $500 inNon-Labor Income Child Goods Child Goods Child Goods
All Ages All Ages Ages 3-9 Only Ages 10-15 Only
Percent Change from Baseline
Mean Latent Child Quality (Age 16) 1.61 4.628 0.024 9.42Mean Hours Work (Mother) -15.12 -10.36 -4.29 -10.69Mean Hours Work (Father) -12.62 -7.55 -3.78 -6.92Mean Active Time w/ Child (Mother) 6.13 4.85 2.55 4.64Mean Active Time w/ Child (Father) 8.22 6.17 3.81 5.32Mean Passive Time w/ Child (Mother) 5.86 5.63 1.93 7.17Mean Passive Time w/ Child (Father) 7.13 6.58 2.62 8.09Mean Leisure (Mother) 5.32 3.01 1.17 2.88Mean Leisure (Father) 8.53 4.33 2.14 3.62Mean Child Expenditures 4.90 28.77 51.61 26.10Mean Household Consumption 6.88 4.16 2.28 3.42Mean Utility 6.13 4.41 2.86 3.73
Notes: All values are the percentage change from the baseline values given in prior tables. Experiment (1) provides $250
in non-labor income per week to all households at all child ages. Experiment (2) provides a subsidy of $250 in non-labor
income for the household and sets child goods expenditures at a minimum level of $250 at all child ages. Experiment (3)
provides a subsidy of $500 and sets child goods expenditures at a minimum level of $500 for child ages 3-9 only; children at
older ages receive no subsidy. Experiment (4) provides a subsidy of $500 and sets child goods expenditures at a minimum
level of $500 for child ages 10-15; children at younger ages receive no subsidy. Mean Latent Child Quality (Age 16) is the
latent value of child quality at the end of age 16 or the start of period t = 17, k17.
27
Our estimates point to the importance of this effect. These are two reasons to
suspect that Bernal’s estimate of the deleterious impact of the mother’s employ-
ment on child development may be overstated.
Brilli (2015) finds that the productivity of maternal time in producing child
quality exceeds that of time spent in childcare, particularly for highly education
mothers (recall that she does not consider the father’s investment in the child).
Since the mother takes these impacts into account when making her labor sup-
ply and investment decisions, the actual impact on child cognitive development
is muted. Households that significantly value their child’s cognitive development
understand that having a mother (and father) spend time away at work will, in
general, limit the growth in the child’s development with respect to a situation
in which this was the only concern in the household. As does our society when
deciding on investments in education, the household realizes that there are oppor-
tunity costs associated with investing in the child and merely attempts to efficiently
allocate the scarce resources at its disposal.
To provide some additional evidence on these key tradeoffs, we use the PSID-
CDS time diary data to examine the types of parental care formal childcare sub-
stitutes for. The effectiveness of formal childcare in improving children’s skills
depends on whether childcare substitutes for lower quality types of care. Condi-
tioning on the child’s age, we find that a 1 hour increase in formal, outside the
home, childcare, is associated with a reduction in the number of hours of mother’s
childcare by about 1/3 of an hour. There is almost no statistically significant re-
lationship between formal childcare and father’s care time. These numbers imply
that formal childcare is mainly trading off with other types of non-parental care
(perhaps care provided by grandparents, siblings, and others). When we turn to
dis-aggregating the maternal care by the “active” and “passive” types, we find
that a 1 hour of formal childcare reduces on average 0.14 hours of active mother’s
care and 0.21 hours of passive care. This suggests that formal childcare trades-off
most strongly with passive maternal care, the less productive form of childcare.
28
2.6 Conclusion
We employ unique data from the PSID-CDS on investments in children to recover
estimates of the child development process. We found that parental time inputs
were more valuable in producing child quality than were money expenditures on
children (at least those made by the household). The value of parental time inputs
decreased with the age of the child, while there was some increase in the value of
money inputs as the child matured.
These results are potentially important for the design of policies to increase
the cognitive ability of children. As is demonstrated in the comparative statics
exercises we perform using the estimated primitive parameters, changes in the
nonlabor income of the household have limited impacts on the cognitive ability of
the child. This result is due to the greater importance of time inputs in the growth
of cognitive ability and the fact that gains in household resources are spread over
parental leisure and household consumption in addition to child investment. The
complex substitution patterns that are generated result in small gains in child
cognitive ability.
29
3 Formal Childcare and Child Out-
comes
Daniela Del Boca, Daniela Piazzalunga, Chiara Pronzato
3.1 Introduction
In this chapter we use data from the Millennium Cohort Study to analyze the link
between early childcare attendance (at the age of 18 months) and child outcomes
in the United Kingdom. As mentioned in the introduction of this book, the UK
closely resembles the US in terms of maternal employment, greater expenditure
on pre-kindergarten education, and higher cognitive performance at the age of
15 (PISA OECD). However, US childcare policies generally target disadvantaged
children, while recent childcare policies in the UK adopt a more universal approach
to coverage.
The availability of formal and affordable childcare for the very young (0-4) has
traditionally been much lower in the UK than in other European countries. The
earliest childcare policies for three and four year olds in the UK were introduced
in the early 2000s. All four year olds since 2000 and all three year olds since
2005 have been entitled to free part-time nursery education. Childcare for the
under-twos instead is mainly provided by the private market and therefore mainly
serves children from families with a higher socio-economic status (West 2010).
In 2013, free part-time education was also extended to disadvantaged two-year
olds, making up about 40 per cent of all two-year olds. This policy involved no
significant change in the amount of public services provided, as its intent was to
make use of the considerable private market for childcare and early education that
30

has developed over the past decades.
The literature analyzing the link between formal childcare and children’s cog-
nitive abilities in the UK has focused on children from disadvantaged families.
Using data from the Effective Provision of Pre-School Education (EPPE) project,
a longitudinal study of early childhood development between the ages of 3 and 7,
Mellhuish et al. (2005) investigate the effects of pre-school education for 3 and 4
year olds, finding that it can foster child development and reduce the disadvantages
experienced by children from low socio-economic backgrounds. Children who had
never attended pre-school had lower levels of attainment (having controlled for
background factors related to the child, parent and home learning environment)
than those who had spent at least some time in pre-school. Blanden et al. (2014)
evaluate whether the introduction of free part-time pre-school education for all 3
year olds has increased the early educational attainment of children in England.
Their results suggest that pre-school attendance has small but positive impacts
on children’s cognitive outcomes, and larger benefits for the most disadvantaged
children, thus contributing to socio-economic mobility.
In this chapter, data from the MCS allows us to analyze the impact of formal
childcare attendance on several child cognitive outcomes, making it possible to
control for a large number of variables and previous cognitive outcomes. Our em-
pirical evidence shows that attending formal childcare at 18 months has a positive
affect on school readiness at age 3 and on other cognitive outcomes at ages 5, 7
and 11.
Here we focus on children under the age of two who are too young to be eligible
for free part-time care provision. Our variable of interest thus mainly reflects the
fact that parents chose for their children to attend private childcare. We evaluate
the role of formal care in reducing inequality to analyse the effect that increased
reliance on formal childcare has on differences in children’s cognitive abilities.
Our results show that childcare policies promoting increased attendance of formal
childcare would help reduce disparities between children in term of their cognitive
skills.
31
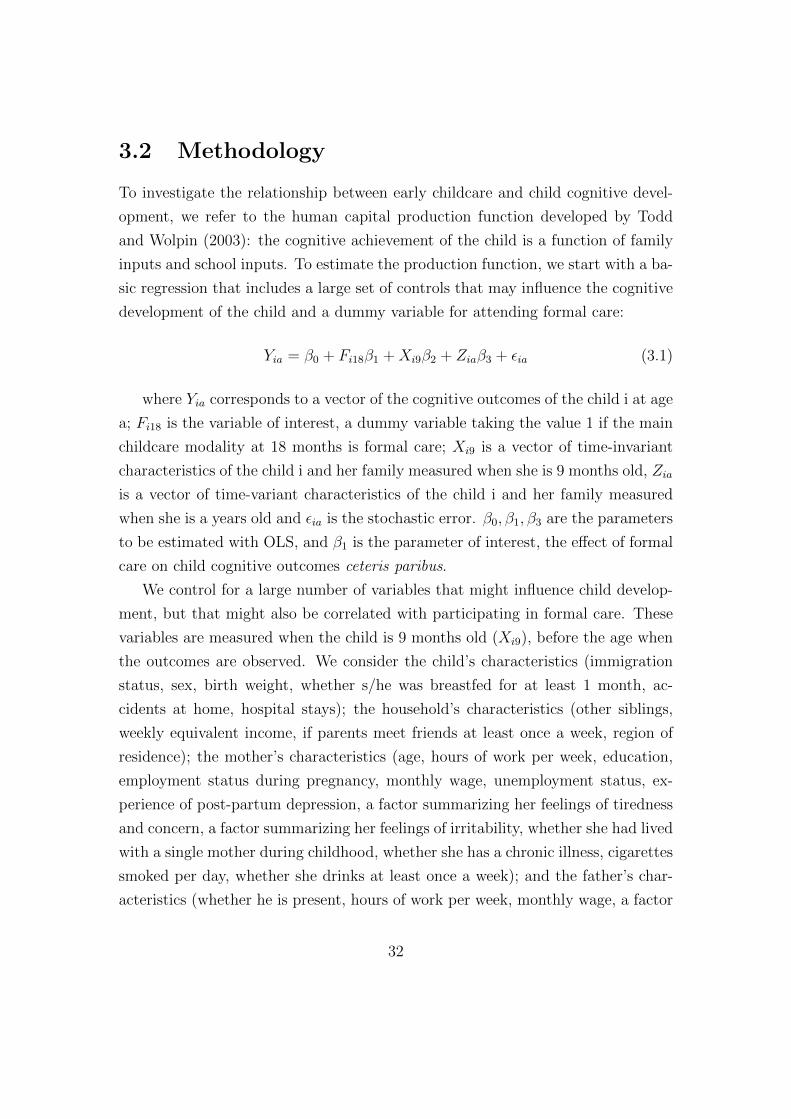
3.2 Methodology
To investigate the relationship between early childcare and child cognitive devel-
opment, we refer to the human capital production function developed by Todd
and Wolpin (2003): the cognitive achievement of the child is a function of family
inputs and school inputs. To estimate the production function, we start with a ba-
sic regression that includes a large set of controls that may influence the cognitive
development of the child and a dummy variable for attending formal care:
Yia = β0 + Fi18β1 +Xi9β2 + Ziaβ3 + εia (3.1)
where Yia corresponds to a vector of the cognitive outcomes of the child i at age
a; Fi18 is the variable of interest, a dummy variable taking the value 1 if the main
childcare modality at 18 months is formal care; Xi9 is a vector of time-invariant
characteristics of the child i and her family measured when she is 9 months old, Zia
is a vector of time-variant characteristics of the child i and her family measured
when she is a years old and εia is the stochastic error. β0, β1, β3 are the parameters
to be estimated with OLS, and β1 is the parameter of interest, the effect of formal
care on child cognitive outcomes ceteris paribus.
We control for a large number of variables that might influence child develop-
ment, but that might also be correlated with participating in formal care. These
variables are measured when the child is 9 months old (Xi9), before the age when
the outcomes are observed. We consider the child’s characteristics (immigration
status, sex, birth weight, whether s/he was breastfed for at least 1 month, ac-
cidents at home, hospital stays); the household’s characteristics (other siblings,
weekly equivalent income, if parents meet friends at least once a week, region of
residence); the mother’s characteristics (age, hours of work per week, education,
employment status during pregnancy, monthly wage, unemployment status, ex-
perience of post-partum depression, a factor summarizing her feelings of tiredness
and concern, a factor summarizing her feelings of irritability, whether she had lived
with a single mother during childhood, whether she has a chronic illness, cigarettes
smoked per day, whether she drinks at least once a week); and the father’s char-
acteristics (whether he is present, hours of work per week, monthly wage, a factor
32

summarizing his feelings of tiredness and concern, a factor summarizing his feel-
ings of irritability, whether he had lived with a single mother during childhood,
cigarettes smoked per day, whether he drinks at least once a week). These variables
provide measures for the socio-economic background of the family, the “cognitive”
characteristics of the parents (work, education, etc.), their non-cognitive charac-
teristics, and their “investment” in the child (e.g. breastfeeding, smoking). In
order not to lose too many observations, we replace missing observations of the
control variables with 0 and construct four missing variable indicators (for the
child, the household, the mother, the father).
In addition, we control for the following variables that can vary over time (Zia):
the presence of the father at home, the presence of a new partner of the mother
at home, household income, and the arrival of new siblings.
It should be kept in mind that since there may be omitted variables correlating
both with the decision to enrol the child in formal care and with her cognitive
outcomes, the results might be biased.
To improve our estimation, for the outcomes at age 5, 7, and 11, we include a
dummy variable equal to 1 if the child has ever been in formal care between the
age of 3 and 5 years (Fi60)1: this variable captures later input choices.
Yia = β0 + Fi18β1 +Xi9β2 + Ziaβ3 + Fi36β4 + εia (3.2)
Then, we include previous outcomes to control for the past early cognitive
abilities of the child Yik, in the spirit of the value added approach:
Yia = β0 + Fi18β1 +Xi9β2 + Ziaβ3 + Fi36β4 +a−1∑k=1
Yikβk + εia (3.3)
By including the past output of the child production function in the estimated
equation, we implicitly control for the set of past inputs as well as for the child
initial endowment and previous development. For the outcomes at age 3, since
there are no previous outcomes, we include child endowments at 9 months, i.e.,
three factor variables that summarize the motion, motor and communication de-
1Obviously, we cannot control for formal care after age 3 on outcomes at age 3.
33
velopment of the child. At age 5, in addition to child endowments at 9 months, we
control for outcomes at age 3; at age 7, we include child endowments at 9 months,
outcomes at age 3 and 5; etc.
The results estimated using specification 3 can be considered as a lower bound
of the true effect, since part of the impact of being in formal care has been absorbed
by previous cognitive outcomes. For this reason, our preferred specification is
specification 2.
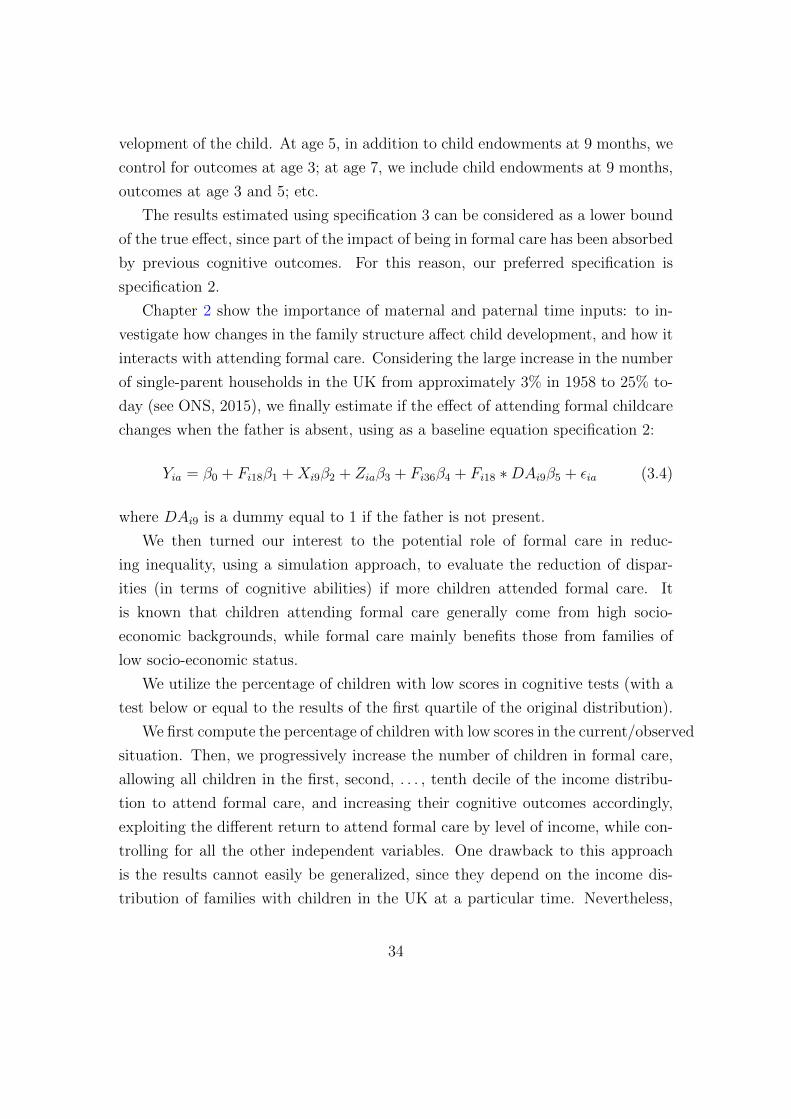
Chapter 2 show the importance of maternal and paternal time inputs: to in-
vestigate how changes in the family structure affect child development, and how it
interacts with attending formal care. Considering the large increase in the number
of single-parent households in the UK from approximately 3% in 1958 to 25% to-
day (see ONS, 2015), we finally estimate if the effect of attending formal childcare
changes when the father is absent, using as a baseline equation specification 2:
Yia = β0 + Fi18β1 +Xi9β2 + Ziaβ3 + Fi36β4 + Fi18 ∗DAi9β5 + εia (3.4)
where DAi9 is a dummy equal to 1 if the father is not present.
We then turned our interest to the potential role of formal care in reduc-
ing inequality, using a simulation approach, to evaluate the reduction of dispar-
ities (in terms of cognitive abilities) if more children attended formal care. It
is known that children attending formal care generally come from high socio-
economic backgrounds, while formal care mainly benefits those from families of
low socio-economic status.
We utilize the percentage of children with low scores in cognitive tests (with a
test below or equal to the results of the first quartile of the original distribution).
We first compute the percentage of children with low scores in the current/observed
situation. Then, we progressively increase the number of children in formal care,
allowing all children in the first, second, . . . , tenth decile of the income distribu-
tion to attend formal care, and increasing their cognitive outcomes accordingly,
exploiting the different return to attend formal care by level of income, while con-
trolling for all the other independent variables. One drawback to this approach
is the results cannot easily be generalized, since they depend on the income dis-
tribution of families with children in the UK at a particular time. Nevertheless,
34
the exercise can be informative of the impact of formal care in reducing cognitive
disparities.
The underlying equation for the simulation is based on specification 2 and is
as follows:
Yia = β0 +Fi18β1 +10∑l=2
Ilβl +10∑
l,m=2
Fi18 ∗ Ilβm +Xi9β2 +Ziaβ3 +Fi36β4 ++εia (3.5)
where Il refers to the income decile and Fi18 ∗ Il to the interaction between
attending formal care and the income decile.
3.3 Data
The MCS is a longitudinal survey conducted by the Centre for Longitudinal Studies
(CLS) that tracks the lives of a sample of about 19,000 children born in the UK in
the year 2000/2001. The first wave of the survey, which was carried out when the
children were around 9 months old, focuses on the circumstances of the pregnancy
and birth as well as the first few months of life. The first part of the survey
also contains important information about the socio-economic background of the
family into which the child is born. Subsequent waves (2 through 5) took place
when the children were about 3, 52, 7 and 113 years old, and the main focus was
on continuity and change in the family as well as the parenting environment to
extract information about the child’s development. A number of variables were
added, to follow and track the development of the child.
In wave 1, the survey consists of 18,552 children. We exclude twins and children
whose main caregiver (and also the main respondent) in wave 1 is not the mother,
since childcare arrangements and the development of the child may be different.
In addition, we lose around 10% of the sample at every new wave due to attrition.
Our main independent variable is formal childcare attendance when the child is 18
months old. It is constructed using retrospective information in wave 2 (when the
child is 3 years old); however, a number of mothers (around 2,000) did not answer
2At the start of primary school.3At the start of secondary school.
35
these questions, and are excluded from the sample (probably because of a filter
error in the questionnaire).4 We further select only children with valid measures
of all the cognitive outcomes used in the analysis. Our final sample consists of a
balanced panel of 7,240 observations.
The MCS contains a number of child cognitive and non-cognitive outcomes:
the first set of outcomes is assessed by the interviewer through standardized tests
of cognitive abilities, taken from validated cognitive tests for children, and focuses
on the child’s ability to perform certain tasks; a second set is reported by the
teacher (starting when the child is 5 and 7) and concerns abilities and behavior
at school; a third set is reported by the mother and regards the child’s behavior
at home. We only consider the first set of outcomes, because it is available from
age 3 and because it is the most objective: the fact that the mother’s report may
be highly biased and the teacher’s evaluations may be influenced by comparison
of the child with others in the class are factors we are not able to control for.
We study the effect of formal childcare on the following outcomes: Bracken
School Readiness assessment (at age 3), Naming Vocabulary (ages 3 and 5), Picture
Similarity (age 5), Pattern Construction (ages 5 and 7), Word Reading Score and
the Number Skills (age 7), Verbal Score (age 11), and Spatial Working Memory
Time, Strategy and Errors (age 11).
The Bracken School Readiness test is used to assess basic concept development;
the Naming Vocabulary verbal test assesses the spoken vocabulary of the child; the
Picture Similarity test measures children’s non-verbal reasoning (Connelly, 2013);
the Pattern Construction test assesses the spatial problem-solving ability of the
child (Connelly, 2013). The Word reading test gives an indication of the child’s
reading skills. The Number skills test evaluates the child’s abilities in the areas of
numbers, shape, and measures. The Verbal Similarities assessment is considered a
measure of the ability to apply previous learning and experience to new situations
(Sullivan and Brown 2014). The Spatial Working Memory task (SWM) measures
participants’ ability to preserve spatial information; it is also thought to measure
the ability to reason and solve problems without prior knowledge or experience
(Sullivan and Brown, 2014). The key outcomes are Strategy, Time taken until last
4Information on childcare arrangements is also available from wave 1, but only for workingmothers.
36
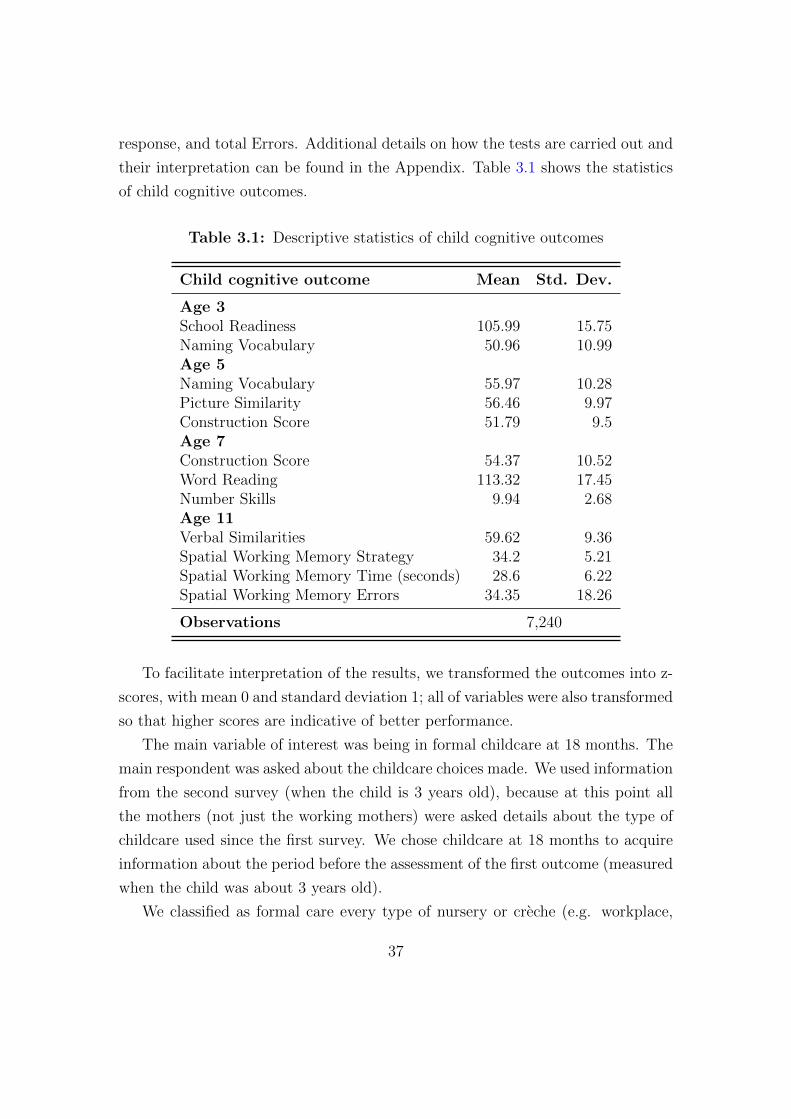
response, and total Errors. Additional details on how the tests are carried out and
their interpretation can be found in the Appendix. Table 3.1 shows the statistics
of child cognitive outcomes.
Table 3.1: Descriptive statistics of child cognitive outcomes
Child cognitive outcome Mean Std. Dev.
Age 3School Readiness 105.99 15.75Naming Vocabulary 50.96 10.99Age 5Naming Vocabulary 55.97 10.28Picture Similarity 56.46 9.97Construction Score 51.79 9.5Age 7Construction Score 54.37 10.52Word Reading 113.32 17.45Number Skills 9.94 2.68Age 11Verbal Similarities 59.62 9.36Spatial Working Memory Strategy 34.2 5.21Spatial Working Memory Time (seconds) 28.6 6.22Spatial Working Memory Errors 34.35 18.26
Observations 7,240
To facilitate interpretation of the results, we transformed the outcomes into z-
scores, with mean 0 and standard deviation 1; all of variables were also transformed
so that higher scores are indicative of better performance.
The main variable of interest was being in formal childcare at 18 months. The
main respondent was asked about the childcare choices made. We used information
from the second survey (when the child is 3 years old), because at this point all
the mothers (not just the working mothers) were asked details about the type of
childcare used since the first survey. We chose childcare at 18 months to acquire
information about the period before the assessment of the first outcome (measured
when the child was about 3 years old).
We classified as formal care every type of nursery or creche (e.g. workplace,
37

local authority, private, nursery school, nursery in primary school), special day
school (for children with special needs), playgroup and combined child/family cen-
ter. 12% of children in our sample are in formal care. The alternative category
includes all other modes of care: supplied by: parents, grandparents, other rela-
tives, friends or child-minders. Children are most often cared for by their parents
(59% of children in the total sample).
3.4 Empirical Results
What we find from the data is that early formal care attendance is positively
correlated with several cognitive outcomes, from age 3 up to age 11 (Table 3.2).
Using the first specification, formal care has a positive and significant effect on
School Readiness at age 3, Picture Similarity at age 5, Number Skills at age 7 and
Spatial Working Memory Errors at age 11. However, formal care at 18 months has
a negative and significant effect on Naming Vocabulary at age 3.
These results are robust to the inclusion of formal care attendance between the
ages of 3 and 5 and to the inclusion of past outcomes. When we include also past
outcomes, there is a small reduction in the estimated coefficients and level of signif-
icance for Number Skills and Spatial Working Memory Errors, which nonetheless
remain positive and significantly different from 0. However, it is important to
keep in mind that in those cases we have added 8 (11) variables controlling for
past outcomes, which are highly correlated with the outcome of interest, and ab-
sorb part of the variation. The effect of formal care is stronger when the father is
absent (specification 4), significant at age 3, and it turns out to be positive also
on Naming Vocabulary.
While we cannot interpret these results as causal, the inclusion of all past
outcomes should largely reduce the bias due to unobserved heterogeneity. At the
same time, it is encouraging to notice that the results are not particularly affected
by the inclusion of the past attainment. Thus, we are confident in considering
specification 2 as our preferred specification.
38
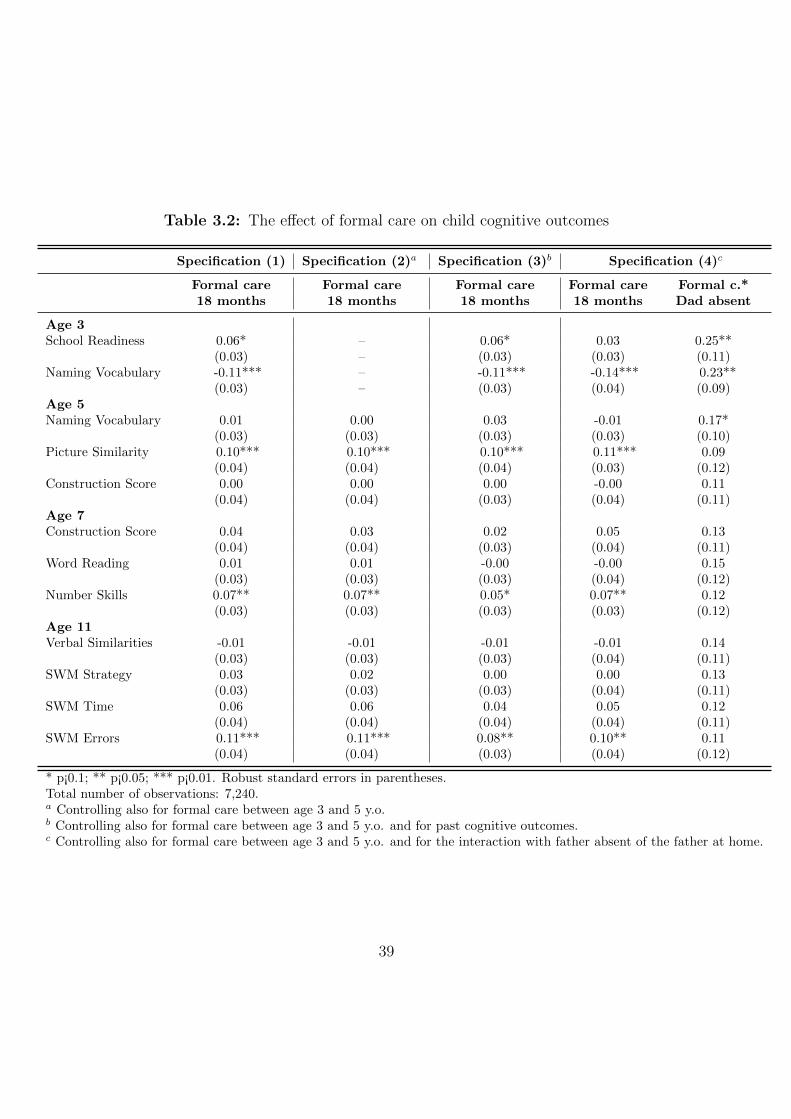
Table 3.2: The effect of formal care on child cognitive outcomes
Specification (1) Specification (2)a Specification (3)b Specification (4)c
Formal care Formal care Formal care Formal care Formal c.*18 months 18 months 18 months 18 months Dad absent
Age 3School Readiness 0.06* – 0.06* 0.03 0.25**
(0.03) – (0.03) (0.03) (0.11)Naming Vocabulary -0.11*** – -0.11*** -0.14*** 0.23**
(0.03) – (0.03) (0.04) (0.09)Age 5Naming Vocabulary 0.01 0.00 0.03 -0.01 0.17*
(0.03) (0.03) (0.03) (0.03) (0.10)Picture Similarity 0.10*** 0.10*** 0.10*** 0.11*** 0.09
(0.04) (0.04) (0.04) (0.03) (0.12)Construction Score 0.00 0.00 0.00 -0.00 0.11
(0.04) (0.04) (0.03) (0.04) (0.11)Age 7Construction Score 0.04 0.03 0.02 0.05 0.13
(0.04) (0.04) (0.03) (0.04) (0.11)Word Reading 0.01 0.01 -0.00 -0.00 0.15
(0.03) (0.03) (0.03) (0.04) (0.12)Number Skills 0.07** 0.07** 0.05* 0.07** 0.12
(0.03) (0.03) (0.03) (0.03) (0.12)Age 11Verbal Similarities -0.01 -0.01 -0.01 -0.01 0.14
(0.03) (0.03) (0.03) (0.04) (0.11)SWM Strategy 0.03 0.02 0.00 0.00 0.13
(0.03) (0.03) (0.03) (0.04) (0.11)SWM Time 0.06 0.06 0.04 0.05 0.12
(0.04) (0.04) (0.04) (0.04) (0.11)SWM Errors 0.11*** 0.11*** 0.08** 0.10** 0.11
(0.04) (0.04) (0.03) (0.04) (0.12)
* p¡0.1; ** p¡0.05; *** p¡0.01. Robust standard errors in parentheses.Total number of observations: 7,240.a Controlling also for formal care between age 3 and 5 y.o.b Controlling also for formal care between age 3 and 5 y.o. and for past cognitive outcomes.c Controlling also for formal care between age 3 and 5 y.o. and for the interaction with father absent of the father at home.
39
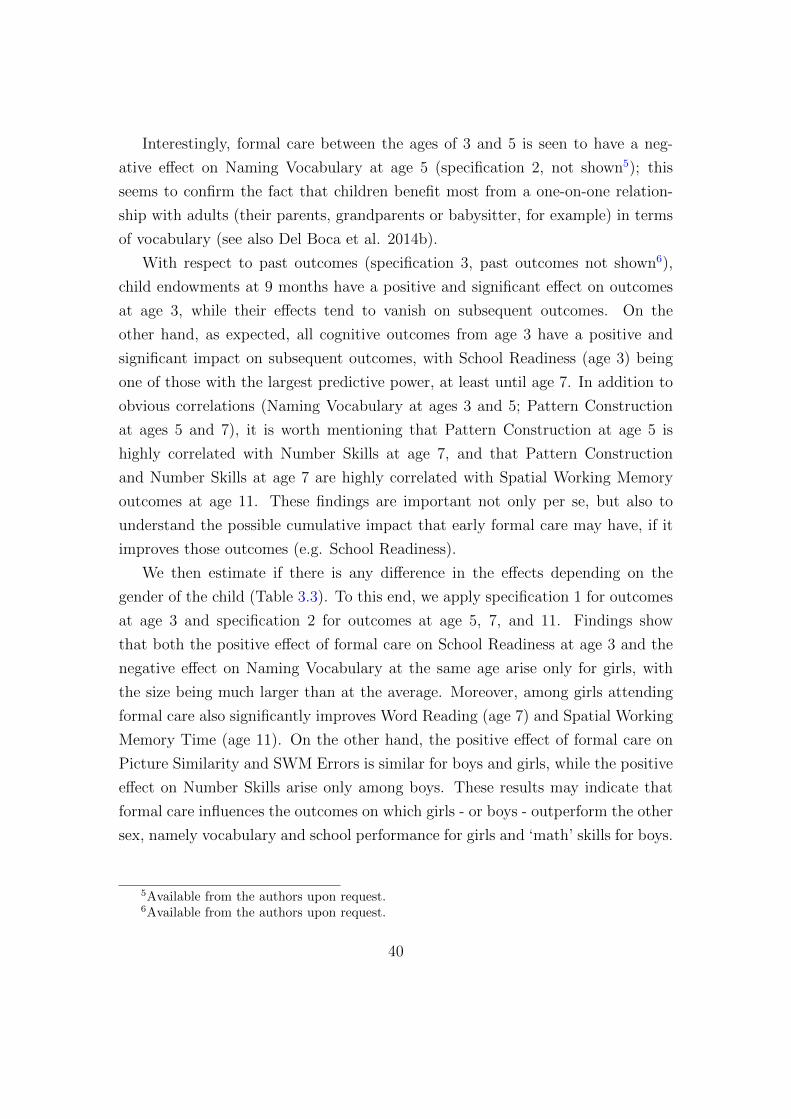
Interestingly, formal care between the ages of 3 and 5 is seen to have a neg-
ative effect on Naming Vocabulary at age 5 (specification 2, not shown5); this
seems to confirm the fact that children benefit most from a one-on-one relation-
ship with adults (their parents, grandparents or babysitter, for example) in terms
of vocabulary (see also Del Boca et al. 2014b).
With respect to past outcomes (specification 3, past outcomes not shown6),
child endowments at 9 months have a positive and significant effect on outcomes
at age 3, while their effects tend to vanish on subsequent outcomes. On the
other hand, as expected, all cognitive outcomes from age 3 have a positive and
significant impact on subsequent outcomes, with School Readiness (age 3) being
one of those with the largest predictive power, at least until age 7. In addition to
obvious correlations (Naming Vocabulary at ages 3 and 5; Pattern Construction
at ages 5 and 7), it is worth mentioning that Pattern Construction at age 5 is
highly correlated with Number Skills at age 7, and that Pattern Construction
and Number Skills at age 7 are highly correlated with Spatial Working Memory
outcomes at age 11. These findings are important not only per se, but also to
understand the possible cumulative impact that early formal care may have, if it
improves those outcomes (e.g. School Readiness).
We then estimate if there is any difference in the effects depending on the
gender of the child (Table 3.3). To this end, we apply specification 1 for outcomes
at age 3 and specification 2 for outcomes at age 5, 7, and 11. Findings show
that both the positive effect of formal care on School Readiness at age 3 and the
negative effect on Naming Vocabulary at the same age arise only for girls, with
the size being much larger than at the average. Moreover, among girls attending
formal care also significantly improves Word Reading (age 7) and Spatial Working
Memory Time (age 11). On the other hand, the positive effect of formal care on
Picture Similarity and SWM Errors is similar for boys and girls, while the positive
effect on Number Skills arise only among boys. These results may indicate that
formal care influences the outcomes on which girls - or boys - outperform the other
sex, namely vocabulary and school performance for girls and ‘math’ skills for boys.
5Available from the authors upon request.6Available from the authors upon request.
40
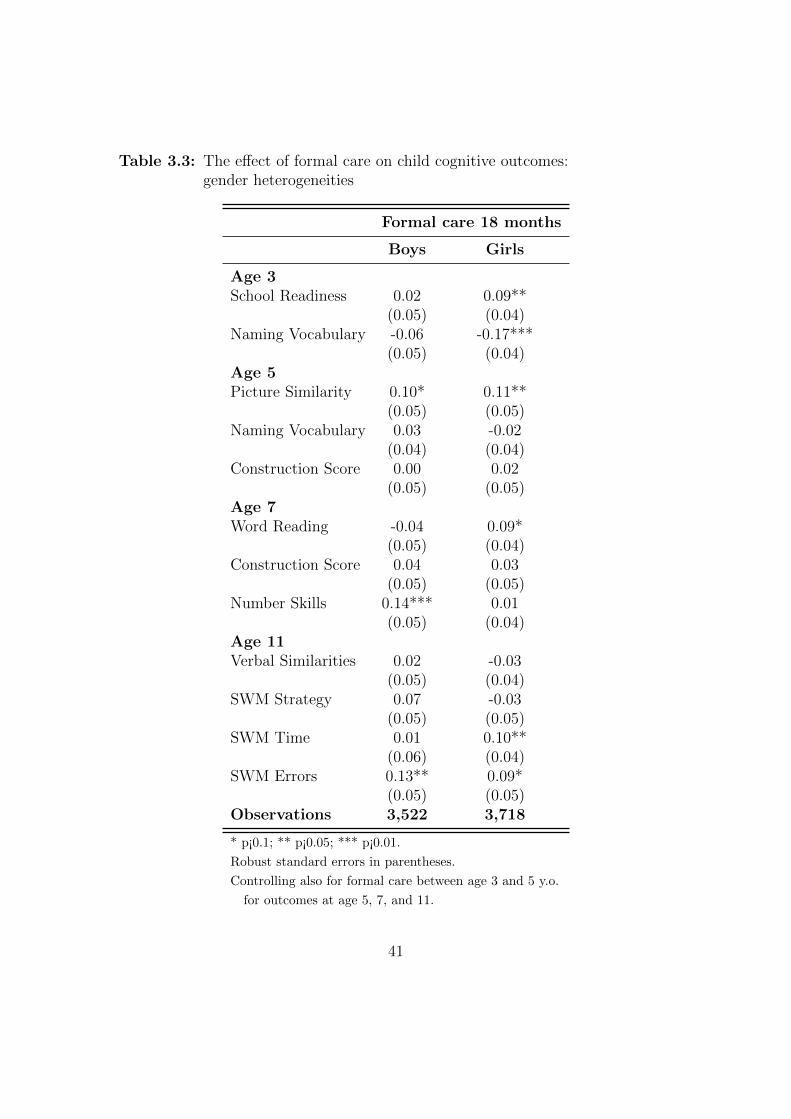
Table 3.3: The effect of formal care on child cognitive outcomes:gender heterogeneities
Formal care 18 months
Boys Girls
Age 3School Readiness 0.02 0.09**
(0.05) (0.04)Naming Vocabulary -0.06 -0.17***
(0.05) (0.04)Age 5Picture Similarity 0.10* 0.11**
(0.05) (0.05)Naming Vocabulary 0.03 -0.02
(0.04) (0.04)Construction Score 0.00 0.02
(0.05) (0.05)Age 7Word Reading -0.04 0.09*
(0.05) (0.04)Construction Score 0.04 0.03
(0.05) (0.05)Number Skills 0.14*** 0.01
(0.05) (0.04)Age 11Verbal Similarities 0.02 -0.03
(0.05) (0.04)SWM Strategy 0.07 -0.03
(0.05) (0.05)SWM Time 0.01 0.10**
(0.06) (0.04)SWM Errors 0.13** 0.09*
(0.05) (0.05)Observations 3,522 3,718
* p¡0.1; ** p¡0.05; *** p¡0.01.
Robust standard errors in parentheses.
Controlling also for formal care between age 3 and 5 y.o.
for outcomes at age 5, 7, and 11.
41

We also examined the predictors of attending formal care7: ceteris paribus,
household income is positively correlated with attending formal care, as is the
number of hours the mother works. On the other hand, children are less likely
to be enrolled in early formal care if the mother does not work, if the father
is present, and if there are siblings. Interestingly, the development of the child
at 9 months has no effect on attending formal care. An increase in household
weekly equivalent income by £100 would increase participation in formal care by
2 percentage points. Increasing the percentage of mothers with a high level of
education by 25 percentage points (from 43% to 68%) would increase the number
of children in formal care by 1 percentage point. These results indicate that while
formal care is more common in wealthier families, indirect policies are not enough
for stimulating higher attendance rates.
Our next step was therefore to investigate the possible effects of a policy in-
troducing free formal care for all children in the first, second, . . . , tenth deciles of
household income. The starting point was about 12% of children 18 months old
attending formal care on average. Table 3.4 presents some descriptive statistics
about the attendance of formal care and labour market outcomes of the mother by
income decile. As expected, there are fewer children in formal care in the lowest
deciles (about 5-6%), while the attendance rate reaches 16% in the 8th decile, 25%
in the 9th, and 33% in the top decile. Simultaneously, the percentage of mothers
working increases along the wage distribution, from 16% to about 80%, as well as
the number of hours worked and hourly wage.
When we allowed for children of each decile to attend formal care, we increased
that measure by about 9% each time, from an attendance rate of 22.7% up to
100%, when children from every family background are enrolled in formal care.
We simulate the percentage of children with low scores only for those outcomes for
which formal care has a significant effect. Figure 3.1 presents the results for School
Readiness and Naming Score at age 3, Picture Similarity (age 5), Number Skills
(age 7), and Spatial Working Memory (age 11). The red point/bar represents the
baseline condition, i.e., with the level of attendance and the percentage of children
7These are the results of a regression in which attending formal care is the dependent variable,and all the control variables mentioned earlier are the independent variables. In addition, wealso control for the child endowments at 9 months. The results are not shown for the sake ofbrevity, but are available from the author upon request.
42
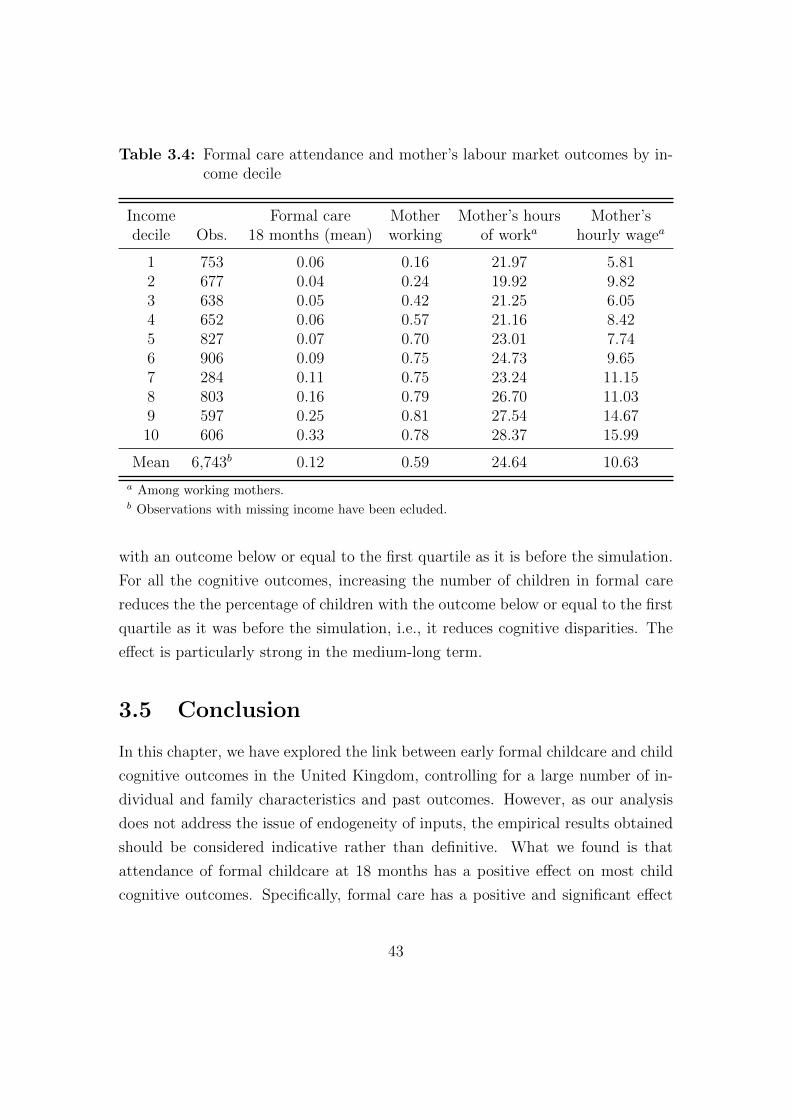
Table 3.4: Formal care attendance and mother’s labour market outcomes by in-come decile
Income Formal care Mother Mother’s hours Mother’sdecile Obs. 18 months (mean) working of worka hourly wagea
1 753 0.06 0.16 21.97 5.812 677 0.04 0.24 19.92 9.823 638 0.05 0.42 21.25 6.054 652 0.06 0.57 21.16 8.425 827 0.07 0.70 23.01 7.746 906 0.09 0.75 24.73 9.657 284 0.11 0.75 23.24 11.158 803 0.16 0.79 26.70 11.039 597 0.25 0.81 27.54 14.6710 606 0.33 0.78 28.37 15.99
Mean 6,743b 0.12 0.59 24.64 10.63
a Among working mothers.b Observations with missing income have been ecluded.
with an outcome below or equal to the first quartile as it is before the simulation.
For all the cognitive outcomes, increasing the number of children in formal care
reduces the the percentage of children with the outcome below or equal to the first
quartile as it was before the simulation, i.e., it reduces cognitive disparities. The
effect is particularly strong in the medium-long term.
3.5 Conclusion
In this chapter, we have explored the link between early formal childcare and child
cognitive outcomes in the United Kingdom, controlling for a large number of in-
dividual and family characteristics and past outcomes. However, as our analysis
does not address the issue of endogeneity of inputs, the empirical results obtained
should be considered indicative rather than definitive. What we found is that
attendance of formal childcare at 18 months has a positive effect on most child
cognitive outcomes. Specifically, formal care has a positive and significant effect
43

on School Readiness at age 3, Picture Similarity at age 5, Number Skills at age
7, and Spatial Working Memory Errors at age 11. Further exploration of this link
simulating the impact of a policy to increases the number of children attending
formal childcare suggests that an increase in the number of children attending
formal care would significantly reduce cognitive disparities among children. These
results confirm previous findings for the UK showing that pre-school formal edu-
cation improves the cognitive abilities of disadvantaged children. The limitation
of our exercise is its implicit assumption that the same patterns in the data hold
true when the proportion of children in childcare is dramatically increased.
44
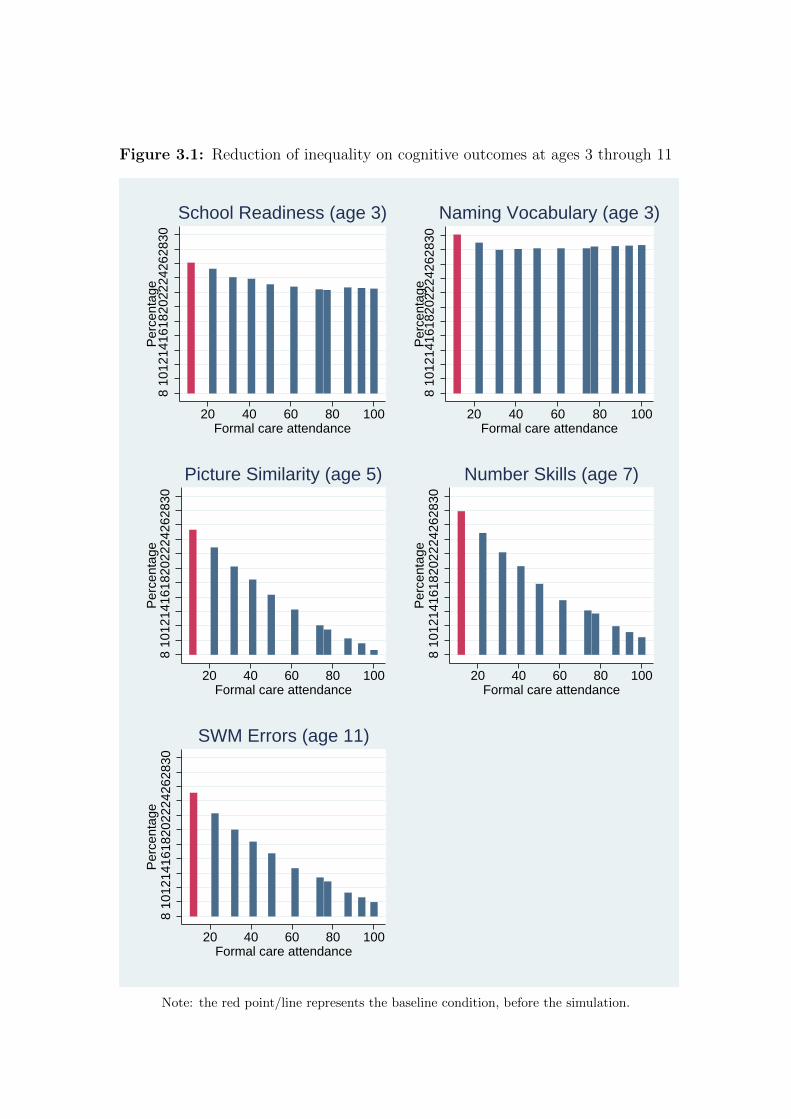
Figure 3.1: Reduction of inequality on cognitive outcomes at ages 3 through 118
1012
1416
1820
2224
2628
30P
erce
ntag
e
20 40 60 80 100Formal care attendance
School Readiness (age 3)
810
1214
1618
2022
2426
2830
Per
cent
age
20 40 60 80 100Formal care attendance
Naming Vocabulary (age 3)
810
1214
1618
2022
2426
2830
Per
cent
age
20 40 60 80 100Formal care attendance
Picture Similarity (age 5)
810
1214
1618
2022
2426
2830
Per
cent
age
20 40 60 80 100Formal care attendance
Number Skills (age 7)
810
1214
1618
2022
2426
2830
Per
cent
age
20 40 60 80 100Formal care attendance
SWM Errors (age 11)
Note: the red point/line represents the baseline condition, before the simulation.
3.A The cognitive outcomes
The tests used in the MCS are derived from standardized tests: the Bracken Basic
Concept Scale-Revised, the British Ability Scale II, the Progress in Math test,
and the Cambridge Neuropsychological Test Automated Battery. The Bracken
School Readiness assessment is used to assess basic concept development in young
children, and is one element of the Bracken Basic Concept Scale-Revised (BBCS-
R), which measures the comprehension of 308 functionally relevant educational
concepts in 11 subtests or concept categories. Only 6 subsets are implemented
for the Bracken School Readiness used in the MCS: colors (primary and basic),
letters (knowledge of upper- or lower- case letters), numbers/counting (single and
double-digits numbers and assigning a number to a set of objects), sizes (concepts
that describe one, two and three dimensions), comparisons (the ability to match
or differentiate objects), and shapes (including lines, circles, squares, cubes and
pyramids). The BAS (British Ability Scale II) Naming Vocabulary Verbal test
assesses the spoken vocabulary of the child. Children are shown individual test
items from booklets of colorful pictures of objects and asked to name the objects.
The scale measures language ability; picture recognition is also crucial, but un-
likely to cause problems (Hansen, 2012). Low scores may also reflect reluctance to
speak. For the BAS Picture Similarity test, children are shown a row of 4 pictures
on a page and asked to place a card with a fifth picture under the picture most
similar to it. This assessment measures children’s non-verbal reasoning (Connelly,
2013). The BAS Pattern Construction test assesses the child’s accuracy and speed
in constructing a design by putting together flat squares or solid cubes with black
and yellow patterns on each side. The test assesses the spatial problem-solving
ability of the child (Connelly, 2013). In the BAS Word reading test the child reads
a series of words presented on a card out loud, thus giving an indication of his or
her reading skills. The Number skills test is adapted from the National Founda-
tion for Education Research (NFER) Progress in Math test. In this assessment,
children complete various tasks, covering the topics of numbers, shape, space and
measures, and data handling. In the BAS Verbal Similarities assessment, the in-
terviewer reads three words to the child and the child must say how the words are
related. It is considered a measure of the ability to apply what have been previ-
46

ously learned and experienced to new situations (Sullivan and Brown 2014). The
Spatial Working Memory task (SWM) is drawn from the Cambridge Neuropsy-
chological Test Automated Battery (CANTAB). It measures participants’ ability
to preserve spatial information; it is also thought to measure the ability to reason
and solve problems without prior knowledge or experience (Sullivan and Brown
2014). The task is to find tokens hidden in boxes in the display. The key outcomes
are Strategy (use of a search sequence to complete the tasks in the most efficient
way), Time taken until last response, and total Errors.
47
4 Childcare Related Outcomes and
the Role of Selection Criteria
Daniela Del Boca, Chiara Pronzato, Giuseppe Sorrenti
4.1 Introduction
According to the Italian National Institute of Statistics (ISTAT), despite growth
in the number of childcare users in Italy over the last decade, still only 13% of
children aged 0-2 obtained a slot in the public childcare system in 2013. Child-
care policies are usually driven by two main considerations: Firstly, childcare is
an important factor in enabling maternal employment; and secondly, childcare at-
tendance contributes to children’s cognitive and non-cognitive development later
in life (Heckman et al., 2003). These considerations are particularly salient in
institutional contexts with low rates of maternal employment and below-average
student performance.
Italy is a clear case where childcare provision would yield considerable social
benefits, given that its maternal employment rate and student performance are
both considerably lower than elsewhere in Europe. Maternal participation in the
labor market in Italy is just 54.5%, as opposed to approximately 80% in countries
such as Denmark or the Netherlands, and Italian students perform well below the
OECD average in both mathematics and reading, as indicated by the PISA 2012
cross-country assessment of children’s standardized test scores. In this chapter
we explore the link between childcare attendance, maternal employment and child
outcomes in Italy, taking into account important features of the Italian system,
such as childcare rationing.
48

4.2 The Italian childcare system
In spite of the recent growth in private sector provision of childcare services, the
Italian childcare system is still mainly public. The past decade has seen a gradual
increase in public expenditure on childcare by the municipalities, as well as in the
number of municipalities providing childcare services (Table 4.A). However, both
demand and supply of childcare remain low. The demand of childcare did not
grow for two reasons. Firstly, the strong relationships within the family and the
low mobility have favoured a persistent and crucial role of grandparents in caring
grandchildren. Grandparents’ care is not only cheaper, but also more convenient,
flexible and reliable. Secondly, fertility rates remain low except among immigrant
households.1 Concerning the supply side, only about half of the Italian municipal-
ities manage to provide public childcare services, and this is likely to be a limiting
factor for maternal employment and child development.
The territorial divide in childcare provision is striking, with significant hetero-
geneity in school availability (and quality) between the North and the South. The
percentage of children enrolled in public childcare - or in childcare centers financed
by the municipality - is also highly variable. On average, 3.5% of children aged
0-2 in the south are enrolled in public childcare, whereas this figure reaches ap-
proximately 17% in central and northern Italy. Regional variability is even more
pronounced. As shown in Figure 4.1, the min-max range at the regional level is
around 25 percentage points. All of the regions that have less than 10% child-
care coverage are in southern Italy, while the three regions with more than 20%
coverage are in the north.
These disparities in public childcare services are driven by many different fac-
tors, but the main one is the availability of financial and economic resources to
ensure service sustainability. Since financial and economic constraints are a prob-
lem in many areas, childcare prices and the criteria for selecting children who will
attend become essential elements in guaranteeing a sufficient level of service cover-
age. On the one hand, policy makers can adjust the fees families are charged so as
1Immigrant households, who on average have a larger number of young children 0-6, cannotenjoy the vicinity of grandparents but do not use formal childcare because of monetary, culturaland information constraints. Moreover, often immigrant mothers are less likely to work.
49
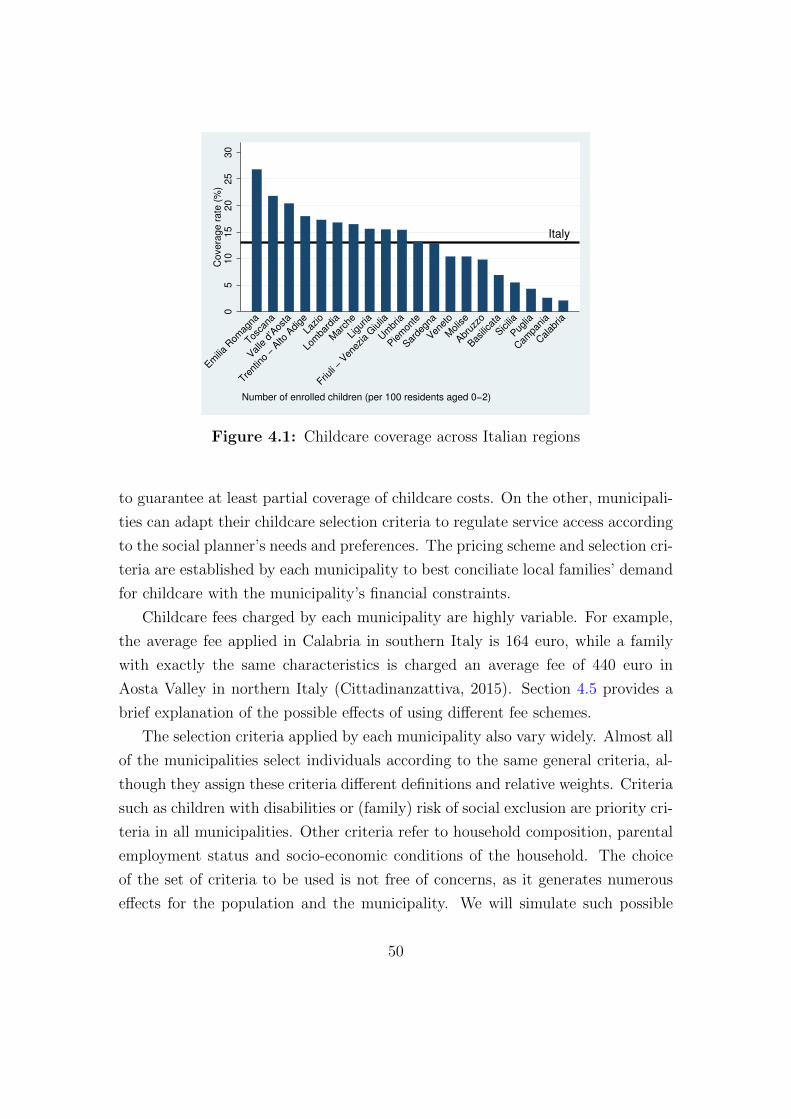
Italy0
51
01
52
02
53
0C
overa
ge
ra
te (
%)
Emilia
Rom
agna
Tosca
na
Valle d
’Aos
ta
Trent
ino
− Alto
Adige
Lazio
Lom
bard
ia
Mar
che
Ligu
ria
Friuli −
Venez
ia G
iulia
Um
bria
Piem
onte
Sarde
gna
Venet
o
Molise
Abruz
zo
Basilic
ata
Sicilia
Puglia
Cam
pania
Calab
ria
Number of enrolled children (per 100 residents aged 0−2)
Figure 4.1: Childcare coverage across Italian regions
to guarantee at least partial coverage of childcare costs. On the other, municipali-
ties can adapt their childcare selection criteria to regulate service access according
to the social planner’s needs and preferences. The pricing scheme and selection cri-
teria are established by each municipality to best conciliate local families’ demand
for childcare with the municipality’s financial constraints.
Childcare fees charged by each municipality are highly variable. For example,
the average fee applied in Calabria in southern Italy is 164 euro, while a family
with exactly the same characteristics is charged an average fee of 440 euro in
Aosta Valley in northern Italy (Cittadinanzattiva, 2015). Section 4.5 provides a
brief explanation of the possible effects of using different fee schemes.
The selection criteria applied by each municipality also vary widely. Almost all
of the municipalities select individuals according to the same general criteria, al-
though they assign these criteria different definitions and relative weights. Criteria
such as children with disabilities or (family) risk of social exclusion are priority cri-
teria in all municipalities. Other criteria refer to household composition, parental
employment status and socio-economic conditions of the household. The choice
of the set of criteria to be used is not free of concerns, as it generates numerous
effects for the population and the municipality. We will simulate such possible
50
effects in the remainder of the chapter.
To sum up, the characteristics of the Italian case allow us to explore the ef-
fects of early childcare on maternal employment and child outcomes, as well as
to evaluate the impact of different formal childcare selection criteria. In Section
4.3, we provide empirical estimates of the link between childcare provision and
maternal employment. In Section 4.4, we report empirical estimates of the link
between childcare and child outcomes. Finally, in Section 4.5 we take into account
rationing in public childcare access together with fee schemes and formal childcare
selection criteria. Simple simulation exercises indicate that the fees and selection
criteria applied by each municipality impact the costs and benefits of childcare
provision.
4.3 Childcare and maternal employment
The impact of childcare use on maternal employment is difficult to assess. The
potential endogeneity of childcare use makes it difficult to interpret the results as
causal. Here we compare two different empirical strategies of exploring the link
between childcare and maternal employment in Italy.
The first strategy aims at understanding the effect of public childcare avail-
ability on maternal employment when the child is in the second grade of primary
school (7 years old). The dataset used is from the Italian Institute for the Evalu-
ation of the Education System (INVALSI), and it collects information about the
parents’ and children’s characteristics such as parents’ work and educational sta-
tus, and children’s gender and immigration status. The data set also contains a
variable related to childcare attendance when the child was less than 3, but is
not reliable due to the large number of missing variables (40%). To address this
limitation, individual information about childcare attendance is substituted with
childcare coverage at the provincial level experienced by each individual in the
sample. As a result, the effect of interest should be interpreted as an Intention
to Treat effect (ITT). Table 4.1 reports the main results of both OLS and GLS
specifications. The GLS specification is implemented to take into consideration
the error components at the provincial level.
Both the OLS and GLS coefficients of childcare provision on maternal em-
51
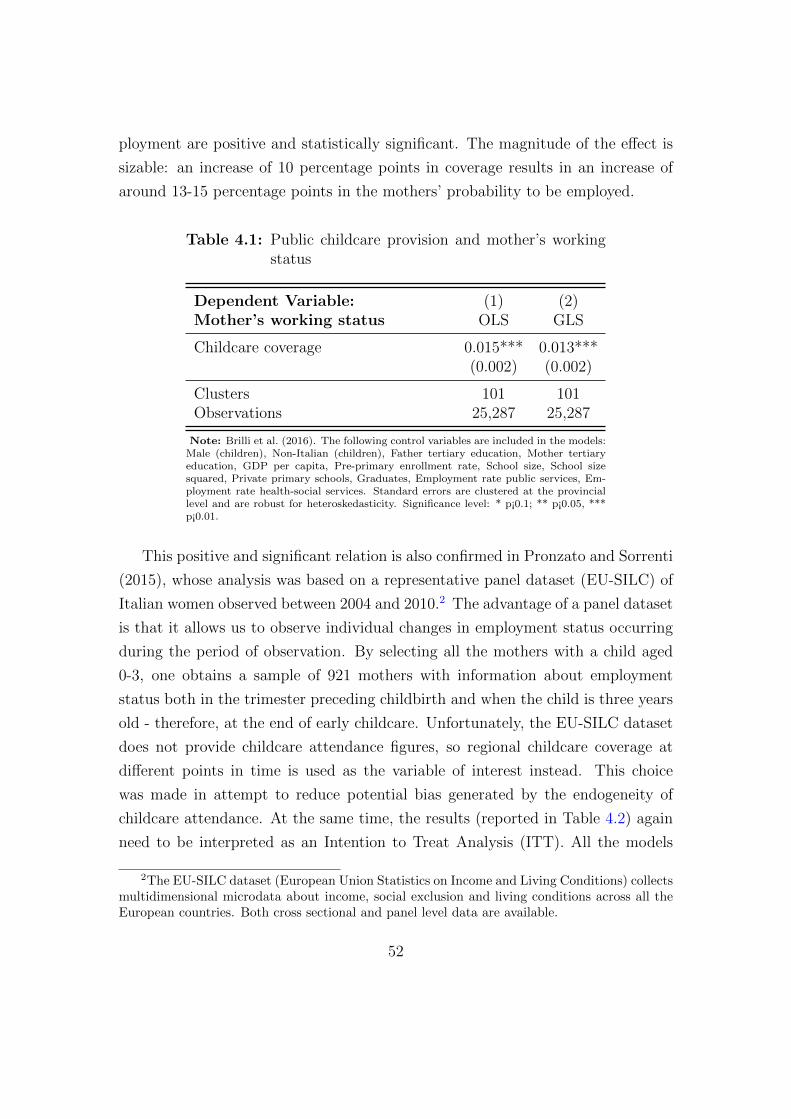
ployment are positive and statistically significant. The magnitude of the effect is
sizable: an increase of 10 percentage points in coverage results in an increase of
around 13-15 percentage points in the mothers’ probability to be employed.
Table 4.1: Public childcare provision and mother’s workingstatus
Dependent Variable: (1) (2)Mother’s working status OLS GLS
Childcare coverage 0.015*** 0.013***(0.002) (0.002)
Clusters 101 101Observations 25,287 25,287
Note: Brilli et al. (2016). The following control variables are included in the models:Male (children), Non-Italian (children), Father tertiary education, Mother tertiaryeducation, GDP per capita, Pre-primary enrollment rate, School size, School sizesquared, Private primary schools, Graduates, Employment rate public services, Em-ployment rate health-social services. Standard errors are clustered at the provinciallevel and are robust for heteroskedasticity. Significance level: * p¡0.1; ** p¡0.05, ***p¡0.01.
This positive and significant relation is also confirmed in Pronzato and Sorrenti
(2015), whose analysis was based on a representative panel dataset (EU-SILC) of
Italian women observed between 2004 and 2010.2 The advantage of a panel dataset
is that it allows us to observe individual changes in employment status occurring
during the period of observation. By selecting all the mothers with a child aged
0-3, one obtains a sample of 921 mothers with information about employment
status both in the trimester preceding childbirth and when the child is three years
old - therefore, at the end of early childcare. Unfortunately, the EU-SILC dataset
does not provide childcare attendance figures, so regional childcare coverage at
different points in time is used as the variable of interest instead. This choice
was made in attempt to reduce potential bias generated by the endogeneity of
childcare attendance. At the same time, the results (reported in Table 4.2) again
need to be interpreted as an Intention to Treat Analysis (ITT). All the models
2The EU-SILC dataset (European Union Statistics on Income and Living Conditions) collectsmultidimensional microdata about income, social exclusion and living conditions across all theEuropean countries. Both cross sectional and panel level data are available.
52
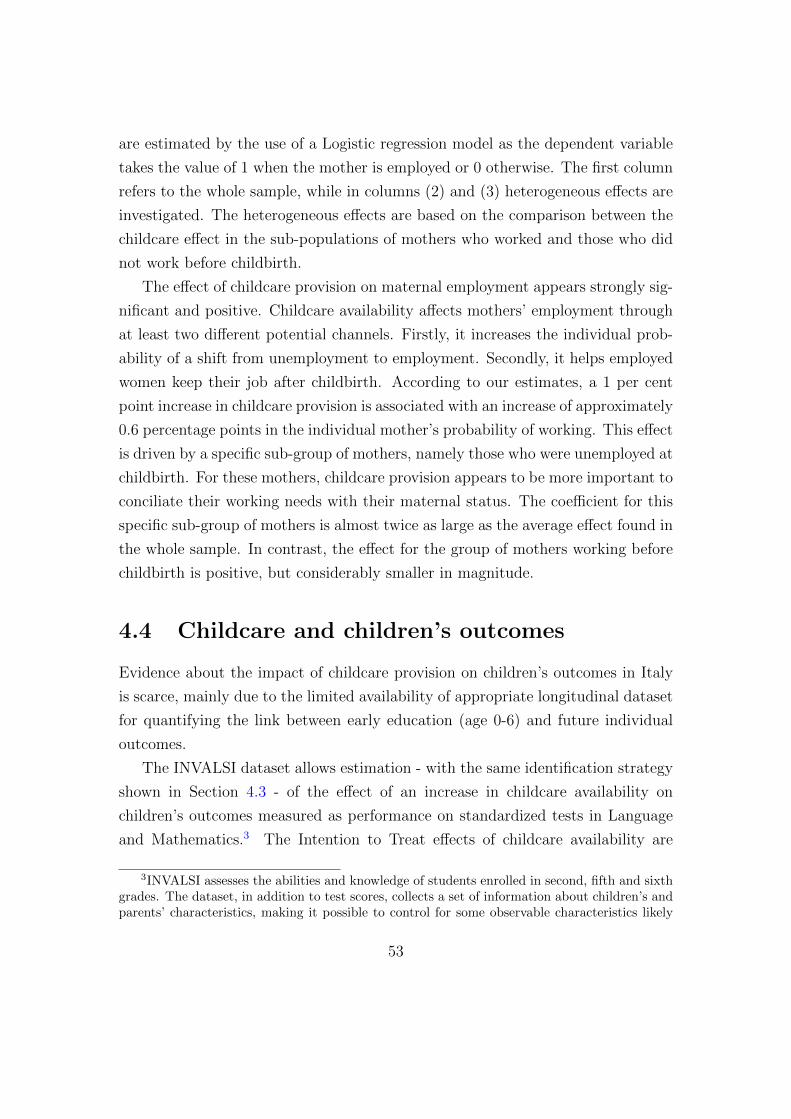
are estimated by the use of a Logistic regression model as the dependent variable
takes the value of 1 when the mother is employed or 0 otherwise. The first column
refers to the whole sample, while in columns (2) and (3) heterogeneous effects are
investigated. The heterogeneous effects are based on the comparison between the
childcare effect in the sub-populations of mothers who worked and those who did
not work before childbirth.
The effect of childcare provision on maternal employment appears strongly sig-
nificant and positive. Childcare availability affects mothers’ employment through
at least two different potential channels. Firstly, it increases the individual prob-
ability of a shift from unemployment to employment. Secondly, it helps employed
women keep their job after childbirth. According to our estimates, a 1 per cent
point increase in childcare provision is associated with an increase of approximately
0.6 percentage points in the individual mother’s probability of working. This effect
is driven by a specific sub-group of mothers, namely those who were unemployed at
childbirth. For these mothers, childcare provision appears to be more important to
conciliate their working needs with their maternal status. The coefficient for this
specific sub-group of mothers is almost twice as large as the average effect found in
the whole sample. In contrast, the effect for the group of mothers working before
childbirth is positive, but considerably smaller in magnitude.
4.4 Childcare and children’s outcomes
Evidence about the impact of childcare provision on children’s outcomes in Italy
is scarce, mainly due to the limited availability of appropriate longitudinal dataset
for quantifying the link between early education (age 0-6) and future individual
outcomes.
The INVALSI dataset allows estimation - with the same identification strategy
shown in Section 4.3 - of the effect of an increase in childcare availability on
children’s outcomes measured as performance on standardized tests in Language
and Mathematics.3 The Intention to Treat effects of childcare availability are
3INVALSI assesses the abilities and knowledge of students enrolled in second, fifth and sixthgrades. The dataset, in addition to test scores, collects a set of information about children’s andparents’ characteristics, making it possible to control for some observable characteristics likely
53
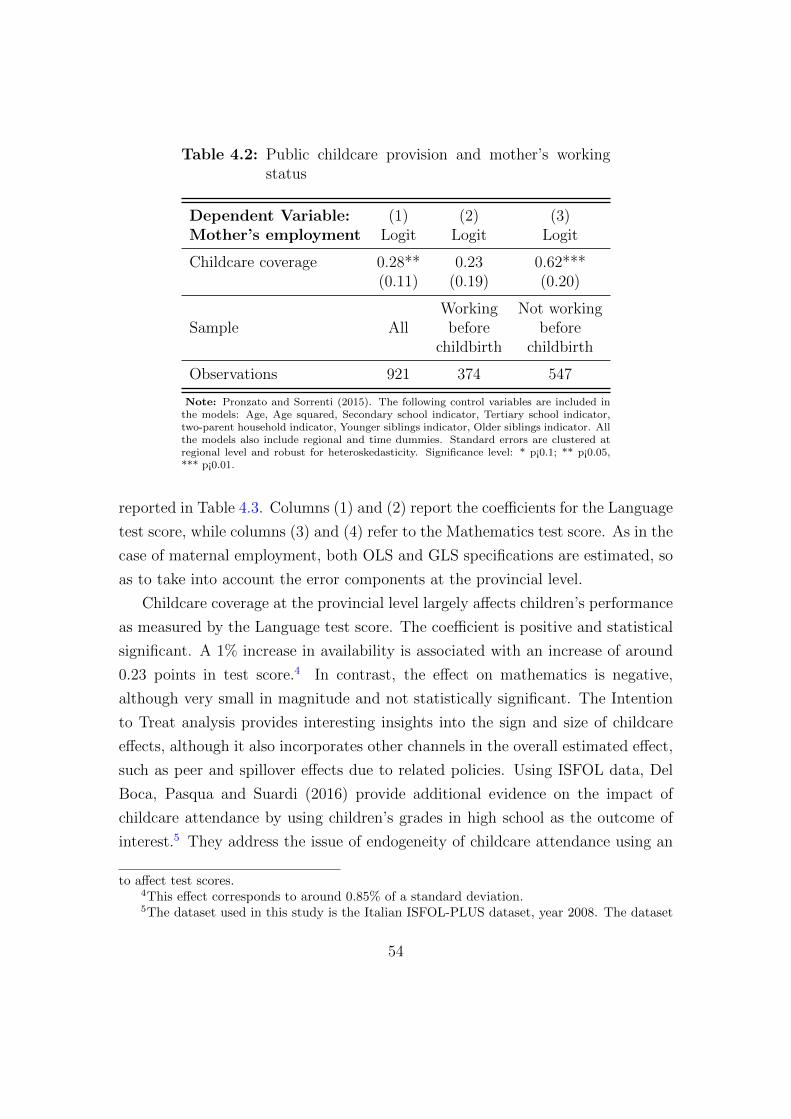
Table 4.2: Public childcare provision and mother’s workingstatus
Dependent Variable: (1) (2) (3)Mother’s employment Logit Logit Logit
Childcare coverage 0.28** 0.23 0.62***(0.11) (0.19) (0.20)
Working Not workingSample All before before
childbirth childbirth
Observations 921 374 547
Note: Pronzato and Sorrenti (2015). The following control variables are included inthe models: Age, Age squared, Secondary school indicator, Tertiary school indicator,two-parent household indicator, Younger siblings indicator, Older siblings indicator. Allthe models also include regional and time dummies. Standard errors are clustered atregional level and robust for heteroskedasticity. Significance level: * p¡0.1; ** p¡0.05,*** p¡0.01.
reported in Table 4.3. Columns (1) and (2) report the coefficients for the Language
test score, while columns (3) and (4) refer to the Mathematics test score. As in the
case of maternal employment, both OLS and GLS specifications are estimated, so
as to take into account the error components at the provincial level.
Childcare coverage at the provincial level largely affects children’s performance
as measured by the Language test score. The coefficient is positive and statistical
significant. A 1% increase in availability is associated with an increase of around
0.23 points in test score.4 In contrast, the effect on mathematics is negative,
although very small in magnitude and not statistically significant. The Intention
to Treat analysis provides interesting insights into the sign and size of childcare
effects, although it also incorporates other channels in the overall estimated effect,
such as peer and spillover effects due to related policies. Using ISFOL data, Del
Boca, Pasqua and Suardi (2016) provide additional evidence on the impact of
childcare attendance by using children’s grades in high school as the outcome of
interest.5 They address the issue of endogeneity of childcare attendance using an
to affect test scores.4This effect corresponds to around 0.85% of a standard deviation.5The dataset used in this study is the Italian ISFOL-PLUS dataset, year 2008. The dataset
54
instrumental variable technique, and they find a positive and significant impact of
childcare attendance.
Table 4.3: Public childcare provision and children’s outcomes
Dependent Variable: Language test score Mathematics test score
(1) (2) (3) (4)OLS GLS OLS GLS
Childcare coverage 0.233*** 0.195*** -0.010 -0.001(0.062) (0.069) (0.042) (0.055)
Clusters 101 101 101 101Observations 33,708 33,708 33,708 33,708
Note: Brilli et al. (2016). The following control variables are included in the models: Male (children),Non-Italian (children), Father tertiary education, Mother tertiary education, GDP per capita, Pre-primaryenrollment rate, School size, School size squared, Private primary schools, Graduates, Employment rate publicservices, Employment rate health-social services. Standard errors are clustered at province level and robust forheteroskedasticity. Significance level: * p¡0.1; ** p¡0.05, *** p¡0.01.
4.5 The role of selection criteria
One of the most peculiar aspects of the Italian public childcare system is the
presence of rationing. In all Italian regions, demand for childcare is greater than
supply, and in some Italian regions (e.g. Basilicata) only 2 out of 3 children have
access to childcare.
In a context of excess demand, the social planner adopts a rationing system
that allocates the available slots according to its own preferences and a series of
constraints. The Italian case is particularly interesting in terms of the role of the
social planner’s choices in shaping the outcomes related to childcare provision. In
fact, the decision-making process for childcare policies related to children aged 0-3
is highly decentralized. The central government establishes the common standards
provides information on each respondent’s demographic characteristics, as well as a set of ret-rospective information on the individual’s school grades at the end of junior high school, highschool, and university; along with - in the 2008 wave only - information about the respondent’sformal childcare attendance and mother’s employment status when she/he was under age ofthree.
55
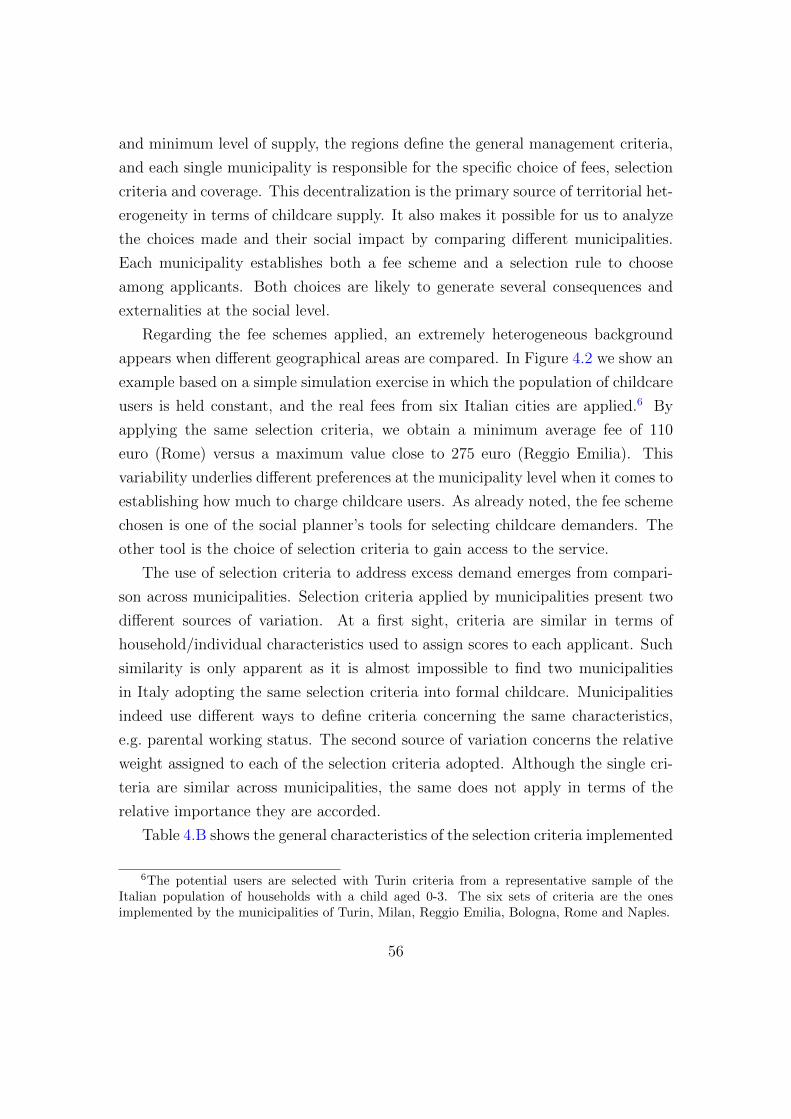
and minimum level of supply, the regions define the general management criteria,
and each single municipality is responsible for the specific choice of fees, selection
criteria and coverage. This decentralization is the primary source of territorial het-
erogeneity in terms of childcare supply. It also makes it possible for us to analyze
the choices made and their social impact by comparing different municipalities.
Each municipality establishes both a fee scheme and a selection rule to choose
among applicants. Both choices are likely to generate several consequences and
externalities at the social level.
Regarding the fee schemes applied, an extremely heterogeneous background
appears when different geographical areas are compared. In Figure 4.2 we show an
example based on a simple simulation exercise in which the population of childcare
users is held constant, and the real fees from six Italian cities are applied.6 By
applying the same selection criteria, we obtain a minimum average fee of 110
euro (Rome) versus a maximum value close to 275 euro (Reggio Emilia). This
variability underlies different preferences at the municipality level when it comes to
establishing how much to charge childcare users. As already noted, the fee scheme
chosen is one of the social planner’s tools for selecting childcare demanders. The
other tool is the choice of selection criteria to gain access to the service.
The use of selection criteria to address excess demand emerges from compari-
son across municipalities. Selection criteria applied by municipalities present two
different sources of variation. At a first sight, criteria are similar in terms of
household/individual characteristics used to assign scores to each applicant. Such
similarity is only apparent as it is almost impossible to find two municipalities
in Italy adopting the same selection criteria into formal childcare. Municipalities
indeed use different ways to define criteria concerning the same characteristics,
e.g. parental working status. The second source of variation concerns the relative
weight assigned to each of the selection criteria adopted. Although the single cri-
teria are similar across municipalities, the same does not apply in terms of the
relative importance they are accorded.
Table 4.B shows the general characteristics of the selection criteria implemented
6The potential users are selected with Turin criteria from a representative sample of theItalian population of households with a child aged 0-3. The six sets of criteria are the onesimplemented by the municipalities of Turin, Milan, Reggio Emilia, Bologna, Rome and Naples.
56
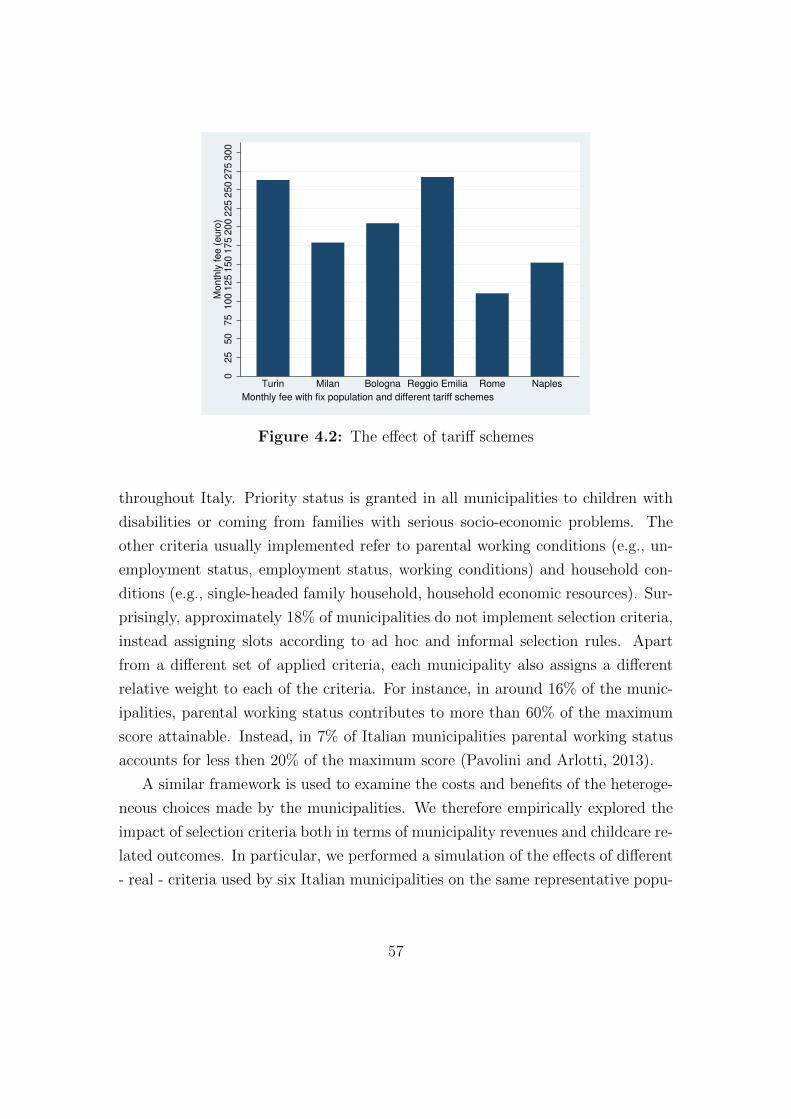
02
55
07
51
00
12
51
50
17
52
00
22
52
50
27
53
00
Mo
nth
ly fe
e (
euro
)
Turin Milan Bologna Reggio Emilia Rome Naples
Monthly fee with fix population and different tariff schemes
Figure 4.2: The effect of tariff schemes
throughout Italy. Priority status is granted in all municipalities to children with
disabilities or coming from families with serious socio-economic problems. The
other criteria usually implemented refer to parental working conditions (e.g., un-
employment status, employment status, working conditions) and household con-
ditions (e.g., single-headed family household, household economic resources). Sur-
prisingly, approximately 18% of municipalities do not implement selection criteria,
instead assigning slots according to ad hoc and informal selection rules. Apart
from a different set of applied criteria, each municipality also assigns a different
relative weight to each of the criteria. For instance, in around 16% of the munic-
ipalities, parental working status contributes to more than 60% of the maximum
score attainable. Instead, in 7% of Italian municipalities parental working status
accounts for less then 20% of the maximum score (Pavolini and Arlotti, 2013).
A similar framework is used to examine the costs and benefits of the heteroge-
neous choices made by the municipalities. We therefore empirically explored the
impact of selection criteria both in terms of municipality revenues and childcare re-
lated outcomes. In particular, we performed a simulation of the effects of different
- real - criteria used by six Italian municipalities on the same representative popu-
57
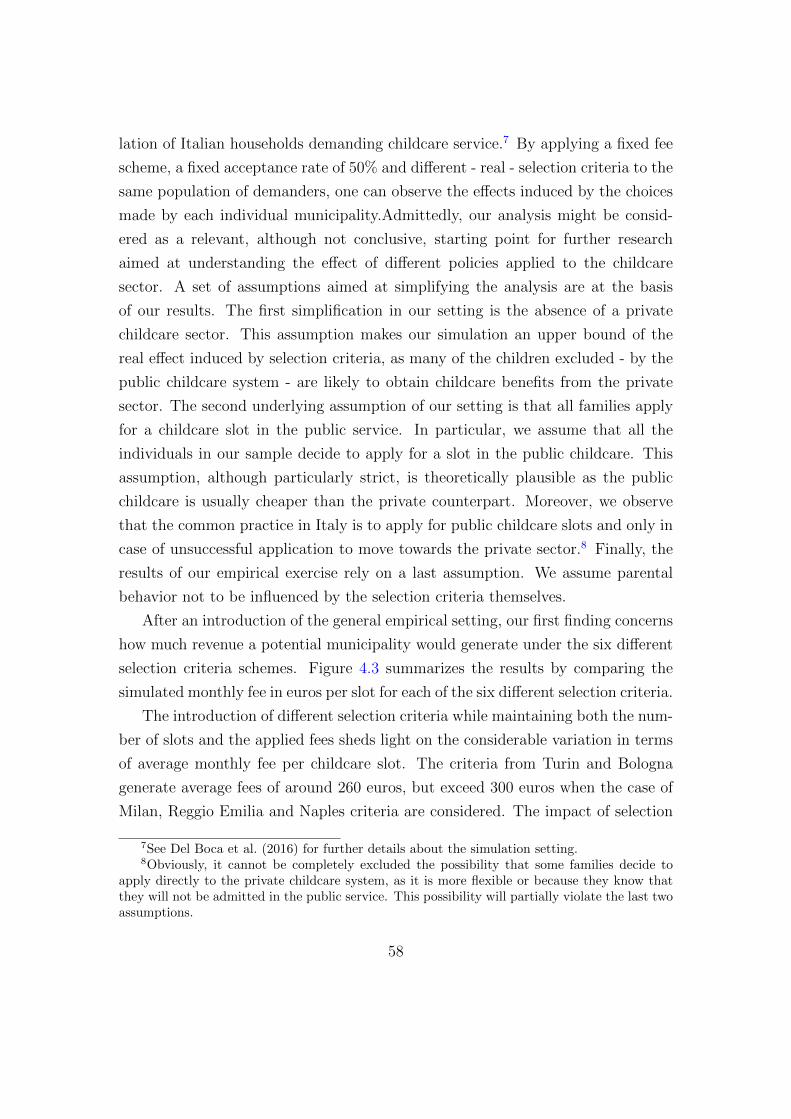
lation of Italian households demanding childcare service.7 By applying a fixed fee
scheme, a fixed acceptance rate of 50% and different - real - selection criteria to the
same population of demanders, one can observe the effects induced by the choices
made by each individual municipality.Admittedly, our analysis might be consid-
ered as a relevant, although not conclusive, starting point for further research
aimed at understanding the effect of different policies applied to the childcare
sector. A set of assumptions aimed at simplifying the analysis are at the basis
of our results. The first simplification in our setting is the absence of a private
childcare sector. This assumption makes our simulation an upper bound of the
real effect induced by selection criteria, as many of the children excluded - by the
public childcare system - are likely to obtain childcare benefits from the private
sector. The second underlying assumption of our setting is that all families apply
for a childcare slot in the public service. In particular, we assume that all the
individuals in our sample decide to apply for a slot in the public childcare. This
assumption, although particularly strict, is theoretically plausible as the public
childcare is usually cheaper than the private counterpart. Moreover, we observe
that the common practice in Italy is to apply for public childcare slots and only in
case of unsuccessful application to move towards the private sector.8 Finally, the
results of our empirical exercise rely on a last assumption. We assume parental
behavior not to be influenced by the selection criteria themselves.
After an introduction of the general empirical setting, our first finding concerns
how much revenue a potential municipality would generate under the six different
selection criteria schemes. Figure 4.3 summarizes the results by comparing the
simulated monthly fee in euros per slot for each of the six different selection criteria.
The introduction of different selection criteria while maintaining both the num-
ber of slots and the applied fees sheds light on the considerable variation in terms
of average monthly fee per childcare slot. The criteria from Turin and Bologna
generate average fees of around 260 euros, but exceed 300 euros when the case of
Milan, Reggio Emilia and Naples criteria are considered. The impact of selection
7See Del Boca et al. (2016) for further details about the simulation setting.8Obviously, it cannot be completely excluded the possibility that some families decide to
apply directly to the private childcare system, as it is more flexible or because they know thatthey will not be admitted in the public service. This possibility will partially violate the last twoassumptions.
58
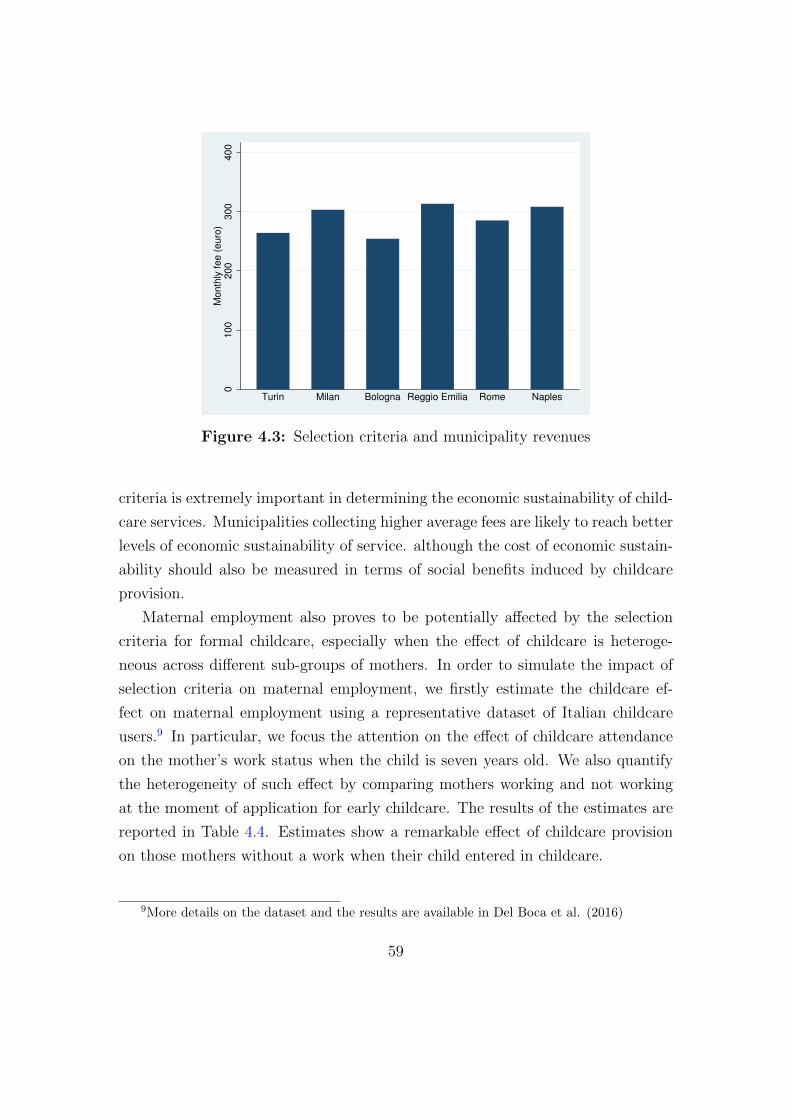
01
00
20
03
00
40
0M
on
thly
fe
e (
eu
ro)
Turin Milan Bologna Reggio Emilia Rome Naples
Figure 4.3: Selection criteria and municipality revenues
criteria is extremely important in determining the economic sustainability of child-
care services. Municipalities collecting higher average fees are likely to reach better
levels of economic sustainability of service. although the cost of economic sustain-
ability should also be measured in terms of social benefits induced by childcare
provision.
Maternal employment also proves to be potentially affected by the selection
criteria for formal childcare, especially when the effect of childcare is heteroge-
neous across different sub-groups of mothers. In order to simulate the impact of
selection criteria on maternal employment, we firstly estimate the childcare ef-
fect on maternal employment using a representative dataset of Italian childcare
users.9 In particular, we focus the attention on the effect of childcare attendance
on the mother’s work status when the child is seven years old. We also quantify
the heterogeneity of such effect by comparing mothers working and not working
at the moment of application for early childcare. The results of the estimates are
reported in Table 4.4. Estimates show a remarkable effect of childcare provision
on those mothers without a work when their child entered in childcare.
9More details on the dataset and the results are available in Del Boca et al. (2016)
59
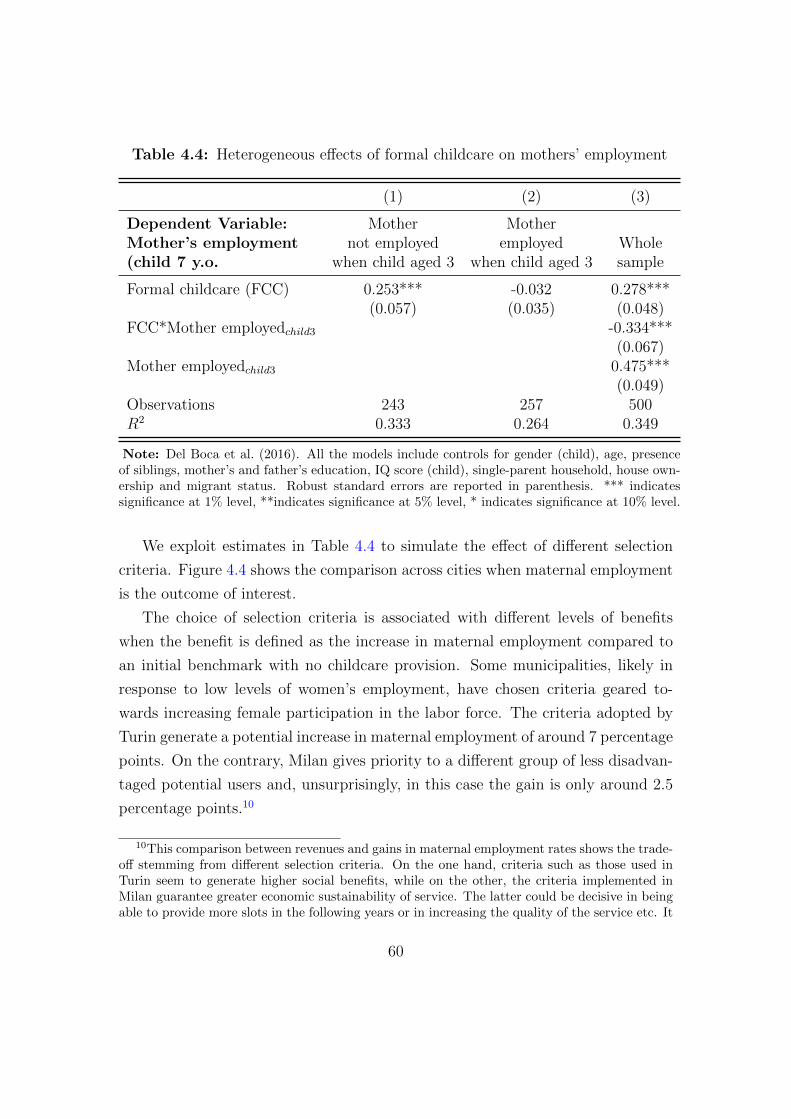
Table 4.4: Heterogeneous effects of formal childcare on mothers’ employment
(1) (2) (3)
Dependent Variable: Mother MotherMother’s employment not employed employed Whole(child 7 y.o. when child aged 3 when child aged 3 sample
Formal childcare (FCC) 0.253*** -0.032 0.278***(0.057) (0.035) (0.048)
FCC*Mother employedchild3 -0.334***(0.067)
Mother employedchild3 0.475***(0.049)
Observations 243 257 500R2 0.333 0.264 0.349
Note: Del Boca et al. (2016). All the models include controls for gender (child), age, presenceof siblings, mother’s and father’s education, IQ score (child), single-parent household, house own-ership and migrant status. Robust standard errors are reported in parenthesis. *** indicatessignificance at 1% level, **indicates significance at 5% level, * indicates significance at 10% level.
We exploit estimates in Table 4.4 to simulate the effect of different selection
criteria. Figure 4.4 shows the comparison across cities when maternal employment
is the outcome of interest.
The choice of selection criteria is associated with different levels of benefits
when the benefit is defined as the increase in maternal employment compared to
an initial benchmark with no childcare provision. Some municipalities, likely in
response to low levels of women’s employment, have chosen criteria geared to-
wards increasing female participation in the labor force. The criteria adopted by
Turin generate a potential increase in maternal employment of around 7 percentage
points. On the contrary, Milan gives priority to a different group of less disadvan-
taged potential users and, unsurprisingly, in this case the gain is only around 2.5
percentage points.10
10This comparison between revenues and gains in maternal employment rates shows the trade-off stemming from different selection criteria. On the one hand, criteria such as those used inTurin seem to generate higher social benefits, while on the other, the criteria implemented inMilan guarantee greater economic sustainability of service. The latter could be decisive in beingable to provide more slots in the following years or in increasing the quality of the service etc. It
60
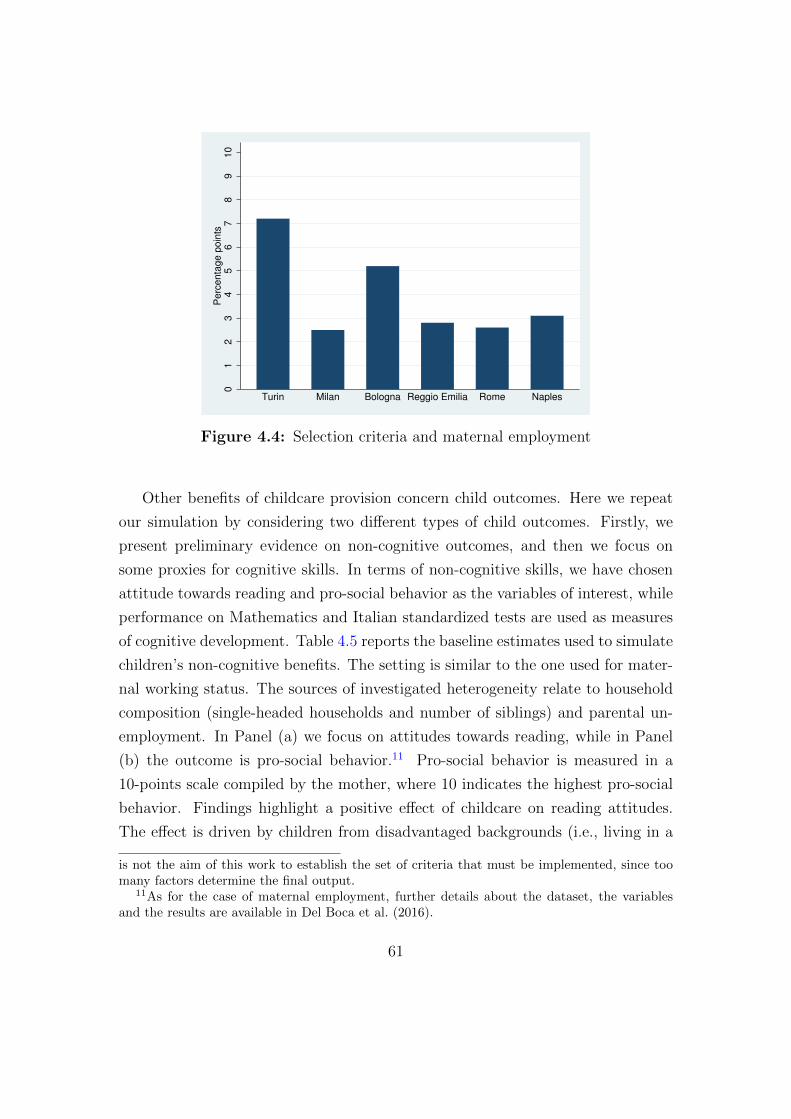
01
23
45
67
89
10
Pe
rce
nta
ge p
oin
ts
Turin Milan Bologna Reggio Emilia Rome Naples
Figure 4.4: Selection criteria and maternal employment
Other benefits of childcare provision concern child outcomes. Here we repeat
our simulation by considering two different types of child outcomes. Firstly, we
present preliminary evidence on non-cognitive outcomes, and then we focus on
some proxies for cognitive skills. In terms of non-cognitive skills, we have chosen
attitude towards reading and pro-social behavior as the variables of interest, while
performance on Mathematics and Italian standardized tests are used as measures
of cognitive development. Table 4.5 reports the baseline estimates used to simulate
children’s non-cognitive benefits. The setting is similar to the one used for mater-
nal working status. The sources of investigated heterogeneity relate to household
composition (single-headed households and number of siblings) and parental un-
employment. In Panel (a) we focus on attitudes towards reading, while in Panel
(b) the outcome is pro-social behavior.11 Pro-social behavior is measured in a
10-points scale compiled by the mother, where 10 indicates the highest pro-social
behavior. Findings highlight a positive effect of childcare on reading attitudes.
The effect is driven by children from disadvantaged backgrounds (i.e., living in a
is not the aim of this work to establish the set of criteria that must be implemented, since toomany factors determine the final output.
11As for the case of maternal employment, further details about the dataset, the variablesand the results are available in Del Boca et al. (2016).
61

single-parent family, having siblings, or in a family in which the parents are un-
employed). We also find a positive childcare effect on pro-social behavior for all
the children, and particularly for children who live in a single-headed household
or who have no siblings.
62
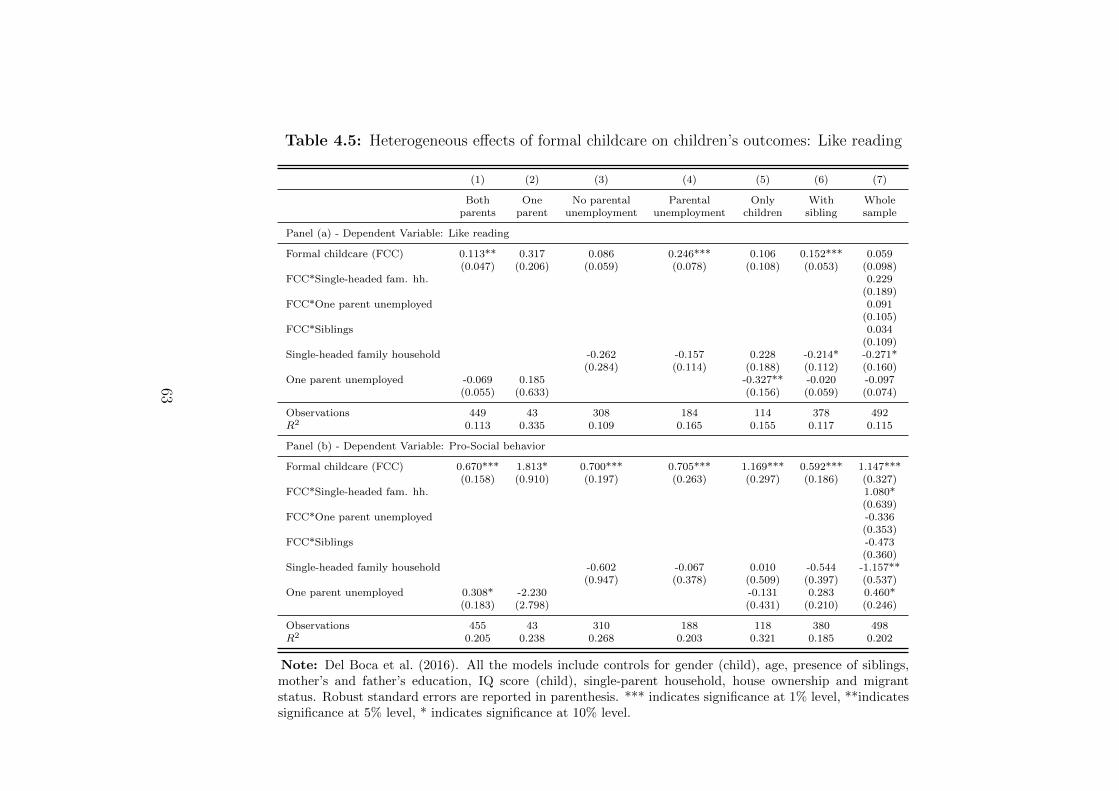
Table 4.5: Heterogeneous effects of formal childcare on children’s outcomes: Like reading
(1) (2) (3) (4) (5) (6) (7)
Both One No parental Parental Only With Wholeparents parent unemployment unemployment children sibling sample
Panel (a) - Dependent Variable: Like reading
Formal childcare (FCC) 0.113** 0.317 0.086 0.246*** 0.106 0.152*** 0.059(0.047) (0.206) (0.059) (0.078) (0.108) (0.053) (0.098)
FCC*Single-headed fam. hh. 0.229(0.189)
FCC*One parent unemployed 0.091(0.105)
FCC*Siblings 0.034(0.109)
Single-headed family household -0.262 -0.157 0.228 -0.214* -0.271*(0.284) (0.114) (0.188) (0.112) (0.160)
One parent unemployed -0.069 0.185 -0.327** -0.020 -0.097(0.055) (0.633) (0.156) (0.059) (0.074)
Observations 449 43 308 184 114 378 492R2 0.113 0.335 0.109 0.165 0.155 0.117 0.115
Panel (b) - Dependent Variable: Pro-Social behavior
Formal childcare (FCC) 0.670*** 1.813* 0.700*** 0.705*** 1.169*** 0.592*** 1.147***(0.158) (0.910) (0.197) (0.263) (0.297) (0.186) (0.327)
FCC*Single-headed fam. hh. 1.080*(0.639)
FCC*One parent unemployed -0.336(0.353)
FCC*Siblings -0.473(0.360)
Single-headed family household -0.602 -0.067 0.010 -0.544 -1.157**(0.947) (0.378) (0.509) (0.397) (0.537)
One parent unemployed 0.308* -2.230 -0.131 0.283 0.460*(0.183) (2.798) (0.431) (0.210) (0.246)
Observations 455 43 310 188 118 380 498R2 0.205 0.238 0.268 0.203 0.321 0.185 0.202
Note: Del Boca et al. (2016). All the models include controls for gender (child), age, presence of siblings,mother’s and father’s education, IQ score (child), single-parent household, house ownership and migrantstatus. Robust standard errors are reported in parenthesis. *** indicates significance at 1% level, **indicatessignificance at 5% level, * indicates significance at 10% level.
63
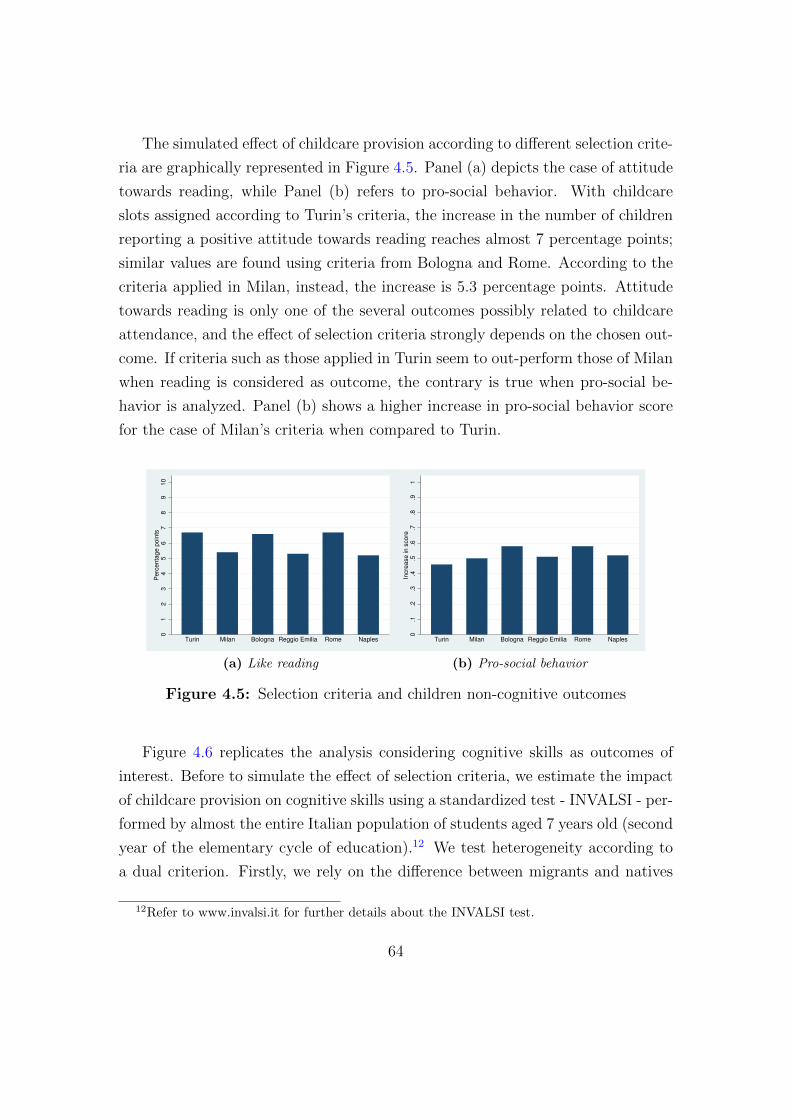
The simulated effect of childcare provision according to different selection crite-
ria are graphically represented in Figure 4.5. Panel (a) depicts the case of attitude
towards reading, while Panel (b) refers to pro-social behavior. With childcare
slots assigned according to Turin’s criteria, the increase in the number of children
reporting a positive attitude towards reading reaches almost 7 percentage points;
similar values are found using criteria from Bologna and Rome. According to the
criteria applied in Milan, instead, the increase is 5.3 percentage points. Attitude
towards reading is only one of the several outcomes possibly related to childcare
attendance, and the effect of selection criteria strongly depends on the chosen out-
come. If criteria such as those applied in Turin seem to out-perform those of Milan
when reading is considered as outcome, the contrary is true when pro-social be-
havior is analyzed. Panel (b) shows a higher increase in pro-social behavior score
for the case of Milan’s criteria when compared to Turin.
01
23
45
67
89
10
Perc
enta
ge p
oin
ts
Turin Milan Bologna Reggio Emilia Rome Naples
(a) Like reading
0.1
.2.3
.4.5
.6.7
.8.9
1In
cre
ase in s
core
Turin Milan Bologna Reggio Emilia Rome Naples
(b) Pro-social behavior
Figure 4.5: Selection criteria and children non-cognitive outcomes
Figure 4.6 replicates the analysis considering cognitive skills as outcomes of
interest. Before to simulate the effect of selection criteria, we estimate the impact
of childcare provision on cognitive skills using a standardized test - INVALSI - per-
formed by almost the entire Italian population of students aged 7 years old (second
year of the elementary cycle of education).12 We test heterogeneity according to
a dual criterion. Firstly, we rely on the difference between migrants and natives
12Refer to www.invalsi.it for further details about the INVALSI test.
64
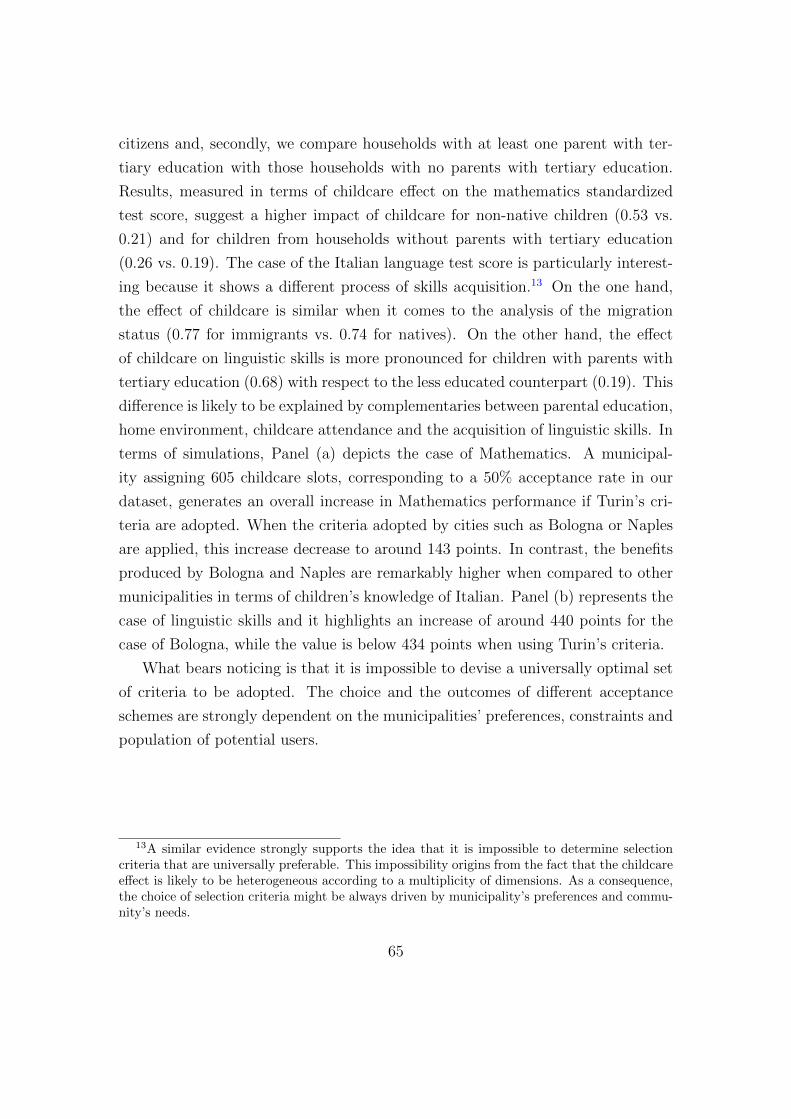
citizens and, secondly, we compare households with at least one parent with ter-
tiary education with those households with no parents with tertiary education.
Results, measured in terms of childcare effect on the mathematics standardized
test score, suggest a higher impact of childcare for non-native children (0.53 vs.
0.21) and for children from households without parents with tertiary education
(0.26 vs. 0.19). The case of the Italian language test score is particularly interest-
ing because it shows a different process of skills acquisition.13 On the one hand,
the effect of childcare is similar when it comes to the analysis of the migration
status (0.77 for immigrants vs. 0.74 for natives). On the other hand, the effect
of childcare on linguistic skills is more pronounced for children with parents with
tertiary education (0.68) with respect to the less educated counterpart (0.19). This
difference is likely to be explained by complementaries between parental education,
home environment, childcare attendance and the acquisition of linguistic skills. In
terms of simulations, Panel (a) depicts the case of Mathematics. A municipal-
ity assigning 605 childcare slots, corresponding to a 50% acceptance rate in our
dataset, generates an overall increase in Mathematics performance if Turin’s cri-
teria are adopted. When the criteria adopted by cities such as Bologna or Naples
are applied, this increase decrease to around 143 points. In contrast, the benefits
produced by Bologna and Naples are remarkably higher when compared to other
municipalities in terms of children’s knowledge of Italian. Panel (b) represents the
case of linguistic skills and it highlights an increase of around 440 points for the
case of Bologna, while the value is below 434 points when using Turin’s criteria.
What bears noticing is that it is impossible to devise a universally optimal set
of criteria to be adopted. The choice and the outcomes of different acceptance
schemes are strongly dependent on the municipalities’ preferences, constraints and
population of potential users.
13A similar evidence strongly supports the idea that it is impossible to determine selectioncriteria that are universally preferable. This impossibility origins from the fact that the childcareeffect is likely to be heterogeneous according to a multiplicity of dimensions. As a consequence,the choice of selection criteria might be always driven by municipality’s preferences and commu-nity’s needs.
65
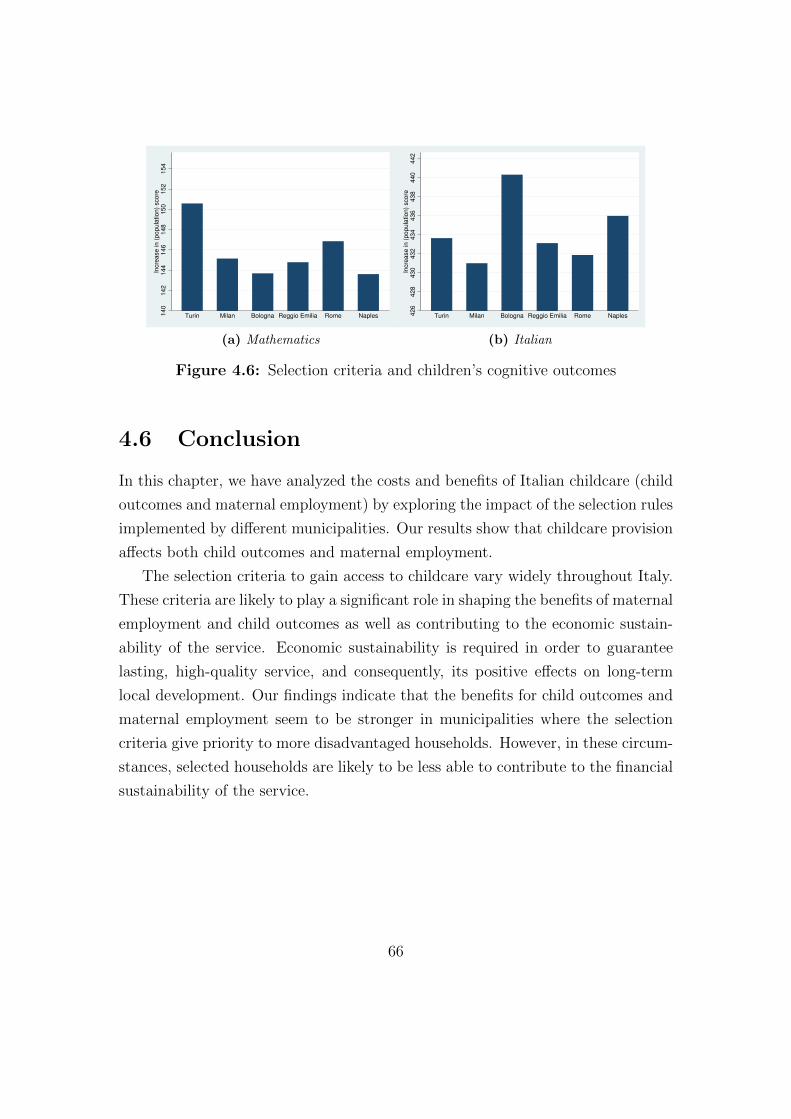
140
142
144
146
148
150
152
154
Incre
ase in (
popula
tion)
score
Turin Milan Bologna Reggio Emilia Rome Naples
(a) Mathematics
426
428
430
432
434
436
438
440
442
Incre
ase in (
popula
tion)
score
Turin Milan Bologna Reggio Emilia Rome Naples
(b) Italian
Figure 4.6: Selection criteria and children’s cognitive outcomes
4.6 Conclusion
In this chapter, we have analyzed the costs and benefits of Italian childcare (child
outcomes and maternal employment) by exploring the impact of the selection rules
implemented by different municipalities. Our results show that childcare provision
affects both child outcomes and maternal employment.
The selection criteria to gain access to childcare vary widely throughout Italy.
These criteria are likely to play a significant role in shaping the benefits of maternal
employment and child outcomes as well as contributing to the economic sustain-
ability of the service. Economic sustainability is required in order to guarantee
lasting, high-quality service, and consequently, its positive effects on long-term
local development. Our findings indicate that the benefits for child outcomes and
maternal employment seem to be stronger in municipalities where the selection
criteria give priority to more disadvantaged households. However, in these circum-
stances, selected households are likely to be less able to contribute to the financial
sustainability of the service.
66
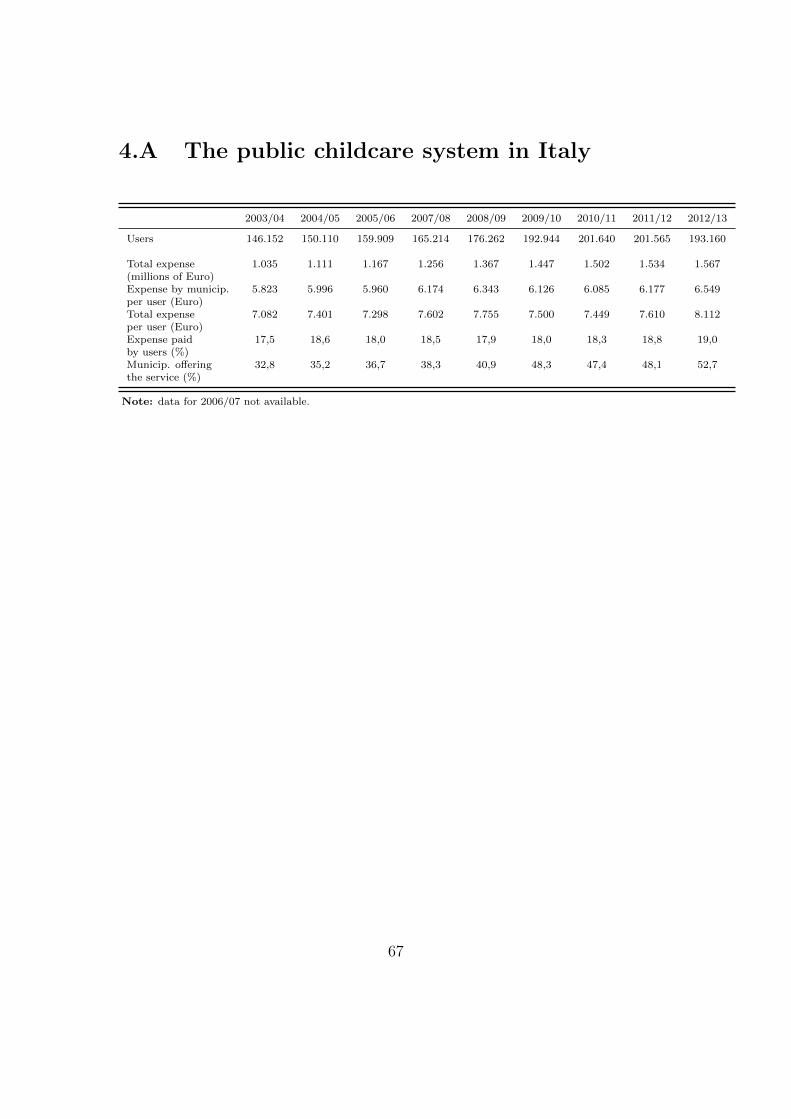
4.A The public childcare system in Italy
2003/04 2004/05 2005/06 2007/08 2008/09 2009/10 2010/11 2011/12 2012/13
Users 146.152 150.110 159.909 165.214 176.262 192.944 201.640 201.565 193.160
Total expense 1.035 1.111 1.167 1.256 1.367 1.447 1.502 1.534 1.567(millions of Euro)Expense by municip. 5.823 5.996 5.960 6.174 6.343 6.126 6.085 6.177 6.549per user (Euro)Total expense 7.082 7.401 7.298 7.602 7.755 7.500 7.449 7.610 8.112per user (Euro)Expense paid 17,5 18,6 18,0 18,5 17,9 18,0 18,3 18,8 19,0by users (%)Municip. offering 32,8 35,2 36,7 38,3 40,9 48,3 47,4 48,1 52,7the service (%)
Note: data for 2006/07 not available.
67

4.B Selection criteria in public childcare:
Typology of criteria
Municipalities that adopt selection criteria: % of Municipalities
General ones and not explicitly defined and measured 18.5
Priority given to children with disabilities or 100coming from households with relevant socio-economic problems
Different treatment of single parents households 31.9depending on the reason why the child lives only with one parent
A specific score given in case of parent(s) employed 98.7
A specific score given depending if the parents works 61.0part-time or full-time
A specific score given in case of parent(s) unemployed 78.7
A specific score given in case of parent(s) unstable 35.9working condition (fixed-term contracts, etc.)
A specific score given in case of parent(s) who are students 69.7
A specific score given in case of parent(s) who are not 29.7participating in the labor market for other reasons
A specific score is given depending on the economic resources 37.3the household has
Note: Pavolini and Arlotti (2013).
68
References
[1] Bernal, R. (2008), “The Effect Of Maternal Employment And Child Care
On Children’s Cognitive Development,” International Economic Review, 49:4,
1173–1209.
[2] Bernal, R., and M. P. Keane (2011), “Child care choices and children’s cogni-
tive achievement: The case of single mothers.” Journal of Labor Economics,
29:3, 459–512.
[3] Biroli P., Conti, G. Del Boca, D., Giudici C., Heckman, L. and Pronzato, C.
(2014). “Evaluating the Impact of the Infant Toddler Centers and Preschools
Children: the Reggio Approach”, mimeo, University of Chicago.
[4] Blanden, J., Del Bono, E., Hansen, K., Mac Nally, S. and B. Rabe (2014),
“Early interventions and children’s educational attainment. Evaluating the
impact of free part-time pre-school education for 3 year olds in England”
ISER (University of Essex).
[5] Blau, D., (1999), “The Effect of Income on Child Development”, Review of
Economics and Statistics, 81, 261-276.
[6] Brilli, Y. (2015), “Mothers’ time allocation, child care and child cognitive
development”, EUI MWP Working Paper 03.
[7] Brilli, Y., Del Boca, D. and Pronzato, C. (2016), “Does child care availability
play a role in maternal employment and children’s development? Evidence
from Italy.” Review of Economics of the Household, 1: 27–51.
69
[8] Bryson, C., Brewer, M., Sibieta, L. and Butt,S. (2013), “The role of informal
childcare: understanding the research evidence“. Report Nuffield Foundation.
[9] Cardoso, R. A., Fontainha, E. and Monfardini, C. (2010), “Children and
Parents’ Time Use: Empirical Evidence on investment in Human Capital in
France, Italy and Germany,” Review of the Economics of the Household, 8,
479-504.
[10] Carneiro, P., and Heckman, J. J. (2003), “Human Capital Policy.” In: Heck-
man, J. J., A. B. Krueger, and B. M. Friedman (eds). Inequality in America:
What Role for Human Capital Policies? Cambridge, MA: MIT Press, 77–239.
[11] Cittadinanza Attiva (2013), “Gli asili nidi tra caro rette e liste d’attesa”,
Dossier Osservatorio Prezzi e Tariffe, Rome.
[12] Connelly, R. (2013), “Interpreting Test Scores”, Millennium Cohort Study
Data Note 2013/1, London: Centre for Longitudinal Studies.
[13] Cunha, F. and Heckman, J. (2008), “Formulating and Estimating the Tech-
nology of Cognitive and Noncognitive Skill Formation,” Journal of Human
Resources, 43, 738-778.
[14] Cunha, F., Heckman, J., and Schennach, S. (2010), “Estimating the Technol-
ogy of Cognitive and Non-Cognitive Skill Formation,” Econometrica, 78: 3,
883-931.
[15] Datta Gupta, N. Simonsen, M. (2010), “Noncognitive Child Outcomes and
Universal High Quality Child Care”, Journal of Public Economics, 94(1-2):30-
43.
[16] Del Boca D. (2015a), “Child care arrangements and labor supply”, IDB Work-
ing paper 88074 Inter-American Development Bank May 2015.
[17] Del Boca D. (2015b), “Child care Choices and Child Outcomes”, IZA World
of Labor March 2015.
70
[18] Del Boca, D. and Vuri, D. (2007), “The Mismatch between Employment
and Child Care in Italy: the Impact of Rationing”, Journal of Population
Economics, 20(4), 805-832.
[19] Del Boca, D., Flinn, C. and Wiswall, M. (2014), “Household choices and child
development.”’ Review of Economic Studies, 81:2, 137–185.
[20] Del Boca, D., Piazzalunga, D. and Pronzato, C. (2014), “Early child care
and child outcomes : the role of Grandparents” IZA Discussion Paper 8565,
Institute for the Study of Labor.
[21] Del Boca, D., Monfardini, C. and Nicoletti, C. (2016), “Self investments of
adolescents and their cognitive development.” Journal of Labor Economics,
forthcoming.
[22] Del Boca, D., Pasqua, S. and Suardi, S. (2016), “Child care, Maternal Em-
ployment, and Childrens’ School Outcomes. An Analysis of Italian Data”,
European Journal of Population, 32(2), 211-229.
[23] Del Boca, D., Pronzato, C. and Sorrenti G. (2016b), “When Rationing Plays
a Role: Selection Criteria in the Italian Early Childcare System”, CESifo
Economic Studies, 62 (4), 752-775.
[24] Ermisch, J., and Francesconi, M. (2005), “Parental Employment and Chil-
dren’s Welfare,” in Women at Work: An Economic Perspective, edited by
Boeri, T., Del Boca, D., and Pissarides, C. Oxford: Oxford University Press.
[25] Felfe, C. and Lalive, R. (2014), “Does Early Child Care Help or Hurt Chil-
dren’s Development?”, IZA Discussion Paper 8484, Institute for the Study of
Labor.
[26] Gugl, E., and Welling, L. (2010), “The Early Bird Gets The Worm? Birth
Order Effects In A Dynamic Family Model”, Economic Inquiry, 48,690-703.
[27] Gormley, W. T. (2008), “The effects of Oklahoma’s Pre-K program on His-
panic children”, Social Science Quarterly, 89, 916-936.
71
[28] Hansen, C., and Hawkes, D. (2009), “Early childcare and child development”
, Journal of Social Policy, 38:2, 211–239.
[29] Hansen, K. (ed.) (2012), “Millennium Cohort Study. First, Second, Third
and Fourth Surveys, A Guide to the Datasets” (7th Ed.), London: Centre for
Longitudinal Studies.
[30] Havnes, T. and Mogstad, M. (2011), “No Child Left Behind. Universal Child
care and Children’s Long-Run Outcomes”, American Economic Journal: Eco-
nomic Policy, 3, 97–129.
[31] Havnes, T. and Mogstad, M. (2014), “Is Universal Child care Leveling the
Playing Field? Evidence from Non-Linear Difference-in-Differences”, Journal
of Public Economics, 127, 100-114.
[32] Heckman, J. and Masterov, D. (2007), “The Productivity Argument for In-
vesting in Young Children,” Review of Agricultural Economics, 29, 446-493.
[33] Herbst, C. (2015), “The rising cost of child care in the US”, IZA Discussion
Paper 9072, Institute for the Study of Labor.
[34] Hofferth, S., Davis-Kean, P., Davis, J., and Finkelstein, J., (1998), User guide
for the Child Development Supplement of the Panel Study of Income Dynam-
ics, http://psidonline.isr.umich.edu/CDS/usergd.html.
[35] Istituto degli Innocenti (2006), “I nidi e altri servizi integrativi per la prima
infanzia”, Quaderni del Centro Nazionale di Documentazione e l’Analisi per
l’Infanzia n. 36.
[36] ISTAT (2010), “L’offerta comunale di nidi e altri servizi socio educativi per
l’infanzia”, Istituto Nazionale di Statistica Roma.
[37] Liu, H., Mroz, T., and Van der Klaauw, W. (2010), “Maternal Employment,
Migration, and Child Development”, Journal of Econometrics, 156, 212-228.
[38] Loeb, S., Bridges, M., Bassok, D., Fuller, B. & Rumberger, R.W. (2007),
“How Much is Too Much? The Influence of Preschool Centers on Children’s
72
Social and Cognitive Development”. Economics of Education Review, 26, 52-
66.
[39] Loken, K., Mogstad, M., and Wiswall, M., (2012), “What Linear Estima-
tors Miss: Re-Examining the Effects of Family Income on Child Outcomes”,
American Economic Journals: Applied Economics, 4, 1-35.
[40] Lord, F. M. and Novick, M. (1968), Statistical Theories of Mental Test Scores.
Reading MA: Addison-Welsley Publishing Company.
[41] Melhuish, E., Sammons, P., Siraj-Blatchford, I. and B. Taggart (2005), “Effec-
tive Pre- School Education. The Effective Provision of Pre-School Education
(EPPE) Project: Final Report”. Institute of Education: London.
[42] OECD (2012), “Family Data Base Public policies for families and children,
Formal care and early education services.”
[43] Office for National Statistics (2015), Families and
Households. Available at: https://www.ons.gov.uk/
peoplepopulationandcommunity/birthsdeathsandmarriages/families/
datasets/familiesandhouseholdsfamiliesandhouseholds
[44] Pavolini, E. and Arlotti, M. (2013), “Growing unequal: child care policies in
Italy and the social class divide”, mimeo.
[45] Pinheiro, J. and Bates, D., (2006), “Unconstrained Parametrizations for
Variance-Covariance Matrices,” Statistics and Computing, 6, 289-296.
[46] Pronzato, C. and Sorrenti, G. (2015), “When context does matter. Child care
and maternal employment: trying to solve the puzzle”, CESifo DICE Report,
13(1), 3-8.
[47] Sullivan, A. and Brown, M. (2014) “Cognitive development”. In Platt, L. (ed)
Millennium Cohort Study Age 11 Survey Initial Findings. London: Centre for
Longitudinal Studies.
73

[48] Todd, P., and Wolpin, K. (2003), “On the Specification and Estimation of
the Production Function for Cognitive Achievement,” Economic Journal, 113,
F3-F33.
[49] Todd, P., and Wolpin, K. (2007), “The Production of Cognitive Achievement
in Children: Home, School, and Racial Test Score Gaps,” Journal of Human
Capital, 1:1, 91-136.
[50] West, A. (2006), “The pre-school education market in England from 1997:
quality, availability, affordability and equity”, Oxford Review of Education,
32(3): 283-301.
[51] Woodcock, R., and Johnson, M. (1989), Tests of Achievement, Standard Bat-
tery [Form B]. Chicago, IL: Riverside Publishing (Houghton Mifflin).
[52] Wrohlich, K. (2006), “Labor supply and child care choices in a rationed child
care market”, DIW Berlin Discussion Papers 1169.
[53] Zollino, F. (2008), “Il difficile accesso ai servizi di istruzione per la prima
infanzia in Italia: i fattori di offerta e di domanda”, Questioni di Economia e
Finanza - Occasional Papers n. 30, Bank of Italy.
74