Embed Size (px)
Citation preview

NATIONAL CENTER Series 11 For HEALTH STATISTICS I Number 21
VITAL and HEALTH STATISTICS DATA FROM THE NATIONAL HEALTH SURVEY
Childbearing and Diabetes Mellitus United States - 19604962
The relationship of the number of pregnancies to diabetes as shown in data from the Health Examination Survey, 196042, and data from Sudbury, Massachusetts.
Washington, D.C. November 1966
U.S. DEPARTMENT OF HEALTH, EDUCATION, AND WELFARE Public Health Service
John W. Gardner William H. Stewart
Secretary . Surgeon General

Public Health Service Publication No. lOOO-Series 11-No. 21
For sale by the Superintendent of Documents, U.S. Government Printing Office Washington, D.C., 20402 - Price 25 cents

NATIONALCENTERFOR HEALTHSTATISTICS
FORREST E. LINDER, PH.D., Director
THEODORE D. WOOLSEY, Deputy Director
OSWALD K. SAGEN, PH.D, Assistant Director
WALT R. SIMMONS, M.A., Slntisticd Advisor
ALICE M. WATERHOUSE, M.D., Medical Advisor
JAMES E. KELLY, D.D.S., Dental Advisor
LOUIS R. STOLCIS, M.A., Executive Officer
DONALD GREEN, bzfomation O//icer
DIVISIONOF HEALTHEXAMINATIONSTATISTICS ARTHURJ. MCDOWELL, Chief
TAVIA GORDON,Assistant Chief
COOPERATION OF THE BUREAU OF THE CENSUS
In accordance with specifications established by the National Health Survey, the Bureau of the Census, under a contractual agreement, participated in the design and selection of the sample, and carried out the first stage of the field interviewing and certain parts of the statistical processing.
Public Health Service Publication No. 10004eries 11-No. 21
Library of Congress Catalog Card Number 6642093

PREFACE The analysis of Health Examination Survey
data in the body of this report is based on the sample group examined in Cycle I of the HES rather than on estimates for the target population. In simple terms reference is made to the 6,672 persons in the HES sample rather than the 111,086,OOOpeople from which the sample was selected. For this reason the reader must be warned not to use the data as descriptive of the total population of the United States, since their probability of selection is not taken into account.
The use of uninflated data from the sample differs, of course, from ordinary usage. The sampling scheme of HES andthe associated procedures for estimation and for estimating the variances of the estimates were designed to yield an unbiased representation of the civilian noninstitutionalized population of the conterminous United States at (essentially) a fixed point in time, and confidence intervals for that representation.
In this report, however, the data are treated as a manifestation of some general process. This is different from a description of the target
population of the first cycle of the Health Examination Survey. Rather it concerns a defined biological or medical process (presumably of some generality), which may be manifesting itself in the persons examined by the HES. Were it repeated a large number of times (to use one conceptualization) it would, by chance, sometimes manifest itself by one set of numbers and some-times by another. These sets of numbers are assumed to be distributed in a fashion definable by available statistical techniques.
The specific question under examination in this report is whether the stress of successive pregnancies predisposes women to develop diabetes. This is a problem that has been studied from varying viewpoints in several differentpopulations. The data from the HES is viewed in this report as part of the total body of evidence on the subject. Additional evidence is still needed before firm answers are possible.
Tavia Gordon Division of Health Examination Statistics
iii
CONTENTS Preface--------------------------------------------------------------
Introduction _________-_-____________________________------------------
Results -------_-_-___--_--_------------------------------------------Diabetes-----------------------------------------------------------Blo&Glucose Level------------------------------------------------Diabetes for Men---------------------------------------------------
Page **’111
1
2 2 3 3
Discussion ______--________________________________------------------- 3
Summary------------------------------------------------------------- 4
References----------~------------------------------------------------ 5
Detailed TabIes------------------------------------------------------- 6
Appendix I. Items on the Medical History Relating to Glucose Tolerance--- 12
Appendix II. Casual Aspects of the Glucose Tolerance Test--------------- 14
Appendix III. Quality of Blood Glucose Determinations-------------------- 16
Appendix IV, Diabetes-Documentation---------------------------------- 18
Appendix V. Statistical Notes _____ --________--- --_ ____ __ _ _ _____ _ ___ ___- 19

IN THIS REPORT data are presented on the relation of the number of pregnancies to diabetes. With increasing parity there was a rise in the probability of finding previously known diabetes among women in the Health Examination Survey. Data from the population of Sudbury, Massachusetts did not show a similar difference for women or for men. Blood glucose levels, on the contrary, were found to be unrelated to marital status OY childbearing, exceptforan isolated finding of higher blood glucose levels in women ofparity nine or move. The question of whether the higherparity of diabetes is due to a causal association between the metabolic stresses of pregnancy and the development of Later diabetes re-mains moot.
SYMBOLS
Dam not available ________________________ ___
Category not applicable------------------- . . .
Quantity zero _____________________ - ______ _
Quantity more than 0 but less than 0.05----- 0.0
Figure does not meet standards of *reliability orprecision------------------
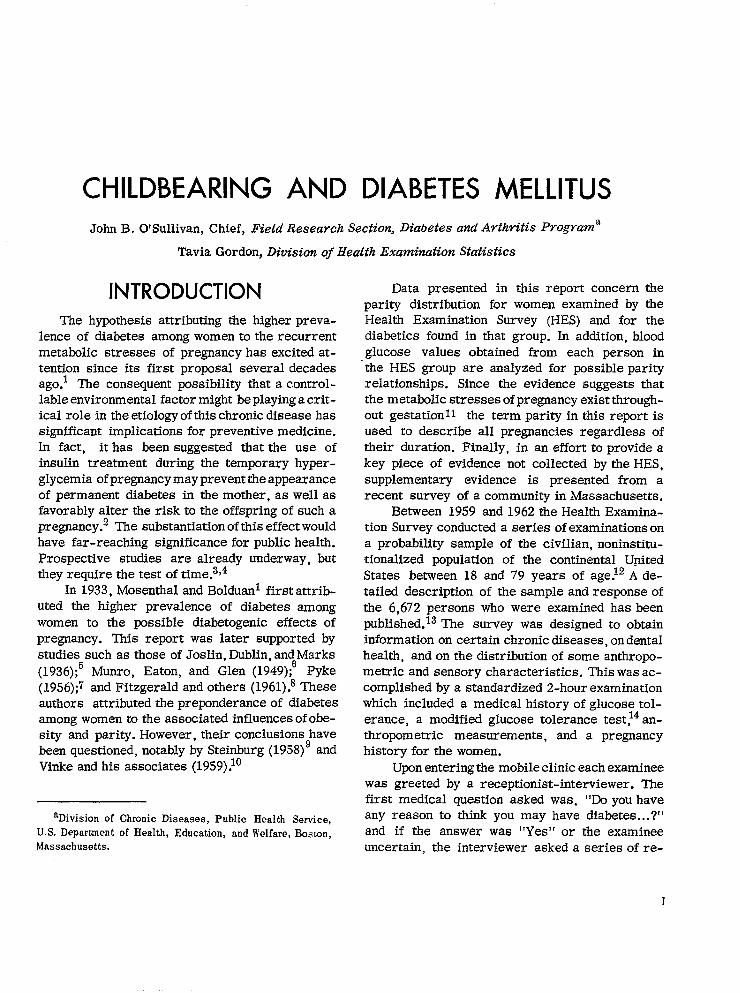
CHILDBEARING AND DIABETES MELLITUS John B. O’Sullivan, Chief, FieLd Research Section, Diabetes and Arthritis Programa
Tavia Gordon, Division of Health Examination Statistics
INTRODUCTION The hypothesis attributing the higher preva
lence of diabetes among women to the recurrent metabolic stresses of pregnancy has excited attention since its first proposal several decades ag0.l The consequent possibility that a controllable environmental factor might be playing a critical role in the etiology of this chronic disease has significant implications for preventive medicine. In fact, it has been suggested that the use of insulin treatment during the temporary hyperglycemia of pregnancy may prevent the appearance of permanent diabetes in the mother, as well as favorably alter the risk to the offspring of such a pregnancy.2 The substantiation of this effect would have far-reaching significance for public health. Prospective studies are already underway, but they require the test of time,3y4
In 1933, Mosenthal and Bolduanl firstattributed the higher prevalence of diabetes among women to the possible diabetogenic effects of pregnancy. This report was later supported by studies such as those of Joslin, Dublin, and Marks (1936);5 Munro, Eaton, and Glen (1949): Pyke (1956);7 and Fitzgerald and others (1961).8These authors attributed the preponderance of diabetes among women to the associated influences of obesity and parity. However, their conclusions have been questioned, notably by Steinburg (19.58)’and Vinke and his associates (1959):’
aDivision of Chronic Diseases, Public Health Service, U.S. Department of Health, Education, and Welfare, Boston, Massachusetts.
Data presented in this report concern the parity distribution for women examined by the Health Examination Survey (HES) and for the diabetics found in that group. In addition, blood glucose values obtained from each person in the HES group are analyzed for possible parity relationships. Since the evidence suggests that the metabolic stresses of pregnancy exist through-out gestation11 the term parity in this report is used to describe all pregnancies regardless of their duration. Finally, in an effort to provide a key piece of evidence not collected by the HES, supplementary evidence is presented from a recent survey of a community in Massachusetts.
Between 1959 and 1962 the Health Examination Survey conducted a series of examinations on a probability sample of the civilian, noninstitutionalized population of the continental United States between 18 and 79 years of age?” A de-tailed description of the sample and response of the 6,672 persons who were examined has been published.13 The survey was designed to obtain information on certain chronic diseases, on dental health, and on the distribution of some anthropometric and sensory characteristics. This was accomplished by a standardized 2-hour examination which included a medical history of glucose tolerance, a modified glucose tolerance test,r4 anthropometric measurements, and a pregnancy history for the women.
Upon entering the mobile clinic each examinee was greeted by a receptionist-interviewer. The first medical question asked was, “Do you have any reason to think you may have diabetes...?” and if the answer was “Yes” or the examinee uncertain, the interviewer asked a series of re-
1

lated questions to determine whether a diagnosis of diabetes had been made by a physician, whether the examinee was under a doctor’s care for the disease, how frequently he saw a doctor for diabetes, and whether any specific hypoglycemic agent was used in treatment (Appendix I).
Then the examinee was given a medical his-tory form to complete. Included among the 74 questions in this section were several relating to diabetes-increased thirst, increased urination, recent weight loss, and relatives with diabetes-and several on pregnancy history (Appendix I).
Unless there was a clear history of diabetes under medical care, the examinee was offered a drink containing 50 grams of glucose with lemon flavoring (“Dextol”) which was diluted in 250 cc. of water. The drink was administered without regard to the time or content of the previous meal (Appendix II). An hour after theglucose drink was given, a blood specimen was obtained by venipuncture, and about 30 minutes later aurine specimen was collected. The blood specimen was shipped to the laboratory of the Diabetes Field Research Unit in Boston, where blood glucose determinations were done by the Somogyi-Nelson methodr” (Appendix III).
The use of oral hypoglycemics or insulin was accepted as documentation of stated diabetes. If a person diagnosed by a physician was not on medication, the diagnosis was accepted unless the blood glucose level was less than 138 mg. per 100 ml. without challenge or 148 mg. per 100 ml. with challenge. In most instances the levels were substantially higher (Appendix IV). Most of the stated diabetics met these arbitrary criteria for definite diabetes. If a stated diabetic did not satisfy the criteria for a definite diagnosis but had consulted a physician about diabetes within the last 6 months and had afollowup medical appointment scheduled within the next 6 months, he was considered a questionable case. Otherwise a diagnosis was not accepted. Less than 9 percent of the examinees reporting diabetes failed to meet the criteria for a definite or questionable diagnosis.
Data from the population of S&bury, Massachusetts were obtained during a comprehensive epidemiologic study initiated there in 1964.ra Seventy-seven percent of the total population, aged 15 years and over, had medical examina-
0.05
0.0 I I I I I I I I I’ 0 2 4 6 6 IO
PARITY
Figure I. Age-adjusted probability of having diabetes, by parity.
tions. Stated diabetics were verified in detail and new diabetics were accepted if two postprandial blood sugars were above the 92d and 98th percentile levels for the whole p?pulation respectively and a glucose tolerance test was abnormalJ7 Blood glucose determinations were performed on venous whole blood samples using the Auto Analyzer. This method was found to give results comparable with the Somogyi-Nelson method when a random subsample of the population’s samples were tested by both methods. r*
RESULTS Diabetes
Figure 1 displays the age-adjusted probability of definite or possible diabetes for women in the Health Examination Survey according to thenumber of pregnancies. Despite the irregular distribution of these points, it is clear that the probability of diabetes is increased with parity,
The relationship of parity to diabetes may be considered in different terms: Are diabetic women more likely to have a higher parity than nondiabetic women? Table 1 shows the mean number of pregnancies by age for definite or possible dia-
2

betics and nondiabetics. In the three age groups with sizablenumbers of diabetics-45-54, 55-64, and 65-74 years-mean parity was higher for diabetics than for nondiabetics. While it is difficult to draw any conclusions about the other age groups due to small sample sizes and a consequently high sampling variability of the data, there is a suggestion that diabetic women under 45 years of age reported fewer pregnancies than non-diabetic women. Overall, however, the mean parity for diabetic women ages 18-79 years was higher than the mean parity for nondiabetic women. This difference is statistically significant at a level of 5 percent, although, as has already been indicated, the level, and indeed the direction of the differences, was not consistent among the various age groups. Even if the parity count is restricted to live births, mean parity was elevated in diabetic women (table 2).
Blood Glucose Level
Table 3 presents the distribution by age and parity of women examined by the Health Examination Survey who had a blood glucose determination 1 hour following the ingestion of 50 grams of glucose; pregnant women and previously known diabetics were excluded. Their mean blood glucose levels are given by parity for specific age groups (table 4). and summarized for all ages (table 5). The results indicate that these levels did not rise with increasing parity. The correlation of parity with blood glucose level was also seen to be very low when all parities were considered together (table 6). The high parity groups, how-ever, were seen to have significantly higher blood glucose levels.
A closer examination of parity nine or more is provided in table 7. Here the mean blood glucose level, adjusted for obesity as measured in skinfold thickness, was seen to be higher than for women of lower parity. This difference is statistically significant at a S-percent level. While the difference is not clearly manifest in every age group, this variation could have arisen by chance. A similar analysis for parity eight did not yield the same result-the higher than expected blood glucose level for this group was not statistically significant. Since the glucose levels for white and yc$ro populations did not appear to differ, I4
racial differences in the percent of high-parity women did not have to be taken into account.
Data exhibiting mean blood glucose levels for both men and women are given in table 8. Analyses with respect to marital status or child-bearing confirm that having children is not, in general, associated with higher blood glucose levels.
Diabetes for Men
The absence of parity data on men in the Health Examination Survey precluded an analysis for men of parity in relation to the prevalence of diabetes or blood glucose level. For this reason recourse was made to the data from the Sudbury Study (table 9).
The average number of births at Sudbury was higher for diabetic than nondiabetic women but the difference was small. While these data are not inconsistent with the HES findings, neither are they inconsistent with the hypothesis that no difference exists in parity between diabetic andnondiabetic women. The data for men were equally inconclusive when age differences were control-led. This was true whether only confirmed “stated” diabetics were included in the analyses, or per-sons with previously unrecognized disease were also included.
DISCUSSION
The confirmed higher parity among female diabetics may be considered invarious ways. This analysis is concerned primarily with the possibility that the stresses of recurrent pregnancies are related in a causal way to diabetes. The data in this report do not allow this question to be answered. It had been hoped that findings from the Sudbury Study would provide a clear answer. For example, a definite association between family size and diabetes for women, and the absence of such an association for men would tend to confirm a causal relationship. Alternatively, a clear association for both men and women would argue against an etiologic role. However, there was no clear association between higher parity and diabetes for either men or women in Sudbury. What is more, the hypothesis that high parity is a cause of diabetes is weakened by the failure to
3

find any meaningful correlation between blood glucose levels and parity in the HES sample. The HES findings, however, agree with those of other studies suggesting that diabetics tend to have large families.lg* 20 The data from the HES and Sudbury studies, but especially from the HES, would be consistent with this conclusion.
The findings with respect to women of parity nine or more are difficult to fit into the picture. It is not clear from the HES data whether the higher mean glucose levels in these women represent a real relationship, a random statistical variation, or an unsuspected artifact. While figures from a large prenatal population indicated that the relationship between higher gestational blood glucose levels and increasing parity could be accounted for by the concurrent rise in maternal age,21 such an explanation would not apply to the Health Examination Survey data. The explanation may lie, at least in part, in the higher than aver-age glucose levels noted for women of limited education or incomeF2 since two-thirds of all women of parity nine or more had only a grade school education and women of high parity also tend to have lower incomes. Available data (table 10) would argue against this explanation, suggesting, rather, that blood glucose levels at parity nine or more are high no matter what the education or income. Unfortunately, the data on this subject are too limited to be interpreted with confidence. It is conceivable that other artifacts account for this finding, since women of very high parity may be an unusual group in many respects. A further discussion of this subject is included in Appendix V.
An explanation for the presumed effects of sex and parity on the incidence of diabetes in previous studies must consider the variation in methods used to identify the diabetic, as well as the characteristics of the population studied. For ex-ample, although the Oxford, Massachusetts Study of diabetes found more female “previously known” diabetics, they were equally balanced by a male excess of newly discovered diabetics.23 It is obvious that diagnostic habits, techniques, and local health attitudes influence the results of this type of investigation. Conflicting evidence for a male or female preponderance in the sex prevalence of diabetes1*>17 or even that the sex prevalence is changing2” if, indeed, such preva-
4
Ience measurements can be made with sufficient accuracy,17 lead to the same conclusion. The commonly accepted majority of females among diabetics is still very much an open question.
The many relationships of pregnancy to diabetes cannot, of course, be explored by these data. It is conceivable that women who fail to cope with the temporary stress of gestation will show the effects years later. The increasedrisks to the pregnancy of such potentially diabetic per-sons are acknowledged.4 On the other hand, whether such metabolic stresses result in an acceleration in the appearance of diabetes is questionable. The failure to demonstrate an earlier onset of diabetes in women of high parity would appear to argue against such a possibility . 69 7719 While prospective evidence is still lacking, available data seem to favor the conclusion that pregnancy has no role in the causation or earlier appearanceof diabetes. The Health Examination Survey, therefore, confirms the tendency toward higher parity among diabetic women without providing an explanation for it. To at-tribute this increase in family size to an altered fertility rate or to more subtle psychosocial factors would be purely speculative.
SUMMARY
1. Blood glucose levels of women examined by the Health Examination Survey were found to be unrelated to marital status or childbearing. The isolated finding of higher blood glucose levels in women of parity nine or more is discussed.
2. With increasing parity there was a rise in the probability of finding previously known diabetes among women in the Health Examination Survey. Age-adjusted data from the population of Sudbury, Massachusetts, did not show a similar difference either for men or women.
3. The data in this report do not resolve the question of whether the higher parity of diabetics is due to a causal association between the metabolic stresses of pregnancy and the development of later diabetes. The available evidence, however, favors a tentative conclusion that no such relationship exists.
REFERENCES
‘Mosenthal, H. O., and Bolduan, C.: Diabetes mellitus-problems of present day treatment. Am.J.M.Sc. 186:605, Nov. 1933.
‘Hoet, J. P., and Lukens, F. D. W.: Carbohydrate metabolism in pregnancy. Diobetea 3:1, 1954.
‘Wilkerson, II. L. C., and Remein, Q. R.: Studies of abnormal carbohydrate metabolism in pregnancy. Diabetes 6:324, 1957.
405 u11‘Ivan, J. B., Gellis, S., Dandrow, R., and Tenney, B.: The potential diabetic and her treatment in pregnancy. J.Obet.fiGynaec. 27:633, 1966.
5Joslin, E. P., Dublin, L. I., and Marks, H. H.: Studies in diabetes mellitus, IV, Etiology, Part 1. Am.J.M.Sc. 191(6): 759, June 1936.
%iunro, H. N., Eaton, J. C., and Glen, A.: Survey of a Scottish diabetic clinic. J.CZin.EndocrinoZ. 9:48, 1949.
7Pyke, D. A.: Parity and the incidence of diabetes. Lancer 1(692’7):818, June 1956.
‘Fitzgerald,M., Malins, J., O’Sullivan, D., and Wall, M.: The effectof sex and parity on the incidence of diabetes mellitus. Quart.J.Med. 117:57, 1961.
‘Steinberg, A. G.: Heredity anddiabetes. Diabetes 7~244, 1958.
“Vinke,B., Nagelsmit,W. F., van Buchem, F. S. P., and Smid, L. J.: Some statistical investigation in diabetes mellitus. Diubetes 8:100, 1959.
‘%pellacy, W. H., Goetz, F. C., and Greenberg, B. 2.: Plasma insulin in normal early pregnancy. Obet. & Gynec. 25:862, 1965.
12National Center for Health Statistics: Plan and initial program of the Health Examination Survey. VitoZ und He&h Stutktics. PBS Pub. No. 1000Series l-No. 4. Public Health Service. Washington. U.S. Government Printing Office, July 1965.
13National Center for Health Statistics: Cycle I of the Health Examination Survey, sample and response. Vital and He&h Statistics. PHS Pub. No. 1000Series ll-NO. 1 Public Health Service. Washington. U.S. Government Printing Cffice, Apr. 1964.
14National Center for Health Statistics: Glucose tolerance of adults. Vital and Health Statistics. PHS Pub. No. 1000Series 11-No. 2. Public Health Service. Washington. U.S. Government Printing Office, May 1964.
15Nelson, N. A.: Photometric adaptation of the Somogyi method for the determination of glucose. J.BioZ.Chem. 153: 375, 1944.
16McDonald, G. W., and Clemence, T: Demographic aspects in selecting a site for a community epidemiologic study. Pub.HenZthRep. 80:6, 1965.
170’Sullivan, J. B., and Williams, R. F.: Diabetes mellitus in perspective-a population study in Sudbury, Massachusetts. To be published.
180’Sullivan, J. B., and McDonald, G. W.: Decisive factors in the design of the Sudbury study of chronic disease. Pub. Health Rep. In press.
lgJackson, W. P. U.: Is pregnancy diabetogenic? Lancet 11(7217):1369, Dec. 1961.
20Steinberg, A. G.: Nature and treatment of diabetes-genetics and diabetes, ch. 34. Ezcerpta Medica Found., 1965.
210’Sullivan, J. B., Tenney, B., and Gellis, B.: Gestational blood glucose levels in normal and potentialIy diabetic women related to the birth weight of their infants. Diabetes 15:466, 1966.
22National Center for Health Statistics: Blood glucose levels in adults, Vital and Health Statistics. PHS Pub. No. 1000Series ll-No. 18. Public Health Service. Washington. U.S. Government Printing Office, Sept. 1966.
23Wilkerson, H. L. C., and Krall, L. P.: Diabetes in a New England town. J.A.M.A. 135(4):209, Sept. 1947.
24Malins, J. M., Fitzgerald, M. G., and Wall, M.: A change in the sex prevalenceof diabetesmellitus. Diobetologia 1:121, 1965.
25National Center for Health Statistics: The one hour oral glucose tolerance test. Vital and He&h Stotistice. PHS Pub. No. lOOO-Series ~-NO. 3. Public Health Service. Washington. U.S. Government Printing Office, July 1963.
26National Center for Health Statistics: Health interview responses compared with medical records. Vital &nd Health Statistics. PHS Pub. No. 1000Series ~-NO. 7. Public Health Service. Washington. U.S. Government Printing Office, Jul> 1965.
5

DETAILED TABLES
Page
Table 1. Mean parity for diabetic and nondiabetic women, by age: Health Examination Survey, 1960-62-------------------------------------------------------------------- 7
2. Mean number of births, by age of woman and diabetic status: Health ExaminationSurvey, 1960-62----------------------------------------------------------------- 7
3. Number of women, by age and parity: Health Examination Survey, 1960-62---------- 8
4. Mean blood glucose levels of women, by age and parity: Health Examination Survey, 1960-62-------------------------------------------------------------------- 8
5. Excess of actual over expected mean glucose values for women 18-79 years of age,by parity: Health Examination Survey, 1960-62----------------------------------- 9
6. Correlation of parity and blood glucose levels in women, by age: Health Examination Survey, 1960-62------------------------------------------------------------ 9
7. Mean blood glucose levels for women with parity less than nine and parity nineand over, by age: Health Examination Survey, 1960-62---------------------------- 10
8. Mean blood glucose in adults, never married and married, with or without chil-10dren, by sex and age: Health Examination Survey,-X960-62------------------------
9. Parity and diabetes, by age and sex: Sudbury, Massachusetts--------------------- 11
10. Mean glucose level at parity nine and at lower parities for women with low in-come or education, by selected ages: Health Examination Survey, 1960-62--------- 11
6

Table 1. Mean parity for diabetic and nondiabetic women,by age: Health Examination Survey,1960-62- -T Numberofwomen T Mean parity
Non- Non-Diabetic diabetic Diabetic diabetic Difference
18-24 years---------------------------------- 3 531 1.13 -1.13
25-34 years---------------------------------- 6 740 1.67 2.87 -1.20 35-44 years---------------------------------- 5 779 2.80 3.28 -0.48
45-54 years---------------------------------- 22 683 4.55 3.14 1.41 55-64 years---------------------------------- 18 425 4.22 2.83 1.39 65-74 years---------------------------------- 20 279 5.55 3.62 1.93 75-79 years---------------------------------- 4 66 1.50 3.71 -2.21
Mean----------------------------------------- . . . . . . . . . . . . 0.67
NOTE: If i is the specified parity (+0,1,...,8,9; more than 9 parity being taken as 9) and Nik is the number of women of parity i in age group k(TNik-Nk) and nik the number of women in that age and parity group with diabetes ($nik=nk)and
dk = 4 inik/nk - Fi(Nik - nik)/(Nk - nk)
and
rk = [q i2Nik-(~iNik)~Nk] (* - N*k) (5) k
then the mean difference in parity for all age groups is taken as
"=(f +)A: +,- 0.67309
with variance V= 4 l/rk = 0.08677
D2/V being distributed as chi-square with 1 d.f.
F (dk- DJ2/rk = 29.06. This statistic, which is distributed as chi-square with 6 d.f., indicates that the variation of the d, was too large to be attributed to chance at a 5 percent level.
Table 2. Mean number of births, by age of woman and diabetic status: Hea .th Examination Survey,1960-62
Age O iebeiic/ Mean number of births
18-24 years------------------------------------------------------ 0.93 -0.9325-34 years------------------------------------------------------ 1.50 2.48 -0.9835-44 years------------------------------------------------------ 2.20 2.82 -0.6245-54 years------------------------------------------------------ 3.82 2.65 1.1755-64 years------------------------------------------------------ 4.00 2.4865-j’& years------------------------------------------------------ 4.65 3.25 E 75-79 years------------------------------------------------------ 1.50 3.32 -1:a2
L
236-443 O-66-2 7

-- --
--
-- --
--
Table 3. Number of women, by age and parity: Health Examination Survey, 1960-62
Parity Age
Total 0 1 2 3 4 5 6 7 8 9f
Number of women
All ages---- 3,267 651 454 616 509 358 228 132 91 71 157
18-24 years------- 441 220 83 74 32 16 11 2 2 1 -
25-34 years------- 665 97 88 124 142 95 56 27 21 8 7
35-44 years------- 751 99 68 155 143 108 68 35 17 17 41
45-54 years------- 663 90 103 126 114 75 49 29 23 14 40
55-64 years------- 410 91 65 75 51 33 25 19 9 9 33
65-74 years------- 276 42 42 47 23 25 17 18 18 18 26
75-79 years------- 61 12 5 15 4 6 2 2 1 4 10
NOTE: Includes only women with blood glucose determination after challenge. Excludes pregnant women and women with diagnosed diabetes.
Table 4. Mean blood glucose levels of women,by age and parity: Health Examination Survey,1960-62
Parity
Total 0 1 2 3 4 5 6 7 8 9+
Mean glucose in mg.%
All ages---- 125.5 121.4 128.3 123.0 121.2 124.3 125.7 129.6 131.6 141.4 146.5 -
18-24 years------- 103.9 103.8 103.9 106.6 106.5 92.3 105.1 81.0 99.0 79.0
25-34 years------- 110.5 112.4 112.4 111.2 109.8 110.5 109.4 105.5 104.2 103.9 112.1
35-44 years------- 119.5 122.6 120.3 114.1 116.1 119.7 118.5 124.0 126.5 124.5 134.5
45-54 years------- 132.3 129.6 138.8 128.6 125.8 131.1 133.9 131.2 121.9 155.2 151.3
55-64 y.ears------- 144.0 137.9 147.3 140.7 139.8 157.2 153.7 144.1 164.3 137.7 144.2
65-74 years------- 158.4 160.6 159.8 153.7 166.6 142.3 155.2 159.3 169.5 162.1 160.3
75-79 years------- 172.0 184.5 193.4 160.4 192.0 170.0 138.5 164.5 105.0 171.0 172.4
NOTE: Includes only women with blood glucose determination after challenge. Excludes pregnant women and women with diagnosed diabetes.
8

-------
--------------------------
Table 5. Excess of actual over expected mean glucose values for women 18-79 years of age,by parity: Health Examination Survey, 1960-62
-Excess of actual over
Number tzxpecte'd mean glucose level Parity of f
in mg.% women
Unadjusted1 Adjusted'
o---------------------- -------_---_--__------------ 651 -0.1 l------------------------------------------- 454 2.8 3.0 2 __.m--------------- -----------_----____------------ 616 -2.7 -2.6 3 _---_-_--_---_--_--------------------------------- 509 -2.3 -2.2 4 _---_-____--_______------------------------------- 358 -0.6 -0.9 5-------------------------------------------------- 228 0.4 6 __-_-______--_-___-------------------------------- 132 -0.3 -0.3
7 _____-____---_-___-_------------------------------ 91 0.6 0.4 8-------------------------------------------------- 71 4.7 4.4 9 and over----------------‘ 157 9.2 8.5
1 If di is the difference in mean glucose levels between the specified parity class and all parities in tile ithage group and ni is the number of women in that age-parity group then ?nidi/Zniis the unadjusted excess of actual over expected.
'Adjusted for skinfold thickness. If b. is the slope of the linear regression of skinfold thickness on blood glucose level in the >th age group and si is the ;th difference in skinfold thickness between the 2 parity classes, then bisr is the adjustment for skinfold thickness in thejth age group.
NOTE: Includes only women with blood glucose determination after challenge. Excludes pregnant women and women with diagnosed diabetes.
Table 6. Correlation of parity- - and blood glucose levels in women,- by- age: Health Examination-SurGey, 1960-62 -r Parity
All parities O-8
-18-24 years--------------------------------------------------------------------
25-34 years-------------------------------------------------------------------- :g*;2: 1:.;2;35-44 years-------------------------------------------------------------------- 0:066 ;: ;I;45-54 years--------------------------------------------------------------------
55-64 years-------------------------------------------------------------------- E5781 0:08065-74 years---------------------------------------------------------~---------- 0:032 0.018 75-79 years-------------------------------------------------------------------- -0.095 -0.153
NOTE: Includes only women with blood glucose determination after challenge. Excludes pregnant women and women with diagnosed diabetes. Parity greater than 9 is scored as 9.
9

Table 7. Mean blood glucose levels for women with parity less than nine and parity nine and over,by age: Health Examination Survey, 1960-62
Parity Difference
Age Adjustedfor
Actual skinfold thick
nessl
Mean glucose in mg.%
18-24 years---------------------------------------"------------- . . . -mm m-m
X5-34 years----------------------------------------------------- 110.4 115.035-44 years----------------------------------------------------- 118.6 134.5 1-E45-54 years----------------------------------------------------- 19:655-64 years----------------------------------------------------- E*; 29 -0.765-74 years -_--------------------"------------------------------ 158:O 1631075-79 years----------------------------------------------------- 172.3 170.4 2::
Mean 2 --------_-----_-_--_--------------------------------------- . . . 1. * . 10.4
lIf bi is the slope of the linear regression of skinfold thickness on blood glucose level in the ith age group and si is the jtb difference in skinfold thickness between the 2 parityclasses, then bisi is the adjustment for skinfold thickness in the ith age group.
2 If di is the difference in mean blood glucose levels for the 2 parity classes in the ith age group and I/wi is the variance of that difference, then B wi d@wi is the mean difference shown,with a variance Of l/ZWi. For computational convenience the same value of wi was used for the actual and adjusted differences although they should have been slightly less for the adjusteddifferences. 4 (di- D)'wi= 5.16 (not significant at a 5 percent level).
NOTE: Includes only women with blood glucose determination after challenge. Excludes pregnant women and women with diagnosed diabetes.
Table 8. Mean blood glucose in adults, never married and married, with or without children, by sex and age: Health Examination Survey, 1960-62 -
NeverSex and age married
I Married 1 I Married
Total t-
Men Number of persons Mean glucose in mg.%
18-24 years----------------------- 243 157 105 I
92.6 96.5 98.2 95.625-34 years----------------------- 96 569 481 105.9 101.2 102.3 101.135-44 years----------------------- 646 567 128.7 113.5 111.9 113.845-54 years----------------------- ;z 502 422 120.0 118.8 118.3 119 .o55-64 years----------------------- 30 368 289 135.4 131.8 135.5 130.865-74 years----------------------- 16 233 192 142.0 136.9 75-79 years----------------------- 2 65 53 EE . E'1~~. 151.7 151.6
Women
18-24 years----------------------- 198 243 197 103.1 104.6 111 .O 103.225-34 years----------------------- 60 605 540 115.1 108.4 110.135-44 years----------------------- 33 718 638 110.2 i:; *; 125.4 119.2 ,55-64
years----------------------- 634 536 124.7 13217 138.6 131.645-54 years----------------------- t: 384 306 133.1 144.8 138.6 146.565-74 years----------------------- 13 263 157.8 157.2
75-79 years----------------------- 3 58 '2 :E . 173.3 ELj . 168.3
NOTE: Includes only persons with blood glucose determinations after challenge. Excludes per-sons with diagnosed diabetes and pregnant women. For a few persons it is not known whether or not they had children.
10

Table 9. Parity and diabetes, by age and sex: Sudbury, Massachusetts'
Men Women Men Women
Age Dia- Non- Dia- Non- Dia- Non- Non
diabet& bz$f, betic ,$$ betic ,z:;, bz$ betic
Number of persons Mean number of children ever born
All ages------------------------ 53 "2,154 31 2,385 2.7 2.6
15-24 years--------------------------- 371 39125-34 years--------------------------- ; 526 706 2.435-44 years--------------------------- 741 70145-54 years--------------------------- 1: 298 9:X55-64 years--------------------------- 16265-74 years--------------------------- ;-63 :*0275 years and wer--------------------- 1:2 2;; 3:5 412
1 Includes the stated, confirmed, and newly discovered diabetics in the Sudbury population. 2Excludes 1 person with number of children not stated. 3Excludes 2 persons with number of children not stated.
Table 10. Mean glucose level at parity nine and at lower parities for women with low income oreducation, by selected ages: Health Examination Survey, 1960-62-
Numberofwomen Mean glucose in mg.%T: Family income, education, and age
Parity ?arity lifferpasiy 9 9 ence
FAMILY INCOME
Under $2,000 35-44 years------------------------------------------- 129.8 116.645-54 years------------------------------------------- 134.0 155.3 -E*.f
$2,000-$3,999 35-44 years------------------------------------------- 10 127.0 162.3 35.345-54 years------------------------------------------- 8 130.0 165.5 35.5
EDUCATION
Under 5 years 35-44 years------------------------------------------- 10 131.6 -4.745-54 years------------------------------------------- 8 i267'53 165.0 17.5.
5-8 years 35-44 years------------------------------------------- 123.945-54 years------------------------------------------- 132.5 22E. 1:::
9-12 years 35-44 years------------------------------------------- 18 142.1 24.945-54 years------------------------------------------- 7 x . 151.4 23.5
11
--
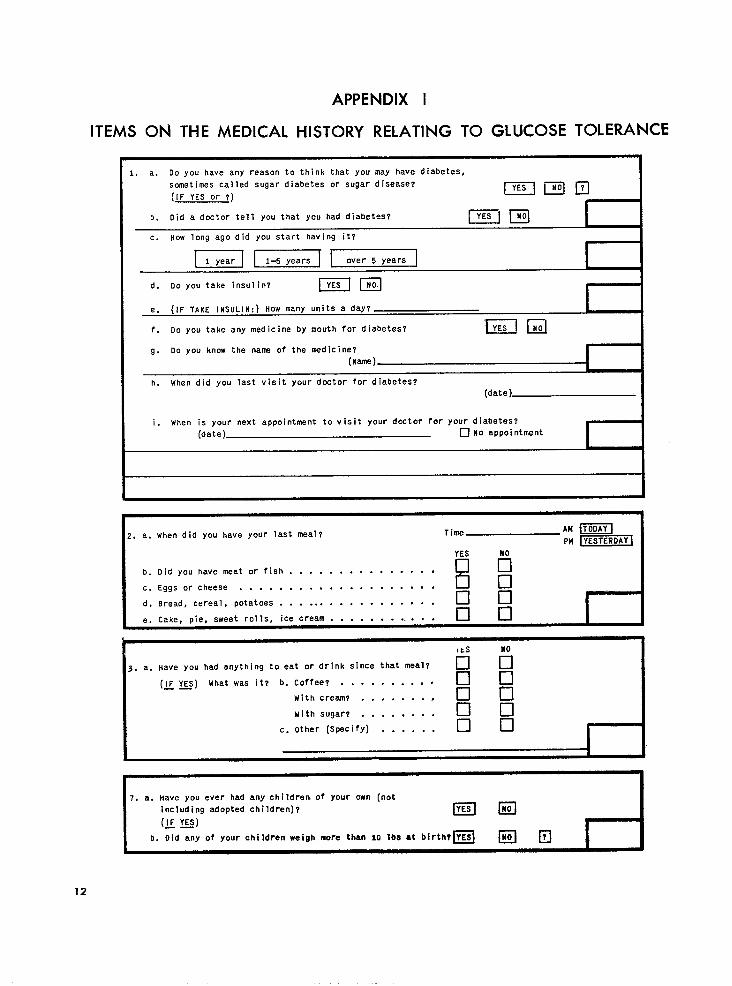
APPENDIX I
ITEMS ON THE MEDICAL HISTORY RELATING TO GLUCOSE TOLERANCE
1. a. Do you have any reason to think that you may have diabetes,
sometimes called sugar diabetes or sugar disease? BpJI (IF YES or T)
b. Did a doctor tell you that you had diabetes? IpiJ I
HOW long ago did you start having it?
c. (TJyearI)
d. DO you take insulin? IYES
e. (IF TAKE INSULIN:) HOW many Units a day?
1. Do you take any medicine by mouth for diabetes? 1YES
9. DO you know the name of the medicine?
(Name) I
h. When did you last visit your doctor for diabetes? (date)
i. when is your next appointment to visit your doctor for your diabetes? (date) 0 No appointment
I
2. a. When did you have your last meal? Time
YES
b. Did you have meat or fish . . . . . . . . . . . . . .
c. Eggs or cheese . . . . . . . . . k3
d. Bread, cereal, potatoes . . . . . . cl
e. Cake, pie, sweet rolls, ice cream . . . . . . . ., . . . q 0
ILS
3. a. Have you had anything to eat or drink since that meal? cl IFi
(IF E) What was it? b. Coffee? . . . . . . . . . . cl cl
With cream? . . . . . . . r
With sugar? . . . . . . . . B E:
c. other (Specify) . . . . . . Cl cl
I
7. a. Have you ever had any children. of your own (not including adopted children)? fGJ/g
(IF YES)
b. Did any of your children weigh more than lo lbs at blrthrm a q
12
1
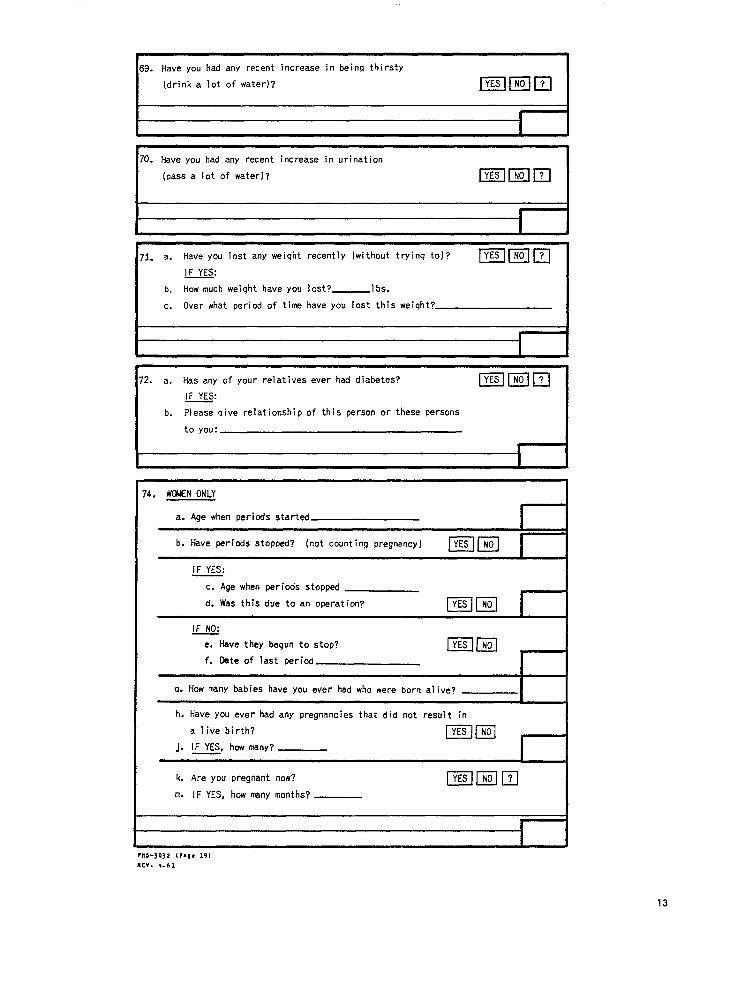
69. Have you had any recent increase in beinq thirsty
(drink a lot of water)?
I70. Have you had any recent increase in urination
(pass a lot of water)? JTE-piFlNOl
f c I Have you lost any weiqht recently (without tryinq to]?
How much weiqht have you lost? c. Over what period of time have you lost this weiqht?
Has any of your relatives ever had diabetes?
74. WMN ONLY
a. Age when periods started I
b. Have periods stopped? (not counting pregnancy) ppiq ,
c. Age when periods stopped
d. Was this due to an operation?
IF NO:
e. Have they begun to stop?
f. Date of last period
a. How many babies have you ever had who were born alive?
h. Have you ever had any pregnancies that did not result in
a live birth? j-%q-iq
j. IF YES, how many? r-4
k. Are you pregnant now?
m. IF YES, how many months?
I I
13

APPENDIX II
CASUAL ASPECTS OF THE GLUCOSE TOLERANCE TEST
The glucose tolerance test used in the Health glucose tolerance test was not standardized. For Examination Survey required that the examinee be example, an examinee might appear for examination given a challenge of 50 grams of glucose shortly at any time of the day, from early morning until late after beginning the examination and that 1 hour later in the evening. Or, he might arrive either just after a venous blood specimen be taken. In that sense eating or many hours after his last meal. And the con-the glucose tolerance test was standardized. There tent of his last meal, as well as his usual diet, was were a number of respects, however, in which the entirely uncontrolled by the survey. Given all these
Table I. Mean blood glucose levels, by time of day challenge was given, specified intervals be-tween last meal and challenge, sex, and age: Health Examination Survey, 1960-62
Time of day challenge was given Interval between last meal and
challenge, sex, and age B-11 a.m. 12-5 p.m. oz ia&
I I
60- 119 minutes in mg.%
Men18-39 years-------------------------------------------------- 87.4 95.8 98.140-54 years-------------------------------------------------- 108.5 127.3 110.055 years and over-------------------------------------------- 130.6 155.1 106.5
Women
40-54 years--------------------------------------------------55 years and over--------------------------------------------
107.7 118.1
125.1 148.5
116.1 131.3
120-179 minutes
Men18-39 years--------------------------------------------------40-54 years--------------------------------------------------55 years and over--------------------------------------------
103.3 115.1 129.1
101.0 116.5 135.0
97.4 113.6 117.3
Womenla-39 years-------------------------------------------------- 102.1 108.8 98.8
LB-39 years-------------------------------------------------- 92.7 105.7 100.5
40-54 years--------------------------------------------------55 year- and over--------------------------------------------
121.0 146.6
118.7 153.5
119.7 135.4
180-239 minutes
MenLB-39 years--------------------------------------------------40-54 years--------------------------------------------------55 years and over--------------------------------------------
107.7 119.5 130.5
99.0
:t;:i
94.5 110.7 137.8
WomenLB-39 years-------------------------------------------------- 110.1 114.0 100.040-54 years-------------------------------------------------- 144.2 131.5 101.855 years and over-------------------------------------------- 150.3 148.8 124.8
NOTE: Values in this table do not constitute estimates for the population of the United States.
14

variables it might well be asked, “How standardized was the glucose tolerance test used by the Health Examination Survey?”
To answer this question, at least in part, the Health Examination Survey, with the help of staff members of the Tecumseh Community Health Study, instituted a special study to investigate the effect on blood glucose levels of differences in the size of the glucose challenge, time of day, and time since last meal.25 The study was undertaken with a group of 24 prisoners who were given a series of glucose tolerance tests under a variety of conditions, extending over a period of 16 weeks. It was found that with a challenge of 50 grams of glucose the blood glucose level 1 hour after challenge was affected to no discernible extent by the time between the last meal and challenge, but that levels after the midday meal were higher than levels after the morning meal. It was also found that any standard test procedure yielded results comparable to any other standard procedure. Response to any given procedure, as with most biological behavior, tended to vary from one time to the next.
In part, the same factors can be examined on the basis of the examination findings themselves. All examinees were asked when they had last eaten. The time of challenge was noted. Mean blood glucose levels are presented in table I by sex, in broad age groups, according to the time of day that the examinee was given the glucose drink, and according to the interval between his last meal and the glucose drink. These data are for examined persons only and do not constitute estimates for the population of the United States. The
data are restricted to persons who came in for examination 1 to 4 hours after the meal, since such persons
account for the majority of ail examinees. When differences in blood glucose level associated with time of challenge and interval since last meal are measured against differences between people, the following conclusions are reached:
Persons given 50 grams of glucose 2 to3 hours or 3 to 4 hours after the morning meal had higher blood glucose levels after challenge than persons given the same glucose challenge be-tween 1 and 2 hours after the same meal.
So far as can be judged from the data, no similar effect is discernible for the midday or evening meals.
The blood glucose level after challenge also varied with time of day. Levels were higher after the midday meal than after the morning or evening meals.
Except for the effect of t ime on blood glucose levels after the morning meal, these findings are consistent with those from the special studp5 and may be considered extensions from the very restricted and special group of 24 male prisoners to the population as a whole.
It is of interest to examine table I for age and sex differentials on the possibility that differences between the various age-sex groups in time of appearance for the examination may somehow introduce an artifact when the data are consolidated. This is not the case. Even in data specific for time of day and time since last meal there is strong gradient by ageand a definite, though weaker, sex differential, just as there is in the consolidated data.
15
APPENDIX III
QUALITY OF BLOOD GLUCOSE DETERMINATIONS
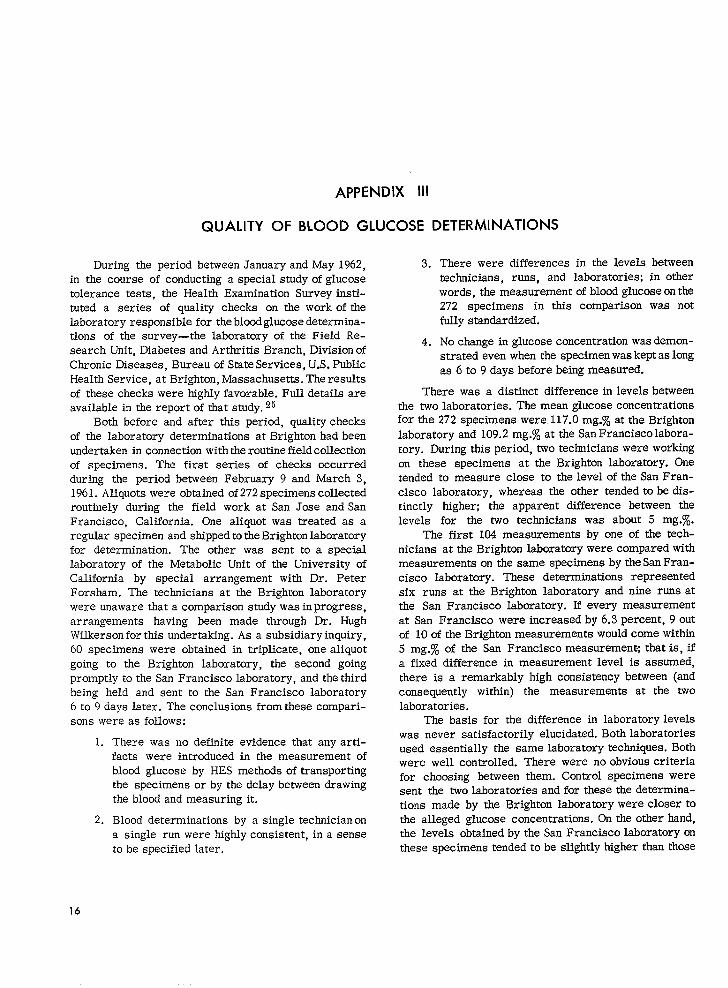
During the period between January and May 1962, in the course of conducting a special study of glucose tolerance tests, the Health Examination Survey instituted a series of quality checks on the work of the laboratory responsible for the bloodglucose determinations of the survey-the laboratory of the Field Re-search Unit, Diabetes and Arthritis Branch, Division of Chronic Diseases, Bureau of State Services, U.S. Public Health Service, at Brighton, Massachusetts. The results of these checks were highly favorable. Full details are available in the report of that study. 25
Both before and after this period, quality checks of the laboratory determinations at Brighton had been undertaken in connection with the routine fieldcollection of specimens. The first series of checks occurred during the period between February 9 and March 3, 1961. Aliquots were obtained of 272 specimens collected routinely during the field work at San Jose and San Francisco, California. One aliquot was treated as a regular specimen and shipped to the Brighton laboratory for determination. The other was sent to a special laboratory of the Metabolic Unit of the University of California by special arrangement with Dr. Peter Forsham. The technicians at the Brighton laboratory were unaware that a comparison study was in progress, arrangements having been made through Dr. Hugh Wilkerson for this undertaking. As a subsidiary inquiry, 60 specimens were obtained in triplicate, one aliquot going to the Brighton laboratory, the second going promptly to the San Francisco laboratory, and the third being held and sent to the San Francisco laboratory 6 to 9 days later. The conclusions from these comparisons were as follows:
1. There was no definite evidence that any artifacts were introduced in the measurement of blood glucose by HES methods of transporting the specimens or by the delay between drawing the blood and measuring it.
2. Blood determinations by a single technicianon a single run were highly consistent, in a sense to be specified later.
3. There were differences in the levels between technicians, runs, and laboratories; in other words, the measurement of blood glucose on the 272 specimens in this comparison was not fully standardized.
4. No change in glucose concentration was demonstrated even when the specimen was kept as long as 6 to 9 days before being measured.
There was a distinct difference in levels between the two laboratories. The mean glucose concentrations for the 272 specimens were 117.0 mg.% at the Brighton laboratory and 109.2 mg.% at the San Francisco laboratory. During this period, two technicians were working on these specimens at the Brighton laboratory. One tended to measure close to the level of the San Francisco laboratory, whereas the other tended to be distinctly higher; the apparent difference between the levels for the two technicians was about 5 mg.%.
The first 104 measurements by one of the technicians at the Brighton laboratory were compared with measurements on the same specimens by the San Francisco laboratory. These determinations represented six runs at the Brighton laboratory and nine runs at the San Francisco laboratory. If every measurement at San Francisco were increased by 6.3 percent, 9 out of 10 of the Brighton measurements would come within 5 mg.% of the San Francisco measurement that is, if a fixed difference in measurement level is assumed, there is a remarkably high consistency between (and consequently within) the measurements at the two laboratories.
The basis for the difference in laboratory levels was never satisfactorily elucidated. Both laboratories used essentially the same laboratory techniques. Both were well controlled. There were no obvious criteria for choosing between them. Control specimens were sent the two laboratories and for these the determinations made by the Brighton laboratory were closer to the alleged glucose concentrations. On the other hand, the levels obtained by the San Francisco laboratory on these specimens tended to be slightly higher than those
16

obtained by the Brighton laboratory. In other words, the comparisons between the laboratories were in the opposite direction from those that were obtained during the rest of the series and only confuse the issue.
Inter-laboratory comparison is a harsh test of any laboratory. The general conclusion was that blood glucose determinations are not so well standardized as is commonly thought and that additional work in standardization is highly desirable. Although the results of this series were in some respects equivocal, by any realistic standards the laboratory work being done on specimens from the Health Examination Survey was quite reliable.
Between June 1961 and May 1962, a series of aliquots from specimens collected in the field were sent at regular intervals to the laboratory of the Framing
-ooo
ham Heart Study, by arrangements with Dr. Thomas R. Dawber, Director. Except for one aberrant set of comparisons the Brighton laboratory averaged slightly higher than the Framingham. G-fmore interest, perhaps, is the variability of measurement. This may be represented by the statistic s=Gwhere w= c&
2n ii being the difference between determinations by the Boston and Framingham laboratories on the same specimen, and n being the number of specimens. Theoverall value of 2 was 8.0 mg.R, or 5.9 mg.% if the one aberrant set were omitted, When it is considered that this figure includes variability arising from differences be-tween laboratories, between technicians within laboratories, and between laboratory runs over a period of 1 year, the results are very encouraging.
17

APPENDIX IV
DIABETES-DOCUMENTATION
Of the 6,672 sample persons examined, 114 were diagnosed as having definite known diabetes and 11 as having questionable known diabetes. The persons with questionable known diabetes gave a history of disease and reported that the diagnosis had been made by a physician. Furthermore, all reported having seen a physician for the disease witbin the previous 6 months. None, however, were taking any hypoglycemic medication. Because they reported they were under close medical supervision, none were given a glucose challenge. Their blood glucose levels ranged from 74 mg.% to 122 mg.%. Only one was found to have urine glucase and his blood glucose level was 74 mg.%.
The 114 persons diagnosed as having definite known diabetes either reported they were on medication or were found to have elevated blood glucose levels.
Not on hypoglycemic medicationChallenge---------------------------------------------No =hallenge------------------------------------------
On hypoglycemic medicationChallenge---------------------------------------------No challenge-----------------------------------------
lFor 4 persons no specimen was available.
In order to identify the sample group for the Health Examination Survey, a household interview was conducted at each sample household. This made available a large amount of information both for persons subsequently examined and for sample persons who were not examined. Included in this information were data derived from a morbidity questionnaire.
Reports of diabetes from the household interview are in close correspondence with the final diagnoses made from the health examination. Altogether 107 examined persons were reported to have diabetes on the household interview, as compared with 125 with definite or questionable known diabetes on the examination. In 96 cases the two sources agreed. There were
-000
Of the total, 82 were using hypoglycemic agents of some sort, 33 using insulin alone, 5 using both insulin and an oral hypoglycemic, and 44 using only an oral hypoglycemic. ‘Of the 32 persons not on hypoglycemic medication, 24 received a challenge and 8 did not. Blood glucase levels for these 32 persons ranged from 148 to 412 mg.% with challenge and from 138 to364 mg.% with-out challenge. Five cases of definite known diabetes were persons who gave a history of diabetes but denied that it had been diagnosed by a physician. Since their blood glucose levels ranged from 218 to412 mg.% it was assumed that these cases had, in fact, been medically diagnosed.
The distribution of blood glucose levels in mg.% in persons having definite known diabetes was as follows: .
Total Under 150-150 169
24 8
a I74
L70- 200- 300+L99 299
--i- 112 1 4 1
‘;. If 152
29 cases found on examination but not reported on household interview and 11 cases reported on the interview but not diagnosed on the examination. Of the latter, two persons gave a history of diabetes on the examination but the diagnoses could not be confirmed by the evidence available, while nine persons gave no such history on the examination. Although the two sources yield comparable information on diabetes, the household interview can be considered as providing a net understatement of the prevalence of known diabetes in the population. This is in accord with a previous study of this subject, which found 88 cases of diabetes reported by household interview for every 100 identified from medical sources. 96
18

APPENDIX V
STATISTICAL NOTES
The data from the Health Examination Survey come from 42 primary sampling units or stands (standard metropolitan statistical areas or sets of 1 to 3 contiguous counties). The possibility of variation from stand to stand is obviously of analytical concern. In this in-stance, it is possible that a concurrent variation of parity and blood glucose level by stand could yield a spurious correlation or a discordant variation by stand might conceal a real correlation. For example, all 9-parity women might be at places where (for entirely unrelated reasons, such as a shift in laboratory standards) blood glucose levels are unusually high or unusually low.
To explore the “stand effect,” the blood glucose level for each stand has been plotted against the percentage of women of parity nine or more (fig. I). Each statistic is presented relative to the expected value for that stand-expected, that is, on the basis of the age distribution of the sample at that place and the average
values for all stands combined for each age group. Thus, if the actual value is higher than the expected the statistic is presented as a positive difference.
From figure I it appears that places with an “excess” number of women of parity nine or more also tend to have higher than expected mean blood glucose levels, although the association is not very strong. Some association might have been anticipated. The HES found that women in the South had higher than average blood glucose levels and high parity is also more common in the South than in the remainder of the country. (To be precise this “effect,” if, indeed, it is more than a chance phenomenon, may really not be a “stand effect” at all, but may arise at another stage of sampling, or from measurement variation. For analytical purposes, however, it is convenient to treat it as a stand effect.)
Having uncovered this association the question arises ,What is the appropriate method of allowing for it in analysis?” From table 3 it is evident that almost all of the information about parity nine or more is concentrated in the age groups between 35 and 74 years. From table 7 it appears that parity nine or more is associated with a distinct elevation of blood glucose level in the age groups 35-44 and 45-54 years but not in the age groups 55-64 and 65-74 years.
This prior information is used in allowing for the stand effect. Mean values for women 35-54, and 55-74 years are computed for parity nine and parity zero through eight in each stand. The mean value for parity nine or more at all stands was compared with a value for parity zero through eight obtained by weighting the stand-specific value for parity zero through eight
A
.
A- Actual-~xpecied percentof wmlwn of parity 9
T
B- Actual-expected blood IS glucose level (in mg.%l
. t
Figure I. Excess in blood glucose level and in the pro-portion of women of parity nine, by stand.
by the number of parity nine women in that stand and summing over all stands. Symbolically, if nii is the number of parity nine women in a specific stand in the jthage group and Xii is the mean blood glucose level for women of parity zero through eight, then the adjusted mean for parity zero through eight is F nii Xii/ Tni,-This leads to the following comparisons for the total HES sample:
Mean blood glucose
Thus, what might be described as the stand effect has only a trivial influence on the conclusions one would draw from the data.
-I
OUTLINE OF REPORT SERIES FOR VITAL AND HEALTH STATISTICS
Public Health Service Publication No. 1000
Series 1. Programs and collection procedwes .--Reports which describe the general programs of the National Center for Health Statistics and its offices and divisions, data collection methods used, definitions, and other material necessary for understanding the data.
Series 2. Data evaluation and methods research .-Studies of new statistical methodology including: experimental tests of new survey methods, studies of vital statistics collection methods, new analytical techniques, objective evaluations of reliability of collected data, contributions to statistical theory.
Series 3. Analytical studies.- Reports presenting analytical or interpretive studies based on vital and health statistics, carrying the analysis further than the expository types of reports in the other series.
Series 4. Documents and committee reports .-Final reports of major committees concerned with vital and health statistics, and documents such as recommended model vital registration laws and revised birth and death certificates.
Series 10. Data from the Health Interview Survey.- Statistics on illness, accidental injuries, disability, use of hospital, medical, dental, andother services, andotherhealth-related topics, based on data collected in a continuing national household interview survey.
Series 11. Data from the Heatth Examination Survey .-Data from direct examination, testing, and measurement of national samples of the population provide the basis for two types of reports: (1) estimates of the medically defined prevalence of specific diseases in the United States and the distributions of the population with respect to physical, physiological, and psychological characteristics; and (2) analysis of relationships among the various measurements without reference to an explicit finite universe of persons.
Series 12. Data from the Institutional Population Surveys.- Statistics relating to the health characteristics of persons in institutions, and on medical, nursing, and personal care received, based on national samples of establishments providing these services and samples of the residents or patients
Series 13. Data from the Hospital Discharge Survey .-Statistics relating to discharged patients in short-stay hospitals, based on a sample of patient records in a national sample of hospitals.
Series 20. Data on mortality.- Various statistics on mortality other than as included in annual or monthly reports- special analyses by cause of death, age, andother demographic variables, also geographic and time series analyses.
Series 21. Data on natality, marriage, anddivorce. -Various statistics on natal@, marriage, and divorce other than as included in annual or monthly reports- special analyses by demographic variables, also geographic and time series analyses, studies of fertility.
Series 22. Data from the National Natality and Mortality Surveys.- Statistics on characteristics of births and deaths not available from the vital records, basedon sample surveys stemming from these records, including such topics as mortality by socioeconomic class, medical experience in the last year of life, characteristics of pregnancy, etc.
For a list of titles of reports published in these series, write to: Office of Information and Publications National Center for Health Statistics U.S. Public Health Service Washington, D.C. 20201