Embed Size (px)
Citation preview
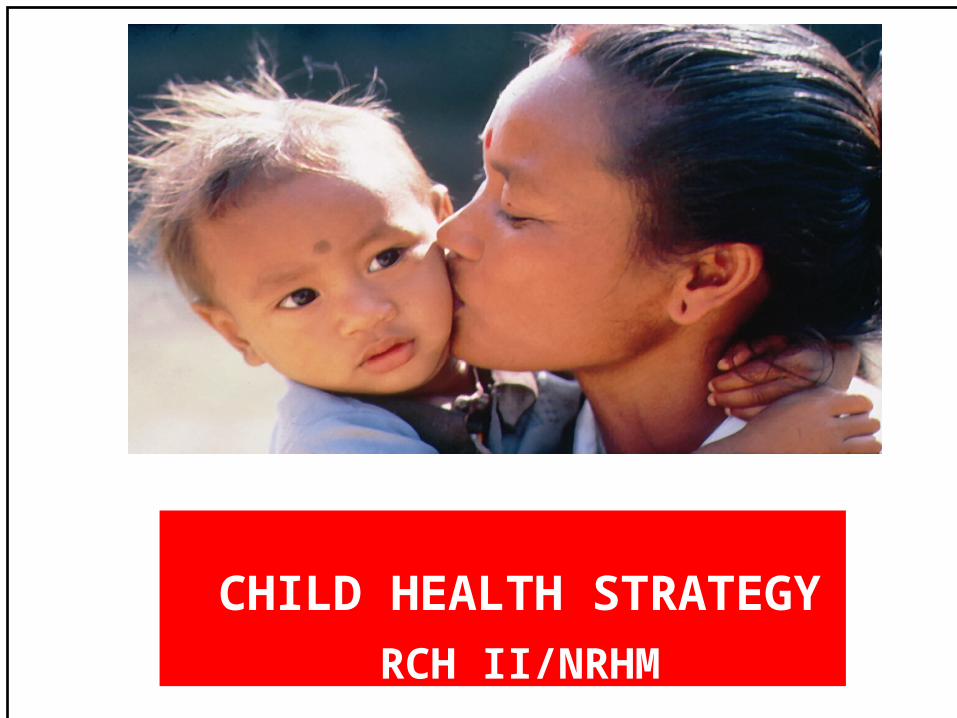
CHILD HEALTH STRATEGY RCH II/NRHM
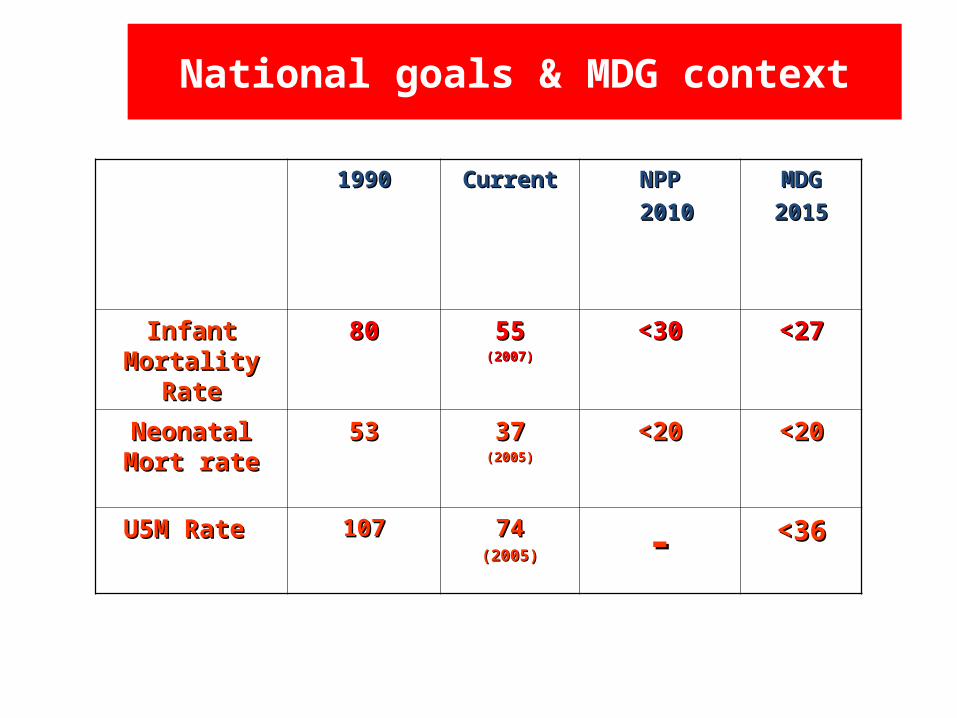
National goals & MDG context
19901990 CurrentCurrent NPPNPP
20102010
MDGMDG
20152015
Infant Infant Mortality RateMortality Rate
8080 5555(2007)(2007)
<30<30 <27<27
Neonatal Mort Neonatal Mort raterate
5353 3737(2005)(2005)
<20<20 <20<20
U5M Rate U5M Rate 107107 7474(2005)(2005) -- <36<36
39.043.448.6
57.0
78.5
67.6
1
74.3
94.9
109.3
0
20
40
60
80
100
120
NFHS 1(92-93) NFHS 2(98-99) NFHS 3(05-06)
Neo- natal mortality Infant mortality #REF! Under f ive mortailty
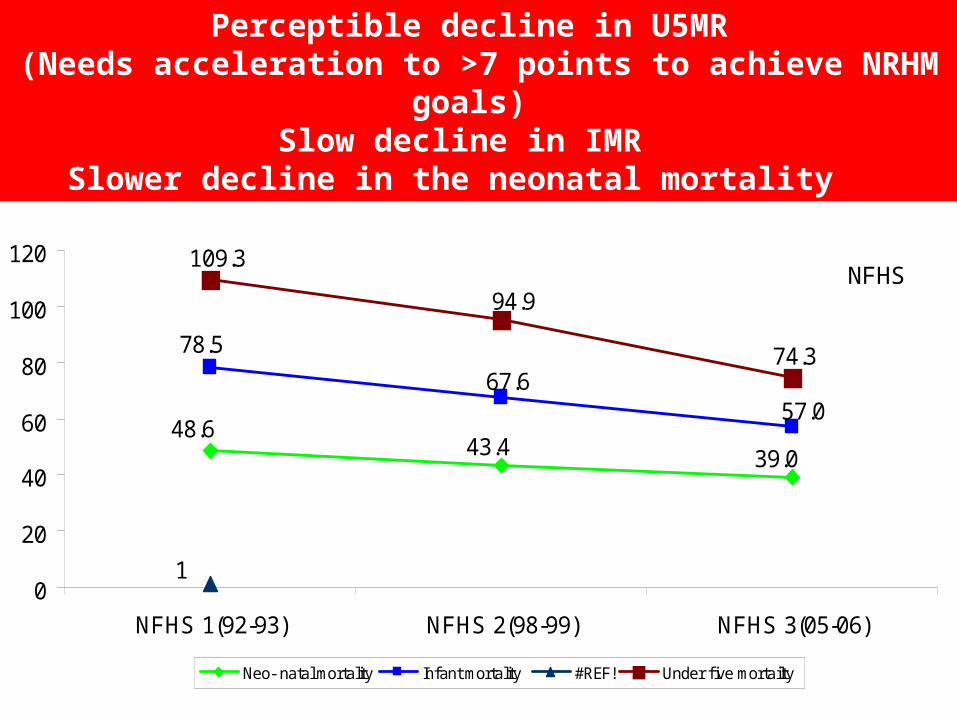
Perceptible decline in U5MR (Needs acceleration to >7 points to achieve NRHM goals)
Slow decline in IMR Slower decline in the neonatal mortality
NFHS
69 70 67 67 66
60 60 58 57 5653 51 50
47 48 47 46 45 45 4439 37
0
10
20
30
40
50
60
70
801980
1982
1984
1986
1988
1991
1993
1995
1997
1999
2004
NMR
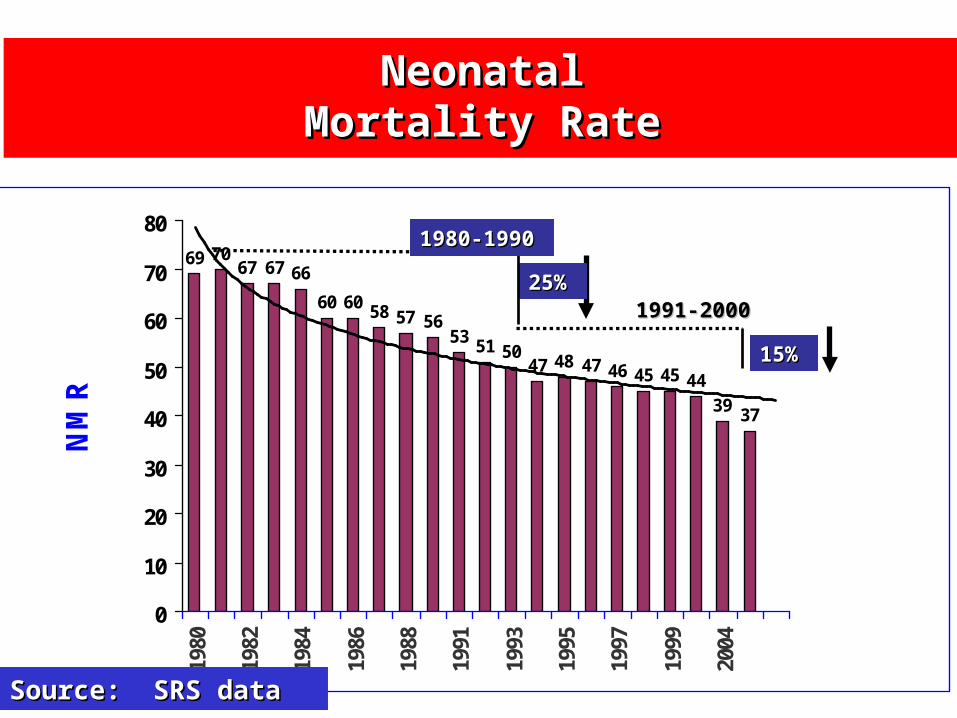
NeonatalNeonatalMortality RateMortality Rate
Source: SRS dataSource: SRS data
15%15%
25%25%
1980-19901980-1990
1991-20001991-2000
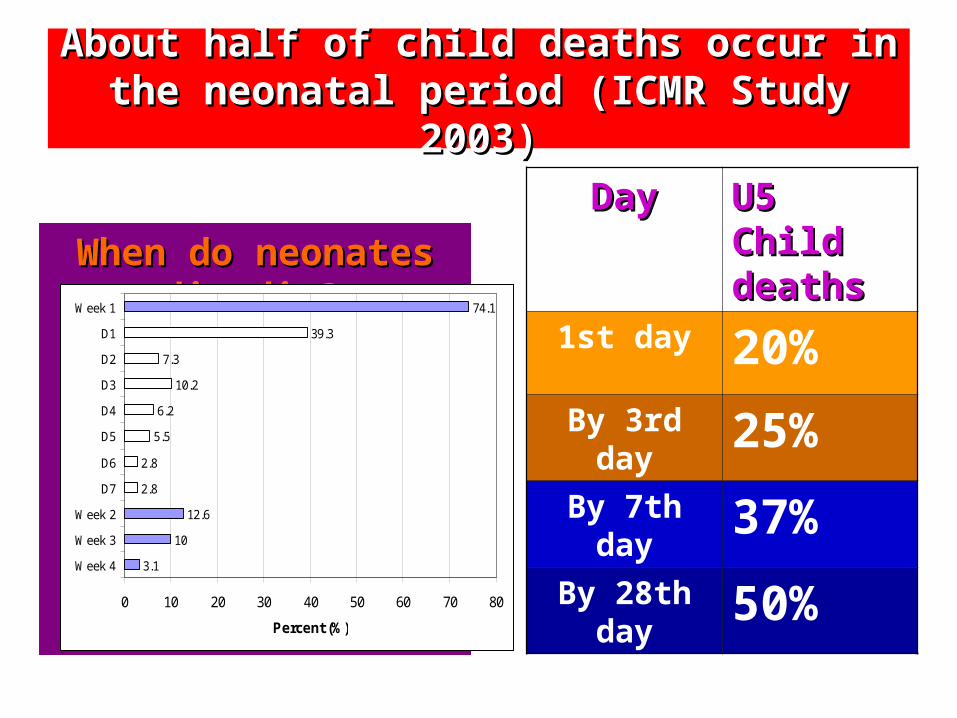
About half of child deaths occur in the neonatal About half of child deaths occur in the neonatal period (ICMR Study 2003)period (ICMR Study 2003)
When do neonates die When do neonates die die?die?
3.1
10
12.6
2.8
2.8
5.5
6.2
10.2
7.3
39.3
74.1
0 10 20 30 40 50 60 70 80
Week 4
Week 3
Week 2
D7
D6
D5
D4
D3
D2
D1
Week 1
Percent (%)
DayDay U5 Child U5 Child deathsdeaths
1st day 20%
By 3rd day 25%
By 7th day 37%
By 28th day
50%
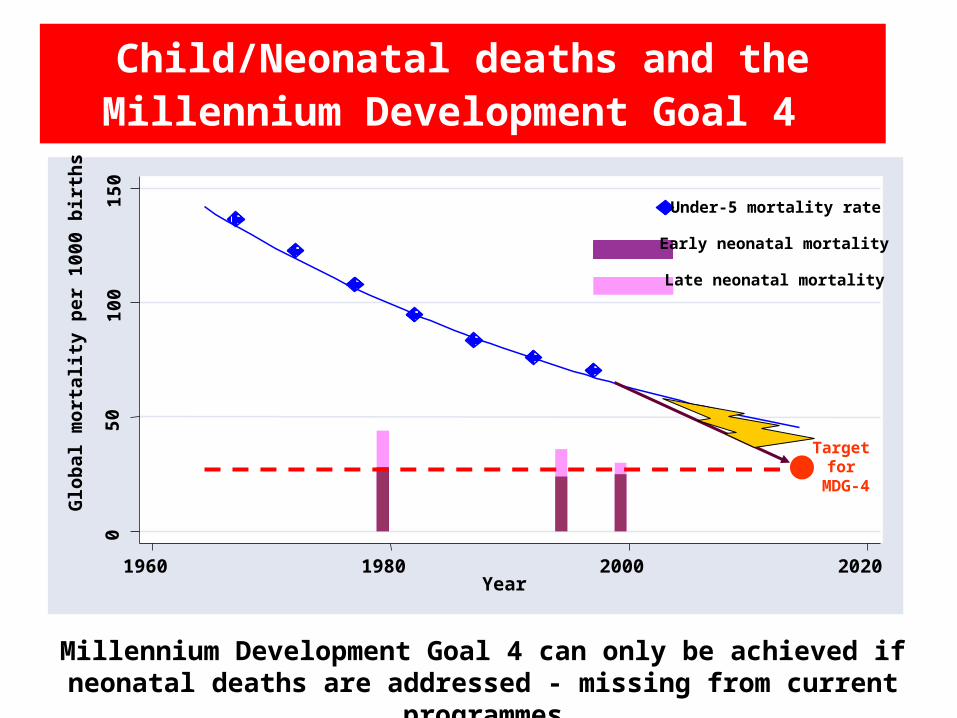
Child/Neonatal deaths and the Millennium Development Goal 4
Millennium Development Goal 4 can only be achieved if neonatal deaths are addressed - missing from current programmes
050
100
150
Glo
bal m
orta
lity
per 1
000
birt
hs
1960 1980 2000 2020Year
Under-5 mortality rate
Late neonatal mortality
Early neonatal mortality
Target for
MDG-4
IMR
tre
nd
s`
IMR
tre
nd
s` RCH II
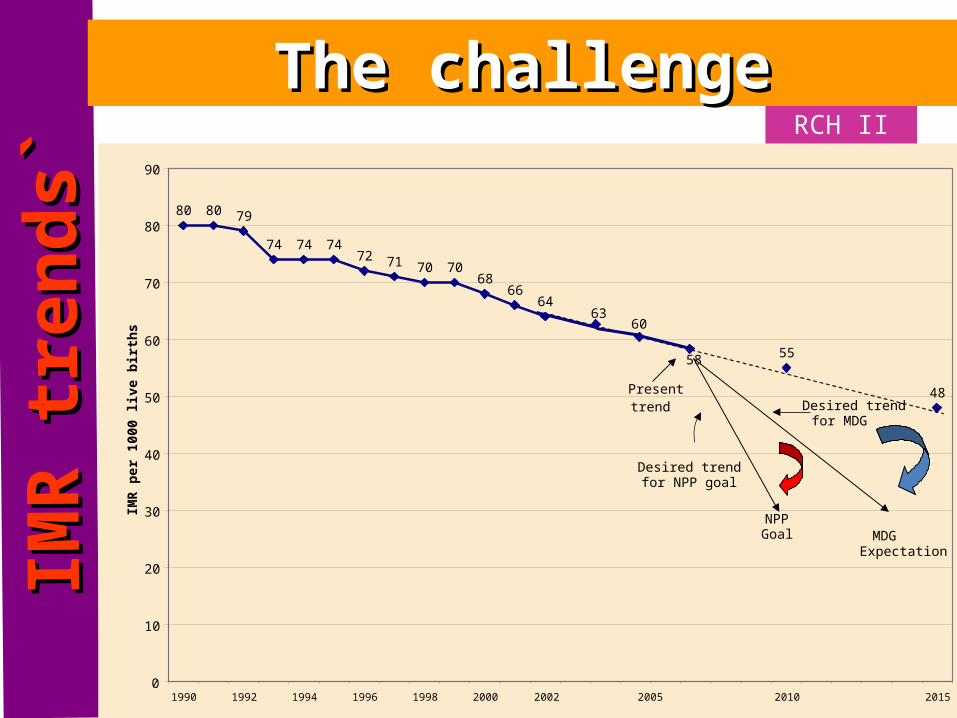
The challengeThe challenge
80 80 79
74 74 7472 71 70 70
6866
64
55
48
0
10
20
30
40
50
60
70
80
90
1990 1992 1994 1996 1998 2000 2005 2010 2015
IMR
per 1
000
live
birt
hs
Present trend
Desired trend for NPP goal
Desired trend for MDG
MDGExpectation
NPPGoal
6360
58
2002
UP26.1%
MP13.0%
Bi11.8%
Rj7.2%
AP6.4%
Mh5.6%
Or4.7%
Guj4.5%
WB4.5%
Kn4.1%
TN3.8%
As2.9%
Hr1.8%
Pb1.3%
Kr0.5%
HP0.4%
Rest1.5%
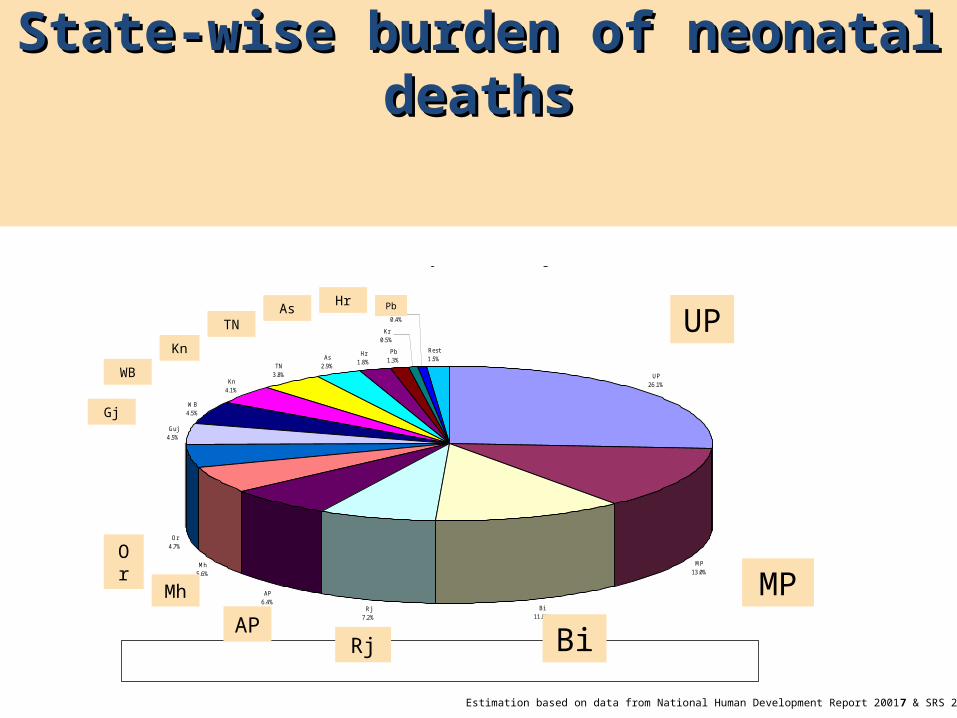
Neonatal Mortality burden in major states
Estimation based on data from National Human Development Report 2001 & SRS 2000
UP:Uttar Pradesh;MP:Madhya Pradesh;Bi:Bihar;Rj:Rajasthan;Mh:Maharashtra;Or:Orissa;WB: West Bengal; Kn:Karnataka,TN:Tamil Nadu;As: Assam;Hr:Haryana;Pb:Punjab;Ke:Kerala;HP:Himachal Pradesh
State-wise burden of neonatal State-wise burden of neonatal deathsdeaths
UP
Mh
APRj Bi
MPOr
Gj
WB
Kn
TNAs Hr Pb
Estimation based on data from National Human Development Report 20017 & SRS 2001
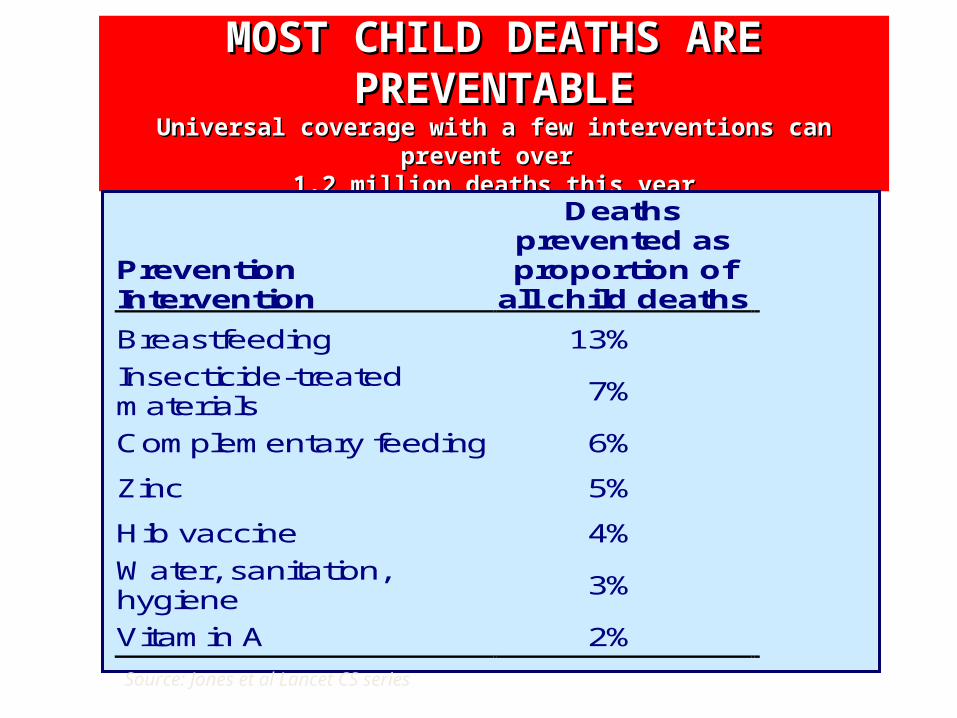
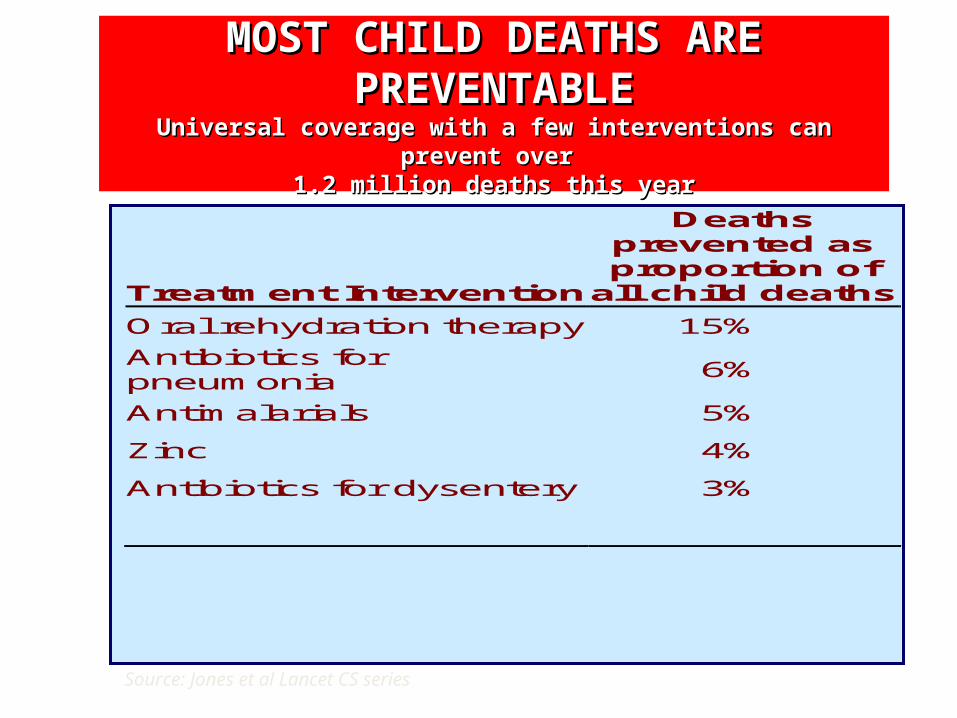
MOST CHILD DEATHS ARE PREVENTABLEMOST CHILD DEATHS ARE PREVENTABLEUniversal coverage with Universal coverage with a few a few interventions can prevent interventions can prevent over over
1.2 million deaths this year1.2 million deaths this year
Prevention Intervention
Deaths prevented as proportion of
all child deaths
Breastfeeding 13%
Insecticide-treated materials
7%
Complementary feeding 6%
Zinc 5%
Hib vaccine 4%
Water, sanitation, hygiene
3%
Vitamin A 2%
Source: Jones et al Lancet CS series
MOST CHILD DEATHS ARE PREVENTABLEMOST CHILD DEATHS ARE PREVENTABLEUniversal coverage with Universal coverage with a few a few interventions can prevent interventions can prevent over over
1.2 million deaths this year1.2 million deaths this year
Treatment Intervention
Deaths prevented as proportion of
all child deaths
Oral rehydration therapy 15%
Antibiotics for pneumonia
6%
Antimalarials 5%
Zinc 4%
Antibiotics for dysentery 3%
Source: Jones et al Lancet CS series
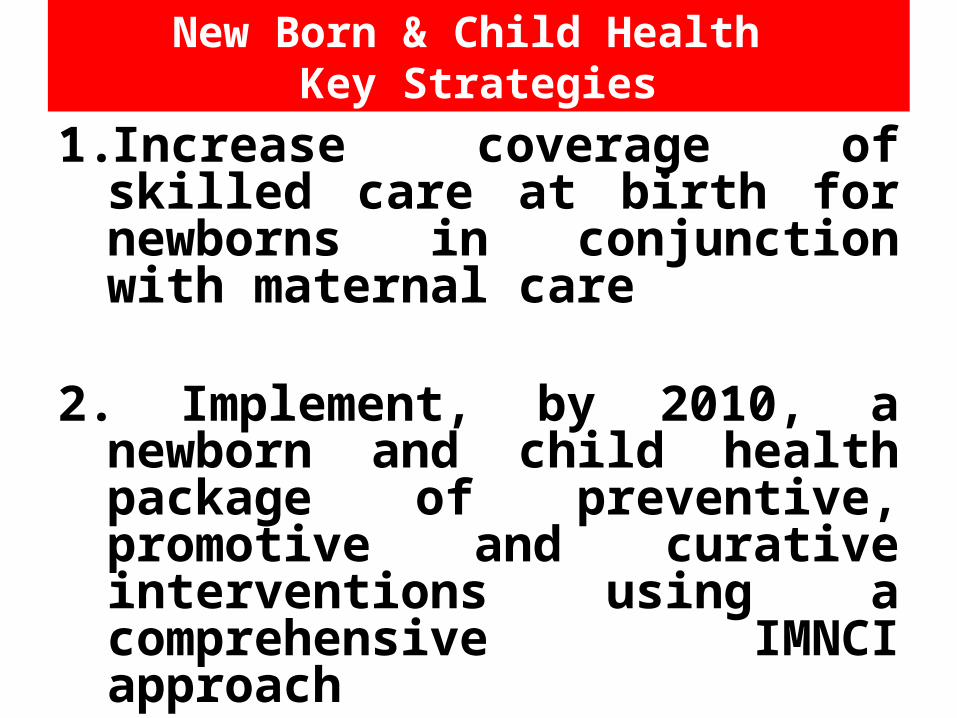
New Born & Child Health Key Strategies
1. Increase coverage of skilled care at birth for newborns in conjunction with maternal care
2. Implement, by 2010, a newborn and child health package of preventive, promotive and curative interventions using a comprehensive IMNCI approach
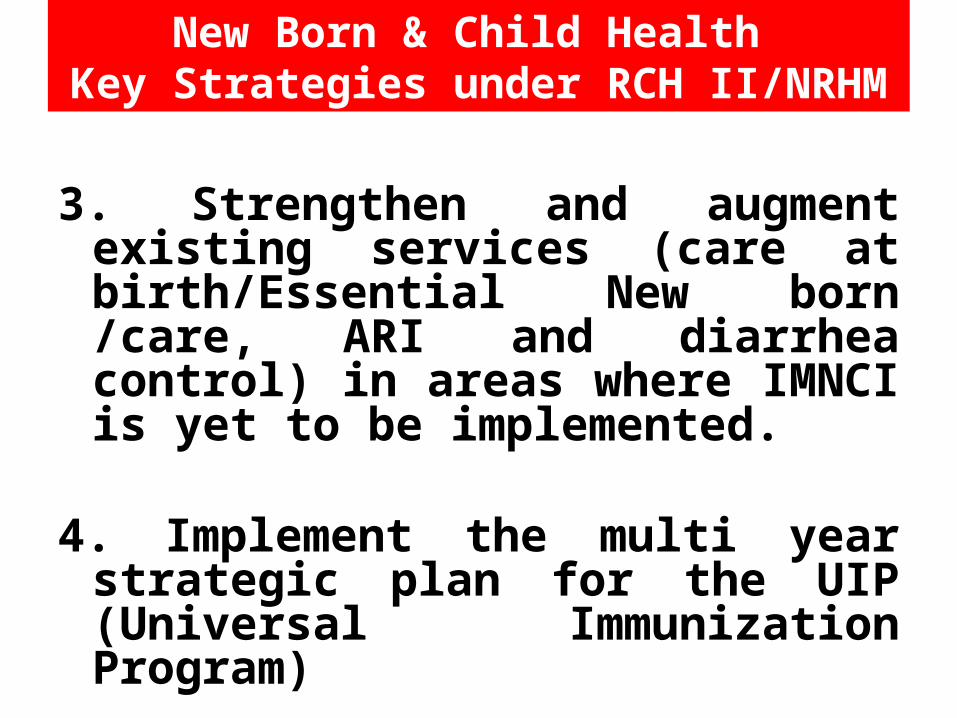
New Born & Child Health Key Strategies under RCH II/NRHM
3. Strengthen and augment existing services (care at birth/Essential New born /care, ARI and diarrhea control) in areas where IMNCI is yet to be implemented.
4. Implement the multi year strategic plan for the UIP (Universal Immunization Program)
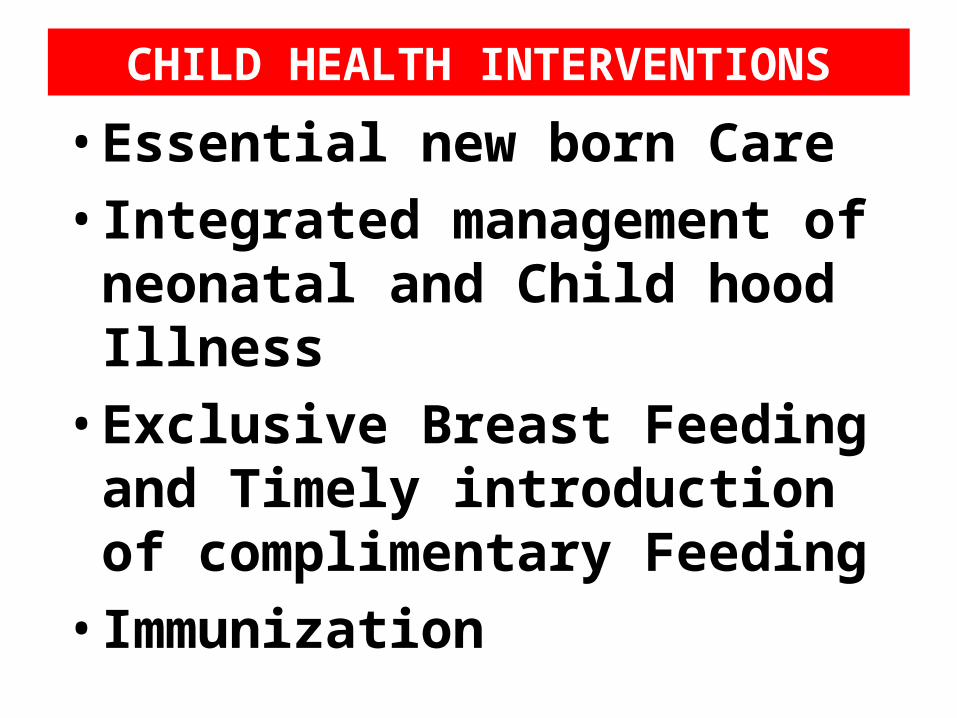
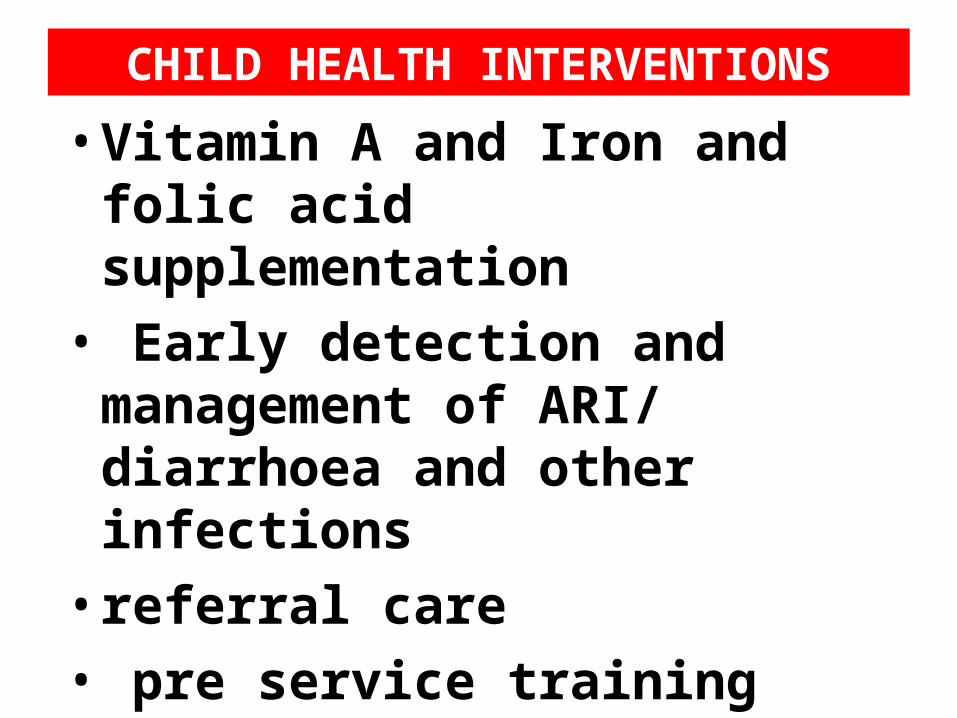
CHILD HEALTH INTERVENTIONS
• Essential new born Care• Integrated management of neonatal
and Child hood Illness• Exclusive Breast Feeding and Timely
introduction of complimentary Feeding
• Immunization
CHILD HEALTH INTERVENTIONS
• Vitamin A and Iron and folic acid supplementation
• Early detection and management of ARI/ diarrhoea and other infections
• referral care • pre service training
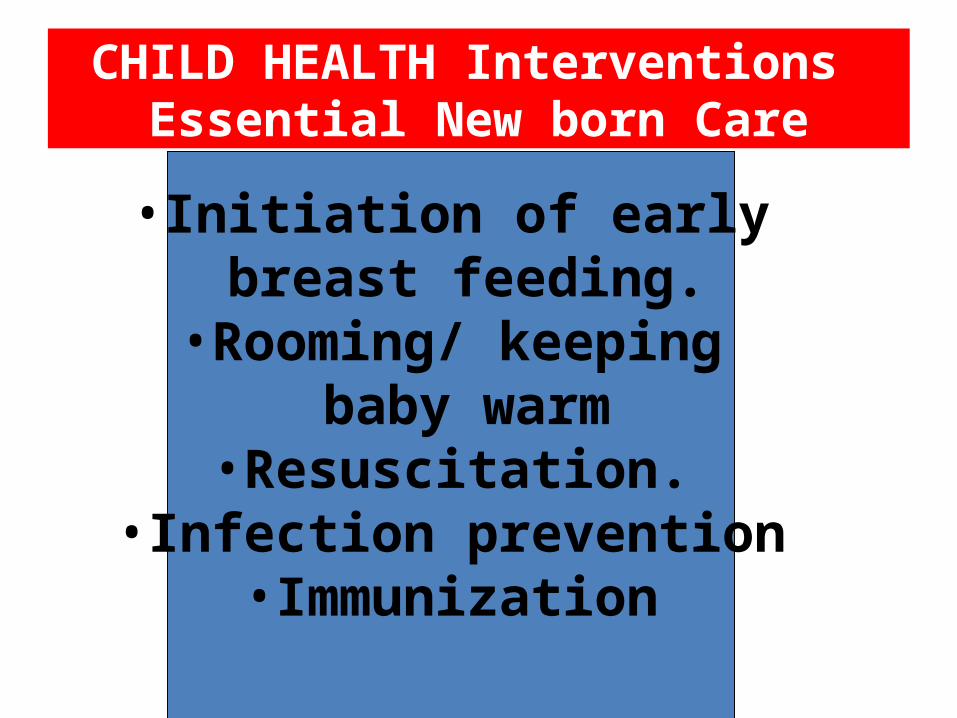
CHILD HEALTH Interventions Essential New born Care
•Initiation of early breast feeding.
•Rooming/ keeping baby warm
•Resuscitation.•Infection prevention
•Immunization
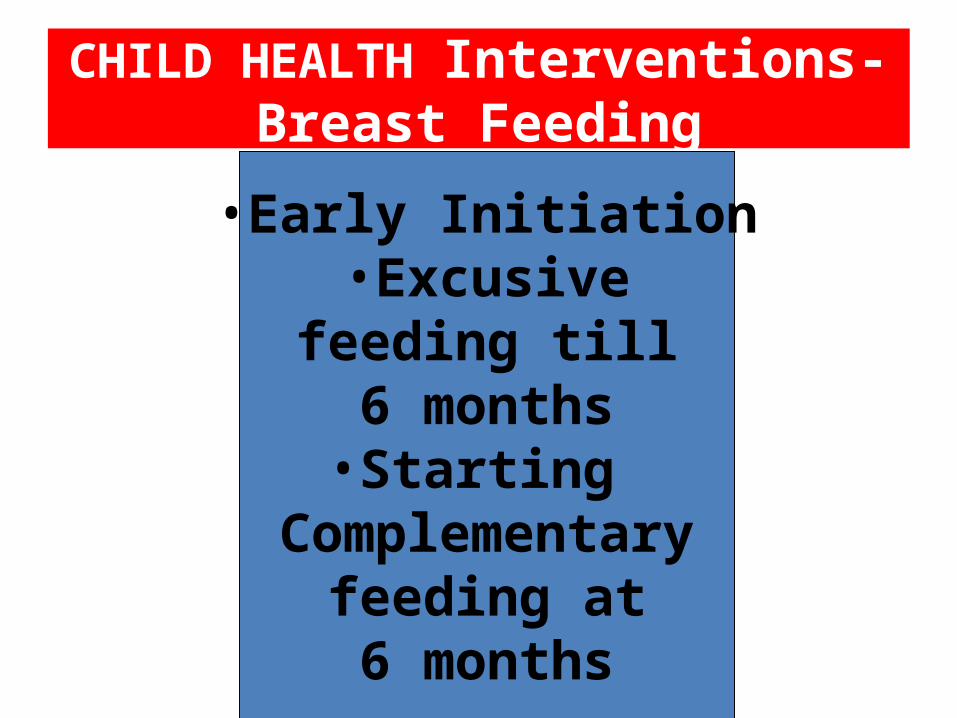
CHILD HEALTH Interventions- Breast Feeding
•Early Initiation•Excusive
feeding till 6 months•Starting
Complementary feeding at 6 months
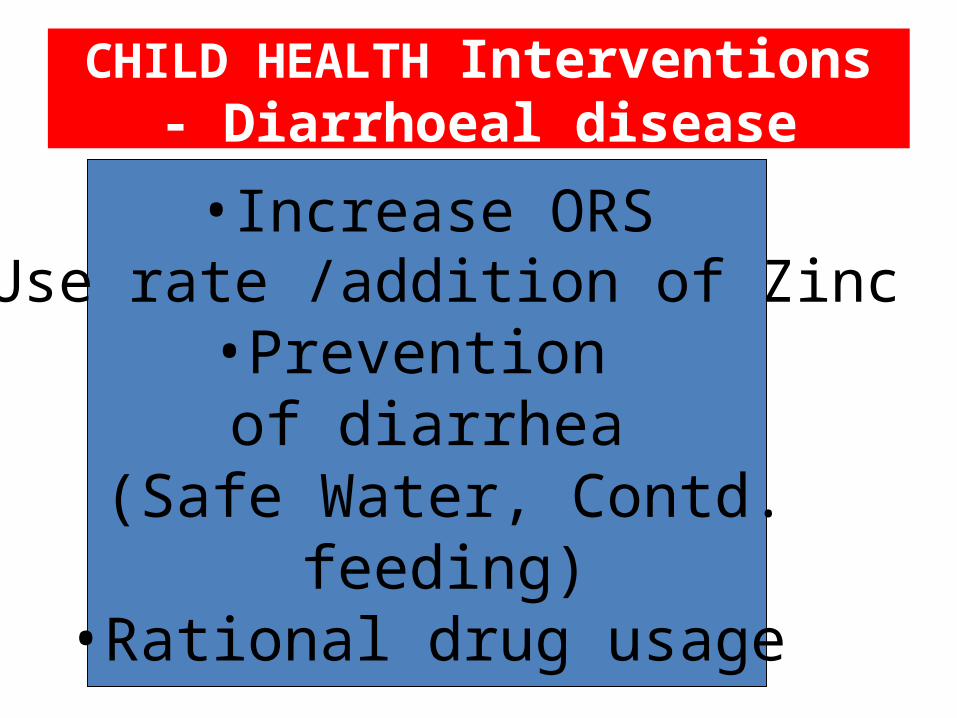
CHILD HEALTH Interventions - Diarrhoeal disease
•Increase ORS Use rate /addition of Zinc
•Prevention of diarrhea
(Safe Water, Contd. feeding)
•Rational drug usage
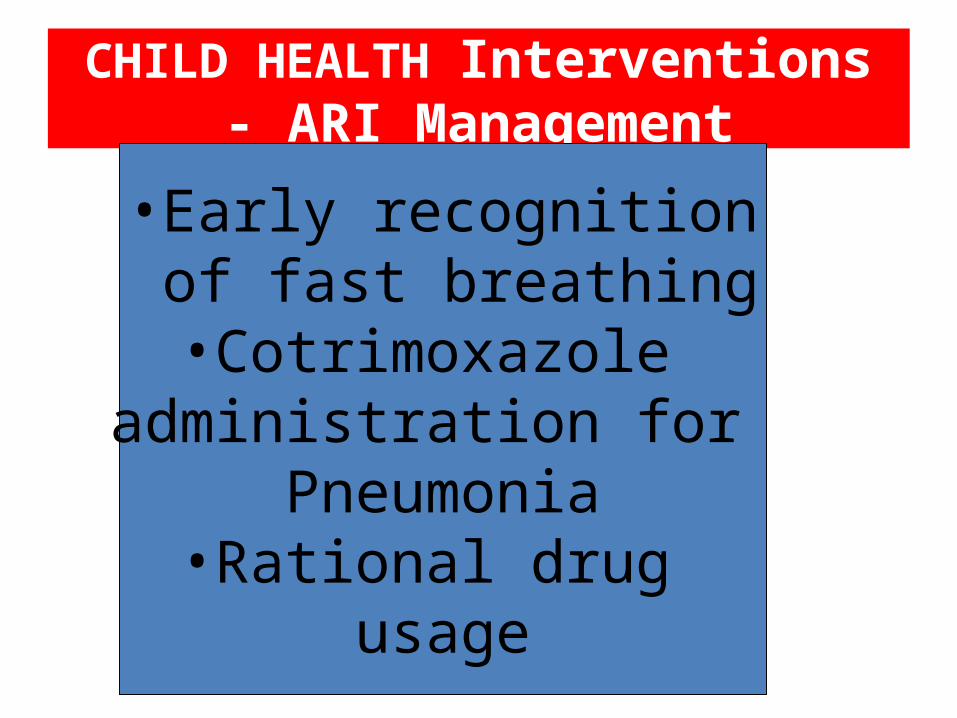
CHILD HEALTH Interventions - ARI Management
•Early recognition of fast breathing•Cotrimoxazole
administration for Pneumonia
•Rational drug usage
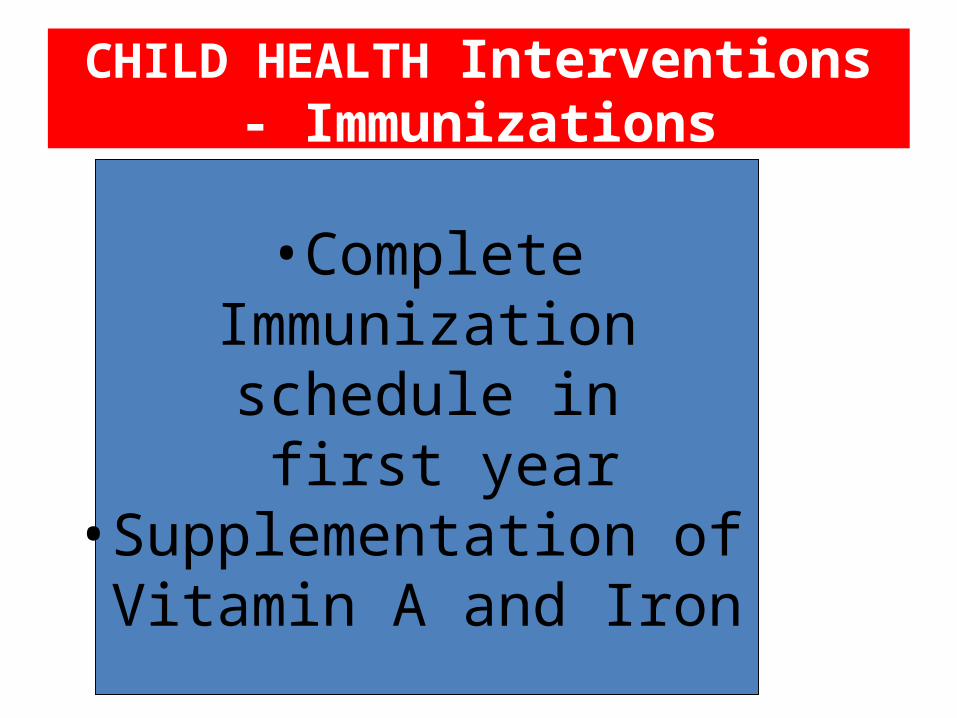
CHILD HEALTH Interventions - Immunizations
•Complete Immunization
schedule in first year
•Supplementation of Vitamin A and Iron
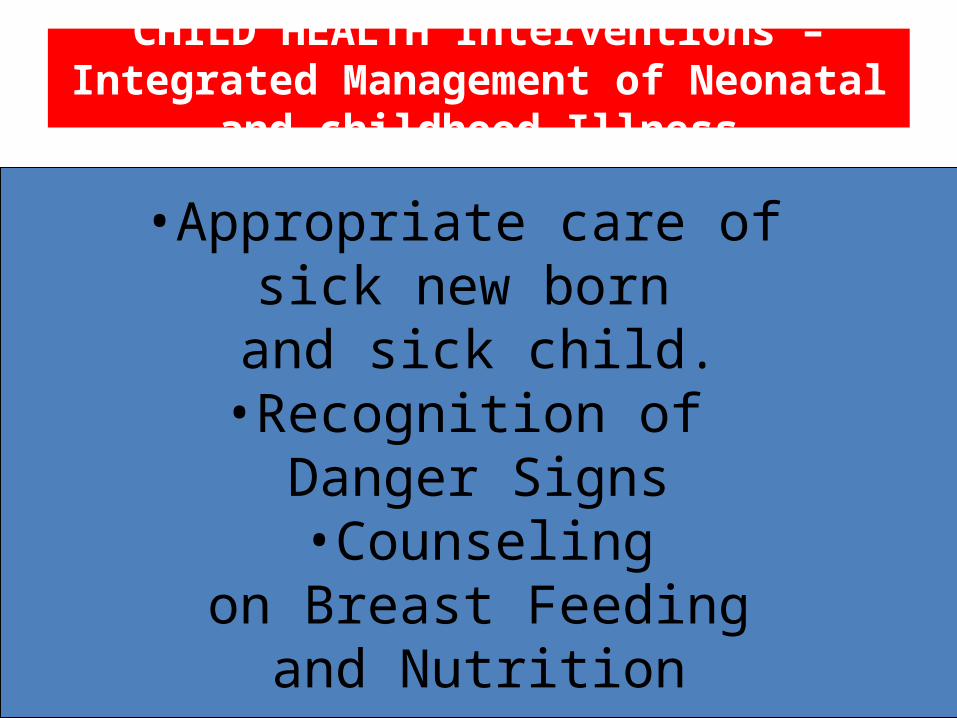
CHILD HEALTH Interventions – Integrated Management of Neonatal and childhood Illness
•Appropriate care of sick new born and sick child.
•Recognition of Danger Signs•Counseling
on Breast Feeding and Nutrition
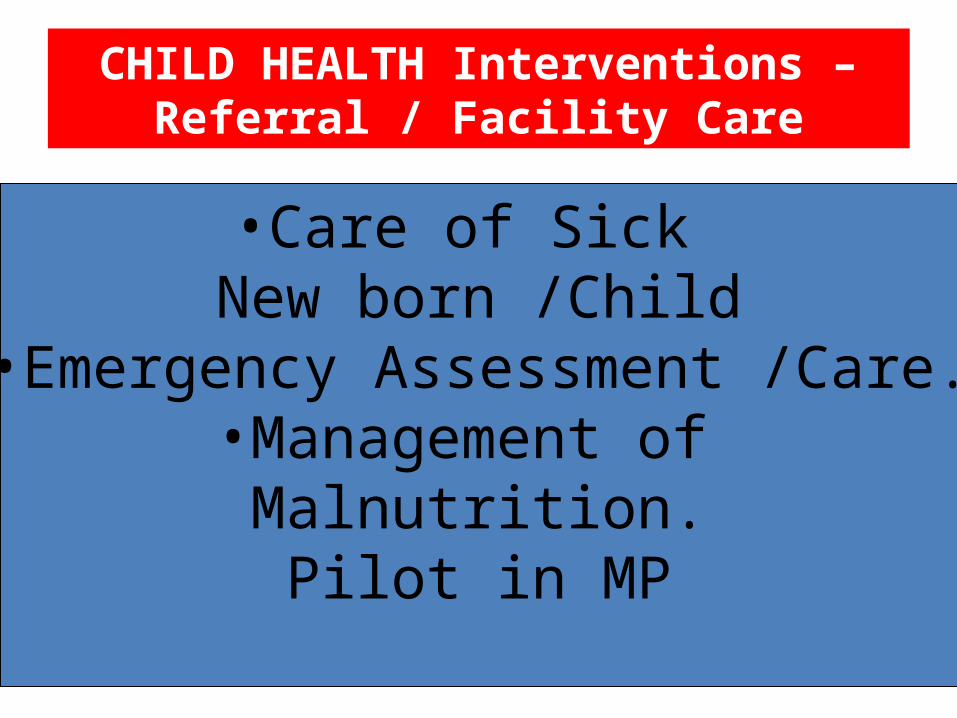
CHILD HEALTH Interventions – Referral / Facility Care
•Care of Sick New born /Child
•Emergency Assessment /Care.•Management of
Malnutrition.Pilot in MP
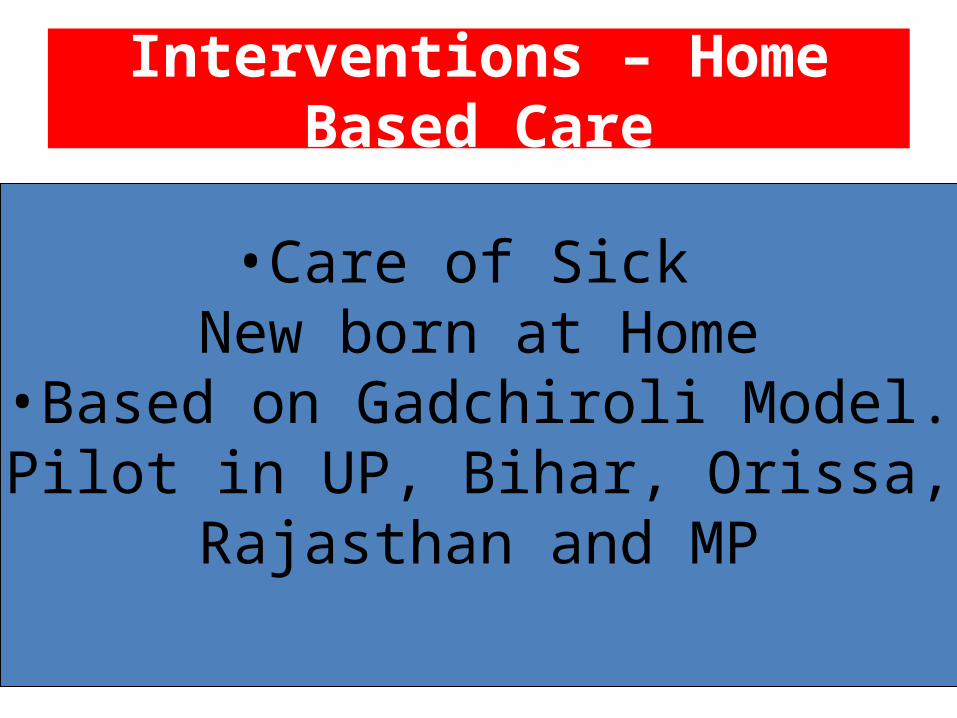
Interventions – Home Based Care
•Care of Sick New born at Home
•Based on Gadchiroli Model.•Pilot in UP, Bihar, Orissa,
Rajasthan and MP
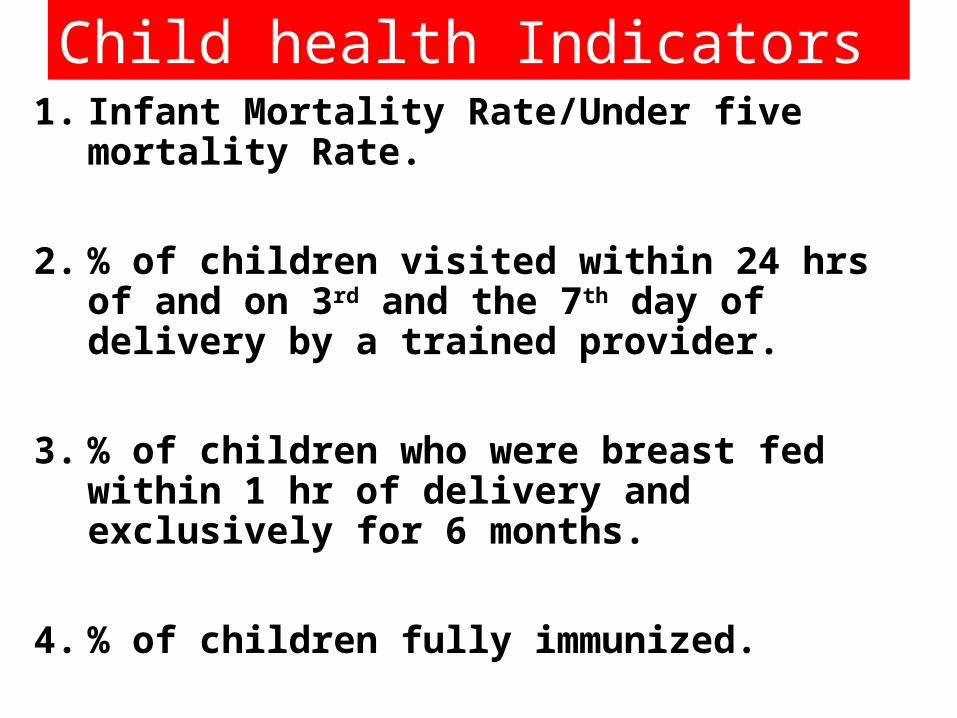
Child health Indicators 1. Infant Mortality Rate/Under five
mortality Rate.
2. % of children visited within 24 hrs of and on 3rd and the 7th day of delivery by a trained provider.
3. % of children who were breast fed within 1 hr of delivery and exclusively for 6 months.
4. % of children fully immunized.
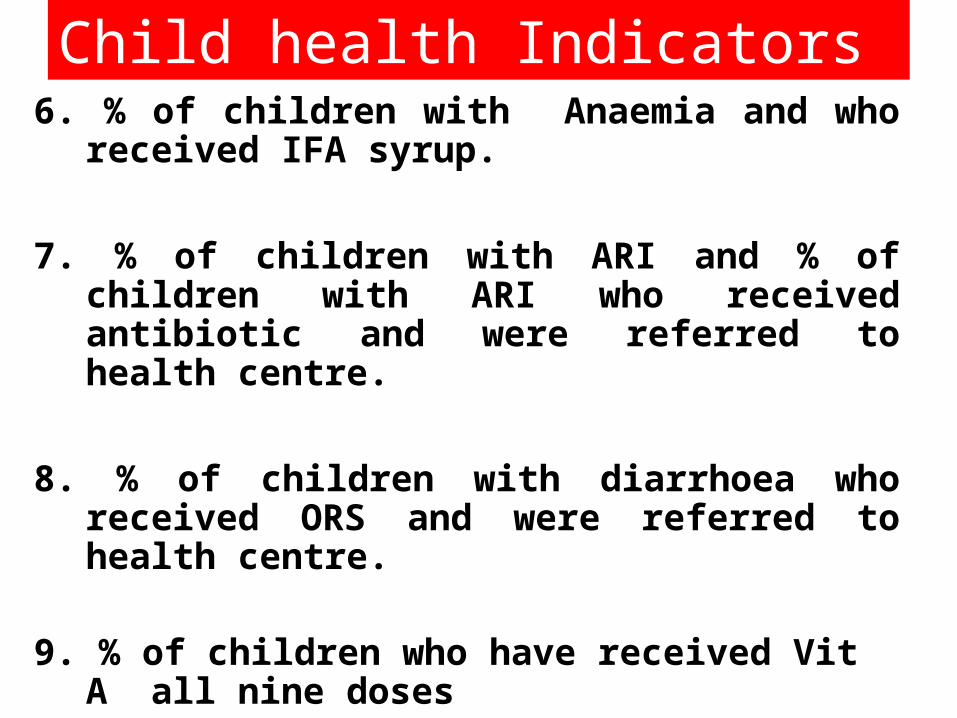
Child health Indicators 6. % of children with Anaemia and who
received IFA syrup.
7. % of children with ARI and % of children with ARI who received antibiotic and were referred to health centre.
8. % of children with diarrhoea who received ORS and were referred to health centre.
9. % of children who have received Vit A all nine doses
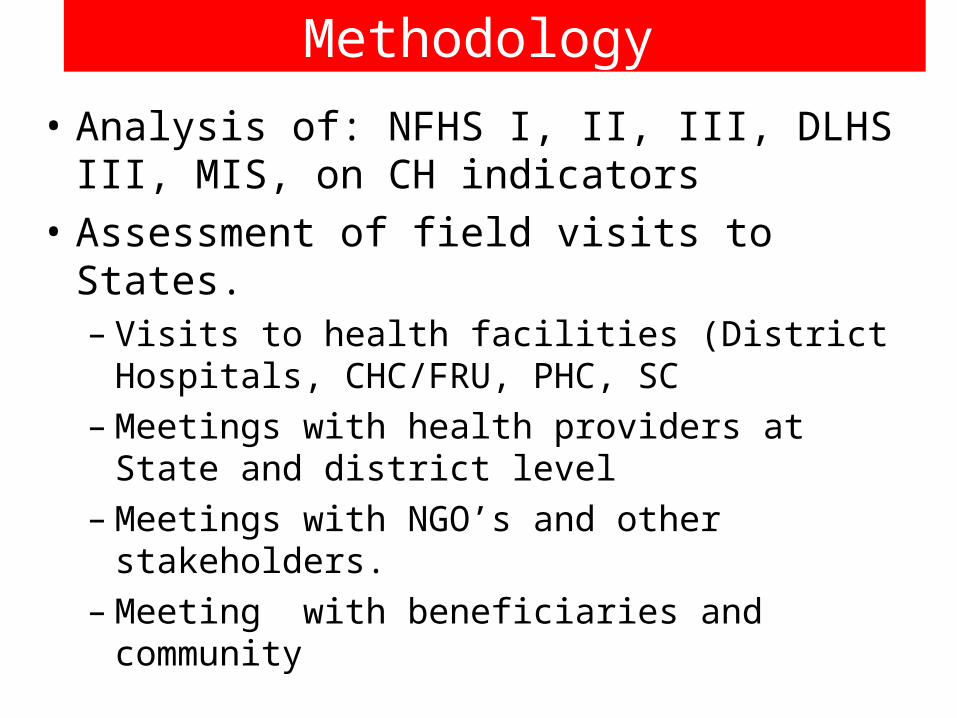
Methodology
• Analysis of: NFHS I, II, III, DLHS III, MIS, on CH indicators
• Assessment of field visits to States.– Visits to health facilities (District Hospitals,
CHC/FRU, PHC, SC– Meetings with health providers at State and district
level– Meetings with NGO’s and other stakeholders.– Meeting with beneficiaries and community
TRENDS IN CHILD HEALTH
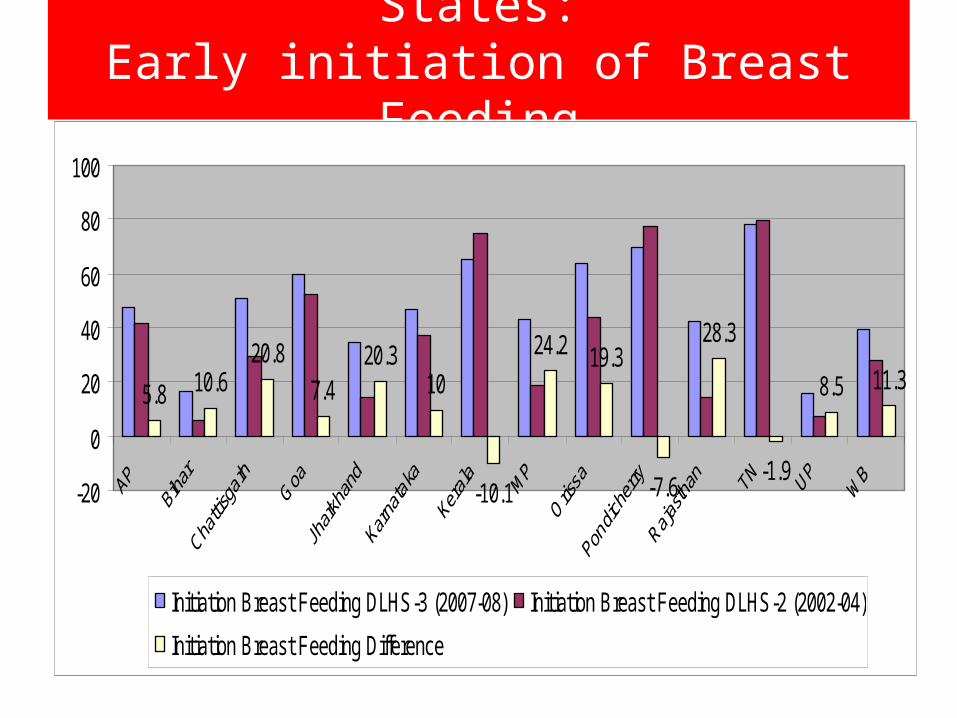
States:Early initiation of Breast Feeding
5.8 10.620.8
7.420.3
10
-10.1
24.2 19.3
-7.6
28.3
-1.9
8.5 11.3
-20
0
20
40
60
80
100
Initiation Breast Feeding DLHS-3 (2007-08) Initiation Breast Feeding DLHS-2 (2002-04)
Initiation Breast Feeding Difference
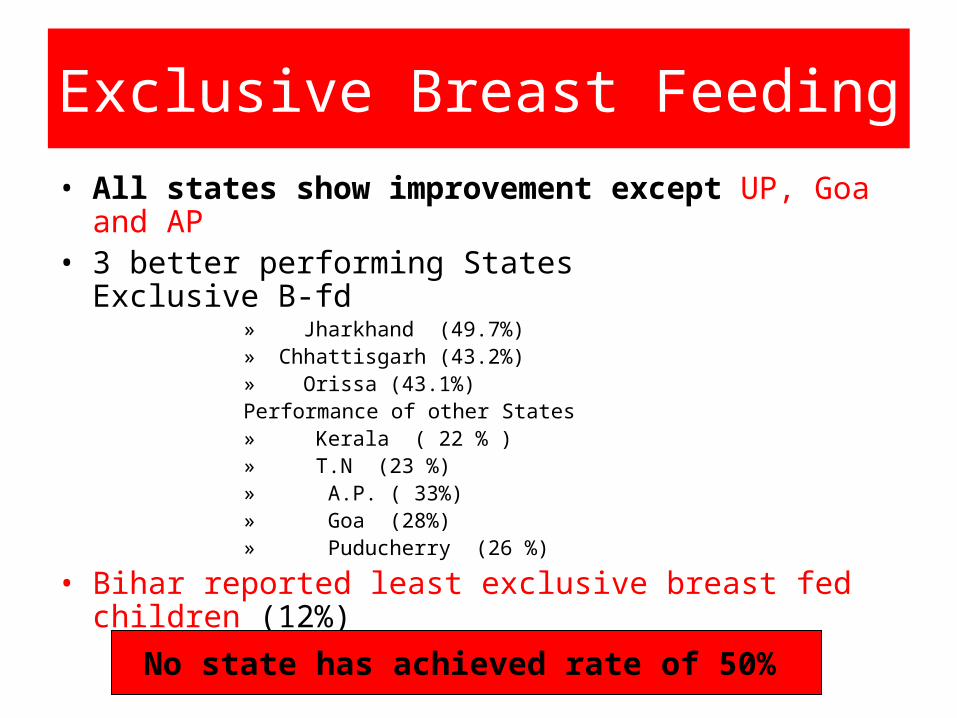
Exclusive Breast Feeding• All states show improvement except UP, Goa and AP • 3 better performing States
Exclusive B-fd » Jharkhand (49.7%)» Chhattisgarh (43.2%) » Orissa (43.1%)Performance of other States» Kerala ( 22 % )» T.N (23 %)» A.P. ( 33%)» Goa (28%)» Puducherry (26 %)
• Bihar reported least exclusive breast fed children (12%)
No state has achieved rate of 50%
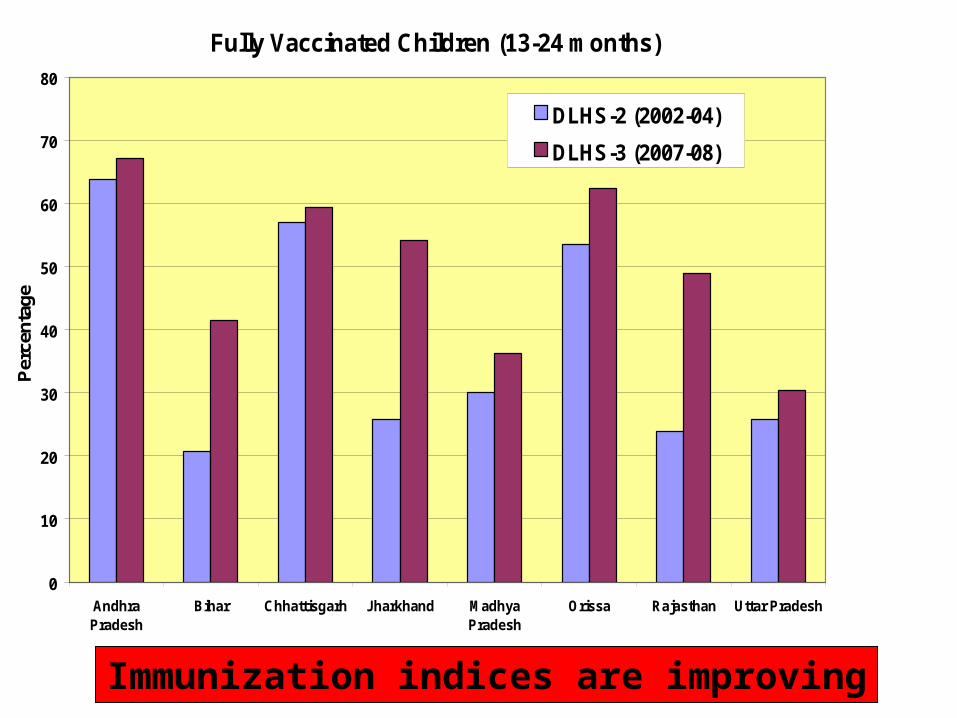
Fully Vaccinated Children (13-24 months)
0
10
20
30
40
50
60
70
80
AndhraPradesh
Bihar Chhattisgarh Jharkhand MadhyaPradesh
Orissa Rajasthan Uttar Pradesh
Per
cent
age
DLHS-2 (2002-04)
DLHS-3 (2007-08)
Immunization indices are improving
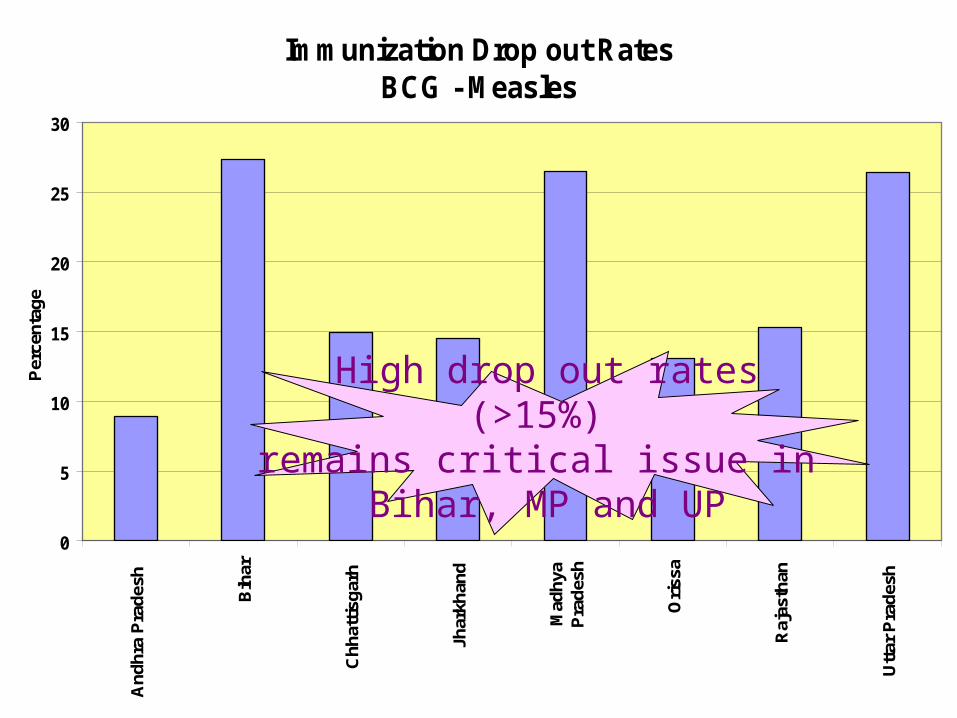
Immunization Drop out RatesBCG - Measles
0
5
10
15
20
25
30A
ndhr
a P
rade
sh
Bih
ar
Chh
attis
garh
Jhar
khan
d
Mad
hya
Pra
desh
Ori
ssa
Raj
asth
an
Utt
ar P
rade
sh
Per
cent
age
High drop out rates(>15%)
remains critical issue in Bihar, MP and UP
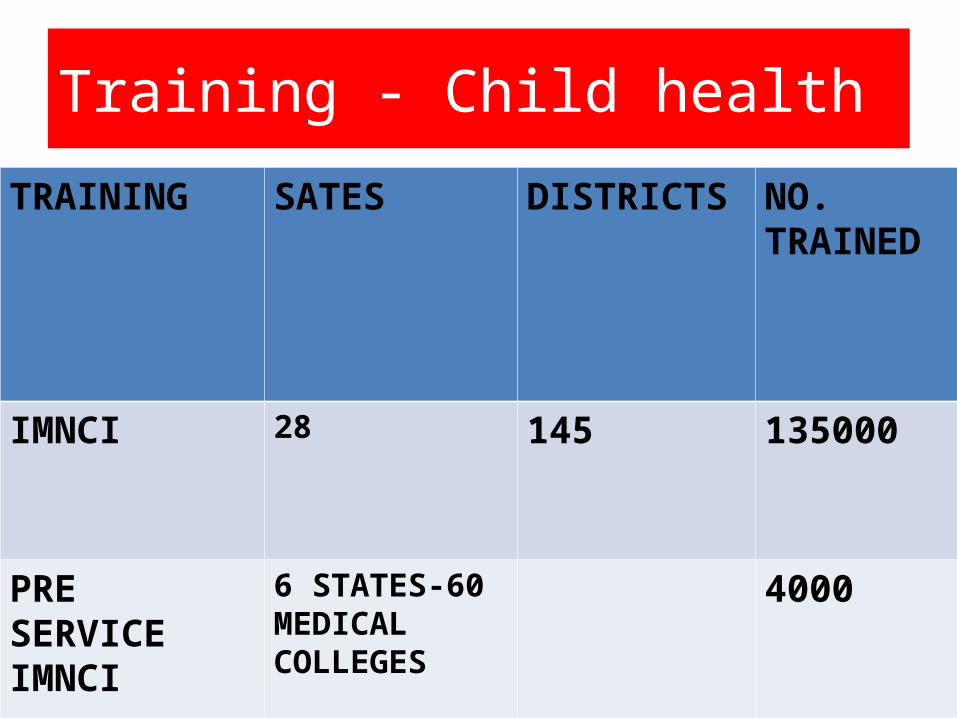
Training - Child health
TRAINING SATES DISTRICTS NO. TRAINED
IMNCI 28 145 135000
PRE SERVICE IMNCI
6 STATES-60 MEDICAL COLLEGES
4000
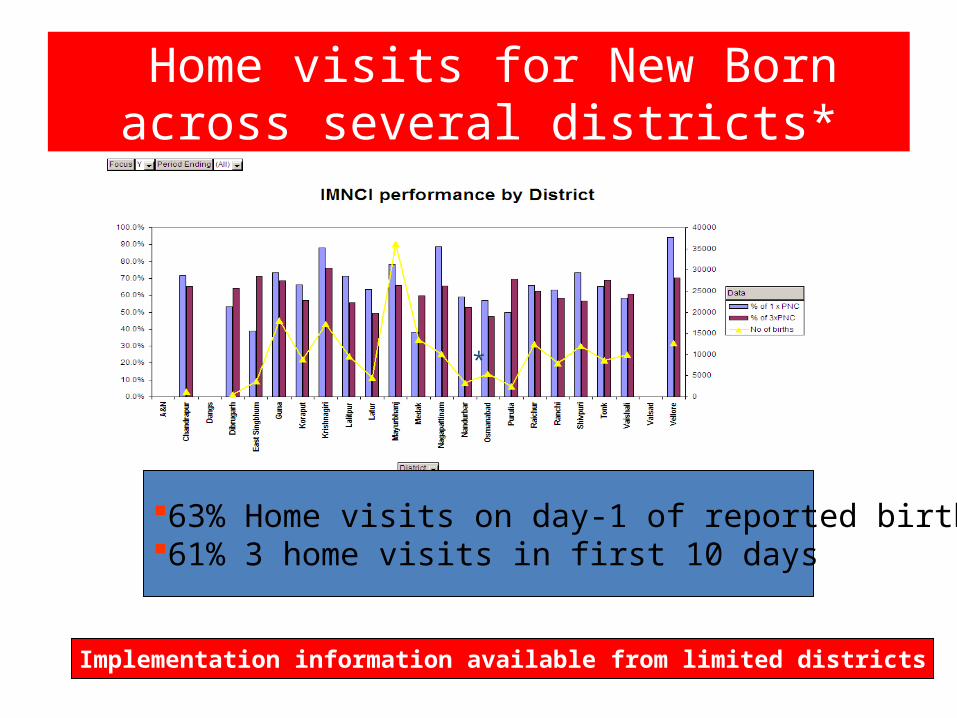
Home visits for New Born across several districts*
63% Home visits on day-1 of reported births61% 3 home visits in first 10 days
*
Implementation information available from limited districts
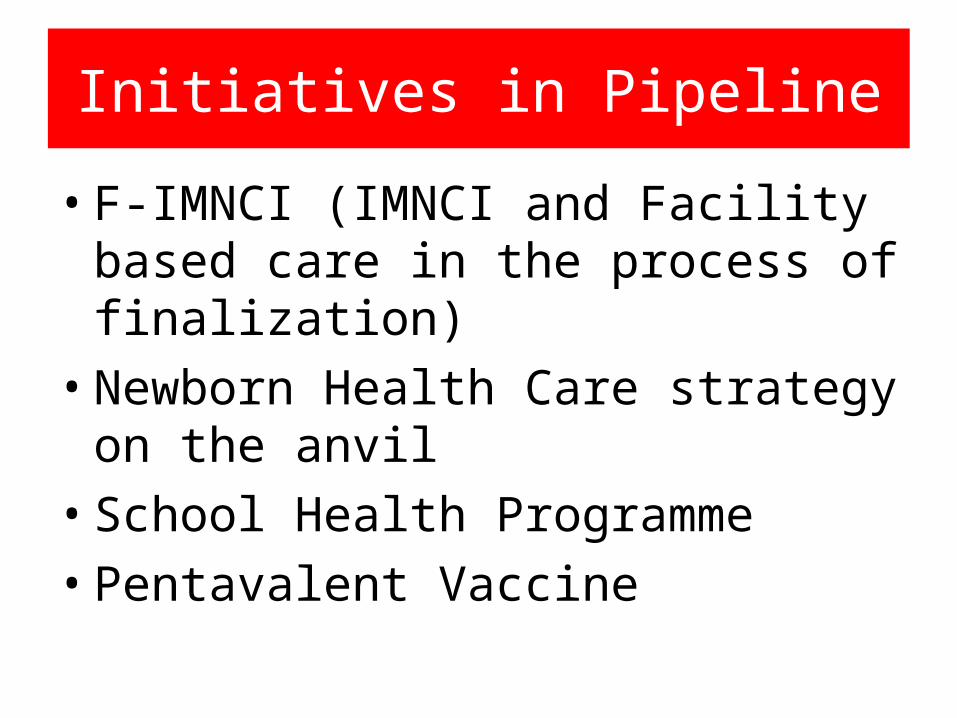
Initiatives in Pipeline
• F-IMNCI (IMNCI and Facility based care in the process of finalization)
• Newborn Health Care strategy on the anvil
• School Health Programme• Pentavalent Vaccine
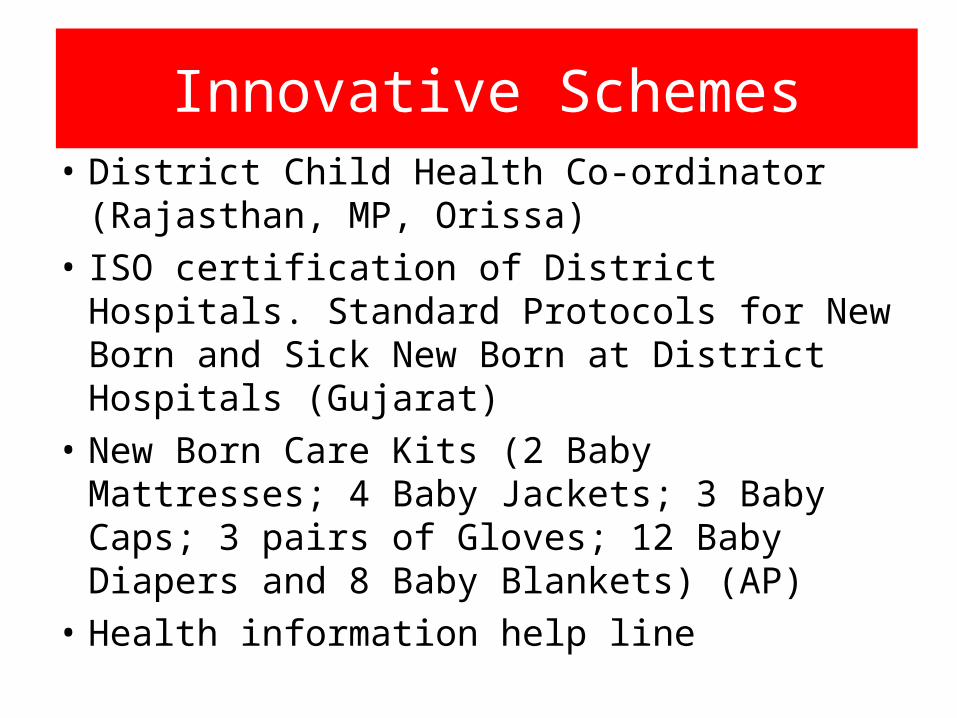
Innovative Schemes• District Child Health Co-ordinator (Rajasthan,
MP, Orissa)• ISO certification of District Hospitals. Standard
Protocols for New Born and Sick New Born at District Hospitals (Gujarat)
• New Born Care Kits (2 Baby Mattresses; 4 Baby Jackets; 3 Baby Caps; 3 pairs of Gloves; 12 Baby Diapers and 8 Baby Blankets) (AP)
• Health information help line
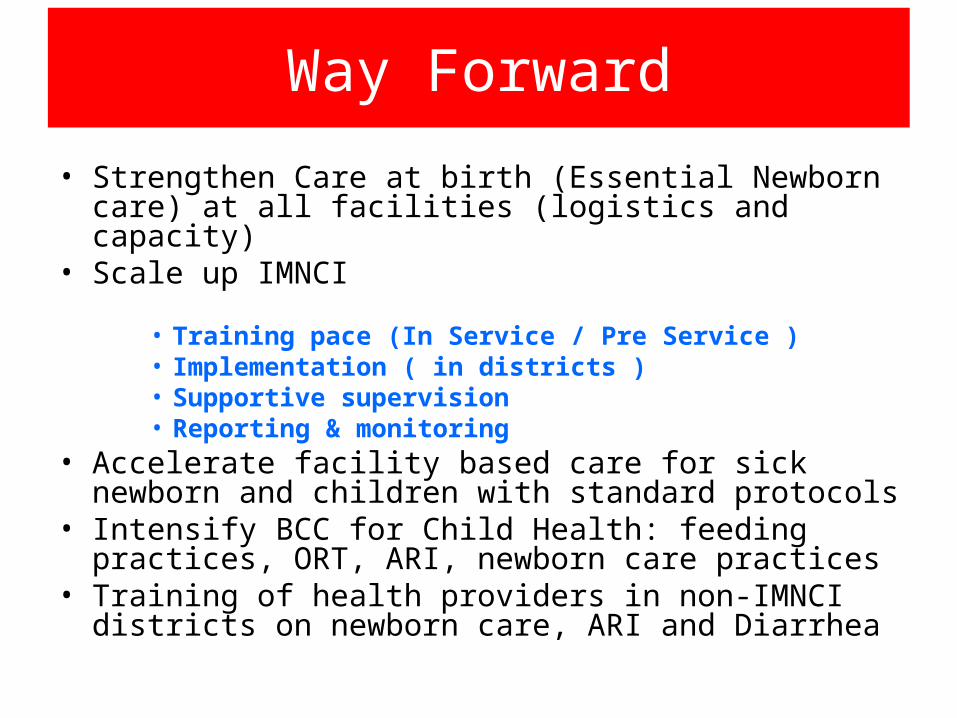
Way Forward
• Strengthen Care at birth (Essential Newborn care) at all facilities (logistics and capacity)
• Scale up IMNCI
• Training pace (In Service / Pre Service )• Implementation ( in districts )• Supportive supervision • Reporting & monitoring
• Accelerate facility based care for sick newborn and children with standard protocols
• Intensify BCC for Child Health: feeding practices, ORT, ARI, newborn care practices
• Training of health providers in non-IMNCI districts on newborn care, ARI and Diarrhea