Embed Size (px)
Citation preview

Child Care/Head Start Partnership Study: Final Report i

Child Care/Head Start Partnership Study: Final Report ii
CHILD CARE/HEAD START PARTNERSHIP STUDY:FINAL REPORT
Study authors:
Diane SchilderBenjamin ChaunceyMeghan Broadstone
Candy MillerAshley Smith
Sheila SkiffingtonKimberly Elliott
Education Development Center, Inc.Newton, MA
Submitted to:
Child Care BureauAdministration for Children and Families
U.S. Department of Health and Human ServicesWashington, DC
September 30, 2005

Child Care/Head Start Partnership Study: Final Report iii
Acknowledgments
The authors would like to sincerely thank. . .
All of the local child care providers and Head Start agencies throughout the state of Ohio who put forth atremendous effort to make our data collection possible.
Ellen Kiron for her devotion to improving the quality of child care for both children and families, and herkeen insight in helping to conceptualize the project.
Ivelisse Martinez-Beck and Dawn Ramsburg from the Child Care Bureau for their time, guidance, andsupportive review of our materials throughout the study.
The state leaders in Ohio, especially Terrie Hare, Jamie Gottesman, Barbara Haxton, and AliciaLeatherman, whose unfailing support and guidance were invaluable to our success. In addition, we wouldlike to thank the Ohio Head Start/Child Care Technical Assistance Workgroup members who helpedguide our new data collection and informed our analysis of data presented in this report. We would alsolike to thank Paulette Mogan for her help with our research activities.
Our Advisory Committee, who helped us better understand the nuances of state and federal policyimplications, reviewed our materials, provided critical feedback, and helped us overcome numerouschallenges. We are immensely grateful to Joanne Brady, Nancy Clark-Chiarelli, Steffanie Clothier,Costanza Eggers-Pierola, David Fernie, Paul Fraunholtz, Scott Groginsky, Terrie Hare, Sharon LynnKagan, Valentina Kloosterman, Barbara Kraemer-Cook, Alicia Leatherman, Jana Martella, Marta Rosa,Rachel Schumacher, James Scott, Sally Coleman Selden, Chris Stoneburner, and Kay Taylor.
Our passionate, dedicated, and resourceful colleagues at Education Development Center, specificallyJoanne Brady, Nancy Clark-Chiarelli, Donna Coppola, Dipty Das, Donna Dervishian, Kim Elliott, CaraMiller, Julie Morrison, Ann Schlesinger, and Bailey Triggs.
Our interns, who approached the task of a substantial data collection with enthusiasm and dedication. Weare deeply grateful to Rachel Anderson, Allison Brassard, Elissa Chin, Iole Damaskinos, Nora Dowley,Virginia Fitzhugh, Sheila Fothergill, Karen Freedman, Rie Kijima, Casey Lamb, Rebekka Lee, SarahLewis, Ariel Nierenburg, Elizabeth Osche, Ken Rampino, Stacy Shorr, Krista Smaby, KristenStinchcombe, Shannon Sullivan, Tina Wong, and Rachel Zeig-Owens.
Our research colleagues and national experts, who provided insights regarding our analysis includingPatricia Divine, Joanna Grymes, Diane Paulsell, Jodi Sandfort, Tom Schultz, and Karen Tvedt.

Child Care/Head Start Partnership Study: Final Report iv
Table of Contents
Executive Summary
Chapter 1: Child Care/Head Start Partnerships: Issues, Theoretical Framework, and Research Design
Chapter 2: The Nature of Child Care/Head Start Partnerships
Chapter 3: Teacher Characteristics, Benefits, and Practices
Chapter 4: Parents and Children Served by Partnerships: Perspectives on Services and Quality
Chapter 5: Conclusion and Discussion
Endnotes
Appendices
A. Director Survey DataB. Partnership Survey DataC. Teacher Survey DataD. Parent Survey Data

Child Care/Head Start Partnership Study: Final Report v
Copyright © September 2005. Education Development Center, Inc. With attribution, this report may befreely reproduced and distributed without permission for educational, non-commercial purposes,but cannot be sold or republished without written permission.
This report was developed by researchers at the Center for Children & Families to learn about the natureof early care and education partnerships and their impact on quality and access to services. The Center forChildren & Families is a center within Education Development Center, Inc. The research activities havebeen funded through a grant from the U.S. Department of Health and Human Services, Administration forChildren and Families, Child Care Bureau (Grant Number 90YE037) and have been supported by theOhio Department of Job and Family Services. Any opinions, findings, conclusions, or recommendationsexpressed in this publication are those of the authors and do not necessarily reflect the views of thefunders.

Child Care/Head Start Partnership Study: Final Report 1
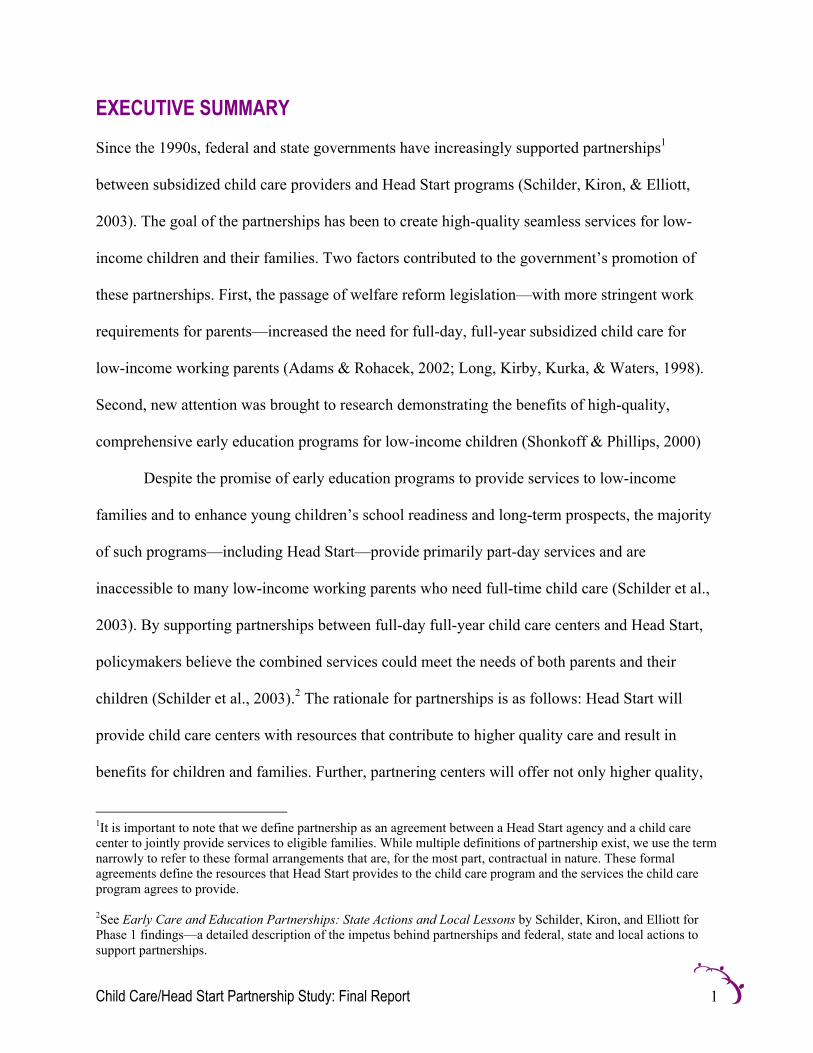
EXECUTIVE SUMMARY
Since the 1990s, federal and state governments have increasingly supported partnerships1
between subsidized child care providers and Head Start programs (Schilder, Kiron, & Elliott,
2003). The goal of the partnerships has been to create high-quality seamless services for low-
income children and their families. Two factors contributed to the government’s promotion of
these partnerships. First, the passage of welfare reform legislation—with more stringent work
requirements for parents—increased the need for full-day, full-year subsidized child care for
low-income working parents (Adams & Rohacek, 2002; Long, Kirby, Kurka, & Waters, 1998).
Second, new attention was brought to research demonstrating the benefits of high-quality,
comprehensive early education programs for low-income children (Shonkoff & Phillips, 2000)
Despite the promise of early education programs to provide services to low-income
families and to enhance young children’s school readiness and long-term prospects, the majority
of such programs—including Head Start—provide primarily part-day services and are
inaccessible to many low-income working parents who need full-time child care (Schilder et al.,
2003). By supporting partnerships between full-day full-year child care centers and Head Start,
policymakers believe the combined services could meet the needs of both parents and their
children (Schilder et al., 2003).2 The rationale for partnerships is as follows: Head Start will
provide child care centers with resources that contribute to higher quality care and result in
benefits for children and families. Further, partnering centers will offer not only higher quality,
1It is important to note that we define partnership as an agreement between a Head Start agency and a child carecenter to jointly provide services to eligible families. While multiple definitions of partnership exist, we use the termnarrowly to refer to these formal arrangements that are, for the most part, contractual in nature. These formalagreements define the resources that Head Start provides to the child care program and the services the child careprogram agrees to provide.
2See Early Care and Education Partnerships: State Actions and Local Lessons by Schilder, Kiron, and Elliott forPhase 1 findings—a detailed description of the impetus behind partnerships and federal, state and local actions tosupport partnerships.
Child Care/Head Start Partnership Study: Final Report 2
but more comprehensive services (Schilder et al., 2003). While this theory is compelling to
many, few quantitative researchers have tested whether partnerships are related to the anticipated
benefits. Moreover, limited research exists on the factors that contribute to a partnerships’ ability
to yield desired results.
Research Design and Methodology
To address questions about early care and education partnerships, researchers at the Center
for Children & Families (CC&F) are undertaking a longitudinal survey research study of
child care centers that examines the nature and benefits of partnerships, as well as the
differences between partnering and comparison centers. This report is the final report from
first phase of the study that we undertook from 2001 to 2005. For this report we used chi-
square statistics, logistic regression analyses, regression analyses, t-tests, and Analysis of
Variance (ANOVAs) to analyze quantitative data collected from a stratified sample of
randomly selected licensed child care providers in Ohio. We analyzed differences between
the following two groups: 78 centers in partnership with Head Start and 63 comparison
centers not in partnership with Head Start. The data set consisted of responses to three rounds
of surveys administered to partnership center directors3 and comparison center directors,
teachers, and parents. These surveys asked questions about structural indicators of quality;
the services provided by centers; teacher professional development, education, and benefits;
as well as parents’ perceptions of quality. The process we used to develop the survey
instruments4 ensured careful and rigorous construction and measurement of key concepts.
3Researchers also surveyed the Head Start programs partnering with these centers.4Researchers derived items in the instruments from nationally recognized surveys such as the Cost, Quality, andChild Outcomes in Early Childhood Care and Education Study, the Investigating Partnerships in Early ChildhoodEducation (I-PIECE) Study, and the Head Start Family and Child Experiences Survey (FACES).

Child Care/Head Start Partnership Study: Final Report 3
Our research sought to build upon existing qualitative research that reveals variation in the
types of providers engaged in partnerships (Ontai, Hinrichs, Beard, & Wilcox, 2002; Paulsell,
Nogales, & Cohen, 2003; Sandfort & Selden, 2001; Schilder et al., 2003) and suggests that
certain factors are important to partnerships’ growth, development, and capacity to achieve
desired outcomes (Kiron, 2003). Three research questions framed our analysis and writing:
• What are the characteristics of child care centers in partnership with Head Start and what is
the variation in partnership duration, resources, communication, and management?
• Do differences exist between child care centers in partnership with Head Start and
comparison centers in terms of center characteristics; teacher characteristics, benefits, and
classroom practices; and services offered to children and their families? Are there
demographic differences in the parent populations at partnering and non-partnering centers?
• Do duration, resources, communication, and management of the partnership predict desired
outcomes?
Findings
• Variation: Our study confirms that variation exists in the types of child care centers engaged
in partnership. Child care centers that engage in Head Start partnerships range from non-
profit to for-profit, religious-affiliated to secular, large to small, urban to rural.
• Population Served: Our analyses reveal that partnering child care centers provide services not
only to children from low-income families, but also provide child care to a large percentage
of children from higher income families. As research has shown that school-aged low-
income students served in economically diverse settings perform better than those in
homogenous settings, this finding reveals an additional potential benefit of partnerships.

Child Care/Head Start Partnership Study: Final Report 4
• Resources: Our data indicate that partnership centers receive resources from Head Start.
These resources include funding, professional development, and additional materials and
supplies. On average, partnership centers receive $3,600 dollars per child per year. Centers
use this funding to purchase supplies such as art materials, to support teacher training, and to
enhance teacher compensation packages. In addition to this funding, partnership centers
receive professional development and training, paid staff, and additional materials and
supplies from Head Start. These resources can help partnership centers meet Head Start’s
rigorous program performance standards. While the resources are related to the number of
Head Start children attending the center, centers use the funds in a variety of ways that can
improve early education experiences for every child. For example, all children can benefit
from classrooms with enhanced equipment, such as science centers or bookshelves, and
supplies or additional art and curriculum materials. Furthermore, all children have the
potential to benefit from better-trained teachers.
• Staff: Our findings reveal that partnership is a strong and statistically significant predictor of
offering teachers more professional development and training opportunities and better
compensation packages. Our data also indicate that partnership is a statistically significant
predictor of teachers’ usage of structured curricula and standardized assessments.
• Services: Our analyses indicate that partnership is a statistically significant predictor of
centers’ provision of additional screenings, referrals, and services to children and families.
This finding is especially compelling given that the final evaluation of the federally funded
Comprehensive Child Development Program (CCDP)—a program funded in 1997 at a level
of $15,768 dollars per family per year—found few differences in the services accessed by
CCDP and non-participating control group families. That study found that control group

Child Care/Head Start Partnership Study: Final Report 5
families were able to access many of the services offered by CCDP. For example, equal
percentages of CCDP and control group families visited a doctor for checkups, received
acute medical care, and received dental services. In contrast, our findings indicate that
families served by partnership centers are more likely to have access to services than
comparison families. Furthermore, regardless of income, parents at partnering centers are
more likely to receive comprehensive services for their children, more parent involvement
opportunities, and services and referrals for their families. Thus, it is possible for centers in
partnership with Head Start to leverage the benefits of the partnership to enhance the quality
of care for all children and families at the center. The size of the differences between
partnering and comparison centers indicates that partnership with Head Start is an important
factor in a center’s likelihood of offering screenings, referrals, and services (U.S. Department
of Health and Human Services/Administration for Children and Families/Child Care Bureau,
n.d.).5
• Agreement, Goals, and Benefits: While our findings indicate that the existence of a
partnership predicts certain benefits to child care centers, it appears that the nature of
partnerships is important. Centers that develop strong agreements and have consistent goals
with their partners, and who report good communication, are the most likely to report
improved benefits. These findings have implications for Head Start and Child Care
Development Fund (CCDF) policies. Over the past decade, federal leaders have encouraged
partnerships between Head Start and child care centers. At the same time, states have devoted
CCDF quality dollars to a range of activities with the goal of improving quality. Our research
demonstrates that partnership with Head Start is related to specific quality improvements.
5This research and demonstration program—funded by the federal government—was designed to providecomprehensive services to low-income children and families. For additional information see:http://www.abtassociates.com/reports/ES-D19940018.pdf

Child Care/Head Start Partnership Study: Final Report 6
Thus, leaders might consider the implications of this finding for policies related to CCDF
quality funds. Policymakers could consider ways to strengthen partnership agreements and
communication among partners as they consider ways to encourage the development of these
factors in partnerships.
Conclusion
Study findings serve to bridge gaps in the literature and expand the current knowledge base on
child care/Head Start partnerships. While researchers did not include random assignment—and
the study cannot provide definitive answers about causation—the study’s findings provide a
closer look at the nature and impact of partnerships and clearly reveal a strong relationship
between partnership and desired outcomes.
As policymakers seek ways to leverage improvements in child care, we hope that these
findings will serve to inform their deliberations. Federal and state leaders issuing regulations and
guidance to programs in partnership might consider one of our study’s most important findings:
partnership with Head Start is related to additional resources to a child care center and an
increased likelihood that the center will offer the screenings, referrals, and services that
researchers suggest make a difference for low-income children and their families.
Our study also leads to specific questions for future research. While the findings appear
promising, questions exist about whether observations would confirm the quality differences
reported by the directors, teachers, and parents. Furthermore, questions remain about whether the
reported improvements in teacher practices, along with the additional services provided to
children and their families, lead to improvements in children’s school readiness. To address these
important questions, and to determine if differences exist in the school readiness of children
served by partnering and non-partnering centers, we will continue our longitudinal study. In the

Child Care/Head Start Partnership Study: Final Report 7
upcoming years, we will collect classroom and child-level data from the sample of partnership
centers and comparison centers using standardized observational tools.
Child Care/Head Start Partnership Study: Final Report 8
CHAPTER 1 CHILD CARE/HEAD START PARTNERSHIPS: ISSUES,THEORETICAL FRAMEWORK, AND RESEARCH DESIGN
INTRODUCTION
Since the 1990s, federal and state governments have increasingly supported partnerships between
subsidized child care providers and Head Start programs (Schilder, Kiron, & Elliott, 2003). The
goal of the partnerships has been to create high-quality, seamless services for low-income
children and their families. The impetus behind this move was twofold. First, the passage of
welfare reform legislation—with more stringent work requirements for parents—increased the
need for full-day, full-year subsidized child care for low-income working parents (Adams &
Rohacek, 2002; Long, Kirby, Kurka, & Waters, 1998). Second, new attention was brought to
research demonstrating the benefits of high-quality, comprehensive early education programs for
low-income children (Shonkoff & Phillips, 2000). However, most of these programs—including
Head Start—provided primarily part-day services and were, therefore, inaccessible to many low-
income working parents who needed full-time child care (Schilder et al., 2003). By supporting
partnerships between child care centers and Head Start programs, policymakers believed the
combined services could meet the needs of parents and their children (Schilder et al., 2003).6
In 2001, the U.S. Department of Health and Human Services (DHHS) Administration for
Children and Families (ACF) Child Care Bureau awarded a three-year research grant to
Education Development Center, Inc. (EDC) to study partnerships between child care providers
and Head Start programs. Upon receipt of this grant, we launched the Partnership Impact study,
an intensive, longitudinal survey research study of child care centers that examined the nature of
partnerships and the differences between partnering and comparison centers. 6See Early Care and Education Partnerships: State Actions and Local Lessons by Schilder, Kiron, and Elliott for adetailed description of the impetus behind partnerships and federal, state, and local actions to support partnerships.

Child Care/Head Start Partnership Study: Final Report 9
We asked randomly selected child care centers to participate in the study, and center
directors completed questionnaires in 2002, 2003, and 2004. Teachers at these centers and
parents of children served by these centers also completed surveys. The surveys collected data on
structural indicators of quality; the services provided by centers; teacher professional
development, education, and benefits; and parents’ perceptions of quality. We present our
findings in this report.
In the remainder of this chapter, we describe the theoretical framework underlying the
study and present our research methodology. Chapter 2 presents our analyses of data on the
nature of child care/Head Start partnerships. Chapter 3 outlines our findings related to teacher
benefits and practices. Chapter 4 reviews our analyses of differences in the comprehensive
services offered by partnering and comparison centers and presents parents’ perspectives on the
services they received. In Chapter 5, we conclude the report with a summary of findings and a
discussion of implications for future research.
THEORETICAL FRAMEWORK
In theory, child care/Head Start partnerships will result in full-day, full-year, high-quality care
that meets the needs of children and families. Two key assumptions underlie this premise. First,
it is assumed that Head Start programs will provide their partners with additional
resources—such as funding, professional development, and opportunities for staff—that
contribute to higher quality care, more comprehensive services, and other benefits for children
and families. One reason for this assumption is that the cost of Head Start is greater than the cost
of child care. According to the U.S. Government Accountability Office, Head Start served
912,000 children in FY 2003 at a cost of approximately 6.5 billion dollars. Note that the Child
Care Development Fund (CCDF), the largest federal source of subsidized child care

Child Care/Head Start Partnership Study: Final Report 10
dollars—served an estimated 1,260,000 children under age five. While the annual federal cost is
4.8 billion, CCDF also requires states to allocate matching and Maintenance of Effort (MOE)
funds for child care which increases the amount of subsidized child care funding beyond the
level of Head Start funding (U.S. Department of Health and Human Services/Administration for
Children and Families/National Child Care Information Center, n.d.).
Second, it is hypothesized that by partnering with Head Start, child care centers will offer
more comprehensive services because the Head Start program is required to provide more
comprehensive services than some subsidized child care (Schilder et al., 2003). Moreover, child
care centers in partnership with Head Start might offer features of higher quality care. Head Start
programs are required to follow the Head Start Program Performance Standards. These standards
require Head Start programs and their partners to abide by specific child-teacher ratios, teacher
educational requirements, teacher professional development and training standards, and
supervision practices. These standards also require Head Start to involve families in their
children’s education and to offer specific screenings, referrals, and services. Furthermore, Head
Start programs are subjected to regular monitoring by the federal government (Schumacher,
Irish, & Lombardi, 2003). In contrast, states regulate subsidized child care and there is a range of
regulations governing child-teacher ratios, teacher educational requirements, teacher professional
development and training standards, and supervision and monitoring practices (Stoney &
Stanton, 2001).
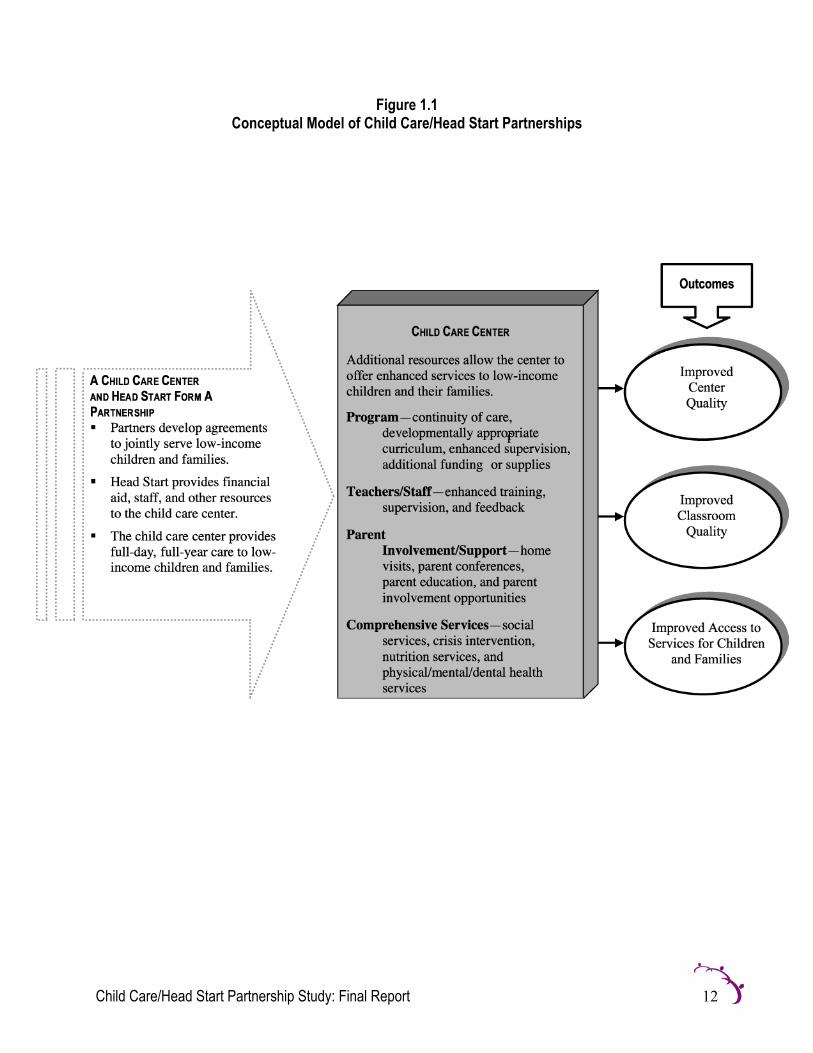
Figure 1.1 below provides a logic model illustrating the theory. In this model, child care
centers in partnership receive from Head Start financial supports and resources that enable them
to offer continuity of care, improved curriculum, parent involvement opportunities and support,
and comprehensive services to children and parents. In addition, teachers and staff at partnering

Child Care/Head Start Partnership Study: Final Report 11
centers receive increased training and professional development opportunities and enhanced
supervision. Thus, the partnership yields benefits to centers, classrooms, and families.
While this theory is compelling to many, limited research has been conducted that tests
whether partnerships result in anticipated benefits. In the pages that follow Figure 1.1, we
describe the research design that we developed to explore whether partnerships yield the
intended benefits and to examine the nature of child care/Head Start partnerships.
Child Care/Head Start Partnership Study: Final Report 12
Figure 1.1Conceptual Model of Child Care/Head Start Partnerships
Child Care/Head Start Partnership Study: Final Report 13
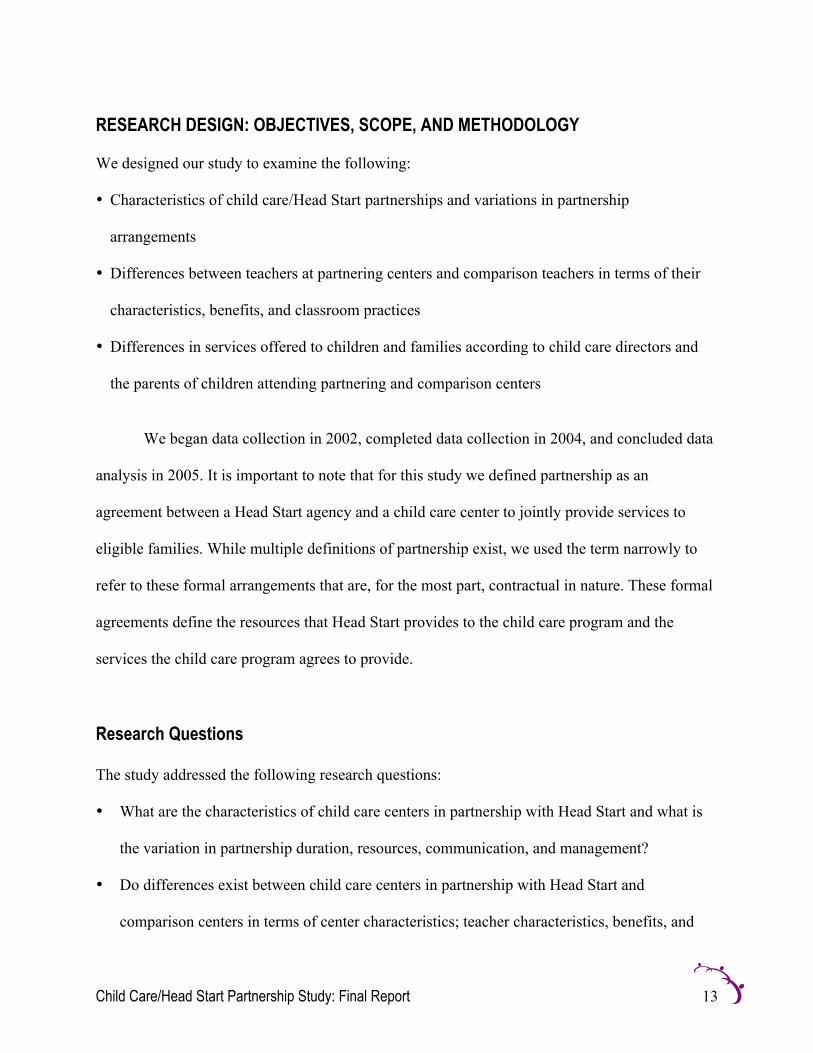
RESEARCH DESIGN: OBJECTIVES, SCOPE, AND METHODOLOGY
We designed our study to examine the following:
• Characteristics of child care/Head Start partnerships and variations in partnership
arrangements
• Differences between teachers at partnering centers and comparison teachers in terms of their
characteristics, benefits, and classroom practices
• Differences in services offered to children and families according to child care directors and
the parents of children attending partnering and comparison centers
We began data collection in 2002, completed data collection in 2004, and concluded data
analysis in 2005. It is important to note that for this study we defined partnership as an
agreement between a Head Start agency and a child care center to jointly provide services to
eligible families. While multiple definitions of partnership exist, we used the term narrowly to
refer to these formal arrangements that are, for the most part, contractual in nature. These formal
agreements define the resources that Head Start provides to the child care program and the
services the child care program agrees to provide.
Research Questions
The study addressed the following research questions:
• What are the characteristics of child care centers in partnership with Head Start and what is
the variation in partnership duration, resources, communication, and management?
• Do differences exist between child care centers in partnership with Head Start and
comparison centers in terms of center characteristics; teacher characteristics, benefits, and

Child Care/Head Start Partnership Study: Final Report 14
classroom practices; and services offered to children and their families? Are there
demographic differences in the parent populations at partnering and non-partnering centers?
• Do duration, resources, communication, and management of the partnership predict desired
outcomes?
Sampling Strategy and Data Sources
We selected the child care centers in the study based on a stratified random sample of all
licensed child care providers in Ohio. We began by stratifying centers on the comprehensive list
available from the Ohio Department of Job and Family Services child care licensing database.
First, we separated the centers into one of two groups: those in partnership and those in
comparison centers. Next, we stratified centers in each group by urbanicity to ensure that a
representative portion of child care centers were selected from urban, suburban, and rural areas.
Finally, we contacted the U.S. Bureau of the Census to review existing definitions of urbanicity,
and we also contacted the U.S. Department of Health and Human Services to ensure that the
urbanicity categories reflected the challenges that child care centers face depending upon their
geographic location.
After stratifying the list, we randomly selected centers to participate in the study. We
contacted the directors at the randomly selected centers by telephone, asked initial screening
questions, and recruited eligible centers for the study. Based on the screening calls, we sent
recruitment packages to a total of 221 eligible child care centers (i.e., those providing full-day,
full-year care and accepting child care subsidies). The packages included questionnaires and
explanatory information. Following the mailing, we called center directors to answer any
questions about the materials. To increase the response rate, we sent packages to non-
respondents and telephoned each non-respondent to encourage participation. We also sent non-

Child Care/Head Start Partnership Study: Final Report 15
respondents a third package of materials, and they received a letter from the state care
administrator encouraging their participation in the study. A total of 141 child care centers were
both eligible and agreed to participate. At the point of initial data collection the sample included
78 centers that were in partnership with Head Start, and 63 comparison centers not in
partnership, with a response rate for the baseline survey of 65 percent.
We asked each center director to complete surveys in 2002, 2003, and 2004, and we
requested that they distribute surveys to teachers and parents at their centers. In addition, we
surveyed the Head Start programs partnering with these centers. Table 1.1 illustrates the number
of surveys completed from each source in each round of data collection.
Table 1.1 Data Sources
Year 1 Year 2 Year 3Data Source Part. Comp. Total Part. Comp. Total Part. Comp. TotalChild Care CenterDirectors
78 63 141 47 66 113 40 54 94
Teachers 102 53 155 71 78 149 49 55 104Parents 415 323 738 318 381 699 133 121 254Total 595 439 1034 436 525 961 222 230 452
The attrition rate for partnership centers between Year 1 and Year 2 is partly due to
centers’ discontinuation of partnerships and partly due to centers’ refusal to participate further in
the study. Of the 78 centers in partnership in Year 1, 17 partnership centers—or 21 percent of
partnership centers—discontinued their partnerships and became comparison centers in Year 2.
Moreover, 16 centers—or 21 percent of 78 partnership centers that participated in the survey in
Year 1—refused to participate in the survey in Year 2. For comparison centers, 12 comparison
centers—about 19 percent of the 63 comparison centers that participated in the survey in Year
1—refused to participate in the survey in Year 2. However, centers that discontinued their
partnerships after Year 1 joined the comparison sample for Year 2. Thus, the total number of
Child Care/Head Start Partnership Study: Final Report 16
comparison centers appeared to increase to 66. Note that only two comparison centers in Year 1
initiated new partnerships prior to the second round of data collection.
Instruments
We used an exhaustive and systematic process to develop a battery of five surveys. The steps in
the process—conducting a review of the literature, interviewing researchers across the country,
and convening review groups of national experts and state stakeholders—ensured careful and
rigorous construction and measurement of key concepts. We pilot-tested each survey to ensure
item-construct validity.
Items in the instruments are from nationally-recognized surveys such as the Cost,
Quality, and Child Outcomes in Early Childhood Care and Education Study, the Investigating
Partnerships in Early Childhood Education (I-PIECE) Study, and the Head Start Family and
Child Experiences Survey (FACES). Table 1.2 presents details about the survey instruments that
we used (Cost Quality and Child Outcomes Study Team, 1995; Sandfort & Selden, 2001; U.S.
Department of Health and Human Services/Administration for Children and Families/Project
Team FACES, 2003).

Child Care/Head Start Partnership Study: Final Report 17
Table 1.2 Survey Instruments, Respondents, and Constructs
Instrument Respondent ConstructsPartnership Survey Child care center director
(only those in partnership) Partnership duration Resources devoted to the
partnership Communication among partners Management of the partnership
Director Survey Child care center director(partnership and comparisoncenters)
Child care center practice Characteristics of the child care
center Structural elements of quality
Teacher Survey Teachers (partnershipclassroom teachers andcomparison teachers)
Teacher compensation andbenefits
Teacher education andprofessional development
Teacher practicesParent Survey Parents (with children in
partnership classrooms andwith children not inpartnership classrooms)
Satisfaction with quality of careand services
Satisfaction with access toservices
Employment stabilityHead Start Partner Survey Head Start programs in
partnership with child carecenters
Resources devoted to thepartnership
Nature of the partnership
Surveys were similar for each round, but some minor differences existed. In some
instances, we added questions to address new areas of interest based on feedback from the
project’s advisory committee. For example, we added more detailed questions about the nature
and use of screenings; we asked child care directors not only if screenings occurred, but also who
conducted the screenings, where they occurred, and how the data were used. Moreover, the first
round parent survey asked parents to list “other” services they received, and subsequent surveys
listed the most frequently noted items, such as transportation, in the service section.

Child Care/Head Start Partnership Study: Final Report 18
To capture information about the partnership from both Head Start and child care
sources, we administered two different surveys. The Partnership Survey asked questions of child
care directors about the partnership duration, resources received, communication, and
management of the partnership. The Head Start Partner Survey measured Head Start directors’ or
partnership coordinators’ perspectives on the nature of partnership.
Analyses
We analyzed the survey data to address the key research questions. Analyses included chi-square
statistics, logistic regression analyses, regression analyses, t-tests, and Analysis of Variance
(ANOVAs). We analyzed differences between the following two groups: centers in partnership
with Head Start and comparison centers not in partnership with Head Start.
We developed analytic models that included predictors, and in some cases outcome
variables, that were composites of a number of items (see Appendices) that measured classroom
quality, teacher beliefs about learning and teaching, parental involvement and support,
organizational capacity, well-defined agreement and goals, communication and relationship, and
benefits for the center, staff, and families and also consisted of child-teacher ratio and turnover.
Our control variables consisted of duration of the partnership, total Head Start funding received,
per child funding received from Head Start, equipment and supplies received from Head Start,
child-teacher ratio, and non-profit and faith-based organizational status. We tested interactions
between duration of partnership and all predictors, and Head Start funding and all predictors,
throughout our analysis process. Before we performed any inferential statistical analysis, we
used descriptive statistics and frequencies to examine differences between partnership centers
and comparison centers on individual survey items. We also examined the distributions of all

Child Care/Head Start Partnership Study: Final Report 19
survey composite items that would be used in any further analysis to ensure no transformations
were needed for abnormally distributed variables. All centers that had individual data were
included in these analyses. We used three different sets of analyses to address our research
questions.
First, we used regression analysis to examine the teacher and director/partnership survey
composites discussed previously. We fit models allowing us to compare partnership centers to
comparison group centers by using group code as a dummy variable (Partnership=1,
Comparison=0) to examine differences between groups on the following center and classroom
level variables:
Classroom Level (teacher and parent survey): Classroom quality/learning environment Teacher beliefs about learning and teaching Teacher beliefs about literacy development Teacher beliefs about child initiated activities and explicit rewards Workshops attended Job satisfaction Parental involvement and support
Center Level (director survey and parent survey): Child and parent services Organizational capacity Teacher turnover Quality of supervision Child-teacher ratio
Second, we conducted growth modeling of the composites mentioned previously to
examine differences in teacher growth as a result of participation in a partnership. Growth
modeling analysis was conducted using two different approaches. We used duration of
partnership (continuous variable beginning with 0 for center that had no partnership) to predict
differences in growth at three time points. However, we acknowledge the possibility that the
model may overestimate the effect of duration on growth because centers that did not benefit

Child Care/Head Start Partnership Study: Final Report 20
from partnerships might discontinue their arrangements with Head Start. Therefore, there exists a
potential selection bias in this estimation. After examination of these initial growth models, we
decided to conduct another set of analyses that would provide insight into differences that might
exist for centers that remained consistent over the course of the study. To do this, we used a
dummy variable (Partnership=1; Comparison=0) to examine differences in growth based only on
differences between groups at three time points while controlling for duration of partnership and
two dummy coded (0,1) indicators measuring non-profit and faith-based centers. Centers with
missing data and those who changed partnership status could not be included in our growth
modeling analysis.
Third and lastly, we used multiple regression analysis to examine the relationship
between various center/partnership characteristics and our predictors of classroom quality,
teacher beliefs and practices, parental support and involvement, teacher turnover, organizational
capacity, and quality of supervision. In our models we controlled for duration of the partnership,
funding and supplies received from Head Start, and the interaction between these variables and
each predictor.
Strengths and Limitations of the Study Design
Our findings serve to bridge gaps in the literature and expand the current knowledge base on
child care/Head Start partnerships. By carrying out rigorous, quantitative research, we have
gathered a new data set that provides a closer look at the nature and impact of partnerships.
While the study included a randomly selected sample of partnering centers and
comparison centers throughout Ohio, some limitations exist with its design. For example, the
study is based on randomly selected programs that were in partnership with Head Start. We did

Child Care/Head Start Partnership Study: Final Report 21
not “assign” partnership to these programs, and it is possible that reported differences could be a
result of self-selection bias. To address this issue, we examined differences between comparison
and partnership centers in terms of their organizational capacity and found no statistically
significant differences (see Chapter 2). Furthermore, we completed non-response analyses to
determine if differences existed in the centers that elected to participate compared with non-
participating centers. Analyses revealed no differences in center budgets, total enrollments,
demographics of the population, and urbanicity.
While these measures strengthened the research design, we did not include random
assignment and therefore the study cannot provide definitive answers about causation. The
study’s findings do, nevertheless, clearly reveal a strong relationship between partnership and
desired outcomes. Data about this relationship, as well as our findings concerning the nature of
partnerships, can be useful to policymakers and researchers alike.

Child Care/Head Start Partnership Study: Final Report 22
CHAPTER 2 THE NATURE OF CHILD CARE/HEAD STARTPARTNERSHIPS
OVERVIEW OF RELEVANT RESEARCH
Existing research on early care and education partnerships reveals variation in the types of
providers engaged in partnerships and suggests that certain factors are important for partnerships
to successfully develop and grow (Kiron, 2003). Specifically, qualitative studies show that child
care providers engaged in partnership vary in terms of their size and type, the numbers of
children served through the partnership, and the ways in which services are delivered (Ontai,
Hinrichs, Beard, & Wilcox, 2002; Paulsell, Nogales, & Cohen, 2003; Sandfort & Selden, 2001;
Schilder et al., 2003). Furthermore, these qualitative studies suggest that the following factors are
important for partnership success:
• Strong planning to ensure partners develop well-defined partnership agreements/goals
• Communication among partners that enables individuals to resolve issues as they arise
• Resources including direct funding, professional development, and other resources such as
materials, supplies, and staff
• Duration of the partnership, as many partners report that the first year is spent planning and the
delivery of jointly planned services takes time (Kiron, 2003; Schilder, et al., 2003)
Qualitative research on these features has shown that because child care providers are
governed by different laws and regulations than Head Start, agreement among the partners is
important for the partnership to succeed. Since child care centers that partner with Head Start are
required to follow Head Start regulations, strong agreements and goals, regular communication
to resolve issues as they arise, and funding that can be used to meet Head Start’s regulations can
help partnerships succeed (Schilder, et al., 2003).
Child Care/Head Start Partnership Study: Final Report 23
While child care administrators, policymakers, and training professionals have used these
qualitative findings to inform partnership policies and practices, questions remain about the
generalizability of the findings regarding the characteristics of partnering child care centers.
Furthermore, it is unclear whether the factors that qualitative research has identified as important
to partnerships are associated with desired outcomes for typical child care centers in partnership
with Head Start.
METHODS IN BRIEF
We used a Director Survey (see Chapter 1) and a Partnership Survey to collect data from
participating child care centers. We sent surveys to each center director in 2002, 2003, and 2004.
The Partnership Survey was sent only to centers that had partnerships with Head Start.
The Partnership Survey included questions about the characteristics of the partnership;
the factors of partnership that qualitative research revealed were associated with partnership
success; the duration of the partnership; the process of developing the partnership; and the
features of partnership planning and management that appeared most important to the success of
partnerships. We also asked child care directors to provide us with data about their perceptions of
the benefits of partnership.
We asked a series of questions to obtain data about features of partnership that the
qualitative literature had shown to be related to improved outcomes. Specifically, the survey
included questions to address the following:
Characteristics of the partnership Factors of partnership qualitative research revealed were associated with success Duration of the partnership Partnership development process Features of partnership planning and management that appeared most important to
success

Child Care/Head Start Partnership Study: Final Report 24
Additionally, we asked child care directors to provide us with data about their perceptions
of the benefits of partnership. Questions were directly related to benefits for the centers overall,
benefits for staff, as well as benefits for families. Table 2.1 provides a detailed list of the
underlying constructs of the partnership survey, a summary of the questions we asked, and
descriptions of the properties of the construct scores we used to analyze the data. These
constructs were designed to provide an overall assessment of outcomes related to partnership and
included the following:
Well-defined partnership agreement and goals Good communication and relationship Benefits and improvement for center and staff overall Benefits and improvements for families
To examine the properties of our constructs and the items that make them up, we
conducted reliability analysis. Table 2.1 also shows the results of these analyses. Cronbach’s
alphas were obtained and are based on the average inter-item correlations. An alpha that
approximated .70 or greater was considered highly acceptable. As Table 2.1 shows, all constructs
measured by our partnership survey showed a very high internal consistency, with alphas ranging
from .70 to .90.

Child Care/Head Start Partnership Study: Final Report 25
Table 2.1 Partnership Constructs, Questions, and Description of Scale Scores
Construct Survey Questions Description of Scale ScoresWell-Defined PartnershipAgreement and Goals
Do you have the following: A written contract with Head Start A regularly updated contract Written roles and responsibilities Written partnership goals Written plans for the partnership Written procedures for communication A shared partnership philosophy with the Head Start
program Agreement with Head Start about curriculum A process to orient staff to the Head Start program A process to orient staff to Head Start regulations Procedures for resolving conflicts Clearly defined roles and responsibilities for staff
involved in the partnership Ways to prepare staff for new responsibilities A process to involve all staff in all phases of
partnership Procedures to keep children enrolled if parents lose
subsidy eligibility Procedures to keep children enrolled if parents lose
Head Start eligibility Procedures to manage finances as part of partnership Similar goals regarding working together
Scale range is 0 to 58. Dichotomousquestions were coded 0 for “no” and 1for “yes.” Likert scale questions werecoded 0 to 4. The responses weresummed to create the total composite.(Reliability results: Alpha=. 90; 19Items; n = 109)
Good Communicationand Relationship
To what degree do you believe… You have good communication within your organization You have good communication across organizations You and your partner have mutual respect You are a full partner Your voice is heard You can call Head Start when you need to Head Start views your center as a full partner
Scale range is 0 to 28. The 7 Likertscale questions were coded 0 to 4 andthe responses were summed to createthe total composite. In addition, anaverage was created using a range of 0to 4. (Reliability results: Alpha=. 90; 7Items; n = 163)
Benefits andImprovements for Center
To what degree do you believe the partnership hasresulted in… Benefits to staff not directly involved in partnership Improved capacity to provide family involvement
opportunities Improved capacity to provide family services Improved compensation for staff Improved professional development opportunities
Scale range is 0 to 20. The 5 Likertscale questions were coded 0 to 4 andresponses were summed to create thetotal composite. In addition, an averagewas created with a range of 0 to 4.(Reliability results: Alpha=. 81; 5 Items;n = 162)
Benefits for Staff To what degree do you believe the partnership hasresulted in… Benefits to staff Improved compensation for staff Improved professional development opportunities
Scale ranges from 0 to 12. The 4 Likertscale questions were coded 0 to 4 andresponses were summed to create thetotal composite. In addition, an averagewas created with a range of 0 to 4.(Reliability results: Alpha=. 70; 3 Items;n = 162)

Child Care/Head Start Partnership Study: Final Report 26
Construct Survey Questions Description of Scale ScoresBenefits andImprovements forFamilies
To what extent do you believe the partnership hasresulted in improvements in… Family involvement opportunities Improved services to families Benefits for families not directly involved in Head Start
Scale ranges from 0 to 12. The 4 Likertscale questions were coded 0 to 4 andresponses were summed to create thetotal composite. In addition, an averagewas created with a range of 0 to 4.(Reliability results: Alpha=.79; 3 Items;n = 90)
We analyzed data to determine frequencies, differences among groups, and relationships
among variables and desired outcomes (see Chapter 1 for additional details about the analyses).
Below, we present our findings concerning:
• Characteristics of the child care centers in the sample
• Partnering child care centers in the sample
• Resources from Head Start
• Well-defined agreement and goals, communication, and benefits of partnership
• Predictors of partnership benefits
• Challenges of partnership
Characteristics of the Child Care Centers in the Sample
• Partnership Status. Approximately 47 percent of centers were in partnership with the federal
and/or state Head Start program during data collection. Fifty-three percent of the sample was
comprised of comparison centers that either did not engage in partnership or discontinued
their partnership with Head Start during the study.
• Non-Profit Status and Religious Affiliation. About 40 percent of all centers were non-profit,
and 18 percent considered themselves to be faith-based. The proportion of partnership and
comparison centers in the sample were similar for both types.

Child Care/Head Start Partnership Study: Final Report 27
• Urbanicity. Forty percent of the centers were urban, 43 percent were suburban, and the
remaining centers were in small towns or rural areas. No statistically significant differences
existed in the urbanicity of partnering centers and comparison centers.
• Size. The average total number of preschool-aged children enrolled in the centers was 39.
The comparison and partnering centers appear to serve similar numbers of preschool-aged
children. Along with preschool enrollments, the average annual child care center budgets
were also similar. The mean annual budget was about $380,000 (SD 550,000) dollars. No
significant differences were reported between partnership and comparison centers.
• Populations. A summary of the percentage of the population receiving subsidies, population
demographics, and full-time status of the children who attended child care centers follows.
− Percent of population receiving subsidies: The average percentage of the population
receiving child care subsidies was 51 percent. Partnering centers served a somewhat
higher percentage of subsidy children as they reported an average of 54 percent compared
with 47 percent for comparison centers (p < .05).
− Demographics: On average, 59 percent of the students attending the child care centers
were white, 33 percent were African American, and 7 percent were Hispanic, Asian, or
Other. We found differences in the demographics of centers in partnership and
comparison centers. Comparison centers reported that 65 percent of the children were
white compared with 53 percent of children attending partnership programs (p < .01).
Centers reported that an average of 4 percent of children attending centers were from
families where English was not the native language. While comparison centers appear to
serve a slightly higher percentage of this population (5 percent versus 3 percent for
partnership centers), the difference is not statistically significant. Both partnership and

Child Care/Head Start Partnership Study: Final Report 28
comparison centers indicated serving similar numbers of children with disabilities, with
an average of 4 percent per center.
− Full-time status: On average, 64 percent of the students attending child care centers
attended 40 hours per week or more. Partnering centers reported that on average about
69 percent of students were enrolled full-time, whereas comparison centers reported that
about 61 percent of students were enrolled full-time.
• Selected Indicators of Quality. A summary of selected indicators of quality—accreditation
status and child-teacher ratios—follows.
− Accreditation: The National Association for the Education of Young Children (NAEYC)
had accredited 15 percent of all of the centers. While 19 percent of the partnership centers
were accredited, compared with 12 percent of the comparison centers, this difference is
not significant.
− Ratios: The average number of children to teachers was 9.9 for all centers. While the
difference between centers in partnership and comparison centers appears to be small (9.6
versus 10.2), this difference is statistically significant (p < .05). The average ratios were
well below the maximum according to the Ohio child care licensing standards both for
partnership centers and comparison centers. For 3-year-olds, the ratio required by Ohio
State licensing standards is 12 children to one adult and 14 children to one adult for
4-year-olds and 5-year-olds. Note that the ratio required by Head Starts program
standards is no more than 17 children to 2 adults for 3-year-olds and no more than 20
children to 2 adults for 4-year-olds and 5-year-olds.
• Indicators of Center Capacity. While 96 percent of centers reported having a staff handbook,
only 55 percent reported using salary scales. Furthermore, only a few centers (7 percent) had

Child Care/Head Start Partnership Study: Final Report 29
a collective bargaining agreement. There were no significant differences between
partnership and comparison centers for any of the capacity items (see Table 2.2 below for a
complete list).
Table 2.2 Characteristics of Child Care Centers in the Sample
Characteristic
PartnershipPercent federal and/or state HS centers 47 %Percent comparison centers 53 %
UrbanicityPercent urban 40 %Percent suburban 43 %Percent small town/rural 16 %
SizeAverage total number of preschoolers enrolled 39Average center annual budget 380 K
Population Percent of children receiving subsidy 51 %Percent full-time 64 %
Race/EthnicityBlack/African American 33 %Hispanic 3 %Asian 1 %White 59 %Other 2 %
Quality IndicatorsPercent of centers accredited 15 %Average child-teacher ratio 9.9
Center Capacity IndicatorsOrganizational chart/staffing plan 71 %Annual budget 68 %Staff handbook 96 %Salary scales 55 %Collective bargaining agreement 7 %Strategic plan 39 %Enrollment and policy information for parents 99 %Job descriptions 91 %Health insurance as a benefit to staff 61 %

Child Care/Head Start Partnership Study: Final Report 30
Partnering Child Care Centers in the Sample
• Number of Children Varies Substantially. The number of preschoolers who received Head
Start services at partnership centers varied substantially. The average number receiving
services was 13 (M = 13.44, SD = 8.39). The number of Head Start children at child care
centers ranged from 1 child to 38 children. We found no statistically significant differences
in the number of children receiving Head Start services over the three rounds of data
collection.
• Fluctuation in Numbers Receiving Services. The vast majority—about 79 percent—of center
directors in the study reported that they experienced fluctuation in the number of children
receiving Head Start services during the previous year. Directors mentioned year-end
changes, seasonal changes, and changes in subsidy as the reasons for the fluctuation. For
example, 60 percent of directors reported that fluctuations occurred due to seasonal changes
and 64 percent of directors stated that fluctuations resulted from changes in subsidy
eligibility. The changes in subsidy eligibility can occur because determination of child care
subsidy eligibility is made regularly throughout the year based on the family’s income and/or
employment status. While children who are deemed eligible for federal Head Start remain
eligible until the age of school entry, children can lose the full-day child care services if their
parents lose eligibility for subsidies. The fluctuation that was reported by centers in our study
appeared to be quite substantial in partnership centers. The percentage of children who
received Head Start services at one point during the year but who left during the year
constituted, on average, 35 percent of the total number of children who received Head Start
services in each partnership center.

Child Care/Head Start Partnership Study: Final Report 31
• Delivery of Services. The child care centers in the study reported providing Head Start
services to children through a variety of arrangements. While nearly all of the centers
reported serving Head Start children in classrooms that also served non-Head Start children,
just over 10 percent reported serving children in a separate Head Start-enhanced classroom.
• Duration and Development of the Partnerships in the Study. Child care centers in the study
reported a mean partnership duration with Head Start of 3.12 years, with the duration of
partnerships ranging from .06 to 9.09 years. About 8 percent of center directors reported that
the partnership was in the early stages of formation and about 31 percent reported that the
partnership was fully established. Not surprisingly, analyses reveal a statistically significant
relationship between directors’ perceptions of the development of the partnership and the
partnership duration (r2 = .1091), p < .0001.
• Partnership Planning. Center directors reported spending an average of nearly six months
(M = 5.95) planning with Head Start before formally establishing the partnership. However,
the amount of time spent planning varied substantially—18 percent of child care centers
reported that they began providing services the day they first talked with Head Start, but 79
percent reported providing services within a year of talking with Head Start. On average,
child care center directors reported meeting with Head Start 2.63 times before establishing
the partnership.
Resources from Head Start
• Funding. Over 90 percent of partnering child care centers reported receiving funds directly
from Head Start. Analyses of Director Survey data revealed that the mean reported annual
funding Head Start was $25,342 dollars, but the standard deviation was $19,676 dollars per

Child Care/Head Start Partnership Study: Final Report 32
center, indicating a great deal of variability in per center funding. The per child annual
funding ranged from $6 dollars to $3,600 dollars.
Most center directors (69 percent) reported using funds for equipment, such as science
centers or bookshelves, and supplies (73 percent), such as art supplies and curriculum
materials. More than half of the centers reported using funds for training (66 percent) or to
enhance teachers’ salaries (60 percent), and about a quarter of directors reported using funds
to enhance teacher benefits (23 percent).7
• Staff. In some cases, Head Start employs and supervises teachers who work directly in
partnering child care centers. About 39 percent of partnering center directors reported that
Head Start hires teachers or family service workers to work in their centers.
• Professional Development and Training. A majority (76 percent) of partnering center directors
reported that their staff had participated in professional development and training that was
supported by Head Start. The types of professional development and training varied. For
example, 60 percent reported receiving training that is offered to Head Start staff, 60 percent
reported receiving parent involvement training, 53 percent reported receiving literacy
training, 51 percent reported receiving cardiopulmonary resuscitation (CPR training), 56
percent received training on how to meet the Head Start Program Performance Standards,
and 38 percent reported participating in Child Development Associate (CDA) credential
training or college courses.
While a majority indicated that the partnership resulted in additional professional
development and training opportunities, one challenge for child care directors was the
convenience of the training. Over half of the directors reported that the opportunities were
7Sum of percentages is greater than 100 percent, as survey respondents were asked to check all that applied.

Child Care/Head Start Partnership Study: Final Report 33
offered at a time that were convenient to attend, yet nearly a third indicated that the training
was not offered at a convenient time or location.
• Equipment, Supplies, and Materials. Analyses revealed that, in addition to receiving funding,
substantial percentages of child care centers in partnership also received equipment, supplies,
and materials directly from Head Start. Child care center directors reported receiving
equipment (50 percent) and supplies (65 percent) directly from Head Start.
Well-Defined Agreement and Goals, Communication, and Benefits of Partnership
• Well-Defined Agreement and Goals. Nearly all of the child care centers in partnership in Ohio
(95 percent) reported having a written partnership agreement/contract with Head Start, with
the remaining centers reporting that they were in the process of establishing a formal
agreement. Furthermore, nearly all of the centers reported regularly updating the
contract—96 percent of centers with contracts reported updating it regularly, and 1.36
percent reported updating the contract on an “as needed” basis.
Most child care directors (70 percent) reported that they worked with their Head Start
partner to mutually develop the partnership agreement. However, a substantial percentage
(30 percent) of directors reported that their Head Start partner developed the agreement
without input from the child care center.
Many center directors reported that the agreements contained specific details that
previous qualitative research has shown are important for partnerships to achieve desired
results. However, variability existed. For example, when we asked directors about the details
of the contracts, data revealed that:
− Ninety-three percent specified roles and responsibilities of each partner.

Child Care/Head Start Partnership Study: Final Report 34
− Eighty-four percent specified partnership goals.
− Seventy-seven percent specified how to recruit and enroll Head Start children.
− Seventy-seven percent specified procedures for communicating with their Head Start
partners.
− Seventy-six percent specified the maximum number of partnership children to be served.
− Seventy-six percent specified how to meet Head Start Program Performance Standards
through partnership.
We also asked child care directors a series of questions about the degree to which they
believed they shared goals with their Head Start partners. We asked child care directors if
they had the following: a written contract with Head Start, a regularly updated contract,
written roles and responsibilities, written partnership goals, written plans for the partnership,
written procedures for communication, a shared partnership philosophy with the Head Start
program, agreement with Head Start about curriculum, a process to orient staff to the Head
Start program, a process to orient staff to Head Start regulations, procedures for resolving
conflicts, clearly defined roles and responsibilities for staff involved in the partnership, ways
to prepare staff for new responsibilities, a process to involve all staff in all phases of
partnership, procedures to keep children enrolled if parents lose subsidy eligibility,
procedures to keep children enrolled if parents lose Head Start eligibility, procedures to
manage finances as part of partnership, and similar goals regarding working together.
Based on this series of questions, we developed a composite of items called “Well-
defined agreements and goals” with the lowest possible score of 0 and the highest possible
score of 58. The average score was 37 (M = 37.18, SD = 12.45). This indicates that the
average center director reported neither perfect agreement nor absolute disagreement on the

Child Care/Head Start Partnership Study: Final Report 35
series of questions about agreement and goals. However, some centers expressed very strong
agreement—reporting 58. The lowest rating was six, indicating that while in some cases
agreement was weak, no centers believed there was absolute disagreement. Nonetheless, the
reports reveal a range of experiences in terms of the agreement among partners.
• Good Communication and Relationship. To determine the level of communication among
partners, we asked child care center directors to rate the degree to which they believed they
had good communication within and across organizations and mutual respect. We also asked
the degree to which the director felt she was a full partner, that her voice was heard, that she
could call Head Start, and that Head Start viewed the center as a full partner. The lowest
possible total score was 0 and the highest possible total score was 28. The average score was
20 (M = 20.229, SD = 6.28).
• Benefits and Improvements for Center Overall. To assess the perceived benefits of the
partnership to the center overall, we asked directors to rate the degree to which they believed
the partnership led to: benefits to staff not directly involved in partnership, improved capacity
to provide family involvement opportunities, improved capacity to provide family services,
improved compensation for staff, and improved professional development opportunities for
staff. The possible values ranged from 0 to 20. The average reported score was 11 (M =
10.55, SD = 4.87). It is interesting to note that some centers reported 0 benefits whereas
others reported 20.
• Benefits and Improvements for Staff. To explore benefits to staff, we also developed a
composite with items only related to staff. For this composite we used the items related to
benefits to staff, improved compensation for staff, and improved professional development

Child Care/Head Start Partnership Study: Final Report 36
opportunities. The range for this scale was 0 to 12. The average score was six (M = 5.67,
SD = 3.26). While some centers reported a score of 12, others reported 0 benefits for staff.

Child Care/Head Start Partnership Study: Final Report 37
Well-defined agreement and goals predicting benefits for centers based on low and high levels of communication and relationship (n=106)
(Formula: Benefits=.547+.159(Agreement) + .191(Communication)
2.074
10.34
6.85
15.12
0
2
4
6
8
10
12
14
16
18
20
Low Agreement and Goals High Agreement and Goals
LowCommunication
HighCommunication
• Benefits and Improvements for Families. To examine benefits to families, we also developed a
separate composite of the items related to improvement to families. This composite consisted
of questions about improved family involvement opportunities, improved services to
families, and benefits for families not directly involved in Head Start. On this 3-item scale
with a possible range of 0 to 12, the average score was 7 (M = 6.89, SD = 2.99). The
perceived benefits for families also spanned the possible range—from 0 to 12.
Predictors of Partnership Benefits
Regression analysis showed that agreements about goals and strong communication are
predictive of the benefits of partnership. Figure 2.1 below illustrates that the higher the level of
communication, the higher the reported benefits for the center. Furthermore, this figure shows
the relationship between the score on “Well-defined agreement and goals” and reported benefits
for the center. Centers with a high score on “Well-defined agreement and goals” experienced
greater benefits and improvements regardless of the reported level of communication.
Figure 2.1 Agreement and Goals Predicting Benefits for Centers
Child Care/Head Start Partnership Study: Final Report 38
Well-defined agreement and goals predicting benefits for staff based on low and high levels of communication and relationship (n=106)
(Formula: Benefits=.696+.064(Agreement) + .125(Communication)
1.46
4.784.58
7.91
0
2
4
6
8
10
12
Low Agreement and Goals High Agreement and Goals
LowCommunication
HighCommunication
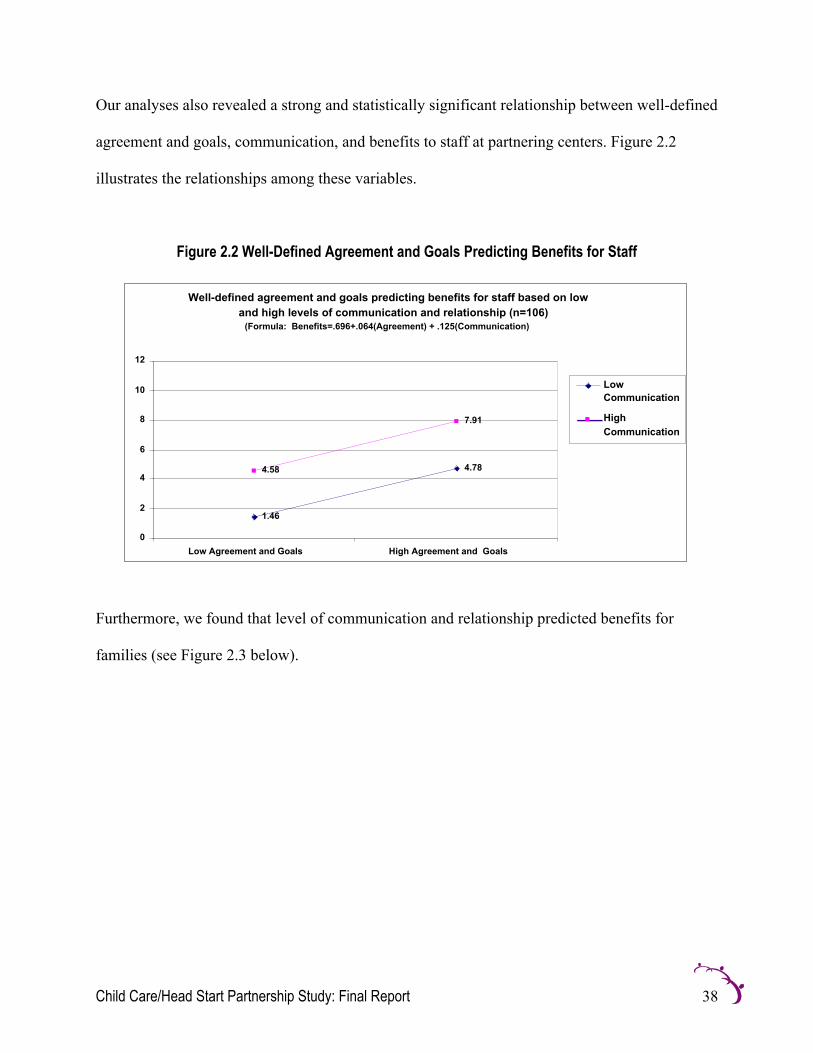
Our analyses also revealed a strong and statistically significant relationship between well-defined
agreement and goals, communication, and benefits to staff at partnering centers. Figure 2.2
illustrates the relationships among these variables.
Figure 2.2 Well-Defined Agreement and Goals Predicting Benefits for Staff
Furthermore, we found that level of communication and relationship predicted benefits for
families (see Figure 2.3 below).

Child Care/Head Start Partnership Study: Final Report 39
Figure 2.3 Level of Communication and Relationship Predicting Benefits for Families
Level of communication and relationship predicting benefits for families at low to high levels of benefits for staff (n=156)
(Formula: Benefits=.696+.064(Agreement) + .125(Communication)
1.58
6.256.247
10.92
0
2
4
6
8
10
12
Low Communication andRelationship
High Communication andRelationship
Low Benefits forStaff
High Benefits forStaff
There is a significant statistical interaction, (t = 3.72), p < .0001, between duration of
partnership and well-defined agreement and goals when predicting benefits and improvements
for centers overall (see Figure 2.4 below). A very high amount of variation (62 percent) in the
scale score for “Benefits and Improvements for Centers Overall” is associated with variation in
the interaction between duration of the partnership and well-defined agreement and goals.
Centers that participated in the partnership showed a greater increase in the “Benefits and
Improvements for the Center,” as scores on the “Agreement and Goals” scale increased at the
beginning of the partnership. The impact of well-defined agreement and goals on benefits and
improvements for centers lessens with each year of participation in the partnership, but still has a
positive association up to seven years.

Child Care/Head Start Partnership Study: Final Report 40
Figure 2.4 Benefits for Center as a Function of Interaction between Duration and Goals
Fitted regression lines of benefits for center overall as a function of the interaction between duration and well-defined agreement and goals
(Formula: Center Benefits=-2.75+.375*(Goals)+1.093*(Duration)+-.0423*(Dur*Goals)
02468
101214161820
Low Goals High Goals
Well-defined Agreement and Goals
Ben
efits
and
Im
prov
emen
ts fo
r Cen
ters
1 Year3 Years5 Years7 Years
Challenges of Partnership
Our surveys included open-ended items asking about the challenges of partnerships. It is not
surprising that the challenges cited most often are associated with those factors that appear most
important for partnership success. For example, nearly one fifth of respondents cited that
communication between partners was a challenge. Similarly, many child care directors reported
challenges associated with agreement and alignment of goals. Slightly more than 15 percent
reported challenges with specifying roles and responsibilities. Other challenges that were cited
were associated with changes in the staffing at the program. For example, some directors
reported that changes in staffing at their own program or at their partnering Head Start agency
caused service disruptions. Furthermore, many cited challenges working with parents to
complete the necessary paperwork and with parents’ eligibility.

Child Care/Head Start Partnership Study: Final Report 41
DISCUSSION
Our findings serve to clarify and quantify the differences between partnership and comparison
centers, the nature of child care/Head Start partnerships, and the supportive factors and outcomes
of partnerships. The comparison of partnering and non-partnering child care centers reveals that
our samples were relatively well matched at the inception of the study. For example, no
statistically significant differences exist in the size of the centers and each indicator of center
capacity.
While partnering centers serve slightly higher percentages of children on subsidies,
nearly half of the population at these centers is comprised of non-subsidized families who pay
the full tuition. As policymakers consider ways to provide the same, high-quality services to low-
income families that are available to higher income families, it is interesting to note that in our
sample of Ohio partnership centers, children from different economic backgrounds are being
served in the same settings, are being taught by the same teachers, and are participating in the
same curricula and activities.
Our data analyses do indicate that centers in partnership differ from comparison centers
on one important indicator of quality—child/staff ratios. Our hypothesis that centers in
partnership would provide better ratios—because the Head Start Program Performance Standards
require more stringent ratios than Ohio child care licensing standards—is correct.
Our data analyses also support qualitative findings concerning the nature of partnerships.
The variation in characteristics and structure of partnering and comparison centers is similar to
that identified in the current literature; centers vary in terms of partnership status, urbanicity,
size, populations served, and selected structural indicators of quality. Furthermore, the group of
partnering child care centers exhibits substantial variation in the number of children receiving

Child Care/Head Start Partnership Study: Final Report 42
Head Start services, the degree of fluctuation in the population of children served, and the ways
in which services are delivered.
Importantly, we found that the centers in partnership received an average of $3,600
dollars per child per year from Head Start and also received other resources such as training and
professional development, paid staff, and materials and supplies. The qualitative research reveals
that while resources can be an incentive, funding can also help centers meet the more rigorous
Head Start Program Performance Standards. Our findings suggest such a relationship exists.
Furthermore, a key finding is that the factors that qualitative literature suggests are
important for partnership success do, indeed, appear to be statistically significant predictors of
partnership benefits for child care centers, staff, and families. The findings illustrate the
importance of well-defined agreements and goals among partners in achieving desired results.
Furthermore, strong communication among partners is predictive of the benefits of partnerships.
While these findings are strong, we recognize the importance of validating the self-
reported benefits of the partnership. Therefore, in Chapters 3 and 4 we present additional
analyses that explore the relationship among these partnership factors and the benefits that
teachers and families reported receiving.

Child Care/Head Start Partnership Study: Final Report 43
CHAPTER 3 TEACHER CHARACTERISTICS, BENEFITS, ANDPRACTICES
OVERVIEW OF RELEVANT RESEARCH
Qualitative studies have revealed that teachers at partnering child care centers believe that their
centers’ partnerships with Head Start lead to benefits for themselves that ultimately result in
quality improvements in classrooms. Kiron’s profiles of child care centers in partnership
indicated that teachers at partnering centers believe that their partnerships produce improvements
in compensation and employment benefits, supervision, and professional development
opportunities (Education Development Center Inc., 2001). These benefits to teachers—which
studies have shown are important predictors of high-quality early childhood classrooms—are
reflected in the research findings of Sandfort & Selden, Paulsell et al., and Ontai (Ontai et al.,
2002; Paulsell et al., 2003; Sandfort & Selden, 2001). These studies have also suggested that
teachers at partnering centers believe that partnerships lead to improvements in the services they
provide.
However, no large-scale, systematic, quantitative studies have explored whether teachers
at partnering centers actually receive additional opportunities and supports compared with
teachers at non-partnering centers. Moreover, no studies have examined systematically whether
these reported benefits are associated with improvements in teacher attitudes, beliefs, and
practices that are related to observed classroom quality. Our research with teachers was designed
to explore whether such differences exist between partnering center teachers and comparison
center teachers.

Child Care/Head Start Partnership Study: Final Report 44
METHODS IN BRIEF
We analyzed data from two different target populations. Data were analyzed from the randomly
selected sample of child care centers included in the overall Partnership Impact study (see
Chapter 1 for more details). In addition, we invited teachers within these centers to participate.
Participating teachers represented a self-selected sample from child care centers in the study.
Across the three rounds of data collection, we received 408 completed teacher surveys (see Table
1.1 in Chapter 1).
We collected the data using two different instruments. First, the Director Survey included
questions about opportunities offered to teachers. Second, a Teacher Survey included questions
about teacher compensation and benefits, teacher education and professional development, and
teacher practices. The surveys were similar, but not identical, for each round of data collection.
Our Teacher Survey used many of the same questions and scales used by FACES as well as
items from the I-PIECE Study. We also included a modified “Developmentally Appropriate
Practices Scale” which FACES researchers found to be correlated with classroom observation
data, providing evidence for the validity of these measures.
The Teacher Survey was designed to provide an overall assessment of how a center’s
participation in the partnership was related to classroom level practice. Table 3.1 provides a
detailed list of the underlying constructs of the teacher survey, a summary of the questions we
asked, and descriptions of the properties of the construct scores we used to analyze the data. The
classroom-level outcomes included the following:
Classroom quality/rich learning environment Teacher beliefs about teaching and learning Child initiated activities Literacy activities Quality of job/job satisfaction Parental involvement

Child Care/Head Start Partnership Study: Final Report 45
Parental support/linkages to resources Quality of supervision
We conducted reliability analysis to examine the properties of our constructs.
Cronbach’s alphas were obtained and are based on the average inter-item correlations. Table 3.1
also shows the results of these analyses. An alpha that approximated .70 or greater was
considered highly acceptable and above .65 was considered acceptable. As Table 3.1 shows, all
constructs measured by our teacher survey showed very high or at least acceptable (> .65)
internal consistency with alphas ranging from .65 to .91.

Child Care/Head Start Partnership Study: Final Report 46
Table 3.1 Teacher Constructs, Questions, and Description of Scale Scores
Construct Teacher Survey Question Description of Scale Scores
Classroom Quality/Rich LearningEnvironment
Read to childrenUse structured curriculumReview letters of alphabet or wordsReview names of colorsReview number concepts or countGive children science materialsGive time in different play activitiesGive supply of age appropriate toysGive time outsideGive art suppliesGreet each parentInvolve parents in learning activitiesFormally assess or screen children
Thirteen individual items withrange from 0 to 2 based on Likertscale responses were averagedto form construct. (Reliabilityresults: Alpha=. 73; n = 374)
Teacher BeliefsAbout Learning andTeaching
Responsive to differences in developmentEach curriculum area taught separatelyChildren select own learning activitiesChildren cut shapes, drama, art, writingChildren work silently and aloneChildren learn through active explorationTeachers use treats to encourage behaviorTeachers use punishments to encourage behaviorChildren involved in establishing rulesChildren should recognize single lettersChildren should color within predefined linesChildren should form letters correctly on pageChildren should dictate stories to teacherChildren know letter soundsChildren know letter forms before writing
Fifteen individual items withrange from 0 to 3 based on Likertscale responses were averagedto form construct. (Reliabilityresults: Alpha= .73; n = 323)
Child InitiatedActivities
Children select own learning activitiesChildren cut shapes, drama, art, writingChildren learn through active explorationChildren should dictate stories to teacherChildren involved in establishing rules
Five individual items with range 0to 3 based on Likert scaleresponses were averaged toform construct. (Reliabilityresults: Alpha=.72; n = 366)
Literacy Development Children should recognize single lettersChildren should form letters correctly on pageChildren know letter sounds
Three individual items with rangefrom 0 to 2 based on Likert scaleresponses were averaged toform construct. (Reliabilityresults: Alpha=.66; n = 374)
Quality of Job/JobSatisfaction
Receive guidance from my directorHave enough time to do all requiredClearly defined job responsibilitiesHigh enough salary for job demandsGet support from other staffGet support from my supervisorGet support & communication from managementGet enough funds for supplies & activities
Construct range is 0 to 13 basedon sum of “yes” answers todichotomous questions.(Reliability results: Alpha=.74;13 items; n = 287)

Child Care/Head Start Partnership Study: Final Report 47
Construct Teacher Survey Question Description of Scale Scores
Opportunities to give input to management for changesHave clear goals & objectives for teachingCenter has a staff handbookCenter director not afraid to take risksCenter has a collective bargaining agreement
Parental Involvement Involve parents in child’s learning activitiesParent advisory group opportunitiesVolunteer in classroomMeet with parents to discuss child’s progressSend home written communication to parentsParents participate in the classroom
Construct range is 0 to 10 basedon the sum of four items withrange from 0 to 2 and twodichotomous (yes/no) questions.(Reliability results: Alpha=.65; 6items; n = 291)
ParentalSupport/Linkages toResources
Immigration referralsEmployment services referralsAdult literacy opportunitiesAssistance obtaining food stampsFinancial aid for schoolHousing assistance or referralGED preparation referralsEnglish proficiency class referrals
Construct range is 0 to 1 basedon the average of eightdichotomous (yes/no) questions.(Reliability results: Alpha=.91; n= 197)
Parental Involvement& Support
Involve parents in child’s learning activitiesMeet with parents to discuss child’s progressSend home written communication to parentsParents participate in the classroomImmigration referralsParent advisory group opportunitiesVolunteer in classroomEmployment services referralsAdult literacy opportunitiesAssistance obtaining food stampsFinancial aid for schoolHousing assistance or referralGED preparation referralsEnglish proficiency class referrals
This construct was formed toprovide an overall score oninvolvement and support andconsists of the parentalinvolvement and support itemsmentioned previously. Theconstruct range is 0 to 18 basedon the sum of 4 items with rangefrom 0-2 and ten dichotomous(yes/no) items. (Reliabilityresults: Alpha=. 86; 14 items; n =184)
Quality of Supervision Administrator observes in classroomAdministrator meets to give feedbackAdministrator discusses linking curriculum tochildren’s developmental needs
Administrator discusses developmentally appropriate practiceAdministrator discusses strategies for literacy-rich curriculumAdministrator reviews teaching plans
Six individual items with rangefrom 0 to 2 based on Likert scaleresponses were averaged toform construct. (Reliabilityresults: Alpha=.91; n = 381)
We conducted quantitative analyses to: 1) compare teachers in partnering centers to
teachers in non-partnering centers; 2) describe the quantitative relationship, where one existed,
between the quality of the partnership with Head Start (assessed using composites of individual
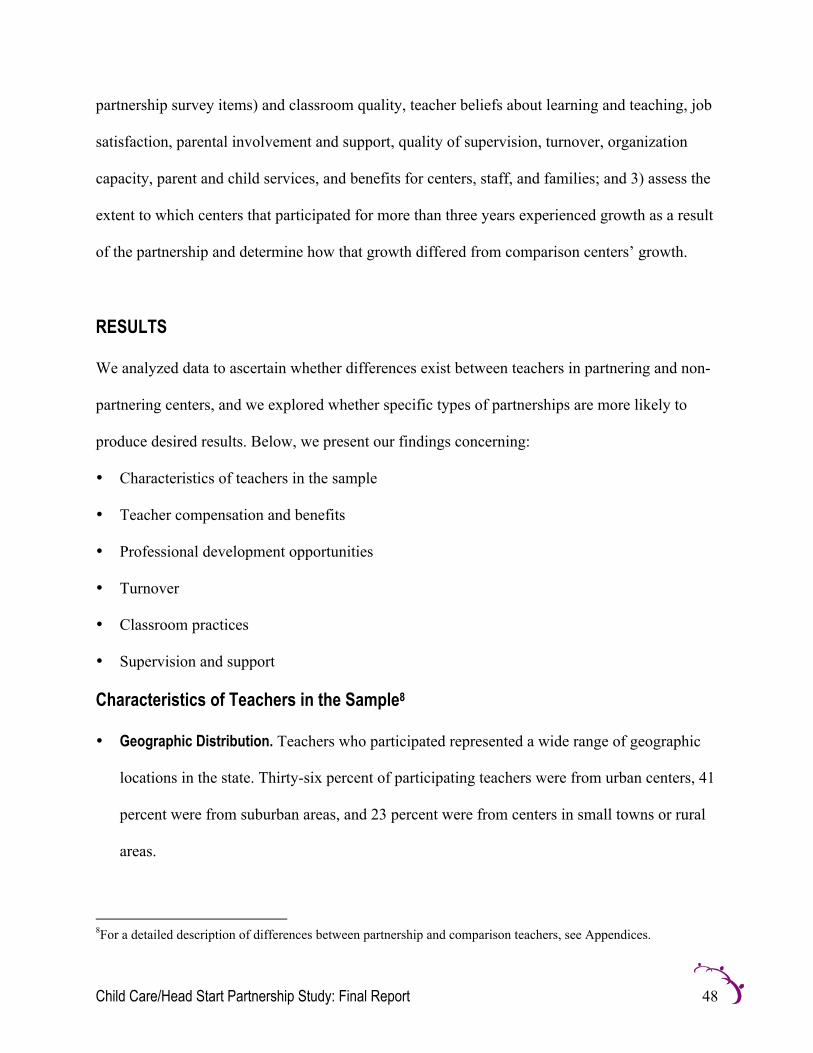
Child Care/Head Start Partnership Study: Final Report 48
partnership survey items) and classroom quality, teacher beliefs about learning and teaching, job
satisfaction, parental involvement and support, quality of supervision, turnover, organization
capacity, parent and child services, and benefits for centers, staff, and families; and 3) assess the
extent to which centers that participated for more than three years experienced growth as a result
of the partnership and determine how that growth differed from comparison centers’ growth.
RESULTS
We analyzed data to ascertain whether differences exist between teachers in partnering and non-
partnering centers, and we explored whether specific types of partnerships are more likely to
produce desired results. Below, we present our findings concerning:
• Characteristics of teachers in the sample
• Teacher compensation and benefits
• Professional development opportunities
• Turnover
• Classroom practices
• Supervision and support
Characteristics of Teachers in the Sample8
• Geographic Distribution. Teachers who participated represented a wide range of geographic
locations in the state. Thirty-six percent of participating teachers were from urban centers, 41
percent were from suburban areas, and 23 percent were from centers in small towns or rural
areas.
8For a detailed description of differences between partnership and comparison teachers, see Appendices.

Child Care/Head Start Partnership Study: Final Report 49
• Hours Per Week, Number of Classrooms, and Number of Children Served. Teachers reported
working an average of 37.4 hours per week. On average, teachers worked in 1.21 classrooms
serving 15 children per classroom.
• Length of Child Care Career. Teachers reported working in child care for an average of 90
months. Teachers’ experience ranged from less than a month to over 30 years.
• Education Level. We found no differences in the education level of the teachers working at
partnering centers and comparison teachers.
• Professional Identity. We analyzed data related to professional identity and experience to
explore whether differences exist between teachers at partnering centers and teachers at
comparison centers. Analyses revealed that teachers at partnering centers and comparison
centers reported the same perceptions of professional identity (see Table 3.2).

Child Care/Head Start Partnership Study: Final Report 50
Table 3.2 Percent of Teachers in Each Category of “View of Job” (n = 394)
Partnership Comparison _2
My chosen occupation 70.42 67.78 0.3203A stepping-stone to work in another field related to child care 15.49 16.67 0.0998A stepping-stone to K–12 teaching 16.90 12.78 1.3002An entry-level job in this organization 1.88 1.11 0.3816Temporary employment (until a better job is available) 2.35 1.11 0.8523
_p < .10 *p < .05 **p < .01 ***p < .001
Teacher Compensation and Benefits
While teachers at partnering centers were more likely than comparison teachers to receive a
range of employment benefits, no differences in compensation were reported. However,
Table 3.3 shows statistically significant differences in the percentage of teachers who received
paid sick leave, family leave, dental insurance, tuition reimbursement, release time for training,
and retirement plans.

Child Care/Head Start Partnership Study: Final Report 51
Table 3.3 Percentage of Teachers at Partnering and Comparison CentersReceiving Specific Employee Benefits
n Partnership Comparison _2
Paid vacation 295 77.98 71.84 1.96Paid sick leave 376 60.19 46.75 6.76**Paid maternity leave 330 22.35 15.89 2.18Paid family leave 321 22.73 11.03 7.55**Paid health insurance 377 39.34 36.97 0.22Paid dental insurance 371 28.37 19.75 3.64_
Tuition reimbursement 343 35.08 15.79 16.16***Retirement plan 355 46.73 25.16 17.34***Release time for training 345 58.67 44.59 6.70**
_p < .10 *p < .05 **p <. 01 ***p <. 001
A two-tailed independent samples t-test revealed that differences also existed in the total
number of employee benefits that teachers at partnering centers received compared with teachers
at non-partnering centers (M = 3.08, SD = 2.52), t(405) = -4.29, p < .001. While differences
existed in the number of benefits, there were no statistically significant differences in the
compensation that teachers received at partnering centers compared with teachers at non-
partnering centers.9
To determine if specific aspects of partnership were related to improvements in the
benefits received by teachers, we explored two critical aspects of partnership. We examined
whether the duration of the partnership was associated with benefits. In addition, we examined
whether the strength of the partnership, as we describe in Chapter 2, was associated with
improvements in benefits.
Logistic regression analyses of data from teachers working at partnering centers revealed
that the duration of partnership was a strong and statistically significant predictor of the 9Researchers asked teachers to indicate their monthly compensation using a scale with specific income ranges.Wilcoxon Two-Sample tests were then used to detect statistically significant differences in the ordinal data betweenthe two groups of teachers.

Child Care/Head Start Partnership Study: Final Report 52
likelihood that teachers would receive paid maternity leave, paid family leave, release time for
training, and tuition reimbursement (see Table 3.4).
Table 3.4 Logistic Regression Analysis for Employee Benefits Offered to TeachersControlling for Duration of Partnership
Dependent variables n B SE B eB Wald _2
Paid vacation 196 -0.14 0.10 0.87 1.82Paid sick leave 186 0.14 0.09 1.15 2.49Paid maternity leave 160 0.42 0.12 1.52 12.80***Paid family leave 157 0.43 0.12 1.54 13.27***Paid health insurance 190 0.16 0.09 1.17 3.17_
Paid dental insurance 188 0.23 0.10 1.26 5.63*Tuition reimbursement 171 0.23 0.10 1.26 5.87*Retirement plan 178 0.33 0.10 1.40 12.15***Release time for training 178 0.23 0.10 1.26 5.64*
_p < .10 *p <. 05 **p < .01 ***p < .001
Building on our finding that well-defined agreement and goals, strong communication,
and partnership duration were predictive of self-reported improvements, we looked at whether
partnering centers reported a relationship between well-defined agreement and goals and teacher
reported benefits. We found a significant statistical interaction between duration of partnership
and scores on the “Well-defined Agreement and Goals” scale when predicting benefits and
improvements for staff at centers in partnership
(t = 4.09), p < .0001. Thirty-seven percent of the variation (r2 = .37) in benefits and
improvements for staff was associated with variation in the interaction between duration of the
partnership and well-defined agreement and goals. Moreover, there was a greater increase in the
“Benefits and Improvements for Staff” scale score as the score on the “Agreement and Goals”
scale increased at the beginning of the partnership. The impact of well-defined agreement and
goals on benefits and improvements for centers lessened with each year of participation in the
partnership, but still had a positive association up to five years.

Child Care/Head Start Partnership Study: Final Report 53
Figure 3.1 Benefits and Improvements for Staff as a Function of PartnershipDuration and Well-Defined Agreement and Goals
Fitted Regression Lines of Benefits and Improvements for Staff as a Function of the Interaction Between Duration and Well-defined Agreement and Goals
(Formula: Staff Benefits=-3.022+1.264*(Duration)+.237*(Goals)+-.0399*(Duration*Goals)
-202468
1012
Low Goals High Goals
Well-defined Agreement and Goals
Ben
efits
for S
taff 1 Year
3 Years5 Years7 Years
We also found that while no differences existed between the compensation of teachers at
partnering and comparison centers, duration of the partnership was significantly positively
associated, (t = 2.45), p < .05, with teacher compensation. As duration increased, so did the
amount of teacher compensation received (see Figure 3.2). The association was low, however,
explaining only 3 percent (r2 = .032) of the variation in teacher compensation.

Child Care/Head Start Partnership Study: Final Report 54
Figure 3.2 Teacher Compensation as a Function of Partnership Duration
Fitted regression line of teacher compensation as a function of partnership duration
(Formula: Compensation=2.173+.145*Duration)
0
1
2
3
4
1 Year 3 Years 5 Years 7 Years 9 Years
Duration of Partnership
Compensation: 1=Less than $10,000; 2=$10,000-14,999; 3=$15,000-19,999; 4=$20,000-23,999; 5=$24,000-27,999; 6=$28,000-31,999; 7=$32,000-35,999; 8=Over $36,000
Professional Development Opportunities
We found some differences in the professional development opportunities reported by partnering
center teachers and comparison center teachers. A two-tailed independent samples t-test revealed
statistically significant differences in the number of hours of professional development received
(M = 24.93, SD = 34.58), t(336) = -2.47, p < .05, with partnership teachers receiving more
professional development. We also found that when compared to teachers in non-partnering
centers, teachers in partnering centers were offered more offsite workshops, X2(1, N = 378) =
19.0479, p < .001, and gave higher rating to the effectiveness of professional development
training, (M = 3.35, SD = 0.57), t(397) = -2.24, p< .05.
We also examined a relationship between duration of partnership and professional
development opportunities reported by teachers. Our analysis revealed that duration of
partnership was a positive predictor for teachers’ ratings of the effectiveness of professional
development received (r2 = .0353), F(1, 194) = 7.10, p < .01. However, duration of partnership
was not significantly predictive of teachers’ likelihood of reporting that they had participated in

Child Care/Head Start Partnership Study: Final Report 55
professional development opportunities such as taking college courses, onsite workshops, or
offsite workshops.
When analyzing the interactions between specific aspects of partnership and the
professional development opportunities provided to teachers, we found some strong and
statistically significant effects (see Figure 3.3). Specifically, we found that approximately 24
percent of the variation (r2 = .237) in participation in onsite workshops was associated with
variation in duration of the partnership, (t = 2.53), p < .05, and per child funding (t = 2.28),
p < .05, together. The model was significant overall (F = 6.83), p < .01. That is, duration of the
partnership and the amount of funding received from Head Start per child were positively related
to teacher participation in onsite workshops. Furthermore, centers with high per child funding
and longer partnership duration had teachers who participated in the highest number of onsite
workshops. Centers with low per child funding and low partnership duration had teachers who
participated in the lowest number of onsite workshops.
It took seven years of participation in the partnership before centers with low per child
funding received from Head Start had teachers who participated in an equal number of
workshops as teachers in centers with high per child funding at one year duration. However, the
number of onsite workshops teachers participated in increased steadily as the number of years in
the partnership increased, regardless of the amount of funding per child.

Child Care/Head Start Partnership Study: Final Report 56
Figure 3.3 Teacher Participation in Onsite Workshops as a Function of Duration and Funding
Fitted regression lines of teacher participation in onsite workshops as a function of partnership duration and per child funding received
from Head Start (Formula: Onsite Workshops=-.297+.000896*Per Child Funding+.517*Duration)
0
2
4
6
8
1 Year 3 Years 5 Years 7 Years 9 Years
Duration of Partnership
Low Per ChildFundingModerate PerChild FundingHigh Per ChildFunding
Turnover
To examine the relationship between teacher turnover and the existence of partnership, we
analyzed data from child care directors and found that partnership with Head Start was
associated with increased teacher turnover. Partnering centers reported that mean annual teacher
turnover was 2.47, compared with 1.66 at comparison centers (M = 2.04, SD = 2.83),
t(258) = -2.6, p < .05. Analyses revealed that 21 percent of the teachers leaving partnership
centers left involuntarily and 79 percent left voluntarily. This finding is consistent with
qualitative study reports that partnering with Head Start leads child care directors to seek higher
standards for teachers (Schilder et al., 2003). In addition, some studies have suggested that when
some child care teachers working in partnering centers become aware of higher paying
employment at Head Start, they leave the child care centers for better pay. While initially
turnover was related to partnership, regression analyses revealed that duration of the partnership
was not related to turnover (r2 = .0105), F(1, 141) = 1.50, p < .22. Thus, changes in turnover
appeared to happen initially, but did not increase over the duration of the partnerships.

Child Care/Head Start Partnership Study: Final Report 57
Classroom Practices
• Curriculum. Teachers at partnering centers were more likely to report using a structured
curriculum in the classroom (M = 3.45, SD = 0.89), t(354) = -2.15, p < .05. Specifically, chi-
square analyses revealed that teachers at partnering centers were more likely than non-
partnering centers to use Creative Curriculum X2(1, N = 397) = 4.16, p <. 05, High Scope
X2(1, N = 397) = 11.03, p < .001, or Bright Beginnings X2(1, N = 243) = 4.12, p < .05.
Furthermore, teachers at partnering centers were less likely to use a teacher-designed
curriculum, X2(1, N = 397) = 19.07, p < .001, and less likely to report that they used no
curriculum X2(1, N = 397) = 6.54, p < .05.
• Assessments. Partnering centers were more likely to report using some standardized child
and classroom assessment tools. While partnering centers were as likely as comparison
centers to report using the Early Language and Literacy Classroom Observation (ELLCO)
(nearly 3 percent for both groups) and the Early Childhood Environmental Rating Scale
(ECERS) (nearly 10 percent versus 8 percent of the comparison centers), partnership centers
were more likely to report using the National Association for the Education of Young
Children (NAEYC) self-study tool (71 percent versus 35 percent of the comparison centers).
Comparison centers were more likely to use center-designed child assessment tools or no
standardized instruments: 68 percent used center-designed child assessment tools compared
with 46 percent of partnership centers; 8 percent reported using no child assessment
instruments compared with 2 percent of the partnership centers. Partnering centers were more
likely to engage Head Start staff in the assessment process than comparison centers. While
all of the comparison centers reported that teachers and/or center directors conducted child

Child Care/Head Start Partnership Study: Final Report 58
assessments, 38 percent of the partnership centers reported that Head Start staff conducted
the child assessment.
• Classroom Activities. When asked about frequency of specific classroom activities, only the
use of structured curriculum differentiated partnering center teachers from comparison center
teachers (see Table 3.5). Yet, some differences between partnering and comparison centers
existed with teachers’ engagement of parents (see Table 3.6). Partnership teachers were
significantly more likely to meet with parents to discuss children’s progress and parents in
partnering classrooms were significantly more likely to help out in the classroom.
Table 3.5 Teachers’ Reports of Specific Classroom Activities
Partnership Comparison n M (SD) M (SD) t
Read to children 405 3.81 (0.44) 3.76 (0.46) -1.13Review names of colors 405 3.63 (0.57) 3.56 (0.61) -1.25
Review letters of the alphabetor words
4043.64 (0.58) 3.68 (0.59) 0.61
Review number concepts orcount
4063.68 (0.52) 3.72 (0.53) 0.76
Give children art suppliesto use in the classroom
4063.85 (0.46) 3.81 (0.45) -0.98
Give children time to spendoutside (weather permitting)
4053.87 (0.40) 3.82 (0.50) -1.04
Give children science or naturematerials
4063.37 (0.74) 3.25 (0.78) -1.51
Give children time in differenttypes of play activities
4063.91 (0.30) 3.90 (0.35) -0.20
Give children a good supply ofage-appropriate toys andmaterials
4073.88 (0.40) 3.88 (0.37) -0.03
Use a structured curriculum 397 3.54 (0.80) 3.35 (0.97) -2.15* Total Score 407 36.90 (3.21) 36.64 (3.54) -0.77
Note. For each item, teachers were asked, “During a typical day, how often do the following activitiesoccur in your preschool classroom?” Response options were as follows: 1 = Never, 2 = Sometimes, 3 =Often, 4 = Always._p < .10 *p < .05 **p < .01 ***p < .001

Child Care/Head Start Partnership Study: Final Report 59
Table 3.6 Teachers’ Reports of Specific Parent Involvement Activities
Partnership Comparison n M (SD) M (SD) t
Greet each parent and childwhen they arrive
404 3.81 (0.47) 3.80 (0.51) -0.29
Involve parents in theirchild’s learning activities
400 3.30 (0.73) 3.23 (0.78) -0.97
Meet with parents todiscuss their child’sprogress
397 3.03 (0.87) 2.84 (0.88) -2.19*
Send home writtencommunication to parents
399 3.10 (0.91) 3.16 (0.86) 0.64
Parents participate ashelpers in the classroom
398 2.17 (0.84) 1.94 (0.78) -2.69**
Total Score 385 15.44 (2.50) 14.97 (2.60) -1.79_
Note. For each item, teachers were asked, “How often do the following activities occur?” Responseoptions were as follows: 1 = Never, 2 = Sometimes, 3 = Often, 4 = Always._p < .10 *p < .05 **p < .01 ***p < .001
Developmentally Appropriate Beliefs. Teachers working at partnering centers and comparison
teachers reported similar beliefs about developmentally appropriate practices. While no
differences were reported between the groups, our analyses of data from partnership teachers
revealed a slight, but steady, increase in teacher beliefs about learning and teaching that was
significantly associated, (t = 2.65), p < .01, with the number of years their centers had been
participating in the partnership (see Figure 3.4). The association was low, however, explaining
only 3 percent of the variation in teacher beliefs about learning and teaching.

Child Care/Head Start Partnership Study: Final Report 60
Figure 3.4 Teacher Beliefs about Learning and Teaching as a Function of Duration
Fitted regression line of teachers beliefs about learning and teaching as a function of duration of partnership
(Formula: TchBel=1.804+.03965*Duration)
1
1.5
2
2.5
3
1 Year 3 Years 5 Years 7 Years 9 Years
Duration of Partnership
Nonetheless, partnership teachers showed a steady increase in their beliefs related to
child-initiated activities as duration of the partnership increased (t = 4.14), p < .0001. Eight
percent of the variation in child-initiated activities was associated with variation in duration (see
Figure 3.5).
Figure 3.5 Child-Initiated Activities as a Function of Duration
Fitted regression line of child initiated activities as a function of duration of partnership
(Formula: ChdInt=2.257+.06986*Duration)
1
1.5
2
2.5
3
1 Year 3 Years 5 Years 7 Years 9 Years
Duration of Partnership

Child Care/Head Start Partnership Study: Final Report 61
Furthermore, there was a steady increase in teacher beliefs about literacy development
that was associated with the number of years their centers had been participating in the
partnership (t = 5.42), p < .0001. Our analyses revealed that 13 percent of the variation in
teachers’ beliefs about literacy development was associated with variation in duration (see Figure
3.6).
Figure 3.6 Teacher Beliefs about Literacy Development as a Function of Duration
Fitted regression line of teacher beliefs about literacy development as a function of duration of partnership(Formula: LitBel=.979+.133*Duration)
00.5
11.5
22.5
3
1 Year 3 Years 5 Years 7 Years 9 Years
Duration of Partnership
Supervision and Support
We found that partnership teachers differed from comparison teachers in terms of the amount
and type of supervision they received (see Table 3.7). Independent samples t-test analyses
revealed that teachers at partnering centers were more likely than teachers at non-partnering
centers to report that they received guidance from the director and that an administrator
discussed strategies to ensure a literacy-rich curriculum. Analyses also suggested that partnership
teachers were more likely to discuss the relationship between the curriculum and children’s
developmental needs with an administrator.

Child Care/Head Start Partnership Study: Final Report 62
Table 3.7 Teacher Reports of Administrator Supervision Activities
Partnership Comparison n M (SD) M (SD) t
An administrator…Observes me in theclassroom to assess mypractice 397 2.49 (0.95) 2.43 (0.91) -0.58
Meets with me to give mefeedback regarding myclassroom teachingpractices 393 2.63 (0.83) 2.47 (0.94) -1.69_
Discusses with me howtolink the curriculum tochildren’sdevelopmental needs 394 2.58 (0.91) 2.42 (0.97) -1.71_
Discusses with mestrategies fordevelopmentallyappropriate teachingpractice 392 2.62 (0.93) 2.49 (0.98) -1.36
Discusses with mestrategies to ensure aliteracy-rich curriculum 390 2.57 (0.92) 2.34 (0.97) -2.44*
Reviews teaching planswith me 389 2.44 (0.93) 2.34 (1.05) -1.03
Receive guidance frommy director 393 3.33 (0.83) 3.13 (0.91) -2.33*
Total score 372 18.76 (5.34) 17.64 (5.81) -1.95_
Note. For each item, teachers were asked, “How often do the following activities occur?” Responseoptions were as follows: 1 = Never, 2 = Sometimes, 3 = Often, 4 = Always._p < .10 *p < .05 **p < .01 ***p < .001
Furthermore, we found that the number of years in the partnership and the amount of per
child funding were positively associated with the quality of supervision received (see Figure
3.8). That is, the quality of supervision increased as duration increased, and the quality of
supervision increased as the amount of per child funding from Head Start increased. Analyses
revealed that approximately 8 percent of the variation (r2 = .082) in quality of supervision was
associated with variation in duration of partnership, (t = 2.00), p < .05, and per child funding

Child Care/Head Start Partnership Study: Final Report 63
received from Head Start (t = 2.01), p <. 05. Furthermore, the quality of supervision was highest
in centers that received a high amount of per child funding and were engaged in partnership
longer (5–9 years), and the quality of supervision was lowest in centers that received a low
amount of per child funding and were engaged in partnership fewer years (1–4 years).
Figure 3.8 Quality of Supervision as a Function of Duration and Per Child Funding
Fitted regression lines of quality of supervision as a function of duration of partnership and per child Head Start funding
(Formula: QualSup=.757+.0001386*Per Child Funding + .07249*Duration)
0
0.5
1
1.5
2
1 Year 3 Years 5 Years 7 Years 9 Years
Duration of Partnership
Low PerChildFunding
ModeratePer ChildFunding
High PerChildFunding
DISCUSSION
Our analyses reveal that teachers who are working at partnering child care centers are more
likely to receive employee benefits than teachers at comparison centers. This finding supports
previous, qualitative studies that suggest that teachers who work at child care centers in
partnership with Head Start have the potential of receiving additional benefits and guidance.
Teachers at partnering centers are also more likely to participate in professional development
opportunities. Finally, our research indicates that teachers at partnering centers use standardized
curricula and assessment tools more often than teachers at non-partnering centers.

Child Care/Head Start Partnership Study: Final Report 64
Statistically significant differences exist between teachers working at partnering centers
and comparison teachers at non-partnering centers in terms of their use of curriculum and their
use of assessment data. While few differences exist in the teachers’ reports of classroom
activities, teachers at partnering centers were more likely to report engaging parents in activities.
Furthermore, analyses reveal that partnership duration is significantly predictive of improved
classroom activities. Partnerships with specific features are also significantly more likely to
engage in high-quality early childhood activities. For example, the number of years in the
partnership is associated with an increase in teacher beliefs about literacy development.
Moreover, duration and the amount of per child funding are positively associated with the quality
of supervision received.
These results suggest that partnerships between Head Start and child care centers can
improve the quality of care children receive directly and indirectly. Children benefit directly
when research-based standardized curricula are used in their classrooms (Goffin & Wilson,
2001). Children may indirectly benefit when teachers receive supports such as health insurance
and professional trainings, theoretically improving job satisfaction and decreasing turnover.
However, our research did not find differences in salaries reported by partnership teachers and
comparison teachers, and we found that partnership centers were more likely to report higher
teacher turnover. Since children benefit from stability in child care environments (Whitebook,
Howes, & Phillips, 1990), increasing teaching salaries, as opposed to increasing benefits, may
play a larger role in improving child care quality.
Our findings reveal no statistically significant differences in the background
characteristics of the teachers in the sample. Therefore, our research did not find support for our
hypothesis that teachers at partnering centers would have higher education levels than teachers at

Child Care/Head Start Partnership Study: Final Report 65
comparison centers. Our prediction was based on the fact that Head Start regulations currently
call for all Head Start teachers to have CDA certification and require that at least half of all
teachers have an associate’s degree in early childhood or a related field (U.S. Department of
Health and Human Services, 1998). Although not significant at the .05 level, our data does,
however, suggest a difference between partnering and comparison centers in the percentage of
teachers with CDAs, X2(1, N = 91) = 3.1310, p = .0768. With a larger sample, this difference
may have been significant and should be included in future research.
While we did not find the expected relationship between teaching at a partnership center
and the adoption of “developmentally appropriate practices,” our within-partnership analyses
reveal that the longer a center is in partnership, the higher the likelihood that the center will
adopt such practices. Beliefs about literacy practices and child-initiated practices are also
associated with partnership duration. Furthermore, centers with strong agreement on goals and
with high levels of communication with their partners are much more likely to engage in such
practices. Taken together, these findings reveal that merely entering into a partnership will not
produce desired results for teachers, but partnerships that endure and have strong communication
among partners will produce desired results.
Our survey of teachers shows differences between partnering and comparison centers.
However, due to the structure of the study, we cannot determine whether the partnerships caused
the differences. It could be that the centers that sought partnerships were already more likely to
offer benefits to staff and to use a structured curriculum, and it was not the partnership itself
which led to these improvements. However, the relationship between duration of the partnership
and improvements leads us to attribute some aspects of the partnership to these improvements.
Furthermore, according to teacher surveys, there are benefits to working at a partnership center.

Child Care/Head Start Partnership Study: Final Report 66
To better understand the actual impact of partnership on teachers, we believe an important next
step is to collect observational data from classrooms to better understand partnerships’
relationship to teacher practice.

Child Care/Head Start Partnership Study: Final Report 67
CHAPTER 4 PARENTS AND CHILDREN SERVED BY PARTNERSHIPS:PERSPECTIVES ON SERVICES AND QUALITY
OVERVIEW OF RELEVANT RESEARCH
The inclusion of parents’ experiences in research on child care is essential. Until recently, most
researchers focused on how child care professionals and researchers defined quality in child care
centers. However, researchers have found that parents and researchers do not always rate child
care quality identically (Cryer & Burchinal, 1997; Lim, 2005). In our study, we administered
surveys to child care directors and parents to learn about parents’ satisfaction with care, the
opportunities offered to parents to participate in classrooms, and services provided through child
care centers to families. One of the hallmarks of Head Start is its emphasis on parental
involvement (Castro, Bryant, Peisner-Feinberg, & Skinner, 2004). Therefore, as suggested
earlier, partnerships with Head Start will theoretically lead to increased parent involvement and
family access to services. To date, however, little research has been conducted concerning the
specific differences in services offered to families attending partnering centers versus non-
partnering centers.
METHODS IN BRIEF
To understand the services provided to parents and children, we analyzed responses to specific
questions from the Director Survey (see Chapter 1) related to services, opportunities, and
supports offered to parents and screenings, referrals, and services offered to children. We also
analyzed data from the Parent Survey. This data represented responses from a self-selected
sample of parents whose children attended the child care centers participating in the study. The
sample included surveys from 1,691 parents. Parents who completed surveys represented a wide
range of geographic locations in the state.

Child Care/Head Start Partnership Study: Final Report 68
RESULTS
Below, we present our findings concerning:
• Characteristics of parents in the sample
• Demographic comparisons
• Hours of child care
• Reasons for selecting a child care center
• Family involvement at child care centers
• Screenings, referrals, and services
• Satisfaction with accessibility and quality of services
Characteristics of Parents in the Sample
Approximately one-third (33 percent) of parents who completed surveys were from urban
centers, 42 percent were from suburban areas, and 25 percent were from centers in small towns
or rural areas. Non-response analyses revealed that the parents completing the surveys were less
likely to come from urban areas compared with the number of parents at the centers overall (the
percentage of parents from urban centers in the study was 38 percent).
Nearly all (92 percent) of the parents who completed surveys were mothers, 4 percent
were fathers, and 3 percent were guardians or grandparents. Most (83 percent) of the parents
completing the surveys were white, 12 percent were African American, and 5 percent were
Hispanic, Asian, or other. A small percentage (5 percent) of parents reported that they spoke a
language other than English in their homes. More than half (60 percent) of parents completing
the surveys reported that they were married, 23 percent categorized themselves as single, and 12
percent stated that they were divorced.
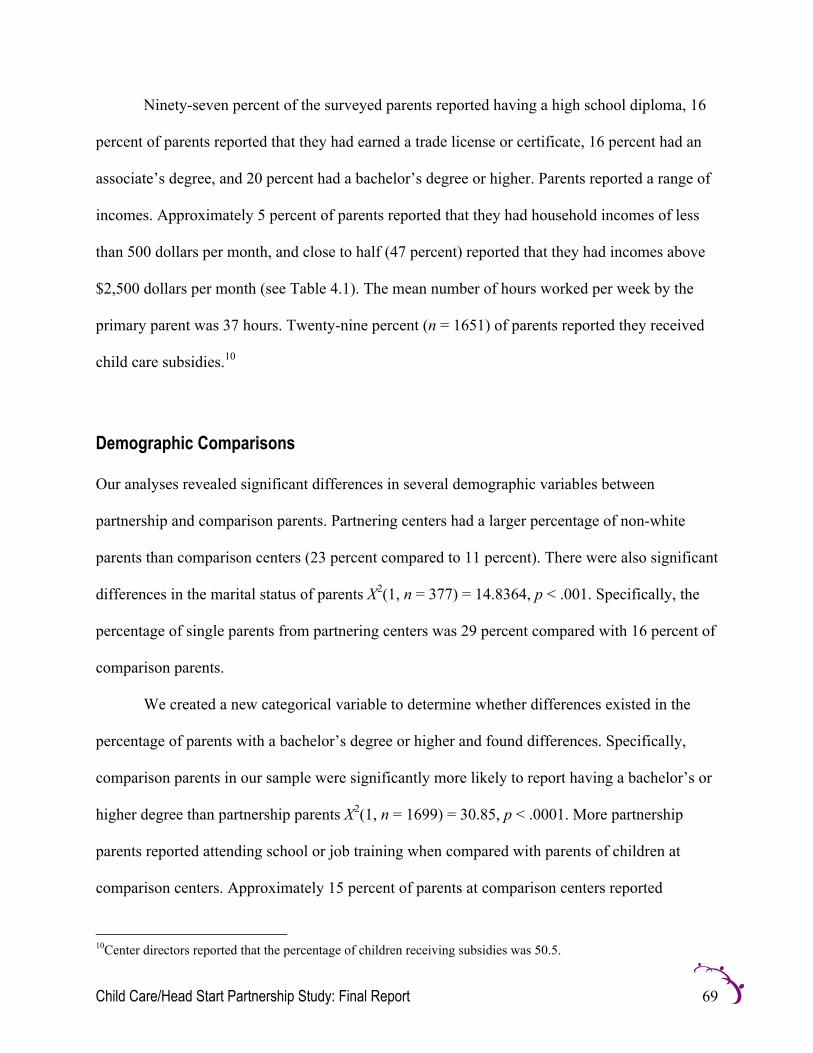
Child Care/Head Start Partnership Study: Final Report 69
Ninety-seven percent of the surveyed parents reported having a high school diploma, 16
percent of parents reported that they had earned a trade license or certificate, 16 percent had an
associate’s degree, and 20 percent had a bachelor’s degree or higher. Parents reported a range of
incomes. Approximately 5 percent of parents reported that they had household incomes of less
than 500 dollars per month, and close to half (47 percent) reported that they had incomes above
$2,500 dollars per month (see Table 4.1). The mean number of hours worked per week by the
primary parent was 37 hours. Twenty-nine percent (n = 1651) of parents reported they received
child care subsidies.10
Demographic Comparisons
Our analyses revealed significant differences in several demographic variables between
partnership and comparison parents. Partnering centers had a larger percentage of non-white
parents than comparison centers (23 percent compared to 11 percent). There were also significant
differences in the marital status of parents X2(1, n = 377) = 14.8364, p < .001. Specifically, the
percentage of single parents from partnering centers was 29 percent compared with 16 percent of
comparison parents.
We created a new categorical variable to determine whether differences existed in the
percentage of parents with a bachelor’s degree or higher and found differences. Specifically,
comparison parents in our sample were significantly more likely to report having a bachelor’s or
higher degree than partnership parents X2(1, n = 1699) = 30.85, p < .0001. More partnership
parents reported attending school or job training when compared with parents of children at
comparison centers. Approximately 15 percent of parents at comparison centers reported
10Center directors reported that the percentage of children receiving subsidies was 50.5.
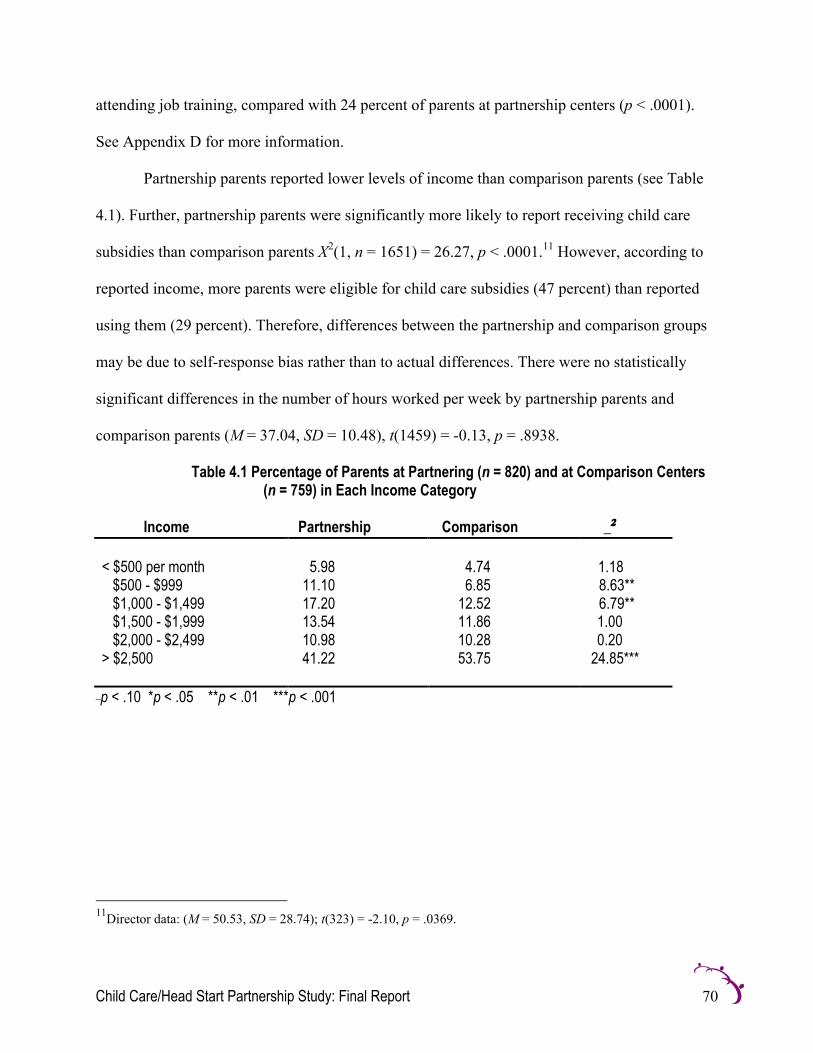
Child Care/Head Start Partnership Study: Final Report 70
attending job training, compared with 24 percent of parents at partnership centers (p < .0001).
See Appendix D for more information.
Partnership parents reported lower levels of income than comparison parents (see Table
4.1). Further, partnership parents were significantly more likely to report receiving child care
subsidies than comparison parents X2(1, n = 1651) = 26.27, p < .0001.11 However, according to
reported income, more parents were eligible for child care subsidies (47 percent) than reported
using them (29 percent). Therefore, differences between the partnership and comparison groups
may be due to self-response bias rather than to actual differences. There were no statistically
significant differences in the number of hours worked per week by partnership parents and
comparison parents (M = 37.04, SD = 10.48), t(1459) = -0.13, p = .8938.
Table 4.1 Percentage of Parents at Partnering (n = 820) and at Comparison Centers(n = 759) in Each Income Category
Income Partnership Comparison _2
< $500 per month 5.98 4.74 1.18 $500 - $999 11.10 6.85 8.63** $1,000 - $1,499 17.20 12.52 6.79** $1,500 - $1,999 13.54 11.86 1.00 $2,000 - $2,499 10.98 10.28 0.20> $2,500 41.22 53.75 24.85***
_p < .10 *p < .05 **p < .01 ***p < .001
11Director data: (M = 50.53, SD = 28.74); t(323) = -2.10, p = .0369.

Child Care/Head Start Partnership Study: Final Report 71
Hours of Child Care
We asked parents to tell us the average number of hours per day and average number of days per
week that their children attended the centers. Parents reported that their children attended the
centers, on average, about seven hours per day (M = 7.43, SD = 2.22) and four days per week
(M = 4.25, SD = 1.07). Statistically significant differences in the hours of care were reported
between partnership parents and comparison parents t(1513) = -6.59, p < .0001. Differences also
existed in the average number of days that children attended care, with partnership children
attending more days than comparison children t(1610) = -5.31, p < .0001.
Reasons for Selecting a Child Care Center
Parents reported multiple reasons for selecting a child care center.12 Seventy-two percent
reported that they selected the center because the center provided quality care, 59 percent
because it had good teachers, and 58 percent because the center was close to their home.
Comparison parents were more likely to report that they had selected the center based on the
quality of teachers and overall quality of care. Comparison parents also reported that the global
quality of the care at the centers was higher than that reported by parents whose children
attended partnership centers t(1647) = 3.67, p < .0003. Parents of children attending Head Start
partnership centers were more likely than comparison parents to report that they selected the
center because it offered Head Start services (p < .0001) or accepted child care subsidies
(p < .01).
12We asked parents to select the three main reasons for choosing care. Parents were offered the following options:a) The center is close to my home; b) The center is affordable; c) The center is close to my work; d) The center hadan opening for my child; e) The center has good teachers; f) The center provides quality care; g) The center acceptschild care subsidies; h) The center provides Head Start services.

Child Care/Head Start Partnership Study: Final Report 72
We found that approximately one quarter of parent surveys were from parents of children
who attended religious-affiliated programs. Parents at religious-affiliated centers were more
likely to be comparison parents than partnership parents X2(1, n =1690) = 24.8996, p < .0001.
However, we did not examine religious affiliation as a reason for choosing a center.
Family Involvement at Child Care Centers
One of the potential outcomes of partnership is greater involvement of the families in the child
care centers. We found that partnership parents were more likely than comparison parents to be
offered parent involvement opportunities (see Table 4.2 below). According to child care center
directors, parents of children attending partnering centers were more likely to be offered an
opportunity to participate in parent workshops.
Table 4.2 Differences in Parental Involvement Opportunities Offered by CentersBased on Director Reports
Parent Opportunities Partnership (n = 165) Comparison (n = 183) _2
Offers parent workshops 53.99 40.44 6.3577 *
Opportunities to volunteerin classroom
69.74 68.05 0.1065
Serve on parent advisorygroup
57.67 41.76 8.7088 **
Help parents set familygoals
85.80 72.22 9.3660 **
_p < .10 *p < .05 **p < .01 ***p < .001
Furthermore, consistent with the director data, parents at partnering centers were more
likely to report that they served on a parent advisory group (p < .001) and received help with
family goals (p < .05). While there were no differences in reports from directors that the centers
offered volunteer opportunities, parents at partnering centers reported that they spent
significantly more time volunteering than comparison parents (p < .05).

Child Care/Head Start Partnership Study: Final Report 73
Screenings, Referrals, and Services
• Child-Focused Screenings, Referrals, and Services. Chi-square analyses revealed that
partnership center directors were more likely than comparison center directors to report
providing all of the specific child screenings, referrals, and services that are required by the
Head Start Program Performance Standards (see Table 4.3). Specifically, partnership
directors were more likely to report providing screenings for children including vision,
hearing, dental, mental health, and developmental. For example, 86 percent of partnership
directors reported that they provided developmental screenings compared with 52 percent of
comparison directors, 83 percent stated that they provided vision screening compared with 38
percent of comparison directors, and 80 percent reported that they provided hearing
screening compared with 31 percent of comparison directors. Table 4.3 shows that the
percentage of partnering centers that reported providing each specific screening, referral, or
service to preschool-aged children was higher than the percentage of comparison centers.
The differences in specific referrals and services offered by partnering and comparison
centers are all statistically significant.

Child Care/Head Start Partnership Study: Final Report 74
Table 4.3 Differences in Reports of Screenings, Referrals, and Services forChildren Based on Director Reports
Partnership Comparison _2
(n = 165) (n = 183)Child screenings Developmental Screening 86.06 52.51 44.86*** Vision screening 82.93 38.46 70.80*** Hearing screening 79.88 31.49 81.23*** Speech screening 77.44 41.34 45.97*** Mental health screening 68.13 37.78 31.26*** Dental screening 54.66 13.26 66.31*** Nutritional screening 40.74 15.25 27.60*** Lead screening 40.37 17.13 22.80***Child referrals Medical referrals 52.80 32.78 13.96*** Dental referrals 50.62 20.56 33.96*** Mental health referrals 67.95 (n = 78) 50.79 (n = 63) 4.28* Social service referrals 68.10 45.25 18.09***
Child services Physical therapy 32.70 16.11 12.78*** Speech therapy 67.48 34.81 36.63***
_p < .10 *p < .05 **p < .01 ***p < .001
Consistent with these reports, parents of children attending partnership centers were
also more likely than comparison centers to report that their children received screenings and
services. Specifically, parents were more likely to report that their children received
developmental screenings (p < .01), vision screenings (p < .001), hearing screenings
(p < .001), speech screenings (p < .001), and dental screenings (p < .001). Furthermore,
parents at partnering centers were more likely to report that their children were offered
physical therapy (p < .001) or speech therapy (p < .001). Parents of children at partnering and
comparison centers were equally likely to report that their children received nutrition or lead
screenings.

Child Care/Head Start Partnership Study: Final Report 75
In addition to examining differences in the specific services, screenings, and referrals
provided by partnership and comparison centers, we also examined differences in the total
number that were offered. We found that partnership directors offered a greater number of
screenings, referrals, and services than comparison directors. Independent samples t-test
analysis revealed that the number (M = 5.24, SD = 2.34) of screenings directors of partnering
centers reported offering to children is significantly higher than the number (M = 2.42,
SD = 2.28) reported by non-partnering centers, t(346) = -11.39, p < .0001. Furthermore, the
mean number of referrals and services is 2.67 (SD = 1.76), compared with 1.47 (SD = 1.60)
for non-partnering centers, t(346) = -6.64, p < .0001.
Partnership parents also reported that their children received significantly more
screenings, referrals, and services than comparison parents. Independent samples t-test
analysis revealed that the number (M = 3.66, SD = 2.90) of screenings, services, and referrals
received by children was significantly higher than the number (M = 1.86, SD = 1.91)
reported by comparison parents, t(1524) = -11.77, p < .0001.
To examine whether the duration of the partnership was related to the provision of
these screenings and services, we conducted regression analyses. Our analysis of child care
center director data revealed that duration of partnership was not a statistically significant
predictor of the number of screenings that directors reported providing, (r2 = .0046),
F(1, 143) = 0.66, p = 0.4196, and was not highly correlated with the number of referrals and
services directors reported offering (p = 0.3241). However, regression analysis of parent data
revealed that duration was significantly correlated with the number of child services parents

Child Care/Head Start Partnership Study: Final Report 76
reported receiving. This correlation appeared even stronger when controlling for such
parental characteristics as educational attainment, income, and receipt of child care subsidy.13
Figure 4.1 Child Services reported by Parents as a Function of Duration of Partnership
Fitted regression lines of total number of child services reported by parents as a function of partnership duration
(Formula: Number of Child Services = 3.14139 + 0.18574*Duration)
0
1
2
3
4
5
6
1 Year 3 Year 5 Year 7 Year 9 Year
Duration of Partnership
• Parent Services and Supports. In addition to asking directors and parents about the services
for children, we asked about parent services and supports. Chi-square analyses revealed that
directors of partnering centers were more likely to report offering parent services.
Specifically, partnership directors were more likely to report offering parents a process for
family goal setting (p < .0001), medical referrals (p < .0001), GED preparation (p < .0001),
immigration services (p < .001), and adult literacy (p < .0001). Significant differences also
existed between reports from partnership directors and comparison directors in terms of
13Educational attainment and income are strongly inversely correlated with the total number of child services.

Child Care/Head Start Partnership Study: Final Report 77
offering social service referrals (p < .0001), parent workshops (p < .05), mental health
referrals (p < .0001), employment referrals (p < .0001), or marriage counseling (p < .001).
However, significant differences did not exist between partnering centers and comparison
centers in terms of offering assistance with financial aid, housing assistance or referral, or
transportation. Table 4.4 shows the percentage of centers that provided specific referrals or
services to parents.

Child Care/Head Start Partnership Study: Final Report 78
Table 4.4 Differences in Parent Referrals and Services Based on Director Reports
Partnership Comparison _2
(n = 165) (n = 183)
Parent ServicesSocial service referrals 76.69 56.11 16.11***Medical referrals 54.04 30.17 19.90***Mental health referrals 61.88 36.67 21.55***GED preparation 43.56 17.78 27.06***English proficiency classes 25.15 6.11 24.12***Immigration services 10.56 2.21 10.31**Employment placementreferrals 38.89 16.67 21.27***
Adult literacy 35.19 8.89 35.12***Assistance obtaining foodstamps 45.06 27.37 11.58***
Assistance with financial aid 46.01 36.11 3.47_
Marriage counseling 20.99 9.39 9.08**Legal services referrals 27.78 13.89 10.10**Energy/fuel assistance 38.89 18.89 16.79***Processes for working onfamily issues/goals 50.92 30.00 15.61***
_p < .10 *p < .05 **p < .01 ***p < .001
Reports from parents were consistent with the reports from directors for most parent
services and referrals. Partnership parents were significantly more likely to report receiving
social service referrals (p < .001), mental health referrals (p < .001), employment referrals
(p < .001), GED preparation (p < .001), English proficiency (p < .05), immigration services
(p < .001), food stamp assistance (p < .001), and energy/fuel assistance (p < .01). However,
while directors of partnering centers were more likely to report offering marriage counseling,
parents reported no differences between partnering and comparison centers in marriage
counseling services. Furthermore, while analysis of director data showed no differences in
housing assistance offered by partnering and comparison centers, parents at partnering

Child Care/Head Start Partnership Study: Final Report 79
centers were significantly more likely to report receiving such assistance
(p < .001).
As with the child screenings, services, and referrals, we also analyzed the total number
of services and referrals offered to parents. Independent t-test analyses revealed that directors
of centers in partnership were more likely to provide parents with referrals and services than
comparison directors t(305) = -5.88, p < .0001. Partnership center directors reported
providing on average 5.65 (SD = 4.62) referrals/services to parents, compared with 3.05 (SD
= 2.00) provided by comparison centers. Consistent with these findings, parents at partnering
centers reported receiving significantly more services and referrals than parents at
comparison centers (p < .0001).
Regression analyses of data reported by child care center directors revealed that
duration of the partnership was somewhat correlated with the number of referrals and
services offered to parents (r2 = .0213), p = .0799. Furthermore, logistic regression analyses
revealed that duration was correlated with director reports of a center’s likelihood of offering
some specific services and referrals to parents such as medical referrals (p < .05), mental
health referrals (p < .05), GED preparation (p < .05), assistance with financial aid (p < .05),
and energy/fuel assistance (p < .05).
Reports from parents were consistent with those of child care center directors.
Specifically, analyses of parent data revealed a strong correlation between the number of
parent services received and the duration of the partnership. Again, we found that this
correlation appeared to be stronger when controlling for parental income, level of educational
attainment, and receipt of child care subsidy.

Child Care/Head Start Partnership Study: Final Report 80
Table 4.5 Logistic Regression of Director Reports of Parent Referrals and ServicesControlling For Duration of Partnership
Dependent variables B SE B eBParent ServicesSocial service referrals 0.0566 0.1183 1.058Medical referrals 0.2651 0.1077 1.304*Mental health referrals 0.2450 0.1133 1.278*GED preparation 0.2142 0.0997 1.239*English proficiency classes 0.0816 0.1067 1.085Immigration services 0.1430 0.1432 1.154Employment placement
referrals 0.0259 0.09741.026
Adult literacy 0.0902 0.0997 1.094Assistance obtaining food
stamps 0.0864 0.09641.090
Assistance with financial aid 0.2112 0.0997 1.235*Marriage counseling -0.1059 0.1207 0.900Legal services referrals 0.1221 0.1033 1.130Energy/fuel assistance 0.2098 0.1004 1.233*Processes for working on
family issues/goals 0.2874 0.1051 1.333**
_p < .10 *p < .05 **p < .01 ***p < .001
We found a significant statistical interaction (t = 4.56), p < . 0001 between duration of the
partnership and the score on the “Agreement and Goals” scale when predicting parents’ reports
of services received. However, the association was low, explaining only 4 percent of the
variation in parent services. While there was an increase in parent services as the score on the
“Agreement and Goals” scale increased in the first two years of partnership, the impact
associated with “Agreement and Goals” began to decline steadily after three years in partnership.

Child Care/Head Start Partnership Study: Final Report 81
Figure 4.2 Parent Services as a Function of Duration of Partnership and Agreement
Fitted regression lines of parent services as a function of duration of the partnership and agreement and goals
Formula: ParServ=-.146+.129(Duration)+.01298(Goals)+-.003591(Duration*Goals)
0
0.25
0.5
0.75
1
Low Agreement and Goals High Agreement and Goals
Duration of Partnership
1 Year
3 Years
5 Years
7 Years
Satisfaction with Accessibility and Quality of Services
Partnership parents were significantly more likely to report high satisfaction with accessibility of
services when compared with parents at non-partnering centers (p < .0001). Interestingly, even
though parents at partnering centers were more likely to receive the services through public
funds, no differences were reported in the quality of services received (p = 0.4853).
We found that for parents whose children attended partnership centers, ratings of
classroom quality started slightly higher at the beginning of a partnership for centers with low
communication and relationship, but there was a steady increase for centers with both low and
high communication and relationship scores as the duration of the partnership increased. The
association was low, however, explaining only 3 percent of the variation in parents’ ratings of
classroom quality (t = 2.512), p < .05.

Child Care/Head Start Partnership Study: Final Report 82
Figure 4.3 Parent Ratings of Quality as a Function of Duration and Communication
Fitted regression lines of parent ratings of classroom quality as a function of duration of partnership based on communication and relationship
Formula: Classroom Quality=2.54+-.02122(Commun)+.03139(Duration)+.0002819(Dur*Commun)
0.75
1.5
2.25
3
1 Year 3 Years 5 Years 7 Years
Duration of Partnership
LowCommunication
HighCommunication
DISCUSSION
Our research suggests that families attending partnering centers receive benefits such as services,
referrals, and screenings that are not provided at non-partnering centers. Moreover, parents at
partnership centers are more likely to be involved in their children’s classrooms. Our findings
also reveal significant differences between parents’ experiences and demographics at the two
types of centers and highlight several aspects of child care/Head Start partnerships that have
relevancy for policymakers and researchers.
First, partnership parents are more likely to receive services for their children (e.g.,
developmental screenings, physical therapy, and speech therapy), as well as for themselves (e.g.,
GED preparation, parent workshops that contribute to children’s optimal intellectual and
physical development and families’ self-sufficiency). Duration of partnership appears to be
correlated with families’ likelihood of receiving both kinds of services.

Child Care/Head Start Partnership Study: Final Report 83
While our parent survey findings indicate that duration of partnership is predictive of
services, screenings, and referrals to children, it is interesting to note that our director survey data
does not reveal a statistically significant relationship between duration and services for children.
This suggests that as partnerships become more established, parents may become more familiar
with the center’s offerings and more comfortable accepting provided services. Our findings
concerning the correlation between duration of partnerships, likelihood of centers providing
services and referrals to parents, and parent reports of receiving services may also be due to
parents’ growing familiarity with the available services and a better system of integrating
services and referrals into parent-center relationships.
Second, our analyses reveal several differences in demographics between family
populations at partnership and comparison centers. Parents at partnership centers are more likely
to report lower incomes, more likely to be involved in job training, more likely to hold two or
more jobs, more likely to be single parents, and more likely to be non-White. They are less likely
to have bachelor’s degrees.
These demographic differences, and especially our findings concerning partnership
parents’ education and income, are instructive to the ongoing study of child care quality. As
policymakers consider options such as partnerships for bringing quality care to children and
families, we must recognize differences in the populations we are comparing in studies. Further,
as we move forward to conduct research on the links between partnerships and observed
classroom quality, it is essential that we include information about the children’s families that
could confound the results.

Child Care/Head Start Partnership Study: Final Report 84
CHAPTER 5 CONCLUSION AND DISCUSSION
We designed our study to examine prevailing theories about the nature and benefits of child
care/Head Start partnerships that are primarily derived from qualitative research. We selected a
set of three factors to investigate—the characteristics of and variations in child care/Head Start
partnerships, the differences between partnership and comparison teachers, and the differences in
services offered to children and families—because to date, these key elements of partnership
have largely remained unexplored by quantitative researchers. By gathering and analyzing data
in these areas, we sought to test the qualitative literature’s findings and illuminate the relevancy
of the assumptions made about the promise of partnerships to improve and expand services for
children and families.
Our analyses substantiate much of the qualitative research on improvements for the
beneficiaries of child care/Head Start partnerships—children, parents, and staff—and also
provide new details about partnership arrangements and benefits. Below, we provide highlights
of all of our key findings concerning the nature of partnerships and the relationship between
partnering and desired outcomes.
• Variation: Our study confirms that variation exists in the types of child care centers engaged
in partnership. Child care centers that engage in Head Start partnerships range from non-
profit to for-profit, religious-affiliated to secular, large to small, urban to rural.
• Population Served: Our analyses reveal that partnering child care centers provide services not
only to children from low-income families, but also provide child care to a large percentage
of children from higher income families. As research has shown that school-aged low-
income students served in economically diverse settings perform better than those in
homogenous settings, this finding reveals an additional potential benefit of partnerships.

Child Care/Head Start Partnership Study: Final Report 85
• Resources: Our data indicate that partnership centers do, indeed, receive resources from
Head Start. These resources include funding, professional development, and additional
materials and supplies. On average, partnership centers receive $3,600 dollars per child per
year. Centers use this funding to purchase supplies such as art materials, to support teacher
training, and to enhance teacher compensation packages. In addition to this funding,
partnership centers receive professional development and training, paid staff, and additional
materials and supplies from Head Start. These resources can help partnership centers meet
Head Start’s rigorous program performance standards. While the resources are related to the
number of Head Start children attending the center, centers use the funds in a variety of ways
that can improve early education experiences for every child. For example, all children can
benefit from classrooms with enhanced equipment, such as science centers or bookshelves,
and supplies or additional art and curriculum materials. Furthermore, all children have the
potential to benefit from better-trained teachers.
• Staff: Our findings reveal that partnership is a strong and statistically significant predictor of
offering teachers more professional development and training opportunities and better
compensation packages. Our data also indicate that partnership is a statistically significant
predictor of teachers’ usage of structured curricula and standardized assessments.
• Services: Our analyses indicate that partnership is a statistically significant predictor of
centers’ provision of additional screenings, referrals, and services to children and families.
This finding is especially compelling given that the final evaluation of the federally funded
Comprehensive Child Development Program (CCDP)—a program funded in 1997 at a level
of $15,768 dollars per family per year—found few differences in the services accessed by
CCDP and non-participating control group families. That study found that control group

Child Care/Head Start Partnership Study: Final Report 86
families were able to access many of the services offered by CCDP. For example, equal
percentages of CCDP and control group families visited a doctor for checkups, received
acute medical care, and received dental services. In contrast, our findings indicate that
families served by partnership centers are more likely to have access to services than
comparison families. Furthermore, regardless of income, parents at partnering centers are
more likely to receive comprehensive services for their children, more parent involvement
opportunities, and services and referrals for their families. Thus, it is possible for centers in
partnership with Head Start to leverage the benefits of the partnership to enhance the quality
of care for all children and families at the center. The size of the differences between
partnering and comparison centers indicates that partnership with Head Start is an important
factor in a center’s likelihood of offering screenings, referrals, and services (U.S. Department
of Health and Human Services/Administration for Children and Families/Child Care Bureau,
n.d.).14
• Agreement, Goals, and Benefits: While our findings indicate that the existence of a
partnership predicts certain benefits to child care centers, it appears that the nature of
partnerships is important. Centers that develop strong agreements and have consistent goals
with their partners, and who report good communication, are the most likely to report
improved benefits. These findings have implications for Head Start and Child Care
Development Fund (CCDF) policies. Over the past decade, federal leaders have encouraged
partnerships between Head Start and child care centers. At the same time, states have devoted
CCDF quality dollars to a range of activities with the goal of improving quality. Our research
demonstrates that partnership with Head Start is related to specific quality improvements.
14This research and demonstration program—funded by the federal government—was designed to providecomprehensive services to low-income children and families. For additional information see:http://www.abtassociates.com/reports/ES-D19940018.pdf

Child Care/Head Start Partnership Study: Final Report 87
Thus, leaders might consider the implications of this finding for policies related to CCDF
quality funds. Policymakers could consider ways to strengthen partnership agreements and
communication among partners as they consider ways to encourage the development of these
factors in partnerships.
As policymakers seek ways to leverage improvements in child care, we hope that these
findings will serve to inform their deliberations. Federal and state leaders issuing regulations and
guidance to programs in partnership might consider one of our study’s most important findings:
partnership with Head Start brings additional resources to a child care center and increases the
likelihood that the center will offer the screenings, referrals, and services that researchers suggest
make a difference for low-income children and their families.
Our study also leads to specific questions for future research. While the findings appear
promising, questions exist about whether observations would confirm the quality differences
reported by the directors, teachers, and parents. Furthermore, questions remain about whether the
reported improvements in teacher practices, along with the additional services provided to
children and their families, lead to improvements in children’s school readiness. To address these
important questions, we will continue our longitudinal study. In the upcoming years, we will
collect data from the sample of partnership centers and comparison centers using standardized
observational tools. Furthermore, we will collect data from a sample of children attending these
centers to determine if differences exist in children’s school readiness.

Child Care/Head Start Partnership Study: Final Report 88
REFERENCES
Adams, G., & Rohacek, M. (2002). More than a work support? Issues around integrating childdevelopment goals into the child care subsidy system. Early Childhood ResearchQuarterly, 17, 418–440.
Cost Quality and Child Outcomes Study Team. (1995). Cost, quality, and child outcomes in childcare centers. Denver, CO: University of Colorado at Denver.
Education Development Center, Inc. (2001). Partnership profiles. Newton, MA: Author, Centerfor Children & Families. from http://www.nccic.org/ccpartnerships/profiles.htm
Kiron, E. (2003). Blending early care and education funds: Issues, opportunities, and strategies(Res. Brief Vol. 1, No. 2). Newton, MA: Education Development Center, Inc. RetrievedMarch 3, 2004, from http://ccf.edc.org/PDF/EDC_FinBrief2.pdf
Long, S. K., Kirby, G. G., Kurka, R., & Waters, S. (1998). Child care assistance under welfarereform: Early responses by the states (Occasional Paper No. 15). Washington, DC: TheUrban Institute. Retrieved June 9, 2004, fromhttp://www.urban.org/UploadedPDF/occa15.pdf
Ontai, L. L., Hinrichs, S., Beard, M., & Wilcox, B. L. (2002). Improving child care quality inearly Head Start programs: A partnership model. Infant Mental Health Journal, 23(1–2),48–61.
Paulsell, D., Nogales, R., & Cohen, J. (2003). Quality child care for infants and toddlers: Casestudies of three community strategies. Executive summary. Retrieved July 23, 2003, fromhttp://www.mathematica-mpr.com/PDFs/qualchildhlth.pdf
Sandfort, J. R., & Selden, S. C. (2001). Blurring the boundaries: Local collaborations amongHead Start, preschool, and child care programs [Electronic version]. Policy & Practice,March, 18-23. Retrieved September 8, 2004, from http://www.lynchburg.edu/business/i-piece/Blurring.pdf
Schilder, D., Kiron, E., & Elliott, K. (2003). Early care and education partnerships: Stateactions and local lessons (Res. Brief Vol. 1, No. 1). Newton, MA: EducationDevelopment Center, Inc. Retrieved June 20, 2004, fromhttp://ccf.edc.org/PDF/EDC_ExecBrief.pdf
Schumacher, R., Irish, K., & Lombardi, J. (2003). Meeting great expectations: Integrating earlyeducation program standards in child care. Washington, DC: Center for Law and SocialPolicy. Retrieved September 8, 2005, fromhttp://www.clasp.org/publications/meeting_rpt.pdf
Shonkoff, J. P., & Phillips, D. A. (Eds.). (2000). From neurons to neighborhoods: The science ofearly childhood development. Washington, DC: National Academy Press.
Stoney, L., & Stanton, N. (2001). Child care and development fund: Report of state plans for theperiod 10/01/99 to 9/30/01. Washington, DC: U.S. Department of Health and HumanServices, Administration for Children and Families, Child Care Bureau. Retrieved July22, 2005, from http://www.nccic.org/pubs/CCDFStat.pdf
U.S. Department of Health and Human Services/Administration for Children and Families/ChildCare Bureau. (n.d.). Child Care and Development Fund fiscal year 2004 state spendingfrom all appropriation years. Retrieved September 8, 2005, fromhttp://www.acf.hhs.gov/programs/ccb/research/04acf696/overview.htm
U.S. Department of Health and Human Services/Administration for Children andFamilies/National Child Care Information Center. (n.d.). Child care: Funding and

Child Care/Head Start Partnership Study: Final Report 89
spending under federal block grants (CRS Report for Congress). Retrieved September 8,2005, from http://nccic.org/pubs/crsreport.pdf
U.S. Department of Health and Human Services/Administration for Children andFamilies/Project Team FACES. (2003). Head Start FACES 2000: A whole-childperspective on program performance. Fourth progress report. Washington, DC: U.S.Department of Health and Human Services/Administration for Children andFamilies/Administration on Children Youth and Families/Child Outcomes Research andEvaluation, Head Start Bureau.

Child Care/Head Start Partnership Study: Final Report 90
APPENDIX A: DIRECTOR SURVEY DATA
Table A1 Demographic Characteristics of Child Care Centers
Round 1(n=141)
Round 2(n=113)
Round 3(n=94)
Total(n=348)
Partnership Status (%) Partnership 55.3 (n=78) 41.6 (n=47) 42.6 (n=40) 47.4 (n=165) Comparison 41.6 (n=63) 58.4 (n=66) 57.4 (n=54) 52.6 (n=183)
Urbanicity (%) Urban 40.4 (n=57) 38.1 (n=43) 42.6 (n=40) 40.2 (n=140) Partnership 57.9 (n=33) 46.5 (n=20) 47.5 (n=19) 51.4 (n=72) Comparison 42.1 (n=24) 53.5 (n=23) 52.5 (n=21) 48.6 (n=68)
Suburban 44.0 (n=62) 45.1 (n=51) 40.3 (n=38) 43.4 (n=151) Partnership 53.2 (n=33) 35.3 (n=18) 36.8 (n=14) 43.0 (n=65) Comparison 46.8 (n=29) 64.7 (n=33) 63.2 (n=24) 57.0 (n=86)
Small Town 6.4 (n=9) 8.0 (n=9) 7.5 (n=7) 7.2 (n=25) Partnership 44.4 (n=4) 44.4 (n=4) 57.2 (n=4) 48.0 (n=12) Comparison 55.6 (n=5) 55.6 (n=5) 42.8 (n=3) 52.0 (n=13)
Rural 9.2 (n=13) 8.9 (n=10) 9.6 (n=9) 9.2 (n=32) Partnership 61.5 (n=8) 50.0 (n=5) 33.3 (n=3) 50.0 (n=16) Comparison 38.5 (n=5) 50.0 (n=5) 66.7 (n=6) 50.0 (n=16)
Table A2 Comparison of Enrollment and Budget
Partnership Comparisonn M (SD) n M (SD) t (df)
Average enrollment 164 32.81 (18.81) 180 30.84 (27.59) -0.78 (317)Total enrollmenta 87 38.17 (19.22) 120 38.78 (29.74) 0.18 (203)Number of classrooms
per center 165 2.32 (1.16) 182 2.31 (1.31) -0.04 (345)Child to teacher ratio 163 9.57 (2.59) 183 10.16 (2.88) 2.00* (344)Average annual budget 86 $416,414 ($685,891) 89 $339,402 ($375,231) -0.92 (131)
Note. Analysis performed on three rounds of data.aRound 2 and 3 data.*p < .05, **p < .01, ***p < .001.

Child Care/Head Start Partnership Study: Final Report 91
Table A3 Comparison of Organizational Type
Partnership Comparisonn % n % _2 (df)
For-Profit/Non-Profit Statusa
For-profit 45 57.69 40 64.52 0.64 (1)Non-profit 33 42.31 22 35.48
Faith-Based Statusa
Faith-based 11 14.10 15 24.19 2.33 (1)Non-faith-based 67 85.90 47 75.81
Note. Percentages calculated from non-missing values from three rounds of data.aRound 1 data only.*p < .05, **p < .01, ***p < .001.
Table A4 Comparison of Accreditation Status
Partnership Comparisonn % n % _2 (df)
Accreditation StatusAccredited 31 19.02 21 11.86 10.05** (2)Not accredited 89 54.60 126 71.19Seeking accreditation 43 26.38 30 16.95
Note. Percentages calculated from non-missing values from three rounds of data.aRound 1 data only.*p < .05, **p < .01, ***p < .001.

Child Care/Head Start Partnership Study: Final Report 92
Table A5 Organizational Capacity Indicators for Child Care Centers
Partnership Comparisonn % n % _2 (df)
Organizational chart/staffing plan 117 70.91 128 70.33 0.01 (1)
2001 / 2002 budgeta 50 64.10 44 70.97 0.74 (1)2003 / 2004 budgetb 28 70.00 36 66.67 0.12 (1)Staff handbook 161 97.58 172 94.51 2.11 (1)Salary scales 96 58.18 96 52.75 1.03 (1)Collective bargaining
agreement 12 7.27 12 6.63 0.06 (1)Strategic plan 67 40.61 68 37.78 0.29 (1)Enrollment and policy
information for parents 161 97.58 181 99.45 2.14 (1)Job descriptions 148 89.70 167 91.76 0.44 (1)Health insurance as a
benefit to staffc 55 63.22 71 59.66 0.27 (1)Current partnership with
Head Startc 82 94.25 18 15.13 125.97*** (1)
Note. Percentages calculated from non-missing values from three rounds of data.aRound 1 data only. bRound 3 data only. cRound 2 and 3 data.*p < .05, **p < .01, ***p < .001.

Child Care/Head Start Partnership Study: Final Report 93
Table A6 Director Reported Characteristics of Children Attending Child Care Centers
Partnership ComparisonCharacteristic (%) n M (SD) n M (SD) t (df)Race/Ethnicity
Black/AfricanAmerican 164 41.63 (37.02) 180 25.53 (28.40) -4.49*** (305)
Hispanic 163 2.61 (6.27) 177 4.19 (6.87) 2.19* (338)White 164 52.68 (36.61) 178 65.29 (30.30) 3.45*** (317)Asian 163 0.95 (2.04) 178 1.48 (3.57) 1.71 (286)Other 160 1.93 (4.61) 173 2.24 (7.41) 0.47 (291)
Preschoolersreceiving subsidy 154 54.03 (28.58) 171 47.38 (28.61) -2.10* (323)
Preschoolers withdisabilities 161 3.33 (6.65) 171 4.82 (13.84) 1.26 (248)
English as SecondLanguage 160 2.53 (8.90) 173 4.51 (11.26) 1.79 (323)
Preschoolers whoreceive FederalHead Starta 78 22.78 (28.52) 107 3.61 (10.13) -5.68*** (91.3)
Preschoolers whoreceive StateHead Starta 79 26.13 (28.13) 105 4.74 (14.55) -6.17*** (109)
Preschoolers whoattend 40+hours/wkb 36 68.55 (27.60) 52 60.90 (28.58) -1.25 (86)
Preschoolers whoattend 25–39hours/wk b 37 23.41 (24.43) 51 22.60 (23.88) -0.16 (86)
Preschoolers whoattend <25 hrs/wkb 37 5.00 (10.26) 52 13.72 (17.61) 2.94** (84.1)
Note. Analysis performed on three rounds of data.aRound 2 and 3. bRound 3 only.*p < .05, **p < .01, ***p < .001.

Child Care/Head Start Partnership Study: Final Report 94
Table A7 Teacher Turnover as Reported by Directors
Partnership Comparisonn M (SD) n M (SD) t (df)
Total TeacherTurnover 160 2.47 (3.42) 181 1.66 (2.11) 2.60* (258)
Of Teachers wholeft centers,percent who left:
Voluntarily 115 79.14 (30.44) 114 81.66 (31.64) 0.61 (227)Involuntarily 112 21.12 (30.70) 113 16.29 (30.48) -1.18 (223)
Note. Analysis performed on three rounds of data.*p < .05, **p < .01, ***p <.001.
Table A8 Differences in Parental Involvement Opportunities Offered by Centers Based on DirectorReports
Partnership ComparisonOpportunity n % n % _2 (df)Parent advisory committee 94 57.67 76 41.76 8.71** (1)Working with families on
goals for children 139 85.80 130 72.22 9.37** (1)Parent workshops 88 53.99 74 40.44 6.36* (1)Parents volunteering in
classroom 106 69.74 115 68.05 0.11 (1)Note. Percentages calculated from non-missing values from three rounds of data.*p < .05, **p < .01, ***p < .001.

Child Care/Head Start Partnership Study: Final Report 95
Table A9 Differences in Reports of Screenings, Referrals, and Services for Children Based on DirectorReports
Partnership ComparisonService n % n % _2 (df)Screenings
Vision screeninga 136 82.93 70 38.46 70.80*** (1)Hearing screeninga 131 79.88 57 31.49 81.23*** (1)Dental screeninga 88 54.66 24 13.26 66.31*** (1)Mental health observation
& assessmenta 109 68.13 68 37.78 31.26*** (1)
Developmental screeninga 142 86.06 94 52.51 44.86*** (1)Speech screeninga 127 77.44 74 41.34 45.97*** (1)Nutrition screeninga 66 40.74 27 15.25 27.60*** (1)Lead screeninga 65 40.37 31 17.13 22.80*** (1)
Referrals & ServicesMedical referralb 85 52.80 59 32.78 13.96*** (1)Dental referralb 82 50.62 37 20.56 33.96*** (1)Social service referralb 111 68.10 81 45.25 18.09*** (1)Mental health referralc 53 67.95 32 50.79 4.28* (1)Physical therapyb 52 32.70 29 16.11 12.78*** (1)Speech therapyb 110 67.48 63 34.81 36.63*** (1)Transportationd 4 10.26 11 20.37 1.71 (1)
Note. Percentages calculated from non-missing values from three rounds of data.aItem included in the calculation of the Child Screening Score.bItem included in the calculation of the Child Referral/Service Score.cRound 1 data only. dRound 3 data only.*p < .05, **p < .01, ***p < .001.

Child Care/Head Start Partnership Study: Final Report 96
Table A10 Differences in Parent Referrals and Services Based on Director Reports
Partnership ComparisonService n % n % _2 (df)
Social service referralsa 125 76.69 101 56.11 16.11*** (1)Medical referralsa 87 54.04 54 30.17 19.90*** (1)Mental health referralsa 99 61.88 66 36.67 21.55*** (1)GED preparationa 71 43.56 32 17.78 27.06*** (1)English proficiency classesa 41 25.15 11 6.11 24.12*** (1)Immigration servicesa 17 10.56 4 2.21 10.31** (1)Employment placementreferrala 63 38.89 30 16.67 21.27*** (1)
Adult literacya 57 35.19 16 8.89 35.12*** (1)Assistance obtaining FoodStampsa 73 45.06 49 27.37 11.58*** (1)
Assistance with financial aida 75 46.01 65 36.11 3.47 (1)Marriage counselinga 34 20.99 17 9.39 9.08** (1)Legal service referralsa 45 27.78 25 13.89 10.10** (1)Energy/fuel assistancea 63 38.89 34 18.89 16.79*** (1)Processes for working onfamily issues/goalsa 83 50.92 54 30.00 15.61*** (1)
Housing assistance orreferralb 37 47.44 23 37.10 1.51 (1)
Transportationc 6 15.38 6 11.11 0.37 (1)Note. Percentages calculated from non-missing values from three rounds of data.aItem included in the calculation of the Parent Referral/Service Score.bRound 1 only. cRound 3 only.*p < .05, **p < .01, ***p < .001.
Table A11 Comparison of Parent and Children Service Scores
Partnership (n = 165)
Comparison (n = 183)
Item M (SD) M (SD) t (df)
Child Screening Scorea 5.24 (2.34) 2.42 (2.28) -11.39*** (346)Child Referral/Service Scoreb 2.67 (1.76) 1.47 (1.60) -6.64*** (346)Parent Referral/ServiceScorec
5.65 (4.62) 3.05 (3.51) -5.88*** (305)
Note. Analysis performed on three rounds of data.aChild Screening Score is the total number of screenings offered to children (see Table A6). Maximum score = 8.bChild Referral/Service Score is the total number of referrals/services offered to children (see Table A6). Maximum score = 5.cParent Referral/Service Score is the total number of referrals/services offered to parents (see Table A7). Maximum score = 14.*p < .05, **p < .01, ***p < .001.

Child Care/Head Start Partnership Study: Final Report 97
Table A12 Summary of Logistic Regression Analysis for Partnership Duration Predicting DirectorReported Parent Services (n = 143)
Partnership DurationOutcome B SE B eB
Social service referrals 0.06 0.12 1.06Medical referrals 0.27 0.11 1.30*Mental health referrals 0.25 0.11 1.28*GED preparation 0.21 0.10 1.24*English proficiency classes 0.08 0.11 1.09Immigration services 0.14 0.14 1.15Employment placement
referrals 0.03 0.10 1.03
Adult literacy 0.09 0.10 1.10Assistance obtaining foodstamps
0.09 0.10 1.09
Assistance with financial aid 0.21 0.10 1.24*Marriage counseling -0.11 0.12 0.90Legal service referrals 0.12 0.10 1.13Energy/fuel assistance 0.21 0.10 1.23*Processes for working on familyissues and family goals
0.29 0.11 1.33**
Housing assistance orreferralsa
Transportationa -0.45 0.48 0.64Note. eB = exponentiated B.an = 69. bn = 31.*p < .05, **p < .01, ***p < .001.
Table A13 Comparison of Teacher Use of Child Assessments
Partnership Comparison
Assessment n % n % _2
High Scope COREa 3 7.50 4 7.69 <0.01Get it Got it Go!a 8 20.00 6 11.54 1.25
Galileob 51 58.62 17 14.53 43.65***Creative Curriculuma 13 32.50 9 17.31 2.87Center designed toolsb 40 45.98 80 68.38 10.34**Work samplesa 16 40.00 15 28.85 1.26No assessment toolsb 2 2.30 9 7.69 2.85
Note. Percentages calculated from non-missing values from three rounds of data.aRound 3 data only. bRound 2 and 3 data only.*p < .05, **p < .01, ***p < .001.

Child Care/Head Start Partnership Study: Final Report 98
Table A14 Comparison of Teacher Use of Classroom Assessments
Partnership Comparison
Assessment n % n % _2 (df)
ELLCOa 2 2.56 3 2.86 0.01 (1)ECERSb 3 9.68 3 7.50 0.11 (1)NAEYC Self-Studyb 22 70.97 14 35.00 9.04** (1)
Note. Percentages calculated from non-missing values from three rounds of data.ELLCO = Early Language and Literacy Classroom Observation.ECERS = Early Childhood Environment Ratings Scale.NAEYC = National Association for the Education of Young Children.aRound 2 and 3 data only. bRound 3 data only.*p < .05, **p < .01, ***p < .001.

Child Care/Head Start Partnership Study: Final Report 99
APPENDIX B: PARTNERSHIP SURVEY DATA
Table B1 Comparison of Urbanicity of Partnership Centers
Urbanicity (%)Round 1
(n=75)Round 2
(n=61)Round 3
(n=54)Total
(n=190)Urban 41.33 (n=31) 42.62 (n=26) 42.59 (n=23) 42.11 (n=80) Active 41.33 (n=31) 43.40 (n=23) 43.59 (n=17) 43.48 (n=71) Discontinued n/a 37.50 (n=3) 40.00 (n=6) 39.13 (n=9)Suburban 44.00 (n=33) 40.98 (n=25) 38.89 (n=21) 41.58 (n=79) Active 44.00 (n=33) 39.62 (n=21) 38.46 (n=15) 39.13 (n=69) Discontinued n/a 50.00 (n=4) 40.00 (n=6) 43.48 (n=10)Small Town 5.33 (n=4) 6.56 (n=4) 7.41 (n=4) 6.32 (n=12) Active 5.33 (n=4) 7.55 (n=4) 10.26 (n=4) 8.70 (n=12) Discontinued n/a 0.00 (n=0) 0.00 (n=0) 0.00 (n=0)Rural 9.33 (n=7) 9.84 (n=6) 11.11 (n=6) 10.00 (n=19) Active 9.33 (n=7) 9.43 (n=5) 7.69 (n=3) 8.70 (n=15) Discontinued n/a 12.50 (n=1) 20.00 (n=3) 17.39 (n=4)
Note. Percent based on partnership sub-sample. See Table A1 for urbanicity of total sample.
Table B2 Characteristics of Partnership
n M Median (SD)
Duration of partnership (years) 154 3.12 2.89 (1.80)How established is partnershipa 167 3.66 4.00 (1.22)Number of months spent planningpartnership
57 5.95 4.07 (6.70)
Number of meetings to developagreement
90 2.63 2.50 (1.55)
Number of children receiving HeadStart services
153 13.44 12.00 (8.39)
Percent of Head Start eligiblechildren who changed status overthe course of a year (fluctuation)
143 35.64 33.33 (23.58)
Note. Analysis performed on three rounds of non-missing data.aDirectors rated their perception of partnership establishment on a five-point scale where 1 = just forming, and 5 = fully established.

Child Care/Head Start Partnership Study: Final Report 100
Table B3 Characteristics of Partnership Agreement
n %Center has current agreement with Head Start 158 95.18Agreement was mutually developed by center and HeadStart partner
112 70.44
Agreement is regularly updated 149 96.13Agreement is updated annually 136 92.52Agreement specifies maximum number of children toreceive Head Start services
114 76.00
Agreement has document describing roles andresponsibilities of center and Head Start partner
149 93.13
Agreement has document describing partnership’s goals 134 83.75Agreement has document describing how to meet HeadStart performance standards
126 75.90
Agreement has document describing communicationwith partner
120 76.92
Agreement has process for recruiting and enrollingHead Start children
127 77.44
Note. Percentages calculated from non-missing values from three rounds of data.
Table B4 Methods of Head Start Service Delivery
Head Start enhanced services are deliveredto children. . . n %
In a separate Head Start classroom 4 10.26In a mixed classroom 37 94.87At Head Start sites with transportationprovided 2 5.13
By center teachers at the Head Start site 2 5.13Note. Percentages calculated from non-missing values from round three data. Percent sum is greater than 100 because some centersuse multiple methods.
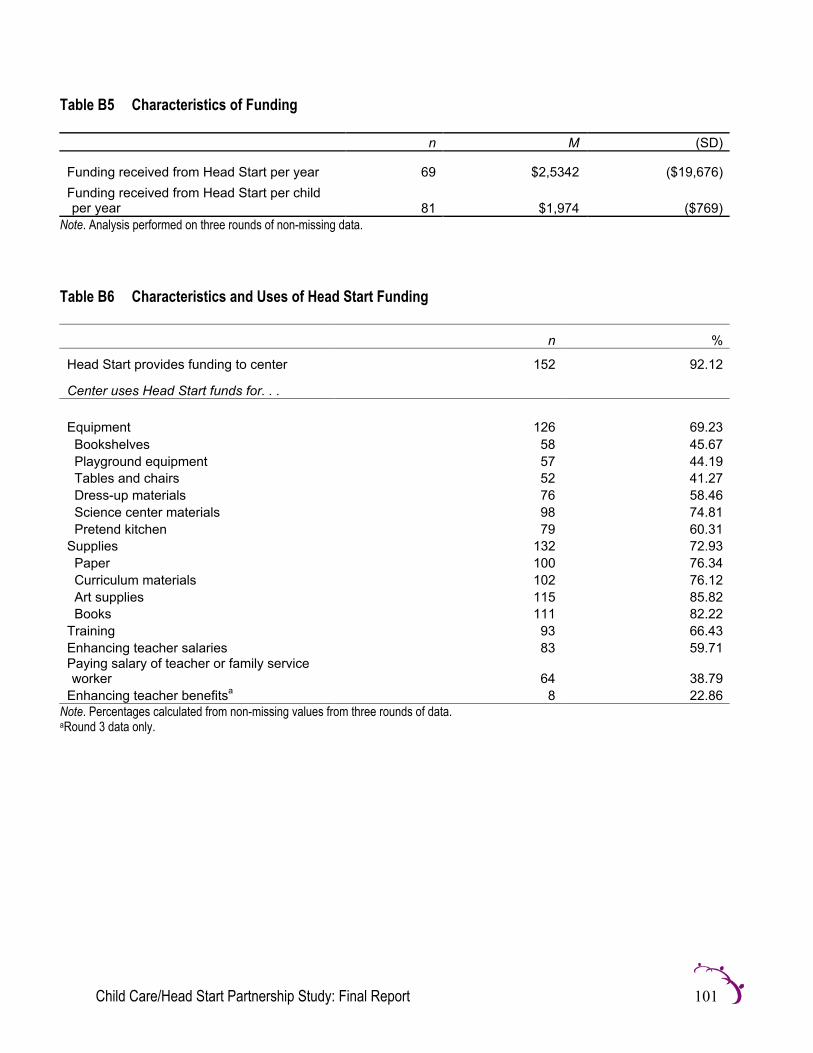
Child Care/Head Start Partnership Study: Final Report 101
Table B5 Characteristics of Funding
n M (SD)
Funding received from Head Start per year 69 $2,5342 ($19,676)Funding received from Head Start per childper year 81 $1,974 ($769)
Note. Analysis performed on three rounds of non-missing data.
Table B6 Characteristics and Uses of Head Start Funding
n %
Head Start provides funding to center 152 92.12
Center uses Head Start funds for. . .
Equipment 126 69.23 Bookshelves 58 45.67 Playground equipment 57 44.19 Tables and chairs 52 41.27 Dress-up materials 76 58.46 Science center materials 98 74.81 Pretend kitchen 79 60.31Supplies 132 72.93 Paper 100 76.34 Curriculum materials 102 76.12 Art supplies 115 85.82 Books 111 82.22Training 93 66.43Enhancing teacher salaries 83 59.71Paying salary of teacher or family serviceworker 64 38.79
Enhancing teacher benefitsa 8 22.86Note. Percentages calculated from non-missing values from three rounds of data.aRound 3 data only.

Child Care/Head Start Partnership Study: Final Report 102
Table B7 Materials and Services that Head Start Provides to Center
Head Start provides. . . n %
Equipmenta 36 50.00 Bookshelves 43 33.86 Playground equipment 20 15.87 Tables and chairs 35 27.78 Dress-up materials 30 23.81 Science center materials 49 39.20 Pretend kitchen 31 24.80
Suppliesa 46 64.79 Paper 67 49.26 Curriculum materials 69 50.74 Art supplies 70 51.09 Books 80 59.70
Note. Percentages calculated from non-missing values from three rounds of data.aRound 1 data only.
Table B8 Characteristics of Head Start Training
Head Start provides. . . n %
Training 121 75.63
Trainings conveniently offered 81 62.31
CPR traininga 26 50.98
Literacy traininga 26 53.06
Parent involvement traininga 30 60.00Training on Head Start performancestandardsa 28 56.00
College courses or CDA classesa 19 38.00
All trainings offered to Head Start staff 83 59.71
Note. Percentages calculated from non-missing values from three rounds of data.aRound 1 data only.

Child Care/Head Start Partnership Study: Final Report 103
Appendix C: TEACHER SURVEY DATA
Table C1 Comparison of Urbanicity of Child Care Parents
Urbanicity (%)Round 1(n=154)
Round 2(n=149)
Round 3(n=104)
Total(n=407)
Urban 35.06 (n=54) 35.57 (n=53) 38.46 (n=40) 36.12 (n=147) Partnership 35.29 (n=36) 40.85 (n=29) 32.65 (n=16) 36.49 (n=81) Comparison 34.62 (n=18) 30.77 (n=24) 43.64 (n=24) 35.68 (n=66)Suburban 38.96 (n=60) 42.28 (n=63) 43.27 (n=45) 41.28 (n=168) Partnership 38.24 (n=39) 38.03 (n=27) 51.02 (n=25) 40.99 (n=91) Comparison 40.38 (n=21) 46.15 (n=36) 36.36 (n=20) 41.62 (n=77)Small Town 14.29 (n=22) 10.07 (n=15) 12.50 (n=13) 12.29 (n=50) Partnership 13.73 (n=14) 9.86 (n=7) 10.20 (n=5) 11.71 (n=26) Comparison 15.38 (n=8) 10.26 (n=8) 14.55 (n=8) 12.97 (n=24)Rural 11.69 (n=18) 12.08 (n=18) 5.77 (n=6) 10.32 (n=42) Partnership 12.75 (n=13) 11.27 (n=8) 6.12 (n=3) 10.81 (n=24) Comparison 9.62 (n=5) 12.82 (n=10) 5.45 (n=3) 9.73 (n=18)
Table C2 Comparison of Teacher Job Characteristics
Partnership Comparison
Item n M (SD) n M (SD) t (df)
Hours worked per day 220 7.70 (1.28) 184 7.56 (1.50) -1.00 (362)Days worked per weeka 118 4.95 (0.43) 131 4.89 (0.48) -0.96 (247)Hours worked per weeka 118 37.72 (7.91) 131 37.19 (7.29) -0.55 (247)Weeks worked per year 200 49.62 (5.91) 168 48.46 (6.66) -1.77 (366)Classrooms taught 218 1.24 (0.52) 178 1.17 (0.44) -1.44 (394)Preschoolers taught inclassroom 213 15.16 (7.17) 180 14.96 (6.59) -0.22 (391)
Preschoolers receiving HeadStart servicesb 40 5.75 (3.70) 10 2.80 (1.81) -3.60** (30)
Note. Analysis performed on three rounds of data.aRound 2 and 3 data. bRound 3 data.*p < .05, **p < .01, ***p < .001.

Child Care/Head Start Partnership Study: Final Report 104
Table C3 Percentage of Teachers at Partnering and Comparison Centers Receiving Specific EmployeeBenefits
Partnership ComparisonBenefit n % n % X2 (df)
Paid vacationa 170 77.98 125 71.84 1.96 (1)Paid sick leavea 124 60.19 79 46.75 6.76** (1)Paid maternity leavea 40 22.35 24 15.89 1.02 (1)Paid family leavea 40 22.73 16 11.03 7.55** (1)Paid health insurancea 83 39.34 61 36.97 0.22 (1)Paid dental insurancea 59 28.37 32 19.75 3.64 (1)Tuition reimbursementa 67 35.08 24 15.79 16.16*** (1)Retirement plana 93 46.73 39 25.16 17.34*** (1)Release time for traininga 115 58.67 66 44.59 6.70** (1)Note. Percentages calculated from non-missing values from three rounds of data. aItem included in the calculation of the Teacher Benefits Score.*p < .05, **p < .01, ***p < .001.
Table C4 Logistic Regression for Relationship Between Partnership Duration and Teacher Benefits(n = 143)
Partnership Duration
Outcome n B SE B eB
Paid vacation 196 -0.14 0.10 0.87Paid sick leave 186 0.14 0.09 1.15Paid maternity leave 160 0.42 0.12 1.52***Paid family leave 157 0.43 0.12 1.54***Paid health insurance 190 0.16 0.09 1.17Paid dental insurance 188 0.23 0.10 1.26*Tuition reimbursement 171 0.23 0.10 1.26*Retirement plan 178 0.33 0.10 1.40***Release time for training 178 0.23 0.10 1.26*
Note. eB = exponentiated B.*p < .05, **p < .01, ***p < .001.
Table C5 Comparison of Teacher Benefits Score
Partnership ComparisonItem n M (SD) n M (SD) t (df)
Teacher benefits scorea 222 3.56 (2.65) 185 2.52 (2.23) -4.29*** (405)Note. Analysis performed on three rounds of data.aTeacher benefits score is the total number of benefits received (see Table C3). Maximum score = 9.*p < .05, **p < .01, ***p < .001.

Child Care/Head Start Partnership Study: Final Report 105
Table C6 Comparison of Levels of Teacher Education
Partnership ComparisonEducational Attainment n % n % _2 (df)
CDA credentiala 13 31.71 8 16.00 4.11 (1)High school diploma 91 41.55 81 44.75 0.41 (1)Trade license or certificate 31 14.16 17 9.39 2.13 (1)Associate’s in early childhood 45 20.55 39 21.55 0.06 (1)Associate’s in another field 12 5.48 9 4.97 0.05 (1)Bachelor’s in early childhood 17 7.76 10 5.52 0.79 (1)Bachelor’s in another field 19 8.68 22 12.15 1.30 (1)Graduate degree in early childhood 1 0.46 0 0.00 0.83 (1)Graduate degree in another field 3 1.37 3 1.66 0.06 (1)
Note. Percentages calculated from non-missing values from three rounds of data.aRound 3 data only.*p < .05, **p < .01, ***p < .001.
Table C7 Comparison of Hours of Teacher Professional Development Received
Partnership ComparisonItem n M (SD) n M (SD) t (df)Hours of professionaldevelopment received inthe past year 180 29.27 (37.55) 162 20.18 (30.46) -2.47* (336)
Note. Analysis performed on three rounds of data. *p < .05, **p < .01, ***p < .001.
Table C8 Comparison of Types of Teacher Professional Development Received
Partnership ComparisonProfessional Development n % n % _2 (df)
Onsite workshops 137 68.84 105 63.25 1.27 (1)
Offsite workshops 182 87.08 116 68.64 19.05*** (1)
College courses 75 41.21 54 33.75 2.02 (1)Note. Percentages calculated from non-missing values from three rounds of data.*p < .05, **p < .01, ***p < .001.

Child Care/Head Start Partnership Study: Final Report 106
Table C9 Comparison of Teacher Perceptions of Training
Partnership Comparison
Teacher Perception of. . . n M (SD) n M (SD) t (df)
Training is effective 218 3.40 (0.53) 181 3.28 (0.61) -2.24* (397)Satisfaction with amount oftraining 216 2.97 (0.77) 180 2.92 (0.77) -0.65 (394)
Confidence in abilities, notraining necessary 217 2.12 (0.77) 181 2.26 (0.79) 1.84 (396)
Note. Analysis performed on three rounds of data. Teachers were asked to rate their level of agreement on a four-point scale where 1 =strongly disagree, and 4 = strongly agree. *p < .05, **p < .01, ***p < .001.
Table C10 Linear Regression Analysis for the Relationship Between Partnership Duration and Teachers’Perception of the Effectiveness of Training
Partnership DurationOutcome df (model, error) B SE B FTeacher perception of
effectiveness of training (1,194) 0.06 0.02 7.10**Note. r2 = 0.04.*p < .05, **p < .01, ***p < .001.
Table C11 Comparison of Teachers in Each Category of “View of Job”
Partnership ComparisonPerception of Job n % n % _2 (df)
Chosen occupation 150 70.42 122 67.78 0.32 (1)Stepping stone to related field 33 15.49 30 16.67 0.10 (1)Stepping stone to K–12 36 16.90 23 12.78 1.30 (1)Entry level job at this organization 4 1.88 2 1.11 0.38 (1)Temporary employment 5 2.35 2 1.11 0.85 (1)
Note. Percentages calculated from non-missing values from three rounds of data.*p < .05, **p < .01, ***p < .001.
Table C12 Comparison of Teacher Experience
Partnership Comparison
Item n M (SD) n M (SD) t (df)Experience in child care(months) 215 93.58 (87.02) 181 85.75 (74.38) -0.96 (394)
Length of employment atcenter (months) 220 60.24 (71.03) 182 54.60 (56.03) -0.89 (399)
Note. Analysis performed on three rounds of data.*p < .05, **p < .01, ***p < .001.

Child Care/Head Start Partnership Study: Final Report 107
Table C13 Comparison of Teacher Use of Curriculum
Partnership ComparisonCurriculum n % n % _2 (df)
No curriculum 5 2.30 14 7.82 6.54* (1)Teacher designed 103 47.47 124 69.27 19.07*** (1)Creative Curriculum 63 29.03 36 20.11 4.16* (1)High Scope 21 9.68 3 1.68 11.03*** (1)Heads Up Reading 6 2.76 5 2.79 <0.01 (1)First Connections 2 0.92 1 0.56 0.17 (1)High Reacha 8 6.90 10 7.87 0.08 (1)West Eda 0 -- 0 -- -- (1)Montessoria 5 4.31 1 0.79 3.12 (1)Bright Beginningsa 1 0.86 7 5.51 4.12* (1)Step Curriculumb 4 3.96 1 1.92 0.45 (1)Galileob 34 33.66 1 1.92 19.60*** (1)Other 50 23.04 35 19.55 0.71 (1)
Note. Percentages calculated from non-missing values from three rounds of data.aRound 2 and 3 data only. bRound 1 data only.*p < .05, **p < .01, ***p < .001.
Table C14 Comparison of Teacher’s Reports of Classroom Activities
Partnership Comparison
Classroom Activity. . . n M (SD) n M (SD) t (df)
Read to children 219 3.81 (0.44) 185 3.76 (0.46) -1.13 (402)Use structuredcurriculum 213 3.54 (0.80) 183 3.35 (0.97) -2.15* (354)
Review letters or words 219 3.64 (0.58) 184 3.68 (0.59) 0.61 (401)Review names of colors 219 3.63 (0.57) 185 3.56 (0.61) -1.25 (402)Review number conceptsor count 221 3.68 (0.52) 184 3.72 (0.53) 0.76 (403)
Give children sciencematerials 220 3.37 (0.74) 185 3.25 (0.78) -1.51 (403)
Give time in different playactivities 220 3.91 (0.30) 185 3.90 (0.35) -0.20 (403)
Give supply of ageappropriate toys 221 3.88 (0.40) 185 3.88 (0.37) -0.03 (404)
Give time outside 220 3.87 (0.40) 184 3.82 (0.50) -1.04 (350)Give art supplies 220 3.85 (0.46) 185 3.81 (0.45) -0.98 (403)Total scorea 221 36.90 (3.21) 185 36.64 (3.54) -0.77 (404)
Note. Teachers evaluated item based on a four-point scale where 1 = never, and 4 = always.aMinimum = 10, Maximum = 40. *p < .05, **p < .01, ***p < .001.

Child Care/Head Start Partnership Study: Final Report 108
Table C15 Comparison of Teachers’ Reports of Parent Involvement Activities
Partnership ComparisonParent InvolvementActivity n M (SD) n M (SD) t (df)
Greet each parent 219 3.81 (0.47 184 3.80 (0.51) -0.29 (401)Involve parents inlearning activities 215 3.30 (0.73) 184 3.23 (0.78) -0.97 (397)
Meet with parents todiscuss child’s progress 215 3.03 (0.87) 181 2.84 (0.88) -2.19* (394)
Send home writtencommunication toparents 216 3.10 (0.91) 182 3.16 (0.86) 0.64 (396)
Parents participate ashelpers in classroom 217 2.17 (0.84) 180 1.94 (0.78) -2.69** (395)
Total scorea 209 15.44 (2.50) 175 14.97 (2.60) -1.79 (382)Note. Teachers evaluated item based on a four-point scale where 1 = never, and 4 = always.aMinimum = 5, Maximum = 20.*p < .05, **p < .01, ***p < .001.
Table C16 Comparison of Teachers’ Reports of Administrator Supervision Activities
Partnership ComparisonParent InvolvementActivity n M (SD) n M (SD) t (df)Receive guidance fromdirector 213 3.33 (0.83) 179 3.13 (0.91) -2.33* (390)
Observe in classroom toassess practice 215 2.49 (0.95) 182 2.43 (0.91) -0.58 (395)
Meet with teacher to givefeedback regardingclassroom teachingpractice 214 2.63 (0.83) 179 2.47 (0.94) -1.69 (391)
Discuss how to linkcurriculum to children’sdevelopmental needs 214 2.58 (0.91) 180 2.42 (0.97) -1.71 (392)
Discuss strategies fordevelopmentallyappropriate teachingpractice 215 2.62 (0.93) 177 2.49 (0.98) -1.36 (390)
Discuss strategies toensure a literacy-richcurriculum 213 2.57 (0.92) 177 2.34 (0.97) -2.44* (388)
Review teaching plans 212 2.44 (0.93) 177 2.34 (1.05) -1.03 (387)Total scorea 202 18.76 (5.34) 170 17.64 (5.81) -1.95 (370)
Note. Teachers evaluated item based on a four-point scale where 1 = never and 4 = always.aMinimum = 7, Maximum = 28.*p < .05, **p < .01, ***p < .001.

Child Care/Head Start Partnership Study: Final Report 109
APPENDIX D: PARENT SURVEY DATA
Table D1 Comparison of the Urbanicity of Child Care Parents
Urbanicity (%)Round 1(n=737)
Round 2(n=699)
Round 3(n=254)
Total(n=1690)
Urban 34.87 (n=257) 30.04 (n=210) 39.37 (n=100) 33.55 (n=567)
Partnership 40.48 (n=168) 31.13 (n=99) 28.57 (n=38) 35.22 (n=305)
Comparison 27.64 (n=89) 29.13 (n=111) 51.24 (n=62) 31.80 (n=262)
Suburban 41.79 (n=308) 44.92 (n=341) 33.86 (n=86) 41.89 (n=708)
Partnership 37.11 (n=154) 35.53 (n=113) 43.61 (n=58) 37.53 (n=325)
Comparison 47.83 (n=154) 52.76 (n=201) 23.14 (n=28) 46.48 (n=383)
Small Town 12.48 (n=92) 15.74 (n=110) 16.14 (n=41) 14.38 (n=243)
Partnership 10.60 (n=44) 17.92 (n=57) 16.54 (n=22) 14.20 (n=123)
Comparison 14.91 (n=48) 13.91 (n=53) 15.70 (n=19) 14.56 (n=120)
Rural 10.85 (n=80) 9.30 (n=65) 10.63 (n=27) 10.18 (n=172)
Partnership 11.81 (n=49) 15.41 (n=49) 11.28 (n=15) 13.05 (n=113)
Comparison 9.63 (n=31) 4.20 (n=16) 9.92 (n=12) 7.16 (n=59)

Child Care/Head Start Partnership Study: Final Report 110
Table D2 Comparison of Parent Demographic Characteristics
Partnership ComparisonCharacteristic n % n % _2 (df)Respondent’s Relation to Child 0.93 (4)
Mother 779 92.52 746 91.76Father 38 4.51 37 4.55Grandparent 15 1.78 20 2.46Guardian 5 0.59 5 0.62Other 5 0.59 5 0.62
Respondent’s Race/Ethnicity 62.19** (4)Asian 5 0.59 3 0.37Black/African American 157 18.41 47 5.80Hispanic 12 1.41 13 1.60White 658 77.14 724 89.27Other 21 2.46 24 2.96
Parent marital status 38.79*** (5)Single 244 28.60 133 16.32Living with partner 34 3.99 33 4.05Married 461 54.04 538 66.01Divorced/Separated 96 11.25 96 11.78Widowed 6 0.70 3 0.37Other 12 1.41 12 1.47
Parent Education 37.72*** (5)No diploma 32 3.74 20 2.46High school diploma/GED 345 40.35 258 31.70Trade license/certificate 142 16.61 122 14.99Associate’s degree 140 16.37 127 15.60Bachelor’s degree 124 14.50 207 25.43Graduate degree 72 8.42 80 9.83
Parents enrolled in school orjob training 201 23.67 122 14.91 20.47*** (1)
Parent speaks language otherthan English 42 5.02 48 5.93 0.66 (1)
Parent has child with IEP 80 9.60 40 4.98 12.90*** (1)Note. Percentages calculated from non-missing values from three rounds of data.*p < .05, **p < .01, ***p < .001.

Child Care/Head Start Partnership Study: Final Report 111
Table D3 Comparison of Parents’ Monthly Income
Partnership ComparisonIncome Level (dollars/month) n % n % _2 (df)
< 250 13 1.59 11 1.45 0.05 (1)250 – 499 36 4.39 25 3.29 1.28 (1)500 – 999 91 11.10 52 6.85 8.63** (1)1,000 – 1,499 141 17.20 95 12.52 6.79** (1)1,500 – 1,999 111 13.54 90 11.86 1.00 (1)2,000 – 2,499 90 10.98 78 10.28 0.20 (1)> 2500 338 41.22 408 53.75 24.85*** (1)2,500 – 2,999a 38 9.09 43 9.49 0.04 (1)3,000 – 3,499a 34 8.13 44 9.71 0.66 (1)> 3,500a 116 27.75 161 35.54 6.08* (1)3,500 – 3,999b 11 9.17 7 6.48 0.56 (1)4,000 – 4,499b 6 5.00 5 4.63 0.02 (1)4,500 – 4,999b 2 4.67 7 6.48 3.48 (1)> 5,000b 23 19.17 21 19.44 < 0.01 (1)
Note. Percentages calculated from non-missing values from three rounds of data.aRound 2 and 3 data only. bRound 3 data only.*p < .05, **p < .01, ***p < .001.
Table D4 Comparison of Parents’ Payment Method for Child Care
Partnership ComparisonMethod of Payment n % n % _2 (df)
Employer 18 2.14 25 3.09 1.46 (1)Head Start 44 5.24 8 0.99 24.41*** (1)Child care subsidy 293 34.84 189 23.36 26.27*** (1)Parent & familya 332 83.00 293 92.43 14.06*** (1)Parent/guardianb 369 83.67 425 86.38 1.35 (1)Parent’s familyb 13 2.95 19 3.86 0.58 (1)Other 33 3.92 28 3.46 0.25 (1)
Note. Percentages calculated from non-missing values from three rounds of data.aRound 1 data only. bRound 2 and 3 data only.*p < .05, **p < .01, ***p < .001.

Child Care/Head Start Partnership Study: Final Report 112
Table D5 Comparison of Parents’ Employment Status
Partnership ComparisonItem n M (SD) n M (SD) t (df)
Number of jobs worked 761 1.08 (0.29) 710 1.06 (0.26) -0.99 (1,468)Hours worked per week 757 37.08 (10.58) 704 37.00 (0.40) -0.13 (1,459)
Note. Analysis performed on three rounds of data.*p < .05, **p < .01, ***p < .001.
Table D6 Comparison of Time Spent in Child Care
Partnership Comparison
Item n M (SD) n M (SD) t (df)
Hours per day child attends 836 7.79 (1.90) 806 7.07 (2.46) -6.59*** (1,513)Days per week child attends 833 4.38 (1.01) 808 4.11 (1.12) -5.31*** (1,610)
Note. Analysis performed on three rounds of data.*p < .05, **p < .01, ***p < .001.
Table D7 Comparison of Enrollment in Centers with Religious Affiliation
Partnership Comparisonn % n % _2 (df)
Parents with children enrolledat centers with religiousaffiliation 169 19.52 247 29.98 24.90*** (1)
Note. Percentages calculated from non-missing values from three rounds of data.*p < .05, **p < .01, ***p < .001.

Child Care/Head Start Partnership Study: Final Report 113
Table D8 Comparison of Parents’ Reasons for Selecting Child Care Center
Partnership ComparisonReason n % n % _2 (df)Center is close to home 477 55.53 489 59.93 3.31 (1)Center has good teachers 460 53.55 525 64.34 20.10*** (1)Center accepts subsidies 157 18.28 111 13.60 6.80** (1)Center is affordable 245 28.52 196 24.02 4.37* (1)Center had opening for child 288 33.53 234 28.68 4.59* (1)Center provides quality care 587 68.41 622 76.32 13.03*** (1)Center is close to worka 159 35.57 156 31.39 1.85 (1)Center provides Head Start
servicesa 81 18.12 29 5.84 34.51*** (1)Note. Percentages calculated from non-missing values from three rounds of data.aRound 2 and 3 data only.*p < .05, **p < .01, ***p < .001.
Table D9 Comparison of Parents’ Self-Reported Involvement in Center
Partnership ComparisonActivity n % n % _2 (df)Process for working on goalsfor preschoolersa 74 63.79 27 68.27 0.49 (1)
Process for working on goalsfor familiesa 37 34.26 20 20.00 5.31* (1)
Opportunity to participate onparent advisory committee 69 8.09 30 3.73 13.99*** (1)
Note. Percentages calculated from non-missing values from three rounds of data.aRound 3 data only.*p < .05, **p < .01, ***p < .001.
Table D10 Comparison of Parents Volunteering in the Classroom
Partnership Comparison
Item n M (SD) n M (SD) t (df)Number of times parentsvolunteer in the classroom(per year) 748 3.12 (18.47) 772 1.44 (10.44) -2.15* (1,189)
Note. Analysis performed on three rounds of data.*p < .05, **p < .01, ***p < .001.

Child Care/Head Start Partnership Study: Final Report 114
Table D11 Differences in Reports of Child Services Based on Parent Reports
Partnership ComparisonItem n % n % _2 (df)Vision screeninga 332 58.66 130 27.48 101.40*** (1)Hearing screeninga 358 61.94 158 32.24 93.63*** (1)Speech screeninga 378 66.90 208 40.86 73.23*** (1)Dental screeninga 263 47.30 104 21.85 72.50*** (1)Health screeninga 299 54.66 170 34.14 44.39*** (1)Developmental screeninga 582 85.71 488 78.84 10.58** (1)Health servicesa 140 27.08 44 9.07 54.13*** (1)Speech therapya 128 28.07 36 7.95 62.23*** (1)Physical therapya 72 16.33 16 3.44 42.85*** (1)Head Start services 514 83.17 128 28.57 323.22*** (1)Nutrition screeningb 27 42.19 18 30.51 1.80 (1)Lead screeningb 17 26.98 11 18.64 1.20 (1)Transportationb 35 35.35 36 36.73 0.04 (1)
Note. Percentages calculated from non-missing values from three rounds of data.aItem included in the calculation of the Child Services Score. bRound 3 data only.*p < .05, **p < .01, ***p < .001.
Table D12 Comparison of Child Services Score
Partnership Comparison
Item n M (SD) n M (SD) t (df)
Child Services Scorea 865 2.95 (2.68) 824 1.64 (1.81) -11.77*** (1,524)Note. Analysis performed on three rounds of data.aChild Services Score is the total number of services received (see Table D11). Maximum score = 9.*p < .05, **p < .01, ***p < .001.
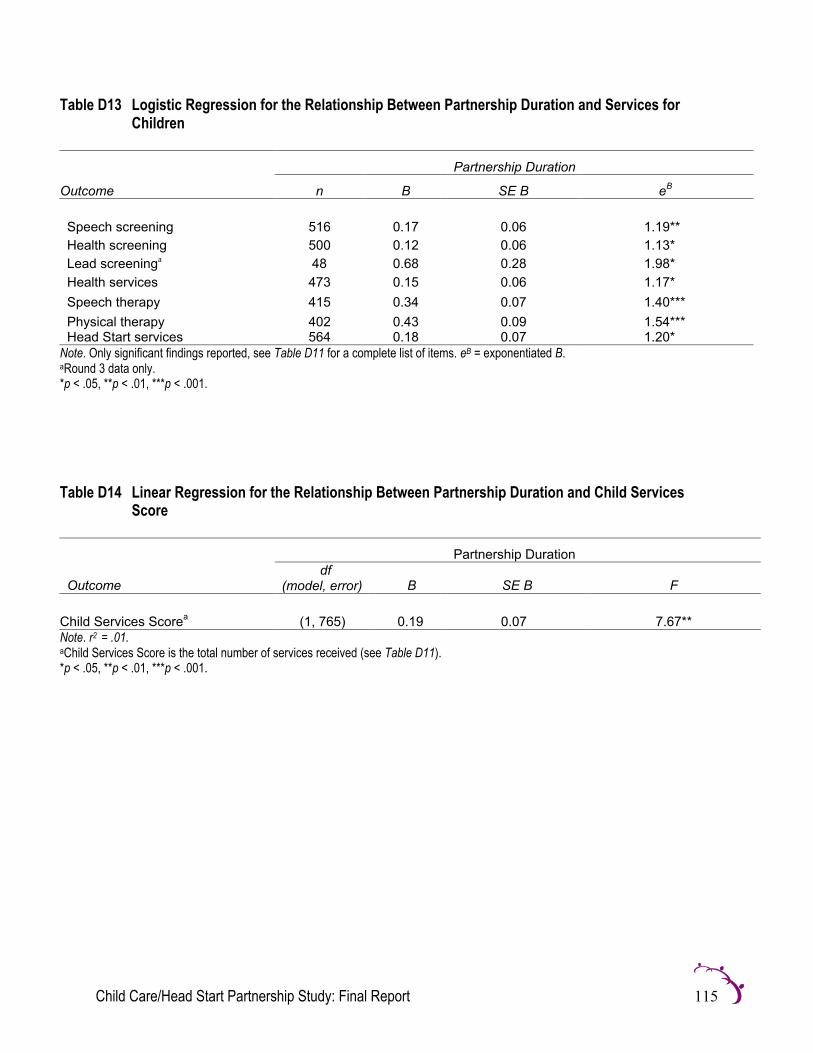
Child Care/Head Start Partnership Study: Final Report 115
Table D13 Logistic Regression for the Relationship Between Partnership Duration and Services forChildren
Partnership Duration
Outcome n B SE B eB
Speech screening 516 0.17 0.06 1.19**Health screening 500 0.12 0.06 1.13*Lead screeninga 48 0.68 0.28 1.98*Health services 473 0.15 0.06 1.17*Speech therapy 415 0.34 0.07 1.40***Physical therapy 402 0.43 0.09 1.54***Head Start services 564 0.18 0.07 1.20*
Note. Only significant findings reported, see Table D11 for a complete list of items. eB = exponentiated B.aRound 3 data only.*p < .05, **p < .01, ***p < .001.
Table D14 Linear Regression for the Relationship Between Partnership Duration and Child ServicesScore
Partnership Duration
Outcomedf
(model, error) B SE B F
Child Services Scorea (1, 765) 0.19 0.07 7.67**Note. r2 = .01.aChild Services Score is the total number of services received (see Table D11).*p < .05, **p < .01, ***p < .001.

Child Care/Head Start Partnership Study: Final Report 116
Table D15 Differences in Reports of Parent Referrals/Services Based on Parent Reports
Partnership ComparisonItem n % n % _2 (df)Information about health careservicesa 347 47.21 222 31.14 39.20*** (1)
Information about Head Starta 476 61.98 169 24.14 212.84*** (1)Information about mentalhealth servicesa 205 29.20 105 15.20 39.49*** (1)
Information about Englishclassesa 70 10.70 46 6.86 6.14* (1)
Information about adulteducation or traininga 203 29.81 80 11.80 66.84*** (1)
Information about GEDpreparationa 113 17.17 31 4.67 53.24*** (1)
Information aboutemployment servicesa 109 16.37 36 5.30 42.79*** (1)
Information about immigrationservicesa 46 7.13 16 2.42 16.07*** (1)
Information about FoodStampsa 119 17.92 52 7.80 30.47*** (1)
Information about financialaida 174 25.59 88 13.00 34.51*** (1)
Information about housingassistancea 109 16.37 26 3.89 57.05*** (1)
Information on parentinga 469 61.39 358 48.84 23.82*** (1)Information on healthymarriagea 94 13.99 93 13.40 0.10 (1)
Information about socialservicesb 121 27.94 82 17.08 15.53*** (1)
Information about legalservicesc 15 11.72 6 5.17 3.32 (1)
Information about energy/fuelassistancec 23 18.11 7 6.09 8.03** (1)
Information about dentalservicesc 39 30.71 21 18.10 5.18* (1)
Transportationc 30 23.44 33 28.21 0.72 (1)Note. Percentages calculated from non-missing values from three rounds of data.aItem included in the calculation of the Parent Services Score. bRound 2 and 3 data only. cRound 3 data only.*p < .05, **p < .01, ***p < .001.

Child Care/Head Start Partnership Study: Final Report 117
Table D16 Comparison of Parent Services Score
Partnership Comparison
Item n M (SD) n M (SD) t (df)
Parent Services Scorea 824 3.08 (3.37) 775 1.71 (2.43) -9.36*** (1,497)Note. Analysis performed on three rounds of data.aParent Services Score is the total number of services received (see Table D15). Maximum score = 13.*p < .05, **p < .01, ***p < .001.
Table D17 Logistic Regression for the Relationship Between Partnership Duration and Services forParents
Partnership Duration
Outcome n B SE B eB
Information about adult educationor training 620 0.14 0.06 1.15*
Information about financial aid forschool 620 0.15 0.06 1.16*
Information about parenting 695 0.11 0.05 1.12*Note. Only significant findings reported, see Table D15 for a complete list of items. eB = exponentiated B.*p < .05, **p < .01, ***p < .001.
Table D18 Linear Regression for the Relationship Between Partnership Duration and Parent ServicesScore
Partnership Duration
Outcomedf
(model,error) B SE B F
Parent Services Scorea (1, 751) 0.28 0.08 12.87***Note. r2 = .02.aParent Services Score is the total number of services received (see Table D15). Maximum score = 13.*p < .05, **p < .01, ***p < .001.

Child Care/Head Start Partnership Study: Final Report 118
Table D19 Comparison of Parent Perceptions of Accessibility and Satisfaction of Services and OverallSatisfaction with Center
Partnership Comparison
Item n M (SD) n M (SD) t (df)Parents’ rating of how easyit is to obtain servicesa 745 3.08 (0.84) 632 2.90 (0.91) -3.83*** (1,297)
Parents’ rating of theirsatisfaction with thequality of servicesa 763 3.55 (0.68) 642 3.52 (0.73) -0.70 (1,403)
Parents’ rating of overallquality of child carecenterb 841 3.59 (0.58) 812 3.69 (0.53) 3.67*** (1,647)
Note. Analysis performed on three rounds of data.aParents rated each item on a four-point scale where 1 = not very, and 4 = very. bParents rated this item on a four-point scale where 1 =poor, and 4 = excellent.*p < .05, **p < .01, ***p < .001.

Child Care/Head Start Partnership Study: Final Report 119
GLOSSARY
ACF (Administration for Children and Families): The branch of the U.S. Department of Health andHuman Services that administers federally funded Child Care, Head Start, Community Services,Temporary Assistance for Needy Families (TANF), and Child Support programs. ACF programsare administered through 12 regional offices across the country.
Child Care and Development Fund (CCDF): Funding from the federal Department of Health andHuman Services/ACF/Child Care Bureau, integrating multiple funding sources for child careactivities across the country. CCDF programs provide services to children and help eligiblefamilies (low-income families, families receiving TANF, and those transitioning from publicassistance) obtain child care in order to work or attend trainings/school. In addition, services maybe provided to children in need of protective services. CCDF makes funds available throughblock grants to states, territories, and federally recognized tribes. Subsidized child care servicesare available to eligible families through child care certificates/vouchers or contracts withproviders. States determine eligibility for CCDF services within federal limits and also setpayment rates for providers and sliding fee scales that determine parent fees. States must ensurethat low-income parents have equal access to providers and the same selection of providers asnon-subsidized parents.
Child Care Bureau: A division of ACF, U.S. Department of Health and Human Services, whichadministers the Child Care and Development Fund (CCDF) to states, territories, and federallyrecognized tribes.
Continuity of Care: Programs that provide continuity of care offer early education services tochildren in a consistent location throughout the day and/or year, to ensure a stable and nurturingearly learning environment. Such care is provided by a consistent set of caregivers, with littleturnover throughout the day/year.
Early Childhood Education: Services provided by early childhood professionals who work withyoung children in many different settings such as: nonprofit and for-profit child care centers,family child care homes, Head Start programs, or prekindergarten (pre-K) classrooms.
Head Start: Since its founding in 1965, the Head Start program has delivered comprehensive andhigh quality services—early education, health, parent involvement, social services—designed tofoster healthy development in low-income children. A child-focused program that has the overallgoal of increasing the school readiness of young children in low-income families, Head Startserves 3- to 5-year-old children, pregnant women, and their families. The Head Start program isadministered by the Head Start Bureau, the Administration on Children, Youth and Families(ACYF), Administration for Children and Families (ACF), Department of Health and HumanServices (DHHS). Grants are awarded by the ACF Regional Offices and the Head Start Bureau’sAmerican Indian and Migrant Program Branches directly to local public agencies, privateorganizations, Indian Tribes, and school systems for the purpose of operating Head Startprograms at the community level.

Child Care/Head Start Partnership Study: Final Report 120
Head Start Bureau: Division of ACF, U.S. Department of Health and Human Services thatadministers the Head Start program. The Bureau develops and oversees regulations based on theHead Start Act, Head Start Program Performance Standards, and other legislation.
Head Start Program Performance Standards: Federal Head Start regulations that establish theagency programmatic functions, activities, and facilities required to meet the objectives andgoals of the Head Start Program as they relate to children and their families. Revised standardswere implemented in January 1998.
Home Visits: A core part of the parental involvement element of the Head Start program in whichproviders visit families’ homes, allowing parents to learn about the needs of their children andabout educational activities that can take place at home.
Partnership: An agreement between a Head Start agency and a child care center to jointly provideservices to eligible families. While multiple definitions of partnership exist, the term is usednarrowly in this study to refer to these formal arrangements, which are, for the most part,contractual in nature. These formal agreements define the resources that Head Start provides tothe child care program and the services the child care program agrees to provide.
Partnership Agreement: A detailed, written document based on a jointly developed plan thatdescribes the roles and responsibilities of each partner to blend/share resources and provideenhanced services to young children and their families.
Stakeholders: State level players that are involved in coordinating early education partnerships.Stakeholders can include leaders from welfare and education agencies, state child careadministrators, pre-K directors, or large groups composed of state and local early educationleaders and others appointed by governors.
Subsidy (or Child Care Assistance): Payments typically made by the state agency that administersCCDF funds to local child care providers to cover a portion of the total cost of child care forparents/children who meet state subsidy eligibility criteria. May be provided through contractswith providers, child care certificates, or cash payments to parents.