Embed Size (px)
Citation preview

Child Care Workforce Study
Child Care Teachers and Assistants
Kim Hooks, Beth Rous, Patti Singleton, Amy Booth, Amy Clark, Tami Gross
Spring 2013

2013 Child Care Workforce Study
The Kentucky Partnership for Early Childhood Services is a multi-project consortium housed at the University of Kentucky, Human Development Institute (HDI). The partnership’s goal is to provide research, training and outreach to support and enhance quality early care, intervention and education. Services are provided through a variety of state and national grants and contracts.
Child Care Aware of Kentucky and the Quality Enhancement Initiatives are within the Kentucky Partnership through funds through the Kentucky Cabinet for Health and Family Services, Division of Child Care (DCC). Child Care Aware of Kentucky provides information to families seeking child care in Kentucky, assists providers with locating professional development opportunities as well as meeting licensing standards, and facilitates community involvement through participation on community organizations and in outreach activities.
This report is one in a series of three examining factors in the child care workforce. Additional reports are available on Licensed Child Care Directors and Certified Family Child Care Homes, available online. Additional copies of this report are available by request.
www.kentuckypartnership.org/workforce
This report was developed in part with Child Care Block Grant funds through a contract to the Human Development Institute from the Kentucky Cabinet for Health and Family Services, Division of Child Care (Contract Number P02 736 1200004856 1). Child Trends, a research center that provides valuable information and insights on the well-being of children was contracted for the development of the survey tool (www.childtrends.org). Recommended Citation: Hooks, K., Rous, B., Singleton, P., Booth, A., Clark, A., &Gross, T. (2013). Kentucky’s 2013 child care workforce study – licensed child care directors. Lexington, KY: Human Development Institute, University of Kentucky
An Equal Opportunity Employer M/F/H

Contents
Table of Tables ..........................................................................................................................................3
Table of Figures ........................................................................................................................................5
Background and Methodology ..........................................................................................................6
Respondent Characteristics ...................................................................................................................8
Hours Worked ......................................................................................................................................9
Higher Education.................................................................................................................................9
Professional Groups ......................................................................................................................... 11
Internet Usage ................................................................................................................................... 12
About Your Position ......................................................................................................................... 13
Experience .......................................................................................................................................... 13
Compensation and Benefits .............................................................................................................. 14
Ability to Enroll Children at Workplace ...................................................................................... 14
Wages .................................................................................................................................................. 15
Additional Employment .................................................................................................................. 15
Health Insurance ............................................................................................................................... 17
Working Environment ......................................................................................................................... 17
Center Policies.................................................................................................................................... 17
Future in Childcare ........................................................................................................................... 19
Characteristics of Children Served ................................................................................................... 20
Ethnic Distribution ............................................................................................................................ 20
Children with Special Needs .......................................................................................................... 22
Limited English Proficiency ............................................................................................................ 24
Professional Development and Training ........................................................................................ 24
Professional Development Supports ........................................................................................... 24
Use of ECE-TRIS .................................................................................................................................. 27
Use of Early Childhood Core Content......................................................................................... 28
Availability of Professional Development by Region .............................................................. 28
pg. 2

Interest in Professional Development by Region ..................................................................... 29
Barriers to Professional Development ......................................................................................... 30
Components of Professional Development that are Supportive ......................................... 31
Quality Improvement .......................................................................................................................... 32
Familiarity ............................................................................................................................................ 32
Source of Information on Quality Initiatives ............................................................................. 33
Barriers to Improvement ................................................................................................................. 33
Conclusion ............................................................................................................................................ 35
References............................................................................................................................................... 38
Table of Tables
Table 1. Response Rate and N ..............................................................................................................6
Table 2. Experience in Early Care and Education ...........................................................................8
Table 3. College Credits and Courses .................................................................................................9
Table 4. Degree Required to Obtain ............................................................................................... 10
Table 5. Membership in Professional Groups ............................................................................... 11
Table 6. Position at Center ................................................................................................................. 13
Table 7. Age Group(s) Currently Working With .......................................................................... 13
Table 8. Experience with Age Group(s) ......................................................................................... 14
Table 9. Years' Experience in Age Group(s) .................................................................................. 14
Table 10. Own Children Enrolled in Center .................................................................................. 14
Table 11. Number of Own Children Enrolled in Center ............................................................ 14
Table 12. Number of Hours and Salary for Other Paid Job ...................................................... 16
Table 13. Health Insurance Explanation ........................................................................................ 17
Table 14. Working Conditions and Policies ................................................................................... 18
Table 15. Conditions that Would Make you stay in Child Care ............................................... 19
Table 16. Percent Enrollment across Racial Categories ............................................................. 21
Table 17. Number of Teachers who work in a classroom with a Special Needs Child/Children ....................................................................................................................................... 23
pg. 3

Table 18. Age Group of Children and/or Families who do not Speak English ................... 24
Table 19. Use and Satisfaction with Professional Development Supports ........................... 26
Table 20. Yes, Using ECE-TRIS: Hours Not Recorded in ECE-TRIS ............................................ 27
Table 21. Not Using ECE-TRIS: Number of Training Hours in Past 12 Months .................... 27
Table 22. Locating Professional Development Opportunities ................................................. 28
Table 23. Interest in Professional Development Topics ............................................................. 29
Table 24. Barriers to Professional Development .......................................................................... 30
Table 25. Role of Professional Development Components in Encouraging and Supporting to Remain in Early Childhood ..................................................................................... 31
Table 26. Primary Purpose of STARS for KIDS NOW ................................................................... 32
Table 27. Influence on how you think about High Quality Practices .................................... 33
Table 28. Obstacles to Improving the Quality of Child Care .................................................... 34
pg. 4

Table of Figures
Figure 1. Distribution of Teachers by Region and Returned Surveys by Region ...................7
Figure 2. Number of Hours Worked per Week ...............................................................................9
Figure 3. Benefits of Increasing Educational Level ..................................................................... 10
Figure 4. Motivation for Completing Higher Education ............................................................ 11
Figure 5. Frequency of Internet Use................................................................................................ 12
Figure 6. Annual Salary of Teachers/Assistants ........................................................................... 15
Figure 7. Household Income ............................................................................................................. 16
Figure 8. Future in Child Care ........................................................................................................... 19
Figure 9. Ethnic Distribution: Children in Childcare Settings versus Kentucky’s child population .............................................................................................................................................. 22
Figure 10. Percent of Teachers who work in a classroom with a Special Needs Child/Children ....................................................................................................................................... 23
Figure 11. Teacher Perception of Director Support for Professional Development .......... 25
Figure 12. Barriers to Professional Development (1=Strongly Disagree to 5=Agree) ....... 31
Figure 13. Role of Professional Development Components in Encouraging and Supporting to Remain in Early Childhood (1=Strongly Disagree to 5=Agree) ................... 32
pg. 5

Background and Methodology
The 2012 Workforce survey request was sent to teachers and assistant teachers at Licensed Type I and Type II centers and certified Family Child Care homes in the state of Kentucky. Information on these teachers was obtained through a data export from the Early Care and Education Training Records Information System (ECE-TRIS). Only employees who were not assigned the role of Director or Owner were included in this export. ECE-TRIS is a centralized database which maintains training records for Early Care and Education professionals in Kentucky. This resulted in an estimated population of 40,399 teachers and assistants in licensed and certified early care and education.
In May of 2012, using email addresses provided by ECE-TRIS, 27,116 individuals were sent a cover letter and link to an online survey using Qualtrics Survey Software, with a request to complete the survey within 3 weeks. Using procedures outlined by Dillman (2009), e-mail reminders were sent at 2 and 4 weeks. Due to a low return rate (2%, N=745), an additional e-mail reminder was sent 8 weeks after the initial request. A total of 924 surveys were completed using the online version (see Table 1 for response rate).
Eight weeks after the initiation of the original survey, assistance was sought from the STARS Quality Coordinators (SQC’s), from the Quality Enhancement Initiative. The SQC’s were able to make contact with center directors and to request that teachers/assistants (particularly those from the underrepresented rural and Type II Centers) be provided with a hard copy of the survey, it is estimated these contacts resulted in an additional 24,000 teachers and assistants. Of those, 260 were completed and returned (see Table 1 for response rate).
As an incentive for completing the survey, all teachers/assistants who submitted a completed survey form were entered into a drawing for early childhood materials. In total, 50 prizes worth up to $20 each were awarded from the drawing. Prizes were given out three weeks following the last group of surveys sent out through the SQCs. Table 1. Response Rate and N
Estimated Population
Adjusted
Sample Size Valid Surveys:
Online Valid Surveys:
Paper Response
Rate
Teachers 40,399 31,116 924 260 4%
Responses were first examined by region. Using the county designations provided by DCC, statewide data were disaggregated by East, West, and Central regions. Ninety-three percent (1,101) respondents provided enough information that region was identifiable. Analyses disaggregated by region will be based on these surveys.
Sixty-four percent (714) of respondents were from the Central region of the state, 13% (144) from the Eastern region of the state and the remaining 25% (243) from the Western region. Table 2 details designated counties included in each region. Figure 1 illustrates the percentage of facilities currently operating in each of these regions and
pg. 6

the return rates by regions. Return rates are closely aligned to the percentages of facilities in each region.
Table 2. Regional County Designation
Region Counties
East Bath, Bell, Boyd, Bracken, Breathitt, Carter, Clay, Elliot, Fleming, Floyd, Greenup, Harlan, Jackson, Johnson, Knott, Knox, Laurel, Lawrence, Lee, Leslie, Letcher, Lewis, Magoffin, Martin, Mason, Menifee, Montgomery,
Morgan, Owsley, Perry, Pike, Robertson, Rockcastle, Rowan, Whitley, Wolfe
Central Adair, Anderson, Boone, Bourbon, Boyle, Bullitt, Campbell, Carlisle, Carroll, Casey, Clark, Clinton,
Cumberland, Estill, Fayette, Franklin, Gallatin, Garrard, Grant, Green, Harrison, Henry, Jefferson, Jessamine, Kenton, Lincoln, Madison, McCreary, Mercer, Nicholas, Oldham, Owen, Pendleton, Powell, Pulaski, Russell,
Scott, Shelby, Spencer, Taylor, Trimble, Wayne, Woodford
West Allen, Ballard, Barren, Breckinridge, Butler, Caldwell, Calloway, Christian, Crittenden, Daviess, Edmonson, Fulton, Graves, Grayson, Hancock, Hardin, Hart, Henderson, Hickman, Hopkins, Laure, Livingston, Logan,
Lyon, Marion, Marshall, McCracken, Mclean, Meade, Metcalfe, Monroe, Muhlenberg, Nelson, Ohio, Simpson, Todd, Trigg, Union, Warren, Washington, Webster
Figure 1. Distribution of Teachers by Region and Returned Surveys by Region
64%
11%
25%
62%
12%
26%
0%
20%
40%
60%
80%
100%
Central East West
Percentage of Staff Located in a Region
Percentage of Survey Respondents Located in a Region
pg. 7
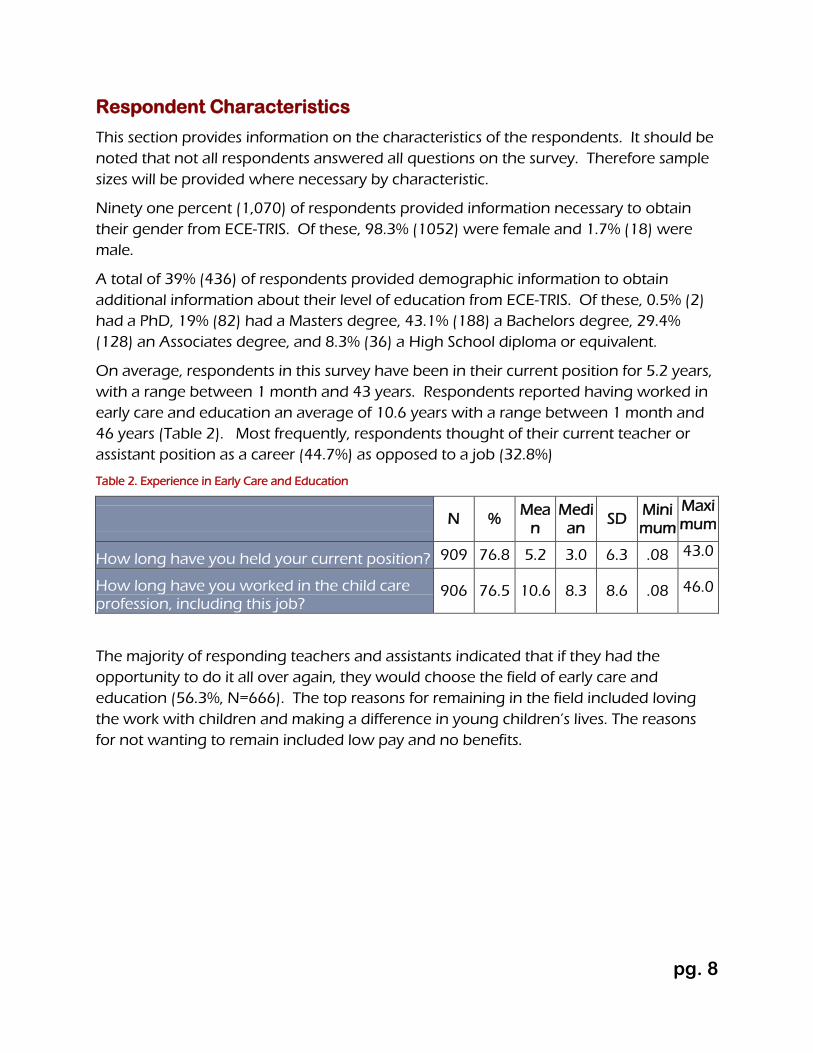
Respondent Characteristics
This section provides information on the characteristics of the respondents. It should be noted that not all respondents answered all questions on the survey. Therefore sample sizes will be provided where necessary by characteristic.
Ninety one percent (1,070) of respondents provided information necessary to obtain their gender from ECE-TRIS. Of these, 98.3% (1052) were female and 1.7% (18) were male.
A total of 39% (436) of respondents provided demographic information to obtain additional information about their level of education from ECE-TRIS. Of these, 0.5% (2) had a PhD, 19% (82) had a Masters degree, 43.1% (188) a Bachelors degree, 29.4% (128) an Associates degree, and 8.3% (36) a High School diploma or equivalent.
On average, respondents in this survey have been in their current position for 5.2 years, with a range between 1 month and 43 years. Respondents reported having worked in early care and education an average of 10.6 years with a range between 1 month and 46 years (Table 2). Most frequently, respondents thought of their current teacher or assistant position as a career (44.7%) as opposed to a job (32.8%)
Table 2. Experience in Early Care and Education
N % Mean
Median
SD Minimum
Maximum
How long have you held your current position? 909 76.8 5.2 3.0 6.3 .08 43.0
How long have you worked in the child care profession, including this job?
906 76.5 10.6 8.3 8.6 .08 46.0
The majority of responding teachers and assistants indicated that if they had the opportunity to do it all over again, they would choose the field of early care and education (56.3%, N=666). The top reasons for remaining in the field included loving the work with children and making a difference in young children’s lives. The reasons for not wanting to remain included low pay and no benefits.
pg. 8

Hours Worked
Most respondents reported that they worked between 35 and 40 hours weekly. Over half (52%), worked 35 or more hours a week. Figure 2 details these responses.
Figure 2. Number of Hours Worked per Week
Higher Education
Respondents were asked to indicate the number of college courses and college semester credits they had completed in Early Childhood or Child Development over the past 7 years. Responses indicated that 29.9 % (355) had taken courses. Table 3 describes these responses with a median number of credits as 18 (range between 1 and 210) and the median number of courses as 5 (range of 1 to 12).
Table 3. College Credits and Courses
N % Mean Median SD Min Max
Number of Courses 355 29.9 10.8 5.0 16.5 1.0 12.0
Total Semester Credits 342 28.9 33.7 18.0 35.7 1.0 210.0
less than 10 hrs. 5%
10-20 hrs. 8%
21-34 hrs. 11%
35-40 hrs. 35%
41-50 hrs. 13%
Over 50 hrs. 4%
No Response 24%
pg. 9

A small percentage of respondents (13.6%, N=161) reported that they were required by their employer to obtain an additional degree in order to maintain their current position. This was cited most frequently as the requirement to obtain the Child Development Associate (CDA). A total of 37.9% (61) chose this response (see Table 4). Table 4. Degree Required to Obtain
N %
Commonwealth Child Care Credential 18 11.2 Child Development Associate (CDA) 61 37.9 Associates 23 14.3 Bachelors 24 14.9 Other 24 14.9 No response 11 6.8
The majority (62.1%, 735) of respondents indicated they have increased their educational level while working. Most frequently, they reported receiving no additional benefits as a result of this change (30.6%, N=362). As illustrated in Figure 3, those that did report receiving a benefit stated most often that their salary was increased (14.1%, N=67). When respondents were asked what effect these benefits had on their motivation for completing a higher education level, 16.9% (124) indicated it was not at all important, and 16.2%(119) were neutral, as illustrated in Figure 4.
Figure 3. Benefits of Increasing Educational Level
30.6
1.5 0.8 1.5 4.3 4
14.1
1.1 4.1
37.9
0
5
10
15
20
25
30
35
40
Noadditionalbenefits
Increasedpaid
vacation
Increasedsick leave
Eligible forhealth
insurance
Trainingexpensescovered
Promotion IncreasedSalary
Retirementbenefits
Other NoResponse
pg. 10

Figure 4. Motivation for Completing Higher Education
Professional Groups
When asked if they belong to any early care and education professional groups, 8.4%(100) of respondents indicated they belonged to the National Association for the Education of Young Children (NAEYC) and 3.6%(43) indicated they were members of the Kentucky Association of Early Childhood Education (KAECE), as described in Table 5.
Table 5. Membership in Professional Groups
N % NAEYC (National Association for the Education of Young Children) 100 8.4
Division of Early Childhood (DEC) 11 0.9 COA (Council on Accreditation) 7 0.6 NECPA (National Early Childhood Program Accreditation ) 5 0.4 AMI (Association of Montessori International-USA) 2 0.2 NAFCC (National Association for Family Child Care) 5 0.4 Local Provider Support Group or Child Care Network 34 2.9 KAECE (Kentucky Association for Early Childhood Education) 43 3.6
SECA (Southern Early Childhood Association) 36 3.0 Kentucky Out of School Alliance 12 1.0 Other 98 8.3
Not at all important, 124, 16.9% Very
Unimportant, 20, 2.7%
Neither, 119, 16.2%
Very Important, 90, 12.2% Extremely
Important, 49, 6.7%
No Response, 333, 45.3%
pg. 11
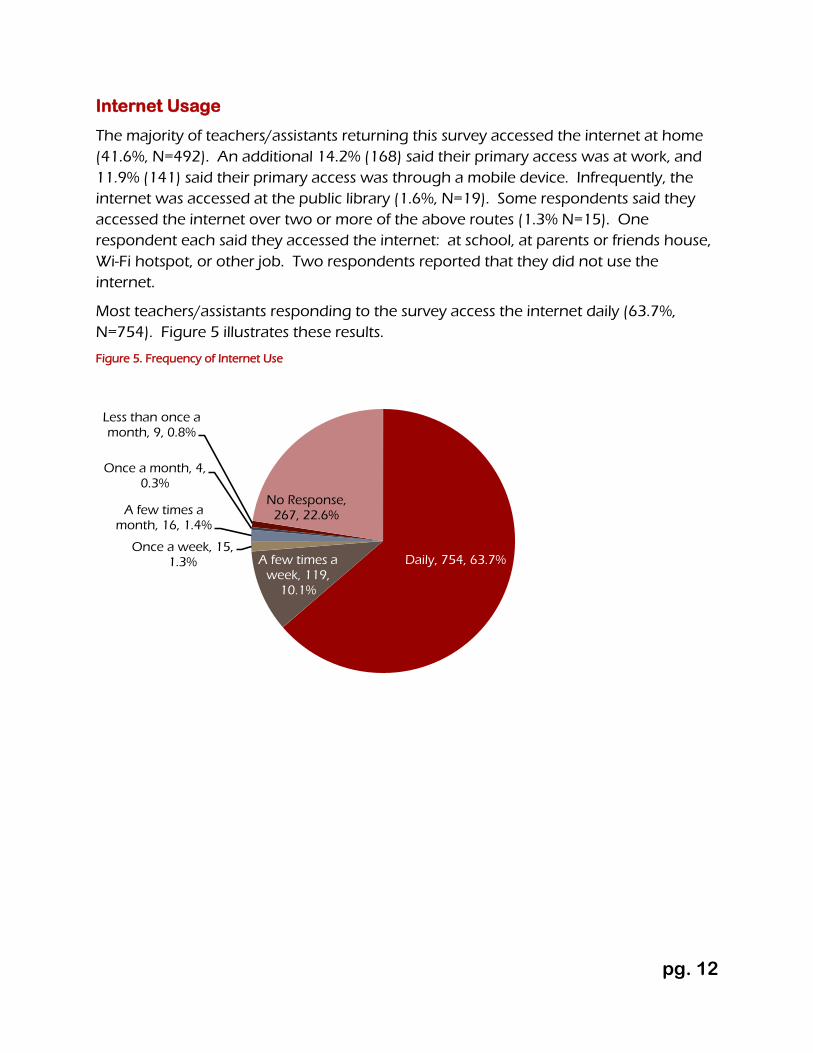
Internet Usage
The majority of teachers/assistants returning this survey accessed the internet at home (41.6%, N=492). An additional 14.2% (168) said their primary access was at work, and 11.9% (141) said their primary access was through a mobile device. Infrequently, the internet was accessed at the public library (1.6%, N=19). Some respondents said they accessed the internet over two or more of the above routes (1.3% N=15). One respondent each said they accessed the internet: at school, at parents or friends house, Wi-Fi hotspot, or other job. Two respondents reported that they did not use the internet.
Most teachers/assistants responding to the survey access the internet daily (63.7%, N=754). Figure 5 illustrates these results.
Figure 5. Frequency of Internet Use
Daily, 754, 63.7% A few times a week, 119,
10.1%
Once a week, 15, 1.3%
A few times a month, 16, 1.4%
Once a month, 4, 0.3%
Less than once a month, 9, 0.8%
No Response, 267, 22.6%
pg. 12

About Your Position
Table 6 describes respondent positions. Respondents included 43.8% (519) teachers and 18.8% (223) assistant teachers.
Table 6. Position at Center
N %
Teacher 511 42.6
Assistant Teacher or Aide 210 17.8
Other 453 38.9
No Response 8 0.7
The majority of individuals who selected the “Other” category indicated that they either functioned as a floater or sub for their center (42), were involved directly with child care/teaching in addition to their other duties (generally office, bus, food services, or administrative) (382) , or had multiple roles at the center (4). A few (9) did not specify what their “Other” role was.
Experience
Respondents were asked to indicate the age group(s) they work with on a regular basis. Infants were those children 0-11 months of age; toddlers ranged from 12-24 months; preschoolers were 2-4 years old and school age children were 5 or more years old. Nearly half (49.8%) indicated they worked with preschoolers, 33.1% with Toddlers, 25.5% with school age and 24.6% with infants. Another 20.8% indicated they were floaters, as described in Table 7.
Table 7. Age Group(s) Currently Working With
N %
Infants 291 24.6% Toddlers 392 33.1% Preschoolers 590 49.8% School Age 302 25.5% Floaters 247 20.8%
Respondents were then asked to indicate what age group(s) they had worked with throughout their early childhood career and to specify approximately how many years they have worked with that group. Results are described in Tables 8 and 9.
pg. 13

Table 8. Experience with Age Group(s)
N %
Infants 704 59.5% Toddlers 845 71.4% Preschoolers 940 79.4% School Age 714 60.3%
Table 9. Years' Experience in Age Group(s)
Mean Median SD Min Max
Infant 5.88 3..00 6.66 0 50 Toddler 5.98 3.00 6.49 0 45 Preschool 7.71 5.00 7.53 0 56 School-Age 7.50 5.00 7.78 0 40
Compensation and Benefits
Ability to Enroll Children at Workplace
Twenty-one percent (258) of respondents indicated “Yes”, they had their own children enrolled in the center where they worked (Table 10). Generally only one or two children were enrolled by any one teacher/assistant, but this number ranged between 1 and 5 children, as described in Table 11.
Table 10. Own Children Enrolled in Center
Table 11. Number of Own Children Enrolled in Center
N %
1 135 53.1 2 85 33.5 3 18 7.1 4 7 1.6 5 3 1.2 No Response 6 2.4
N %
Yes 258 21.8 No 901 57.9 No Response 29 2.4
pg. 14

Wages
Sixty-nine percent (821) of respondents indicated their current salary, with an overall average salary of$22,728.33 and a median of $20,342.40. Results are described in Figure 6.
The position held by the survey respondent did make a difference in average pay (Figure 6). Teachers reported a higher median wage ($17,923) than assistants ($16640) but a lower wage than administrators who taught in addition to their duties ($27,020). Substitutes ($15,080) and floaters ($15,080) had salaries lower than the other three positions.
The U. S. Bureau of Labor Statistics (2013) provides national data on the median preschool teacher salary ($27,130), child care workers ($19,510), and substitutes ($25,930). In each case the national median was more than that of survey respondents holding similar positions, as described in Figure 6.
Figure 6. Annual Salary of Teachers/Assistants
Additional Employment
A minority of respondents supplemented their child care income by working a second job (17.1%, N=203). Table 12 reflects the mean number of hours worked by and wages earned at these second jobs.
TeachersTeacher's
Aides/Assistants
Administrator with
Teacher/Asst Duties
Floaters Substitutes
75th Percentile $22,105.00 $19,760.00 $34,465.00 $18,320.00 $20,800.00
25th Percentile $15,600.00 $15,080.00 $20,624.00 $13,780.00 $15,080.00
Median-50th Percentile $17,923.00 $16,640.00 $27,020.00 $15,080.00 $17,680.00
$17,923.00 $16,640.00
$27,020.00
$15,080.00 $17,680.00
$-
$10,000.00
$20,000.00
$30,000.00
$40,000.00
pg. 15

Table 12. Number of Hours and Salary for Other Paid Job
Eighty-nine percent (1054) of respondents indicated their household’s total income before taxes from all sources and all members the household in 2011 (including income from child care). As illustrated in Figure 7, the majority of households reported making more than $25,000 per year.
Figure 7. Household Income
Under $20,000 25%
$20-25,000 10%
$25-30.000 7%
$30-35,000 5%
$35-40,000 7%
$40-50,000
9%
$50-70,000 12%
$70,000+ 14%
No Response
11%
N
% of those
Reporting Second
Job
Mean Median Std. Deviation Minimum Maximum
Hours per week 183 90.1 18.60 15.00 13.269 0 50.00
Hourly Rate 158 77.8 12.31 10.00 8.25934 0 50.00
pg. 16

Health Insurance
A majority of respondents indicated they do have health insurance (68.2%, N=808). Of these, 35.0% (283) indicated they were covered by a spouse’s policy and 36.4%(294) indicated that their insurance (in some way) was provided through their employer, as described in Table 13. This figure is higher than the national estimates for child care workers of 33% provided by Herzenberg, Price, and Bradley (2005) and 21% from Smith and Baughman (2007). It is still significantly lower than the 66% for the nation as a whole (Herzenberg, Price, and Bradley, 2005).
Table 13. Health Insurance Explanation
N %
I am covered by Spouse 283 35.0% My Insurance is partially paid by Employer 148 18.3% I purchase Thru Employer 97 12.0% I have my Own Policy 75 9.3% My insurance is fully paid by Employer 49 6.1% I am Covered through Medicare/Medicaid 31 3.8% Other 106 13.1% No Response 19 2.4%
Working Environment
Center Policies
Respondents were presented with a list of conditions and policies that affect the work environment and asked to check those which are offered, as summarized in Table 14. Generally, policies regarding organizational structure and staff performance (i.e. personnel policies, job descriptions, evaluation, and orientation to work) are provided most frequently. Policies requiring increase in expenses to the center (i.e. cost of living increase, paid lunch, and performance based raises) are less likely to be provided. See Table 14 for the summary of responses.
pg. 17

Table 14. Working Conditions and Policies
% (N) Who Responded
Yes No
N % N %
Paid Break 88.9 (1053) 712 67.6 341 32.4
Paid Lunch Break 93.1 (1102) 331 30.0 771 70.0
Staff Lounge 88.2 (1044) 588 56.3 456 43.7
Written Job Description 90.4 (1070) 956 89.3 114 10.7
Written Salary Schedule 88.3 (1045) 598 57.2 447 42.8
Formal Grievance Procedure 89.0 (1054) 750 71.2 304 28.8
Written Contract 88.2 (1044) 612 58.6 432 41.4
Written Personnel Policies 88.9 (1052) 950 90.3 102 9.7
Orientation Program 90.5 (1071) 908 84.8 163 15.2
Annual Evaluation 92.4 (1094) 931 85.1 163 14.9
Yearly Cost of Living Increase 87.4 (1035) 272 26.3 763 73.7
Periodic increase in wage based
on performance 88.0 (1042) 404 34.1 638 53.9
Compensation for overtime 88.4 (1047) 658 62.8 389 37.2
Paid preparation/ planning time 97.0 (1149) 598 52.0 551 48.0
Payment for attendance at staff
meetings after work hours 89.1 (1055) 773 73.3 282 26.7
Payment for attendance at
parent meeting after work
hours
90.0 (1066) 552 51.8 514 48.2
Paid release time for attendance
at on-site in-service trainings 88.5 (1048) 771 73.6 277 26.4
Paid release time for attendance
at off-site trainings / workshops 88.5 (1048) 759 72.4 289 26.6
Stipend for professional
development activities or
materials
86.2 (1021) 479 46.9 542 53.1
pg. 18

Future in Child Care
As described in Figure 8, most respondents indicated that they “probably” or “definitely” would be working in the childcare field three years from now (69.6%, N=825). Those who answered “No, Definitely Not” or “No, Probably not”, were then asked what would make them stay in child care. The most frequently chosen response was better pay followed by better benefits, as described in Table 15.
Figure 8. Future in Child Care
Table 15. Conditions that Would Make you stay in Child Care
N %
Better Pay 158 68.1 Better Benefits 77 33.2 Nothing 48 20.7 More Opportunities for Professional Growth 38 16.4 More Respect for my Profession 29 12.5 Better Working Conditions 23 9.9 More Stable Hours 16 6.9 Fewer Hours Per week 4 1.7
No, Definitely not, 38, 3.2%
No, Probably not, 194,
16.4%
Yes, Probably will, 522, 44.1%
Yes, Definitely will, 303, 25.6%
No Response, 127, 10.7%
pg. 19

Characteristics of Children Served
Ethnic Distribution Respondents were asked to indicate the percent of children served across racial categories. The average for these categories included 74.2% Caucasian/White, 13.9% African/American/Black, 6.5% Multi-Racial, 4.2% Hispanic, 1.5% Asian, 1.5% Other and 0.4% American Indian, as described in Table 16 and Figure 9
pg. 20

Figure 9. When compared to the Ethnic Distribution of Children from Kentucky’s 2011 KIDS COUNT data, there was a slightly higher percentage of African American and Multi-Racial children and a lower percentage of Caucasian children reported in child care centers than in Kentucky’s population of children as a whole (Annie E. Casey Foundation, 2011).
Table 16. Percent Enrollment across Racial Categories
Number Teachers/Aides
with at Least One Child
From Group in Center
Mean Median SD Minimum Maximum
%(N) % of Population in Center from Group
African American/Black
60 (709) 13.9% 5.0% 22.85% 0% 100%
American Indian
5 (61) 0.4% 0% 1.93% 0% 20%
Asian 21 (247) 1.5% 0% 4.65% 0% 60%
Hispanic 39 (459) 4.2% 0% 8.9% 0% 98%
Multi-Racial 47 (558) 6.5% 1% 10.91% 0% 94%
Caucasian 82 (975) 74.2% 88.0% 29.32% 0% 100%
Other 8 (90) 1.5% 0% 9.14% 0% 100%
pg. 21

Figure 9. Ethnic Distribution: Children in Childcare Settings versus Kentucky’s child population
Children with Special Needs
Respondents were asked to describe the number of children served with physical, emotional, developmental or behavioral conditions. This included children with Individual Family Service Plans (ages birth to age 3, served by First Steps, Kentucky’s Early Intervention Program) or an Individual Education Plan (ages 3 and older) that allow programs to better address their needs.
Twenty-two percent (262) indicated they had at least one child with a physical condition, 38.0% (480) indicated they had at least one child with an emotional, developmental or behavioral condition, 25.8% (305) indicated they had at least one child with an IFSP and 32.9% (390) indicated they had at least one child with an IEP. Results are summarized in Table 17 and Figure 10.
13.9%
0.4% 1.5% 4.2% 6.5%
74.2%
1.5% 9.0%
0.5% 1.5% 5.0% 3.0%
81.0%
0.3% 0%
20%
40%
60%
80%
100%
AfricanAmerican/
Black
AmericanIndian
Asian Hispanic Multi-Racial Caucasian Other
Average Enrollment by Percent from Workforce Survey
2011 Ethnic Distribution of Children in KY
pg. 22

Table 17. Number of Teachers who work in a classroom with a Special Needs Child/Children
Physical Condition
Emotional, Developmental or
Behavioral Condition
Individual Family Service Plan (0-3
years)
Individual Education Plan (Ages 3+ years)
N % N % N % N % 0 536 45.3 329 27.8 482 40.7 479 40.5 1 127 10.7 90 7.6 96 8.1 80 6.8 2 56 4.7 105 8.9 84 7.1 61 5.2 3 40 3.4 79 6.7 52 4.4 57 4.8 4 9 0.8 47 4.0 20 1.7 32 2.7 5 21 1.8 75 6.3 29 2.4 41 3.5 6 2 0.2 23 1.9 12 1.0 13 1.1 7 3 0.3 15 1.3 5 0.4 9 0.8 8 1 0.1 14 1.2 6 0.5 12 1.0 9 3 0.3 2 0.2 1 0.1 2 0.2 10 or more 48 4.1 104 8.8 0 0.0 83 7.0 No Response
338 28.5 301 25.4 397 33.5 315 26.6
Figure 10. Percent of Teachers who work in a classroom with a Special Needs Child/Children
22.1%
38.0%
25.8% 32.9%
0%
10%
20%
30%
40%
50%
60%
70%
80%
90%
100%
Physical Condition Emotional,Developmental or
Behavioral Condition
IFSP (0-3 Years) IEP (3+ Years)
pg. 23

Limited English Proficiency
Twenty-eight percent (334) of respondents indicated that they do have at least one child in their classroom whose primary language is not English (Table 18). Those who responded “Yes” were asked to indicate the age groups of the children whose primary language is not English, as well as the number with parents or guardians who do not speak English. The highest percentage of groups/classrooms with children and/or families who do not speak English are of Preschool age with 14.9% (177) having at least one child who did not speak English and 15.1% (179) having a parent who does not speak English (Table 18).
Table 18. Age Group of Children and/or Families who do not Speak English
Number of children who are non-English speaking
Number of children who have parents or guardians who do not speak English
N % N %
Infants 43 3.6 51 4.3
Toddlers 96 8.1 88 7.4
Preschool 177 14.9 179 15.1
School-Age 58 4.9 69 5.8
Professional Development and Training
Professional Development Supports
Respondents indicated most frequently that their motivation for professional development was “to gain skills and knowledge to improve my job performance” (52.3%, N=492). This was followed by “to meet individual or program requirements” (22.8%, N=214) and “to support quality improvement of the center” (13.3%, N=125). An additional 8.4% (79) indicated that they were primarily motivated by “improving my business or career” and 3.2% (30) chose “Other”. Of those choosing “Other”, the reasons given were: “All of the Above” (9), because I like children/want to help children (7), None (3), need/keep my job (2), to support the center and gain knowledge (1), my calling (1), I enjoy it (1), for Pay (1),
Most respondents did feel supported by the child care director at their center when seeking professional development (59.2%, N=701). This is illustrated in Figure 11.
.
pg. 24

Figure 11. Teacher Perception of Director Support for Professional Development
Respondents were asked to indicate which professional development supports they were aware of or have used. For those supports they had used, they were then asked to rate their level of satisfaction. Respondents were most familiar with Individual Growth Plans, STARS for KIDS NOW Technical Assistance, the Early Childhood Standards, and Early Childhood Core Content. They were least familiar with KDE Traineeship Scholarship (for special needs training) and Professional Mentoring/Coaching. Teachers were most satisfied with the Early Childhood Scholarship Program (average of 4.29 on a 5-point scale), and least satisfied with the KDE Traineeship Scholarship (average of 3.80 on a 5-point scale). Results are summarized in Table 19.
Not at all, 42, 3.5%
Not always, 62,
5.2%
Somewhat, 191, 16.1%
Most of the Time, 271, 22.9%
Very, 430, 36.3%
No Response, 188, 15.9%
pg. 25

Table 19. Use and Satisfaction with Professional Development Supports
Have Used
%(N)
If you have used, please rate level of satisfaction I'm not
aware of
%(N)
I'm aware of but haven't
used
%(N)
No Response
%(N) Very
dissatisfied
%
Dissatisfied
%
Neither Agree or
Disagree %
Satisfied
%
Very Satisfied
%
Average
Individual Growth Plans/ Professional Development Plans
48.2 (571) 1.4 3.2% 24.5% 47.5% 23.5% 3.88 22.5 (266) 13.4 (159) 15.9 (188)
STARS for KIDS NOW Technical Assistance 47.9 (567) 1.1 3.7 19.4 41.3 34.6 4.05 14.8 (175) 22.8 (270) 14.5 (172)
Early Childhood Standards 44.1 (522) 0.4 2.1 20.3 49.0 28.2 4.02 22.7 (269) 15.6 (185) 17.6 (208) Early Childhood Core Content 41.6 (493) 1.2 1.6 24.9 47.7 24.5 3.93 24.7 (292) 18.4 (218) 15.3 (181)
ECE-TRIS 40.1 (475) 1.5 1.1 21.5 42.9 33.1 4.05 24.5 (290) 18.6 (220) 16.8 (199) Early Childhood Professional Core Content Self-Assessment Form
34.9 (413) 1.5 1.5 30.5 45.0 21.5 3.84 29.9 (354) 18.0 (213) 17.2 (204)
Early Childhood Council 34.1 (404) 1.0 2.2 20.8 42.6 33.4 4.05 28.0 (332) 18.8 (222) 19.1 (226) KIDS NOW Initiative 33.4 (396) 1.3 1.5 18.2 45.2 33.8 4.09 31.2 (369) 18.6 (220) 16.8 (199)
CDA/CDA-K mini-grants 31.2 (369) 1.6 1.1 14.1 33.6 49.6 4.28 26.8 (317) 24.6 (291) 17.5 (207)
Early Childhood Scholarship Program 29.2 (346) 2.0 1.4 11.8 35.3 49.4 4.29 30.2 (358) 22.8 (270) 17.7 (210)
KIDS NOW scholarships 28.4 (336) 1.8 1.5 16.4 29.5 50.9 4.26 32.9 (390) 204 (241) 18.3 (217) Milestone Achievement Award 25.9 (307) 1.3 1.3 19.2 30.9 47.2 4.21 42.6 (505) 13.0 (154) 18.4 (218)
Director’s Credential 25.3 (299) 2.3 2.0 19.4 29.1 47.2 4.17 25.4 (301) 29.6 (351) 19.7 (233) Quality Self-Study 24.7 (293) 1.0 1.7 30.4 38.2 28.7 3.92 40.1 (475) 13.9 (164) 21.3 (252) Early Childhood Trainer’s Credential 24.2 (287) 1.4 2.1 28.2 34.5 33.8 3.97 31.3 (371) 25.0 (296) 19.4 (230)
Related Educational Reimbursement Award 23.1 (274) 1.8 1.8 23.0 28.8 44.5 4.12 43.8 (519) 13.9 (165) 19.1 (226)
Early Childhood Continuous Assessment Guide 22.7 (269) 0.7 1.1 33.5 39.4 25.3 3.87 38.1 (451) 17.7 (210) 21.5 (254)
Professional mentor, coach, or consultant 22.0 (261) 1.9 4.2 30.3 37.5 26.1 3.82 37.8 (447) 19.9 (236) 20.3 (240)
KDE Traineeship Scholarship (for special needs training)
10.6 (125) 2.4 0.8 42.4 23.2 31.2 3.8 50.8 (602) 17.4 (206) 21.2 (251)
pg. 26

Use of ECE-TRIS
Almost half (47.6%, N=564) of respondents indicated that they CURRENTLY use the Early Care and Education Training Records Information System (ECE-TRIS) to track Professional Development. The remaining 37% (438) do not use the system and 15.4% (182) did not respond to the question. Of those who DO use ECE-TRIS, several admitted to having hours completed that had not been entered into the system (Table 20).
Table 20. Yes, Using ECE-TRIS: Hours Not Recorded in ECE-TRIS
N %
Unknown 333 59.0
0-25 154 27.3
26-50 28 5.0
51-75 17 3.0
76-100 20 3.6
No Response 12 2.1
Almost all individuals who do NOT use the system indicated that they have received professional development (95%, N=415). The amount of training received by these individuals is reflected in Table 21.
Table 21. Not Using ECE-TRIS: Number of Training Hours in Past 12 Months
N %
Less than 15 hours 116 26.4
15 hours 124 28.3
16-17 hours 40 9.1
18 hours 25 5.7
19 hours or more 110 25.1
pg. 27

Use of Early Childhood Core Content
Of the 493 respondents who said they had used the Kentucky Early Childhood Core Content (Table 19), 41% (202) stated that their director used Core Content to develop or refine their job description, and 41% (203) stated their Director used Core Content in conducting their evaluation or staff review.
Availability of Professional Development by Region
Respondents were asked to use a 5-point scale to rate their level of agreement with statements about the availability of professional development opportunities. Most (56.2%, N=665) agreed that they were able to find professional development opportunities near their home or work, 48.2% (573) agreed they can find professional development that is affordable and 49.1%(581) agreed they could find professional development that is of high quality.
Respondents from Eastern Kentucky expressed more concern (disagreed/strongly disagreed) for finding professional development that is nearby (14.6%) and affordable (12.5%) than the other two regions, as illustrated in Table 22.
Table 22. Locating Professional Development Opportunities
Strongly Agree
%(N)
Agree %(N))
(N)
Neither Agree nor Disagree
%(N)
Disagree
%(N)
Strongly Disagree
%(N)
No Response
%(N) Average
I can find opportunities for professional development near my home or work.
Central 21.3(152) 35.4(253) 12.9(92) 6.4(48) 3.6(26) 20.3(145) 2.19 East 13.9(20) 37.5(54) 18.8(27) 13.2(19) 1.4(2) 15.3(22) 2.42 West 22.6(55) 32.9(80) 13.6(33) 6.6(16) 3.7(9) 20.6(50) 2.19
Statewide* 21.3 (252)
34.9 (413)
14.6 (173) 7.3 (87) 3.3 (39) 18.6(220) 2.22
I can find professional development that is affordable.
Central 18.9(134) 29.4(210) 19.2(137) 8.5(61) 3.5(25) 20.6(147) 2.35 East 7.6(11) 36.8(53) 27.8(40) 9.7(14) 2.8(4) 15.3(22) 2.57 West 17.3(42) 31.7(77) 20.2(49) 8.6(21) 1.6(4) 20.6(50) 2.32
Statewide* 17.5 (207)
30.7 (363)
21.3 (252) 9.0(106) 2.8 (33) 18.8
(223) 2.36
I can find professional development that is high quality.
Central 16.1(115) 30.8(220) 20.6(147) 7.7(55) 3.5(25) 21.5(152) 2.39 East 12.5(18) 40.3(58) 18.8(27) 12.5(18) .7(1) 15.3(22) 2.39 West 15.6(38) 36.2(88) 20.2(49) 4.1(10) 2.9(7) 21.0(51) 2.27
Statewide* 16.2 (192)
32.9 (389)
21.3 (252) 7.5 (89) 2.8 (33) 19.3
(229) 2.35
*Statewide data include 83 Teachers/Assistant Teachers who did not provide the information required to identify “region” of state.
pg. 28

Interest in Professional Development by Region
Respondents were asked to indicate the types of support, training, or education they would be interested in receiving. The top 5 topics are identified by shading below for the state as a whole and then for each region of the state. The two topics that fell into the top 5 for all regions were Behavior Management and Guidance and Child Development, as described in Table 23.
Table 23. Interest in Professional Development Topics
Statewide* Central East West
%(N) %(N) %(N) %(N)
Behavior management and guidance 62.6(741) 60.8(434) 63.2(91) 65.4(159)
Working with Children with Special Needs 44.7(529) 41.0(293) 55.6(80) 46.5(113)
Stress Management 39.3(465) 36.8(263) 42.4(61) 42.4(103)
Child Development 38.9(461) 37.5(268) 35.4(51) 36.6(89)
Working with Parents 38.3(454) 38.4(274) 38.9(56) 41.6(101)
Child Assessment and Observation 37.3(442) 37.7(269) 32.6(47) 37.4(91)
Helping with School Readiness 36.7(435) 36.1(258) 40.3(58) 37.0(90)
Working with Specific Age Groups 33.8(400) 33.8(241) 33.3(48) 34.6(84)
Working with Schools, other Agencies, etc…. 29.7(352) 29.3(209) 30.6(44) 29.6(72)
KIDS NOW 24.0(284) 23.7(169) 23.6(34) 22.6(55)
Bookkeeping, business management or billing 23.1(273) 22.5(161) 23.6(34) 25.1(61)
Use Formal Curriculum 22.5(266) 22.8(163) 20.8(30) 23.0(56)
Working with Specific Cultural Groups 20.9(247) 21.3(152) 18.1(26) 22.2(54)
Accreditation 18.3(218) 19.0(136) 19.4(28) 25(17)
Getting a Certificate 17.1(202) 16.9(121) 15.3(22) 16.9(41)
Other 2.9(34) 3.5(25) 1.4(2) 2.9(7)
*Statewide data include 83 Teachers/Assistant Teachers who did not provide the information required to identify “region” of state.
pg. 29

Barriers to Professional Development
When asked to indicate their level of agreement in response to the reasons child care providers don’t get more involved in professional development training, the most highly rated item was “I don’t have enough time,” with an average agreement of 3.46 on a 5-point scale. Results are summarized in Table 24 and Figure 12.
Table 24. Barriers to Professional Development
No Response
%(N)
Strongly Agree
%(N)
Agree
%(N)
Neither Agree nor Disagree
%(N)
Disagree %(N)
Strongly Disagree
%(N) Average
I don’t have enough time. 22.9 (271)
13.0 (154)
29.1 (345)
18.7 (221)
12.6 (149) 3.7 (44) 3.46
I don’t have enough information about opportunities available to me.
23.4 (277)
11.8 (140)
22.9 (271)
20.3 (240)
16.5 (195) 5.2 (61) 3.26
The cost is too high. 23.6 (280)
9.4 (111)
22.9 (271)
26.9 (318) 12.9(153) 4.3 (51) 3.26
I have concerns about the relevance of trainings available to me.
23.1 (274)
3.6 (43)
18.3 (217)
29.6 (350)
18.7 (221) 6.7 (79) 2.92
Available trainings are not offered at convenient times.
23.0 (272)
4.8 (57)
18.0 (213)
27.2 (322)
19.3 (229) 7.7 (91) 2.91
The location of offered trainings is inconvenient.
23.1 (274)
5.4 (64)
13.4 (159)
29.2 (346)
20.6 (244) 8.2 (97) 2.83
I don’t like the trainings available. 23.5 (278)
2.2 (26)
11.5 (136)
34.0 (402)
23.6 (280) 5.2 (62) 2.76
I have difficulty accessing online training opportunities.
23.5 (278)
5.1 (60)
9.6 (114)
28.8 (341)
19.0 (225)
14.0 (166) 2.64
It is not useful enough to be worth my time/energy/resources.
23.2 (275)
2.6 (31)
10.9 (129)
25.9 (307)
27.0 (320)
10.3 (122) 2.59
I cannot get a substitute. 23.6 (279)
4.7 (56)
10.6 (125)
21.5 (254)
22.4 (265)
17.3 (205) 2.52
I don’t plan on being in the child care field long term.
23.2 (275)
2.5 (30)
6.4 (76)
18.7 (221)
26.9 (318)
22.3 (264) 2.22
I do not have transportation to get to available trainings.
24.6 (291)
2.1 (25)
2.5 (30)
12.3 (146)
29.2 (346)
29.2 (346) 1.93
pg. 30

Figure 12. Barriers to Professional Development (1=Strongly Disagree to 5=Agree)
Components of Professional Development that are Supportive
When asked to rate the degree to which components have played a role in encouraging and supporting them to remain in the field, respondents most frequently chose the “Professional Development/Growth Plan”. This response received an average rating of 2.67 on a 5-point scale. Responses are summarized in Table 25 and Figure 13.
Table 25. Role of Professional Development Components in Encouraging and Supporting to Remain in Early Childhood
Don't know
%(N)
Not at all
%(N)
(2)
%(N) Somewhat
%(N)
(4)
%(N)
Highly
%(N) Average
Professional Development/Growth Plan 22.8 (270) 17.7 (209) 5.4 (64) 13.9 (165) 6.8 (80) 8.4 (100) 2.67
CDA Assessment Fee Mini-Grant 26.4 (312) 24.7(293) 1.9 (23) 5.5 (65) 4.7 (56) 12.6 (149) 2.56 Non-College Scholarships (CCCC,CDA) 24.9 (295) 24.2 (287) 2.5 (30) 6.9 (82) 4.6 (54) 11.9 (141) 2.55
College Tuition Scholarship 27.4 (324) 24.2 (286) 1.9 (23) 5.7 (68) 4.0 (47) 11.3 (134) 2.50
Milestone Achievement Award 30.7 (363) 23.6 (279) 1.8 (21) 5.3 (63) 3.8 (45) 10.0 (118) 2.43
Trainer’s Credential 30.6 (362) 22.2 (263) 3.8 (45) 8.2 (97) 3.7 (44) 5.7 (67) 2.24
Core Content 29.6 (350) 21.3 (252) 4.6 (55) 10.7 (127) 3.5 (41) 4.6 (55) 2.23 Professional Development Counselor 30.6 (362) 24.1 (285) 3.6 (43) 6.0 (71) 4.3 (51) 5.6 (66) 2.17
Articulation Agreements among training entities, colleges and universities
36.1 (427) 23.1 (274) 3.5 (42) 6.0 (71) 2.6 (31) 2.9 (34) 1.91
3.46
3.26
3.26
2.92
2.91
2.83
2.76
2.64
2.59
2.52
2.22
1.93
0 1 2 3 4 5
I don’t have enough time.
I don’t have enough information about …
The cost is too high.
I have concerns about the relevance of…
Available trainings are not offered at…
The location of offered trainings is…
I don’t like the trainings available.
I have difficulty accessing online training…
It is not useful enough to be worth my…
I cannot get a substitute.
I don’t plan on being in the child care field …
I do not have transportation to get to…
pg. 31

Figure 13. Role of Professional Development Components in Encouraging and Supporting to Remain in Early Childhood (1=Strongly Disagree to 5=Agree)
Quality Improvement
Familiarity
Most (71.8%, N=850) responses indicated that teachers/assistants had heard about Kentucky’s Quality Rating and Improvement System (STARS for KIDS NOW). The overwhelming majority of these (75.3%, N=640) identified the purpose of STARS for KIDS NOW as to “Improve Early Care and Education Programs,” (see Table 26).
Table 26. Primary Purpose of STARS for KIDS NOW
N %
Improve ECE program 640 75.3 Provide information to parents about program quality
114 13.4
Provide monetary incentives 41 4.8 Other 23 2.7 Provide marketing materials 19 2.2 No Response 13 1.5
2.67
2.56
2.55
2.5
2.43
2.24
2.23
2.17
1.91
0 1 2 3 4 5
Professional Development/Growth Plan
CDA Assessment Fee Mini-Grant
Non-College Scholarships (CCCC,CDA)
College Tuition Scholarship
Milestone Achievement Award
Trainer’s Credential
Core Content
Professional Development Counselor
Articulation Agreements among trainingentities, colleges and universities
pg. 32

Source of Information on Quality Initiatives
Twenty six percent (N=313) of participants responding to a question on the most important source of information/influence on their understanding of high quality practices answered “Supervisor or former supervisor”. Other significant sources of support were co-workers/former co-workers (16%, N=184) and another child care professional (10%, N=122), summarized in Table 27).
Table 27. Influence on how you think about High Quality Practices
N %
Supervisor or former supervisor
313 26.4
Co-Worker or former Co-worker
184 15.5
Another child care Professional
122 10.3
Other 103 8.7
A consultant/TA 62 5.2
A Family Member 54 4.6
Local Child care agency 47 4.0
Provider support network 16 1.4
No Response 283 23.9
Barriers to Improvement
Respondents were asked to indicate their top three choices from a list of 13 obstacles to improving the quality of child care. The top obstacle reported was finding qualified staff. This was followed by lack of funding for quality improvements and staff turnover (see Table 28). Respondents were less likely to see a language barrier with families, long work hours, or reimbursements for child care subsidies as barriers to quality in their work place.
pg. 33
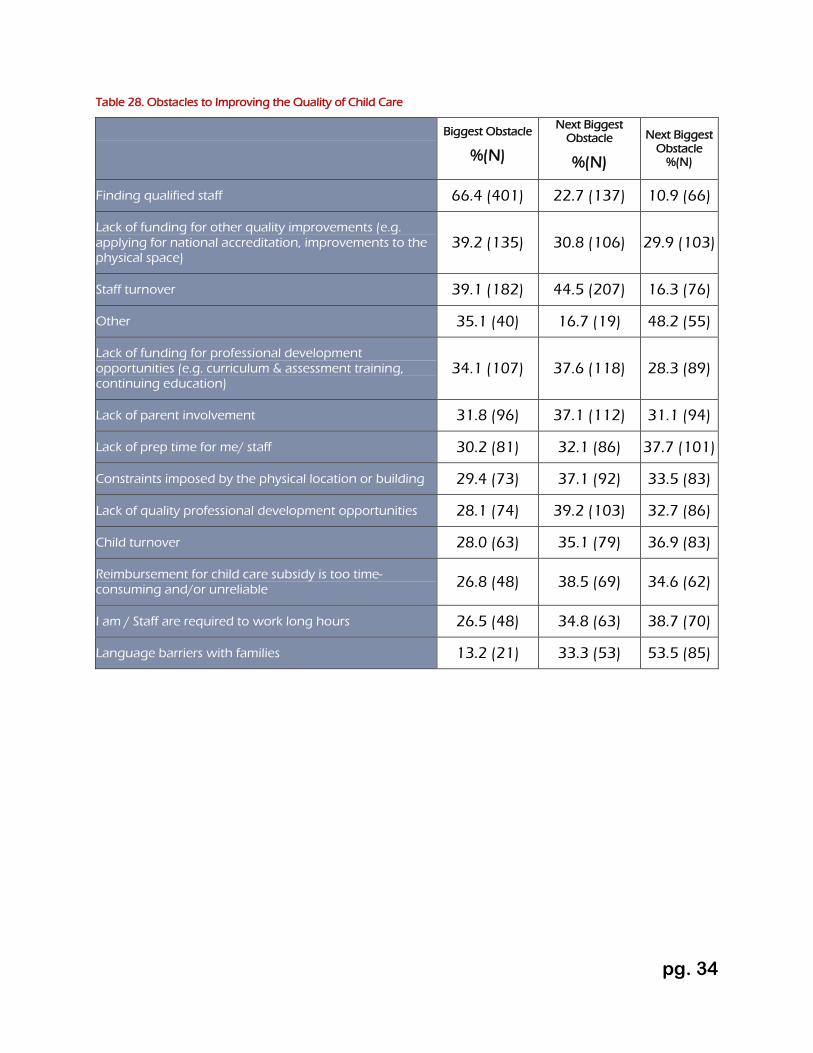
Table 28. Obstacles to Improving the Quality of Child Care
Biggest Obstacle
%(N)
Next Biggest Obstacle
%(N)
Next Biggest Obstacle
%(N)
Finding qualified staff 66.4 (401) 22.7 (137) 10.9 (66)
Lack of funding for other quality improvements (e.g. applying for national accreditation, improvements to the physical space)
39.2 (135) 30.8 (106) 29.9 (103)
Staff turnover 39.1 (182) 44.5 (207) 16.3 (76)
Other 35.1 (40) 16.7 (19) 48.2 (55)
Lack of funding for professional development opportunities (e.g. curriculum & assessment training, continuing education)
34.1 (107) 37.6 (118) 28.3 (89)
Lack of parent involvement 31.8 (96) 37.1 (112) 31.1 (94)
Lack of prep time for me/ staff 30.2 (81) 32.1 (86) 37.7 (101)
Constraints imposed by the physical location or building 29.4 (73) 37.1 (92) 33.5 (83)
Lack of quality professional development opportunities 28.1 (74) 39.2 (103) 32.7 (86)
Child turnover 28.0 (63) 35.1 (79) 36.9 (83)
Reimbursement for child care subsidy is too time-consuming and/or unreliable 26.8 (48) 38.5 (69) 34.6 (62)
I am / Staff are required to work long hours 26.5 (48) 34.8 (63) 38.7 (70)
Language barriers with families 13.2 (21) 33.3 (53) 53.5 (85)
pg. 34
Conclusion
Response Rate: The 2012 Teachers Workforce Survey was sent to all 31,116 teachers/assistants in licensed Type I and Type II centers and certified family child care home in the state of Kentucky. There were 1184 respondents, for a response rate of 4%.
The percent of returned surveys from each portion of the state very closely aligns to the percent of facilities operating in each of Kentucky’s regions. Sixty two percent of respondents were located in Central Kentucky, with an estimated 64% of the population; 12% of respondents were located in Eastern Kentucky, with an estimated 13% of the population; and 25% of respondents were located in Western Kentucky, with 26% of the population. Where helpful, survey results were disaggregated by region to examine differences in responses.
Respondents: Respondents were largely female (98.3%). Of the 36.8% who provided information on educational background, 62.6% currently had a Bachelor’s degree or higher.
Staff Characteristics: Sixty-two percent of respondents indicated that they have taken courses to increase their educational level in the past 7 years. The most completed degree from these courses was the Child Development Associate (CDA).
Fourteen percent of respondents stated that their salary had increased when their education level increased. Between 1% and 5% of respondents reported receiving other benefits such as increased vacation, sick leave, health insurance coverage, coverage for training, and more retirement benefits when they improved their educational status. However, the most frequently selected to a response to the question was that “no additional benefits” (30.6%) were provided following an increase in education level.
Forty four percent of the respondents to this survey stated they were teachers and an additional 18.8% were assistant teachers or aides. A large percentage of respondents fell into the “other” category (36.9%) which primarily consisted of individuals who identified themselves as “floaters” or “subs” or who held other titles at the facility but additionally taught/worked directly with children.
Most (79%) of the respondents stated that they had experience working with preschoolers on a regular basis, 71% worked with toddlers, and about 60% had worked with infants and/or school aged children.
Wages, Benefits: Respondents length of time in the child care field varied greatly (1 month to 46 years), with the average of 5.2 years.
Kentucky’s Annual Wages for teachers as well as assistants were significantly and consistently below the national average as reported by the U. S. Bureau of Labor Statistics (2013). The Median salary for teachers responding to this survey was $17,923
pg. 35

and that for assistant teachers was $15,080. Subs were paid similarly to teachers ($17,680); floaters had lower salaries than any other of the positions ($15,080). These figures contrast with the Average Median Nationwide Salary of $27,130 for teachers, $19,510 for teacher’s aides, and $25,930 for subs (The U. S. Bureau of Labor Statistics, 2013).
Administrators who taught in addition to their other duties reported making more than those individuals who only taught (Median=$27,020). However, the additional duties did not mean that their salaries were significantly higher than directors who responded to the Director’s Workforce Survey (2013).
Most respondents relied on some income in addition to what they made at their job in child care. Fifty-four percent of respondents had a household income of $25,000 or more. Seventeen percent of respondents supplement their income by working an additional job. The remaining individuals rely on the income from another source (i.e. family member).
Approximately 36% percent of respondents had access to some level of Health Care provided by their employer. This exceeds nationwide figures of 33% and 21% (Herzenberg, Price, & Bradley, 2005; Smith & Baughman, 2007) but is still significantly below the percentage of the workforce as a whole (66%) (Smith & Baughman, 2007).
Working Environment. Most respondents reported being satisfied with their work in the early care and education, with 45% thinking of their position as a “career” rather than a “job” and 56% saying they would choose a career in the early care and education field if they had to “do it all over again”. Ninety seven percent of respondents stated that they “probably” or “definitely” would be working in the early childhood field three years from now. Respondents who did not plan to stay in the field gave low pay and no benefits as their primary reason for leaving.
Respondents reported serving children from diverse backgrounds. Twenty-two percent of respondents reported serving at least one child with a physical disability and 38% served at least one child with an emotional or behavioral condition. Twenty-eight percent of those responding had at least one child in their classroom with English as a second language.
The ethnicity of children in centers largely reflects that of the state’s population with the exception that there is a slightly lower percentage of Caucasian children enrolled and a slightly larger percentage of African American and Multi-Racial children enrolled in child care centers than in the state population of children at large. Survey results suggest that the state child care facilities currently have 14% African American, 4% Hispanic, 7% Multiracial, and 74% Caucasian children. This distribution varies widely by facility across the state.
pg. 36

Professional Development: Professional Development Supports most reported by respondents included: Individual Growth Plans (48%), KY STARS for KIDS NOW Technical Assistance (48%), KY Early Childhood Standards (44%), Early Childhood Core Content (42%), and the ECE-TRIS (40%). By contrast, they have least used: KDE Traineeship Scholarships (11%), a professional mentor or coach (22%), and the Early Childhood Continuous Assessment Guide (23%).
Generally, respondents indicate they were able to find professional development opportunities near their home or work (56%), to find affordable opportunities (48%), and to find high quality opportunities (49%). Although still a low percentage, respondents from Eastern Kentucky did express some more concern than the other two regions for finding nearby (15%) and affordable opportunities (10%).
The most frequently requested topics for professional development in ALL regions of the state include Behavior Management (63%) and Guidance and Child Development (45%). The two most cited barriers were time (52%) and not enough information about available opportunities (33%).
Of the 13.6% of respondents who stated they were required by their employer to obtain an additional degree in order to maintain their current position, 37.9% indicted that they were required to obtain a Child Development Associate (CDA).
Respondents stated that Professional Development/Growth Plans (15.2%), CDA Assessment Fee Mini-Grants (17.3%), and Non-College Scholarships (16.5%) were the most helpful supports that played a role in helping them stay in the field. However, it is important to note, that about 40-50% of respondents to each item in this question stated that they “didn’t know” or thought the listed support did not affect their decision to continue in the field at all.
Quality Improvement: The majority of teachers and assistants have heard about STARS for KIDS NOW (72%) and understand the purpose as being to improve the Early Care and Education Program for the State of Kentucky (75%). Most frequently, their source of information for this program is from a supervisor or former supervisor (26%) or a coworker or former coworker (16%).
The Barriers cited most frequently with regard to developing quality programs was to “find Qualified Staff” and lack of funding for quality improvements.
pg. 37
References
Dillman, D.A., Smyth, J.D. & Christian, L.M. (2009). Internet, mail, and mixed-mode surveys: The tailored design method. 3rd Edition. Hobokon, NJ: John Wiley & Sons. [ISBN 978-0-471-69868-5 cloth]
Herzenberg, Stephen; Price, Mark, and Bradley, David (2005). Losing Ground in Early childhood Education: Declining Workforce Qualifications in Expanding Industry (Executive Summary). Retrieved from http://www.epi.org/publication/study_ece_summary/.
Smith, Kristin and Baughman, Reagan (2007). Low Wages Prevalent indirect Care and Child Care Workforce (Policy Brief No. 7). Durham: University of New Hampshire, Carsey Institute. Retrieved from http://www.carseyinstitute.unh.edu/publications/PB_caregivers.pdf.
Rous, Beth; Booth, Amy; Hooks, Kim; & Singleton, Patti (2013. Childcare Workforce Study: Licensed Child Care Directors, Unpublished Report.
The Annie E. Casey Foundation. (2011), Kids Count Data Center, Ethnic Data across States. Retrieved from http://datacenter.kidscount.org/data/acrossstates/Rankings.aspx?ind=1030
U. S. Bureau of Labor Statistics. (2013). News Release on Occupational Employment and Wages—May 2012. Retrieved from http://www.bls.gov/news.release/ocwage.htm.
pg. 38