Embed Size (px)
Citation preview

Early Childhood Research Quarterly 19 (2004) 505–527
Child care quality: centers and home settings thatserve poor families
Bruce Fullera,∗, Sharon Lynn Kaganb, Susanna Loebc, Yueh-Wen Changa
a University of California, Berkeley, CA, USAb Teachers College, Columbia University, New York, NY, USA
c Stanford University, Stanford, CA, USA
Abstract
The effects of center-based care on early development, outside of carefully controlled demonstration programs,appear to be positive yet often modest for children from low-income families. But little is known about variationin the quality of centers and preschools found among low-income neighborhoods. Evidence also remains scarceon the observed quality of home-based care, the settings that most children attend and into which large infusionsof federal dollars are now directed. This paper reports on the observed quality of 166 centers and 187 nonparentalhome settings (including family child care homes and kith or kin providers) serving children in five cities situatedin California, Connecticut, or Florida. Centers displayed higher mean quality as gauged by provider education andthe intensity of structured learning activities, compared to home-based settings, but did not consistently displaymore positive child–provider interactions. Great variability among centers and home-based settings was observed,including between-city differences. Second, we found that contextual neighborhood attributes accounted for thequality of providers selected more strongly than family-level selection factors. Mothers with stronger verbal abilities(PPVT scores) did select higher quality centers; those employed longer hours each week relied on kith and kinproviders with lower education levels. Interrelationships among different quality measures are detailed. The policyimplications of such wide disparities in center and home-based care quality are discussed, including how statescould more carefully strengthen regulatory or quality improvement efforts.© 2004 Elsevier Inc. All rights reserved.
Keywords: Child care; Quality; Poor families
∗ Corresponding author. Tel.: +1 510 643 5362.E-mail address:b [email protected] (B. Fuller).
0885-2006/$ – see front matter © 2004 Elsevier Inc. All rights reserved.doi:10.1016/j.ecresq.2004.10.006
506 B. Fuller et al. / Early Childhood Research Quarterly 19 (2004) 505–527
1. Introduction
High quality preschools or child care centers have displayed encouraging gains in early language andcognitive development for children from poor families (for reviews,Barnett, 1995; Currie, 2001). Yetobserved effects on cognitive and social development are mixed among children sampled across ‘naturallyvarying’ centers, setting aside the carefully controlled demonstration programs. This may be linked tothe widely varying quality of centers operating among poor neighborhoods (Burchinal, 1999; Vandell& Pierce, 2003).
This prompts the first question addressed in this paper: What average levels of, and degree of variabilityin, center qualityare observed across low-income communities? Evidence is scarce, but limited findingsshow that structural measures of quality (e.g., child–staff ratios) may vary independently of processmeasures (e.g., child–caregiver social relations). Initial work suggests that centers in poor communitiescan display fairly high levels of quality on structural indicators, given the efficacy of state regulation andtargeted subsidies in some states (Loeb, Fuller, Kagan, & Carrol, 2004; Phillips, Voran, Kisker, Howes,& Whitebook, 1994).
Equally pressing are two parallel questions, How does the mean quality ofcenter-based programsdiffer from home-based care? And, similar to the question posed of centers, how can we characterizevariability in home care found in low-income communities? Just over 9.2 million children under age fivewere served by kith or kin providers on a regular basis, and another 2.4 million attended licensed familychild care homes (FCCHs) in 1997 (Smith, 2002). This compares to 5.8 million young children attendinga center in the same year.
Only three studies have been published to date that report on the observed quality of nonparentalhome settings, drawing on multi-state samples (Fosburg, 1982; Kontos, Howes, Shinn, & Galinsky,1994; NICHD, 2000). This is unfortunate, given that government support of home-based care has risendramatically for poor and working-class families in recent years (Blau, 2001). Moreover, little researchhas examined alternative ways of measuring quality in home-based settings which may be predictive ofchildren’s developmental trajectories.
We observed the quality of 166 center and 187 home-based child care arrangements utilized by mothersafter they entered a welfare-to-work program in California, Connecticut, or Florida in 1998. The home-based settings included 118 kith or kin arrangements and 69 licensed FCCHs. Our longitudinal study, ingeneral, focuses on the types and quality of child care selected as these mothers moved from welfare to paidjobs, and with what developmental consequences for their young children (Fuller, Kagan, & Loeb, 2002).
We begin by reviewing the field’s differing accounts of why quality varies so dramatically among localcommunities, and what we know empirically about the comparative quality of center versus home-basedprograms. Second, we describe the design of our study, report descriptive findings on the quality of carethat mothers selected, and identify possible factors that influence these child care selection patterns. Third,we show how nonparticipation rates in observational studies such as ours’ can bias estimates of qualitylevels. Finally, we discuss implications of our findings for policy makers and local practitioners.
1.1. The quality of child care available to poor families
Many conceptualize child care in America as amarket, comprised of organizations and individualsthat offer early care and education services. Parents express demand for these services and pay feesor, for low-income parents, government subsidizes organizations or aids families directly via child care

B. Fuller et al. / Early Childhood Research Quarterly 19 (2004) 505–527 507
vouchers. Within this framing, quality levels are then driven by market forces: “. . . the quality of carethat parents can access with child care subsidy funds is predominantly determined by the larger forcesthat shape the overall child care market” (Adams & Rohacek, 2002, p. 421; alsoBlau, 2001). To betterunderstand parental choice, researchers then move from this demand framework and study how parents’individual attributes – maternal education, parental beliefs, stress or other factors in the home – influencethe type or quality of care selected (Clarke-Stewart, 1999; Fuller, Holloway, & Liang, 1996).
Another conception of the child care sector begins not from the demand side but from the supplyside, emphasizing theinstitutionalactors that dominate a mixed market, yielding a range of local optionswhich display varying levels of quality. For example, Head Start preschools served about 813,000 3- and4-year-olds in 2001, regulated from Washington but run by local agencies. Another 765,000 childrenwere served through state preschool programs. In addition, federal child care block-grants and statematching funds supported over 2 million children, primarily through portable vouchers to parents (Adams& Rohacek, 2002). Differing quality standards are attached to these funding streams, often interactingwith state quality regulations. State determination of reimbursement rates for public child care providers,sometimes guided by market rates but politically determined in the end, also exemplifies non-marketforces at work (Adams et al., 2002). From this supply-side viewpoint, institutional factors shape localquality through mechanisms that play-out differently among states and regions.
This helps to explain why the quality of center care (or FCCHs) observed in earlier studies, appears tobe so variable across communities. If only market forces were at work, and given that poor families can notafford high fees, we would expect to see few centers in low-income neighborhoods and quality would beuniformly low. In fact, structural indicators of quality – including staffing ratios, teacher qualifications,and salaries – tend to berelatively high in many centers serving poor families, compared to centerssituated in blue-collar or middle-class communities where families neither afford high fees nor qualifyfor subsidies (Fuller, Raudenbush, Wei, & Holloway, 1993). Phillips et al. (1994)found comparativelyhigh levels of center quality on structural indicators, yet process indicators were low, including less robustchild–teacher interactions and lower educational content, compared to middle-class centers (also,Loebet al., 2004).
The consistent finding that children from poor families benefit most from quality centers is oftenexplained from a deficit perspective: these children enter with lower cognitive and language proficiencies,compared to middle-class children who benefit from stronger home practices (for review,Burchinal, 1999).But this pattern would also be evident if children from poor families benefit from relatively high qualitycenters, compared to lower quality centers that may be disproportionately situated in middle-class andblue-collar neighborhoods (Fuller & Strath, 2001).
Other studies, in contrast, show that low-income and non-English speaking parents are more likely toselect lower quality centers (along structural features or using the Early Childhood Environment RatingScale, ECERS), or these parents rely more on home-based providers who are less educated, on average,and less likely to create educationally rich settings for young children (CQO, 1995; Goelman & Pence,1987; NICHD, 1997).
Uneven quality levels among subsidized centers may be explained by institutional forces operatingat state and local levels. For example,Fuller et al. (2003)found that centers receiving a larger share oftheir budget from subsidies and falling under California’s tighter regulations displayed lower child–staffratios and fewer children per classroom, compared to fee-supported centers falling under less stringentstandards. When Florida improved required staffing ratios and teacher education levels, offering a naturalexperiment, the observed quality of centers and child outcomes rose markedly (Howes et al., 1998).

508 B. Fuller et al. / Early Childhood Research Quarterly 19 (2004) 505–527
Centers located in states with stronger quality regulations have generally scored higher on the ECERSthan centers serving similar populations in states with weaker standards (CQO Study Team, 1995;Holloway, Kagan, Fuller, Tsou, & Carroll, 2001). The NICHD study of early child care found that statequality standards likely matter, showing that children scored higher on school readiness and languagecomprehension at 36 months of age when they attended centers meeting several quality benchmarks,including staffing ratios and provider education levels, although few prior selection factors (for childrenor teachers) were available on which to control (NICHD, 1999).
The regulation of provider education levels, or stronger center subsidies to sustain better trained staff,may help to explain quality variation. For example, center staff with two or four-year college degreesmay display higher levels of sensitivity and responsiveness with preschool-age children (Howes, 1997;Howes, Whitebook, & Phillips, 1992; Hamre & Bridges, 2004). But we still do not know the magnitudewith which gradations of education or child development training yield significant child-level effects, dueto insufficient selection controls in early studies.
Despite these differing accounts for why quality varies across communities, we still know little aboutthe level and distribution of quality among low-income neighborhoods. With such scarce observationaldata from poor neighborhoods – for centers and home-based programs – evidence is equally thin regardinghow multiple gauges of quality may be interrelated or not.
1.2. Comparing the quality of center and home-based care
Most young children with working mothers still receive care in various types of home-based settings.In 1997, for example, among the nation’s 10.1 million children under 5 years old with anemployedmother, just over 44% were cared for by a grandparent or kin member other than the father, 15% byunrelated individuals, and 13% in regulated FCCHs (Smith, 2002). Among the additional 9.1 millionchildren withstay-at-homemothers, 20% received regular care from kin, 5% from unrelated individuals,and a negligible number from FCCH providers.
Kith and kin providers are subjected to criminal background checks in some states but rarely faceother regulatory requirements. They are increasingly reimbursed through federally funded vouchers,particularly after 1996 when welfare-to-work reforms spurred substantial increases in child care spending.Just over a fourth of all families supported through the federal child care block-grant, for instance, areusing unregulated kith or kin members as caregivers, about 700,000 families monthly (U.S. Department,2002). In California, just over half of all families in the state welfare-to-work program who drew childcare subsidies in 2001 were using unregulated kith or kin (Hirshberg, 2003).
Government’s rising support of informal arrangements has unfolded despite little evidence on thequality of these settings.Kontos et al. (1994)observed 226 home-based settings, including licensed andunlicensed FCCHs and individual caregivers, spread across three cities, revealing low levels of quality,on average. On the seven-point Family Day Care Rating Scale (FDCRS), just 9% scored in the “goodquality” range, defined as scale scores of between 5 and 7 points. Over a third scored in the ‘poor quality’range, with average scale scores of just 1 or 2 points, similar to five more modest evaluations reviewedby the Kontos team.1
1 This study suffered from a low response rate. Of the original 947 eligible parents drawn, 739 agreed to participate. But only145 of their providers agreed to be observed. A second sample was drawn, yielding an additional 81 providers. Any resultingbias may be in the direction of inflating the observed quality of these settings. That is, if the research team had gained access toa more random sample of home-based providers, average quality may have been lower.
B. Fuller et al. / Early Childhood Research Quarterly 19 (2004) 505–527 509
The Kontos study also found that young children were not more securely attached to kin members,compared to unrelated caregivers (two-thirds of all individual caregivers lived below the poverty line).This is consistent withFosburg’s (1982)finding, also based on observations, that kin providers tended tointeract less with young children, compared to unrelated caregivers. Forty-six percent of the kin providershad not completed high school, compared to just 9% of the FCCH providers. Regulated FCCHs weredisproportionately used by middle-class families, compared to low-income families who were more likelyto select kin providers.
The Kontos team also found that some indicators of quality were interrelated. Within home-basedsettings, FCCHs displayed the highest quality levels as gauged by the FDCRS and the Arnett Scale ofCaregiver Sensitivity; these providers expressed a stronger intent to stay in the early childhood field,compared to kin providers. FCCH providers, whether regulated or not, tended to care for more childrenduring the day, compared to kin providers, indicating that larger size may be a positive correlate of otherquality measures.
Holloway et al. (2001)observed somewhat higher quality among FCCHs in California and Connecti-cut in terms of mean FDCRS scores, compared to the Kontos findings, for sampled middle-class andlow-income families. The Kontos team reported FDCRS scores averaging 3.4 (out of 7 maximum, av-eraging across subscales), compared to a mean of 4.3 among the FCCHs observed in the Hollowaystudy. The latter team also reported wide variability in scores across individual FDCRS scales, rangingfrom a mean of 1.5 on children’s engagement with activity corners, to 3.0 on the use of worksheets,and 5.7 on the availability of sand or water play materials. FDCRS items related to play and learn-ing materials were moderately correlated to the caregivers’ education levels (r = .32, p< .01) but notto social-interaction items. FCCHs enrolling more children displayed higher scores on both dimen-sions of quality embedded in the FDCRS, compared to homes with fewer children (similar to Kontos’findings).
1.3. Research questions
Moving from these quality issues and the extant literature, we began our study focusing on a pair ofinterrelated questions: What types of child care do low-income parents select, and what is the observedquality of that care? The extent to which maternal employment shapes young children’s development islikely mediated, in part, by these child care selection patterns. Given scarce knowledge of how qualitymay vary across poor neighborhoods, we sampled families and followed children into their child careproviders in five cities situated across three states: California, Connecticut, and Florida.
Second, we compared the quality of center and home-based care, given the propensity of many poorfamilies to choose the latter and the lack of observational evidence from these settings. We adminis-tered measures of quality, especially gauges of child–caregiver interactions that allowed us to arrive atcomparative claims about the qualities of center versus home-based providers.
Third, we revisited the question of whether various dimensions of quality are interrelated, or whethercertain structural or social process measures may move independently among center and home-basedsettings in low-income communities.
Finally, we examine the predictive validity of contextual and family factors in estimating the qual-ity of care that mothers selected. This allowed us to illuminate the relative efficacy of institutional orcontextual factors, vis-a-vis family-level determinants. In turn, we then estimated the degree to whichnon-participation of some centers or home providers biased our estimated levels of quality.

510 B. Fuller et al. / Early Childhood Research Quarterly 19 (2004) 505–527
Table 1Attributes of all sampled mothers and children, 1998 (means and S.D.s reported;n= 927 families)
Research site Mother’s age(year)
Focal child’sage (month)
Ethnicity (%) No highschooldiploma (%)
Mother lives withat least one otheradult (%)Black Latino Vietnamese
San Francisco(n= 195)
29 28 57 (111) 18 (35) 0 (0) 59 (115) 66 (129)
San Jose (n= 219) 29 29 7 (15) 51 (112) 26 (57) 65 (142) 83 (182)Manchester
(n= 73)26 24 20 (15) 19 (14) 0 (0) 35 (26) 42 (31)
New Haven(n= 238)
25 25 44 (105) 21 (50) 0 (0) 36 (86) 36 (86)
Tampa (n= 202) 32 29 47 (95) 14 (28) 1 (2) 50 (101) 52 (105)
2. Procedures
2.1. Sample—families and child care settings
We randomly sampled single mothers with at least one child, 12–42 months of age, during the secondhalf of 1998. All women had recently entered their state’s new welfare-to-work program, placing imme-diate pressure on them to find paid work outside the home. In our Florida (Tampa) and two California(San Francisco and San Jose) sites, we conducted a maternal interview, lasting 90–120 min, at the localwelfare office or by phone. In Connecticut (Manchester and New Haven), participating mothers wereinterviewed by phone.2 Among the women meeting the screening criteria – unmarried mothers enteringnew welfare programs with a young child – 89% agreed to sit for the first interview. This resulted in asample of 927 initial participants, spread across the 5 sites. If more than one child fell into our target agerange, we selected the eldest as the focal child.
A follow-up interview on a variety of child care issues was then conducted between four and 18 monthsafter the initial interview, after most women had selected a child care provider.3 The data for the presentpaper stem from the subset who reported using a nonparental child care provider for at least 10 h per week,equaling 568 of the original mothers. The Connecticut families entered a random-assignment experiment,whereas no assignment to a control group was possible in California or Florida. The present analysis isnot affected by the experimental design of the Connecticut substudy.
Table 1reports basic characteristics forall sampled mothers and children, whether or not they selecteda nonparental child care provider. Most mothers were in their mid to late 20s and had modest levels ofschool attainment, with significant variability across the city sites. The mean focal child’s age ranged
2 The Connecticut families were part of a random-assignment experiment which included splitting the mothers into a programor control group. The latter half of the sample did not face pressure to work outside the home, nor did they face time limits onreceiving cash aid. Inclusion in the control group, however, had no significant effect on quality of care selected when tested inour selection models. All other design features, maternal interview data, and observational methods were identical across all fiveresearch sites. For additional details on the Connecticut subsample, seeFuller et al. (2002).
3 Interviews of Connecticut mothers occurred about 18 months after they entered the state’s new welfare experiment. Duringthe initial interviews we discovered that many women already were using a child care provider, since they were working part-timeeven though eligible for cash aid, or they were unemployed but had enrolled their child in a center or FCCH program.
B. Fuller et al. / Early Childhood Research Quarterly 19 (2004) 505–527 511
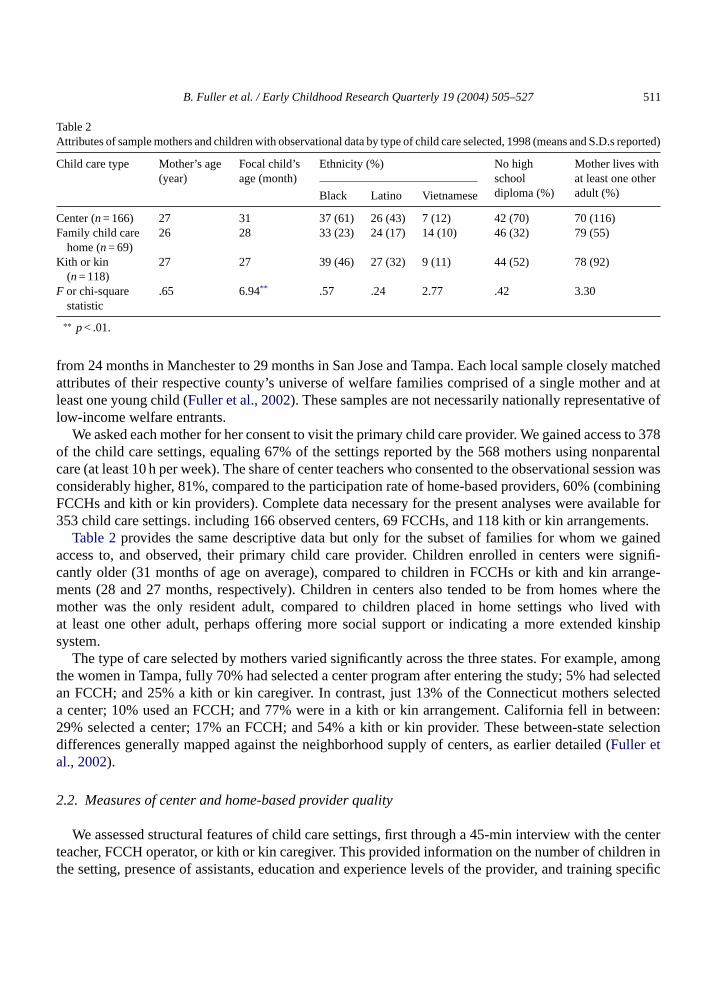
Table 2Attributes of sample mothers and children with observational data by type of child care selected, 1998 (means and S.D.s reported)
Child care type Mother’s age(year)
Focal child’sage (month)
Ethnicity (%) No highschooldiploma (%)
Mother lives withat least one otheradult (%)Black Latino Vietnamese
Center (n= 166) 27 31 37 (61) 26 (43) 7 (12) 42 (70) 70 (116)Family child care
home (n= 69)26 28 33 (23) 24 (17) 14 (10) 46 (32) 79 (55)
Kith or kin(n= 118)
27 27 39 (46) 27 (32) 9 (11) 44 (52) 78 (92)
F or chi-squarestatistic
.65 6.94** .57 .24 2.77 .42 3.30
∗∗ p< .01.
from 24 months in Manchester to 29 months in San Jose and Tampa. Each local sample closely matchedattributes of their respective county’s universe of welfare families comprised of a single mother and atleast one young child (Fuller et al., 2002). These samples are not necessarily nationally representative oflow-income welfare entrants.
We asked each mother for her consent to visit the primary child care provider. We gained access to 378of the child care settings, equaling 67% of the settings reported by the 568 mothers using nonparentalcare (at least 10 h per week). The share of center teachers who consented to the observational session wasconsiderably higher, 81%, compared to the participation rate of home-based providers, 60% (combiningFCCHs and kith or kin providers). Complete data necessary for the present analyses were available for353 child care settings. including 166 observed centers, 69 FCCHs, and 118 kith or kin arrangements.
Table 2provides the same descriptive data but only for the subset of families for whom we gainedaccess to, and observed, their primary child care provider. Children enrolled in centers were signifi-cantly older (31 months of age on average), compared to children in FCCHs or kith and kin arrange-ments (28 and 27 months, respectively). Children in centers also tended to be from homes where themother was the only resident adult, compared to children placed in home settings who lived withat least one other adult, perhaps offering more social support or indicating a more extended kinshipsystem.
The type of care selected by mothers varied significantly across the three states. For example, amongthe women in Tampa, fully 70% had selected a center program after entering the study; 5% had selectedan FCCH; and 25% a kith or kin caregiver. In contrast, just 13% of the Connecticut mothers selecteda center; 10% used an FCCH; and 77% were in a kith or kin arrangement. California fell in between:29% selected a center; 17% an FCCH; and 54% a kith or kin provider. These between-state selectiondifferences generally mapped against the neighborhood supply of centers, as earlier detailed (Fuller etal., 2002).
2.2. Measures of center and home-based provider quality
We assessed structural features of child care settings, first through a 45-min interview with the centerteacher, FCCH operator, or kith or kin caregiver. This provided information on the number of children inthe setting, presence of assistants, education and experience levels of the provider, and training specific

512 B. Fuller et al. / Early Childhood Research Quarterly 19 (2004) 505–527
to child development. The child–staff ratio and group size were verified during our observations but onlyfor the day we visited.
During the observation, be it a center or home, we administered the Arnett Scale of Caregiver Behavior(Arnett, 1989). It focuses on the character of social interaction between child and caregiver, includingthe caregiver’s attentiveness and responsiveness, propensity to explain misbehavior and reason with thechild, as well as warmth and affect. Items coded by the field researcher included, “(caregiver) speakswarmly to the children” and “pays positive attention to the children as individuals.” The Arnett Scale alsomeasures the extent to which caregivers explain misbehavior or more cooperative behavior, rather thandisciplining through directives absent explanation. Field staff were trained centrally on all observationsmeasures and required to reach a 90% level of inter-rater agreement on individual scales for the Arnettand for the other observation measures discussed below.
We also employed the Child–Caregiver Observation System (C-COS) developed by MathematicaPolicy Research, Inc. for the national evaluation of Early Head Start. This is a low-inference recording ofactions in which the focal child and/or provider is engaged over 40 timed snapshots. Field staff, duringeach 30-s snapshot, check-off possible behaviors, including verbal interaction between the provider andchild, either actor initiating a question, child is working with materials, the child’s emotional responses asa result of activity or interaction, watching television or video, and overall ratings regarding the warmthand responsiveness manifest in the child–caregiver relationship over the 40 snapshots. During trainingsessions, before they could begin field work, each staff member reached 90% inter-rater agreement amongthe 22 possible behaviors or emotional reactions observed across 10 snapshots.
At the end of the observation period field staff completed the ECERS for centers and the FDCRS for allhome-based settings. Each instrument gauges a variety of structural and physical aspects of organizations,such as facilities quality, availability of developmentally appropriate learning and play materials, thearrangement of child activities, and the nature of child–caregiver interaction (Harms, Clifford, & Cryer,1997).4 We had reservations about using the FDCRS in kith and kin settings, since it awards higherscores to home settings that are formally arranged for children and in ways that resemble centers. Butthese scores were supplemented by the social-interaction constructs gauged by the Arnett and C-COSinstruments. The majority of mothers selecting FCCHs resided in San Jose, a limitation discussed below.
2.3. Predictors of child care quality selected by mothers
Attention to the selection of child care of varying quality informs two questions. First, we know littleabout whether family-level factors shape the quality of care that parents ‘choose,’ be it a center or home-based provider. Given the institutional forces sketched above, family-level factors may play less of rolethan subsidy and regulatory policies, at least in low-income communities. Second, earlier observationalstudies of child care quality have suffered from widely varying response rates. Gaining access to homesettings, often selected by low-income parents, has been difficult for research teams. A typical design is tofocus exclusively on centers, sampling organizations directly rather than families that sort into differingtypes of care. This serves to boost response rates but also narrows variability among families. Center-
4 We decided to use the ECERS, rather than the ITERS, assuming that most children would be at the upper end of our agedistribution. This proved to be true: two-thirds of the participating children enrolled in centers were 24 months or older. Andsince our sample was split between children in center or home-based care, we did not want to introduce another quality measurefor this small group of young toddlers.
B. Fuller et al. / Early Childhood Research Quarterly 19 (2004) 505–527 513
focused designs obviously ignore home-based settings. In addition, the factors driving selection into childcare types, or settings of variable quality, can not be studied.
By starting with families, rather than child care settings, we can model predictors of selected quality,then use this information to adjust for possible bias due to limited, non-random access to center or homesettings. We studied several factors, through multivariate regression, that helped to explain the qualityof center or home-based care. After identifying these selection factors, we then estimate the quality ofcenter and home care for our entire family sample, and compare these predicted quality levels againstobserved levels.
Maternal-level factors include mother’s age, ethnicity, school attainment (dichotomously coded asreceiving a high school diploma or not), mother’s Peabody Picture Vocabulary Test (PPVT) score (per-centile score,Dunn & Dunn, 1997), employment status (currently working, regular hours or odd-hours),and frequency with which the mother reads with the child, a measure from the HOME Inventory(Bradley, 1993).5 These data were obtained during our initial interview in 1998, with the exceptionof the PPVT administration which occurred during our home visit during wave 2 data collection in2000.
Data on several contextual factors were available to make our selection model more complete, includingthe research site (coded as dummy variables with Tampa as the base) and the number of center-basedenrollment slots operating in each mother’s census tract in 1998. These data were collected from state andlocal agencies that license or register centers. We also examined the possible influence of family income,ethnic composition, and mean school attainment levels within sampled mothers’ respective census tracts,but these demographics features were not related to quality of care selected.
2.4. Sharpening quality measures—principal components analysis
We factor analyzed the standard instruments – including ECERS, FDCRS, Arnett and C-COS scales –to assess underlying constructs which could be identified. For example, the principal components analysisidentified two dimensions across the Arnett scales for our sample of providers (with Eigen values greaterthan 1). The first dimension appeared to capture the provider’s positive affect and responsiveness tochildren (11 items, alpha = .89). The second dimension, comprised of three items, was related to theprovider’s explanations and talk with the child, for instance, explaining to the youngster why his or hermisbehavior was not appropriate (5 items, alpha = .74). This construct proved to effectively discriminatedifferent child care settings.
The principal components analysis of the ECERS scales revealed two distinct factors: eight items relatedto structured learning or play activities (alpha = .98), and several remaining items related to facilities andfurnishings in the classroom or outdoor play area (7 items, alpha = .97). The former composite proved tobe more robust when estimating quality levels of centers selected by mothers. Similarly, the FDCRS scalessplit into the structured-activities dimension (11 items, alpha = .98) and into items related to discipline andsocialization (5 items, alpha = .94). Again, the former composite (alpha = .98) displayed high inter-item
5 Other home practices, including pro-developmental activities from the HOME inventory, such as reading with one’s child,were not related to quality of care selected. A variety of social support measures also held no significant relationship to thequality of care selected. We examined the time spent in the social welfare system (months on cash aid) and involvement withother family support programs, but these factors were not related to quality selection. They were dropped from final selectionmodels, detailed below.
514 B. Fuller et al. / Early Childhood Research Quarterly 19 (2004) 505–527
reliability and predictive validity in estimating quality levels selected by mothers. The most internallyreliable C-COS items related to the frequency of interaction between provider and child, including theprovider’s propensity to invite the child’s verbalization, and engagement of the child in group activities,as opposed to wandering about unengaged in any identifiable activity or social interaction (7 items intotal, alpha = .90).6
3. Findings
3.1. Data analysis plan
Our analysis involved three steps. We identified distinct dimensions of quality gauged by several scales,and studied the extent to which these multiple measures were interrelated. Next, we examined meandifferences quality levels observed in centers versus home-based settings across the multiple indicators.We have separated home-based settings between FCCHs and kith or kin arrangements in all but one case,as detailed below. Finally, we analyzed how contextual factors and family-level factors were related tothe quality of care that mothers selected.
3.2. Interrelationships among the quality measures
The quality measures were interrelated in several instances. Details of this correlational analysis appearin Appendix A. When observing inside centers, the ECERS was related to basic indicators of socialinteraction: the propensity of the provider to engage the child in talk and less disengagement by the focalchild in classroom activities (both from the C-COS). In addition, focal children were more consistentlyengaged when teachers displayed a higher propensity to reason and explain actions to children. Teacherreasoning was negatively related to the simple count of teacher–child interactions, suggesting that lessadult talk was required for group management or discipline. Note that reported associations are significantatp< .05 or stronger.
Social-interaction measures embedded in the C-COS behaved differently relative to the other qualitymeasures used within FCCH and kith or kin settings. Despite the lower count of FCCHs selected bymothers, compared to center or kith and kin providers, the frequency of verbal interaction between theprovider and focal child, as well as the propensity of the provider to ask questions, was significantlyrelated to the sensitivity and responsiveness dimension of the Arnett. Within kith and kin settings, themeasures tended to be more highly interrelated: the frequency of provider–child interaction (C-COS)was significantly correlated with the provider’s education level; the reasoning dimension of the Arnettwas negatively related to propensity of the focal child to be watching television; frequency of providerquestions to the child was associated with the overall FDCRS score (again, each correlation withp< .05).
Overall, we observed some associations between selected measures of quality. Yet with the ex-ception of kith and kin settings, the Arnett, ECERS and FDCRS, and C-COS were not alwaysinterrelated.Appendix B provides correlations for all measures, split for center and home-basedproviders.
6 Details on the principal components analyses and exact scales contributing to the composites are available from the authors.
B. Fuller et al. / Early Childhood Research Quarterly 19 (2004) 505–527 515
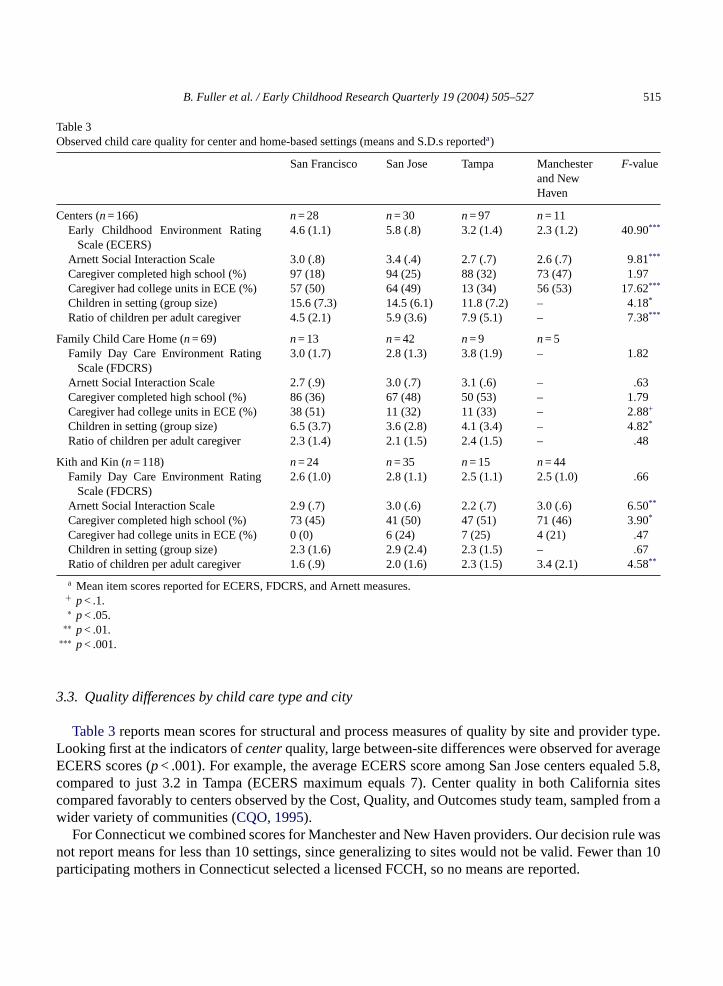
Table 3Observed child care quality for center and home-based settings (means and S.D.s reporteda)
San Francisco San Jose Tampa Manchesterand NewHaven
F-value
Centers (n= 166) n= 28 n= 30 n= 97 n= 11Early Childhood Environment Rating
Scale (ECERS)4.6 (1.1) 5.8 (.8) 3.2 (1.4) 2.3 (1.2) 40.90***
Arnett Social Interaction Scale 3.0 (.8) 3.4 (.4) 2.7 (.7) 2.6 (.7) 9.81***
Caregiver completed high school (%) 97 (18) 94 (25) 88 (32) 73 (47) 1.97Caregiver had college units in ECE (%) 57 (50) 64 (49) 13 (34) 56 (53) 17.62***
Children in setting (group size) 15.6 (7.3) 14.5 (6.1) 11.8 (7.2) – 4.18*
Ratio of children per adult caregiver 4.5 (2.1) 5.9 (3.6) 7.9 (5.1) – 7.38***
Family Child Care Home (n= 69) n= 13 n= 42 n= 9 n= 5Family Day Care Environment Rating
Scale (FDCRS)3.0 (1.7) 2.8 (1.3) 3.8 (1.9) – 1.82
Arnett Social Interaction Scale 2.7 (.9) 3.0 (.7) 3.1 (.6) – .63Caregiver completed high school (%) 86 (36) 67 (48) 50 (53) – 1.79Caregiver had college units in ECE (%) 38 (51) 11 (32) 11 (33) – 2.88+
Children in setting (group size) 6.5 (3.7) 3.6 (2.8) 4.1 (3.4) – 4.82*
Ratio of children per adult caregiver 2.3 (1.4) 2.1 (1.5) 2.4 (1.5) – .48
Kith and Kin (n= 118) n= 24 n= 35 n= 15 n= 44Family Day Care Environment Rating
Scale (FDCRS)2.6 (1.0) 2.8 (1.1) 2.5 (1.1) 2.5 (1.0) .66
Arnett Social Interaction Scale 2.9 (.7) 3.0 (.6) 2.2 (.7) 3.0 (.6) 6.50**
Caregiver completed high school (%) 73 (45) 41 (50) 47 (51) 71 (46) 3.90*
Caregiver had college units in ECE (%) 0 (0) 6 (24) 7 (25) 4 (21) .47Children in setting (group size) 2.3 (1.6) 2.9 (2.4) 2.3 (1.5) – .67Ratio of children per adult caregiver 1.6 (.9) 2.0 (1.6) 2.3 (1.5) 3.4 (2.1) 4.58**
a Mean item scores reported for ECERS, FDCRS, and Arnett measures.+ p< .1.∗ p< .05.
∗∗ p< .01.∗∗∗ p< .001.
3.3. Quality differences by child care type and city
Table 3reports mean scores for structural and process measures of quality by site and provider type.Looking first at the indicators ofcenterquality, large between-site differences were observed for averageECERS scores (p< .001). For example, the average ECERS score among San Jose centers equaled 5.8,compared to just 3.2 in Tampa (ECERS maximum equals 7). Center quality in both California sitescompared favorably to centers observed by the Cost, Quality, and Outcomes study team, sampled from awider variety of communities (CQO, 1995).
For Connecticut we combined scores for Manchester and New Haven providers. Our decision rule wasnot report means for less than 10 settings, since generalizing to sites would not be valid. Fewer than 10participating mothers in Connecticut selected a licensed FCCH, so no means are reported.

516 B. Fuller et al. / Early Childhood Research Quarterly 19 (2004) 505–527
Arnett scores followed a similar pattern, but the differences were not as wide, ranging from 3.4 in SanJose centers to 2.4 in Manchester (maximum score equals 4,p< .001). Arnett scores ranged lower in the11 Connecticut centers to which we gained access, but the variability was not as great as that observedacross ECERS scores.
Staffing ratios were significantly higher in Tampa centers, averaging 7.9 children per adult, comparedto just 4.5–1 in San Francisco centers (p< .001). Again, the California centers compared favorably toearlier observational studies. For example, the NICHD study of early child care observed 7.0 children perstaff member in class groups with 3-year-olds, and 5.2–1 for groups with 4-year-olds (NICHD, 1997). TheAmerican Academy of Pediatrics recommends ratios of 7 to 1 for 3-year-olds and 4 to 1 for 2-year-olds.
The smallest class groups were observed in Tampa, equaling 11.8 children, compared to 15.6 in SanFrancisco centers (p< .05). Tampa centers relied less on classroom aides which accounts for why thesecenters had the highest staffing ratio with somewhat smaller class groups.
Over 80% of lead teachers in each city reported they had completed high school, except among the fewcenters observed in Manchester. The share of center teachers with college-level units in early childhoodeducation (ECE) was lower for staff in Tampa centers.
Caution is warranted in interpreting the findings forfamily child care homes(FCCHs), since SanJose mothers disproportionately made up the group selecting this type of care. Structural measures didsignificantly differ across sites. Average group size in FCCHs was significantly higher in San Francisco,6.5 children on average, compared to San Jose (3.6) and Tampa (4.1,p< .05). Staffing ratios reflectedthis difference but were not statistically significant. Mean FDCRS scores overall were quite similar toaverage levels observed byKontos et al. (1994)for their sample of lower income families.
The character and quality ofkith and kinproviders varied among sites, primarily in terms of schoolattainment and child–staff ratios. Education levels were considerably higher in Manchester and SanFrancisco, where 89% and 73% had completed high school, respectively, compared to just 41% in San Jose(p< .05). This pattern was not consistently associated with Arnett scores, with San Francisco caregiversscoring relatively high at 2.9, along with San Jose caregivers, despite their low education levels, scoringat 2.9, as well. In contrast, Tampa caregivers were poorly educated and displayed low Arnett scores,averaging 2.2 on these four-point scales (p< .01).
3.4. Explaining the quality of care selected
In total, we regressed nine separate quality indicators on contextual and maternal-level factors that maycontribute to the quality ofcentersselected by mothers. For centers, this included the total ECERS score,the two ECERS dimensions (described in the methods section), the two Arnett dimensions, and the threeC-COS factors related to social-interaction patterns. We also estimated the child–staff ratio from the sameselection factors. All predictors were entered simultaneously. We experimented with entering differingblocks of predictors, but the basic multivariate story is quite clear with the simple, one step procedure.Dummy variables for sites were created in a standard manner, a value of 1 indicates the family lived inthat particular city and a zero indicates that the family did not reside in that site. Tampa is the excludedsite in all regression estimations.
From among these seven regressions, four explained at least 10% of the variance in the quality outcome(adjustedr2). The same number of regression estimations were studied forhome-basedcare, includingand then excluding FCCHs. Five of nine regressions accounted for at least 10% of the variance in thequality indicator.

B. Fuller et al. / Early Childhood Research Quarterly 19 (2004) 505–527 517
Table 4Estimating the quality of centers selected by mothers (β coefficients and unstandardized S.E.s reported)
ECERS averagescore
ECERS factor:structuredlearningactivities
Arnett factor:provider’sverbalexplanations
C-COS factor: focalchild interactionwith caregiver
New Haven −.63 (.67) −.79 (.77) .31 (.42) 1.99 (1.94)Manchester −2.05 (.81)* −2.71 (.93)** .06 (.52) 1.60 (2.11)San Francisco 1.43 (.36)*** 1.68 (.41)*** .58 (.23)* 4.39 (.88)***
San Jose 2.36 (.35)*** 2.32 (.40)*** 1.18 (.24)*** 3.46 (.90)***
Capacity 4.3e−5 (3.1e−4) 1.2e−4 (3.6e−4) −1.3e−4 (2.1e−4) 4.5e−4 (8.2e−4)Latina −.16 (.32) −.28 (.37) −.02 (.21) −.65 (.83)African American −.25 (.30) −.45 (.35) −.01 (.19) −1.15 (.78)Asian American −.03 (.61) .09 (.69) −.63 (.38) −1.45 (1.56)Mother’s school attainment:
did not complete highschool
.18 (.23) .27 (.26) −.18 (.16) −.38 (.61)
Mother’s age .01 (.02) .003 (.02) −.02 (.01) −.03 (.04)Frequency of readings to
child.04 (.12) −.03 (.14) −.10 (.01) −.16 (.32)
Mother’s weekly workinghours
.003 (.01) .004 (.01) .001 (.004) .02 (.01)
Mother’s weekly workinghours (missing dummy)
−.26 (.76) −.23 (.86) .93 (.51)+ −.34 (2.1)
Mother’s working onregular daytime schedule
.16 (.25) .29 (.28) .19 (.16) −.05 (.64)
Mother’s working onregular daytime schedule(missing dummy)
.65 (.77) .65 (.88) −.65 (.51) 1.17 (2.1)
Mother’s PPVT score .04 (.02)+ .03 (.24) 3.4e−4 (.01) .005 (.05)Mother’s PPVT score
(missing dummy)3.11 (1.82)+ 3.0 (2.1) .10 (1.13) .44 (4.59)
Intercept −.34 .34 3.7 2.28F statistic 6.17*** 5.56*** 2.77*** 2.89***
N of cases 140 140 131 145Adjustedr2 .39 .36 .19 .18
+ p< .10, for correspondingt-statistics.∗ p< .05, for correspondingt-statistics.
∗∗ p< .01, for correspondingt-statistics.∗∗∗ p< .001, for correspondingt-statistics.
Table 4reports the estimation models for mothers selecting centers. Similar to the descriptive statisticsabove, the city in which the mother resided makes a sizeable difference in estimating the total ECERSscore, the ECERS dimension related to structured learning activities, the reasoning and explanationdimension of the Arnett, and frequency of verbal interaction between the focal child and provider.
Mothers with higher PPVT scores tended to select centers with slightly higher ECERS scores. Mothersemployed for more hours weekly tended to select centers where the observed teacher scored higher on the

518 B. Fuller et al. / Early Childhood Research Quarterly 19 (2004) 505–527
explanations dimension of the Arnett (p< .06). Overall, the mother’s city of residence is more stronglyrelated to center quality than maternal or family-level attributes. This suggests that institutional forcesmay more strongly shape the quality of centers locally available than household-level factors, at leastamong the selection determinants that we measured.
These same selection models behave differently when estimating the quality of allhome-basedproviders, including FCCH and kith and kin providers. We display inTable 5the regression modelswhich include a dummy variable indicating whether the provider was an FCCH (value coded, 1) or a kithor kin provider (coded, 0). FDCRS scores ranged higher in the two Connecticut sites, with the FCCHdummy variable in the model. FCCHs, on average, displayed higher FDCRS scores on the structuredlearning activities dimension, compared to kith and kin arrangements.
When estimating mean Arnett scores, we see that Asian American mothers (disproportion-ately represented in the San Jose site) selected home-based providers that scored one-half pointlower on the four-point Arnett Scale. This may be linked to lower education levels among Viet-namese American mothers, and presumably their kith and kin members, relative to other ethnicgroups.
We estimated the provider’s education level – for either the center teacher or home-based provider –with a logistic regression that reports on the likelihood of completing high school (final column,Table 5).San Francisco providers were more likely to have completed high school, relative to Tampa home-basedproviders (p< .05). Importantly, FCCHs providers were more likely to have completed high school,compared to kith and kin home providers (p< .01). Mothers who worked more hours per week tended toselect less well educated providers. It may be that mothers who labor for more hours per week must relymore heavily on kith or kin, finding only part-day center arrangements, and tend to spend less time withtheir child (suggested byFuller, Kagan, & Loeb, 2002).
Finally, we ran identical regression estimates of quality selected just for mothers who selected a kithor kin provider, dropping the FCCH cases. Latina and Black mothers selected kith or kin caregiverswith lower FDCRS scores and fewer structured learning activities, but Arnett scores were no different,compared to White mothers and their selected kith or kin providers. Arnett scores were lower within kithand kin settings selected by mothers who were employed for longer hours each week (all correspondingcoefficients significant atp< .05).
3.5. Estimating quality levels for the entire family sample
Moving from the parameters identified in these selection models, we then estimated mean qualitylevels in a second set of regressions after including all mothers interviewed, independent of whether wehad gained access to their child care provider. For example, we obtained complete interview data on 200mothers who reported using centers but observed 166 of these centers. Similarly, complete interview datafor mothers selecting a kith or kin provider were available for 293 mothers, even though we observed just118 of their providers.
Table 6summarizes the results from this second set of regressions, after estimating mean quality levelsfor the complete set of families using either a center or kith or kin provider. The mean ECERS scalescore, for instance, equaled 3.9 among the 166 observed centers. But the estimated mean is just 3.4 afterincluding all 200 families in the selection model (p< .01). The pattern is similar for the structured learningactivities dimension of the ECERS, suggesting that observed centers are of higher quality than the broaderrange of centers selected by the entire family sample. However, no significant differences were detected

B.F
ulle
re
tal./E
arly
Ch
ildh
oo
dR
ese
arch
Qu
arte
rly1
9(2
00
4)
50
5–
52
7519
Table 5Estimating the quality of home-based providers selected by mothers, including family child care homes (β coefficients and unstandardized S.E.s reported)
FDCRS meanscale score
FDCRS factor:structuredlearningactivities
Arnett meanscale score
Child–adultstaffingratio
Caregiver’sschoolattainment
New Haven −.40 (.38) −.32 (.39) .62 (.23)** 2.24 (.60)*** 1.52 (.72)*
Manchester −.55 (.57) −.43 (.58) .47 (.44) .90 (1.01) –San Francisco −.34 (.36) −.24 (.37) .42 (.22)+ −.36 (.47) 1.64 (.71)*
San Jose −.36 (.35) −.28 (.35) .42 (.22)+ .07 (.45) .27 (.63)Capacity −2.1e−4 (2.3e−4) −3.1e−4 (2.3e−4) −2.7e−4 (1.4e−4)+ −2.2e−4 (3.2e−4) −1.1e−4 (4e−4)Family child care home .48 (.21)* .63 (2.92)** .16 (.13) .50 (.28)+ 1.13 (.43)**
Latina −.16 (.28) −1.17 (.29) −.30 (.18)+ .46 (.38) −.38 (.54)African American −.30 (.25) −.36 (.25) −.19 (.17) −.02 (.36) −.12 (.49)Asian American −.18 (.38) −.00 (.38) −.50 (.25)* −.10 (.51) .17 (.78)Mother’s school attainment: did
not complete high school.05 (.20) .03 (.20) .17 (.12) −.16 (.28) .04 (.38)
Mother’s age −.02 (.02) −.01 (.02) .001 (.01) .01 (.02) .03 (.03)Frequency of readings to child −.13 (.10) −.11 (.10) −.14 (.07)* −.07 (.14) −.47 (.81)*
Mother’s weekly working hours −.004 (.01) −.01 (.01) −.01 (.003)+ .003 (.01) −.02 (.01)*
Mother’s weekly working hours(missing dummy)
.08 (.38) −.02 (.39) .34 (.24) −.11 (.60) −.67 (.77)
Mother’s working on regulardaytime schedule
.02 (.24) −.002 (.25) .08 (.16) −.35 (.32) −.26 (.46)
Mother’s working on regulardaytime schedule (missingdummy)
.07 (.40) .09 (.40) −.15 (.25) −.48 (.61) −.39 (.81)
Mother’s PPVT score .01 (.01) .01 (.01) .01 (.01) .03 (.02) .02 (.03)Mother’s PPVT score (missing
dummy).70 (1.28) .97 (1.30) .76 (.85) 1.90 (1.87) 1.89 (2.54)
Intercept 3.24 2.67 2.33 −.44 −.38F statistic .84 1.18 2.05* 2.20** 36.9 (chi-square)**
N of cases 166 166 127 142 169Adjustedr2 .09 .13 .13 .13 .17
+ p< .10, for correspondingt-statistics.∗ p< .05, for correspondingt-statistics.
∗∗ p< .01, for correspondingt-statistics.∗∗∗ p< .001, for correspondingt-statistics.

520 B. Fuller et al. / Early Childhood Research Quarterly 19 (2004) 505–527
Table 6Quality levels for observed providers and estimated for all providers selected by mothers (means and S.D.s reported)
Quality measure Observed providers Estimated for all reported providers T-value
Centers n= 166 n= 200ECERS, mean scale score 3.9 (1.65) 3.4 (1.28) 2.83**
ECERS, structured learning activities 4.2 (1.83) 3.7 (1.44) 2.93***
Arnett, verbal explanations 3.3 (.94) 3.4 (.53) n.s.C-COS child–caregiver Interaction 2.9 (3.69) 2.9 (1.78) n.s.
Kith and kin settings n= 118 n= 293FDCRS, mean scale score 2.6 (1.05) 2.5 (.37) n.s.Arnett, mean scale score 2.9 (.70) 2.9 (.39) n.s.Child–staff ratio 2.2 (1.62) 2.7 (1.12) 2.76**
∗∗ p< .01.∗∗∗ p< .005.
for the Arnett reasoning and explanation dimension, nor for the child–provider interaction dimension ofthe C-COS.7
Differences were not observed for the FDCRS mean score, nor for the Arnett, among observed kith andkin versus estimated levels for the entire family sample. However, the child–staff ratio was significantlylower in the observed settings, compared to the estimated ratio for all kith and kin settings. Again, thoseproviders who allowed our field staff to visit tended to be of higher quality than those providers or motherswho denied access.
4. Discussion
Returning to our core questions, we first emphasize that these mothers selected child care providers ofwidely varying quality. For those who selectedcenters, indicators of quality varied significantly acrossthe five cities. This was particularly true for the ECERS and Arnett scores which corresponded to theteacher’s education level and the classroom’s child–staff ratio. Overall, quality levels were not impressive,except for centers in San Francisco and San Jose where ECERS scores and teachers’ school attainmentwere quite high, at least compared to earlier studies conducted in low or middle-income communities.
Family child care homesdisplayed significantly higher quality on multiple measures, compared tokithand kin settings, including FDCRS scores and provider education levels. Importantly, quality levels ofFCCHs, while ranging lower than centers, were less variable across sites. Whether institutional forcesare weaker than market forces, such as FCCH regulatory standards or subsidy levels, remains an openquestion. Caution is warranted in generalizing from these findings, since many of the mothers selectingFCCHs resided in San Jose. In California, higher center quality may be the result of higher qualitystandards, reimbursement levels, or stronger staff development efforts, compared to Connecticut andFlorida, but such policies didnotyield similar between-site differences in FCCH quality.
7 Again, these are the quality indicators for which we could explain at least 0.10 of the variance, based on the quality selectionmodels.
B. Fuller et al. / Early Childhood Research Quarterly 19 (2004) 505–527 521
Kith and kin providers scored quite low on the FDCRS. We do not know whether this measure, designedfor organized FCCHs, holds predictive validity when used in these less formal settings. Arnett Scale scoreswere not significantly lower in kith or kin settings, compared to centers or FCCHs, suggesting that socialrelations vary along different dimensions, compared to levels of materials, structured tasks, and facilities.The share of kith and kin providers who had completed high school or ECE units was considerably lower,compared to center teachers or FCCH providers. This may account for somewhat higher cognitive growthobserved for children attending higher quality FCCHs, compared to kith and kin arrangements (Loeb etal., 2004).
4.1. Institutional context and family-level selection factors
Variation in the quality of centers selected was strongly related to the mother’s city of residence. Thissuggests that states or locales differ in their capacity to advance center quality over time, or their abilityto widen poor families’ access to higher quality centers. Mothers working more hours per week tended toselect lower quality providers, and Asian American (mainly Vietnamese) mothers selected home-basedproviders who scored lower on the Arnett Scale, compared to providers selected by other ethnic groups.Otherwise, individual and family-level factors were weak in explaining the quality of care selected,particularly relative to site effects. This suggests that for low-income families, institutional mechanismsthat expand center supply or regulate quality more effectively play a forceful role relative to family-levelselection factors.
We found that organizational measures of centers, including many items on the ECERS, weremoderately related to social-interaction measures. Children were more engaged in activities (ratherthan wandering unoccupied, as recorded with the C-COS) when attending centers that displayedhigher ECERS and Arnett scores. For FCCH providers, the C-COS interaction measures, especiallythe amount of verbal interaction between child and caregiver, were significantly related to Arnettscores.
Still, more work is required to understand how the organizational structure of settings – including the ar-rangement of learning tasks and adult language opportunities – is related to the character of child–caregiverinteraction and how these dimensions of quality may play out differently in centers versus home settings.On balance, the ways in which children were socially engaged in centers with better educated teachers ap-pear to be linked to the supply of materials and some degree of formalization observed within classrooms(as gauged by the ECERS).
Overall, these findings suggest that the field might reflect on how we conceive of child care selection.Our finding that maternal and family-level factors held little predictive power in estimating the qualityof care selected – but city of residence held a strong relationship – calls out for more attention to localcontext, including how state and local agencies shape the availability of center programs in low-incomecommunities. Our own earlier work adopted family-level demand models, often from economists, inestimating selection patterns. But if local supply, regulations, and subsidy flows (for low-income families)are at work, we risk over emphasizing the role of family-level selection factors.
4.2. Policy implications
Three basic policy implications emerge from these findings. First, low quality levels observed amongmany home-based settings – including care by poorly educated adults – is worrisome. Rising appropri-

522 B. Fuller et al. / Early Childhood Research Quarterly 19 (2004) 505–527
ations for child care, witnessed over the past decade, have greatly expanded the availability of parentalvouchers, often reimbursing kith and kin members for their services. While perhaps a sensible income-support policy, this strategy appears to legitimate and support low quality care in many instances. Theopportunity cost is high: these public dollars are diverted away from centers and the possibility of strength-ening the center and preschool infrastructure.
One countervailing force is that many low-income women work at night or on weekends when fewcenters can afford to remain open. Unless the financing of centers improves, home-based providers willremain the only option for millions of low-wage workers.
Second, the consistent finding that mothers employed for longer hours each week selected lower qualityhome-based providers is troubling as well, especially in light of recurring political pressure to lengthenthe work week for women receiving public assistance. Earlier research on welfare reform experiments,particularly the Minnesota program, found that children’s environments and developmental outcomescan improve when mothers are allowed to work less than full time (Zaslow et al., 2002). One mediatoraccounting for these positive effects may be that mothers are better able to find higher quality home-basedcaregivers who provide less than full-time care.
Third, the sharp differences in center quality across cities prompts questions over what specific in-stitutional mechanisms – subsidy flows, regulatory mechanisms, or professional development – are ef-fectively raising quality in some places but not others. Some work suggests that state monitoring ac-tivity is more efficacious that simply raising regulatory standards (Blau, 2001). Less is known abouthow local action, especially professional development and infrastructure gains, can advance centerquality.
Indeed, states and local governments should move carefully on regulatory fronts. We found that teacheror provider education levels – at the low end, such as among providers in Tampa – were related to lowerquality on other gauges. But we also found that positive social-interaction measures, such as those gaugedby the Arnett, arenot necessarily related to providers’ formal education, nor to structural measures ofquality (as assessed by the ECERS). States and counties – especially in light of the current push foruniversal preschool – may find themselves regulating on easily measured elements of “quality” whichare not empirically related to children’s development. On the other hand, social-interaction measures arepredictive of developmental trajectories in some poor communities (e.g.,Loeb et al., 2004) but difficult totranslate into regulations. Policy makers and professional associations should determine whether certainindicators truly advance children’s growth and how these indicators are interrelated to other features ofquality. Otherwise, government will implement costly quality standards that hold high symbolic valuebut do little to advance children’s growth.
Acknowledgments
The Growing Up in Poverty Project has been funded by the U.S. departments of education and healthand human services, along with the Casey, Packard, MacArthur, and Spencer foundations. The projectis currently supported by the Walter and Elise Haas and Haas Jr. charitable funds. Special thanks aredue Michael Laracy and Marie Young for their generous support of the child-care observation substudywhich informs the present paper. Jude Carroll and Jan McCarthy directed the field work in Connecticutand Florida, respectively.

B. Fuller et al. / Early Childhood Research Quarterly 19 (2004) 505–527 523
Appendix A. Interrelationships among quality measures
When observing center-based programs two C-COS scales proved to be related to scores on the EarlyChildhood Environment Rating Scale (ECERS). The frequency with which the provider urged the focalchild to talk was moderately correlated with the mean of all scale scores drawn from the ECERS (r = .24,p< .002). Frequency is simply reported as the number of snapshots in which the behavior was observed,ranging from 0 to 40 instances.
In addition the frequency with which the focal child was observed wandering, not engaged in anyidentifiable task was associated with the total ECERS score (r =−.54, p< .001). This same wanderingfrequency item was negatively related to the second dimension identified from the Arnett subscales,indicating the provider’s propensity to explain misbehavior and reason with the children (r =−.40,p< .001). A third C-COS item – the simple count of interactions between the focal child and theprovider – was negatively associated with the provider’s reasoning behavior on the Arnett (r =−.23,p< .006). This may indicate more frequent and directive discipline of the focal child within centersettings.
C-COS items behaved differently in FCCH settings vis-a-vis other quality measures. Most notably,the frequency of verbal interaction between the focal child and the FCCH provider was moderatelyrelated to the first identified dimension of the Arnett, the items that tap into sensitivity and the affec-tively warm responsiveness of the provider (r = .29,p< .007). This same dimension of the Arnett wasmoderately associated with the frequency with which the provider invited the focal child to talk (r =.22,p< .04).
For individual kith and kin providers, some of the same C-COS scales were related to struc-tural dimensions of quality. For instance, the count of observed interactions between the focal childand the individual provider was associated with the caregiver’s education level (r = .25, p< .03).The frequency with which the caregiver invited the child to talk was associated with the total FD-CRS score (r = .30, p< .02). The frequency with which the focal child was watching television wasnegatively related to the second Arnett dimension, the caregiver’s propensity to explain and reasonwith the child (r =−.30, p< .01). In sum, certain scales on the C-COS hold fairly consistent con-struct validity in terms of being related to the Arnett scale and, at times, total ECERS or FDCRSscores.
Appendix B
SeeTables B.1 and B.2.

524B
.Fu
ller
eta
l./Ea
rlyC
hild
ho
od
Re
sea
rchQ
ua
rterly
19
(20
04
)5
05
–5
27
Table B.1Correlations between center quality measures and predictors of quality selected by mothers
2 3 4 5 6 7 8 9 10 11 12 13 14 15 16 17 18
1. ECERS score .95** .51** .20** −.13 −.24** .21** .55** .18* .15* −.14 .04 .06 .10 .04 −.13 .01 .052. ECERS factor: structured learn-
ing activities.45** .17* −.14 −.25** .23** .49** .19* .14 −.15 .06 .09 .09 .00 −.10 .04 .04
3. Arnett factor .11 −.07 −.13 .09 .43** .08 .10 −.03 −.04 −.09 −.08 .00 −.03 .05 −.044. C-COS: child engaged .03−.01 .34** .24** .26** .14 −.13 .09 .01 .04 −.05 −.02 −.04 .015. Site: New Haven – – – .26** −.03 .00 .04 .06 .01 .02 −.29** −.25** .036. Site: Manchester – – .02 −.05 −.04 .17** .05 −.03 .01 −.12* −.09 .007. Site: San Francisco – .13 .18** −.02 .08 .01 .07 .00 .01 −.03 .028. Site: San Jose .07 .10 −.09 .11 .07 .07 −.06 −.09 .06 .089. Local enrollment capacity .18** −.09 .14 .03 .08 −.07 −.06 −.11 .0310. Latina −.44** −.17* .11 −.05 −.05 −.01 −.09 .0811. African American −.21** −.01 −.04 −.01 .07 .08 −.0412. Asian .19** .16* −.30** −.10 −.04 .0213. No high school diploma −.16* −.17** −.08 −.13 .0314. Mother’s age −.15* −.08 .01 −.0515. Reading frequency with child −.15* .09 .0816. Hours employed per week .45** −.0817. Working regular day shift .0218. Mother’s PPVT score
∗ p< .05.∗∗ p< .01.

B.F
ulle
re
tal./E
arly
Ch
ildh
oo
dR
ese
arch
Qu
arte
rly1
9(2
00
4)
50
5–
52
7525
Table B.2Correlations between home-based quality measures and predictors of quality selected by mothers
2 3 4 5 6 7 8 9 10 11 12 13 14 15 16 17 18 19 20
1. FDCRS score .96** .42** .22** .13 −.09 −.03 −.01 .04 −.05 .15* .03 −.06 −.02 .02 .00 −.12 −.04 −.03 .032. FDCRS factor: structured
learning activities.38** .23** .15 −.10 −.04 −.01 .06 −.07 .21** .04 −.10 .06 .02 .02 −.12 −.06 −.04 .01
3. Arnett factor .26** .04 .07 .07−.01 .10 −.11 .06 −.04 −.13 .10 .14 .00 −.10 −.18* −.11 .074. Child–adult staffing ratio .06 .07 .13 .14* −.14* −.06 .11 −.16* .03 .10 .10 .06 −.12 −.15* −.08 .035. Caregiver’s school attaitment .30** .02 −.11 −.12 −.13 .01 .02 .00 −.05 −.01 −.05 −.02 .05 −.03 −.066. Site: New Haven – – – −.11 −.19** −.23** .17* .05 .07 −.06 .13 .09 −.02 −.017. Site: Manchester – – .02 −.06 .08 −.02 −.09 −.06 .07 −.04 −.22** −.13 −.068. Site: San Francisco – .02−.03 −.02 .03 −.06 .09 .06 .03 .04 −.04 .20**
9. Site: San Jose .20** .25** .14* −.26** .14* .00 −.03 −.14* −.16* −.03 .0010. Local enrollment capacity .04 .09−.16 .08 .03 −.19* .00 −.06 −.01 .0711. FCCH −.05 −.02 .05 .04 −.08 .05 −.14 .00 .0912. Latina – – .05 .15* −.11 −.06 −.06 −.0113. African American – −.10 −.10 .14* .06 .12 .0114. Asian .18** .13 −.35** −.09 −.05 .0015. No high school diploma 00 −.15* −.18* −.16* .0016. Mother’s age −.19** −.04 −.08 .0417. Reading frequency with child .02 .17* .0818. Hours employed per week .44** −.0319. Working regular day shift20. Mother’s PPVT score −.02
∗ p< .05.∗∗ p < .01
526 B. Fuller et al. / Early Childhood Research Quarterly 19 (2004) 505–527
References
Adams, G., & Rohacek, M. (2002). More than a work support? Issues around integrating child development goals into the childcare subsidy system.Early Childhood Research Quarterly, 17, 418–440.
Adams, G., Snyder, K., Sandfort, J. (2002).Getting and retaining child care assistance: How policy and practice influenceparents’ experiences(Occasional paper no. 55). Washington, DC: Urban Institute.
Arnett, J. (1989). Caregivers in day-care centers: Does training matter?Journal of Applied Developmental Psychology, 10,541–552.
Barnett, W. (1995). Long-term effects of early childhood programs on cognitive and school outcomes.Future of Children, 5(3),25–50.
Blau, D. M. (2001).The child care problem: An economic analysis. New York: Russell Sage Foundation.Bradley, R. (1993). Children’s home environments, health, behavior, and intervention efforts: A review using the HOME inventory
as a marker measure.Genetic, Social, and General Psychology, 119, 439–490.Burchinal, M. (1999). Child care experiences and developmental outcomes. In S. Helburn (Ed.), The silent crisis in U.S. child
care.Annals of the American Academy of Political and Social Science, 563, 73–97.Clarke-Stewart, A. (1999).Characteristics and quality of child care for toddlers and preschoolers. Manuscript, NICHD Early
Child Care Research Network, Washington, DC.Currie, J. (2001). Early childhood education programs.Journal of Economic Perspectives, 15, 213–238.CQO Study Team. (1995).Cost, quality, and child outcomes in child care centers. Technical report, University of Colorado,
Denver.Dunn, L., & Dunn, L. (1997).Peabody Picture Vocabulary Test(3rd ed.). Circle Pines, MN: American Guidance Service.Fosburg, S. (1982). Family day care: The role of the surrogate mother. In L. Laosa & I. Sigel (Eds.),Families as learning
environments for children(pp. 223–260). New York: Plenum.Fuller, B., Kagan, S. L., & Loeb, S. (2002).New lives for poor families? Mothers and young children move through welfare
reform. Berkeley: University of California and Teachers College, Columbia University.Fuller, B., Holloway, S. D., Bozzi, L., Burr, E., Cohen, N., & Suzuki, S. (2003). Explaining local variation in child care quality:
State funding and regulation in California.Early Education and Development, 14, 47–66.Fuller, B., Holloway, S. D., & Liang, X. (1996). Family selection of child-care centers: The influence of household support,
ethnicity, and parental practices.Child Development, 67(6), 3320–3337.Fuller, B., Raudenbush, S., Wei, L., & Holloway, S. D. (1993). Can government raise child-care quality? The influence of family
demand, poverty, and policy.Educational Evaluation and Policy Analysis, 15, 255–278.Fuller, B., & Strath, A. (2001). The child-care and preschool workforce: Demographics, earnings, and unequal distribution.
Educational Evaluation and Policy Analysis, 23, 37–55.Goelman, H., & Pence, A. (1987). Some aspects of the relationships between family structure and child language development in
three types of day care. In D. Peters & S. Kontos (Eds.),Continuity and discontinuity in child care(pp. 129–146). Norwood,New Jersey: Ablex Publishing.
Hamre, B., & Bridges, M.(2004). Berkeley: Policy Analysis for California Education, University of California.Harms, T., Clifford, R., & Cryer, D. (1997).Published ECERS and FDCRS scales. New York: Teachers College Press.Hirshberg, D. (2003).Child care demand and supply under CalWORKs: The early impacts of welfare reform for California’s
children, 1998–2000. Berkeley: Policy Analysis for California Education, University of California.Holloway, S. D., Kagan, S. L., Fuller, B., Tsou, L., & Carroll, J. (2001). Assessing child-care quality with a telephone interview.
Early Childhood Research Quarterly, 16, 165–189.Howes, C. (1997). Children’s experiences in center-based child care as a function of teacher background and adult-child ratio.
Merrill-Palmer Quarterly, 43, 404–425.Howes, C., Galinsky, E., Shinn, M., Sibley, A., Abbott-Shim, M., & McCarthy, J. (1996).The Florida Child Care Quality
Improvement Study. New York: Families and Work Institute.Howes, C., Whitebook, M., & Phillips, D. (1992). Teacher characteristics and effective teaching in child care: Findings from the
National Child Care Staffing Study.Child and Youth Forum, 21, 399–414.Kontos, S., Howes, C., Shinn, M., & Galinsky, E. (1994).Quality in family child care and relative care. New York: Teachers
College Press.
B. Fuller et al. / Early Childhood Research Quarterly 19 (2004) 505–527 527
Loeb, S., Fuller, B., Kagan, S. L., & Carrol, B. (2004). Child care in poor communities: Early learning effects of type, quality,and stability.Child Development, 75, 47–65.
NICHD Early Child Care Research Network. (1997). Poverty and patterns of child care. In G. J. Duncan (Ed.),Consequencesof growing up poor(pp. 100–131). New York: Russell Sage.
NICHD Early Child Care Research Network. (1999). Child outcomes when child care center classes meet recommended standardsof quality.American Journal of Public Health, 89, 1072–1077.
NICHD Early Child Care Research Network. (2000). Characteristics and quality of child care for toddlers and preschoolers.Applied Developmental Sciences, 4, 116–135.
Phillips, D. A., Voran, M., Kisker, E., Howes, C., & Whitebook, M. (1994). Child care for children in poverty: Opportunity orinequity?Child Development, 65, 472–492.
Smith, K. (1997).Who’s minding the children? Child care arrangements, spring 1997. Washington, DC: United States CensusBureau (pp. 70–86).
United States Department of Health and Human Services. (2002).Child care eligibility and enrollment estimates for fiscal year.Washington, DC: Administration for Children and Families.
Vandell, D., & Pierce, K. (2003). Child care quality and children’s success at school. In A. Reynolds & M. Wang (Eds.),Earlychildhood learning: programs for a new century(pp. 115–139). New York: Child Welfare League.
Zaslow, M., Moore, K., Brooks, J., Morris, P., Tout, K., Redd, Z., et al. (2002). Experimental studies of welfare reform andchildren.Future of Children, 12, 79–96.