Embed Size (px)
Citation preview
Child Care and Early Edcuation in Oregon:
Current Status & Trends
Oregon Child Care Research Partnership
Researchers RoundtableOctober 31, 2006
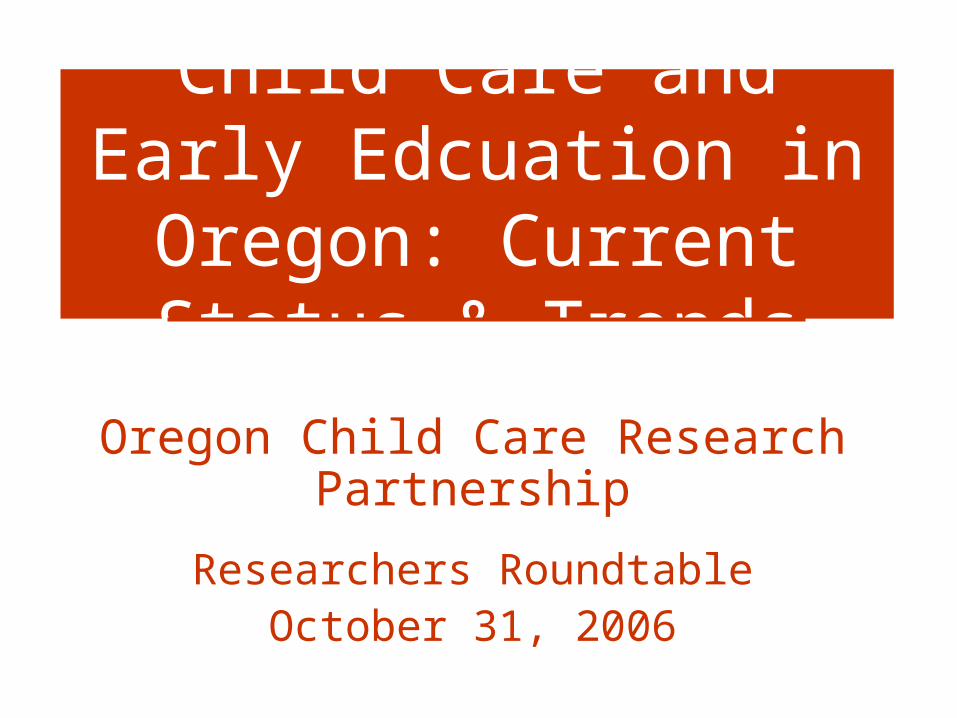
Key Aspects of Child Care and Early Education Supply
• Child care and early education captures arrangements made for care and education of young children and before/after school care for school age children
• Term “child care” used for ease of communication• Demand—the arrangements families make for their
children• Supply—the number of available slots of center and
family child care • Child care market—the portion of the child care supply
that is for pay, active, and available to community children• Prices—the amount market providers charge families• Availability—amount of market care available to families

Primary Care Arrangement of U.S. Children under Age 5: 2002
Other centers, 19%
Head Start/school, 5%
Relative, 32%
In-home, 4%
Family Child Care, 6%
Parental Care Only, 55%
Source: Johnson, J.O. (2005). Who’s Minding the Kids? Child Care Arrangements, Winter 2002..(U.S. Census Bureau P70-101). Washington DC: U.S. Deparment of Commerce

Primary Paid & Unpaid Child Care Arrangements of
Oregon Children Under 5: 2004
Parental60%
Center14%
Family Child Care7%
Relative12%
IH NonRel
7%
I
Source: Oregon Population Survey, 2004
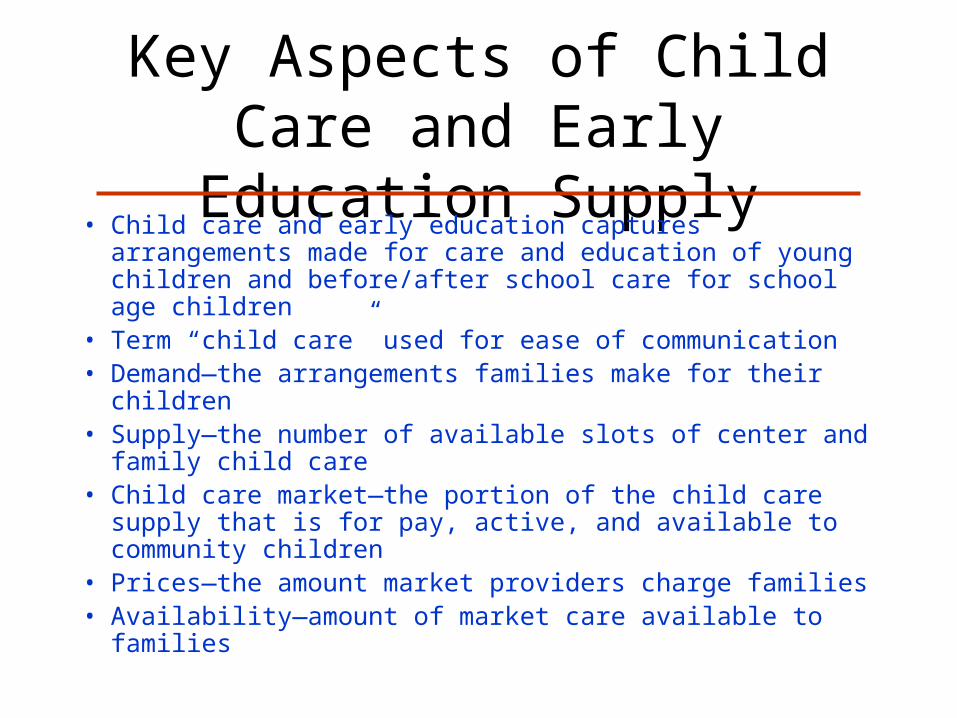
Comparison of Paid and Unpaid Care of Children in US and Oregon
Other centers, 19%
Head Start/school, 5%
Relative, 32%
In-home, 4%Family Child Care,
6%
Parental Care Only, 55%
Parental60%
Center14%
Family Child Care
7%
Relative12%
IH NonRel7%
I
Sources: U.S. Census and Oregon Population Survey
Note: Differences in survey questions and designs limit comparability
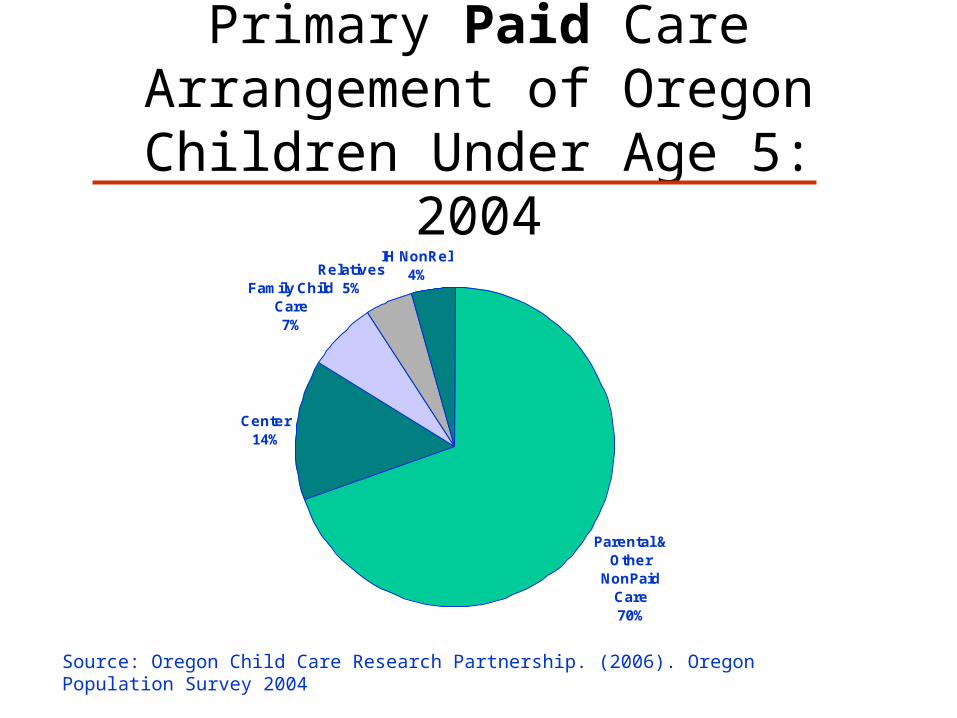
Primary Paid Care Arrangement of Oregon Children Under Age 5: 2004
Parental & Other
NonPaid Care70%
Center14%
Family Child Care7%
Relatives5%
IH NonRel4%
Source: Oregon Child Care Research Partnership. (2006). Oregon Population Survey 2004
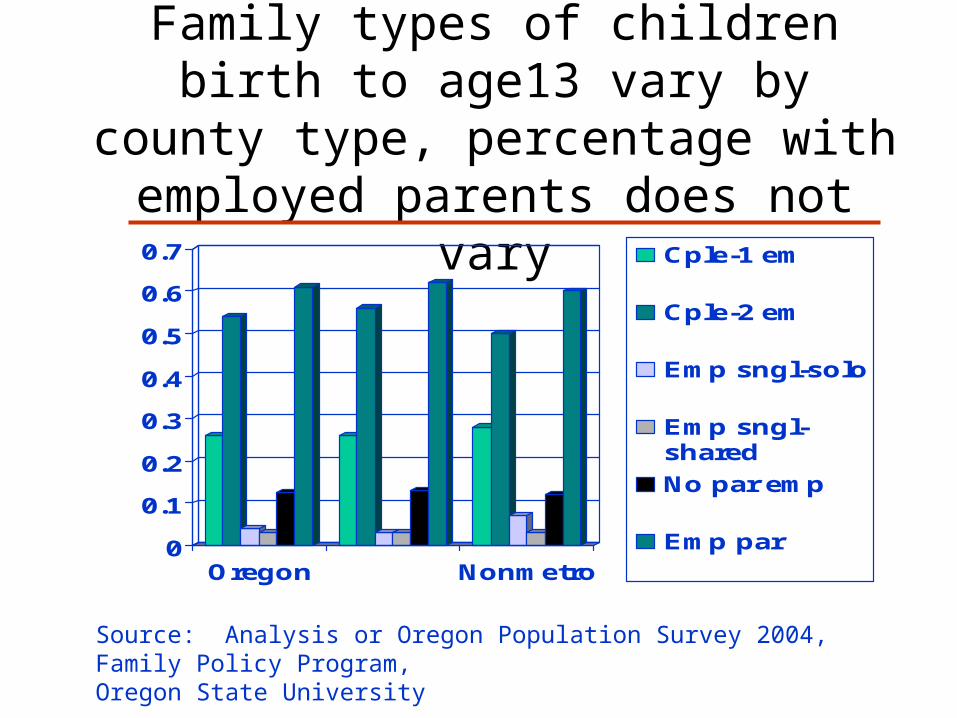
Family types of children birth to age13 vary by county type, percentage with
employed parents does not vary
Source: Analysis or Oregon Population Survey 2004, Family Policy Program,Oregon State University
0
0.1
0.2
0.3
0.4
0.5
0.6
0.7
Oregon Nonmetro
Cple-1 em
Cple-2 em
Emp sngl-solo
Emp sngl-shared
No par emp
Emp par

Amount and type of paid care used varies by county type: Oregon children (birth to 13)
0
0.02
0.04
0.06
0.08
0.1
0.12
0.14
Oregon Metro Nonmetro
Center
I-H nonrel
I-H rel
Rel home
FCC
Grp Actvty
Source: Analysis or Oregon Population Survey 2004, Family Policy Program,Oregon State University

Regulated by CCD and Enrolled by R&R69,480 Slotsadditional 582 providers were regulated but not giving care as of June 2004 or could not be reached
103,777 Slots
Enrolled with R&R and Exempt from Regulation 22,780 Slots plus 450 exempt and not enrolled known to R&R23,230
Regulated by CCD and Not Enrolled with R&R11,067 Slots
Market care is:1. For pay,2. Available to community children, and3. Available as ofJune 2004.Market providersare “open for business”.
Oregon Child Care Market 2004
Sources: Child Care Division and Oregon Child Care Resource and Referral Databases, June 30, 2004

Rough estimate of primary caregivers of children birth to age 13
0
0.05
0.1
0.15
0.2
0.25
0.3
0.35
0.4
Oregon Metro Nonmetro
Unemp par
Paid care
Unpaid ffn
Assumes parent is primary caregiver if parent is not employed.Source: Oregon Population Survey 2004,
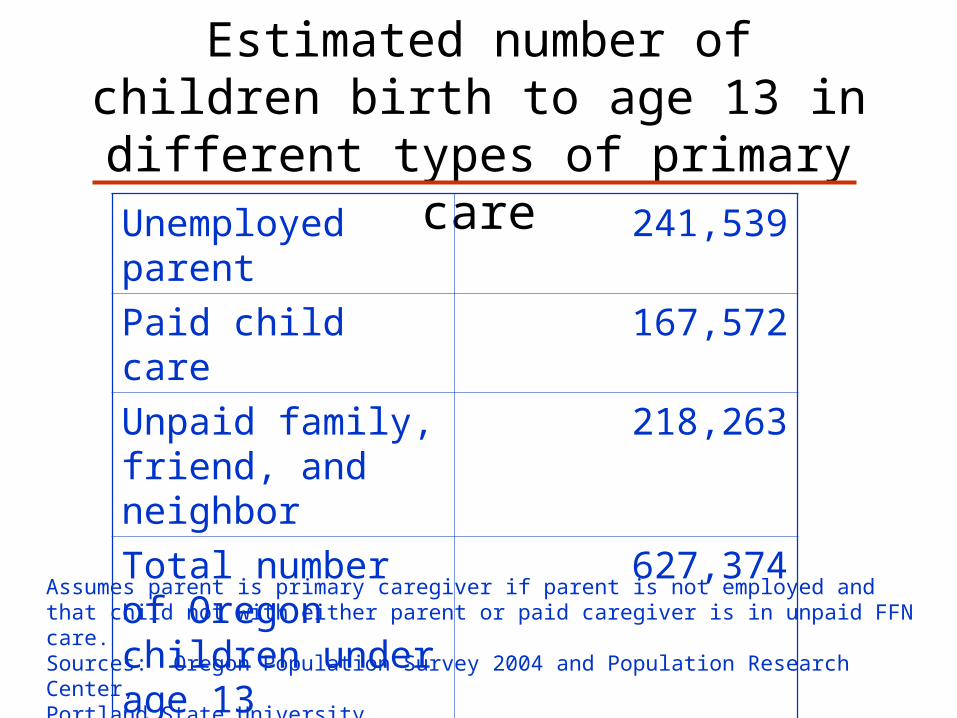
Estimated number of children birth to age 13 in different types of primary care
Unemployed parent 241,539
Paid child care 167,572
Unpaid family, friend, and neighbor
218,263
Total number of Oregon children under age 13
627,374
Assumes parent is primary caregiver if parent is not employed and that child not with either parent or paid caregiver is in unpaid FFN care.Sources: Oregon Population Survey 2004 and Population Research Center,Portland State University.
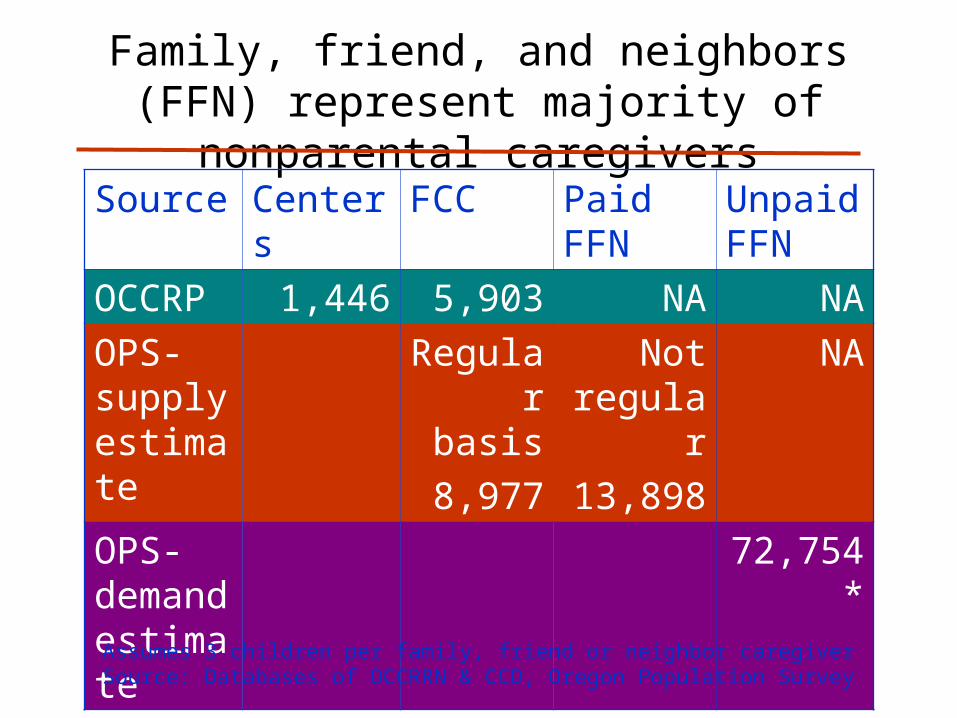
Family, friend, and neighbors (FFN) represent majority of nonparental caregivers
Source Centers FCC Paid FFN
Unpaid FFN
OCCRP 1,446 5,903 NA NA
OPS-supply estimate
Regular basis
8,977
Not regular
13,898
NA
OPS-demand estimate
72,754*
Assumes 3 children per family, friend or neighbor caregiverSource: Databases of OCCRRN & CCD, Oregon Population Survey
Child Care Trends 1990 to 2006

Trends in Child Population: 1990 to 2004
0
50,000
100,000
150,000
200,000
250,000
300,000
1990 1991 1994 1996 1998 2000 2002 2004Year
0-45-- 910--12
Sources: Center for Population and Census, Portland State University, except for 1996 and1998 when population estimates were made by the Oregon Department of Administrative Services
Num
ber
of C
hild
ren
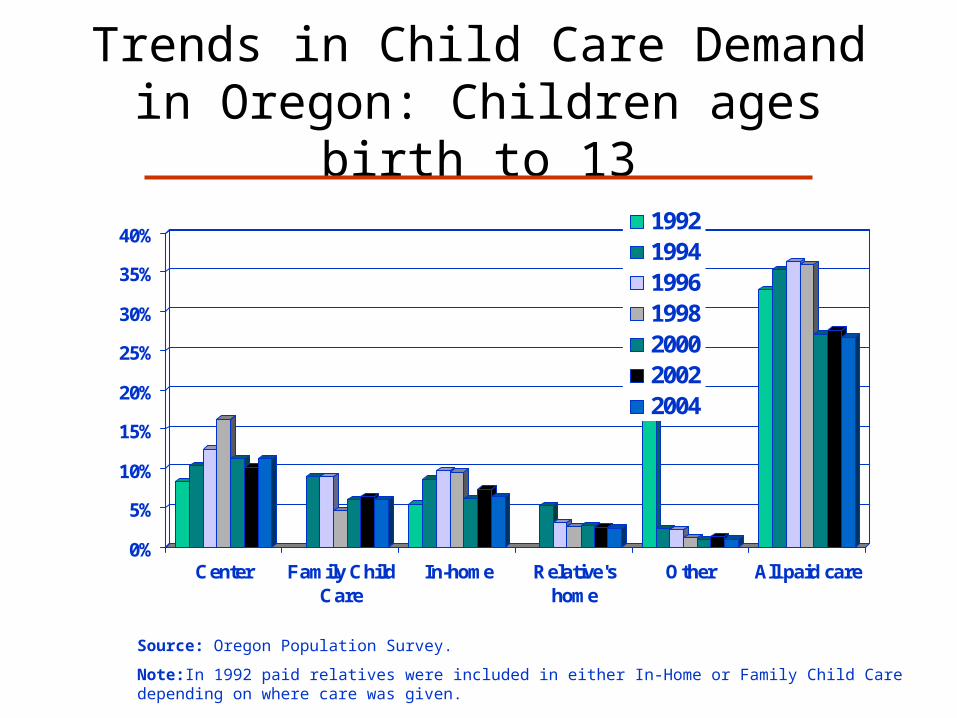
Trends in Child Care Demand in Oregon: Children ages birth to
13
0%
5%
10%
15%
20%
25%
30%
35%
40%
Center Family ChildCare
In-home Relative'shome
Other All paid care
1992199419961998200020022004
Source: Oregon Population Survey.
Note:In 1992 paid relatives were included in either In-Home or Family Child Care depending on where care was given.

Trends in Demand for Center and Family Child Care and Employment of Females
Aged 18 to 39
0
50,000
100,000
150,000
200,000
250,000
300,000
350,000
400,000
1992 1994 1996 1998 2000 2002 2004
Ch
ild c
are
slot
s
Center Care
Sources: Oregon Population Survey .and Local Area Unemployment Statistics, Oregon Employment Department
Family Care
Center & FCC
Employment of Females 18 to 39

Trends in Supply of Center and Family Child Care
0
10,000
20,000
30,000
40,000
50,000
60,000
70,000
80,000
1990 1992 1994 1996 1998 2000 2002 2004
Ch
ild c
are
slot
s Center Care Family Care
Source: Combination of CCR&R data and CCD Regulatory Data.
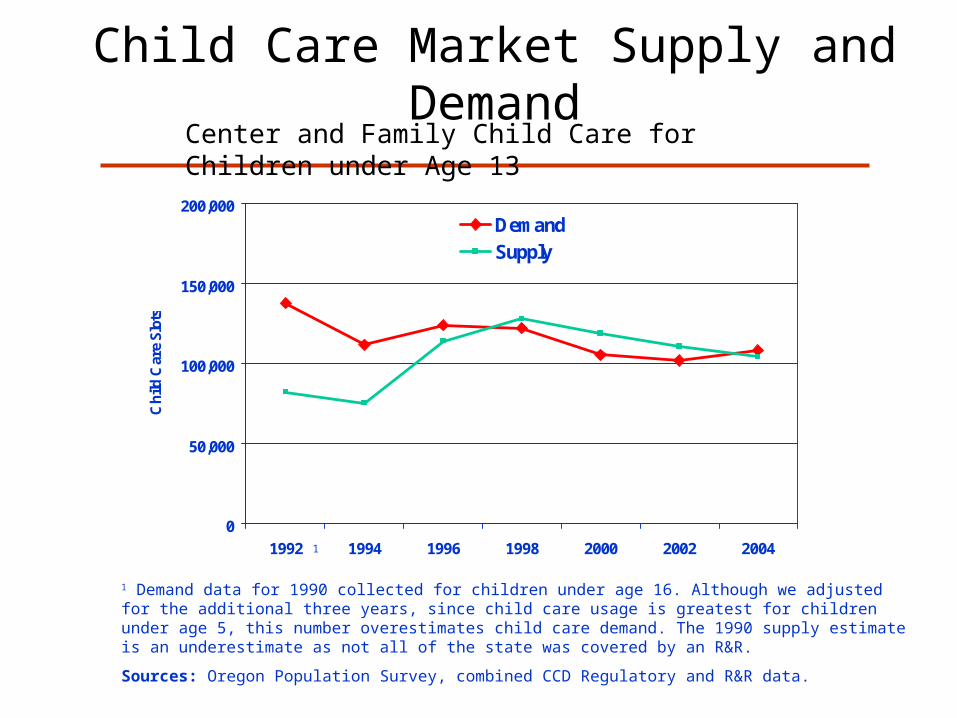
Child Care Market Supply and Demand
0
50,000
100,000
150,000
200,000
1992 1994 1996 1998 2000 2002 2004
Ch
ild C
are
Slo
ts
DemandSupply
Center and Family Child Care for Children under Age 13
1 Demand data for 1990 collected for children under age 16. Although we adjusted for the additional three years, since child care usage is greatest for children under age 5, this number overestimates child care demand. The 1990 supply estimate is an underestimate as not all of the state was covered by an R&R.
Sources: Oregon Population Survey, combined CCD Regulatory and R&R data.
1
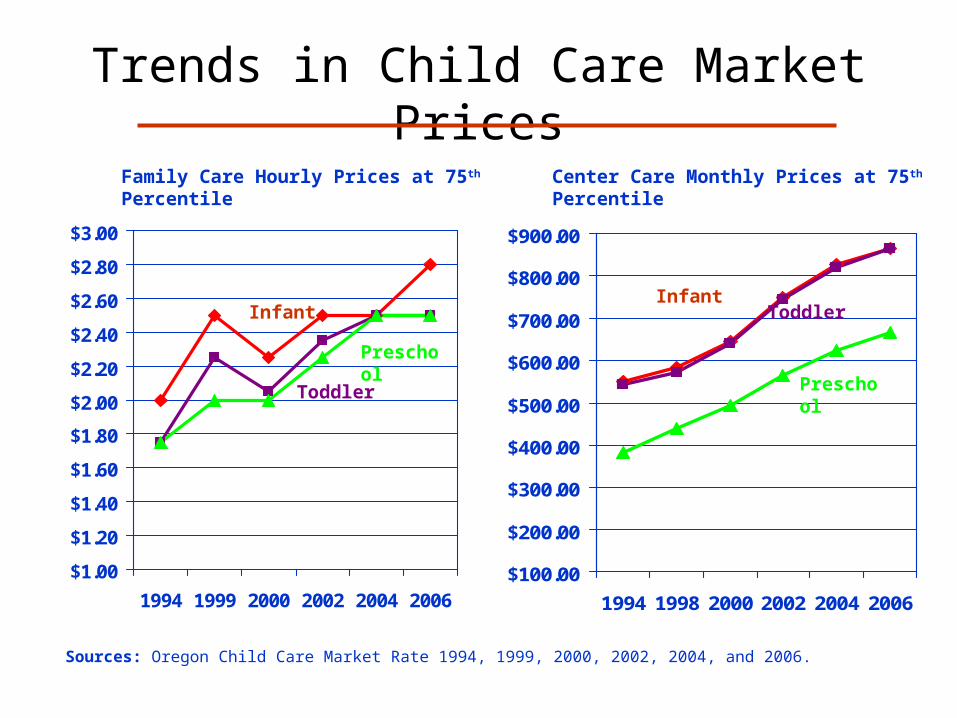
Trends in Child Care Market Prices
$1.00
$1.20
$1.40
$1.60
$1.80
$2.00
$2.20
$2.40
$2.60
$2.80
$3.00
1994 1999 2000 2002 2004 2006
Family Care Hourly Prices at 75th Percentile
Infant
Toddler
Preschool
$100.00
$200.00
$300.00
$400.00
$500.00
$600.00
$700.00
$800.00
$900.00
1994 1998 2000 2002 2004 2006
Center Care Monthly Prices at 75th Percentile
Preschool
ToddlerInfant
Sources: Oregon Child Care Market Rate 1994, 1999, 2000, 2002, 2004, and 2006.
1
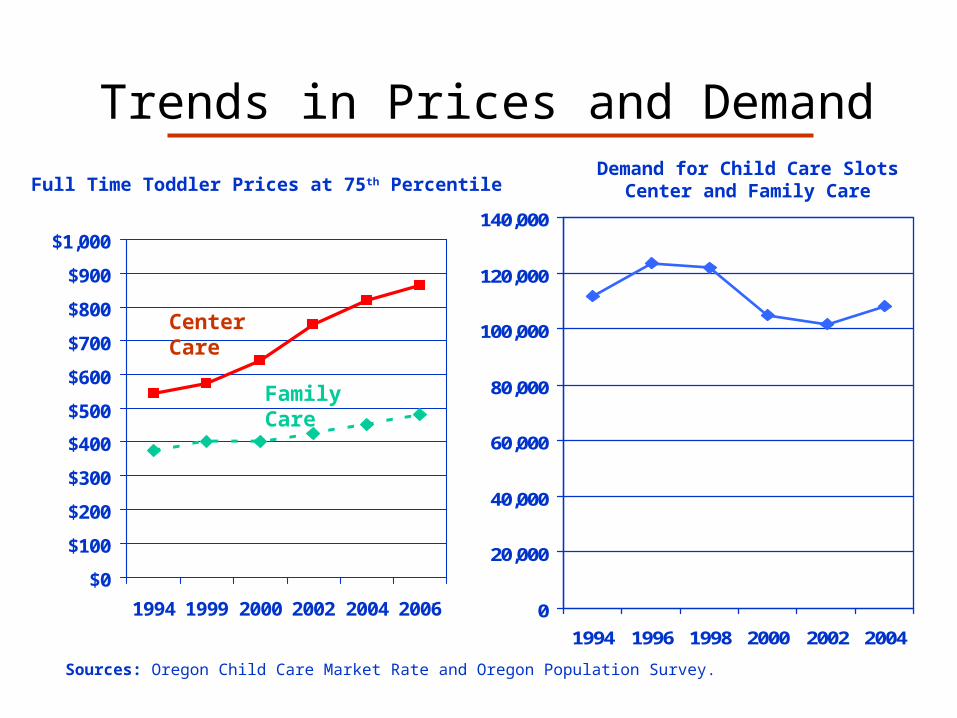
Trends in Prices and Demand
$0
$100
$200
$300
$400
$500
$600
$700
$800
$900
$1,000
1994 1999 2000 2002 2004 2006
Full Time Toddler Prices at 75th Percentile
Center Care
Family Care
Sources: Oregon Child Care Market Rate and Oregon Population Survey.
1 0
20,000
40,000
60,000
80,000
100,000
120,000
140,000
1994 1996 1998 2000 2002 2004
Demand for Child Care SlotsCenter and Family Care

$0
$100
$200
$300
$400
$500
$600
$700
$800
$900
$1,000
1994 1999 2000 2002 2004 2006
Family Care
Center Care
Trends in Prices and Supply
Full Time Toddler Prices at 75th Percentile
0
10,000
20,000
30,000
40,000
50,000
60,000
70,000
80,000
1994 1998 2000 2002 2004
Center Care
Family Care
Supply of Child Care Slots
Sources: Oregon Child Care Market Rate and combination of CCR&R data and CCD Regulatory Data.
1
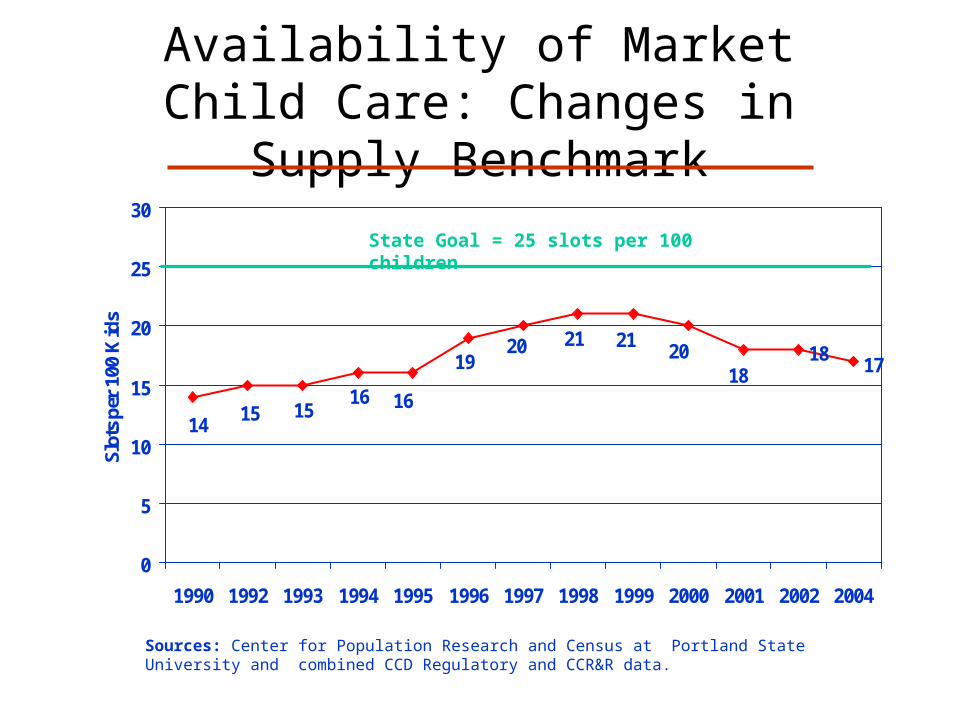
Availability of Market Child Care: Changes in Supply Benchmark
181718
20212120
19
16161515
14
0
5
10
15
20
25
30
1990 1992 1993 1994 1995 1996 1997 1998 1999 2000 2001 2002 2004
Slot
s pe
r 10
0 K
ids
State Goal = 25 slots per 100 children
Sources: Center for Population Research and Census at Portland State University and combined CCD Regulatory and CCR&R data.

Availability by Selected Counties: Changes in Supply
Benchmark
0
5
10
15
20
25
30
1998 2000 2001 2002 2004
Slo
ts p
er 1
00 k
ids
Lane
BentonMultnomah
DeschutesMalheur
CurryGilliam
State Goal = 25 slots per 100 kids
Sources: Center for Population Research and Census at Portland State University and combined CCD Regulatory and CCR&R data.