Embed Size (px)
Citation preview
1
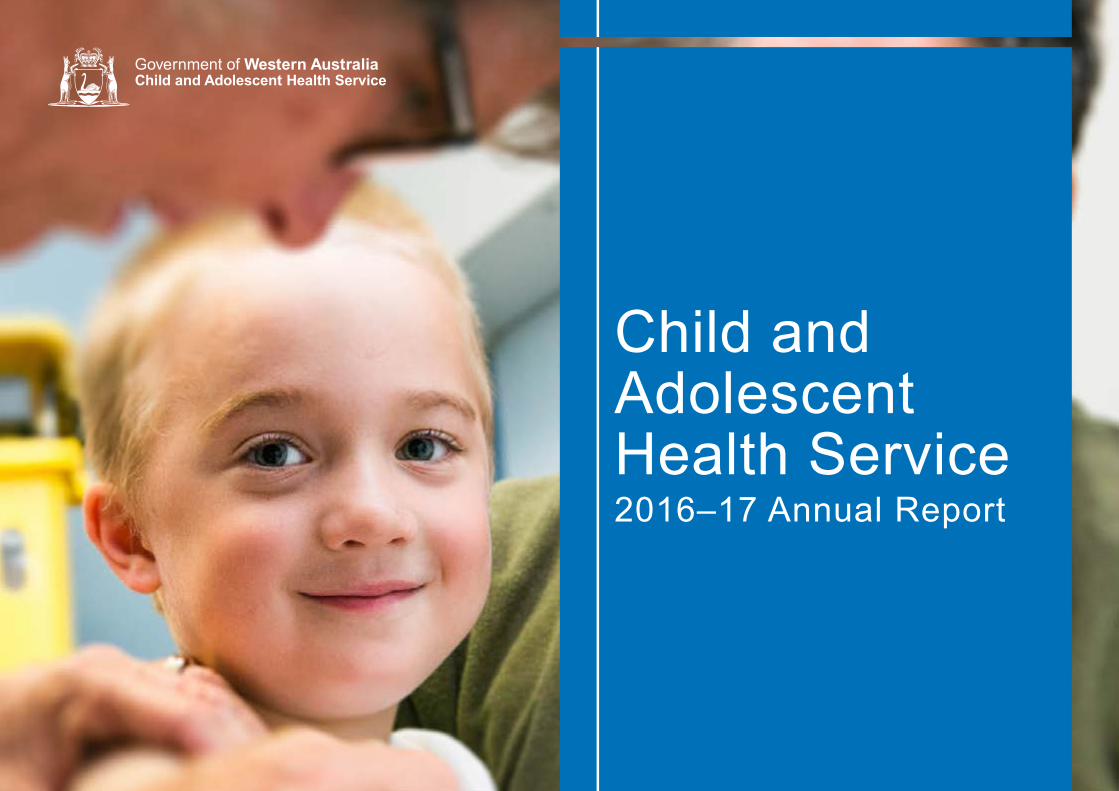
Child and Adolescent Health Service2016–17 Annual Report

2
Acknowledgement of Country and PeopleThe Child and Adolescent Health Service acknowledges the Aboriginal people of the many traditional lands and language groups of Western Australia. It acknowledges the wisdom of Aboriginal Elders both past and present and pays respect to Aboriginal communities of today.
Using the term Aboriginal Within Western Australia, the term Aboriginal is used in preference to Aboriginal and Torres Strait Islander, in recognition that Aboriginal people are the original inhabitants of Western Australia. Aboriginal and Torres Strait Islander may be referred to in the national context and Indigenous may be referred to in the international context. No disrespect is intended to our Torres Strait Islander colleagues and community.
Artist: Richard, John Olman WALLEY 2012
3
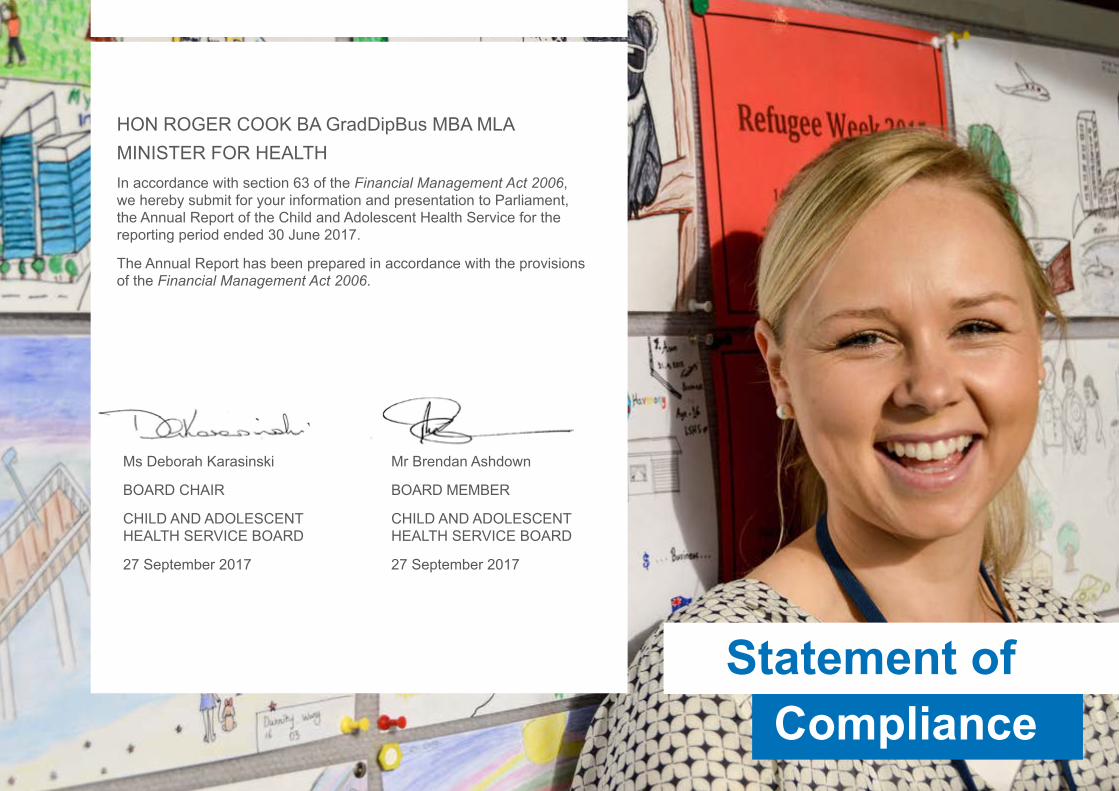
HON ROGER COOK BA GradDipBus MBA MLAMINISTER FOR HEALTHIn accordance with section 63 of the Financial Management Act 2006, we hereby submit for your information and presentation to Parliament, the Annual Report of the Child and Adolescent Health Service for the reporting period ended 30 June 2017.
The Annual Report has been prepared in accordance with the provisions of the Financial Management Act 2006.
Statement ofCompliance
Mr Brendan Ashdown
BOARD MEMBER
CHILD AND ADOLESCENT HEALTH SERVICE BOARD
27 September 2017
Ms Deborah Karasinski
BOARD CHAIR
CHILD AND ADOLESCENT HEALTH SERVICE BOARD
27 September 2017
4
1 Overview of Agency3 Locations and contact
4 Message from the Board
5 Message from the Chief Executive
6 The Health Service Board
8 Vision, mission and values
9 Executive summary
10 Highlights
12 Operational Structure13 Legislation14 CAHS management structure15 About CAHS
20 Performance Highlights
21 Princess Margaret Hospital
22 Child and Adolescent Community Health
23 Child and Adolescent Mental Health Service
24 Aboriginal Health Services
25 Research highlights26 Statement from
the Consumer Advisory Council Chair
27 Statement from the Youth Advisory Committee Chair
28 Statement from the Disability Advisory Committee Chair
29 Agency Performance
30 Financial targets30 Summary of key
performance indicators32 Improvements towards
emergency department access33 Clinical incidents
`
35 Significant Issues36 Culture and morale
36 Delay in the move to Perth Children’s Hospital
36 Ageing community infrastructure
36 Demand and activity
37 Workforce challenges
37 Managing funding and costs efficiently
38 Health inequalities
Contents
5
39 Disclosures and Legal Compliance
40 Audit opinion46 Certification of financial
statements47 Financial statements
110 Key Performance Indicators
111 Certification of key performance indicators
113 KPIs measuring Outcome 1
120 KPIs measuring Outcome 2
124 Other Financial Disclosures
125 Board and committee remuneration
126 Pricing policy
126 Capital works
127 Employment profile
128 Workforce development
128 Perth Children’s Hospital education and training
129 Industrial relations
129 Workers' compensation
129 Governance disclosures
130 Government policy requirements
131 Other Legal Requirements
132 Ministerial directives
132 Advertising
132 Disability and Access Inclusion Plan
133 Compliance with public sector standards
134 Recordkeeping plans
134 Substantive equality
135 Occupational safety, health and injury

2
Overview of Agency
Overview ofAgency
33
Child and Adolescent Health ServiceSTREET ADDRESS Roberts Road, SUBIACO WA 6008POSTAL ADDRESS GPO Box D184, PERTH WA 6840PHONE (08) 9340 8222 FAX (08) 9340 7000EMAIL [email protected] WEB www.cahs.health.wa.gov.au
Princess Margaret Hospital for ChildrenSTREET ADDRESS Roberts Road, SUBIACO WA 6008POSTAL ADDRESS GPO Box D184, PERTH WA 6840PHONE (08) 9340 8222 FAX (08) 9340 7000EMAIL [email protected] www.pmh.health.wa.gov.au
Child and Adolescent Community HealthSTREET ADDRESS Level 8, Eastpoint Plaza, 233 Adelaide Terrace, PERTH WA 6000POSTAL ADDRESS GPO Box S1296, PERTH WA 6845PHONE (08) 9323 6666 FAX (08) 9323 6699EMAIL [email protected] ww2.health.wa.gov.au/cach
Child and Adolescent Mental Health ServiceSTREET AND POSTAL ADDRESS:Level 1, 70 Hay Street, SUBIACO WA 6008PHONE (08) 6389 5800 FAX (08) 6389 5848EMAIL [email protected] ww2.health.wa.gov.au/camhs
Locations and contact
3

4
Message from the BoardThe 2016–17 year was described by one of our Board Members recently as an ‘establishment year’ and in many ways it was. As the inaugural Child and Adolescent Health Service (CAHS) Board established under the Health Services Act 2016, the Board has established many connections with stakeholder groups and received a number of presentations to develop an in depth understanding of the community to whom we provide services.
Throughout the year, the Board has maintained its focus – to ensure the best health and medical outcomes for the children of Western Australia – and has added value to the work of CAHS as described below.
The Board has overseen a number of important initiatives through its Safety and Quality Committee, Finance Committee and Audit and Risk Committee. This includes:
● agreed timelines with the Executive for the completion of serious adverse event reports and the implementation of recommendations
● undertaken detailed examinations of patient outcomes in three clinical departments, confirming that the outcomes are excellent against both national and international standards
● developed effective policies and training in the management and mitigation of clinical and non-clinical risks and compliance
● developed a higher level of rigor and accountability for financial results, including looking at benchmarking and new performance indicators
● planned for beyond the current year and looked at emerging and strategic financial risks
● linked safety and quality with financial results.
During the year, the Board initiated an independent review across Princess Margaret Hospital for Children (PMH) of safety and quality, including patient outcomes, and of the morale and engagement of clinical staff.
The Board was extremely pleased that this review found that safety and quality were not compromised and that there was “a genuine commitment to the provision of safe, high quality care to patients and families (which) is clearly evident across all levels of the organisation and staff are clearly passionate about ensuring that all children of Western Australia receive world class care.”
The review did confirm, however, that there were genuine issues with the morale and engagement of staff at PMH which extended beyond that of the medical staff and the confines of PMH. The Board accepted the 21 recommendations of the review and throughout 2017–18, will work with the Executive to implement these, building and supporting an engaged workforce and fostering a nurturing and respectful culture.
I would like to thank each member of the CAHS staff for their commitment and dedication to excellence in service provision which is evident at all levels of our Health Service. This was referred to in the independent review and I have observed it and been so impressed by it, throughout my year as Chair of the Board.
I would like to thank my fellow Board Members for their considerable contribution to the work of the Board over the year and particularly thank outgoing Board Member Andrew Thompson.
I look forward to working with you all in 2017–18.
Debbie Karasinski Chair Child and Adolescent Health Service Board
55
Message from the Chief ExecutiveThe year 2016–17 has been significant for CAHS. The establishment of the Department of Health as ‘System Manager’ and the subsequent transition from a centralised governance structure from 1 July 2016 to the establishment of CAHS as a separate statutory authority, governed by a Board, has necessitated a substantial cultural shift across the organisation. Since my appointment to the role of CAHS Chief Executive, I am pleased with the ongoing commitment demonstrated by CAHS staff towards ensuring that we are accountable and responsible for providing a safe and contemporary health care service for the children and young people of Western Australia.
Preparation continues towards the opening of Perth Children’s Hospital (PCH) with practical completion earlier this year, marking a time to reflect on the past and future journey towards the closure of PMH. It is fair to say that the CAHS Board, CAHS staff, patients and their families undoubtedly feel a sense of frustration as a result of the unexpected delays in moving to PCH. However, in the short time I have been in the CE role I have experienced, firsthand, the dedication, commitment and perseverance of staff across a range of disciplines who are working as a team towards this important common goal. I am both proud and grateful for their sheer hard work, each and every day, to ensure that the hospital is safe and ready for its first young patients, as well as maintaining the high level of care at PMH. I would like to thank the Perth Children’s Hospital Foundation (PCHF) for their ongoing support as the main fundraising body for PMH and PCH. Each year PCHF donations support thousands of children and young people who rely on our health service for care and treatment.
In March 2017, the CAHS Board commissioned a review of issues relating to the conditions, morale and engagement of staff at PMH. While the review identified specific issues, such as areas where there is a need to improve engagement with Junior Medical Officers, it also noted that these needs extend to all our staff. The review provided recommendations to the CAHS Board regarding actions to be taken to address the issues raised by staff. The Board accepted all 21 recommendations.
A number of initiatives are currently underway to address and implement the recommendations involving staff from PMH and from across the health service more broadly. I am working closely with the Board and other staff groups to ensure that all of the recommendations emerging from the review are implemented effectively and in a timely way and that we embed these changes to make CAHS a stronger organisation that continues to strive for excellence.
This year we introduced the PMH Huddle, a 15 minute stand up status report from Monday to Friday, bringing together clinical, support and corporate staff. Aiming to ensure PMH provides safe, high quality hospital care, the Huddle measures operational excellence by focusing on improvements in communication, openness, transparency, teamwork and accountability. An evaluation undertaken in April found that the Huddle is improving the management of bed occupancy, staff shortages, engagement and the patient experience.
In 2016, CAHS subscribed to Patient Opinion, a not-for-profit web-based feedback platform which enables patients and families to provide complaints and compliments about their health care experience. This new approach to patient and family engagement is gathering momentum at CAHS and we are learning a great deal about where we can improve the care and treatment that we provide to our patients and families. The increased involvement of our Consumer Advisory Council and Youth Advisory Committee has had a very positive influence on our functioning and having their Chairs join the Executive table ensures we keep our young patients and their families and carers in focus as we make decisions.
It is widely acknowledged that CAHS has a proud history of putting children and young people and their families at the centre of everything we do. I look forward to continuing to be part of a team of dedicated professionals who demonstrate our values of respect, integrity, equity, excellence and compassion towards not only our patients and families, but towards each other.
Dr Robyn Lawrence Chief Executive Child and Adolescent Health Service & Perth Children’s Hospital Commissioning
6
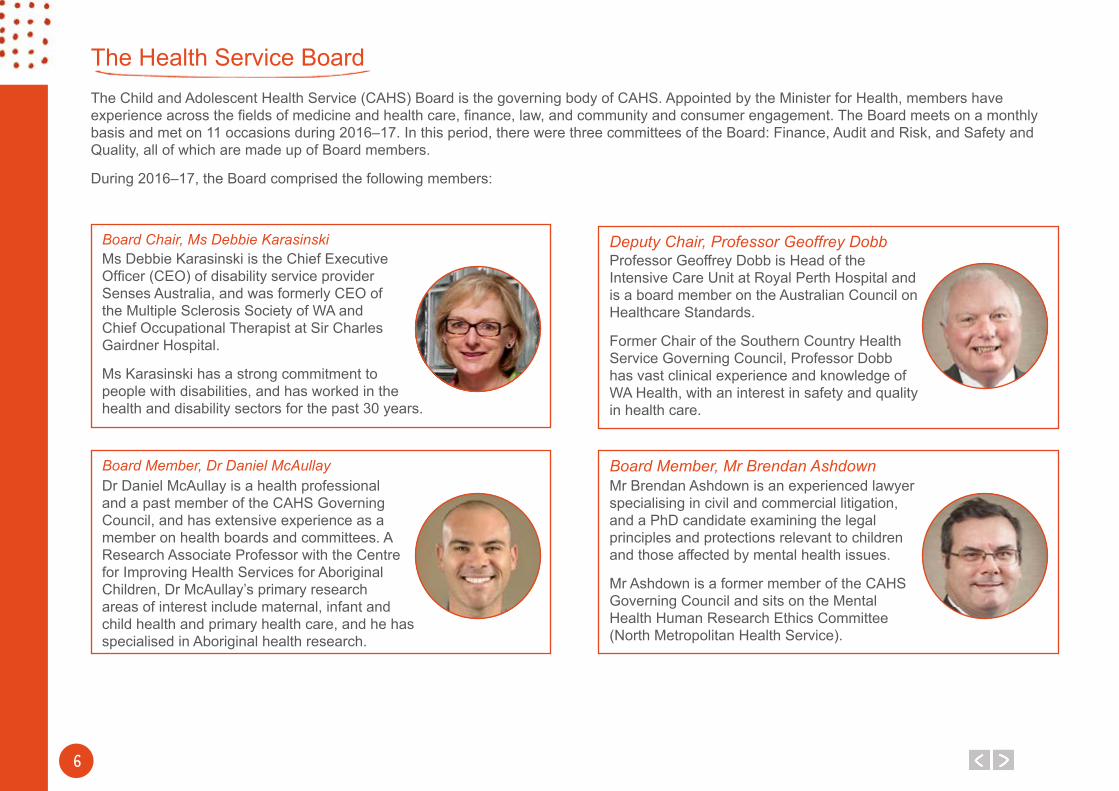
The Health Service BoardThe Child and Adolescent Health Service (CAHS) Board is the governing body of CAHS. Appointed by the Minister for Health, members have experience across the fields of medicine and health care, finance, law, and community and consumer engagement. The Board meets on a monthly basis and met on 11 occasions during 2016–17. In this period, there were three committees of the Board: Finance, Audit and Risk, and Safety and Quality, all of which are made up of Board members.
During 2016–17, the Board comprised the following members:
Ms Debbie Karasinski is the Chief Executive Officer (CEO) of disability service provider Senses Australia, and was formerly CEO of the Multiple Sclerosis Society of WA and Chief Occupational Therapist at Sir Charles Gairdner Hospital.
Ms Karasinski has a strong commitment to people with disabilities, and has worked in the health and disability sectors for the past 30 years.
Board Chair, Ms Debbie KarasinskiProfessor Geoffrey Dobb is Head of the Intensive Care Unit at Royal Perth Hospital and is a board member on the Australian Council on Healthcare Standards.
Former Chair of the Southern Country Health Service Governing Council, Professor Dobb has vast clinical experience and knowledge of WA Health, with an interest in safety and quality in health care.
Deputy Chair, Professor Geoffrey Dobb
Dr Daniel McAullay is a health professional and a past member of the CAHS Governing Council, and has extensive experience as a member on health boards and committees. A Research Associate Professor with the Centre for Improving Health Services for Aboriginal Children, Dr McAullay’s primary research areas of interest include maternal, infant and child health and primary health care, and he has specialised in Aboriginal health research.
Board Member, Dr Daniel McAullayMr Brendan Ashdown is an experienced lawyer specialising in civil and commercial litigation, and a PhD candidate examining the legal principles and protections relevant to children and those affected by mental health issues.
Mr Ashdown is a former member of the CAHS Governing Council and sits on the Mental Health Human Research Ethics Committee (North Metropolitan Health Service).
Board Member, Mr Brendan Ashdown
77
The Health Service Board continued
"Thank You for taking care of Western Australia"
Ms Kathleen Bozanic is a senior finance executive with over 20 years’ experience and significant leadership roles as Partner of a leading professional services firm and as a Chief Financial Officer/General Manager of listed mining companies.
Ms Bozanic brings with her high-calibre skills in financial monitoring, accountability, performance and governance, and a keen interest in WA Health.
Board Member, Ms Kathleen BozanicMs Linley (Anne) Donaldson is a former Director for the Health and Disability Service Complaints Office (HaDSCO), a position that involved strategic leadership in the oversight and management of health, disability and mental health complaints. Ms Donaldson has worked in the health sector for most of her career in a range of positions, and has a depth of experience and understanding of finance, audit, and safety and quality.
Board Member, Ms Linley (Anne) Donaldson
Dr Alexius Julian is a highly-skilled clinician with significant experience in Information and Communications Technology (ICT) across WA Health.
In particular, Dr Julian was the Clinical Lead in the commissioning of ICT at Fiona Stanley Hospital, and has also worked as a Medical Leadership Advisor for the Institute of Health Leadership.
Board Member, Dr Alexius Julian
Mr Andrew Thompson has over 40 years’ business and legal experience working for and advising leading Australian and international energy and resources companies. Currently Deputy Chair of the BrightSpark Foundation of WA, Mr Thompson has significant health sector board experience with extensive exposure to the health issues and challenges facing children and adolescents in WA, as well as insight into the operation of teaching hospitals.
Board Member, Mr Andrew ThompsonMr Peter Mott has over 35 years of health and executive management experience that includes the role of CEO of public and private hospitals in both charitable and for-profit sectors.
Mr Mott is currently Vice President of the Australasian College of Health Service Management, WA Branch Council, and is a past President of the Australian Institute of Management WA.
Board Member Mr Peter Mott
8
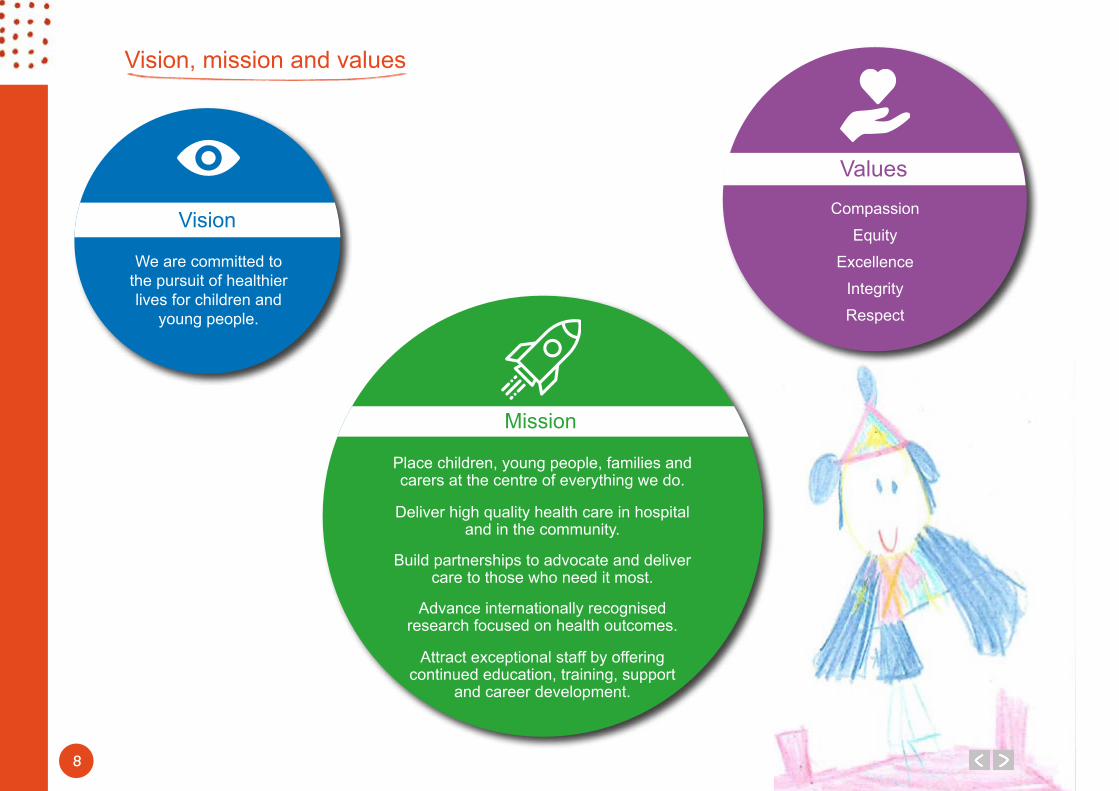
Vision, mission and values
We are committed to the pursuit of healthier lives for children and
young people.
Vision
Mission
Place children, young people, families and carers at the centre of everything we do.
Deliver high quality health care in hospital and in the community.
Build partnerships to advocate and deliver care to those who need it most.
Advance internationally recognised research focused on health outcomes.
Attract exceptional staff by offering continued education, training, support
and career development.
Compassion
Equity
Excellence
Integrity
Respect
Values
99
Executive summaryThe 2016–17 financial year marked the first year of operations under the Health Services Act 2016. The new legislation allowed for the creation of five Health Service Providers (HSPs) as separate statutory authorities under Board governance.
The Child and Adolescent Health Service (CAHS) Board is legally responsible and accountable for the oversight of the acute and community services within CAHS. The Board is chaired by Ms Debbie Karasinski.
The Board members were:
Professor Geoff Dobb Dr Daniel McAullayMr Brendan Ashdown Dr Alexius Julian Ms Kathleen Bozanic Mr Peter MottMs Anne Donaldson Mr Andrew Thompson The first CAHS Board meeting was held on 14 July 2016. The Board hosted a strategic planning session in February 2017 to understand and plan the future of CAHS in the context of our current values of excellence, integrity, equity, compassion and respect.
The Health Services Act 2016 also established the Department of Health as the ‘System Manager’, responsible for the overall management, performance and strategic direction of WA Health. The Functional Review and Readiness Assessments supported WA Health’s transition to these devolved governance arrangements by ensuring each entity is fully ready to take on these new roles to deliver a safe, high-quality, sustainable health system for all Western Australians by 30 June 2018, following the two year transition period.
A strong focus on reform has been evident across all CAHS directorates over the last 12 months. The CAHS Executive, under the leadership of Professor Frank Daly, strived to build safe, robust and sustainable acute and community service models for Western Australian children, their families and carers. The role of consumer advisory groups through the reform process has been invaluable.
PMH continued to implement the PCH operating cost model endorsed by the PCH Taskforce. The focus in the first half of 2016–17 centred on workforce reform.
Workforce initiatives were completed for administration, nursing, allied health, junior medical officers, clinical support and hotel services. This work has been critical to ensuring a sustainable workforce as we prepare to move to PCH.
Child and Adolescent Community Health completed a major redesign of the Perth metropolitan Child Development Service (CDS). The revised service model was developed in partnership with consumers to ensure that CDS is best meeting the needs of children with developmental delays. The new CDS service model includes a wide range of intervention options, and is enabling more timely and flexible services for children and families. The service redesign has significantly reduced waiting times for all major allied health disciplines.
The Child and Adolescent Mental Health Service (CAMHS) reviewed the models of care for the Acute Community Intervention Team and the Acute Response Team programs, to ensure that services could continue to meet the needs of children, young people and their families and be effective and safe. The redesign team has implemented a ‘community integrated model’, which incorporates the intervention and acute response functions being decentralised into community CAMHS teams.
Overall, the CAHS reform program has achieved a significant reduction in expenditure growth of 0.8 per cent, an increase in own source revenue of 5.7 per cent, a net cost of service reduction of 2.5 per cent and a reduction in full-time equivalents of 2.1 per cent (n=62).
On 20 March 2017, the CAHS Board commissioned the CAHS Review into the morale and engagement of clinical staff at PMH, led by Professor Gary Geelhoed. The review report, published on 9 June 2017, made 21 recommendations. Importantly, the PMH Review confirmed that the safety and quality of patient care had not been compromised.
Practical completion of PCH was achieved in April 2017. Significant headway has been made in the transition and commissioning programs of work, in preparation for the opening of PCH once all building issues are resolved.
In the 2017–18 year, CAHS will focus on rebuilding the relationship with the workforce, through the implementation of the PMH Review recommendations under the leadership of Dr Robyn Lawrence, appointed as the CAHS Chief Executive on 19 June 2017.
10
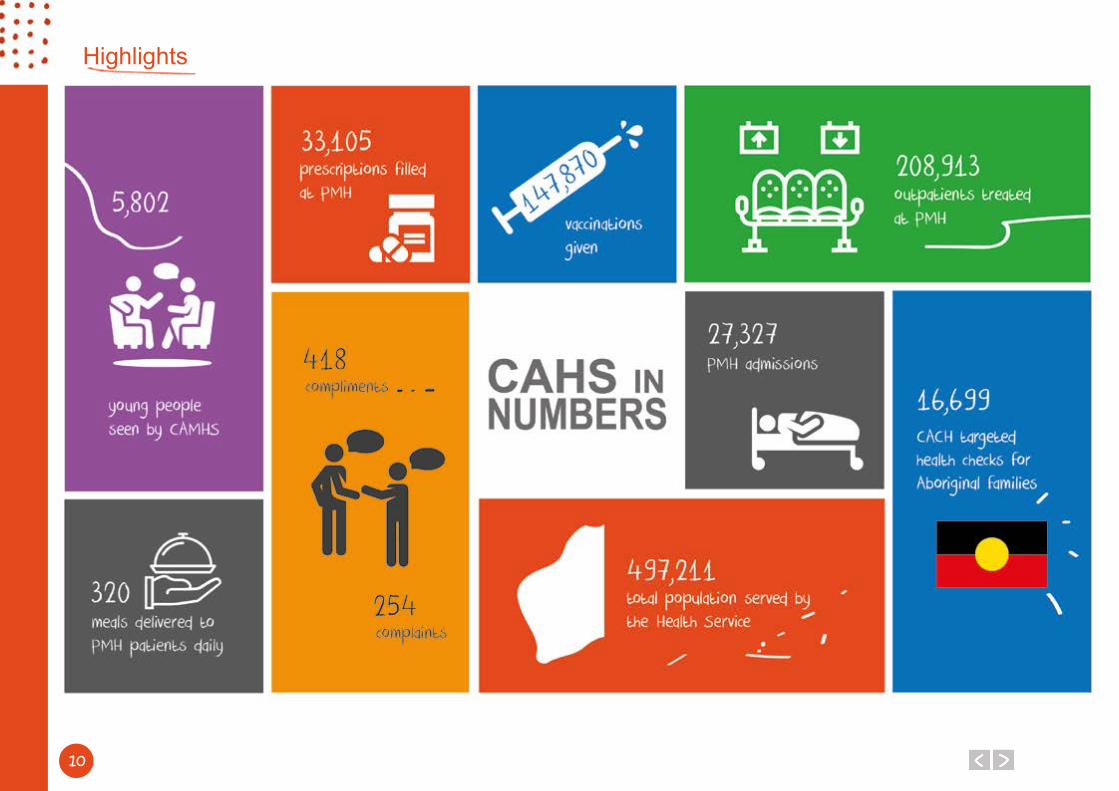
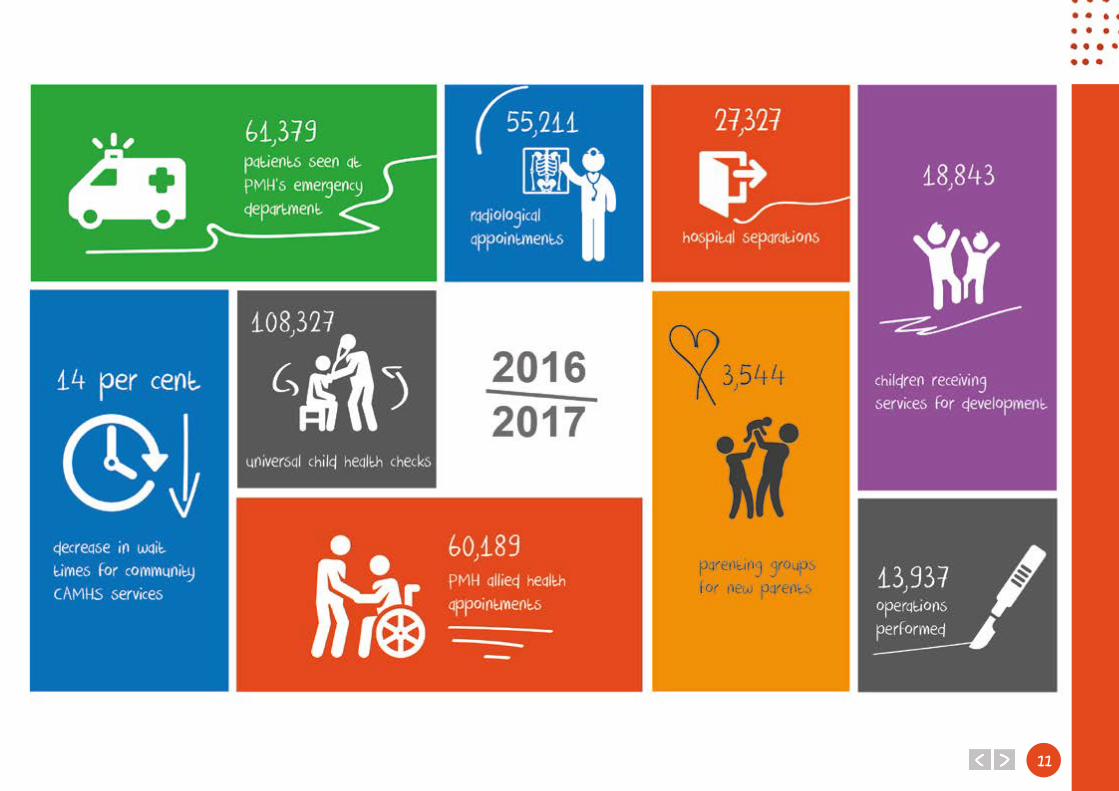
Highlights
1111

12
OperationalStructure
1313
LegislationEnabling legislationThe Child and Adolescent Health Service (CAHS) was established as a board governed health service provider in the Health Services (Health Service Provider) Order 2016 made by the Minister for Health under section 32 of the Health Services Act 2016. CAHS is responsible to the Minister for Health and the Director General of the Department of Health (System Manager) for the efficient and effective management of the organisation.
Amalgamation and establishment of Boards
● North Metropolitan Health Service Board● South Metropolitan Health Service Board● East Metropolitan Health Service Board● Child and Adolescent Health Service Board● WA Country Health Service Board● Health Support Services Board● Western Australian Health Promotion Foundation Board
Acts CAHS is required to comply with that are administered by the Department of Health as at 30 June 2017
● Food Act 2008● Health Practitioner Regulation National Law (WA) Act 2010● Health Services Act 2016● Human Tissue and Transplant Act 1982● Medicines and Poisons Act 2014● Radiation Safety Act 1975
Other Acts administered by the Department of Health as at 30 June 2017
● Anatomy Act 1930● Blood Donation (Limitation of Liability) Act 1985● Cremation Act 1929
● Fluoridation of Public Water Supplies Act 1966● Health (Miscellaneous Provisions) Act 1911● Health Legislation Administration Act 1984● Health Professionals (Special Events Exemption) Act 2000● Health Services (Quality Improvement) Act 1994● Human Reproductive Technology Act 1991● National Health Funding Pool Act 2012● Nuclear Waste Storage and Transportation (Prohibition) Act 1999● Pharmacy Act 2010● Private Hospitals and Health Services Act 1927● Prostitution Act 2000 (except s.62 & Part 5, which are administered
by the Department of the Attorney General)● Public Health Act 2016● Royal Perth Hospital Protection Act 2016● Surrogacy Act 2008● Tobacco Products Control Act 2006● University Medical School, Teaching Hospitals, Act 1955● Western Australian Health Promotion Foundation Act 2016
Acts passed during 2016–17
● Royal Perth Hospital Protection Act 2016
Bills in Parliament as at June 2017
● Nil
Accountable authorityThe Child and Adolescent Health Service Board was the accountable authority for the Child and Adolescent Health Service in 2016–17.
Responsible MinisterThe Child and Adolescent Health Service is responsible to the Minister for Health, the Hon. Roger Cook.
14
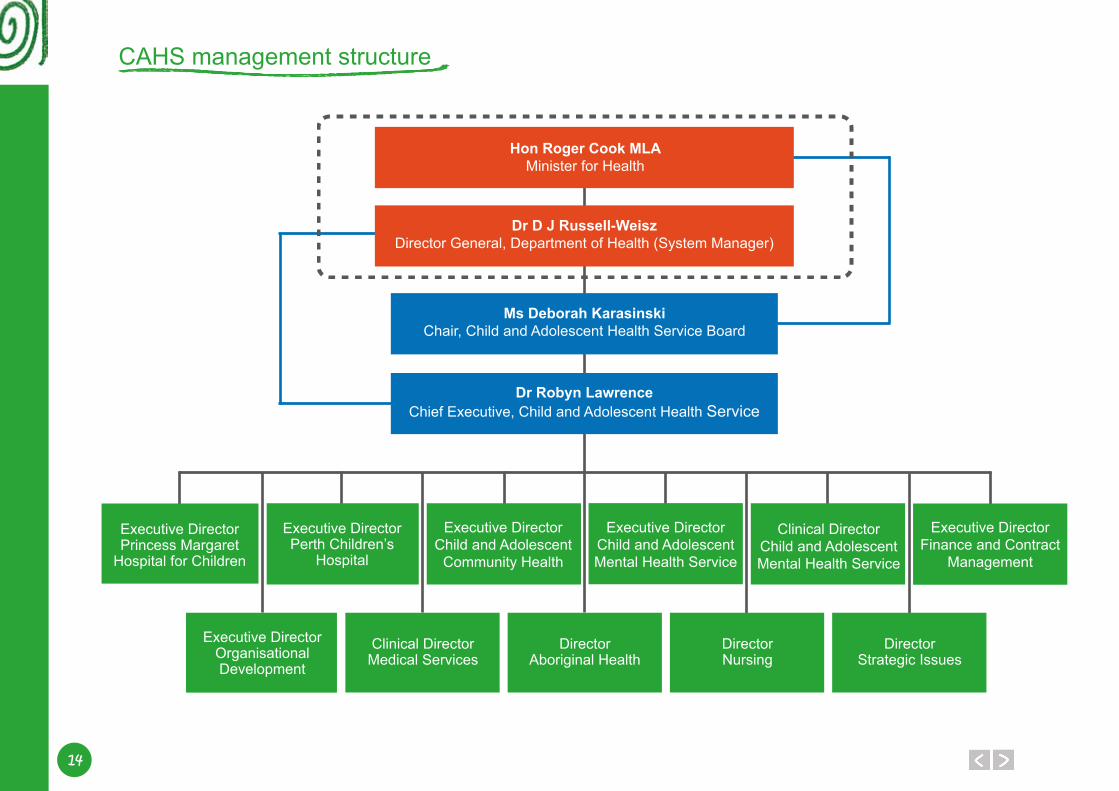
CAHS management structure
Hon Roger Cook MLAMinister for Health
Ms Deborah KarasinskiChair, Child and Adolescent Health Service Board
Executive DirectorPrincess Margaret
Hospital for Children
Executive DirectorOrganisational Development
Clinical DirectorMedical Services
DirectorAboriginal Health
Executive DirectorPerth Children’s
Hospital
Executive DirectorChild and Adolescent
Community Health
Executive DirectorFinance and Contract
Management
Clinical DirectorChild and Adolescent Mental Health Service
Executive DirectorChild and Adolescent Mental Health Service
Dr D J Russell-WeiszDirector General, Department of Health (System Manager)
Dr Robyn LawrenceChief Executive, Child and Adolescent Health Service
DirectorNursing
DirectorStrategic Issues
1515
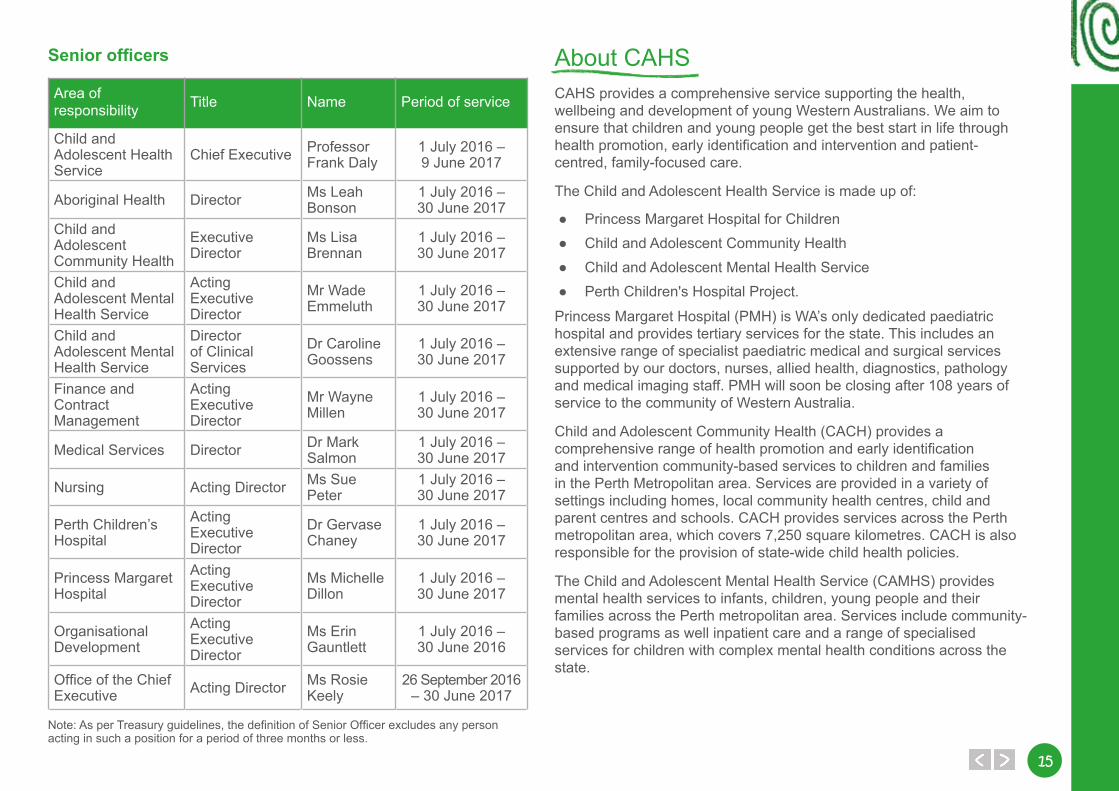
Senior officers
Area of responsibility Title Name Period of service
Child and Adolescent Health Service
Chief Executive Professor Frank Daly
1 July 2016 – 9 June 2017
Aboriginal Health Director Ms Leah Bonson
1 July 2016 – 30 June 2017
Child and Adolescent Community Health
Executive Director
Ms Lisa Brennan
1 July 2016 – 30 June 2017
Child and Adolescent Mental Health Service
Acting Executive Director
Mr Wade Emmeluth
1 July 2016 – 30 June 2017
Child and Adolescent Mental Health Service
Director of Clinical Services
Dr Caroline Goossens
1 July 2016 – 30 June 2017
Finance and Contract Management
Acting Executive Director
Mr Wayne Millen
1 July 2016 – 30 June 2017
Medical Services Director Dr Mark Salmon
1 July 2016 – 30 June 2017
Nursing Acting Director Ms Sue Peter
1 July 2016 – 30 June 2017
Perth Children’s Hospital
Acting Executive Director
Dr Gervase Chaney
1 July 2016 – 30 June 2017
Princess Margaret Hospital
Acting Executive Director
Ms Michelle Dillon
1 July 2016 – 30 June 2017
Organisational Development
Acting Executive Director
Ms Erin Gauntlett
1 July 2016 – 30 June 2016
Office of the Chief Executive Acting Director Ms Rosie
Keely26 September 2016
– 30 June 2017
Note: As per Treasury guidelines, the definition of Senior Officer excludes any person acting in such a position for a period of three months or less.
About CAHSCAHS provides a comprehensive service supporting the health, wellbeing and development of young Western Australians. We aim to ensure that children and young people get the best start in life through health promotion, early identification and intervention and patient-centred, family-focused care.
The Child and Adolescent Health Service is made up of:
● Princess Margaret Hospital for Children● Child and Adolescent Community Health● Child and Adolescent Mental Health Service● Perth Children's Hospital Project.
Princess Margaret Hospital (PMH) is WA’s only dedicated paediatric hospital and provides tertiary services for the state. This includes an extensive range of specialist paediatric medical and surgical services supported by our doctors, nurses, allied health, diagnostics, pathology and medical imaging staff. PMH will soon be closing after 108 years of service to the community of Western Australia.
Child and Adolescent Community Health (CACH) provides a comprehensive range of health promotion and early identification and intervention community-based services to children and families in the Perth Metropolitan area. Services are provided in a variety of settings including homes, local community health centres, child and parent centres and schools. CACH provides services across the Perth metropolitan area, which covers 7,250 square kilometres. CACH is also responsible for the provision of state-wide child health policies.
The Child and Adolescent Mental Health Service (CAMHS) provides mental health services to infants, children, young people and their families across the Perth metropolitan area. Services include community-based programs as well inpatient care and a range of specialised services for children with complex mental health conditions across the state.
16
Perth Children’s Hospital (PCH), located at the QEII Medical Centre in Nedlands, will replace PMH.
The new hospital will include an integrated paediatric research and education facility, and will provide inpatient, ambulatory and outpatient services, with increased bed capacity. It will also house WA’s only paediatric trauma centre. All specialist services currently provided by PMH will be available at PCH, with many clinical areas expanded including an increase in neonatal and oncology capacity, an expanded Surgical Day Stay Unit and the introduction of a High Dependency Unit alongside the Intensive Care Unit.
Shared responsibilities with other agenciesIntegral to the success of CAHS in delivering health services is the ability to partner with other organisations; government and non-government. In delivering care, CAHS works closely with numerous agencies, including, but not limited to the Mental Health and Disability Services Commissions and the Departments of:
● Health● Education● Aboriginal Affairs● Child Protection and Family Support● Justice.
CAHS partners with a large number of community and non-profit organisations that make significant contributions to support our patients, clients, families and carers.
Outcome Based Management FrameworkTo comply with its legislative obligations, CAHS operates under the WA health system Outcome Based Management Framework. This framework describes how outcomes, services and key performance indicators are used to measure agency performance towards achieving the relevant overarching whole-of-government goal. Key performance indicators measure the effectiveness and efficiency of services provided by the WA health system in achieving the stated desired outcomes.
All WA health system reporting entities contribute to achieving the outcomes through health services delivered either directly by the entities or indirectly through contracts with non-government organisations.
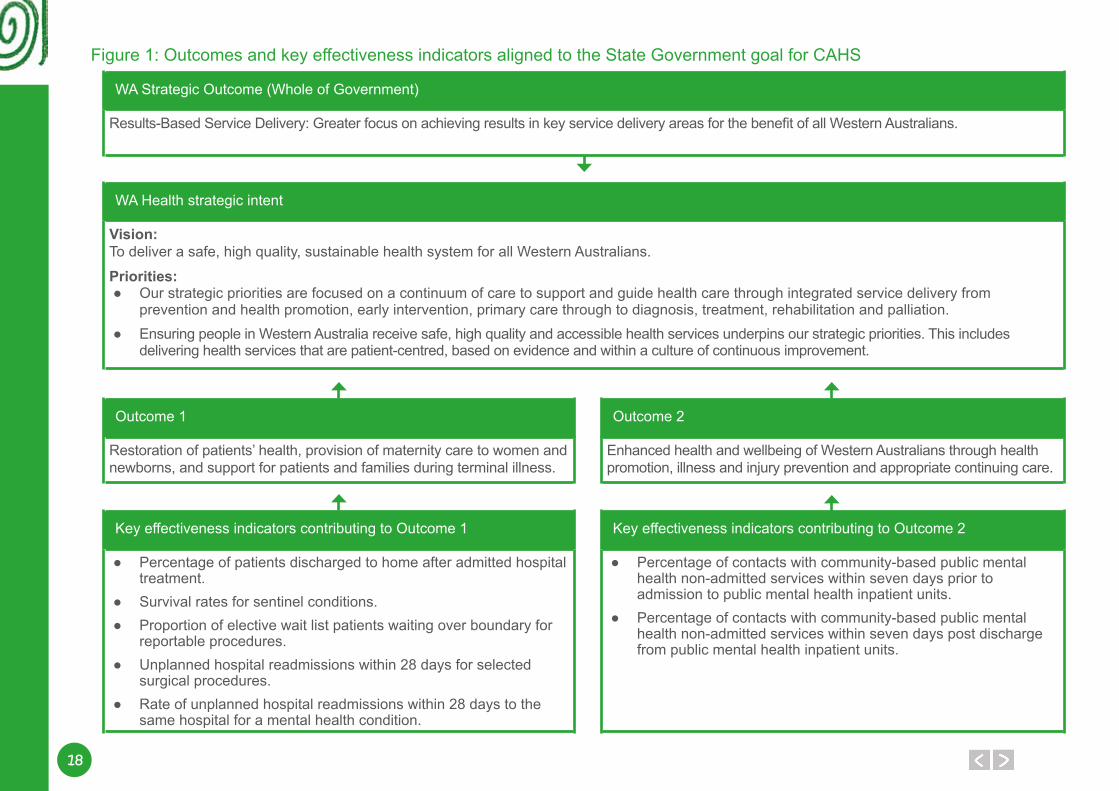
The WA health system’s outcomes and key performance indicators for 2016–17 are aligned to the State Government goal of “greater focus on achieving results in key service delivery areas for the benefit of all Western Australians” (see Figure 1 overleaf).
The outcomes for achievement in 2016–17 by CAHS are:
Outcome 1: Restoration of patients’ health, provision of maternity care to women and newborns, and support for patients and families during terminal illness.
Outcome 2: Enhanced health and wellbeing of Western Australians through health promotion, illness and injury prevention and appropriate continuing care.
CAHS activities that are aligned to Outcome 1 and 2 are cited in Figure 2 overleaf.
Activities related to Outcome 1 aim to:1. Provide quality diagnostic and treatment services that ensure the
maximum restoration to health after an acute illness or injury.
2. Provide appropriate after-care and rehabilitation to ensure thatpeople’s physical and social functioning is restored as far aspossible.
3. Provide appropriate care and support for patients and their familiesduring terminal illness.
Activities related to Outcome 2 aim to:1. Increase the likelihood of optimal health and wellbeing by:
○ providing programs that support optimal physical, socialand emotional development of infants and children
○ encouraging healthy lifestyles (e.g. diet and exercise).
1717
2. Reduce the likelihood of onset of disease or injury by:
○ immunisation programs○ safety programs.
3. Reduce the risk of long-term disability or premature death from injuryor illness through prevention, early identification and intervention,such as:
○ programs for early detection of developmental issues inchildren and appropriate referral for intervention.
○ early identification and intervention of disease anddisabling conditions (e.g. screening of newborns) withappropriate referrals.
○ programs that support self-management by people withdiagnosed conditions and disease (e.g. diabetic education)
○ monitor the incidence of disease in the population todetermine the effectiveness of primary health measures.
4. Provide continuing care services and programs that improve andenhance the wellbeing and environment for people with chronicillness or disability, enabling people with chronic illness or disability tomaintain as much independence in their everyday life as their illnessor disability permits, supporting people in their homes for as long aspossible and providing extra care when long-term residential care isrequired. Services and programs are delivered to:
○ ensure that people experience the minimum of pain anddiscomfort from their chronic illness or disability.
○ maintain the optimal level of physical and socialfunctioning.
○ prevent or slow down the progression of the illness ordisability.
○ enable people to live as long as possible in the place oftheir choice supported by, for example, home careservices.
○ support families and carers in their roles.○ provide access to recreation and education.
Performance against these activities and outcomes are summarised in the Agency Performance section, and described in detail under Key Performance Indicators in the Disclosures and Legal Compliance section commencing on page 112.
"Thank you for looking after me when I was a baby"
from Callia
18
Figure 1: Outcomes and key effectiveness indicators aligned to the State Government goal for CAHS
WA Strategic Outcome (Whole of Government)
Results-Based Service Delivery: Greater focus on achieving results in key service delivery areas for the benefit of all Western Australians.
WA Health strategic intent
Vision: To deliver a safe, high quality, sustainable health system for all Western Australians.
Priorities:● Our strategic priorities are focused on a continuum of care to support and guide health care through integrated service delivery from
prevention and health promotion, early intervention, primary care through to diagnosis, treatment, rehabilitation and palliation.● Ensuring people in Western Australia receive safe, high quality and accessible health services underpins our strategic priorities. This includes
delivering health services that are patient-centred, based on evidence and within a culture of continuous improvement.
Outcome 1
Restoration of patients’ health, provision of maternity care to women and newborns, and support for patients and families during terminal illness.
Key effectiveness indicators contributing to Outcome 1
● Percentage of patients discharged to home after admitted hospitaltreatment.
● Survival rates for sentinel conditions.● Proportion of elective wait list patients waiting over boundary for
reportable procedures.● Unplanned hospital readmissions within 28 days for selected
surgical procedures.● Rate of unplanned hospital readmissions within 28 days to the
same hospital for a mental health condition.
Key effectiveness indicators contributing to Outcome 2
● Percentage of contacts with community-based public mentalhealth non-admitted services within seven days prior toadmission to public mental health inpatient units.
● Percentage of contacts with community-based public mentalhealth non-admitted services within seven days post dischargefrom public mental health inpatient units.
Outcome 2
Enhanced health and wellbeing of Western Australians through health promotion, illness and injury prevention and appropriate continuing care.
1919
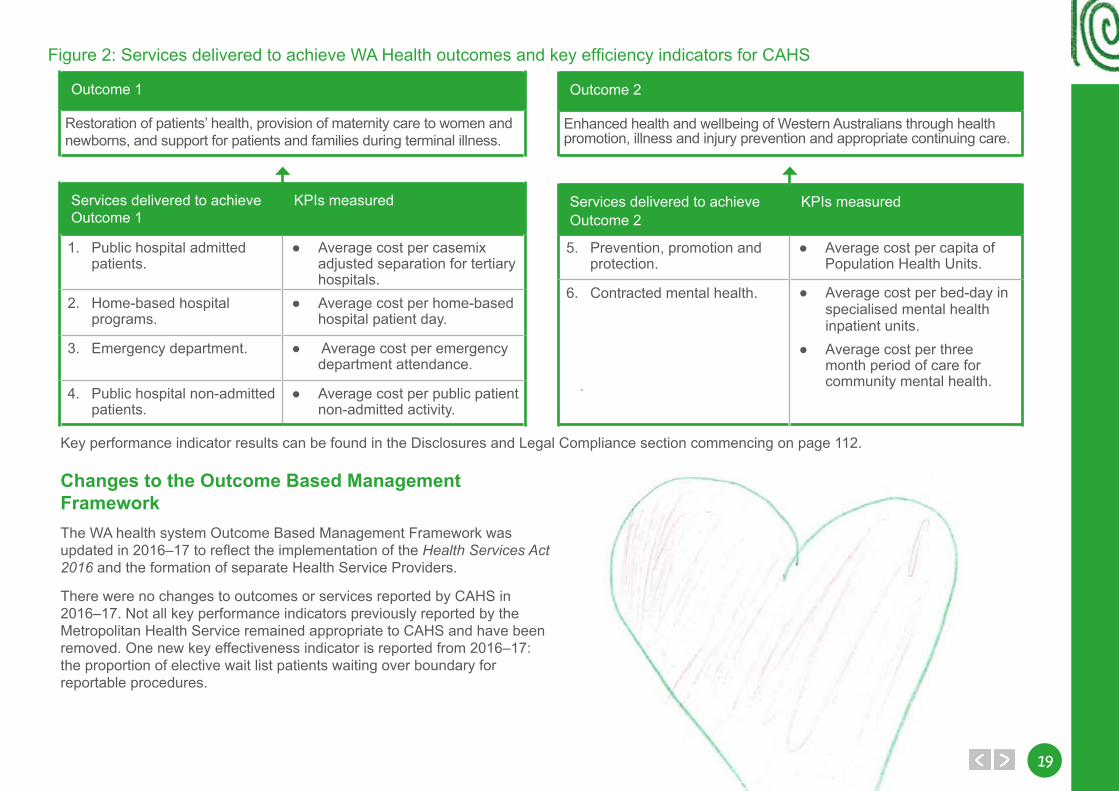
Figure 2: Services delivered to achieve WA Health outcomes and key efficiency indicators for CAHS
Changes to the Outcome Based Management FrameworkThe WA health system Outcome Based Management Framework was updated in 2016–17 to reflect the implementation of the Health Services Act 2016 and the formation of separate Health Service Providers.
There were no changes to outcomes or services reported by CAHS in 2016–17. Not all key performance indicators previously reported by the Metropolitan Health Service remained appropriate to CAHS and have been removed. One new key effectiveness indicator is reported from 2016–17: the proportion of elective wait list patients waiting over boundary for reportable procedures.
Key performance indicator results can be found in the Disclosures and Legal Compliance section commencing on page 112.
Services delivered to achieve Outcome 1
KPIs measured
1. Public hospital admittedpatients.
● Average cost per casemixadjusted separation for tertiaryhospitals.
2. Home-based hospitalprograms.
● Average cost per home-basedhospital patient day.
3. Emergency department. ● Average cost per emergencydepartment attendance.
4. Public hospital non-admittedpatients.
● Average cost per public patientnon-admitted activity.
Services delivered to achieve Outcome 2
KPIs measured
5. Prevention, promotion andprotection.
● Average cost per capita ofPopulation Health Units.
6. Contracted mental health. ● Average cost per bed-day in specialised mental health inpatient units.
● Average cost per three month period of care for community mental health.
Outcome 1
Restoration of patients’ health, provision of maternity care to women and newborns, and support for patients and families during terminal illness.
Outcome 2
Enhanced health and wellbeing of Western Australians through health promotion, illness and injury prevention and appropriate continuing care.
20
Performance Highlights
PerformanceHighlights
2121
Princess Margaret HospitalComplex neonatal cardiac surgery In September 2016, Princess Margaret Hospital (PMH) restarted complex neonatal cardiac surgery, enabling WA patients to receive treatment in Perth rather than travelling to the Eastern States.
For the past seven years, PMH has transferred complex neonatal cardiac cases to the Eastern States to access specialist surgeons and service infrastructure. PMH has invested time and resources to carefully develop a specialist team in order to be able to provide complex neonatal cardiac surgery to WA-based families. Having a local service saves families travelling away from home at what is already a stressful time for them. It is expected that the new service will treat between 10 and 15 patients a year.
Establishment of the ‘ED pathway’ for oncology and haematology patients In August 2016, the way Ward 3B patients accessed urgent care changed. Prior to this time, oncology and haematology patients who required urgent care, phoned the ward and were asked to present straight to 3B for assessment. Through collaboration between 3B the Emergency Department (ED) and with consultation and involvement of consumers, a new pathway was developed, to better meet the needs of patients and their families. Each patient now receives a special alert card on discharge, identifying them as a 3B patient. When they need to come in for urgent assessment, they phone a dedicated helpline and if required are advised to present to ED. Upon arrival they show their card and are triaged accordingly and assessed in a dedicated area.
KKIND: Keeping Kids in No Distress KKIND is a new way of working together for both families and PMH staff, which aims to minimise trauma, anxiety and distress caused by illness, injury and being in hospital. All patients receive universal KKIND care to help them cope with normal stress and anxiety while they are in hospital or having medical procedures. Some patients may need extra care if their distress levels are very high.
Families continue to play a big part in ensuring that their children’s individual needs are being met and are provided with resources and clinical support during their stay.
New volunteers and increasingly diverse volunteer teamThe PMH volunteer team has more than doubled in size this year in readiness for the move to PCH. Since January 2017, PMH has recruited more than 230 new volunteers. This group is incredibly diverse, with an average age of approximately 30. A total of 45 different languages are spoken, and one in nine are male (previously this was one in 23) as a result of new partnerships with universities across the metropolitan area. PMH supports nursing and education disciplines by providing areas in which student volunteers can gain skills to develop in their chosen careers.
Volunteers undergo training in four different volunteer roles before joining the main roster at PMH, in order to make our volunteer team more flexible. Volunteers are provided with additional training, such as universal play training and wayfinding. The volunteer team will be more visible in the evenings and at weekends as we provide more support to patients and their families.
22
Child and Adolescent Community HealthSchool HealthSchool health services work with school staff and parents to provide health education and health promotion; to develop health care plans for students with complex or chronic health needs; and to connect children and adolescents with other health services and supports as required. In the 2016 school year, there were more than 77,000 occasions of service in primary schools and more than 80,000 occasions of service in high school settings.
The recruitment of additional School Health Nurses has contributed to significant improvement in the number of Kindergarten children receiving a universal School Entry Health Assessment (SEHA). In 2016, 94.8 per cent of Kindergarten children received a SEHA, up from 92.1 per cent in 2014. The SEHA completion rate has consistently exceeded the target rate of 90 per cent.
Child Development Service redesignIn 2016–17, the Perth metropolitan Child Development Service (CDS) completed a major redesign of the service. The revised service model was developed in partnership with consumers to ensure that CDS best meets the needs of children with developmental delays and their families. The CDS redesign focused heavily on service planning, with clinical intake meetings being replaced with individual service planning appointments.
The CDS service model now includes a wide range of intervention options which enables the service to provide more timely and flexible services for children and families, with waiting time reductions maintained for all major allied health disciplines. Waiting times for CDS allied health services are approximately three to five months. This represents a 50 per cent reduction in comparison with 2015–16.
Child Health reformBased on the recommendations of the WA Metropolitan Birth to School Entry Universal Health Service Delivery Model Review (2015), improvements have been successfully implemented across state-wide
community child health services to better meet the needs of all families. Key changes include:
● an updated universal child health contact schedule (0–14 days, 8 weeks, 4 months, 12 months, 2 years and school entry).
● greater flexibility for families through increased drop-in and group sessions.
● improvements in the health check assessment protocols, including use of a more robust parent ages and stages questionnaire for identification of developmental delays.
● targeted individual and group sessions to support families with additional needs.
● an updated Performance Reporting Framework for community child health.
ImmunisationChild and Adolescent Community Health (CACH) delivers a 0–4 year old immunisation service across the Perth metropolitan area and is currently undertaking mapping to ensure services are best placed to reach those in need. CACH also delivers a school-based program encompassing Gardasil (HPV), Varivax (Chicken Pox) and Adacel (Diphtheria Tetanus & Pertussis) vaccines and currently services 152 high schools across the Perth metropolitan area. By the end of 2016, CACH had delivered 72,663 individual vaccines.
In term two of 2017, CACH started the Meningococcal W campaign for high school students in years 10, 11 and 12 across the Perth metropolitan area. The numbers of schools have been increased to include all the senior secondary colleges across the metropolitan area. The majority of vaccinations started in term three for this program. During May and June 2017, CACH school-based teams have vaccinated 2,900 students.
In 2016–17 CACH delivered a total of 147,870 vaccinations in the 0–4 and school-aged immunisation services.
2323
Aboriginal HealthThe CACH Aboriginal Health Team (AHT) delivers the Enhanced Aboriginal Child Health Schedule (EACHS) to families who are concerned, at risk, or families who choose to receive services from the AHT. The AHT helps families to raise healthy children by providing the community with child health information and empowering parents to build on the knowledge they have of their children.
State Government funding under the WA Footprints to Better Health Initiative (FBH) enables the AHT to deliver additional services within the Local Government Areas of Joondalup and Wanneroo in the North Metropolitan Area and Gosnells and Armadale in the South Metropolitan Area. Within the Armadale and Kelmscott Shire, the AHT delivers a successful, culturally appropriate and secure Aboriginal Ear Health Clinic. Funding from Rural Health West has enabled the AHT to secure the services of an ear, nose and throat specialist. The clinics are delivered by two nurses (who are of Aboriginal descent) and who have built an excellent rapport with the community, resulting in 100 per cent of referred families attending the clinic this year.
Child and Adolescent Mental Health ServiceImplementation of improvement initiatives at Inpatient Unit The Child and Adolescent Mental Health Service (CAMHS) Inpatient Unit (IPU) has made significant progress against more than 700 action items on their ‘IPU Project Plan’. The purpose of this plan is to ensure that the inpatient service transitions to Perth Children’s Hospital (PCH) effectively and efficiently. The project plan incorporates recommendations from:
● clinical incidents at the IPU
● performance check and improvement processes across the CAMHS acute services
● suggestions from consumers, carers and families
● operational planning for transition to PCH.
Key achievements to date include:
● implementation of a new recovery focused, trauma informed, patient and family-centred model of care. The model of care is guided by the newly affirmed mission statement, vision and values which have been developed by the IPU team.
● the development of seven clinical packages providing guidance for clinicians in the delivery of evidence-based mental health care for young people presenting with psychosis, depression, emerging personality disorder, anxiety and young people who require medication review, diagnostic clarification or crisis prevention.
● implementation of the Safewards model. Safewards was developed in the United Kingdom by Professor Len Bowers and colleagues. It specifically examines events known in the model as ‘conflicts’ (events that threaten staff and patient safety, such as self-harm, suicide, aggression, absconding) and ‘containments’ (things staff do to prevent or reduce harm to staff and patients, such as increased observation, use of extra medication, use of restrictive interventions). The Safewards model offers 10 interventions that are designed to reduce the risk of conflict and containment events occurring. To date, the CAMHS IPU has implemented six of the 10 interventions.
● establishment of and recruitment to a range of new positions. ● development of an extensive staff training program. ● implementation of a furnished sensory modulation room and training
staff in sensory modulation. ● redesign of the ‘My Recovery Plan’ in response to feedback from
young people and the development of an accompanying clinician training package.
The IPU presented this plan at the Towards Elimination of Restrictive Practices 11th National Forum.
24
Realignment of Acute Community Intervention Team and Acute Response Team CAMHS formed a design team to review the existing models of care for the Acute Community Intervention Team (ACIT) and Acute Response Team (ART) to ensure these services continue to meet the needs of children, young people and their families.
The review incorporated an analysis of demand, feedback from consumers, carers and stakeholders, and focused on maximising the use of clinical capacity, improving equity of access and reducing service transition points. A ‘community integrated model’ was developed, which involved the acute response and intervention functions of these teams being decentralised and devolved into community CAMHS teams. The new model was successfully implemented on 3 January 2017 and has resulted in improvements in access, care closer-to-home and the removal of transition points and duplication of assessments; all of which are important to children and families.
Aboriginal community engagement and mental health initiatives implemented at ArmadaleThe Armadale CAMHS Aboriginal Mental Health Worker has led the Armadale Community CAMHS team in implementing a number of initiatives designed to improve access and engagement for Aboriginal young people in the local area.
These include:
● participation in the Armadale Aboriginal Workers Networking Group. ● co-facilitation of a Life Skills for Year 7 and 8 Aboriginal girls
considered to be at risk. ● production of a booklet of Aboriginal ‘Grandparents’ Stories’ that has
been published and distributed to local schools to promote social and emotional learning.
● establishment of a bi-monthly Aboriginal Grandparents and Elders morning tea.
● supervision of Aboriginal Mental Health Worker Practicum Students.
These initiatives have proved extremely successful at increasing access and engagement for Aboriginal children, young people and families at Armadale CAMHS.
Aboriginal Health ServicesThe Child and Adolescent Health Service (CAHS)continues to support and invest in the delivery of culturally safe services and programs that seek to close the gaps in health and wellbeing of Aboriginal people.
In 2016–17, CAHS delivered a range of programs aimed at improving the best possible outcomes for patients and clients, such as:
● Koorliny Moort ‘Walking with Families’ – Provides out of hospital care to Aboriginal families who might find it hard to come into hospital for their appointments or who want to stay closer to home.
● Healthy Kulungas (children) – A lifestyle program for Aboriginal families experiencing weight related health issues and/or weight related health complications for a child in the family.
● Aboriginal Liaison Hospital Services – Provides cultural and practical support and advocacy to children and families identified as most vulnerable within the hospital or community setting.
● Aboriginal Health Team CACH: EACHS – Enhanced Aboriginal Child Health Schedule. Involves Community Health Nurses working alongside Aboriginal Health Workers to provide a comprehensive and culturally acceptable primary health care service designed specifically to address the needs of Aboriginal families.
● Aboriginal Mental Health Services: ‘Warlang Nyit Wirrin, Moorditj Koorlangaka’s “Healthy little spirits make good strong children and adolescents” – Provides cultural support and advocacy for Aboriginal infants, children and young people under the age of 18 and their families in accessing CAMHS mental health services.
● ‘Kulunga Moort Mia’: Children and family place – A lounge area at PCH provides a culturally sensitive relaxing retreat for families accessing the hospital, away from busy clinical environments.
2525
CAHS has an ongoing commitment to cultural learning, with 85 per cent of staff having completed the cultural e-learning program. A number of Aboriginal publications have been developed to further assist staff with their learning and engagement with Aboriginal patients, their families and communities.
Significant events such as NAIDOC week continued to be celebrated across our services.
Research highlightsChild health research at CAHS enables researchers in CAHS and our partner organisations to perform research of the highest quality that will translate into improvements in overall health for children and young people.
Current ongoing research activity in CAHS to 30 April 2017
Interventional clinical trials
137 studies 13,943 participantsObservational studies
116 studies 36,405 participants
Clinicians in CAHS are involved in a number of National Health and Medical Research Council Centres of Research Excellence to improve outcomes for premature infants, children with diabetes, cerebral palsy, food allergies, ear infections, rheumatic heart disease, fetal alcohol spectrum disorder, neurological disorders and to improve health services in emergency medicine and for Aboriginal and Torres Strait Islander children. Researchers at CAHS have published more than 330 scientific publications in the last 12 months.
The Child Health Research Strategic Council was formed in 2016 to provide leadership in child health research across PCH, Telethon Kids Institute (TKI) and partner universities and initiate collaborative strategies to:
● support and encourage opportunities for collaboration between research and clinical service delivery.
● ensure that an optimal environment is provided for world class research, including facilities, training, research support and other resources as appropriate.
● support academic and clinical appointments to maximise the positioning of PCH as a premier academic child health centre.
● oversee the activities of the research facilities at PCH and within CAHS.
CAHS is developing a strong research culture across the organisation by:
● recognising that research strengthens clinical practice. ● supporting departments to develop a research culture and
appropriate infrastructure. ● encouraging and providing resources for early career medical,
nursing and allied health staff to undertake research as part of their practice.
● prioritising research experience as part of staff selection.
During 2016–17, work has focused on strengthening research ethics and governance processes, including the development of a condensed approval process for low-risk projects and better database systems for research projects.
In 2017, CAHS partnered with TKI and received a grant to further enhance governance and support researchers to navigate the processes that are required.
Like the work undertaken in services, there has been an increased focus on community engagement in the research area. At PCH, there will be a dedicated research facility within the outpatient area and a more formal process for identifying families who are interested in being involved in research.
26
Statement from the Consumer Advisory Council Chair
“Change is hard at first, messy in the middle and gorgeous at the end.” – Robin Sharma
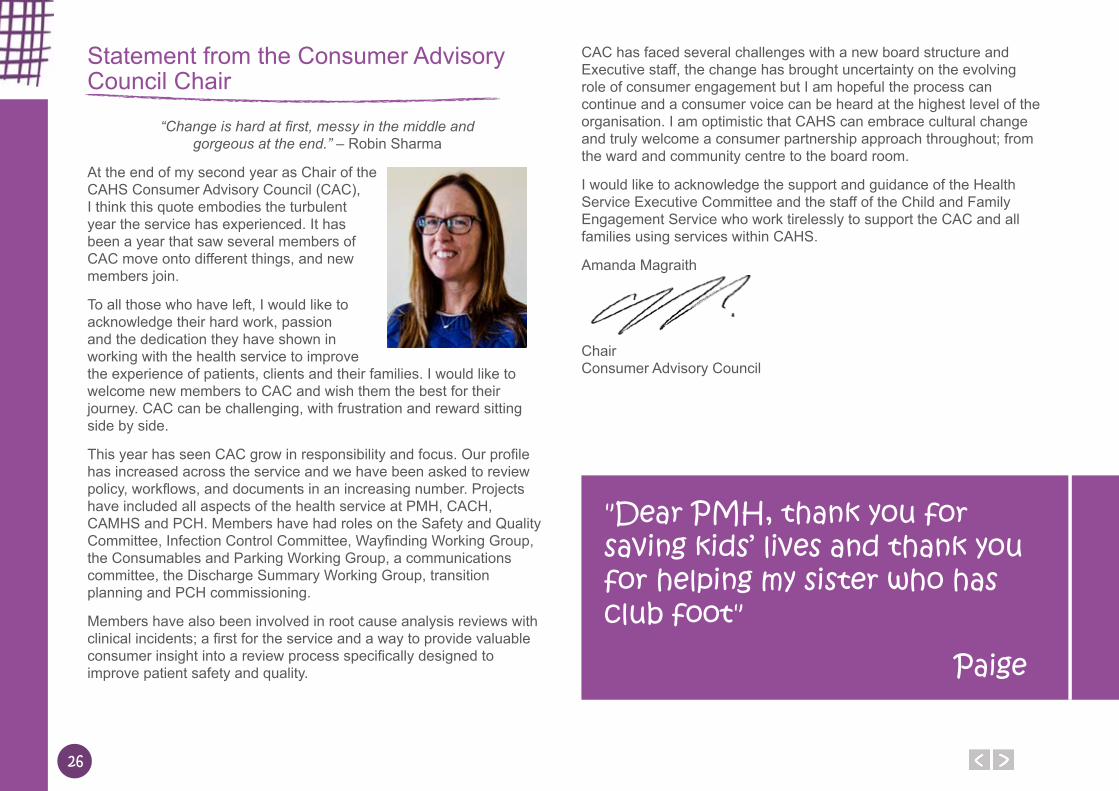
At the end of my second year as Chair of the CAHS Consumer Advisory Council (CAC), I think this quote embodies the turbulent year the service has experienced. It has been a year that saw several members of CAC move onto different things, and new members join.
To all those who have left, I would like to acknowledge their hard work, passion and the dedication they have shown in working with the health service to improve the experience of patients, clients and their families. I would like to welcome new members to CAC and wish them the best for their journey. CAC can be challenging, with frustration and reward sitting side by side.
This year has seen CAC grow in responsibility and focus. Our profile has increased across the service and we have been asked to review policy, workflows, and documents in an increasing number. Projects have included all aspects of the health service at PMH, CACH, CAMHS and PCH. Members have had roles on the Safety and Quality Committee, Infection Control Committee, Wayfinding Working Group, the Consumables and Parking Working Group, a communications committee, the Discharge Summary Working Group, transition planning and PCH commissioning.
Members have also been involved in root cause analysis reviews with clinical incidents; a first for the service and a way to provide valuable consumer insight into a review process specifically designed to improve patient safety and quality.
CAC has faced several challenges with a new board structure and Executive staff, the change has brought uncertainty on the evolving role of consumer engagement but I am hopeful the process can continue and a consumer voice can be heard at the highest level of the organisation. I am optimistic that CAHS can embrace cultural change and truly welcome a consumer partnership approach throughout; from the ward and community centre to the board room.
I would like to acknowledge the support and guidance of the Health Service Executive Committee and the staff of the Child and Family Engagement Service who work tirelessly to support the CAC and all families using services within CAHS.
Amanda Magraith
Chair Consumer Advisory Council
"Dear PMH, thank you for saving kids’ lives and thank you for helping my sister who has club foot"
Paige
2727
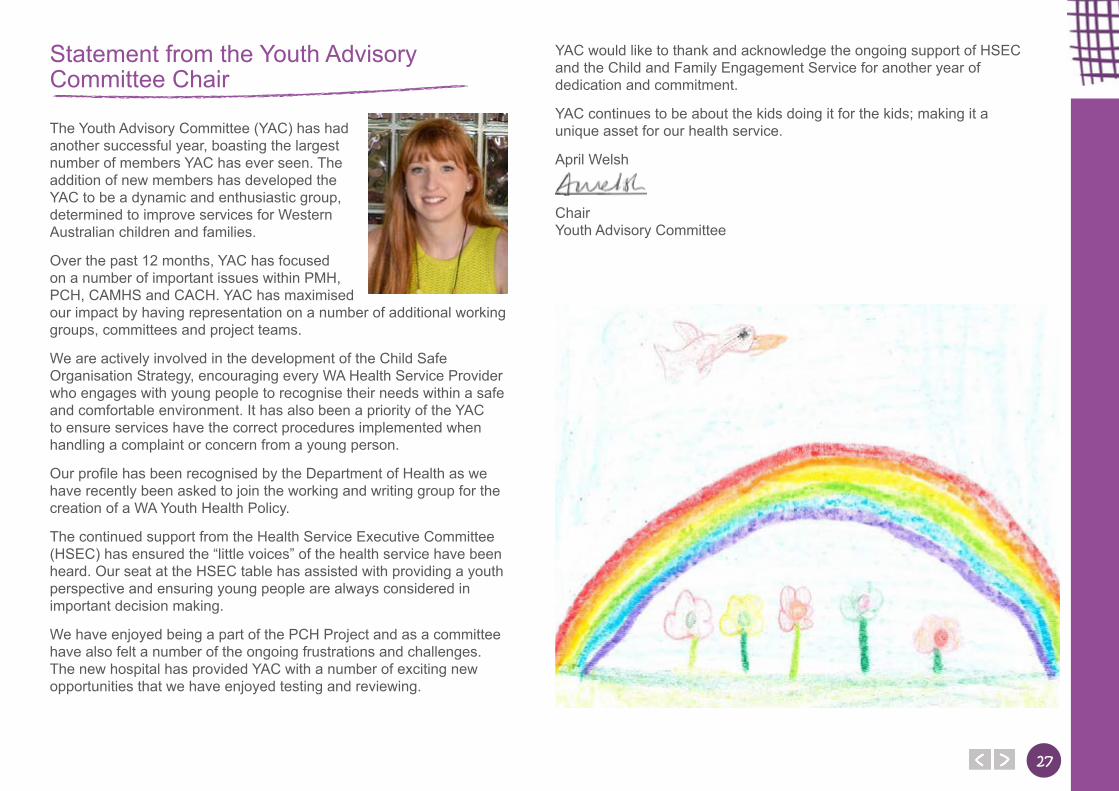
Statement from the Youth Advisory Committee Chair
The Youth Advisory Committee (YAC) has had another successful year, boasting the largest number of members YAC has ever seen. The addition of new members has developed the YAC to be a dynamic and enthusiastic group, determined to improve services for Western Australian children and families.
Over the past 12 months, YAC has focused on a number of important issues within PMH, PCH, CAMHS and CACH. YAC has maximised our impact by having representation on a number of additional working groups, committees and project teams.
We are actively involved in the development of the Child Safe Organisation Strategy, encouraging every WA Health Service Provider who engages with young people to recognise their needs within a safe and comfortable environment. It has also been a priority of the YAC to ensure services have the correct procedures implemented when handling a complaint or concern from a young person.
Our profile has been recognised by the Department of Health as we have recently been asked to join the working and writing group for the creation of a WA Youth Health Policy.
The continued support from the Health Service Executive Committee (HSEC) has ensured the “little voices” of the health service have been heard. Our seat at the HSEC table has assisted with providing a youth perspective and ensuring young people are always considered in important decision making.
We have enjoyed being a part of the PCH Project and as a committee have also felt a number of the ongoing frustrations and challenges. The new hospital has provided YAC with a number of exciting new opportunities that we have enjoyed testing and reviewing.
YAC would like to thank and acknowledge the ongoing support of HSEC and the Child and Family Engagement Service for another year of dedication and commitment.
YAC continues to be about the kids doing it for the kids; making it a unique asset for our health service.
April Welsh
Chair Youth Advisory Committee
28
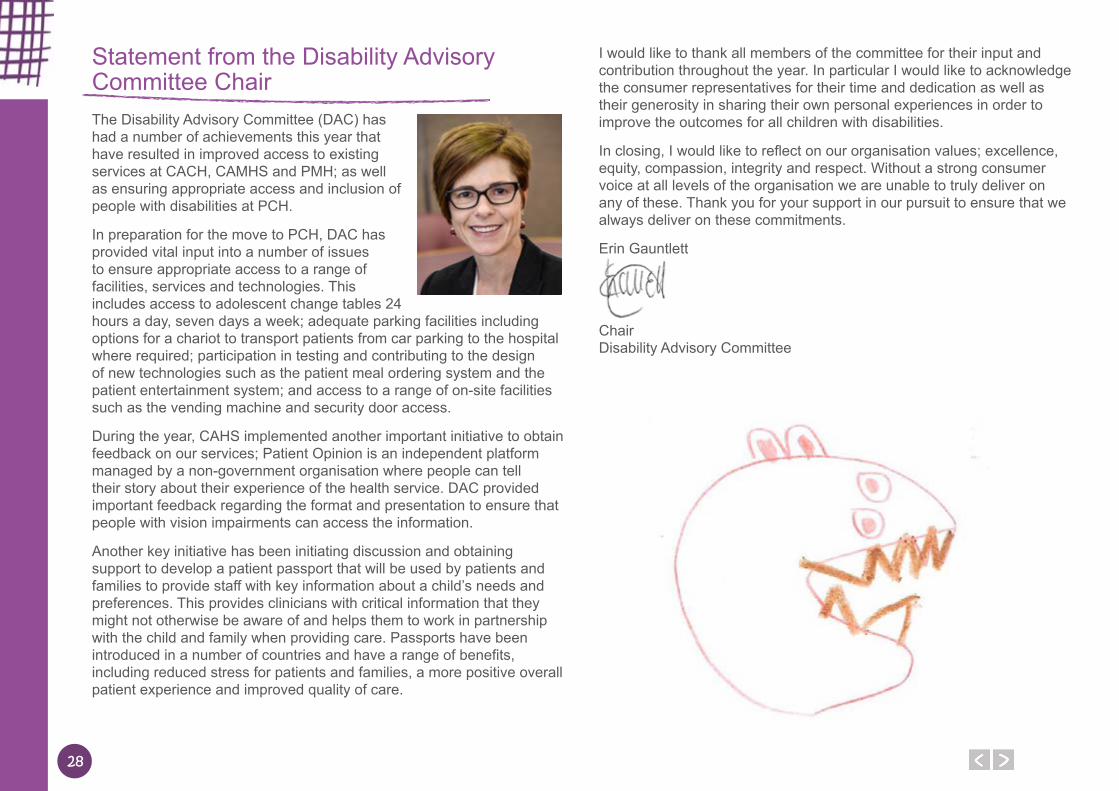
Statement from the Disability Advisory Committee Chair The Disability Advisory Committee (DAC) has had a number of achievements this year that have resulted in improved access to existing services at CACH, CAMHS and PMH; as well as ensuring appropriate access and inclusion of people with disabilities at PCH.
In preparation for the move to PCH, DAC has provided vital input into a number of issues to ensure appropriate access to a range of facilities, services and technologies. This includes access to adolescent change tables 24 hours a day, seven days a week; adequate parking facilities including options for a chariot to transport patients from car parking to the hospital where required; participation in testing and contributing to the design of new technologies such as the patient meal ordering system and the patient entertainment system; and access to a range of on-site facilities such as the vending machine and security door access.
During the year, CAHS implemented another important initiative to obtain feedback on our services; Patient Opinion is an independent platform managed by a non-government organisation where people can tell their story about their experience of the health service. DAC provided important feedback regarding the format and presentation to ensure that people with vision impairments can access the information.
Another key initiative has been initiating discussion and obtaining support to develop a patient passport that will be used by patients and families to provide staff with key information about a child’s needs and preferences. This provides clinicians with critical information that they might not otherwise be aware of and helps them to work in partnership with the child and family when providing care. Passports have been introduced in a number of countries and have a range of benefits, including reduced stress for patients and families, a more positive overall patient experience and improved quality of care.
I would like to thank all members of the committee for their input and contribution throughout the year. In particular I would like to acknowledge the consumer representatives for their time and dedication as well as their generosity in sharing their own personal experiences in order to improve the outcomes for all children with disabilities.
In closing, I would like to reflect on our organisation values; excellence, equity, compassion, integrity and respect. Without a strong consumer voice at all levels of the organisation we are unable to truly deliver on any of these. Thank you for your support in our pursuit to ensure that we always deliver on these commitments.
Erin Gauntlett
Chair Disability Advisory Committee
2929
Agency Performance
AgencyPerformance
30
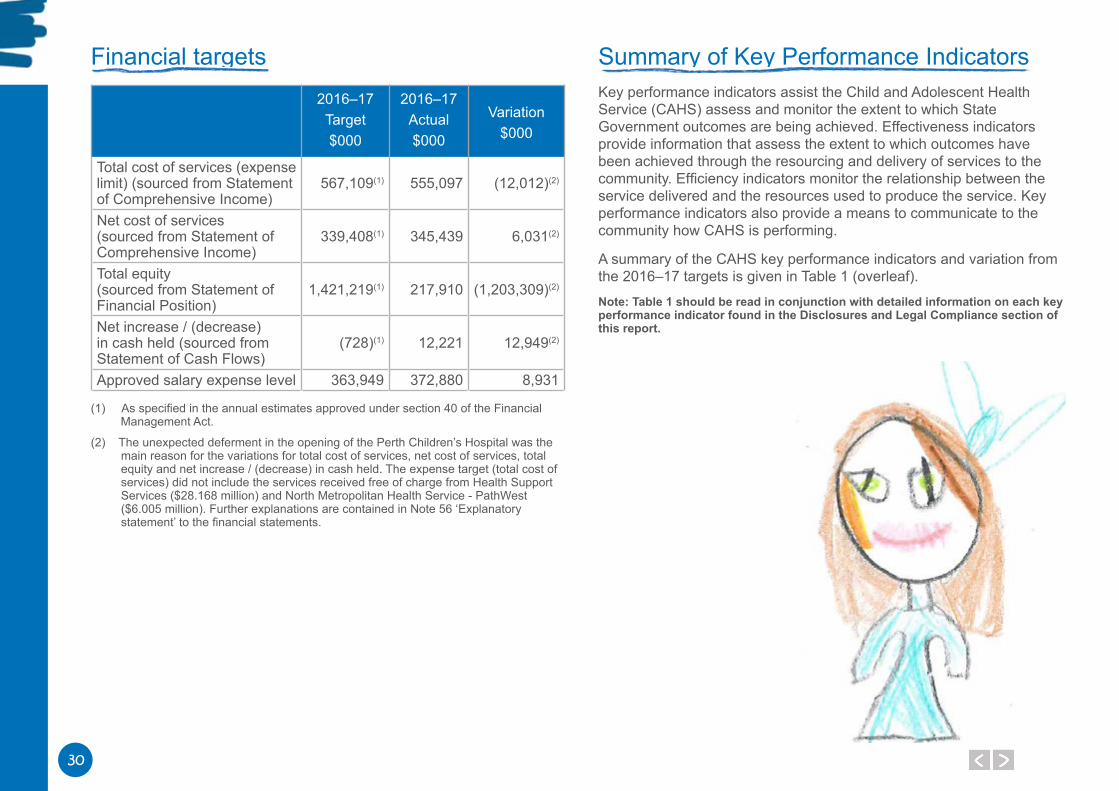
Financial targets2016–17
Target$000
2016–17Actual$000
Variation
$000
Total cost of services (expense limit) (sourced from Statement of Comprehensive Income)
567,109(1) 555,097 (12,012)(2)
Net cost of services (sourced from Statement of Comprehensive Income)
339,408(1) 345,439 6,031(2)
Total equity (sourced from Statement of Financial Position)
1,421,219(1) 217,910 (1,203,309)(2)
Net increase / (decrease) in cash held (sourced from Statement of Cash Flows)
(728)(1) 12,221 12,949(2)
Approved salary expense level 363,949 372,880 8,931
(1) As specified in the annual estimates approved under section 40 of the Financial Management Act.
(2) The unexpected deferment in the opening of the Perth Children’s Hospital was themain reason for the variations for total cost of services, net cost of services, total equity and net increase / (decrease) in cash held. The expense target (total cost of services) did not include the services received free of charge from Health Support Services ($28.168 million) and North Metropolitan Health Service - PathWest ($6.005 million). Further explanations are contained in Note 56 ‘Explanatory statement’ to the financial statements.
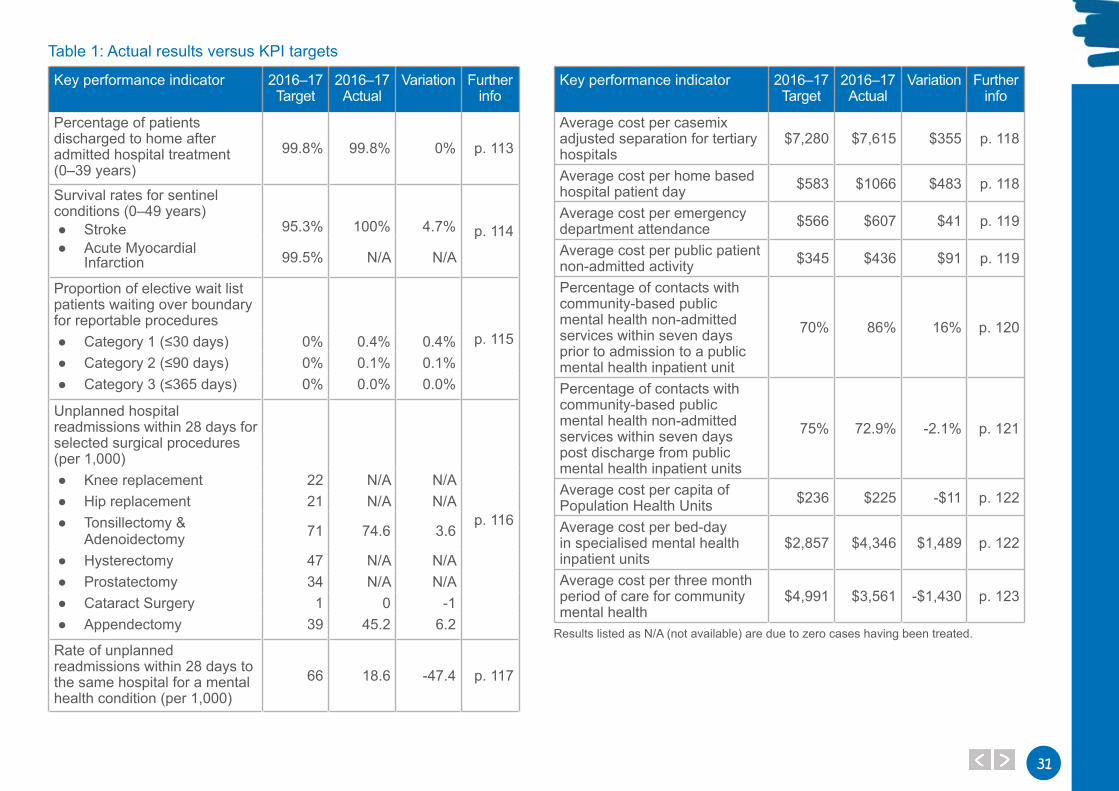
Summary of Key Performance IndicatorsKey performance indicators assist the Child and Adolescent Health Service (CAHS) assess and monitor the extent to which State Government outcomes are being achieved. Effectiveness indicators provide information that assess the extent to which outcomes have been achieved through the resourcing and delivery of services to the community. Efficiency indicators monitor the relationship between the service delivered and the resources used to produce the service. Key performance indicators also provide a means to communicate to the community how CAHS is performing.
A summary of the CAHS key performance indicators and variation from the 2016–17 targets is given in Table 1 (overleaf).
Note: Table 1 should be read in conjunction with detailed information on each key performance indicator found in the Disclosures and Legal Compliance section of this report.
3131
Key performance indicator 2016–17 Target
2016–17 Actual
Variation Further info
Percentage of patients discharged to home after admitted hospital treatment (0–39 years)
99.8% 99.8% 0% p. 113
Survival rates for sentinel conditions (0–49 years)
● Stroke ● Acute Myocardial
Infarction
95.3% 100% 4.7% p. 114
99.5% N/A N/A
Proportion of elective wait list patients waiting over boundary for reportable procedures
p. 115 ● Category 1 (≤30 days) 0% 0.4% 0.4% ● Category 2 (≤90 days) 0% 0.1% 0.1% ● Category 3 (≤365 days) 0% 0.0% 0.0%
Unplanned hospital readmissions within 28 days for selected surgical procedures (per 1,000)
p. 116
● Knee replacement 22 N/A N/A ● Hip replacement 21 N/A N/A ● Tonsillectomy &
Adenoidectomy 71 74.6 3.6
● Hysterectomy 47 N/A N/A ● Prostatectomy 34 N/A N/A ● Cataract Surgery 1 0 -1 ● Appendectomy 39 45.2 6.2
Rate of unplanned readmissions within 28 days to the same hospital for a mental health condition (per 1,000)
66 18.6 -47.4 p. 117
Key performance indicator 2016–17 Target
2016–17 Actual
Variation Further info
Average cost per casemix adjusted separation for tertiary hospitals
$7,280 $7,615 $355 p. 118
Average cost per home based hospital patient day $583 $1066 $483 p. 118
Average cost per emergency department attendance $566 $607 $41 p. 119
Average cost per public patient non-admitted activity $345 $436 $91 p. 119
Percentage of contacts with community-based public mental health non-admitted services within seven days prior to admission to a public mental health inpatient unit
70% 86% 16% p. 120
Percentage of contacts with community-based public mental health non-admitted services within seven days post discharge from public mental health inpatient units
75% 72.9% -2.1% p. 121
Average cost per capita of Population Health Units $236 $225 -$11 p. 122
Average cost per bed-day in specialised mental health inpatient units
$2,857 $4,346 $1,489 p. 122
Average cost per three month period of care for community mental health
$4,991 $3,561 -$1,430 p. 123
Results listed as N/A (not available) are due to zero cases having been treated.
Table 1: Actual results versus KPI targets
32
Improvements towards emergency department accessEmergency Departments (EDs) are specialist multidisciplinary units with expertise in managing acutely unwell patients for their first few hours in hospital.
With the increasing demand on EDs and health services, it is imperative that health service provision is continually monitored to ensure the effective and efficient delivery of safe high-quality care.
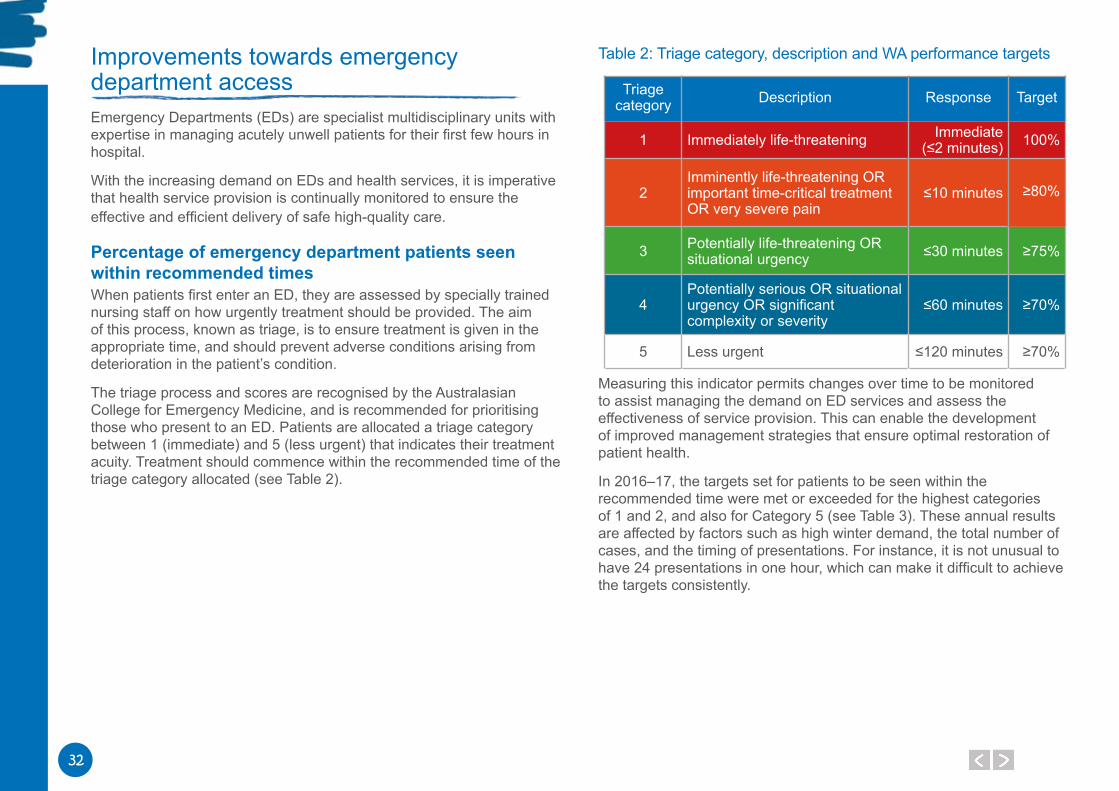
Percentage of emergency department patients seen within recommended timesWhen patients first enter an ED, they are assessed by specially trained nursing staff on how urgently treatment should be provided. The aim of this process, known as triage, is to ensure treatment is given in the appropriate time, and should prevent adverse conditions arising from deterioration in the patient’s condition.
The triage process and scores are recognised by the Australasian College for Emergency Medicine, and is recommended for prioritising those who present to an ED. Patients are allocated a triage category between 1 (immediate) and 5 (less urgent) that indicates their treatment acuity. Treatment should commence within the recommended time of the triage category allocated (see Table 2).
Table 2: Triage category, description and WA performance targets
Triage category Description Response Target
1 Immediately life-threatening Immediate (≤2 minutes) 100%
2Imminently life-threatening OR important time-critical treatment OR very severe pain
≤10 minutes ≥80%
3 Potentially life-threatening OR situational urgency ≤30 minutes ≥75%
4Potentially serious OR situational urgency OR significant complexity or severity
≤60 minutes ≥70%
5 Less urgent ≤120 minutes ≥70%
Measuring this indicator permits changes over time to be monitored to assist managing the demand on ED services and assess the effectiveness of service provision. This can enable the development of improved management strategies that ensure optimal restoration of patient health.
In 2016–17, the targets set for patients to be seen within the recommended time were met or exceeded for the highest categories of 1 and 2, and also for Category 5 (see Table 3). These annual results are affected by factors such as high winter demand, the total number of cases, and the timing of presentations. For instance, it is not unusual to have 24 presentations in one hour, which can make it difficult to achieve the targets consistently.
3333
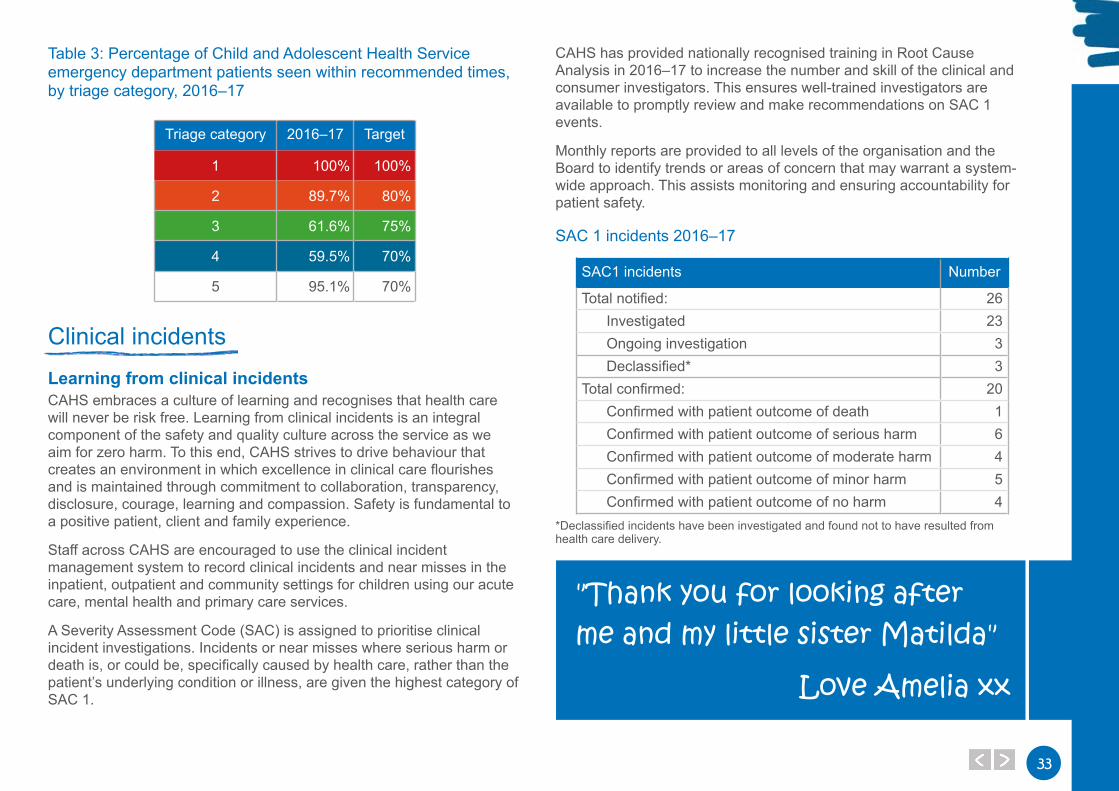
Table 3: Percentage of Child and Adolescent Health Service emergency department patients seen within recommended times, by triage category, 2016–17
Triage category 2016–17 Target
1 100% 100%
2 89.7% 80%
3 61.6% 75%
4 59.5% 70%
5 95.1% 70%
Clinical incidentsLearning from clinical incidents CAHS embraces a culture of learning and recognises that health care will never be risk free. Learning from clinical incidents is an integral component of the safety and quality culture across the service as we aim for zero harm. To this end, CAHS strives to drive behaviour that creates an environment in which excellence in clinical care flourishes and is maintained through commitment to collaboration, transparency, disclosure, courage, learning and compassion. Safety is fundamental to a positive patient, client and family experience.
Staff across CAHS are encouraged to use the clinical incident management system to record clinical incidents and near misses in the inpatient, outpatient and community settings for children using our acute care, mental health and primary care services.
A Severity Assessment Code (SAC) is assigned to prioritise clinical incident investigations. Incidents or near misses where serious harm or death is, or could be, specifically caused by health care, rather than the patient’s underlying condition or illness, are given the highest category of SAC 1.
CAHS has provided nationally recognised training in Root Cause Analysis in 2016–17 to increase the number and skill of the clinical and consumer investigators. This ensures well-trained investigators are available to promptly review and make recommendations on SAC 1 events.
Monthly reports are provided to all levels of the organisation and the Board to identify trends or areas of concern that may warrant a system-wide approach. This assists monitoring and ensuring accountability for patient safety.
SAC 1 incidents 2016–17
SAC1 incidents Number
Total notified: 26Investigated 23Ongoing investigation 3Declassified* 3
Total confirmed: 20Confirmed with patient outcome of death 1Confirmed with patient outcome of serious harm 6Confirmed with patient outcome of moderate harm 4Confirmed with patient outcome of minor harm 5Confirmed with patient outcome of no harm 4
*Declassified incidents have been investigated and found not to have resulted from health care delivery.
"Thank you for looking after me and my little sister Matilda"
Love Amelia xx
34
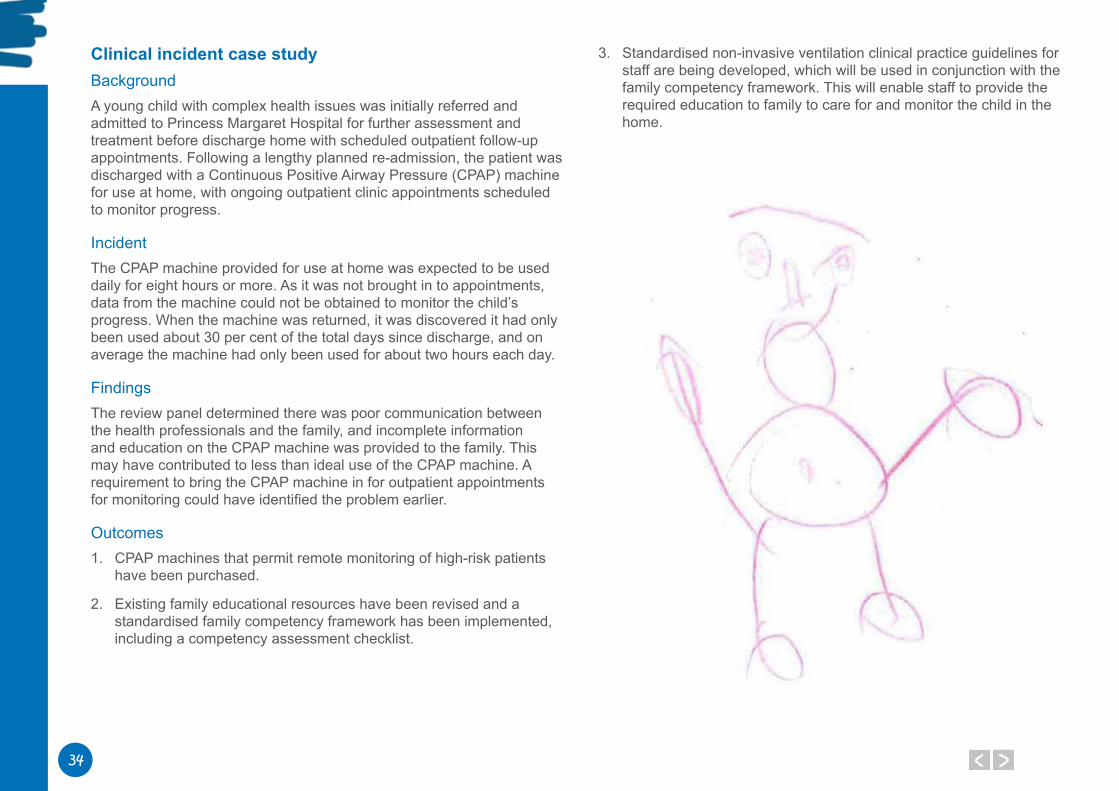
Clinical incident case studyBackgroundA young child with complex health issues was initially referred and admitted to Princess Margaret Hospital for further assessment and treatment before discharge home with scheduled outpatient follow-up appointments. Following a lengthy planned re-admission, the patient was discharged with a Continuous Positive Airway Pressure (CPAP) machine for use at home, with ongoing outpatient clinic appointments scheduled to monitor progress.
Incident The CPAP machine provided for use at home was expected to be used daily for eight hours or more. As it was not brought in to appointments, data from the machine could not be obtained to monitor the child’s progress. When the machine was returned, it was discovered it had only been used about 30 per cent of the total days since discharge, and on average the machine had only been used for about two hours each day.
FindingsThe review panel determined there was poor communication between the health professionals and the family, and incomplete information and education on the CPAP machine was provided to the family. This may have contributed to less than ideal use of the CPAP machine. A requirement to bring the CPAP machine in for outpatient appointments for monitoring could have identified the problem earlier.
Outcomes1. CPAP machines that permit remote monitoring of high-risk patients
have been purchased.
2. Existing family educational resources have been revised and a standardised family competency framework has been implemented, including a competency assessment checklist.
3. Standardised non-invasive ventilation clinical practice guidelines for staff are being developed, which will be used in conjunction with the family competency framework. This will enable staff to provide the required education to family to care for and monitor the child in the home.
3535
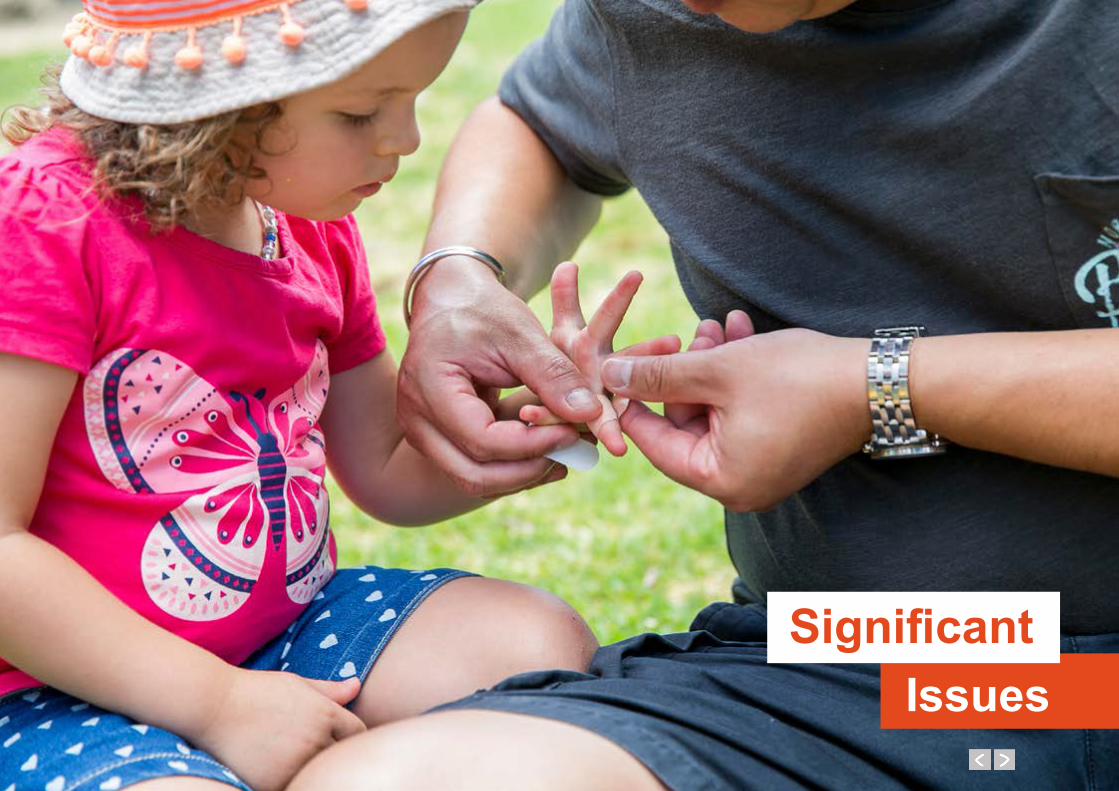
Significant Issues
SignificantIssues
36
Culture and moraleIt is widely acknowledged that the culture of any organisation and the morale of the people working there are inextricably linked to an organisation’s success. The values, motivation, and personal goals of staff are integral components in creating a positive culture where staff feel valued and enjoy the work they do. In healthcare environments in particular, embedding and maintaining a positive work environment is an essential element in ensuring patient safety and wellbeing. Unquestionably, healthcare organisations can be difficult places to be for patients and families who are often at their most vulnerable. We know, however, that patients and their families feel safer and are more trusting of the health care service when the staff caring for them are meaningfully engaged with the values of the organisation and are happy at work. We also know that patients and families are far more likely to ask questions and become actively involved in their health care when the people caring for them feel valued and respected. The Child and Adolescent Health Service (CAHS) Board recognises that staff morale and engagement are critical to patient safety and the effective functioning of Princess Margaret Hospital (PMH) and are crucial factors in the success of Perth Children's Hospital (PCH). Within this context, the Board is committed to ensuring that CAHS is a rewarding and positive place to work and that our patients and their families have the best possible experience during their journey with us.
Delay in the move to Perth Children’s HospitalThe delay in moving to PCH has been widely publicised in the media over the last 12 months. The continuation of the CAHS PCH Project had been a significant cost to the State. The Acting Executive Director PCH has regularly reviewed and changed the project structure and workforce profile to meet the changes in project scope.
Practical completion was accepted by the WA Government in April 2017; however the water quality at the new hospital continues to be a high profile issue directly impacting on confirmation of a move date.
The ageing infrastructure at PMH has required urgent minor works and maintenance to be undertaken to ensure all services can continue to operate safely and efficiently.
An area of priority has been the maintenance and upgrade to the lifts and the Department of Health has funded an on-site resource to respond to lift failure in a timely manner.
The delay in the opening of PCH has meant that the mental health inpatient unit has continued to operate from the Bentley Adolescent Unit (BAU) for far longer than intended. In the absence of a confirmed opening date for PCH, capital works were undertaken to reopen seven inpatient beds in March 2017.
Ageing community infrastructureA number of community facilities used by Child and Adolescent Community Health (CACH) and the Child and Adolescent Mental Health Service (CAMHS) are poorly located in relation to the population they serve, are not fit for purpose and do not comply with the Building Standards.
CACH faces a constant threat of insecure tenure with mounting pressure to vacate a number of government facilities that have been previously provided free of charge. In the last five years, CACH has been evicted from five sites and is vacating another three sites in 2017/18.
There is no funding for alternative premises. In addition, there is an expectation of some Local Governments to achieve commercial (or near commercial) rents for facilities that CACH leases, which represents a further funding challenge for CACH and impacts the sustainability of the service.
A comprehensive statement of need identifying strategic facility requirements was developed and work is underway toward the preparation of a submission to Treasury to seek financial support for strategic infrastructure needs.
Demand and activityOverall CAHS has achieved the activity targets set for 2016–17. The stabilisation in activity can be attributed to the increased capacity of paediatric services developed at Fiona Stanley Hospital, Midland Health Campus and Joondalup Health Campus in the State Health Infrastructure Plan.
3737
PMH has strengthened clinical governance and reporting capability across non-admitted services. Allied health services have developed access criteria. Improvements will be realised in the coming year with ongoing review of clinic profiles and productivity, improved access to and quality of wait list data and effective measures to address non-attendance being implemented.
There has been a 17 per cent increase in the number of births in metropolitan Perth in the four years to 2016–17, contributing to a continuing demand for CACH services. In CACH, the population of children aged 0–4 years is forecast to increase by 23 per cent from 2016 to 2026. The total number of children and young people aged 0–14 years is forecast to increase by 25 per cent.
Community CAMHS has undertaken a system wide reform process aimed at maximising efficiency which has resulted in more children and young people being seen. Following the full implementation of the Choice and Partnership Approach model, 3,385 children were assessed and treated, which is 1,062 more than the corresponding period prior to commencement of implementation. This has been achieved with the same level of resourcing. In addition, there has been a reduction in referral to first appointment times from an average of 50 to 20 days.
Workforce challengesCAHS embarked on an ambitious reform agenda in 2016 to develop safe, robust and sustainable health services. There was a net reduction in the workforce of 62 Full-time Equivalent (FTE) employees in the financial year.
CAHS engaged Press Ganey, a company experienced in patient experience measurement and performance to undertake the ‘Voice of Family’ and ‘Voice of Staff’ surveys.
Survey findings identified two key areas for improvement for the workforce: communication and recognition and respect. Each directorate has developed an action plan for implementation over the coming year.
Recruitment and retention of Junior Medical Officers (JMO) for PMH for 2017 presented some challenges, with the implementation of the new workforce model.
The workforce requirements have been revised for 2017–18 with increased resources being allocated to accommodate JMO leave and professional development.
CACH completed the recruitment of more than 160 new child and school health nurses into child and school health services. Graduate nurses have completed the Transition to Community Health Practice Program, which was offered for the first time in 2016. This program was introduced as part of a service wide recruitment and retention strategy, to allow nurses who have completed the academic specialisation in child and adolescent health nursing (or its equivalent) to consolidate their clinical practice in a supportive environment.
Managing funding and costs efficientlyOverall, CAHS contained costs over the last financial year with only 0.8 per cent increase in total expenditure. In addition, own source revenue increased by 5.7 per cent and the cost of service reduced by 2.5 per cent.
The CAHS Finance Oversight Committee, chaired by the Chief Executive, has developed an increased knowledge and understanding of activity based funding and management, managing funding reform and financial management across the Executive group. This is being shared with managers across CAHS to support departmental accountability and responsibility.
Directorate specific budget reduction strategies have been identified to achieve targets and we will build on this in future years.
During 2016–17, CACH undertook comprehensive workforce affordability modelling across the nursing workforce.
This strategy has been used in conjunction with ongoing monitoring of FTE and payroll expenditure, leading to a better understanding of budgetary pressures and improved budget oversight.
CAMHS has reached an agreement with the Mental Health Commission for inpatient services to receive annual funding of $12.26M under a per diem funding model based upon a bed occupancy of 80 per cent.
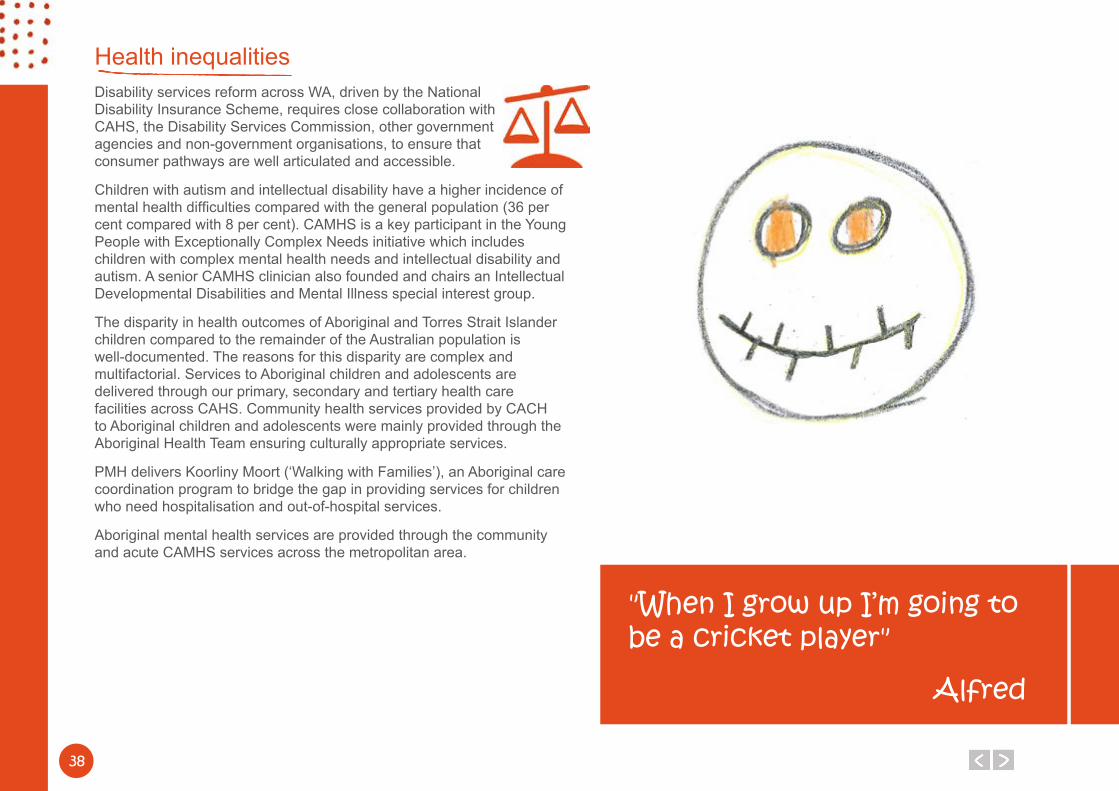
38
Health inequalitiesDisability services reform across WA, driven by the National Disability Insurance Scheme, requires close collaboration with CAHS, the Disability Services Commission, other government agencies and non-government organisations, to ensure that consumer pathways are well articulated and accessible.
Children with autism and intellectual disability have a higher incidence of mental health difficulties compared with the general population (36 per cent compared with 8 per cent). CAMHS is a key participant in the Young People with Exceptionally Complex Needs initiative which includes children with complex mental health needs and intellectual disability and autism. A senior CAMHS clinician also founded and chairs an Intellectual Developmental Disabilities and Mental Illness special interest group.
The disparity in health outcomes of Aboriginal and Torres Strait Islander children compared to the remainder of the Australian population is well-documented. The reasons for this disparity are complex and multifactorial. Services to Aboriginal children and adolescents are delivered through our primary, secondary and tertiary health care facilities across CAHS. Community health services provided by CACH to Aboriginal children and adolescents were mainly provided through the Aboriginal Health Team ensuring culturally appropriate services.
PMH delivers Koorliny Moort (‘Walking with Families’), an Aboriginal care coordination program to bridge the gap in providing services for children who need hospitalisation and out-of-hospital services.
Aboriginal mental health services are provided through the community and acute CAMHS services across the metropolitan area.
"When I grow up I’m going to be a cricket player"
Alfred

3939
Disclosures and Legal Compliance
Disclosures andLegal Compliance
40
4141
42
4343
44
4545
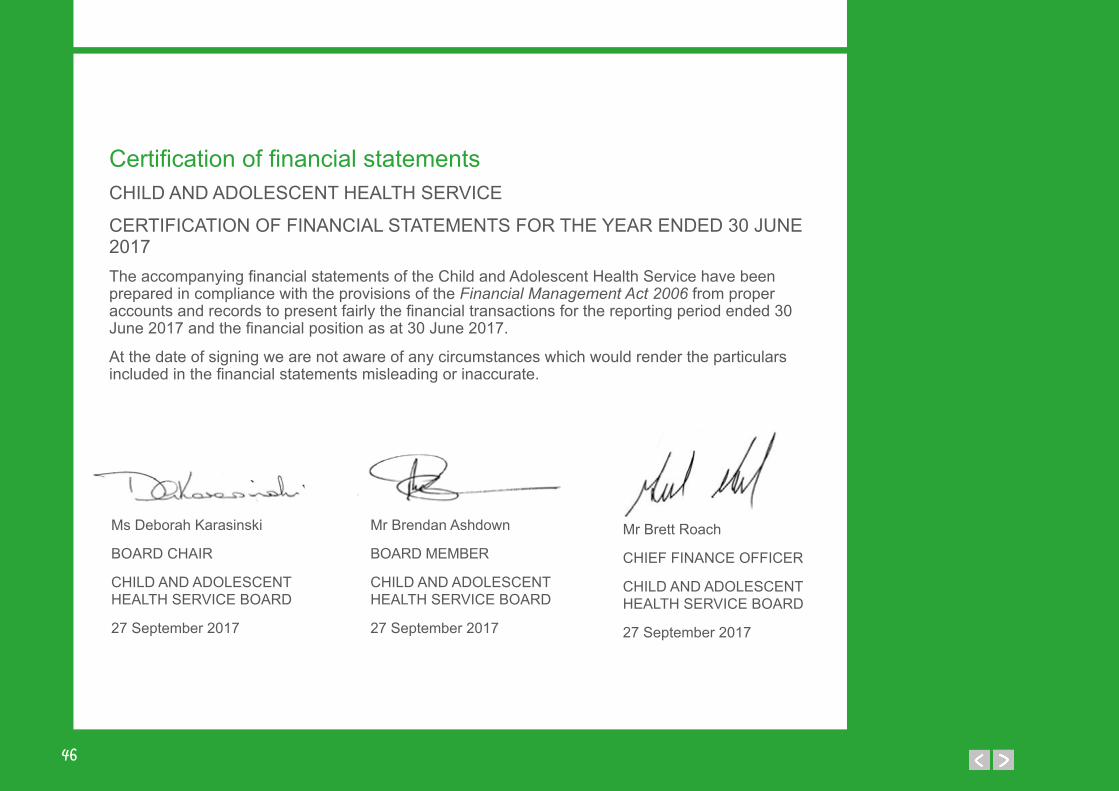
46
Certification of financial statementsCHILD AND ADOLESCENT HEALTH SERVICE
CERTIFICATION OF FINANCIAL STATEMENTS FOR THE YEAR ENDED 30 JUNE 2017The accompanying financial statements of the Child and Adolescent Health Service have been prepared in compliance with the provisions of the Financial Management Act 2006 from proper accounts and records to present fairly the financial transactions for the reporting period ended 30 June 2017 and the financial position as at 30 June 2017.
At the date of signing we are not aware of any circumstances which would render the particulars included in the financial statements misleading or inaccurate.
Mr Brendan Ashdown
BOARD MEMBER
CHILD AND ADOLESCENT HEALTH SERVICE BOARD
27 September 2017
Ms Deborah Karasinski
BOARD CHAIR
CHILD AND ADOLESCENT HEALTH SERVICE BOARD
27 September 2017
Mr Brett Roach
CHIEF FINANCE OFFICER
CHILD AND ADOLESCENT HEALTH SERVICE BOARD
27 September 2017
46
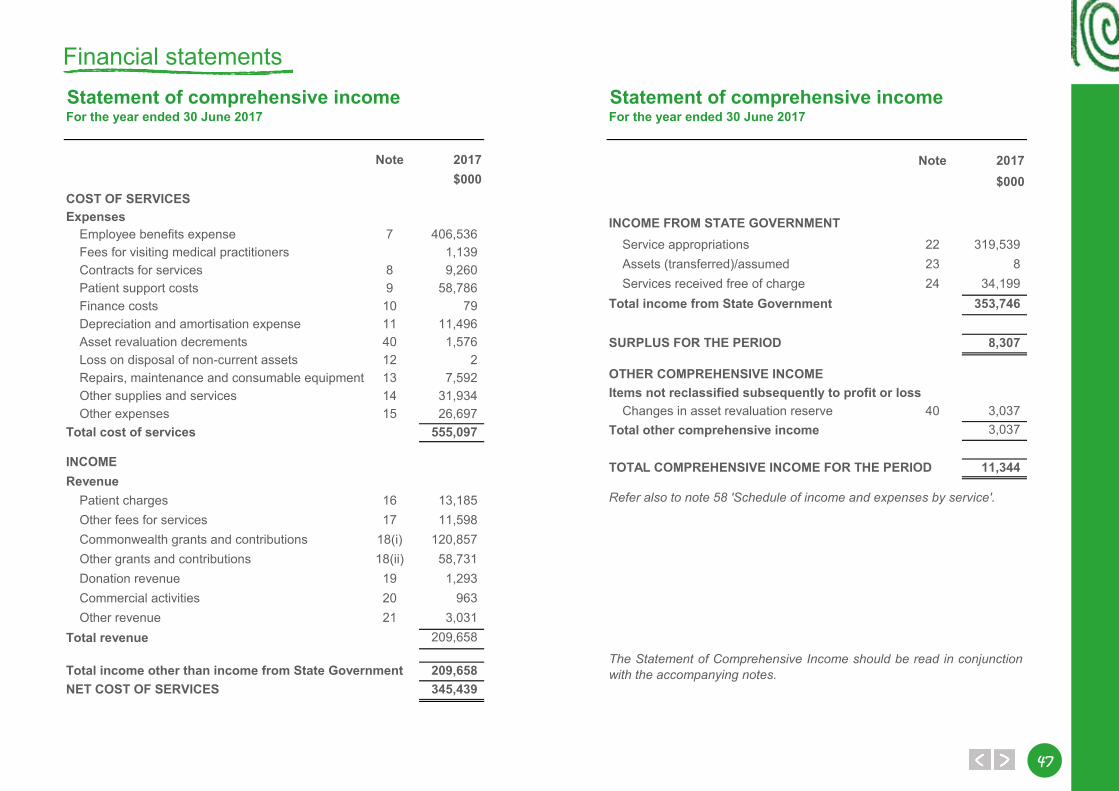
4747
Statement of comprehensive incomeFor the year ended 30 June 2017
Note 2017$000
COST OF SERVICESExpenses
Employee benefits expense 7 406,536Fees for visiting medical practitioners 1,139Contracts for services 8 9,260Patient support costs 9 58,786Finance costs 10 79Depreciation and amortisation expense 11 11,496Asset revaluation decrements 40 1,576Loss on disposal of non-current assets 12 2Repairs, maintenance and consumable equipment 13 7,592Other supplies and services 14 31,934Other expenses 15 26,697
Total cost of services 555,097
INCOMERevenue
Patient charges 16 13,185Other fees for services 17 11,598Commonwealth grants and contributions 18(i) 120,857Other grants and contributions 18(ii) 58,731Donation revenue 19 1,293Commercial activities 20 963Other revenue 21 3,031
Total revenue 209,658
Total income other than income from State Government 209,658NET COST OF SERVICES 345,439
Statement of comprehensive incomeFor the year ended 30 June 2017
Note 2017$000
INCOME FROM STATE GOVERNMENTService appropriations 22 319,539Assets (transferred)/assumed 23 8Services received free of charge 24 34,199
Total income from State Government 353,746
SURPLUS FOR THE PERIOD 8,307
OTHER COMPREHENSIVE INCOMEItems not reclassified subsequently to profit or loss
Changes in asset revaluation reserve 40 3,037Total other comprehensive income 3,037
TOTAL COMPREHENSIVE INCOME FOR THE PERIOD 11,344
Refer also to note 58 'Schedule of income and expenses by service'.
The Statement of Comprehensive Income should be read in conjunctionwith the accompanying notes.
Financial statements
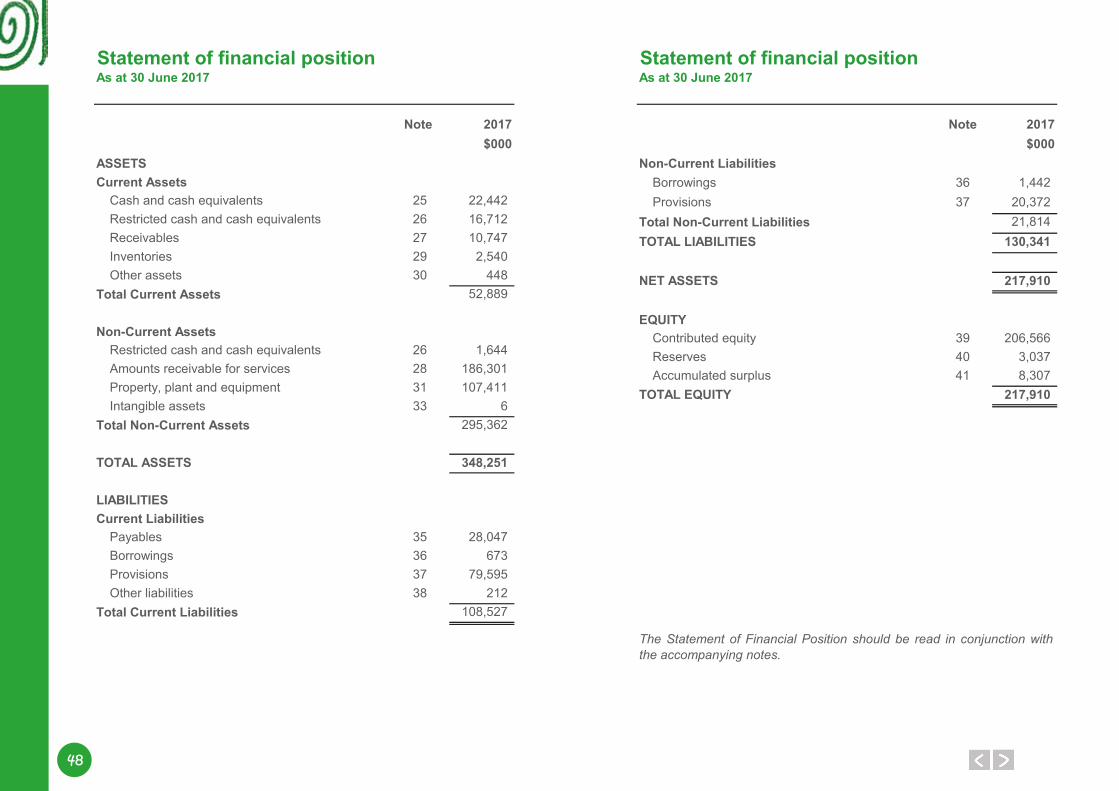
48
Statement of financial positionAs at 30 June 2017
Note 2017$000
ASSETSCurrent Assets
Cash and cash equivalents 25 22,442Restricted cash and cash equivalents 26 16,712Receivables 27 10,747Inventories 29 2,540Other assets 30 448
Total Current Assets 52,889
Non-Current AssetsRestricted cash and cash equivalents 26 1,644Amounts receivable for services 28 186,301Property, plant and equipment 31 107,411Intangible assets 33 6
Total Non-Current Assets 295,362
TOTAL ASSETS 348,251
LIABILITIESCurrent Liabilities
Payables 35 28,047Borrowings 36 673Provisions 37 79,595Other liabilities 38 212
Total Current Liabilities 108,527
Statement of financial positionAs at 30 June 2017
Note 2017$000
Non-Current LiabilitiesBorrowings 36 1,442Provisions 37 20,372
Total Non-Current Liabilities 21,814TOTAL LIABILITIES 130,341
NET ASSETS 217,910
EQUITYContributed equity 39 206,566Reserves 40 3,037Accumulated surplus 41 8,307
TOTAL EQUITY 217,910
The Statement of Financial Position should be read in conjunction withthe accompanying notes.
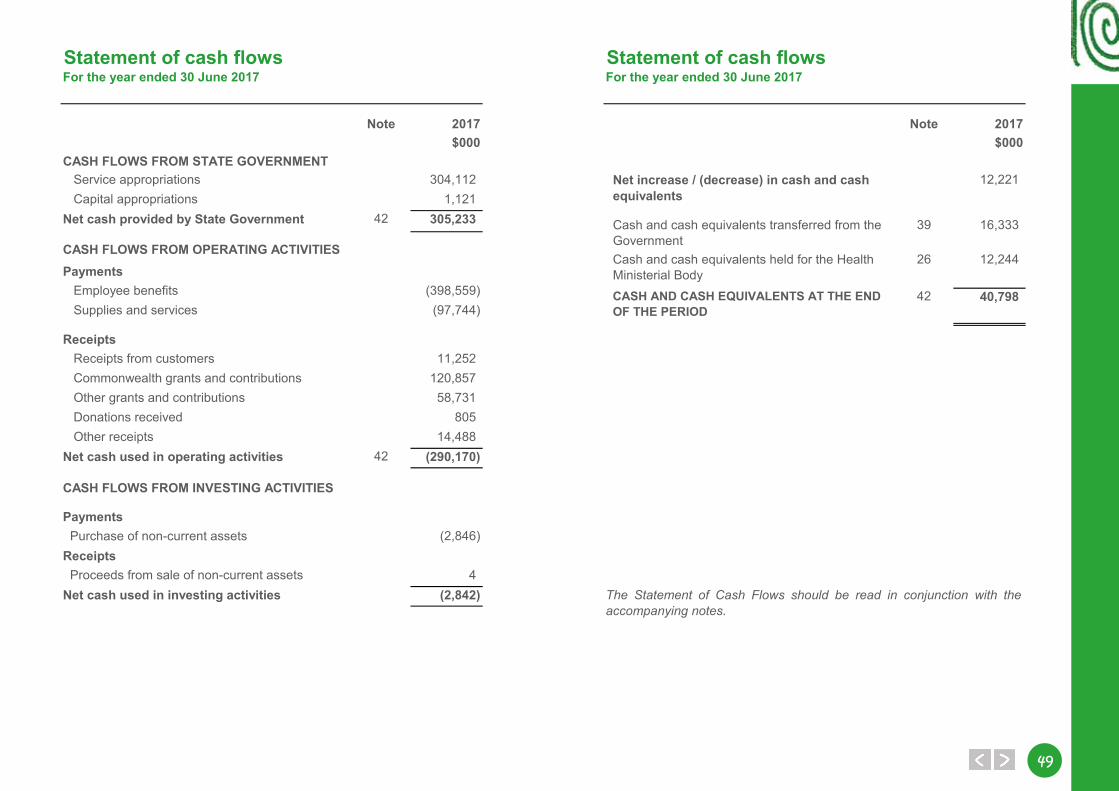
4949
Statement of cash flowsFor the year ended 30 June 2017
Note 2017$000
CASH FLOWS FROM STATE GOVERNMENT Service appropriations 304,112 Capital appropriations 1,121
Net cash provided by State Government 42 305,233
CASH FLOWS FROM OPERATING ACTIVITIESPayments
Employee benefits (398,559) Supplies and services (97,744)
Receipts Receipts from customers 11,252 Commonwealth grants and contributions 120,857 Other grants and contributions 58,731 Donations received 805 Other receipts 14,488
Net cash used in operating activities 42 (290,170)
CASH FLOWS FROM INVESTING ACTIVITIES
PaymentsPurchase of non-current assets (2,846)
ReceiptsProceeds from sale of non-current assets 4
Net cash used in investing activities (2,842)
Statement of cash flowsFor the year ended 30 June 2017
Note 2017$000
Net increase / (decrease) in cash and cash equivalents
12,221
Cash and cash equivalents transferred from the Government
39 16,333
Cash and cash equivalents held for the Health Ministerial Body
26 12,244
CASH AND CASH EQUIVALENTS AT THE END OF THE PERIOD
42 40,798
The Statement of Cash Flows should be read in conjunction with theaccompanying notes.
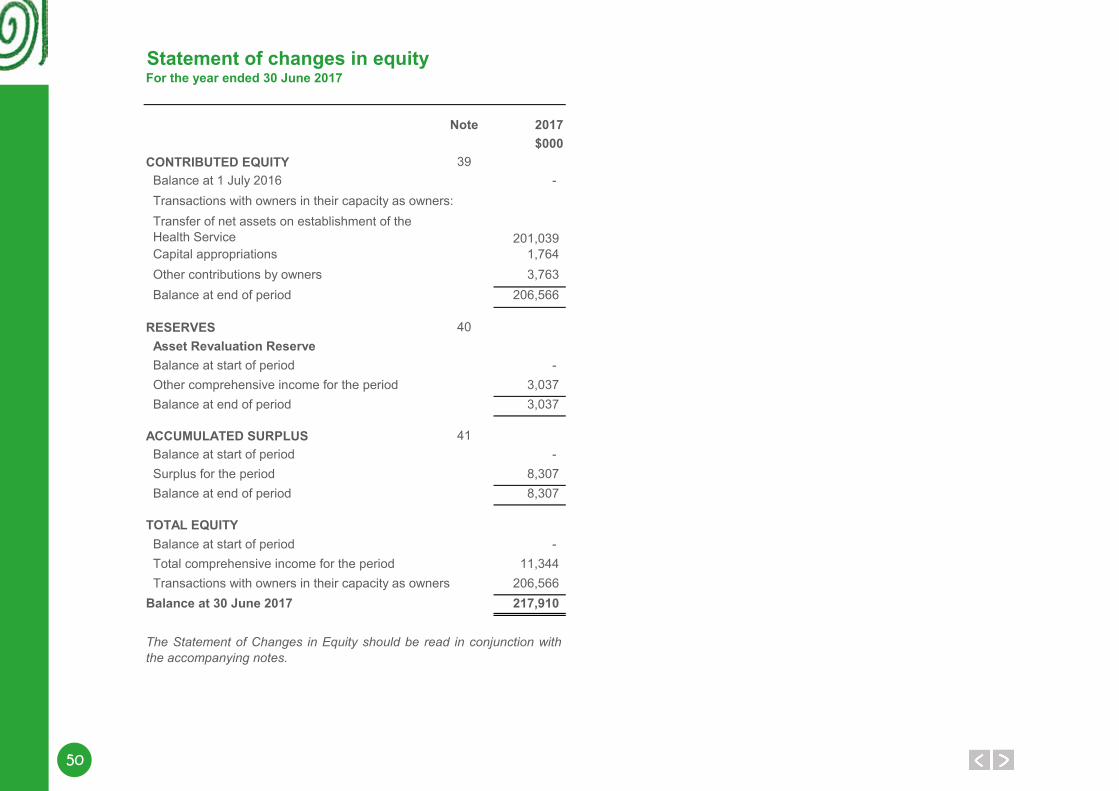
50
Statement of changes in equityFor the year ended 30 June 2017
Note 2017$000
CONTRIBUTED EQUITY 39Balance at 1 July 2016 - Transactions with owners in their capacity as owners:
201,039Capital appropriations 1,764Other contributions by owners 3,763Balance at end of period 206,566
RESERVES 40Asset Revaluation ReserveBalance at start of period - Other comprehensive income for the period 3,037Balance at end of period 3,037
ACCUMULATED SURPLUS 41Balance at start of period - Surplus for the period 8,307Balance at end of period 8,307
TOTAL EQUITYBalance at start of period - Total comprehensive income for the period 11,344Transactions with owners in their capacity as owners 206,566
Balance at 30 June 2017 217,910
The Statement of Changes in Equity should be read in conjunction withthe accompanying notes.
Transfer of net assets on establishment of the Health Service
5151
Notes to the financial statementsFor the year ended 30 June 2017
Note 1. Australian Accounting Standards
Note 2. Summary of significant accounting policies
(a)
(b)
General
The Child and Adolescent Health Service's (The Health Service) financial statements for the year ended 30 June 2017 have been prepared in accordance withAustralian Accounting Standards. The term ‘Australian Accounting Standards’ includes Standards and Interpretations issued by the Australian Accounting StandardsBoard (AASB).
The Health Service has adopted any applicable new and revised Australian Accounting Standards from their operative dates.
Early adoption of standardsThe Health Service cannot early adopt an Australian Accounting Standard unless specifically permitted by Treasurer's Instruction 1101 'Application of AustralianAccounting Standards and Other Pronouncements' . There has been no early adoption of any other Australian Accounting Standards that have been issued oramended (but not operative) by the Health Service for the annual reporting period ended 30 June 2017.
Notwithstanding the Health Service’s deficiency of working capital (total current assets being less than total current liabilities), the financial statements have beenprepared on the going concern basis. This basis has been adopted because, with continuing funding from the State Government, the Health Service is able topay its liabilities as and when they fall due.
The accounting policies adopted in the preparation of the financial statements have been consistently applied throughout all periods presented unless otherwisestated.
The financial statements are presented in Australian dollars and all values are rounded to the nearest thousand dollars ($'000).
General statement
The Health Service is a not-for-profit reporting entity that prepares general purpose financial statements in accordance with Australian Accounting Standards, theFramework, Statements of Accounting Concepts and other authoritative pronouncements of the Australian Accounting Standards Board as applied by theTreasurer's instructions. Several of these are modified by the Treasurer's instructions to vary application, disclosure, format and wording.
The Financial Management Act 2006 and the Treasurer’s instructions impose legislative provisions that govern the preparation of financial statements and takeprecedence over the Australian Accounting Standards, the Framework, Statements of Accounting Concepts and other authoritative pronouncements of the AASB.
Where modification is required and has had a material or significant financial effect upon the reported results, details of that modification and the resultingfinancial effect are disclosed in the notes to the financial statements.
Basis of preparation
The financial statements have been prepared on the accrual basis of accounting using the historical cost convention, except for land and buildings which havebeen measured at fair value.
52
Notes to the financial statementsFor the year ended 30 June 2017
(b)
(c)
(d)
(e)
Basis of preparation (continued)
Provision of servicesRevenue is recognised by reference to the stage of completion of the transaction.Service appropriations
Note 3 'Judgements made by management in applying accounting policies' discloses judgements that have been made in the process of applying the HealthService's accounting policies resulting in the most significant effect on amounts recognised in the financial statements.
Note 4 'Key sources of estimation uncertainty' discloses key assumptions made concerning the future, and other key sources of estimation uncertainty at the endof the reporting period, that have a significant risk of causing a material adjustment to the carrying amounts of assets and liabilities within the next financial year.
Reporting entity
Service appropriations are recognised as revenues at fair value in the period in which the Health Service gains control of the appropriated funds. The HealthService gains control of appropriated funds at the time those funds are deposited to the bank account or credited to the 'Amounts receivable for services' (holdingaccount) held at Treasury. See also note 22 ‘Service appropriations’ for further information.
Revenue is recognised from the sale of goods and disposal of other assets when the significant risks and rewards of ownership are transferred to the purchaserand can be measured reliably.
The reporting entity comprises the Child and Adolescent Health Service. The Health Service was established on 1 July 2016 under the Health Services Act 2016 .
The Health Ministerial Body, established under section 10 of the Health Services Act 2016, has the control of the Perth Children's Hospital (PCH) project duringthe 2016-17 financial year. Hence, assets, liabilities, income and expenses for the PCH project are recognised in the Department of Health's financial statements.
Contributed equityAASB Interpretation 1038 ‘Contributions by Owners Made to Wholly-Owned Public Sector Entities ’ requires transfers in the nature of equity contributions, otherthan as a result of a restructure of administrative arrangements, to be designated by the Government (the owner) as contributions by owners (at the time of, orprior to transfer) before such transfers can be recognised as equity contributions. Capital appropriations have been designated as contributions by owners byTreasurer's Instruction 955 ‘Contributions by Owners made to Wholly Owned Public Sector Entities ’ and have been credited directly to Contributed Equity.
The transfer of net assets to/from other agencies, other than as a result of a restructure of administrative arrangements, are designated as contributions byowners where the transfers are non-discretionary and non-reciprocal.
See also note 39 'Contributed equity'.
IncomeRevenue recognition
Revenue is recognised and measured at the fair value of consideration received or receivable as follows:
Sale of goods
5353
Notes to the financial statementsFor the year ended 30 June 2017
(e)
(f)
(g)
Capitalisation/expensing of assets
Initial recognition and measurement
Subsequent measurement
Income (continued)
For items of property, plant and equipment acquired at no cost or for nominal cost, the cost is their fair value at the date of acquisition.
Where market-based evidence is available, the fair value of land and buildings is determined on the basis of current market values determined by reference torecent market transactions.
In the absence of market-based evidence, fair value of land and buildings is determined on the basis of existing use. This normally applies where buildings arespecialised or where land use is restricted. Fair value for existing use buildings is determined by reference to the cost of replacing the remaining future economicbenefits embodied in the asset, i.e. the depreciated replacement cost. Fair value for restricted use land is determined by comparison with market evidence forland with similar approximate utility (high restricted use land) or market value of comparable unrestricted land (low restricted use land).
Subsequent to initial recognition as an asset, the revaluation model is used for the measurement of land and buildings, and historical cost for all other property,plant and equipment. Land and buildings are carried at fair value less accumulated depreciation (buildings) and accumulated impairment losses. All other itemsof property, plant and equipment are stated at historical cost less accumulated depreciation and accumulated impairment losses.
Grants, donations, gifts and other non-reciprocal contributionsRevenue is recognised at fair value when the Health Service obtains control over the assets comprising the contributions, usually when cash is received.
Other non-reciprocal contributions that are not contributions by owners are recognised at their fair value. Contributions of services are only recognised when afair value can be reliably determined and the services would be purchased if not donated.
GainsRealised and unrealised gains are usually recognised on a net basis. These include gains arising on the disposal of non-current assets and some revaluations ofnon-current assets.
Borrowing costsBorrowing costs are expensed in the period in which they are incurred.
Property, plant and equipment
Items of property, plant and equipment costing $5,000 or more are recognised as assets and the cost of utilising assets is expensed (depreciated) over theiruseful lives. Items of property, plant and equipment costing less than $5,000 are immediately expensed direct to the Statement of Comprehensive Income (otherthan where they form part of a group of similar items which are significant in total).
Property, plant and equipment are initially recognised at cost.
54
Notes to the financial statementsFor the year ended 30 June 2017
(g)
Derecognition
Asset revaluation reserve
Depreciation
Buildings 50 yearsSite infrastructure 50 yearsLeasehold improvements Term of the leaseComputer equipment 4 yearsFurniture and fittings 3 to 20 yearsMotor vehicles 3 to 10 yearsMedical equipment 3 to 20 yearsOther plant and equipment 3 to 10 years
The most significant assumptions and judgements in estimating fair value are made in assessing whether to apply the existing use basis to assets and indetermining estimated economic life. Professional judgement by the valuer is required where the evidence does not provide a clear distinction between markettype assets and existing use assets.
See also note 31 'Property, plant and equipment' and note 32 'Fair value measurement' for further information on revaluation.
Upon disposal or derecognition of an item of property, plant and equipment, any revaluation surplus relating to that asset is retained in the asset revaluationreserve.
The asset revaluation reserve is used to record increments and decrements on the revaluation of non-current assets on a class of assets basis.
All non-current assets having a limited useful life are systematically depreciated over their estimated useful lives in a manner that reflects the consumption of theirfuture economic benefits.
Depreciation is calculated using the straight line method, using rates which are reviewed annually. Estimated useful lives for each class of depreciable asset are:
Land is not depreciated.
Artworks controlled by the Health Service are classified as property, plant and equipment. These are anticipated to have indefinite useful lives. Their servicepotential has not, in any material sense, been consumed during the reporting period and consequently no depreciation has been recognised.
When buildings are revalued, the accumulated depreciation is eliminated against the gross carrying amount of the asset and the net amount restated to therevalued amount.
Land and buildings are independently valued annually by the Western Australian Land Information Authority (Valuation Services) and recognised annually toensure that the carrying amount does not differ materially from the asset’s fair value at the end of the reporting period.
Property, plant and equipment (continued)
5555
Notes to the financial statementsFor the year ended 30 June 2017
(h)
Capitalisation/expensing of assets
5 - 15 years
Computer software
Amortisation for intangible assets with finite useful lives is calculated for the period of the expected benefit (estimated useful life which is reviewed annually) onthe straight line basis. All intangible assets controlled by the Health Service have a finite useful life and zero residual value.
Estimated useful lives for each class of intangible assets are:
Computer software
Software that is an integral part of the related hardware is recognised as property, plant and equipment. Software that is not an integral part of the relatedhardware is recognised as an intangible asset. Software costing less than $5,000 is expensed in the year of acquisition.
Intangible assets are initially recognised at cost. For assets acquired at no cost or for nominal cost, the cost is their fair value at the date of acquisition.
The cost model is applied for subsequent measurement requiring the asset to be carried at cost less any accumulated amortisation and accumulated impairmentlosses.
Intangible assets
Acquisitions of intangible assets costing $5,000 or more and internally generated intangible assets costing $5,000 or more are capitalised. The cost of utilising theassets is expensed (amortised) over their useful lives. Costs incurred below these thresholds are immediately expensed directly to the Statement ofComprehensive Income.
56
Notes to the financial statementsFor the year ended 30 June 2017
(i)
The risk of impairment is generally limited to circumstances where an asset’s depreciation is materially understated, where the replacement cost is falling orwhere there is a significant change in useful life. Each relevant class of assets is reviewed annually to verify that the accumulated depreciation/amortisationreflects the level of consumption or expiration of the asset’s future economic benefits and to evaluate any impairment risk from falling replacement costs.
Intangible assets not yet available for use are tested for impairment at the end of each reporting period irrespective of whether there is any indication ofimpairment.
The recoverable amount of assets identified as surplus assets is the higher of fair value less costs to sell and the present value of future cash flows expected tobe derived from the asset. Surplus assets carried at fair value have no risk of material impairment where fair value is determined by reference to market-basedevidence. Where fair value is determined by reference to depreciated replacement cost, surplus assets are at risk of impairment and the recoverable amount ismeasured. Surplus assets at cost are tested for indications of impairment at the end of each reporting period.
See also note 34 ‘Impairment of assets’ for the outcome of impairment reviews and testing.
Refer also to note 2(o) 'Receivables' and note 27 'Receivables' for impairment of receivables.
Impairment of assetsProperty, plant and equipment and intangible assets are tested for any indication of impairment at the end of each reporting period. Where there is an indicationof impairment, the recoverable amount is estimated. Where the recoverable amount is less than the carrying amount, the asset is considered impaired and iswritten down to the recoverable amount. Where an asset measured at cost is written down to recoverable amount, an impairment loss is recognised in Statementof Comprehensive Income. Where a previously revalued asset is written down to recoverable amount, the loss is recognised as a revaluation decrement in othercomprehensive income. As the Health Service is a not-for-profit entity, unless a specialised asset has been identified as a surplus asset, the recoverable amountis the higher of an asset’s fair value less costs to sell and depreciated replacement cost.
5757
Notes to the financial statementsFor the year ended 30 June 2017
(j)
(k)
(l)
The accrued salaries suspense account (refer note 26 'Restricted cash and cash equivalents') consists of amounts paid annually into a suspense account over aperiod of 10 financial years to largely meet the additional cash outflow in each eleventh year when 27 pay days occur instead of the normal 26. No interest isreceived on this account.
Initial recognition and measurement of financial instruments is at fair value which normally equates to the transaction cost or the face value. Subsequentmeasurement is at amortised cost using the effective interest method.
The fair value of short-term receivables and payables is the transaction cost or the face value because there is no interest rate applicable and subsequentmeasurement is not required as the effect of discounting is not material.
Cash and cash equivalents
For the purpose of the Statement of Cash Flows, cash and cash equivalent (and restricted cash and cash equivalent) assets comprise cash on hand, cash at bankand short-term deposits with original maturities of three months or less that are readily convertible to a known amount of cash and which are subject toinsignificant risk of changes in value.
Accrued salaries
Accrued salaries (see note 35 'Payables') represent the amount due to employees but unpaid at the end of the financial year, as the pay date for the last payperiod for that financial year does not coincide with the end of the financial year. Accrued salaries are settled within a fortnight of the financial year end. TheHealth Service considers the carrying amount of accrued salaries to be equivalent to its fair value.
- Restricted cash and cash equivalents - Receivables - Amounts receivable for services* Financial liabilities: - Payables - Department of Treasury loans
In addition to cash, the Health Service has two categories of financial instrument: * Loans and receivables; and * Financial liabilities measured at amortised cost.
Financial instruments have been disaggregated into the following classes:
* Financial assets: - Cash and cash equivalents
Financial instruments
58
Notes to the financial statementsFor the year ended 30 June 2017
(m)
(n)
(o)
(p)
GST receivables on accrued expenses are recognised by the Health Service. Upon the receipt of tax invoices, GST receivables for the GST group are recorded in the accounts of the Department of Health.
Payables
Payables are recognised when the Health Service becomes obliged to make future payments as a result of a purchase of assets or services. The carrying amountis equivalent to fair value, as settlement is generally within 30 days.
See also note 2(j) 'Financial instruments' and note 35 'Payables'.
Inventories not held for resale are measured at cost unless they are no longer required, in which case they are measured at net realisable value (See note 29'Inventories').
ReceivablesReceivables are recognised at original invoice amount less an allowance for any uncollectible amounts (i.e. impairment). The collectability of receivables isreviewed on an ongoing basis and any receivables identified as uncollectible are written-off against the allowance account. The allowance for uncollectibleamounts (doubtful debts) is raised when there is objective evidence that the Health Service will not be able to collect the debts. The carrying amount is equivalentto fair value as it is due for settlement within 30 days.
See also note 2(j) ‘Financial Instruments’ and note 27 ‘Receivables’.
Accounting procedure for Goods and Services TaxRights to collect amounts receivable from the Australian Taxation Office (ATO) and responsibilities to make payments for GST have been assigned to theDepartment of Health. This accounting procedure was a result of application of the grouping provisions of “A New Tax System (Goods and Services Tax) Act1999 " whereby the Department of Health became the Nominated Group Representative (NGR) for the GST Group as from 1 July 2012. The entities in the GSTgroup include the Department of Health, Mental Health Commission, Child and Adolescent Health Service, East Metropolitan Health Service, North MetropolitanHealth Service, South Metropolitan Health Service, WA Country Health Service, Health Support Services, QE II Medical Centre Trust, and Health and DisabilityServices Complaints Office.
Amounts receivable for services (holding account)The Health Service receives service appropriation funding from the State Government partly in cash and partly as an asset (holding account receivable). Theholding account receivable balance is accessible on the emergence of the cash funding requirement to cover leave entitlements and asset replacement.
See also note 22 'Service appropriations' and note 28 'Amounts receivable for services'.
InventoriesInventories are measured at the lower of cost and net realisable value. Costs are assigned on a weighted average cost basis.
5959
Notes to the financial statementsFor the year ended 30 June 2017
(q)
(r)
Annual Leave and Time Off in Lieu Leave
Long service leave
When assessing expected future payments, consideration is given to expected future wage and salary levels including non-salary components such as employersuperannuation contributions, as well as the experience of employee departures and periods of service. The expected future payments are discounted usingmarket yields at the end of the reporting period on national government bonds with terms to maturity that match, as closely as possible, the estimated future cashoutflows.
Annual leave and time off in lieu leave are not expected to be settled wholly within 12 months after the end of the reporting period and are therefore considered tobe 'other long-term employee benefits'. The annual leave liability and time off in lieu leave liability are recognised and measured at the present value of amountsexpected to be paid when the liabilities are settled using the remuneration rate expected to apply at the time of settlement.
When assessing expected future payments consideration is given to expected future wage and salary levels including non-salary components such as employersuperannuation contributions, as well as the experience of employee departures and periods of service. The expected future payments are discounted usingmarket yields at the end of the reporting period on national government bonds with terms to maturity that match, as closely as possible, the estimated future cashoutflows.
The provisions for annual leave and time off in lieu leave are classified as a current liability as the Health Service does not have an unconditional right to defersettlement of the liability for at least 12 months after the end of the reporting period.
Long service leave is not expected to be settled wholly within 12 months after the end of the reporting period. The long service leave liability is recognised andmeasured at the present value of amounts expected to be paid when the liabilities are settled using the remuneration rate expected to apply at the time ofsettlement.
See also note 2(j) 'Financial instruments' and note 36 'Borrowings'.
Provisions
Provisions are liabilities of uncertain timing or amount and are recognised where there is a present legal or constructive obligation as a result of a past event andwhen the outflow of resources embodying economic benefits is probable and a reliable estimate can be made of the amount of the obligation. Provisions arereviewed at the end of each reporting period.
See also note 37 'Provisions'.
Provisions - employee benefits
All annual leave, time off in lieu leave and long service leave provisions are in respect of employees' services up to the end of the reporting period.
Borrowings
All loans payable are initially recognised at fair value, being the net proceeds received. Subsequent measurement is at amortised cost using the effective interestrate method.
60
Notes to the financial statementsFor the year ended 30 June 2017
(r)
Sick Leave
Deferred Salary Scheme
Superannuation The Government Employees Superannuation Board (GESB) and other fund providers administer public sector superannuation arrangements in Western Australiain accordance with legislative requirements. Eligibility criteria for membership in particular schemes for public sector employees vary according to commencementand implementation dates.
Eligible employees contribute to the Pension Scheme, a defined benefit pension scheme closed to new members since 1987, or the Gold State SuperannuationScheme (GSS), a defined benefit lump sum scheme closed to new members since 1995.
Employees commencing employment prior to 16 April 2007 who were not members of either the Pension Scheme or the GSS became non-contributory membersof the West State Superannuation Scheme (WSS). Employees commencing employment on or after 16 April 2007 became members of the GESB SuperScheme (GESBS). From 30 March 2012, existing members of the WSS or GESBS and new employees have been able to choose their preferred superannuationfund provider. The Health Service makes contributions to GESB or other fund providers on behalf of employees in compliance with the Commonwealth Government's Superannuation Guarantee (Administration) Act 1992. Contributions to these accumulation schemes extinguish the Health Service's liability forsuperannuation charges in respect of employees who are not members of the Pension Scheme or GSS.
The GSS is a defined benefit scheme for the purposes of employees and whole-of-government reporting. However, it is a defined contribution plan for the HealthService's purposes, because the concurrent contributions (defined contributions) made by the Health Service to GESB extinguishes the Health Service'sobligations to the related superannuation liability.
The Health Service has no liabilities under the Pension Scheme or the GSS. The liabilities for the unfunded Pension Scheme and the unfunded GSS transferbenefits attributable to members who transferred from the Pension Scheme, are assumed by the Treasurer. All other GSS obligations are funded by concurrentcontributions made by the Health Service to the GESB.
Liabilities for sick leave are recognised when it is probable that sick leave paid in the future will be greater than the entitlement that will accrue in the future.
Past history indicates that on average, sick leave taken each reporting period is less than the entitlement accrued. This is expected to continue in future periods.Accordingly, it is unlikely that existing accumulated entitlements will be used by employees and no liability for unused sick leave entitlements is recognised. Assick leave is non-vesting, an expense is recognised in the Statement of Comprehensive Income for this leave as it is taken.
The provision for the deferred salary scheme relates to the employees who have entered into an agreement to self-fund an additional twelve months leave in thefifth year of the agreement. The provision recognises the value of salary set aside for employees to be used in the fifth year. The liability is measured on thesame basis as annual leave. It is reported as a current provision as employees can leave the scheme at their discretion at any time.
Unconditional long service leave provisions are classified as current liabilities as the Health Service does not have an unconditional right to defer settlement of theliability for at least 12 months after the end of the reporting period. Pre-conditional and conditional long service leave provisions are classified as non-currentliabilities because the Health Service has an unconditional right to defer the settlement of the liability until the employee has completed the requisite years ofservice.
Provisions (continued)
6161
Notes to the financial statementsFor the year ended 30 June 2017
(r)
Employment on-costs
(s)
(t)
(u)
(v)
(w) Trust accounts
Services received free of charge or for nominal cost, that the Health Service would otherwise purchase if not donated, are recognised as income at the fair valueof the services where they can be reliably measured. A corresponding expense is recognised for services received.
Services received from other State Government agencies are separately disclosed under Income from State Government in the Statement of ComprehensiveIncome.
Assets transferred between government agencies
Discretionary transfers of net assets (assets and liabilities) between State Government agencies free of charge, are measured at the fair value of those net assetsthat the Health Service would otherwise pay for, and are reported under Income from State Government. Transfers of assets and liabilities in relation to arestructure of administrative arrangements are recognised as distribution to owners by the transferor and contribution by owners by the transferee under AASB1004 'Contributions ' in respect of the net assets transferred.
Comparative figuresThe Health Service commenced operations as a new statutory authority on the 1st July 2016. There are no comparative figures for the first year of operations.
Trust Accounts are used by the Health Service to account for funds that they may be holding on behalf of another party, such as patients' cash. The HealthService does not have control of the use of these funds, and cannot deploy them to meet its objectives. Trust Accounts do not form part of the resourcesavailable to the Health Service, and are not reported as assets in the financial statements.
Details of Trust Accounts are reported as a note to the financial statements (refer to note 53).
Employment on-costs (workers’ compensation insurance) are not employee benefits and are recognised separately as liabilities and expenses when theemployment to which they relate has occurred. Employment on-costs are included as part of ‘Other expenses’ and are not included as part of the HealthService’s ‘Employee benefits expense’. Any related liability is included in ‘Employment on-costs provision’. See also note 15 ‘Other expenses’ and note 37 ‘Provisions’.
Superannuation expense
Superannuation expense in the Statement of Comprehensive Income comprises employer contributions paid to the GSS (concurrent contributions), WSS,GESBS, and other superannuation funds.
Services received free of charge or for nominal cost
The GESB makes all benefit payments in respect of the Pension Scheme and GSS transfer benefits, and recoups from the Treasurer for the employer's share.See also note 2(t) 'Superannuation expense’.
Provisions (continued)
62
Notes to the financial statementsFor the year ended 30 June 2017
Note 3. Judgements made by management in applying accounting policies
Note 4. Key sources of estimation uncertainty
Other sources of estimation uncertainty include:- Estimating useful lives of depreciable assets (see note 2(g) ‘Property, plant and equipment’ and note 2(h) ‘Intangible assets’).- Estimating remaining economic life in determining fair values of the existing use assets (see note 2(g) ‘Property, plant and equipment’).
The preparation of financial statements requires management to make judgements about the application of accounting policies that have a significant effect on theamounts recognised in the financial statements. The Health Service evaluates these judgements regularly.
The judgements that have been made in the process of applying accounting policies that have the most significant effect on the amounts recognised in the financialstatements include:
Buildings
A number of buildings that are located on the land of local government agencies have been recognised in the financial statements. The Health Service believes that,based on past experience, its occupancy in these buildings will continue to the end of their useful lives.
Operating lease commitments
The Health Service has entered into a number of leases for buildings. Some of these leases relate to buildings of a temporary nature and it has been determined thatthe lessor retains substantially all the risk and rewards incidental to ownership. Accordingly, these leases have been classified as operating leases.
Key estimates and assumptions concerning the future are based on historical experience and various other factors that have a significant risk of causing a materialadjustment to the carrying amount of assets and liabilities within the next reporting period.
In order to estimate fair value on the basis of existing use, the depreciated replacement costs are determined on the assumption that the buildings will be used for thesame functions in the future. A major change in utilisation of the buildings may result in material adjustment to the carrying amounts.
In estimating the non-current long service leave liabilities, employees are assumed to leave the Health Service each year on account of resignation or retirement at7.5%. This assumption was based on an analysis of the historical turnover rates exhibited by employees in the WA health services. Employees with leave benefits towhich they are fully entitled are assumed to take all available leave uniformly over the following five years or to age 65 if earlier.
Other estimations and assumptions used in calculating the Health Service's long service leave provision include expected future salary rates, discount rates, employeeretention rates and expected future payments. Changes in these estimations and assumptions may impact on the carrying amount of the long service leave provision.
Employee benefits provision
Buildings
6363
Notes to the financial statementsFor the year ended 30 June 2017
Note 5. Disclosure of changes in accounting policy and estimates
AASB 1057
AASB 2014-4
AASB 2015-1
AASB 2015‑2
AASB 2015-6
Initial application of an Australian Accounting Standard
The Health Service has applied the following Australian Accounting Standards effective for annual reporting periods beginning on or after 1 July 2016 that impacted onthe Health Service.
The adoption of this Standard has no financial impact for the Health Service as depreciation and amortisation is not determined by reference torevenue generation, but by reference to consumption of future economic benefits.
Amendments to Australian Accounting Standards - Annual Improvements to Australian Accounting Standards 2012-2014 Cycle (AASB 1, 2, 3, 5, 7, 11,110, 119, 121, 133, 134, 137 & 140)
These amendments arise from the issuance of International Financial Reporting Standard Annual Improvements to IFRSs 2012-2014 Cycle inSeptember 2014, and editorial corrections. The Health Service has determined that the application of the Standard has no financial impact.
Amendments to Australian Accounting Standards ‑ Disclosure Initiative: Amendments to AASB 101 [AASB 7, 101, 134 & 1049]
This Standard amends AASB 101 to provide clarification regarding the disclosure requirements in AASB 101. Specifically, the Standard proposesnarrow-focus amendments to address some of the concerns expressed about existing presentation and disclosure requirements and to ensure entitiesare able to use judgement when applying a Standard in determining what information to disclose in their financial statements. There is no financialimpact.
Amendments to Australian Accounting Standards - Extending Related Party Disclosures to Not-for-Profit Public Sector Entities (AASB 10, 124 & 1049)
Application of Australian Accounting StandardsThis Standard lists the application paragraphs for each other Standard (and Interpretation), grouped where they are the same. There is no financialimpact.
Amendments to Australian Accounting Standards – Clarification of Acceptable Methods of Depreciation and Amortisation [AASB 116 & 138]
The amendments extend the scope of AASB 124 to include application by not-for-profit public sector entities. Implementation guidance is included toassist application of the Standard by not-for-profit public sector entities. There is no financial impact.
64
Notes to the financial statementsFor the year ended 30 June 2017
Note 5. Disclosure of changes in accounting policy and estimates (continued)
Operative forreporting periodsbeginning on/after
AASB 9 1 Jan 2018
AASB 16 1 Jan 2019
AASB 1058 1 Jan 2019
Future impact of Australian Accounting Standards not yet operative
The Health Service cannot early adopt an Australian Accounting Standard unless specifically permitted by TI 1101 Application of Australian Accounting Standards andOther Pronouncements or by an exemption from TI 1101. By virtue of a limited exemption, the Health Service has early adopted AASB 2015-7 Amendments toAustralian Accounting Standards - Fair Value Disclosures of Non-for-Profit Public Sector Entities . Where applicable, the Health Service plans to apply the followingAustralian Accounting Standards from their application date.
Whilst the impact of AASB 16 has not yet been quantified, the Health Service currently has operating leasecommitments for $6.33 million. The Health Service anticipates most of this amount will be brought onto thestatement of financial position, excepting amounts pertinent to short-term or low-value leases. Interest anddepreciation expenses will increase and operating lease expenses will decrease.
Income of Not-for-Profit Entities
This Standard clarifies and simplifies the income recognition requirements that apply to not for profit (NFP)entities, more closely reflecting the economic reality of NFP entity transactions that are not contracts withcustomers. Timing of income recognition is dependent on whether such a transaction gives rise to a liability, or aperformance obligation (a promise to transfer a good or service), or, an obligation to acquire an asset. TheHealth Service has not yet determined the application or the potential impact of the Standard.
Leases
This Standard introduces a single lessee accounting model and requires a lessee to recognise assets andliabilities for all leases with a term of more than 12 months, unless the underlying asset is of low value.
Financial Instruments
This Standard supersedes AASB 139 Financial Instruments: Recognition and Measurement , introducing anumber of changes to accounting treatments.
The mandatory application date of this Standard is currently 1 January 2018 after being amended by AASB 2012-6, AASB 2013-9 and AASB 2014-1 Amendments to Australian Accounting Standards . The Health Service hasnot yet determined the application or the potential impact of the Standard.
6565
Notes to the financial statementsFor the year ended 30 June 2017
Note 5. Disclosure of changes in accounting policy and estimates (continued)
Operative forreporting periodsbeginning on/after
AASB 2010-7 1 Jan 2018
AASB 2014-1 1 Jan 2018
AASB 2014-5 1 Jan 2018
AASB 2014-7 1 Jan 2018
AASB 2015-8 1 Jan 2019
Future impact of Australian Accounting Standards not yet operative
Amendments to Australian Accounting Standards – Effective Date of AASB 15
This Standard amends the mandatory effective date (application date) of AASB 15 Revenue from Contracts withCustomers ' so that AASB 15 is required to be applied for annual reporting periods beginning on or after 1January 2018 instead of 1 January 2017. For Not For Profit entities, the mandatory effective date hassubsequently been amended to 1 January 2019 by AASB 2016 7. The Health Service has not yet determined theapplication or the potential impact of AASB 15.
Amendments to Australian Accounting Standards
Part E of this standard makes amendments to AASB 9 and consequential amendments to other Standards. It hasnot yet been assessed by the Health Service to determine the application or potential impact of the Standard.
Amendments to Australian Accounting Standards arising from AASB 15
This Standard gives effect to the consequential amendments to Australian Accounting Standards (includingInterpretations) arising from the issuance of AASB 15. The Health Service has not yet determined the applicationor the potential impact of the Standard.
Amendments to Australian Accounting Standards arising from AASB 9 (December 2014)
Amendments to Australian Accounting Standards arising from AASB 9 (December 2010) [AASB 1, 3, 4, 5, 7,101, 102, 108, 112, 118, 120, 121, 127, 128, 131, 132, 136, 137, 139, 1023 & 1038 and Int 2, 5, 10, 12, 19 &127]
This Standard makes consequential amendments to other Australian Accounting Standards and Interpretationsas a result of issuing AASB 9 in December 2010. The mandatory application date of this Standard has been amended by AASB 2012-6 and AASB 2014-1 to 1January 2018. The Health Service has not yet determined the application or the potential impact of the Standard.
This Standard gives effect to the consequential amendments to Australian Accounting Standards (includingInterpretations) arising from the issuance of AASB 9 (December 2014). The Health Service has not yetdetermined the application or the potential impact of the Standard.
66
Notes to the financial statementsFor the year ended 30 June 2017
Note 5. Disclosure of changes in accounting policy and estimates (continued)
Operative forreporting periodsbeginning on/after
AASB 2016-2 1 Jan 2017
AASB 2016-3 1 Jan 2018
AASB 2016-4 1 Jan 2017
AASB 2016-7 1 Jan 2017
AASB 2016-8 1 Jan 2019
Amendments to Australian Accounting Standards - Deferral of AASB 15 for Not-for-Profit Entities
Amendments to Australian Accounting Standards – Australian Implementation Guidance for Not-for-Profit Entities
This Standard clarifies identifying performance obligations, principal versus agent considerations, timing ofrecognising revenue from granting a licence, and, provides further transitional provisions to AASB 15. The HealthService has not yet determined the application or the potential impact.
Amendments to Australian Accounting Standards – Disclosure Initiative: Amendments to AASB 107
This Standard amends AASB 107 Statement of Cash Flows (August 2015) to require disclosures that enableusers of financial statements to evaluate changes in liabilities arising from financing activities, including bothchanges arising from cash flows and non-cash changes. There is no financial impact.
Amendments to Australian Accounting Standards – Clarifications to AASB 15
This Standard amends the mandatory effective date (application date) of AASB 15 and defers the consequentialamendments that were originally set out in AASB 2014-5 Amendments to Australian Accounting Standardsarising from AASB 15 for not for profit entities to annual reporting periods beginning on or after 1 January 2019,instead of 1 January 2018. There is no financial impact.
This Standard inserts Australian requirements and authoritative implementation guidance for not-for-profit entitiesinto AASB 9 and AASB 15. This guidance assists not-for-profit entities in applying those Standards to particulartransactions and other events. There is no financial impact.
This Standard clarifies that the recoverable amount of primarily non-cash-generating assets of not-for-profitentities, which are typically specialised in nature and held for continuing use of their service capacity, is expectedto be materially the same as fair value determined under AASB 13 Fair Value Measurement . The Health Servicehas not yet determined the application or the potential impact.
Future impact of Australian Accounting Standards not yet operative
Amendments to Australian Accounting Standards – Recoverable Amount of Non-Cash-Generating SpecialisedAssets of Not-for-Profit Entities
6767
Notes to the financial statementsFor the year ended 30 June 2017
Note 6. Services of the Health Service
Emergency department services describe the treatment provided to those people with sudden onset of illness or injury of such severity and urgency that they needimmediate medical help which is either not available from their general practitioner, or for which their general practitioner has referred them for treatment. Anemergency department can provide a range of services and may result in admission to hospital or in treatment without admission.
Medical officers, nurses and allied health staff provide non-admitted (out-patient) care services and include clinics for pre- and post-surgical care, allied health care andmedical care.
Contracted mental health services describe inpatient care in an authorised ward and community mental health services provided by the Health Service under anagreement with the Mental Health Commission for specialised admitted and community mental health.
Prevention, promotion and protection services describe programs delivered to increase optimal health and wellbeing, encourage healthy lifestyle, reduce the onset ofdisease and disability, reduce the risk of long-term illness as well as detect, protect and monitor the incidence of disease in the population. These include child healthservices, school health services, child development services, public health programs and Aboriginal health programs.
Prevention, Promotion and Protection
Mental Health
Public Hospital Non-admitted Patients
Emergency Department
The ‘Hospital in the Home’ (HITH) and ‘Mental Health in the Home’ (MITH) programs provide short-term acute care in the patient’s home for those who can be safelycared for without constant monitoring for conditions that traditionally required hospital admission and inpatient treatment. These services involve daily home visits bynurses, with medical governance usually by a hospital-based doctor.
Information about the Health Service's services and the expenses and revenues which are reliably attributable to those services are set out in note 58 'Schedule ofincome and expenses by service'. The key services of the Health Service are:
Public Hospital Admitted PatientPublic hospital admitted patient services describe the care services provided to inpatients in public hospitals (excluding specialised mental health wards). An admissionto hospital can be for a period of one or more days and includes medical and surgical treatment, and oncology services.
Home-Based Hospital Programs
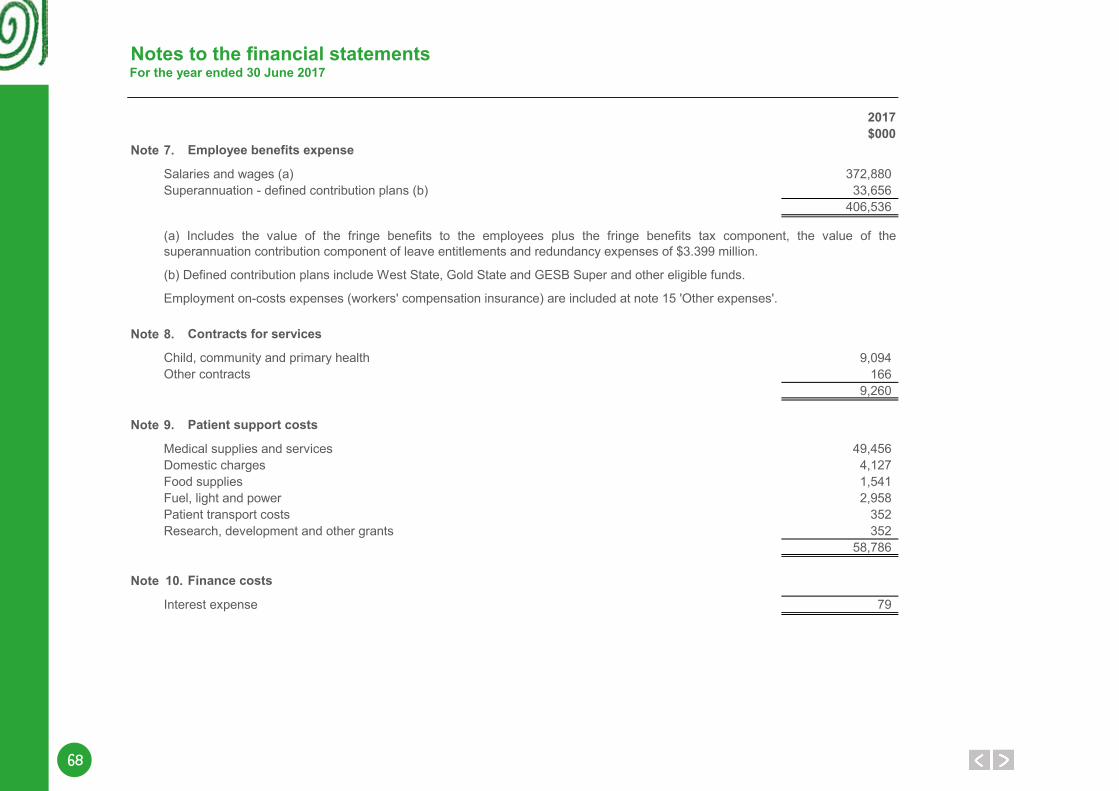
68
Notes to the financial statementsFor the year ended 30 June 2017
2017$000
Note 7.
Salaries and wages (a) 372,880Superannuation - defined contribution plans (b) 33,656
406,536
Note 8.
9,094166
9,260
Note 9.
Medical supplies and services 49,456Domestic charges 4,127Food supplies 1,541Fuel, light and power 2,958Patient transport costs 352Research, development and other grants 352
58,786
Note 10.
Interest expense 79
Employment on-costs expenses (workers' compensation insurance) are included at note 15 'Other expenses'.
Child, community and primary healthOther contracts
(b) Defined contribution plans include West State, Gold State and GESB Super and other eligible funds.
Employee benefits expense
Contracts for services
Patient support costs
Finance costs
(a) Includes the value of the fringe benefits to the employees plus the fringe benefits tax component, the value of thesuperannuation contribution component of leave entitlements and redundancy expenses of $3.399 million.
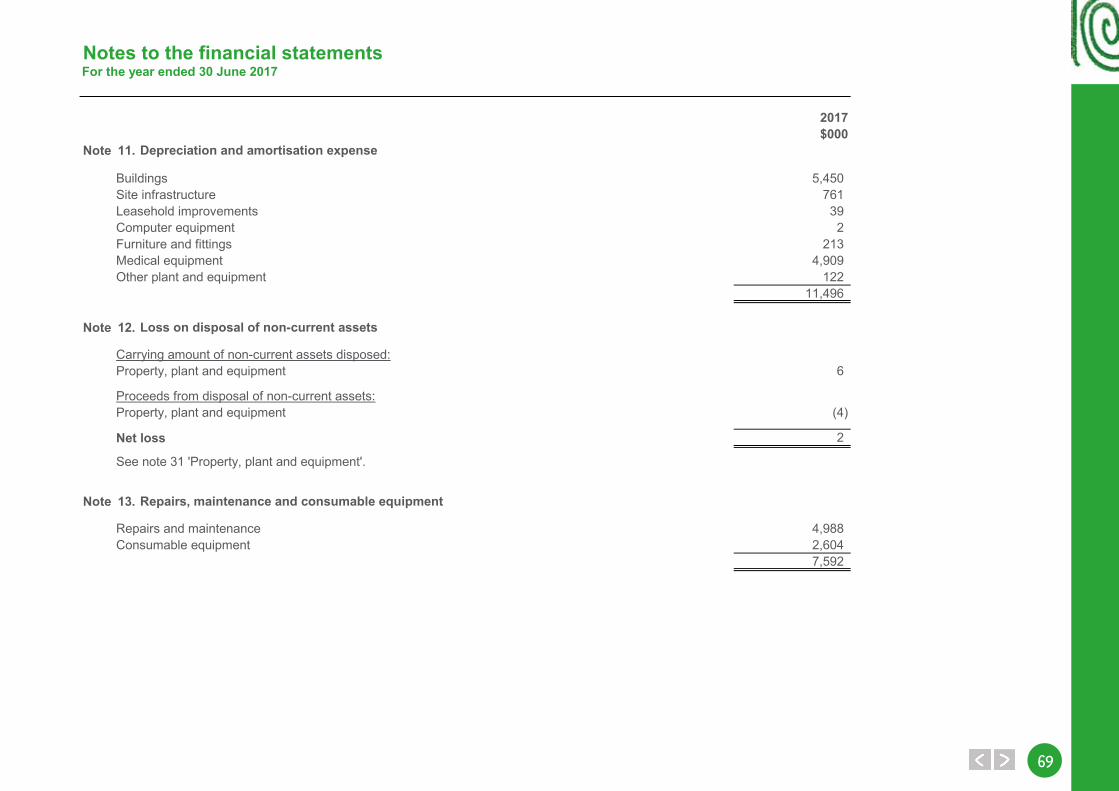
6969
Notes to the financial statementsFor the year ended 30 June 2017
2017$000
Note 11.
Buildings 5,450Site infrastructure 761Leasehold improvements 39Computer equipment 2Furniture and fittings 213Medical equipment 4,909Other plant and equipment 122
11,496
Note 12.
Carrying amount of non-current assets disposed:Property, plant and equipment 6
Proceeds from disposal of non-current assets:Property, plant and equipment (4)
Net loss 2
Note 13.
Repairs and maintenance 4,988Consumable equipment 2,604
7,592
See note 31 'Property, plant and equipment'.
Depreciation and amortisation expense
Loss on disposal of non-current assets
Repairs, maintenance and consumable equipment
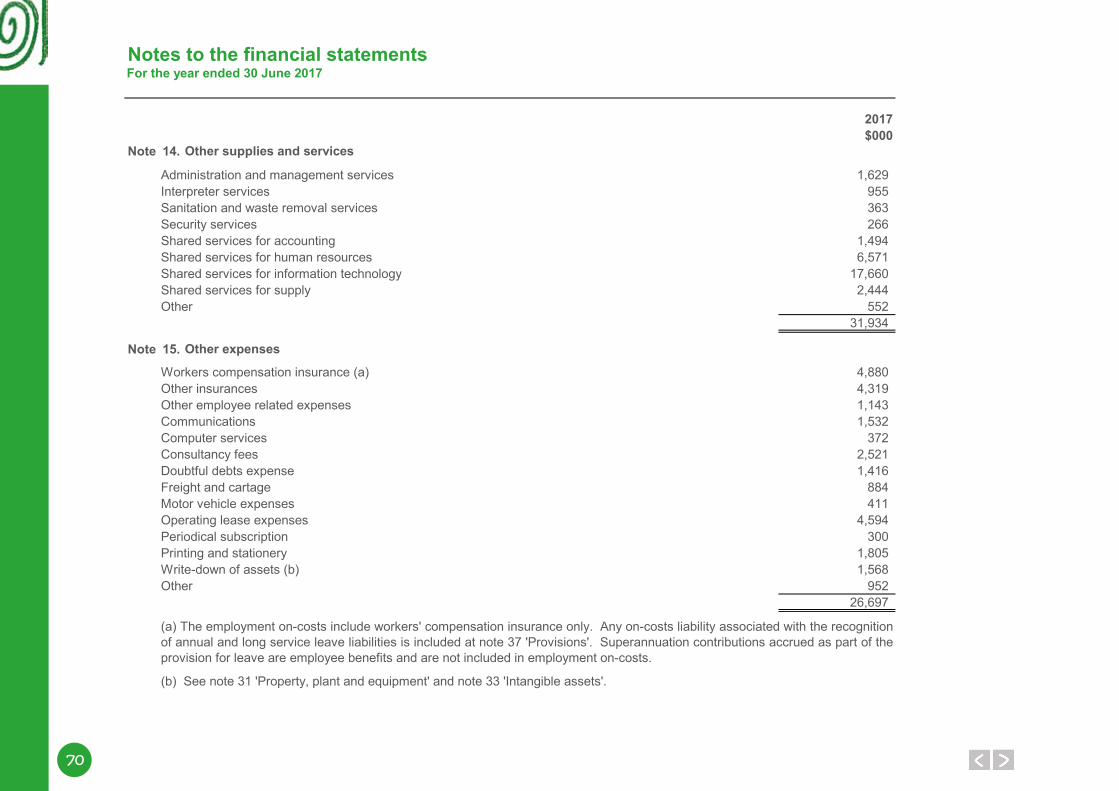
70
Notes to the financial statementsFor the year ended 30 June 2017
2017$000
Note 14.
Administration and management services 1,629Interpreter services 955Sanitation and waste removal services 363Security services 266Shared services for accounting 1,494Shared services for human resources 6,571Shared services for information technology 17,660Shared services for supply 2,444Other 552
31,934
Note 15.
Workers compensation insurance (a) 4,880Other insurances 4,319Other employee related expenses 1,143Communications 1,532Computer services 372
2,521Doubtful debts expense 1,416Freight and cartage 884Motor vehicle expenses 411Operating lease expenses 4,594Periodical subscription 300Printing and stationery 1,805Write-down of assets (b) 1,568Other 952
26,697
(a) The employment on-costs include workers' compensation insurance only. Any on-costs liability associated with the recognitionof annual and long service leave liabilities is included at note 37 'Provisions'. Superannuation contributions accrued as part of theprovision for leave are employee benefits and are not included in employment on-costs.
Consultancy fees
Other supplies and services
Other expenses
(b) See note 31 'Property, plant and equipment' and note 33 'Intangible assets'.
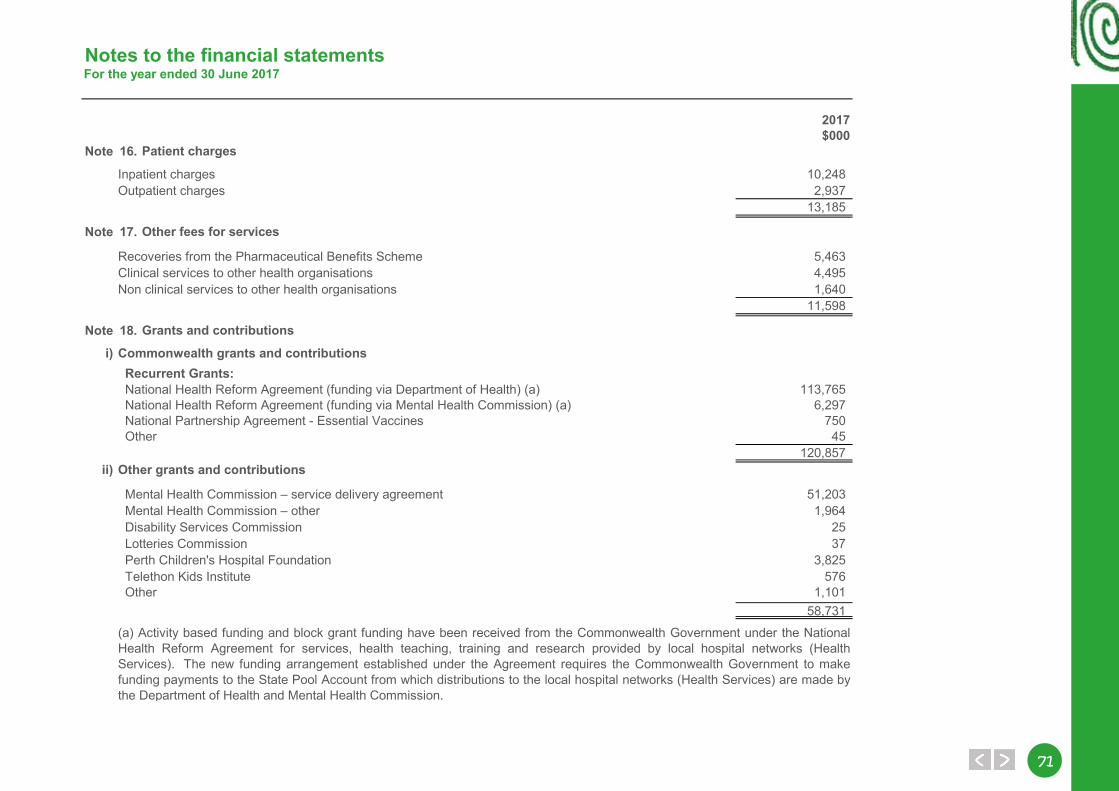
7171
Notes to the financial statementsFor the year ended 30 June 2017
2017$000
Note 16.
Inpatient charges 10,248Outpatient charges 2,937
13,185
Note 17.
Recoveries from the Pharmaceutical Benefits Scheme 5,463Clinical services to other health organisations 4,495Non clinical services to other health organisations 1,640
11,598
Note 18.
i) Commonwealth grants and contributions Recurrent Grants:
113,765 National Health Reform Agreement (funding via Mental Health Commission) (a) 6,297 National Partnership Agreement - Essential Vaccines 750
45120,857
ii) Other grants and contributions
51,2031,964
Disability Services Commission 25 Lotteries Commission 37 Perth Children's Hospital Foundation 3,825 Telethon Kids Institute 576 Other 1,101
58,731
Other fees for services
Grants and contributions
Mental Health Commission – service delivery agreement Mental Health Commission – other
(a) Activity based funding and block grant funding have been received from the Commonwealth Government under the NationalHealth Reform Agreement for services, health teaching, training and research provided by local hospital networks (HealthServices). The new funding arrangement established under the Agreement requires the Commonwealth Government to makefunding payments to the State Pool Account from which distributions to the local hospital networks (Health Services) are made bythe Department of Health and Mental Health Commission.
National Health Reform Agreement (funding via Department of Health) (a)
Other
Patient charges
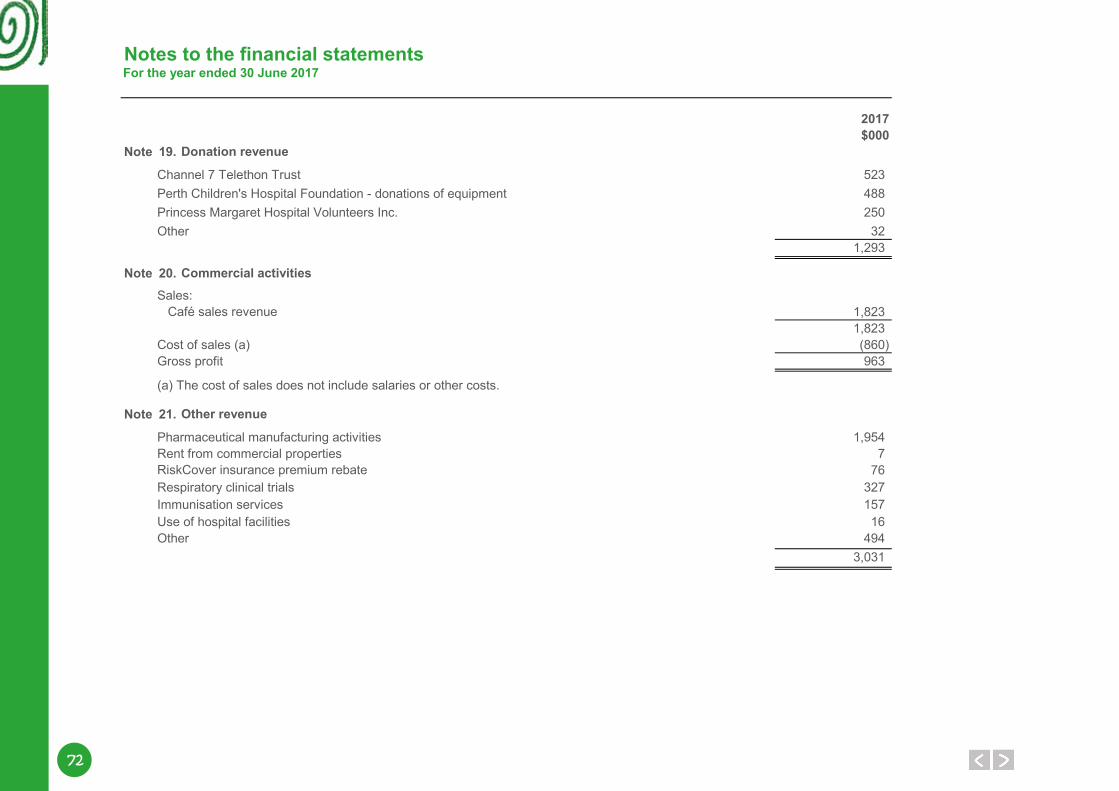
72
Notes to the financial statementsFor the year ended 30 June 2017
2017$000
Note 19.
523Perth Children's Hospital Foundation - donations of equipment 488Princess Margaret Hospital Volunteers Inc. 250Other 32
1,293
Note 20.Sales:
1,8231,823
Cost of sales (a) (860)Gross profit 963
Note 21.
Pharmaceutical manufacturing activities 1,954Rent from commercial properties 7
76Respiratory clinical trials 327Immunisation services 157Use of hospital facilities 16Other 494
3,031
Donation revenue
Commercial activities
Other revenue
Café sales revenue
(a) The cost of sales does not include salaries or other costs.
RiskCover insurance premium rebate
Channel 7 Telethon Trust
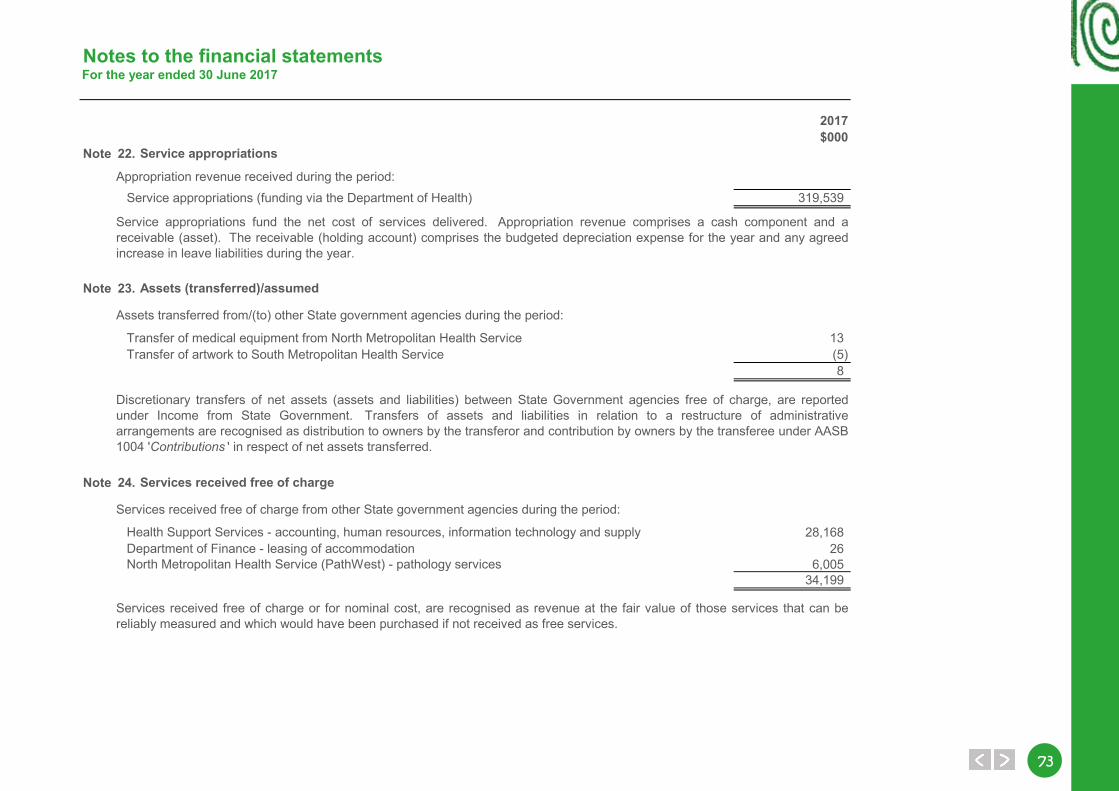
7373
Notes to the financial statementsFor the year ended 30 June 2017
2017$000
Note 22.
Appropriation revenue received during the period: Service appropriations (funding via the Department of Health) 319,539
Note 23.
13(5)8
Note 24.
28,16826
6,00534,199
Transfer of medical equipment from North Metropolitan Health Service Transfer of artwork to South Metropolitan Health Service
Services received free of charge from other State government agencies during the period:
Assets transferred from/(to) other State government agencies during the period:
Health Support Services - accounting, human resources, information technology and supply Department of Finance - leasing of accommodation
Discretionary transfers of net assets (assets and liabilities) between State Government agencies free of charge, are reportedunder Income from State Government. Transfers of assets and liabilities in relation to a restructure of administrativearrangements are recognised as distribution to owners by the transferor and contribution by owners by the transferee under AASB1004 'Contributions ' in respect of net assets transferred.
Services received free of charge or for nominal cost, are recognised as revenue at the fair value of those services that can bereliably measured and which would have been purchased if not received as free services.
Service appropriations
Assets (transferred)/assumed
Services received free of charge
Service appropriations fund the net cost of services delivered. Appropriation revenue comprises a cash component and areceivable (asset). The receivable (holding account) comprises the budgeted depreciation expense for the year and any agreedincrease in leave liabilities during the year.
North Metropolitan Health Service (PathWest) - pathology services
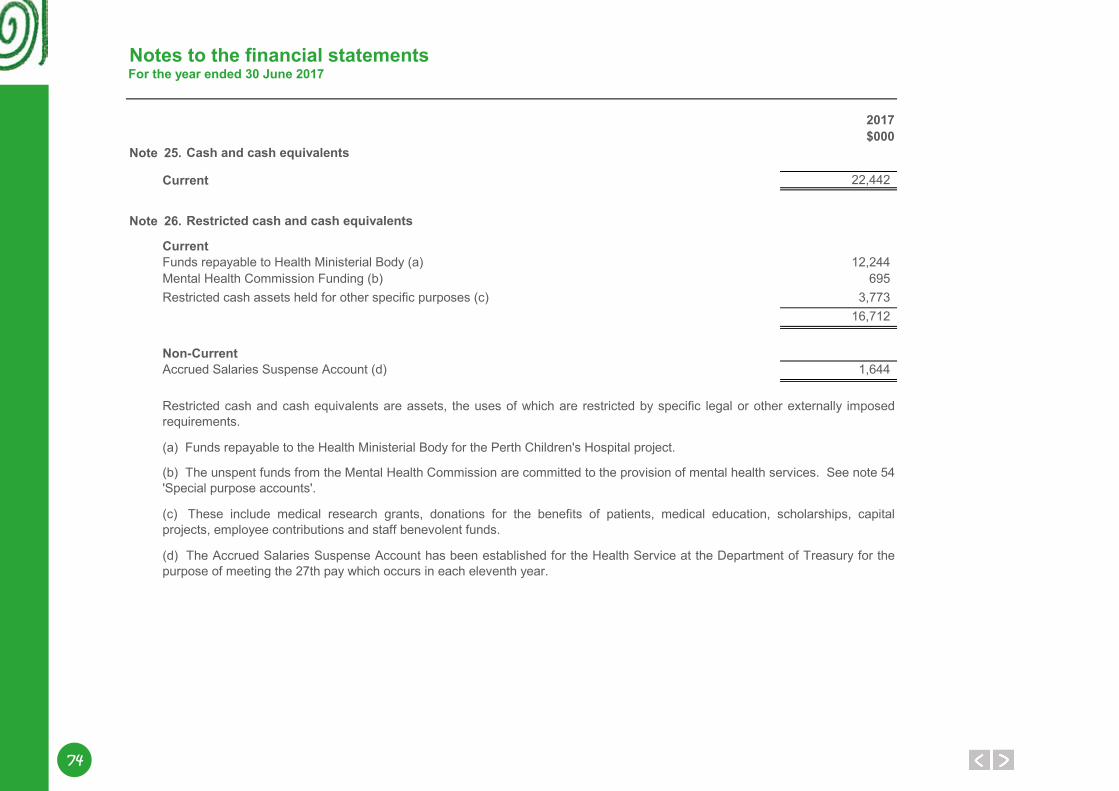
74
Notes to the financial statementsFor the year ended 30 June 2017
2017$000
Note 25.
Current 22,442
Note 26.
CurrentFunds repayable to Health Ministerial Body (a) 12,244Mental Health Commission Funding (b) 695Restricted cash assets held for other specific purposes (c) 3,773
16,712
Non-CurrentAccrued Salaries Suspense Account (d) 1,644
(c) These include medical research grants, donations for the benefits of patients, medical education, scholarships, capitalprojects, employee contributions and staff benevolent funds.
(d) The Accrued Salaries Suspense Account has been established for the Health Service at the Department of Treasury for thepurpose of meeting the 27th pay which occurs in each eleventh year.
Restricted cash and cash equivalents are assets, the uses of which are restricted by specific legal or other externally imposedrequirements.
(b) The unspent funds from the Mental Health Commission are committed to the provision of mental health services. See note 54'Special purpose accounts'.
(a) Funds repayable to the Health Ministerial Body for the Perth Children's Hospital project.
Restricted cash and cash equivalents
Cash and cash equivalents
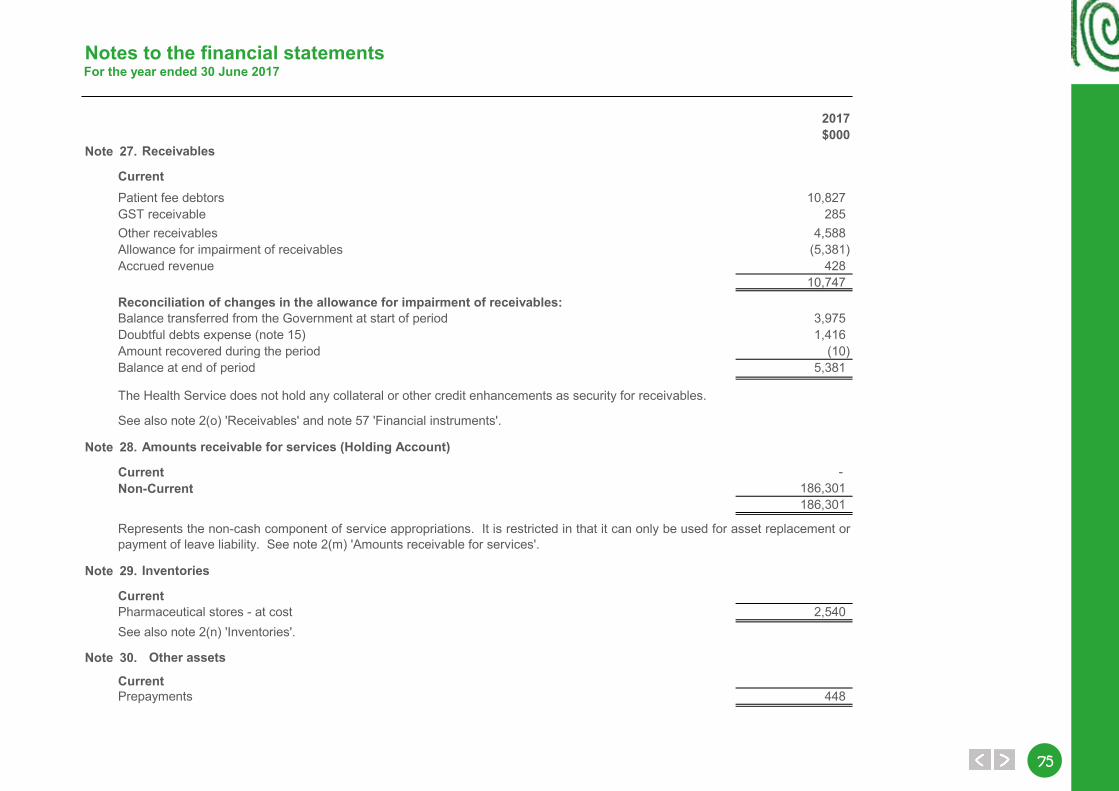
7575
Notes to the financial statementsFor the year ended 30 June 2017
2017$000
Note 27.
CurrentPatient fee debtors 10,827GST receivable 285Other receivables 4,588Allowance for impairment of receivables (5,381)Accrued revenue 428
10,747Reconciliation of changes in the allowance for impairment of receivables:Balance transferred from the Government at start of period 3,975Doubtful debts expense (note 15) 1,416Amount recovered during the period (10)Balance at end of period 5,381
Note 28.
Current - Non-Current 186,301
186,301
Note 29.
CurrentPharmaceutical stores - at cost 2,540
Note 30.
CurrentPrepayments 448
Receivables
Amounts receivable for services (Holding Account)
Inventories
Other assets
The Health Service does not hold any collateral or other credit enhancements as security for receivables.
See also note 2(n) 'Inventories'.
See also note 2(o) 'Receivables' and note 57 'Financial instruments'.
Represents the non-cash component of service appropriations. It is restricted in that it can only be used for asset replacement orpayment of leave liability. See note 2(m) 'Amounts receivable for services'.
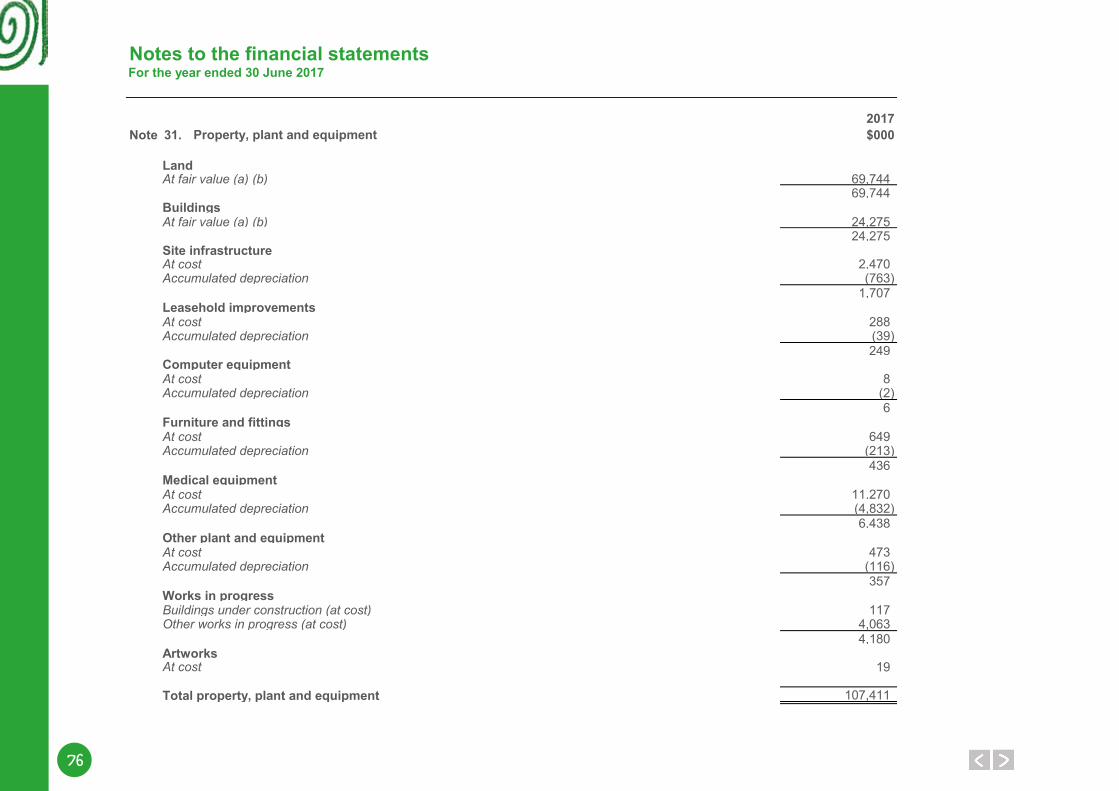
76
Notes to the financial statementsFor the year ended 30 June 2017
2017Note 31. $000
Land69,74469,744
Buildings24,27524,275
Site infrastructure2,470(763)
1,707Leasehold improvements
288(39)249
Computer equipment 8
(2)6
Furniture and fittings649
(213)436
Medical equipment11,270(4,832)6,438
Other plant and equipment473
(116)357
Works in progress117
4,0634,180
Artworks19
Total property, plant and equipment 107,411
Other works in progress (at cost)
At cost
At costAccumulated depreciation
At costAccumulated depreciation
Buildings under construction (at cost)
Accumulated depreciation
At costAccumulated depreciation
At costAccumulated depreciation
Property, plant and equipment
At fair value (a) (b)
At fair value (a) (b)
At costAccumulated depreciation
At cost
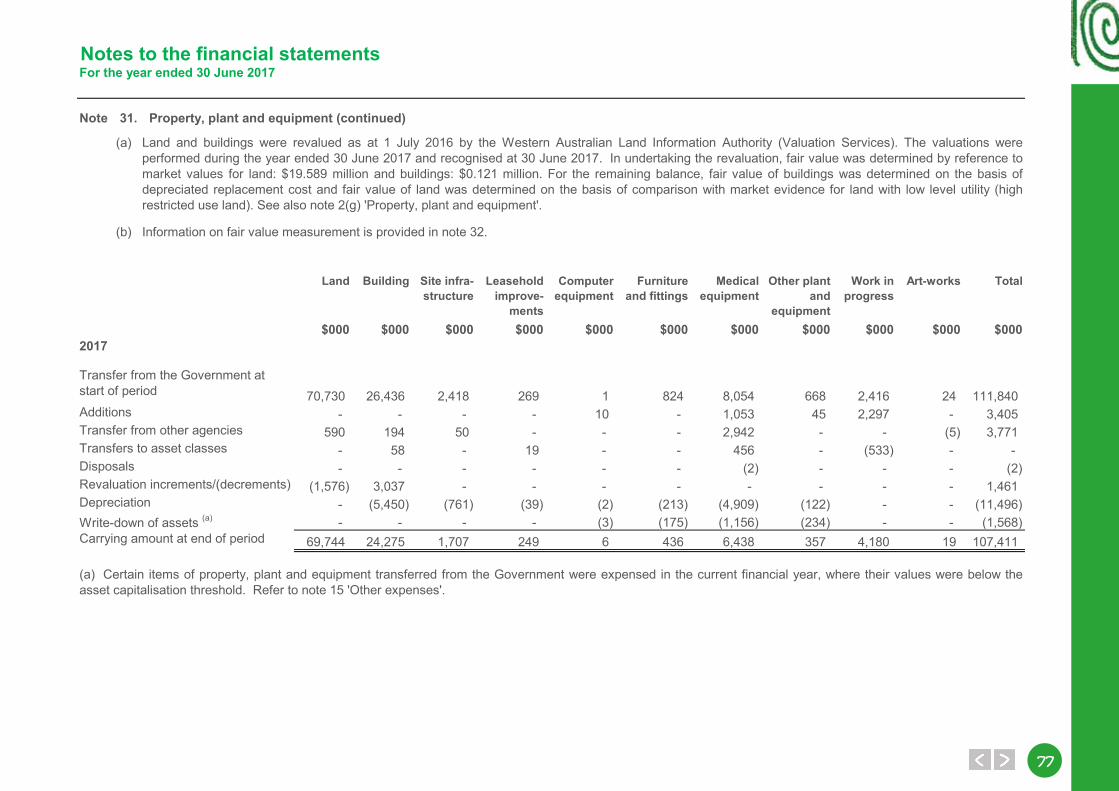
7777
Notes to the financial statementsFor the year ended 30 June 2017
Note 31. Property, plant and equipment (continued)
(a)
(b) Information on fair value measurement is provided in note 32.
Land Building Site infra-structure
Leasehold improve-
ments
Computer equipment
Furniture and fittings
Medical equipment
Other plant and
equipment
Work in progress
Art-works Total
$000 $000 $000 $000 $000 $000 $000 $000 $000 $000 $0002017
70,730 26,436 2,418 269 1 824 8,054 668 2,416 24 111,840Additions - - - - 10 - 1,053 45 2,297 - 3,405Transfer from other agencies 590 194 50 - - - 2,942 - - (5) 3,771Transfers to asset classes - 58 - 19 - - 456 - (533) - - Disposals - - - - - - (2) - - - (2)Revaluation increments/(decrements) (1,576) 3,037 - - - - - - - - 1,461Depreciation - (5,450) (761) (39) (2) (213) (4,909) (122) - - (11,496)Write-down of assets (a) - - - - (3) (175) (1,156) (234) - - (1,568)Carrying amount at end of period 69,744 24,275 1,707 249 6 436 6,438 357 4,180 19 107,411
Land and buildings were revalued as at 1 July 2016 by the Western Australian Land Information Authority (Valuation Services). The valuations wereperformed during the year ended 30 June 2017 and recognised at 30 June 2017. In undertaking the revaluation, fair value was determined by reference tomarket values for land: $19.589 million and buildings: $0.121 million. For the remaining balance, fair value of buildings was determined on the basis ofdepreciated replacement cost and fair value of land was determined on the basis of comparison with market evidence for land with low level utility (highrestricted use land). See also note 2(g) 'Property, plant and equipment'.
Transfer from the Government at start of period
(a) Certain items of property, plant and equipment transferred from the Government were expensed in the current financial year, where their values were below theasset capitalisation threshold. Refer to note 15 'Other expenses'.
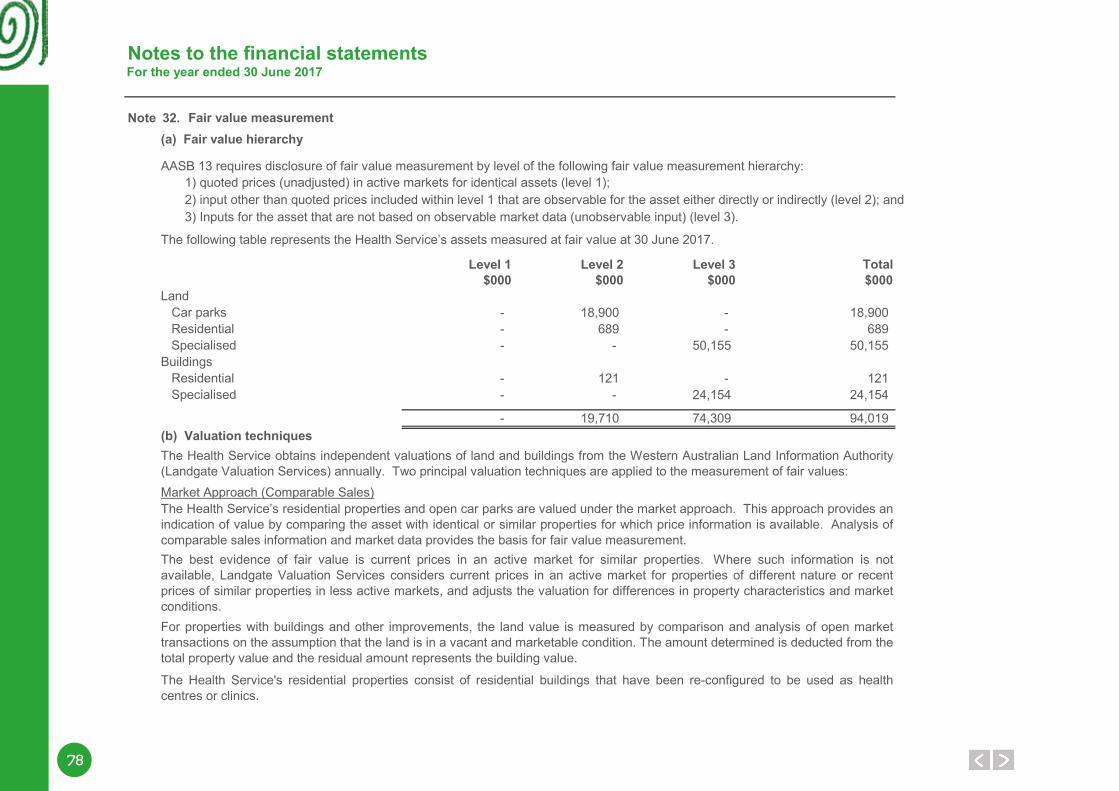
78
Notes to the financial statementsFor the year ended 30 June 2017
Note 32.(a) Fair value hierarchy
Level 1 Level 2 Level 3 Total$000 $000 $000 $000
- 18,900 - 18,900- 689 - 689- - 50,155 50,155
- 121 - 121- - 24,154 24,154
- 19,710 74,309 94,019
The Health Service’s residential properties and open car parks are valued under the market approach. This approach provides anindication of value by comparing the asset with identical or similar properties for which price information is available. Analysis ofcomparable sales information and market data provides the basis for fair value measurement. The best evidence of fair value is current prices in an active market for similar properties. Where such information is notavailable, Landgate Valuation Services considers current prices in an active market for properties of different nature or recentprices of similar properties in less active markets, and adjusts the valuation for differences in property characteristics and marketconditions.For properties with buildings and other improvements, the land value is measured by comparison and analysis of open markettransactions on the assumption that the land is in a vacant and marketable condition. The amount determined is deducted from thetotal property value and the residual amount represents the building value.
The Health Service's residential properties consist of residential buildings that have been re-configured to be used as healthcentres or clinics.
(b) Valuation techniques
Market Approach (Comparable Sales)
The Health Service obtains independent valuations of land and buildings from the Western Australian Land Information Authority(Landgate Valuation Services) annually. Two principal valuation techniques are applied to the measurement of fair values:
Residential SpecialisedBuildings Residential Specialised
3) Inputs for the asset that are not based on observable market data (unobservable input) (level 3).
The following table represents the Health Service’s assets measured at fair value at 30 June 2017.
Land Car parks
AASB 13 requires disclosure of fair value measurement by level of the following fair value measurement hierarchy: 1) quoted prices (unadjusted) in active markets for identical assets (level 1); 2) input other than quoted prices included within level 1 that are observable for the asset either directly or indirectly (level 2); and
Fair value measurement
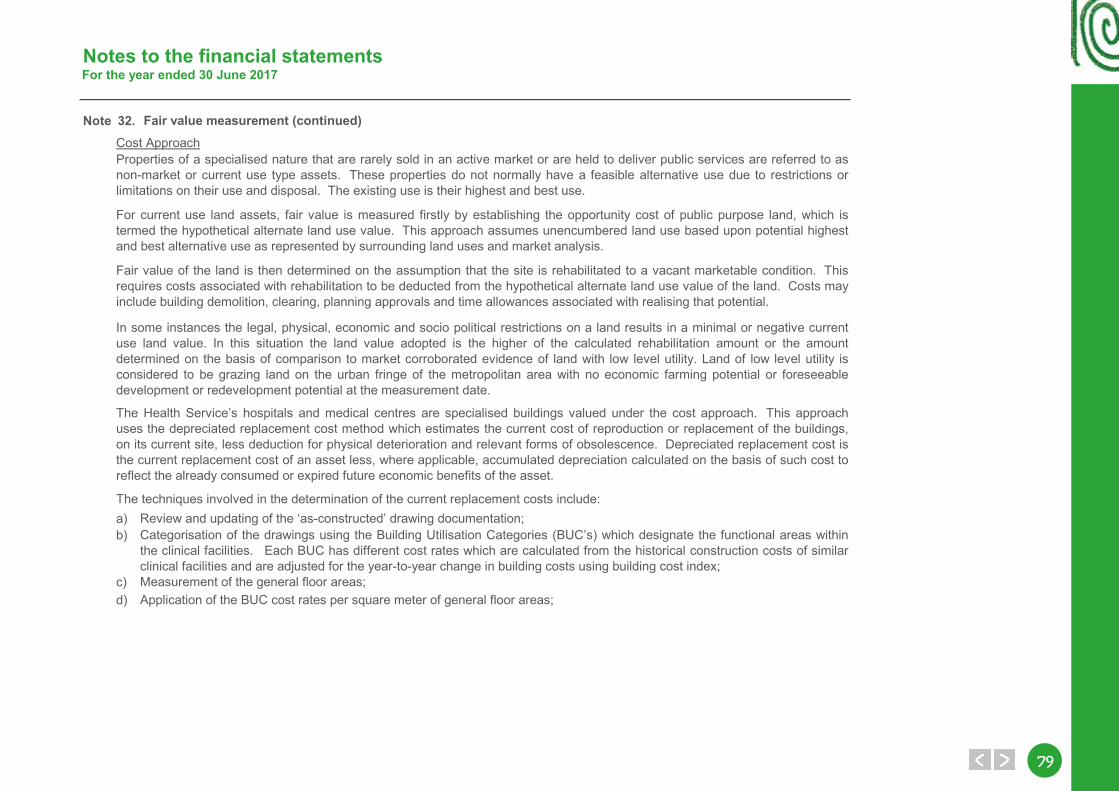
7979
Notes to the financial statementsFor the year ended 30 June 2017
Note 32.
a)b)
c)d)
The techniques involved in the determination of the current replacement costs include:Review and updating of the ‘as-constructed’ drawing documentation;
Measurement of the general floor areas;Application of the BUC cost rates per square meter of general floor areas;
Categorisation of the drawings using the Building Utilisation Categories (BUC’s) which designate the functional areas withinthe clinical facilities. Each BUC has different cost rates which are calculated from the historical construction costs of similarclinical facilities and are adjusted for the year-to-year change in building costs using building cost index;
Cost Approach
The Health Service’s hospitals and medical centres are specialised buildings valued under the cost approach. This approachuses the depreciated replacement cost method which estimates the current cost of reproduction or replacement of the buildings,on its current site, less deduction for physical deterioration and relevant forms of obsolescence. Depreciated replacement cost isthe current replacement cost of an asset less, where applicable, accumulated depreciation calculated on the basis of such cost toreflect the already consumed or expired future economic benefits of the asset.
Properties of a specialised nature that are rarely sold in an active market or are held to deliver public services are referred to asnon-market or current use type assets. These properties do not normally have a feasible alternative use due to restrictions orlimitations on their use and disposal. The existing use is their highest and best use.
For current use land assets, fair value is measured firstly by establishing the opportunity cost of public purpose land, which istermed the hypothetical alternate land use value. This approach assumes unencumbered land use based upon potential highestand best alternative use as represented by surrounding land uses and market analysis.
Fair value of the land is then determined on the assumption that the site is rehabilitated to a vacant marketable condition. Thisrequires costs associated with rehabilitation to be deducted from the hypothetical alternate land use value of the land. Costs mayinclude building demolition, clearing, planning approvals and time allowances associated with realising that potential.
In some instances the legal, physical, economic and socio political restrictions on a land results in a minimal or negative currentuse land value. In this situation the land value adopted is the higher of the calculated rehabilitation amount or the amountdetermined on the basis of comparison to market corroborated evidence of land with low level utility. Land of low level utility isconsidered to be grazing land on the urban fringe of the metropolitan area with no economic farming potential or foreseeabledevelopment or redevelopment potential at the measurement date.
Fair value measurement (continued)
80
Notes to the financial statementsFor the year ended 30 June 2017
Note 32.
(c)
Land Buildings$000 $000
Transfer from the Government at start of period 51,090 26,301Transfer from other agencies 590 194Transfer from works in progress - 58Revaluation increments/(decrements) (1,525) 3,049Depreciation expense - (5,448)Fair value at end of period 50,155 24,154
(d) Valuation processes
The valuation processes include the provision of property information to quantity surveyor and Landgate Valuation Services andthe review of the valuation reports.Landgate Valuation Service determines the fair values of the Health Service’s land and buildings. A quantity surveyor is engagedto provide an update of the current replacement costs for specialised buildings. The Landgate Valuation Services accepts orrevises the current replacement costs calculated by the quantity surveyor for specialised buildings and calculates the depreciatedreplacement costs.
2017
The straight line method of depreciation is applied to derive the depreciated replacement cost, assuming a uniform pattern ofconsumption over the initial 37 years of asset life (up to 75% of current replacement costs). All specialised buildings are assumedto have a residual value of 25% of their current replacement costs.
The valuations are prepared on a going concern basis until the year in which the current use is discontinued.
Buildings with definite demolition plan are not subject to annual revaluation. The depreciated replacement costs at the lastvaluation dates for these buildings are written down to the Statement of Comprehensive Income as depreciation expenses overtheir remaining useful life.
The maximum effective age used in the valuation of specialised buildings is 50 years. The effective age of buildings is initiallycalculated from the commissioning date, and is reviewed after the buildings have undergone substantial renewal, upgrade orexpansion.
Changes in level 3 assets for the period ended 30 June 2017
Fair value measurement (continued)
8181
Notes to the financial statementsFor the year ended 30 June 2017
2017$000
Note 33.
Works in progress6
Total intangible assets 6
Reconciliations:
Computer softwareTransfer from the Government at start of period 4Write-down of assets (a) (4)
-
Works in progressTransfer from the Government at start of period -
66
Total intangible assets Transfer from the Government at start of period 4
6(4)6
Note 34.
Carrying amount at end of period
There were no indications of impairment to property, plant and equipment or intangible assets at 30 June 2017.
The Health Service held no goodwill or intangible assets with an indefinite useful life during the reporting period. At the end of thereporting period there were no intangible assets not yet available for use.
(a) The intangible asset transferred from the Government was expensed in the current financial year, as it was below the assetcapitalisation threshold. Refer to note 15 'Other expenses'.
Impairment of assets
Write-down of assets (a)
Carrying amount at end of period
Additions
Reconciliations of the carrying amount of intangible assets at the beginning and end of the reporting period are set out below:
Carrying amount at end of period
Additions
Computer software under development (at cost)
Intangible assets
82
Notes to the financial statementsFor the year ended 30 June 2017
2017$000
Note 35.
CurrentTrade payables 2,993Payable to Health Ministerial Body 12,244Other payables 55Accrued expenses 7,739Accrued salaries 5,010Accrued interest 6
28,047
Note 36.
Current673
Non-current1,442
2,115
Department of Treasury loans
Department of Treasury loans
This debt relates to funds advanced to the Health Service via the now defunct General Loan and Capital Works Fund. Fundsadvanced and related interest costs are repaid to the Department of Treasury by the Department of Health on behalf of the HealthService. Interest rates are linked to the State Government's debt servicing costs.
Payables
See also note 2(p) 'Payables' and note 57 'Financial instruments'.
Borrowings
8383
Notes to the financial statementsFor the year ended 30 June 2017
2017$000
Note 37.CurrentEmployee benefits provisionAnnual leave (a) 40,754Time off in lieu leave (a) 7,333Long service leave (b) 30,488Deferred salary scheme (c) 1,020
79,595Non-currentEmployee benefits provisionLong service leave (b) 20,372
99,967
33,78114,30648,087
6,13744,72350,860
34986
1,020
More than 12 months after the end of the reporting period
More than 12 months after the end of the reporting period
Within 12 months of the end of the reporting period More than 12 months after the end of the reporting period
Within 12 months of the end of the reporting period
Within 12 months of the end of the reporting period
Provisions
(a) Annual leave liabilities and time off in lieu leave liabilities have been classified as current as there is no unconditional right todefer settlement for at least 12 months after the end of the reporting period. Assessments indicate that actual settlement of theliabilities is expected to occur as follows:
(b) Long service leave liabilities have been classified as current where there is no unconditional right to defer settlement for atleast 12 months after the end of the reporting period. Assessments indicate that actual settlement of the liabilities is expected tooccur as follows:
(c) Deferred salary scheme liabilities have been classified as current where there is no unconditional right to defer settlement forat least 12 months after the end of the reporting period. Assessments indicate that actual settlement of the liabilities is expected to occur as follows:
84
Notes to the financial statementsFor the year ended 30 June 2017
2017$000
Note 38.CurrentIncome received in advance 150Paid parental leave scheme 62
212
Note 39.
Balance at start of period -
Contributions by ownersTransfer of net assets on establishment of the Health Service (b) (e) 201,039Capital appropriations (a) 1,764Transfer of net assets from other agencies (b) (c) (d) 3,763
Balance at end of period 206,566
(a) Treasurer's Instruction (TI) 955 'Contributions by Owners Made to Wholly Owned Public Sector Entities' designates capitalappropriations as contributions by owners in accordance with AASB Interpretation 1038 'Contributions by Owners Made to Wholly-Owned Public Sector Entities'.
(b) AASB 1004 'Contributions' requires transfers of net assets as a result of a restructure of administrative arrangements to beaccounted for as contributions by owners and distributions to owners.
TI 955 designates non-discretionary and non-reciprocal transfers of net assets between state government agencies ascontributions by owners in accordance with AASB Interpretation 1038. Where the transferee agency accounts for a non-discretionary and non-reciprocal transfer of net assets as a contribution by owners, the transferor agency accounts for the transferas a distribution to owners.
(c) The transfer of the East Perth property site ($0.834 million) from the Department of Health to the Health Service occurred in2016-17 for setting up a Child Health Centre.
(d) Equipment with a total value of $2.929 million were transferred from the Health Ministerial Body (Perth Children Hospital'sproject) to the Princess Margaret Hospital during the financial year.
Other liabilities
Contributed equity
The Western Australian Government holds the equity interest in the Health Service on behalf of the community. Equity representsthe residual interest in the net assets of the Health Service. The asset revaluation reserve represents that portion of equityresulting from the revaluation of non-current assets (note 40).
8585
Notes to the financial statementsFor the year ended 30 June 2017
Note 39.
2017$000
AssetsCash and cash equivalents 8,323Restricted cash and cash equivalents 8,010Amounts receivable for services 170,958Receivables 8,977Inventories 2,654Property, plant and equipment 111,840Intangible assets 4Other assets 564
311,330LiabilitiesPayables 14,274Borrowings 2,756Provisions 93,261
110,291
Transfer of net assets on establishment of the Health Service 201,039
Below are the portions of assets and liabilities allocated by the Government to the Child and Adolescent Health Service on 01 July2016:
Contributed equity (continued)(e) Pursuant to the Transfer Order made on 30 June 2016 by the Minister for Health under section 238 of the Health Services Act2016 , the assets and liabilities of the Metropolitan Health Service were allocated the health service providers established underclause 12(1) of the Health Services (Health Service Providers) Order 2016 as published in the Government Gazette dated 17June 2016. The health service providers are the Child and Adolescent Health Service, East Metropolitan Health Service, NorthMetropolitan Health Service, South Metropolitan Health Service and Health Support Services.
86
Notes to the financial statementsFor the year ended 30 June 2017
2017$000
Note 40.`
Asset revaluation reserve
Balance at start of period - Net revaluation increments/(decrements) (a): Buildings 3,037Balance at end of period 3,037
Asset revaluation decrements recognised as an expense (b): Land 1,576
1,576
Note 41.
Balance at start of period - Result for the period 8,307Balance at end of period 8,307
Reserves
Accumulated surplus
(a) Any revaluation increment is credited directly to the asset revaluation reserve, except to the extent that any incrementreverses a revaluation decrement of the same class of assets previously recognised as an expense.
(b) Any revaluation decrement is recognised as an expense, except to the extent of any balance existing in the asset revaluationreserve in respect of that class of assets.
8787
Notes to the financial statementsFor the year ended 30 June 2017
2017$000
Note 42.
Reconciliation of cash
Cash and cash equivalents 22,442Restricted cash and cash equivalents 18,356
40,798
Reconciliation of net cost of services to net cash flows used in operating activities
Net cash used in operating activities (Statement of Cash Flows) (290,170)
Increase/(decrease) in assets:Receivables 3,186Inventories 7Prepayments (116)
Decrease/(increase) in liabilities:Payables (1,458)Current provisions (6,043)Non-current provisions (662)Other current liabilities (212)
Non-cash items:Doubtful debts expense (note 15) (1,416)Write off of inventory (123)Depreciation and amortisation expense (note 11) (11,496)Asset revaluation decrement (note 40) (1,576)Net gain/(loss) from disposal of non-current assets (note 12) (2)Write down of assets (note 15) (1,568)Interest paid by the Department of Health (note 10) (79)Donations of equipment received (note 19) 488Services received free of charge (note 24) (34,199)
Net cost of services (Statement of Comprehensive Income) (345,439)
Notes to the Statement of Cash Flows
Cash assets at the end of the reporting period as shown in the Statement of Cash Flows are reconciled to the related items in theStatement of Financial Position as follows:
88
Notes to the financial statementsFor the year ended 30 June 2017
2017$000
Note 42.
Notional cash flowsService appropriations as per Statement of Comprehensive Income 319,539Capital appropriation credited directly to Contributed equity (refer note 39) 1,764
321,303Less notional cash flows:
Items paid directly by the Department of Health for the Health Serviceand are therefore not included in the Statement of Cash Flows: Interest paid to the Department of Treasury (81) Repayment of borrowings to the Department of Treasury (642) Accrual appropriations (15,347)
(16,070)Cash Flows from State Government as per Statement of Cash Flows 305,233
Note 43.
28112,2302,903
15,414
Notes to the Statement of Cash Flows (continued)
Disability Services Commission - paediatric services
Services provided free of charge
Department for Child Protection and Family Support - health assessmentsDepartment of Education - school health services
At the end of the reporting period the Health Service had fully drawn on all financing facilities, details of which are disclosed in thefinancial statements.
During the reporting period, the following services were provided to other agencies free of charge for functions outside the normaloperations of the Health Service:
8989
Notes to the financial statementsFor the year ended 30 June 2017
Note 44.
Compensation of members of the accountable authority2017
$0 1 $40,001 - $50,000 7 $70,001 - $80,000 1
9
$00034333
376Compensation of senior officers
2017$0 2$10,001 - $20,000 1$160,001 - $170,000 1$170,001 - $180,000 1$190,001 - $200,000 1$200,001 - $210,000 1$210,001 - $220,000 3$240,001 - $250,000 1$480,001 - $490,000 1$530,001 - $540,000 1$550,001 - $560,000 1$810,001 - $820,000 1
Total: 15$000
3,194358364113
4,029
Compensation of key management personnel
Total compensation of members of the accountable authority
Below are the numbers of senior officers that received compensation in the financial year:
Short-term employee benefitsPost-employment benefitsOther long-term benefitsTermination benefitsTotal compensation of senior officers
The short-term employee benefits includes salary, motor vehicle benefits and travel allowances incurred by the Health Service inrespect of senior officers.
Post-employment benefits
The key management personnel include Ministers, board members, and senior officers of the Health Service. However, theHealth Service is not obligated to compensate Ministers and therefore disclosures in relation to Ministers' compensation may befound in the Annual Report on State Finances :
Below are the numbers of board members that received compensation in the financial year:
Short-term employee benefits
90
Notes to the financial statementsFor the year ended 30 June 2017
Note 45.
Related parties of the Health Service include:
---
-
-2017$000
Transactions with government related entities
Significant transactions include:
IncomeService appropriations (note 22) 319,539Assets assumed/(transferred) (note 23) 8Services received free of charge (note 24) 34,199Funding received from the Mental Health Commission (note 18) 53,167
ExpensesInterest expense for the Department of Treasury Loan (note 10) 79Operating lease expenses - Department of Finance (note 15) 1,577 Operating lease expenses - State Fleet (note 15) 501
Operating lease commitments with Department of Finance
Within 1 year 308Later than 1 year and not later than 5 years 21
329
Commitments in relation to non-cancellable operating leases contracted for at the end of the reporting period but notrecognised as liabilities, are payable as follows:
associates and joint ventures of public sector entities that are included in the whole of government consolidated financialstatements; and
public sector entities, including their related bodies, that are included in the whole of government consolidated financialstatements;
the Government Employees Superannuation Board (GESB).
all Ministers and their close family members, and their controlled or jointly controlled entities;
The Health Service is a wholly-owned and control public sector entity that is controlled by the State of Western Australia.
all senior officers and their close family members, and their controlled or jointly controlled entities;
Related party transactions
9191
Notes to the financial statementsFor the year ended 30 June 2017
2017$000
Note 45.
Transactions with other related parties
Superannuation payments to GESB (note Child, community and primary health) (2,764)Payable to GESB 475
Note 46.
Auditing the accounts, financial statements, controls and key performance indicators 126
Details of significant transactions between the Health Service and other related parties are as follows:
All other transactions (including general citizen type transactions) between the Health Service and Ministers, or board members,or senior officers, or their close family members, or their controlled (or jointly controlled) entities are not material for disclosure.
Related Party Transactions (continued)
Remuneration payable to the Auditor General in respect of the audit for the current financial year is as follows:
Remuneration of auditor
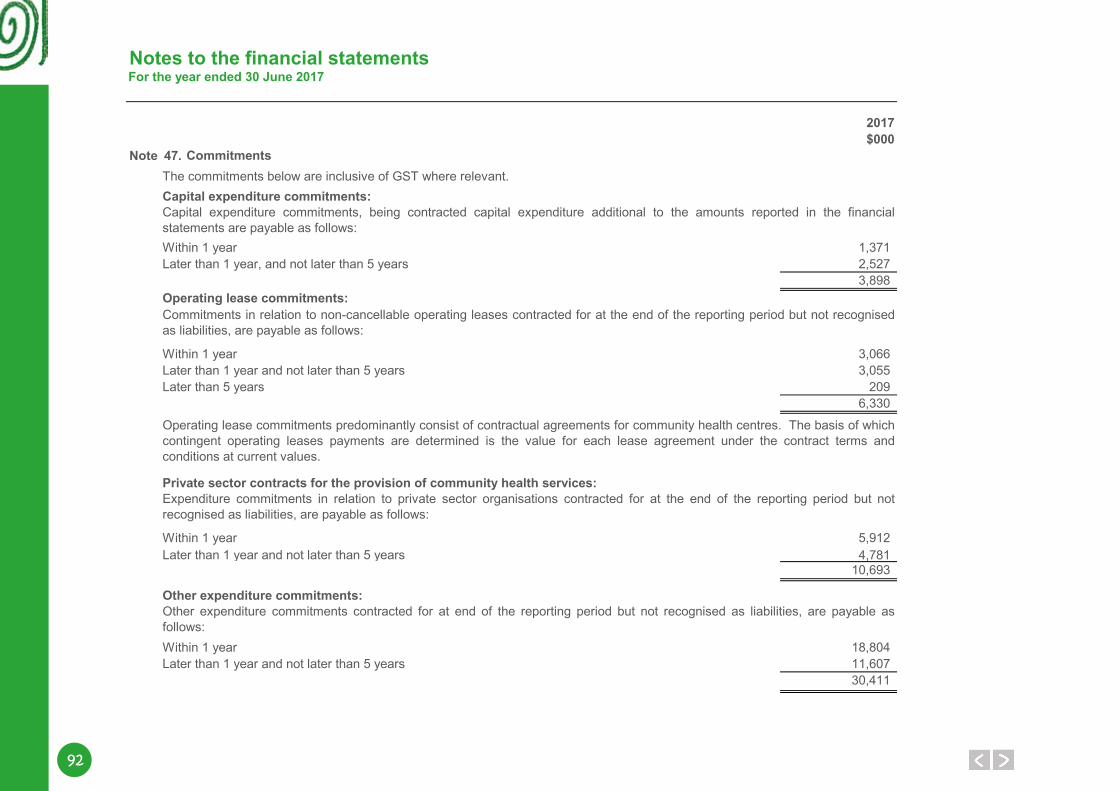
92
Notes to the financial statementsFor the year ended 30 June 2017
2017$000
Note 47.
Capital expenditure commitments:
Within 1 year 1,371Later than 1 year, and not later than 5 years 2,527
3,898Operating lease commitments:
Within 1 year 3,066Later than 1 year and not later than 5 years 3,055Later than 5 years 209
6,330
Private sector contracts for the provision of community health services:
5,9124,781
10,693
Other expenditure commitments:
Within 1 year 18,804Later than 1 year and not later than 5 years 11,607
30,411
The commitments below are inclusive of GST where relevant.
Within 1 year
Operating lease commitments predominantly consist of contractual agreements for community health centres. The basis of whichcontingent operating leases payments are determined is the value for each lease agreement under the contract terms andconditions at current values.
Capital expenditure commitments, being contracted capital expenditure additional to the amounts reported in the financialstatements are payable as follows:
Commitments in relation to non-cancellable operating leases contracted for at the end of the reporting period but not recognisedas liabilities, are payable as follows:
Expenditure commitments in relation to private sector organisations contracted for at the end of the reporting period but notrecognised as liabilities, are payable as follows:
Later than 1 year and not later than 5 years
Other expenditure commitments contracted for at end of the reporting period but not recognised as liabilities, are payable asfollows:
Commitments
9393
Notes to the financial statementsFor the year ended 30 June 2017
Note 48.
Note 49.
Note 50.
Note 51.
Under the Contaminated Sites Act 2003, the Health Service is required to report known and suspected contaminated sites to theDepartment of Environment Regulation (DER). In accordance with the Act, DER classifies these sites on the basis of the risk tohuman health, the environment and environmental values. Where sites are classified as contaminated – remediation required orpossibly contaminated – investigation required , the Health Service may have a liability in respect of investigation or remediationexpenses.
An affiliated body is a body which receives more than half its funding and resources from the Health Service but is not subject tooperational control by the Health Service.
A related body is a body which receives more than half its funding and resources from the Health Service and is subject tooperational control by the Health Service.
There were no events occurring after the reporting period which had significant financial effects on these financial statements.
Litigation in progress
Contaminated sites
At the reporting date, the Health Service is not aware of any contingent assets or contingent liabilities.
At the reporting date, the Health Service does not have any suspected contaminated sites reported under the Act.
Contingent liabilities and contingent assets
Events occurring after the end of the reporting period
Related bodies
Affiliated bodies
The Health Service had no related bodies during the financial year.
The Health Service had no affiliated bodies during the financial year.
The Health Service does not have any pending litigation that are not recoverable from RiskCover insurance at the reporting date.
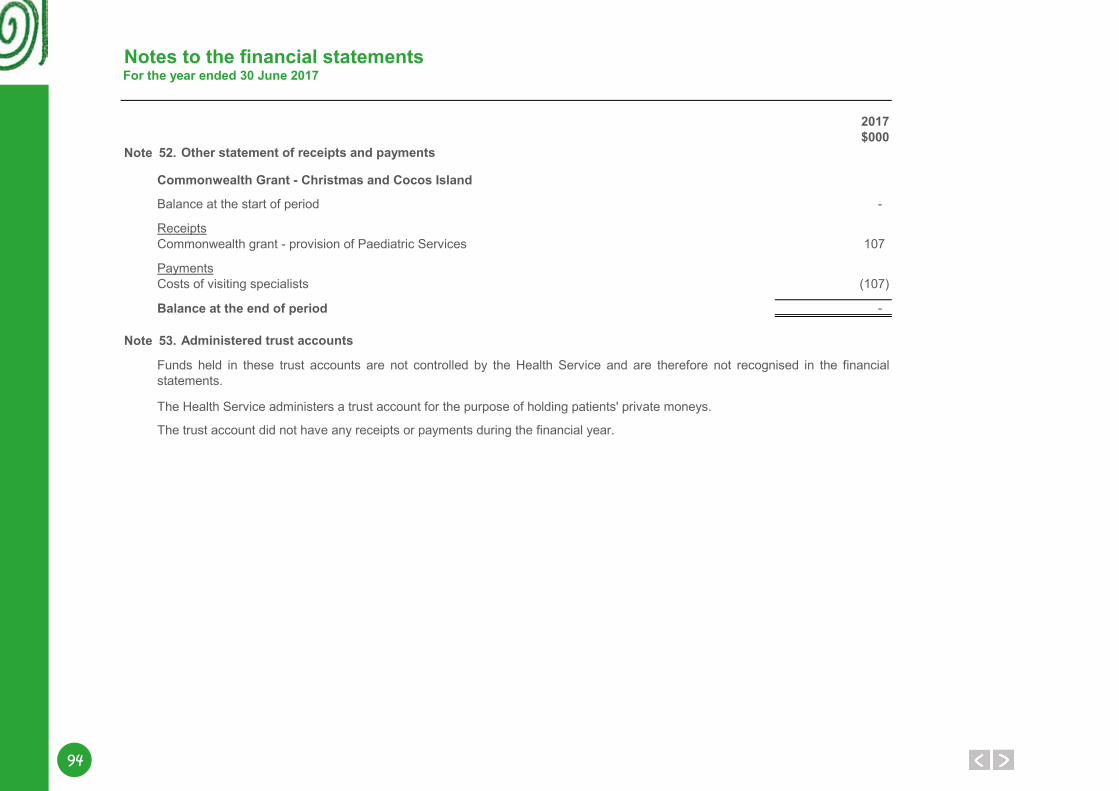
94
Notes to the financial statementsFor the year ended 30 June 2017
2017$000
Note 52.
Balance at the start of period -
ReceiptsCommonwealth grant - provision of Paediatric Services 107
PaymentsCosts of visiting specialists (107)
-
Note 53.
The Health Service administers a trust account for the purpose of holding patients' private moneys.
The trust account did not have any receipts or payments during the financial year.
Funds held in these trust accounts are not controlled by the Health Service and are therefore not recognised in the financialstatements.
Other statement of receipts and payments
Administered trust accounts
Commonwealth Grant - Christmas and Cocos Island
Balance at the end of period
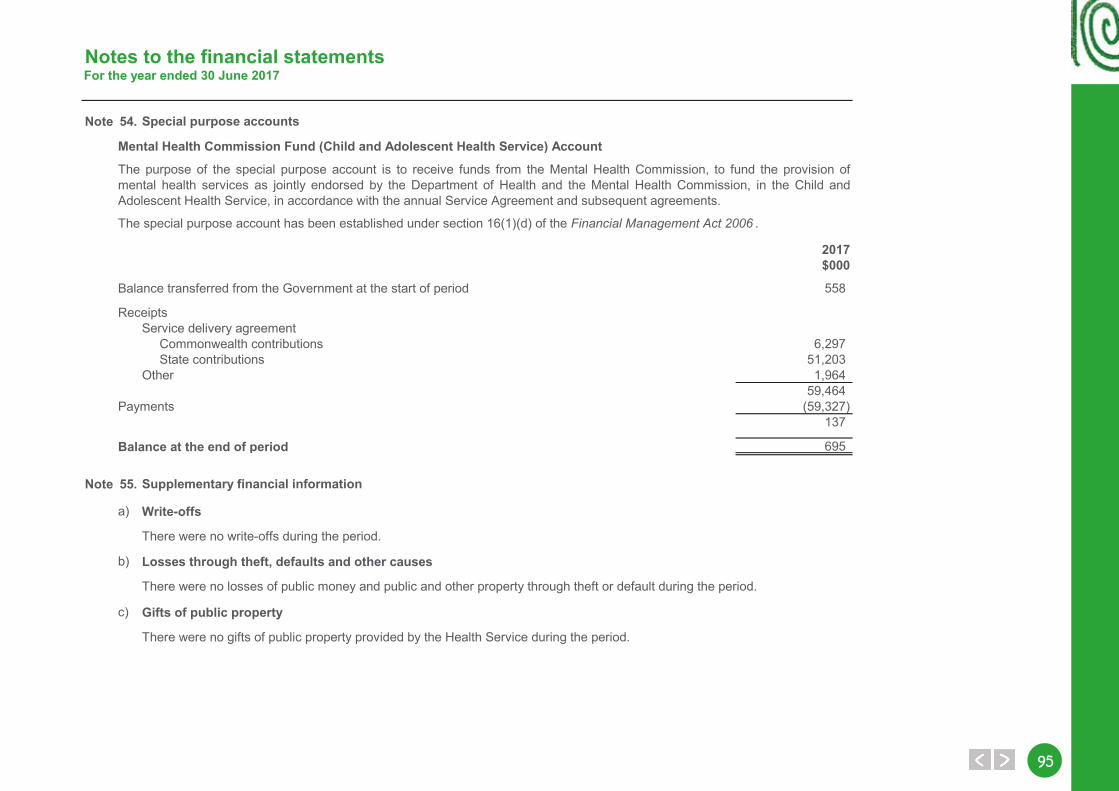
9595
Notes to the financial statementsFor the year ended 30 June 2017
Note 54.
2017$000
Balance transferred from the Government at the start of period 558
ReceiptsService delivery agreement Commonwealth contributions 6,297 State contributions 51,203Other 1,964
59,464Payments (59,327)
137
Balance at the end of period 695
Note 55.
a) Write-offs
There were no write-offs during the period.
b) Losses through theft, defaults and other causes
There were no losses of public money and public and other property through theft or default during the period.
c) Gifts of public property
There were no gifts of public property provided by the Health Service during the period.
Mental Health Commission Fund (Child and Adolescent Health Service) Account
Supplementary financial information
Special purpose accounts
The purpose of the special purpose account is to receive funds from the Mental Health Commission, to fund the provision ofmental health services as jointly endorsed by the Department of Health and the Mental Health Commission, in the Child andAdolescent Health Service, in accordance with the annual Service Agreement and subsequent agreements.
The special purpose account has been established under section 16(1)(d) of the Financial Management Act 2006 .
96
Notes to the financial statementsFor the year ended 30 June 2017
Note 56. Explanatory statement
Variancebetween
Variance 2017 2017 estimate andNote Estimates Actual actual
$000 $000 $000
Employee benefits expense 397,381 406,536 9,155Fees for visiting medical practitioners 2,143 1,139 (1,004)Contracts for services 9,894 9,260 (634)Patient support costs 50,788 58,786 7,998Finance costs 86 79 (7)Depreciation and amortisation expense (a) 56,980 11,496 (45,484)Asset revaluation decrements (b) - 1,576 1,576Loss on disposal of non-current assets - 2 2Repairs, maintenance and consumable equipment 7,170 7,592 422Other supplies and services (c) 2,591 31,934 29,343Other expenses (d) 40,076 26,697 (13,379)
Total Cost of Services 567,109 555,097 (12,012)
(i) 5% and $11 million for Statement of Comprehensive Income; (ii) 5% and $25 million for Statement of Financial Position and (iii) 5% and $11 million for Statement of Cash Flows.
All variances between estimates (original budget) and actual results for 2017 are shown below. Narratives are provided for selected major variances, which aregenerally greater than:
STATEMENT OF COMPREHENSIVE INCOMEExpenses
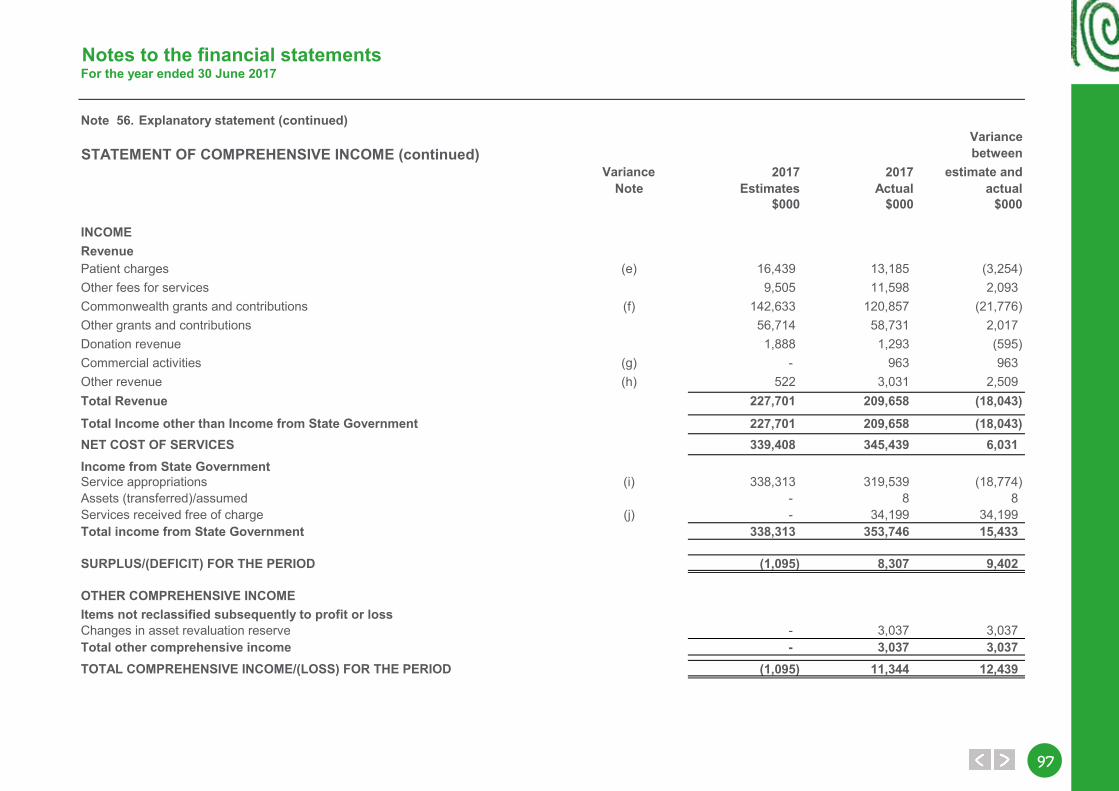
9797
Notes to the financial statementsFor the year ended 30 June 2017
Note 56. Explanatory statement (continued)Variancebetween
Variance 2017 2017 estimate andNote Estimates Actual actual
$000 $000 $000
INCOMERevenuePatient charges (e) 16,439 13,185 (3,254)Other fees for services 9,505 11,598 2,093Commonwealth grants and contributions (f) 142,633 120,857 (21,776)Other grants and contributions 56,714 58,731 2,017Donation revenue 1,888 1,293 (595)Commercial activities (g) - 963 963Other revenue (h) 522 3,031 2,509Total Revenue 227,701 209,658 (18,043)
227,701 209,658 (18,043)NET COST OF SERVICES 339,408 345,439 6,031Income from State GovernmentService appropriations (i) 338,313 319,539 (18,774)Assets (transferred)/assumed - 8 8Services received free of charge (j) - 34,199 34,199Total income from State Government 338,313 353,746 15,433
(1,095) 8,307 9,402
- 3,037 3,037- 3,037 3,037
(1,095) 11,344 12,439
Total Income other than Income from State Government
SURPLUS/(DEFICIT) FOR THE PERIOD
TOTAL COMPREHENSIVE INCOME/(LOSS) FOR THE PERIOD
OTHER COMPREHENSIVE INCOMEItems not reclassified subsequently to profit or lossChanges in asset revaluation reserveTotal other comprehensive income
STATEMENT OF COMPREHENSIVE INCOME (continued)
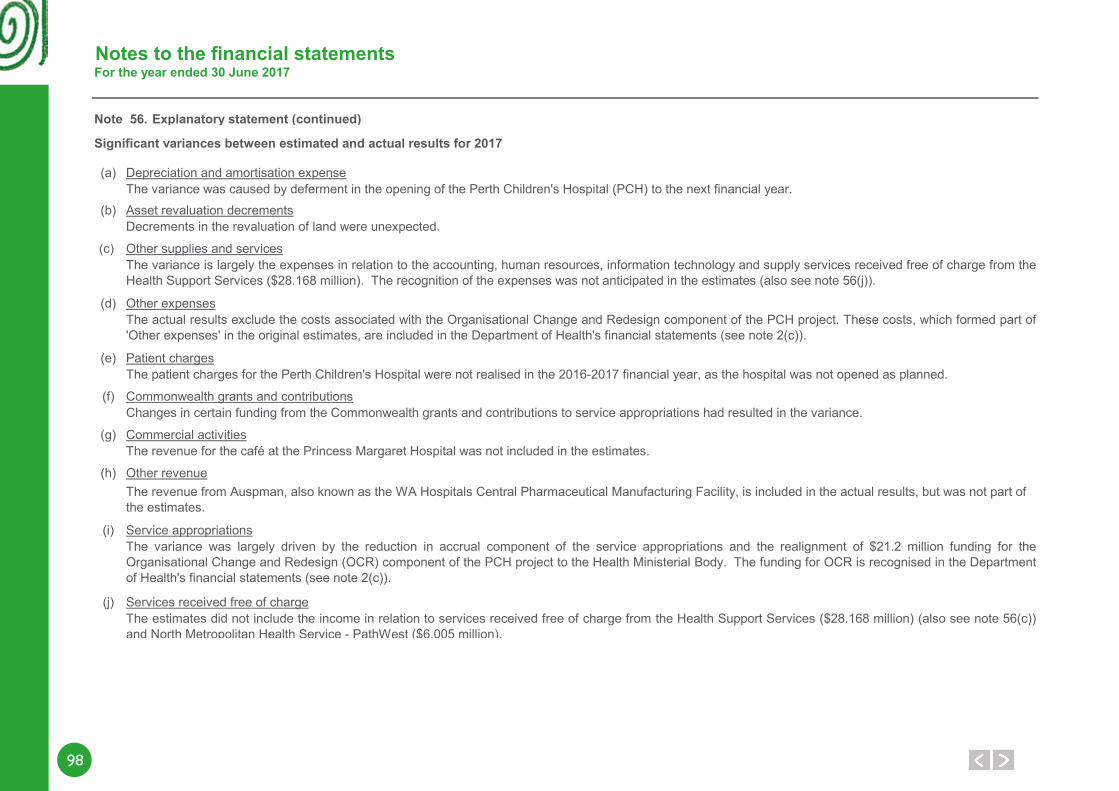
98
Notes to the financial statementsFor the year ended 30 June 2017
Note 56. Explanatory statement (continued)
Significant variances between estimated and actual results for 2017
(a) Depreciation and amortisation expense
(b) Asset revaluation decrements
(c) Other supplies and services
(d) Other expenses
(e) Patient charges
(f) Commonwealth grants and contributions
(g) Commercial activities
(h) Other revenue
(i) Service appropriations
(j) Services received free of charge
Changes in certain funding from the Commonwealth grants and contributions to service appropriations had resulted in the variance.
Decrements in the revaluation of land were unexpected.
The variance is largely the expenses in relation to the accounting, human resources, information technology and supply services received free of charge from theHealth Support Services ($28.168 million). The recognition of the expenses was not anticipated in the estimates (also see note 56(j)).
The revenue for the café at the Princess Margaret Hospital was not included in the estimates.
The revenue from Auspman, also known as the WA Hospitals Central Pharmaceutical Manufacturing Facility, is included in the actual results, but was not part of the estimates.
The patient charges for the Perth Children's Hospital were not realised in the 2016-2017 financial year, as the hospital was not opened as planned.
The variance was caused by deferment in the opening of the Perth Children's Hospital (PCH) to the next financial year.
The actual results exclude the costs associated with the Organisational Change and Redesign component of the PCH project. These costs, which formed part of'Other expenses' in the original estimates, are included in the Department of Health's financial statements (see note 2(c)).
The estimates did not include the income in relation to services received free of charge from the Health Support Services ($28.168 million) (also see note 56(c))and North Metropolitan Health Service - PathWest ($6.005 million).
The variance was largely driven by the reduction in accrual component of the service appropriations and the realignment of $21.2 million funding for theOrganisational Change and Redesign (OCR) component of the PCH project to the Health Ministerial Body. The funding for OCR is recognised in the Departmentof Health's financial statements (see note 2(c)).
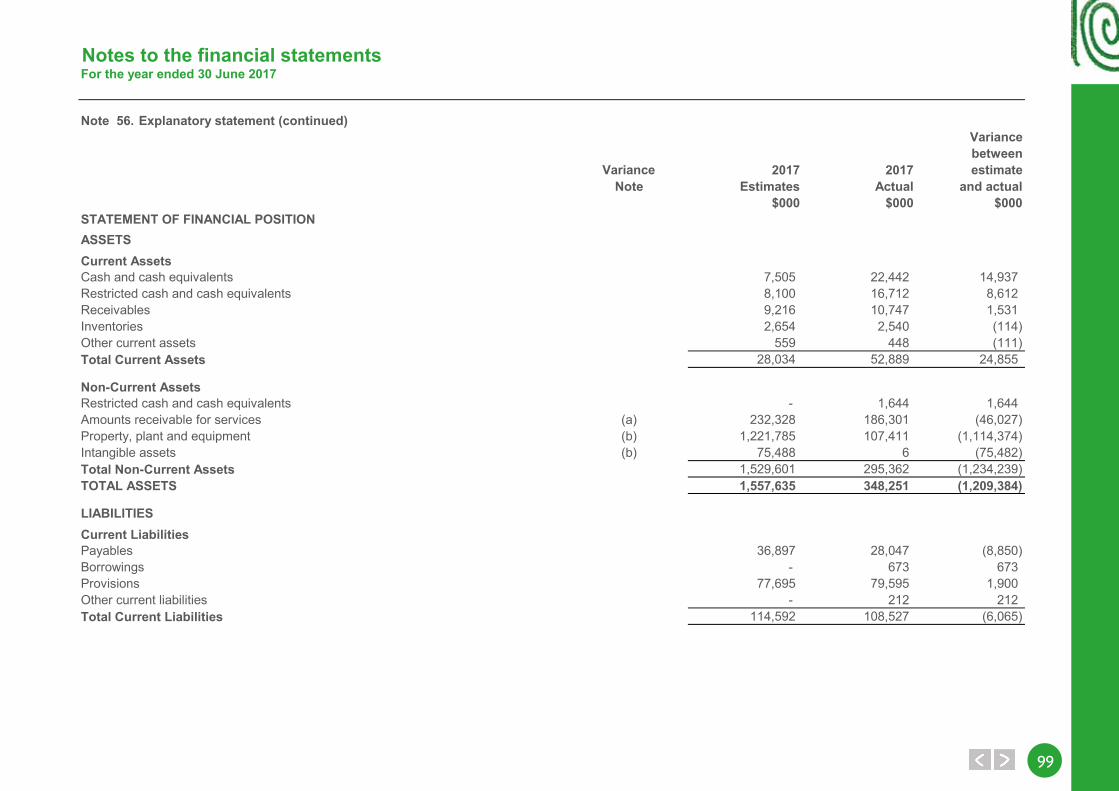
9999
Notes to the financial statementsFor the year ended 30 June 2017
Note 56. Explanatory statement (continued)Variancebetween
Variance 2017 2017 estimateNote Estimates Actual and actual
$000 $000 $000STATEMENT OF FINANCIAL POSITIONASSETSCurrent AssetsCash and cash equivalents 7,505 22,442 14,937Restricted cash and cash equivalents 8,100 16,712 8,612Receivables 9,216 10,747 1,531Inventories 2,654 2,540 (114)Other current assets 559 448 (111)Total Current Assets 28,034 52,889 24,855
Non-Current AssetsRestricted cash and cash equivalents - 1,644 1,644Amounts receivable for services (a) 232,328 186,301 (46,027)Property, plant and equipment (b) 1,221,785 107,411 (1,114,374)Intangible assets (b) 75,488 6 (75,482)Total Non-Current Assets 1,529,601 295,362 (1,234,239)TOTAL ASSETS 1,557,635 348,251 (1,209,384)
LIABILITIESCurrent LiabilitiesPayables 36,897 28,047 (8,850)Borrowings - 673 673Provisions 77,695 79,595 1,900Other current liabilities - 212 212Total Current Liabilities 114,592 108,527 (6,065)
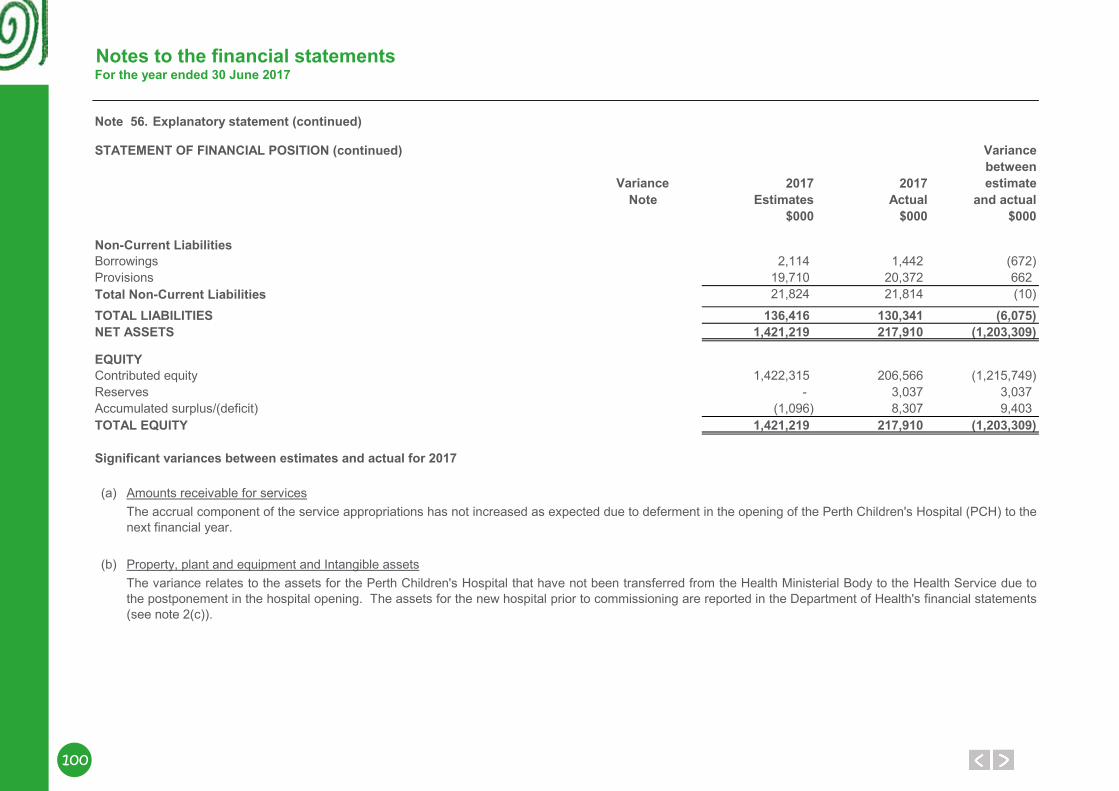
100
Notes to the financial statementsFor the year ended 30 June 2017
Note 56. Explanatory statement (continued)
STATEMENT OF FINANCIAL POSITION (continued) Variancebetween
Variance 2017 2017 estimateNote Estimates Actual and actual
$000 $000 $000
Non-Current LiabilitiesBorrowings 2,114 1,442 (672)Provisions 19,710 20,372 662Total Non-Current Liabilities 21,824 21,814 (10)
TOTAL LIABILITIES 136,416 130,341 (6,075)NET ASSETS 1,421,219 217,910 (1,203,309)
EQUITYContributed equity 1,422,315 206,566 (1,215,749)Reserves - 3,037 3,037Accumulated surplus/(deficit) (1,096) 8,307 9,403TOTAL EQUITY 1,421,219 217,910 (1,203,309)
Significant variances between estimates and actual for 2017
(a) Amounts receivable for services
(b) Property, plant and equipment and Intangible assets
The accrual component of the service appropriations has not increased as expected due to deferment in the opening of the Perth Children's Hospital (PCH) to thenext financial year.
The variance relates to the assets for the Perth Children's Hospital that have not been transferred from the Health Ministerial Body to the Health Service due tothe postponement in the hospital opening. The assets for the new hospital prior to commissioning are reported in the Department of Health's financial statements(see note 2(c)).
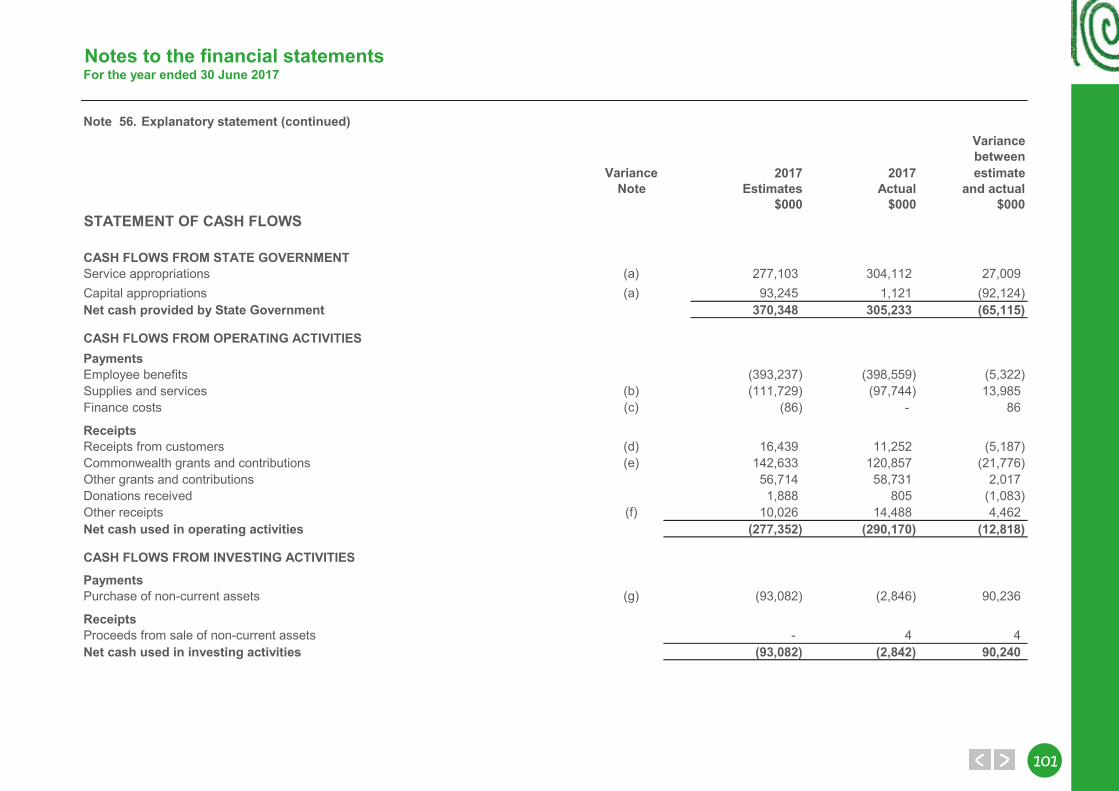
101101
Notes to the financial statementsFor the year ended 30 June 2017
Note 56. Explanatory statement (continued)Variancebetween
Variance 2017 2017 estimateNote Estimates Actual and actual
$000 $000 $000STATEMENT OF CASH FLOWS
CASH FLOWS FROM STATE GOVERNMENTService appropriations (a) 277,103 304,112 27,009Capital appropriations (a) 93,245 1,121 (92,124)Net cash provided by State Government 370,348 305,233 (65,115)
CASH FLOWS FROM OPERATING ACTIVITIESPaymentsEmployee benefits (393,237) (398,559) (5,322)Supplies and services (b) (111,729) (97,744) 13,985Finance costs (c) (86) - 86
ReceiptsReceipts from customers (d) 16,439 11,252 (5,187)Commonwealth grants and contributions (e) 142,633 120,857 (21,776)Other grants and contributions 56,714 58,731 2,017Donations received 1,888 805 (1,083)Other receipts (f) 10,026 14,488 4,462Net cash used in operating activities (277,352) (290,170) (12,818)
CASH FLOWS FROM INVESTING ACTIVITIES
PaymentsPurchase of non-current assets (g) (93,082) (2,846) 90,236
ReceiptsProceeds from sale of non-current assets - 4 4Net cash used in investing activities (93,082) (2,842) 90,240
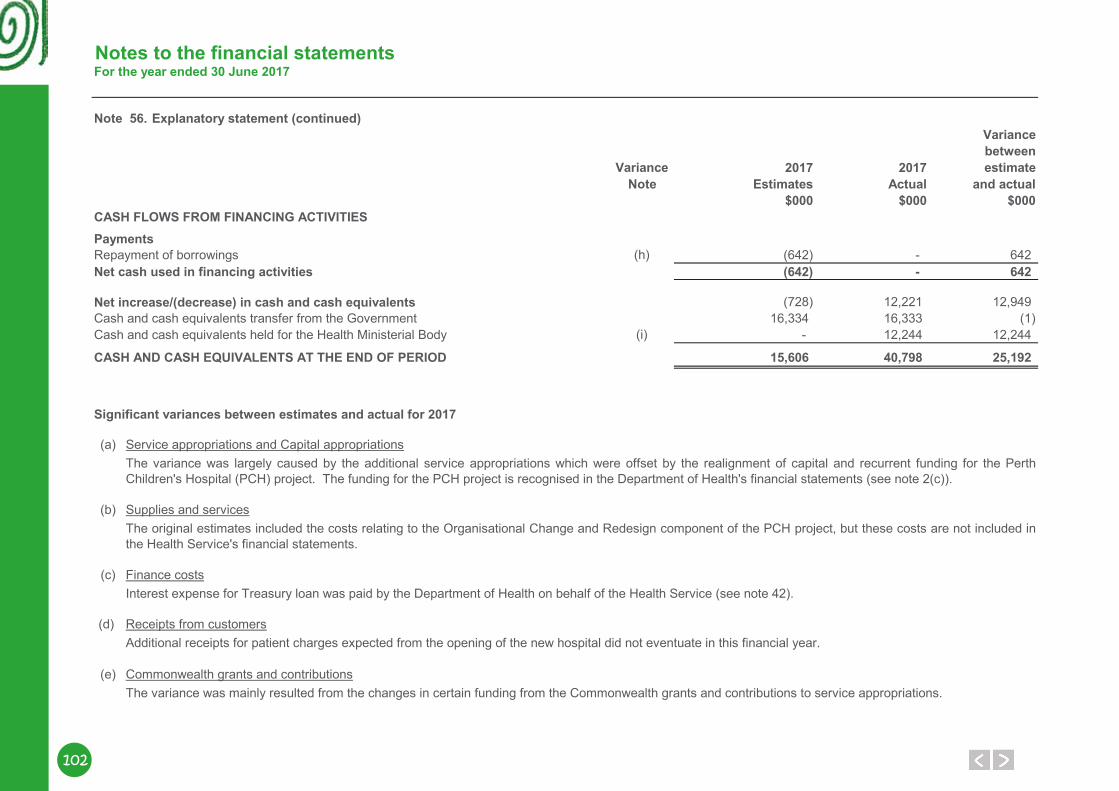
102
Notes to the financial statementsFor the year ended 30 June 2017
Note 56. Explanatory statement (continued)Variancebetween
Variance 2017 2017 estimateNote Estimates Actual and actual
$000 $000 $000CASH FLOWS FROM FINANCING ACTIVITIESPaymentsRepayment of borrowings (h) (642) - 642Net cash used in financing activities (642) - 642
Net increase/(decrease) in cash and cash equivalents (728) 12,221 12,949Cash and cash equivalents transfer from the Government 16,334 16,333 (1)Cash and cash equivalents held for the Health Ministerial Body (i) - 12,244 12,244
CASH AND CASH EQUIVALENTS AT THE END OF PERIOD 15,606 40,798 25,192
Significant variances between estimates and actual for 2017
(a) Service appropriations and Capital appropriations
(b) Supplies and services
(c) Finance costs
(d) Receipts from customers
(e) Commonwealth grants and contributions
The variance was largely caused by the additional service appropriations which were offset by the realignment of capital and recurrent funding for the PerthChildren's Hospital (PCH) project. The funding for the PCH project is recognised in the Department of Health's financial statements (see note 2(c)).
The original estimates included the costs relating to the Organisational Change and Redesign component of the PCH project, but these costs are not included inthe Health Service's financial statements.
Interest expense for Treasury loan was paid by the Department of Health on behalf of the Health Service (see note 42).
Additional receipts for patient charges expected from the opening of the new hospital did not eventuate in this financial year.
The variance was mainly resulted from the changes in certain funding from the Commonwealth grants and contributions to service appropriations.
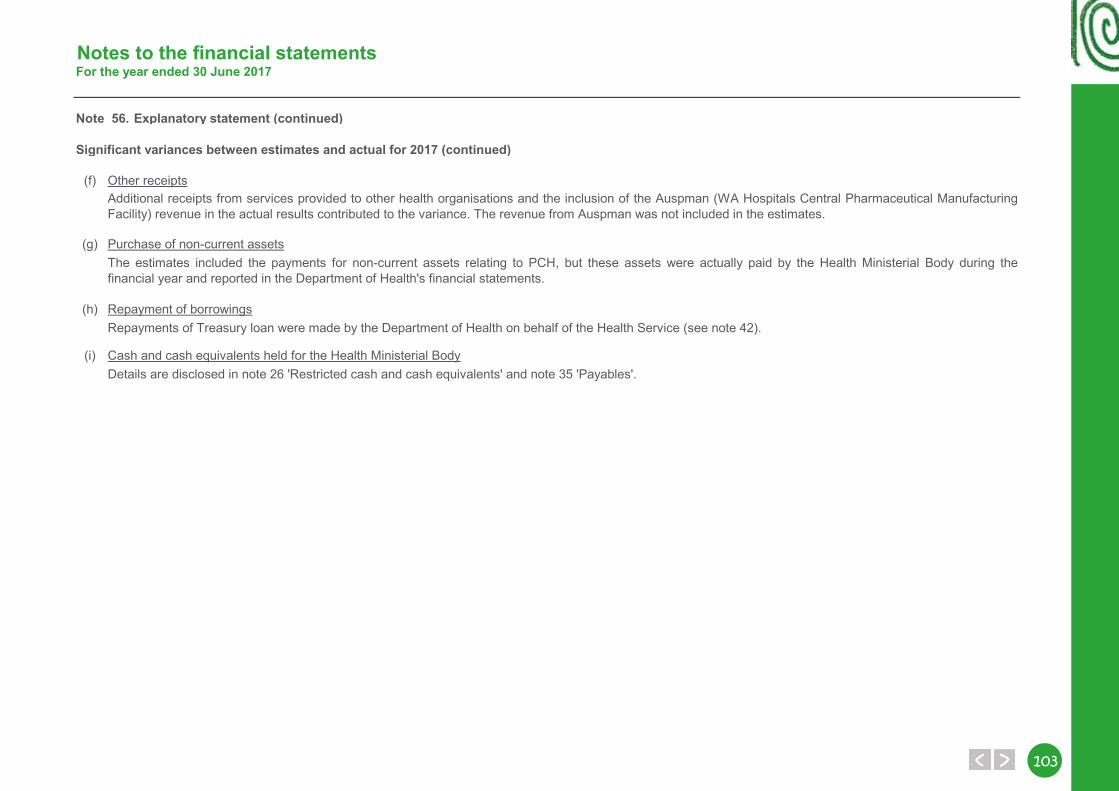
103103
Notes to the financial statementsFor the year ended 30 June 2017
Note 56. Explanatory statement (continued)
Significant variances between estimates and actual for 2017 (continued)
(f) Other receipts
(g) Purchase of non-current assets
(h) Repayment of borrowings
(i) Cash and cash equivalents held for the Health Ministerial BodyDetails are disclosed in note 26 'Restricted cash and cash equivalents' and note 35 'Payables'.
Repayments of Treasury loan were made by the Department of Health on behalf of the Health Service (see note 42).
Additional receipts from services provided to other health organisations and the inclusion of the Auspman (WA Hospitals Central Pharmaceutical ManufacturingFacility) revenue in the actual results contributed to the variance. The revenue from Auspman was not included in the estimates.
The estimates included the payments for non-current assets relating to PCH, but these assets were actually paid by the Health Ministerial Body during thefinancial year and reported in the Department of Health's financial statements.
104
Notes to the financial statementsFor the year ended 30 June 2017
Note 57. Financial instruments(a) Financial risk management objectives and policies
Credit risk
Liquidity risk
Market risk
Liquidity risk arises when the Health Service is unable to meet its financial obligations as they fall due. The Health Service is exposed to liquidity risk through itsnormal course of operations.
Market risk is the risk that changes in market prices such as foreign exchange rates and interest rates will affect the Health Service’s income or the value of itsholdings of financial instruments. The Health Service does not trade in foreign currency and is not materially exposed to other price risks. The Health Service’sexposure to market risk for changes in interest rates relates primarily to the long-term debt obligations. The Health Service's borrowings consist of theDepartment of Treasury (DT) loans. The interest rate risk for the loans is managed by DT through portfolio diversification.
The Health Service has appropriate procedures to manage cash flows including drawdowns of appropriations by monitoring forecast cash flows to ensure thatsufficient funds are available to meet its commitments.
Financial instruments held by the Health Service are cash and cash equivalents, restricted cash and cash equivalents, borrowings, receivables and payables.The Health Service has limited exposure to financial risks. The Health Service’s overall risk management program focuses on managing the risks identifiedbelow.
The maximum exposure to credit risk at the end of the reporting period in relation to each class of recognised financial assets is the gross carrying amount ofthose assets inclusive of any allowance for impairment as shown in the table at note 57(c) 'Financial instrument disclosures' and note 27 'Receivables'.
Credit risk associated with the Health Service’s financial assets is generally confined to patient fee debtors (see note 27). The main receivable of the HealthService is the amounts receivable for services (holding account). For receivables other than government agencies and patient fee debtors, the Health Servicetrades only with recognised, creditworthy third parties. The Health Service has policies in place to ensure that sales of products and services are made tocustomers with an appropriate credit history. In addition, receivable balances are monitored on an ongoing basis with the result that the Health Service’s exposureto bad debts is minimised. At the end of the reporting period, there were no significant concentrations of credit risk.
All debts are individually reviewed, on a timely basis at 30, 60, 90 and 120 days. In a circumstance where a third party is responsible for payment, or there arelegal considerations, payment of accounts can be delayed considerably. Unpaid debts are referred to an external debt collection service within six months of theaccounts being raised.
Allowance for impairment of financial assets is calculated based on objective evidence such as observable data indicating changes in client credit ratings. Forfinancial assets that are either past due or impaired, refer to note 57 (c) 'Financial instrument disclosures'.
Credit risk arises when there is the possibility of the Health Service’s receivables defaulting on their contractual obligations resulting in financial loss to the HealthService.
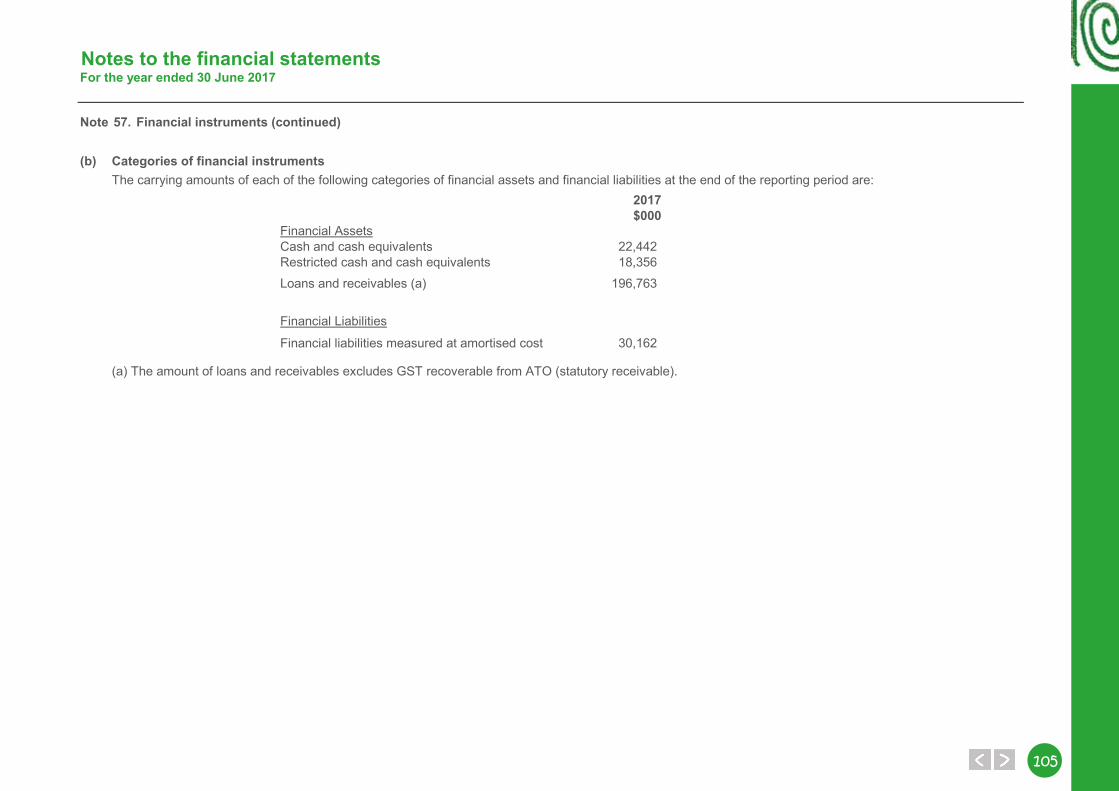
105105
Notes to the financial statementsFor the year ended 30 June 2017
Note 57. Financial instruments (continued)
(b) Categories of financial instruments
2017$000
Financial AssetsCash and cash equivalents 22,442Restricted cash and cash equivalents 18,356Loans and receivables (a) 196,763
Financial Liabilities
Financial liabilities measured at amortised cost 30,162
(a) The amount of loans and receivables excludes GST recoverable from ATO (statutory receivable).
The carrying amounts of each of the following categories of financial assets and financial liabilities at the end of the reporting period are:
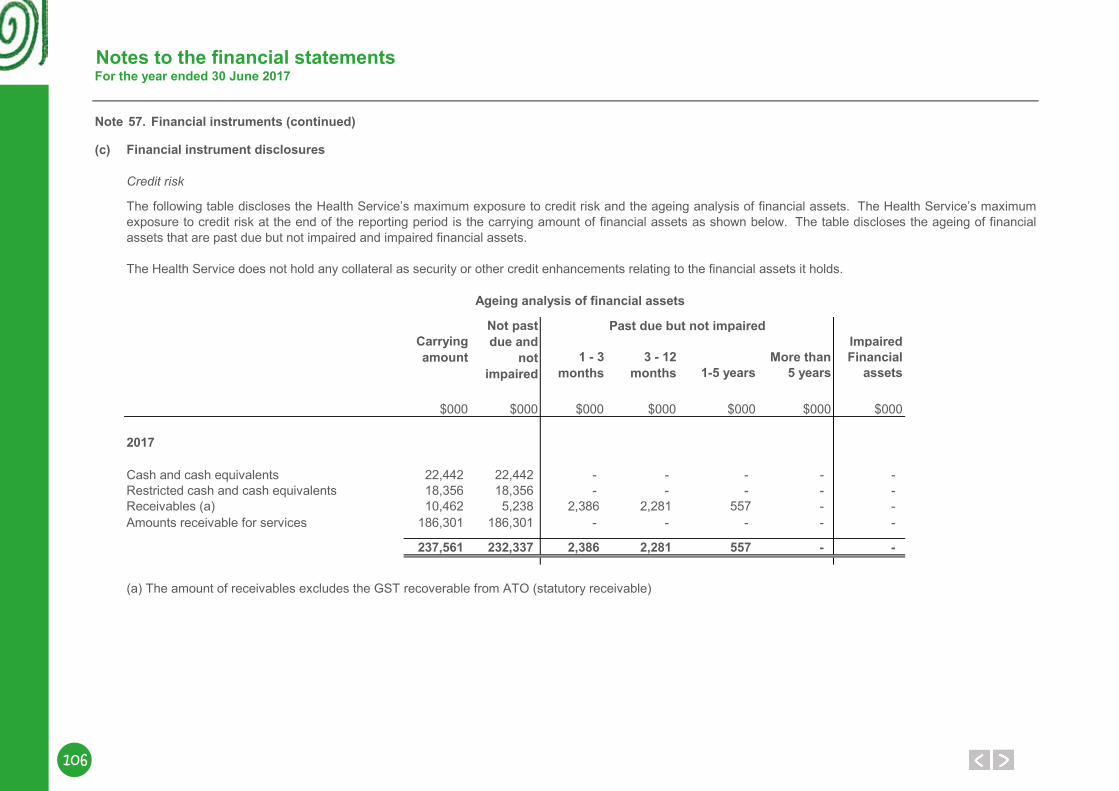
106
Notes to the financial statementsFor the year ended 30 June 2017
Note 57. Financial instruments (continued)
(c)
Credit risk
ImpairedMore than Financial
1-5 years 5 years assets
$000 $000 $000 $000 $000 $000 $000
Cash and cash equivalents 22,442 22,442 - - - - - Restricted cash and cash equivalents 18,356 18,356 - - - - - Receivables (a) 10,462 5,238 2,386 2,281 557 - - Amounts receivable for services 186,301 186,301 - - - - -
237,561 232,337 2,386 2,281 557 - -
(a) The amount of receivables excludes the GST recoverable from ATO (statutory receivable)
Carrying amount
The following table discloses the Health Service’s maximum exposure to credit risk and the ageing analysis of financial assets. The Health Service’s maximumexposure to credit risk at the end of the reporting period is the carrying amount of financial assets as shown below. The table discloses the ageing of financialassets that are past due but not impaired and impaired financial assets.
Ageing analysis of financial assets
Past due but not impaired
The Health Service does not hold any collateral as security or other credit enhancements relating to the financial assets it holds.
Not past due and
not impaired
1 - 3 months
3 - 12 months
Financial instrument disclosures
2017
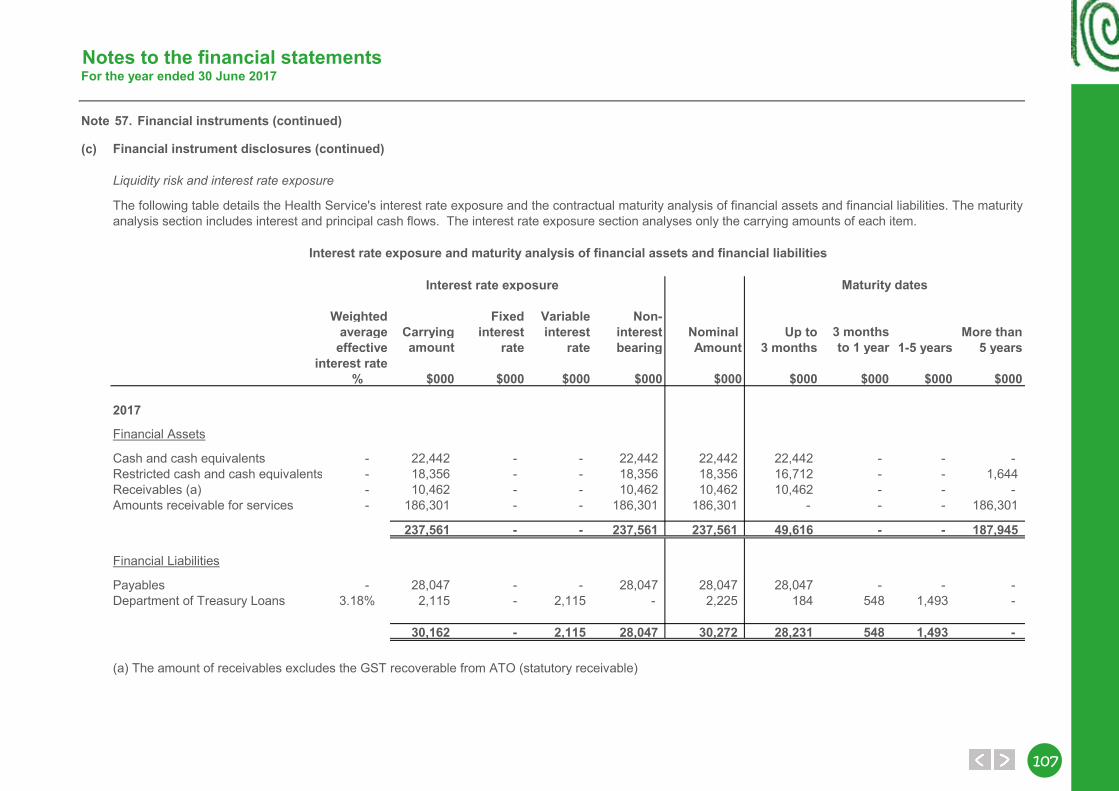
107107
Notes to the financial statementsFor the year ended 30 June 2017
Note 57. Financial instruments (continued)
(c)
Liquidity risk and interest rate exposure
Interest rate exposure
Weighted Fixed Variable Non-average Carrying interest interest interest Nominal Up to 3 months More than
effective amount rate rate bearing Amount 3 months to 1 year 1-5 years 5 yearsinterest rate
% $000 $000 $000 $000 $000 $000 $000 $000 $000
Financial Assets
Cash and cash equivalents - 22,442 - - 22,442 22,442 22,442 - - - Restricted cash and cash equivalents - 18,356 - - 18,356 18,356 16,712 - - 1,644Receivables (a) - 10,462 - - 10,462 10,462 10,462 - - - Amounts receivable for services - 186,301 - - 186,301 186,301 - - - 186,301
237,561 - - 237,561 237,561 49,616 - - 187,945
Financial Liabilities
Payables - 28,047 - - 28,047 28,047 28,047 - - - Department of Treasury Loans 3.18% 2,115 - 2,115 - 2,225 184 548 1,493 -
30,162 - 2,115 28,047 30,272 28,231 548 1,493 -
(a) The amount of receivables excludes the GST recoverable from ATO (statutory receivable)
Interest rate exposure and maturity analysis of financial assets and financial liabilities
Financial instrument disclosures (continued)
The following table details the Health Service's interest rate exposure and the contractual maturity analysis of financial assets and financial liabilities. The maturityanalysis section includes interest and principal cash flows. The interest rate exposure section analyses only the carrying amounts of each item.
2017
Maturity dates
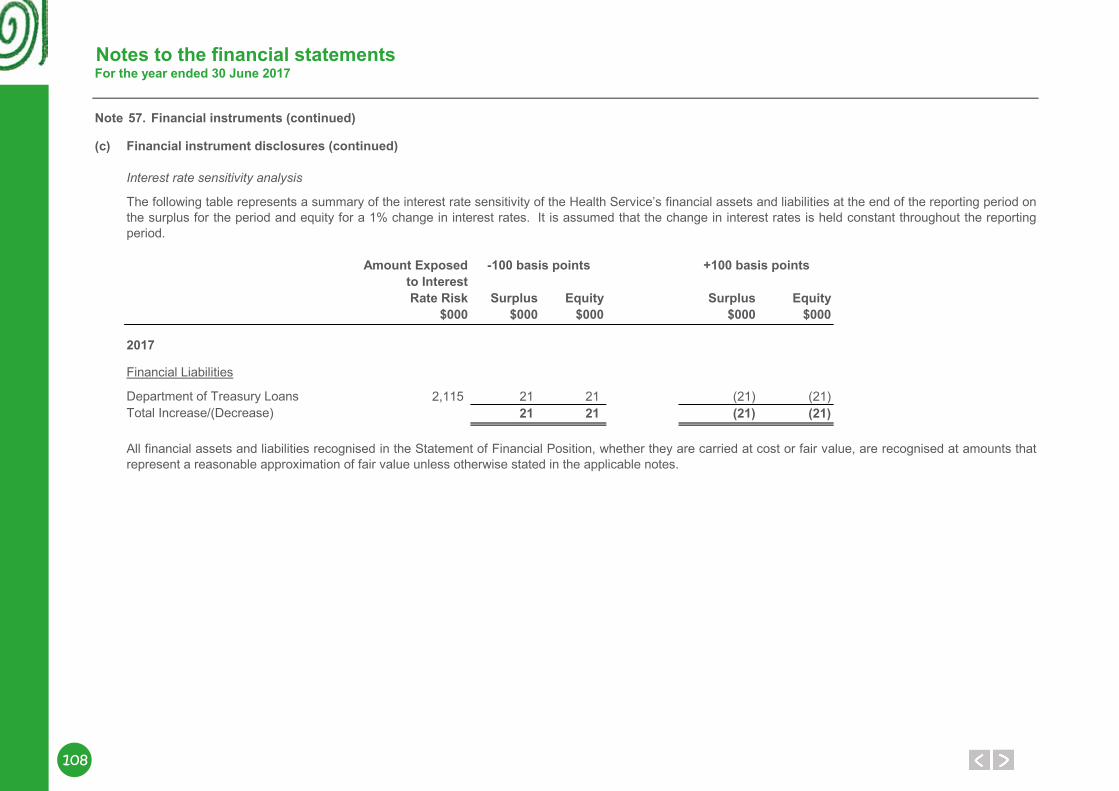
108
Notes to the financial statementsFor the year ended 30 June 2017
Note 57. Financial instruments (continued)
(c)
Interest rate sensitivity analysis
Amount Exposed -100 basis points +100 basis pointsto Interest Rate Risk Surplus Equity Surplus Equity
$000 $000 $000 $000 $000
Financial Liabilities
2,115 21 21 (21) (21)Total Increase/(Decrease) 21 21 (21) (21)Department of Treasury Loans
All financial assets and liabilities recognised in the Statement of Financial Position, whether they are carried at cost or fair value, are recognised at amounts thatrepresent a reasonable approximation of fair value unless otherwise stated in the applicable notes.
2017
Financial instrument disclosures (continued)
The following table represents a summary of the interest rate sensitivity of the Health Service’s financial assets and liabilities at the end of the reporting period onthe surplus for the period and equity for a 1% change in interest rates. It is assumed that the change in interest rates is held constant throughout the reportingperiod.
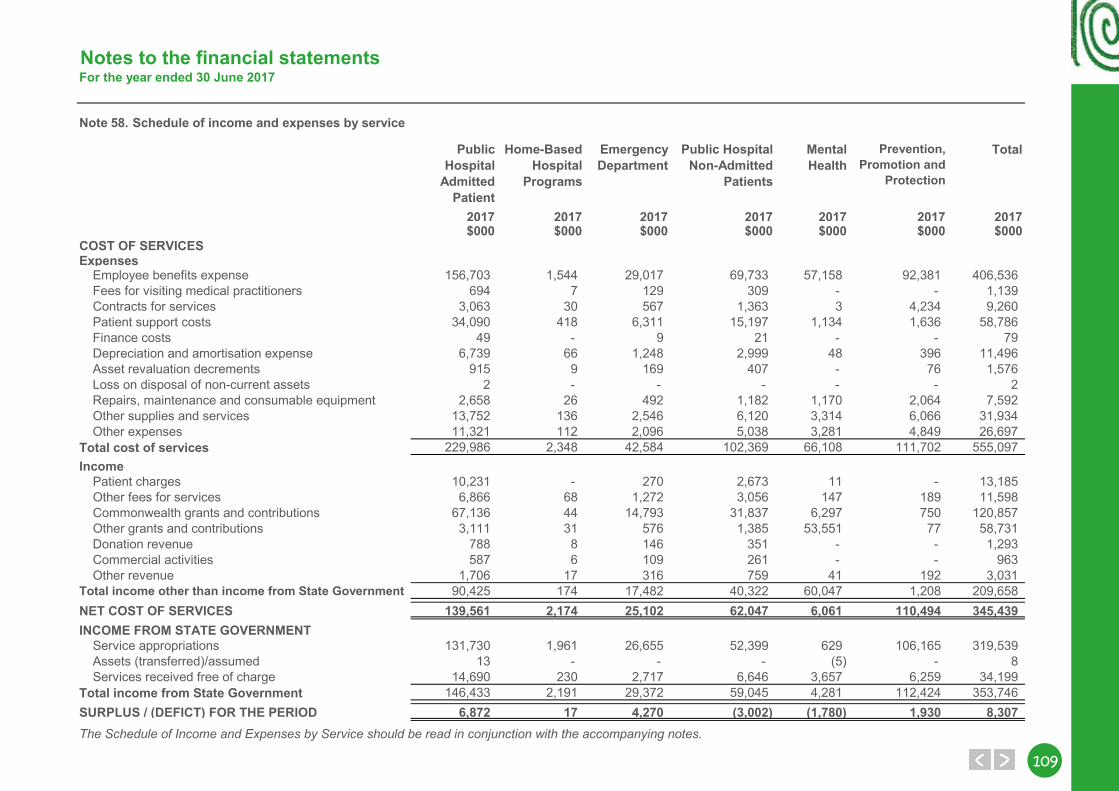
109109
Notes to the financial statementsFor the year ended 30 June 2017
58. Schedule of income and expenses by service
Public Hospital
Admitted Patient
Home-Based Hospital
Programs
Emergency Department
Public HospitalNon-Admitted
Patients
Mental Health
Prevention, Promotion and
Protection
Total
2017 2017 2017 2017 2017 2017 2017$000 $000 $000 $000 $000 $000 $000
COST OF SERVICESExpenses
Employee benefits expense 156,703 1,544 29,017 69,733 57,158 92,381 406,536Fees for visiting medical practitioners 694 7 129 309 - - 1,139Contracts for services 3,063 30 567 1,363 3 4,234 9,260Patient support costs 34,090 418 6,311 15,197 1,134 1,636 58,786Finance costs 49 - 9 21 - - 79Depreciation and amortisation expense 6,739 66 1,248 2,999 48 396 11,496Asset revaluation decrements 915 9 169 407 - 76 1,576Loss on disposal of non-current assets 2 - - - - - 2Repairs, maintenance and consumable equipment 2,658 26 492 1,182 1,170 2,064 7,592Other supplies and services 13,752 136 2,546 6,120 3,314 6,066 31,934Other expenses 11,321 112 2,096 5,038 3,281 4,849 26,697
Total cost of services 229,986 2,348 42,584 102,369 66,108 111,702 555,097Income
Patient charges 10,231 - 270 2,673 11 - 13,185Other fees for services 6,866 68 1,272 3,056 147 189 11,598Commonwealth grants and contributions 67,136 44 14,793 31,837 6,297 750 120,857Other grants and contributions 3,111 31 576 1,385 53,551 77 58,731Donation revenue 788 8 146 351 - - 1,293Commercial activities 587 6 109 261 - - 963Other revenue 1,706 17 316 759 41 192 3,031
Total income other than income from State Government 90,425 174 17,482 40,322 60,047 1,208 209,658NET COST OF SERVICES 139,561 2,174 25,102 62,047 6,061 110,494 345,439INCOME FROM STATE GOVERNMENT
Service appropriations 131,730 1,961 26,655 52,399 629 106,165 319,539Assets (transferred)/assumed 13 - - - (5) - 8Services received free of charge 14,690 230 2,717 6,646 3,657 6,259 34,199
Total income from State Government 146,433 2,191 29,372 59,045 4,281 112,424 353,746SURPLUS / (DEFICT) FOR THE PERIOD 6,872 17 4,270 (3,002) (1,780) 1,930 8,307The Schedule of Income and Expenses by Service should be read in conjunction with the accompanying notes.
Note
110
Key Performance Indicators
Key PerformanceIndicators
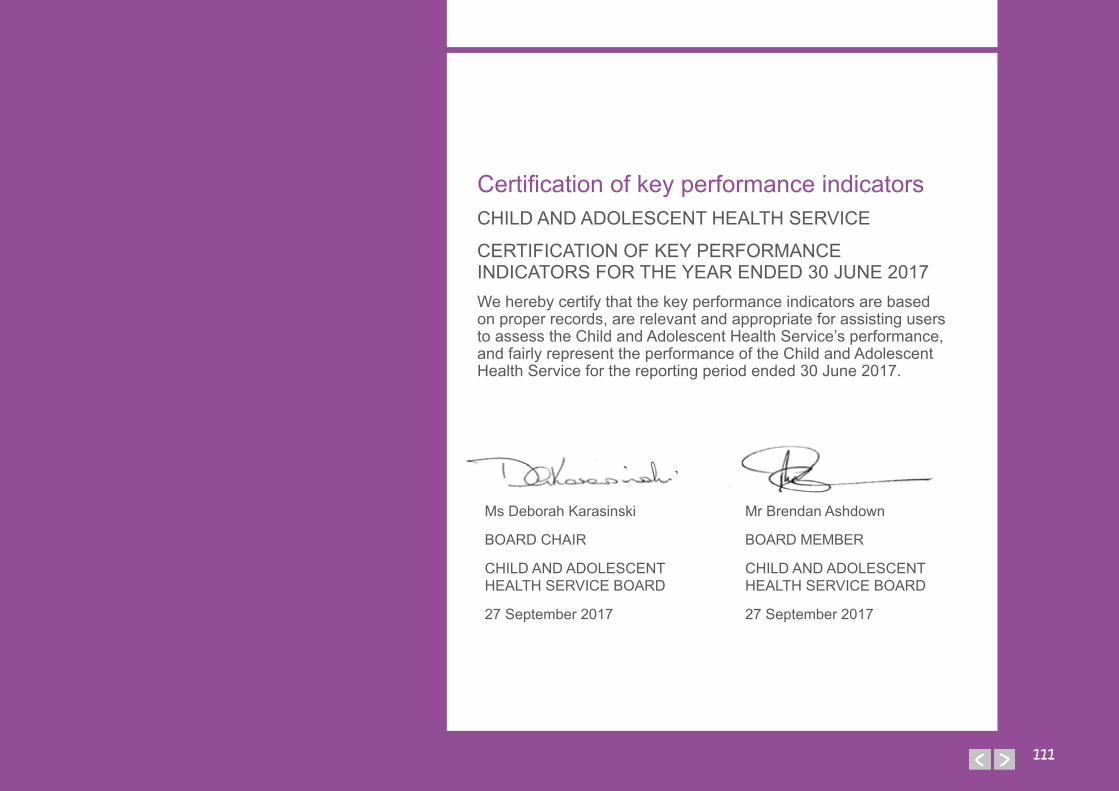
111111
Certification of key performance indicatorsCHILD AND ADOLESCENT HEALTH SERVICE
CERTIFICATION OF KEY PERFORMANCE INDICATORS FOR THE YEAR ENDED 30 JUNE 2017We hereby certify that the key performance indicators are based on proper records, are relevant and appropriate for assisting users to assess the Child and Adolescent Health Service’s performance, and fairly represent the performance of the Child and Adolescent Health Service for the reporting period ended 30 June 2017.
111
Mr Brendan Ashdown
BOARD MEMBER
CHILD AND ADOLESCENT HEALTH SERVICE BOARD
27 September 2017
Ms Deborah Karasinski
BOARD CHAIR
CHILD AND ADOLESCENT HEALTH SERVICE BOARD
27 September 2017
112
KPIs measuring Outcome 1 Page
● Percentage of patients discharged to home after admitted hospital treatment
113
● Survival rates for sentinel conditions 114 ● Proportion of elective wait list patients waiting over boundary for
reportable procedures115
● Unplanned hospital readmissions within 28 days for selected surgical procedures
116
● Rate of unplanned readmissions within 28 days to the same hospital for a mental health condition
117
● Average cost per casemix adjusted separation for tertiary hospitals
118
● Average cost per home based hospital patient day 118 ● Average cost per emergency department attendance 119 ● Average cost per public patient non-admitted activity 119
KPIs measuring Outcome 2 Page
● Percentage of contacts with community-based public mental health non-admitted services within seven days prior to admission to a public mental health inpatient unit
120
● Percentage of contacts with community-based public mental health non-admitted services within seven days post discharge from public mental health inpatient units
121
● Average cost per capita of Population Health Units 122 ● Average cost per bed-day in specialised mental health inpatient
units122
● Average cost per three month period of care for community mental health
123
113113
Percentage of patients discharged to home after admitted hospital treatmentRationaleThe main goals of healthcare provision are to ensure that people receive appropriate evidenced-based health care without experiencing preventable harm and that effective partnerships are forged between consumers, healthcare providers and organisations. Through achieving improvements in the specific priority areas that these goals describe, hospitals can deliver safer and higher-quality care, better outcomes for patients and provide a more effective and efficient health system.
Measuring the number of patients discharged to home after hospital care allows for the monitoring of changes over time that can enable the identification of the priority areas for improvement. This in turn enables the determination of targeted interventions and health promotion strategies, aimed at ensuring optimal restoration of patients’ health.
TargetThe 2016 target is 99.8 per cent. Performance is demonstrated by a result that equals or exceeds the target.
ResultDuring 2016, a total of 99.8 per cent of Child and Adolescent Health Service patients were discharged home after receiving admitted hospital treatment (Table 4). This result is equal to the target.
Table 4: Percentage of patients discharged to home after admitted hospital treatment, 2016
Age group (years)
Discharged home
2016 (%) Target (%)
0–39 99.8 99.8Notes:1. The devolved governance structure for the WA health system enacted by the Health
Services Act 2016 took effect from 1 July 2016. For 2016, data is reported from 1 July to 31 December 2016.
2. The Child and Adolescent Health Service treats patients aged 0–17 years.Data source: Hospital Morbidity Data Collection.
Outcome 1 | Effectiveness KPI
"Thank you PMH for everything, I owe you guys my life :)"
114
Survival rates for sentinel conditionsRationaleHospital survival indicators should be used as screening tools, rather than being assumed to be definitively diagnostic of poor quality and/or safety.
This indicator measures a hospital's performance in relation to restoring the health of people who have suffered a sentinel condition-specifically a stroke or Acute Myocardial Infarction (AMI). For these conditions, a good recovery is more likely when there is early intervention and appropriate care on presentation to an emergency department and on admission to hospital.
These two conditions have been chosen as they are particularly significant for the health care of the community and are leading causes of death and hospitalisation in Australia.
Patient survival after being admitted for one of these two sentinel conditions can be affected by many factors that include the diagnosis, the treatment given or procedure performed, age, co-morbidities at the time of the admission and complications which may have developed while in hospital.
TargetThe 2016 target for each condition, by age group:
Age group (years)
Sentinel condition
Stroke (%) AMI (%)
0–49 95.3 99.5
Performance is demonstrated by a result that equals or exceeds the target.
ResultsThe Child and Adolescent Health Service recorded a 100 per cent survival rate for stroke in 2016 (Table 5). There is no result to report for acute myocardial infarction, as no patients with this condition were treated during 2016 (Table 6).
Table 5: Survival rate for stroke, by age group, 2016
Age group (years)
Stroke
2016 (%) Target (%)
0–49 100 95.3Notes:1. The devolved governance structure for the WA health system enacted by the Health
Services Act 2016 took effect from 1 July 2016. For 2016, data is reported from 1 July to 31 December 2016.
2. The Child and Adolescent Health Service treats patients aged 0–17 yearsData source: Hospital Morbidity Data Collection.
Table 6: Survival rate for acute myocardial infarction, by age group, 2016
Age group (years)
Acute Myocardial Infarction
2016 (%) Target (%)
0–49 N/A 99.5Notes:1. The devolved governance structure for the WA health system enacted by the Health
Services Act 2016 took effect from 1 July 2016. For 2016, data is reported from 1 July to 31 December 2016.
2. The Child and Adolescent Health Service treats patients aged 0–17 years.3. Result listed as N/A (not available) is due to zero cases having been treated.Data source: Hospital Morbidity Data Collection.
Outcome 1 | Effectiveness KPI
115115
Proportion of elective wait list patients waiting over boundary for reportable proceduresRationaleOn 1 April 2016, WA Health introduced a new state-wide performance target for the provision of elective services. The new target requires no patients (nil) on the elective waiting lists wait longer than the clinically recommended time for their procedure, according to their urgency category.
Reportable cases are defined as all waiting list cases that are not listed on the Elective Surgery Wait List Data Collection Commonwealth Non-Reportable Procedures list. This list is consistent with the Australian Institute of Health and Welfare (AIHW) excluded procedures list. It also includes additional procedure codes that are intended to better reflect the procedures identified in the AIHW excluded procedures list.
TargetThe 2016–17 target is 0 (nil) for all urgency categories. Performance is demonstrated by a result that equals the target.
ResultsIn 2016–17, only 0.4 per cent of Child and Adolescent Health Service Category 1 elective wait list patients were not treated within 30 days, and only 0.1 per cent of Category 2 patients were not treated within 90 days. For Category 3 patients, nearly all patients were treated within 365 days, as the result was 0.0 per cent being over boundary.
Table 7: Proportion of elective wait list patients waiting over boundary for reportable procedures, by urgency category, 2016–17
Urgency 2016–17 Over-boundary (%) Target (%)
Category 1 (≤30 days) 0.4 0Category 2 (≤90 days) 0.1 0Category 3 (≤365 days) 0.0 0
Notes: 1. The result is based on an average of weekly census data for the financial year.Data source: Elective Surgery Wait List Data Collection.
Outcome 1 | Effectiveness KPI
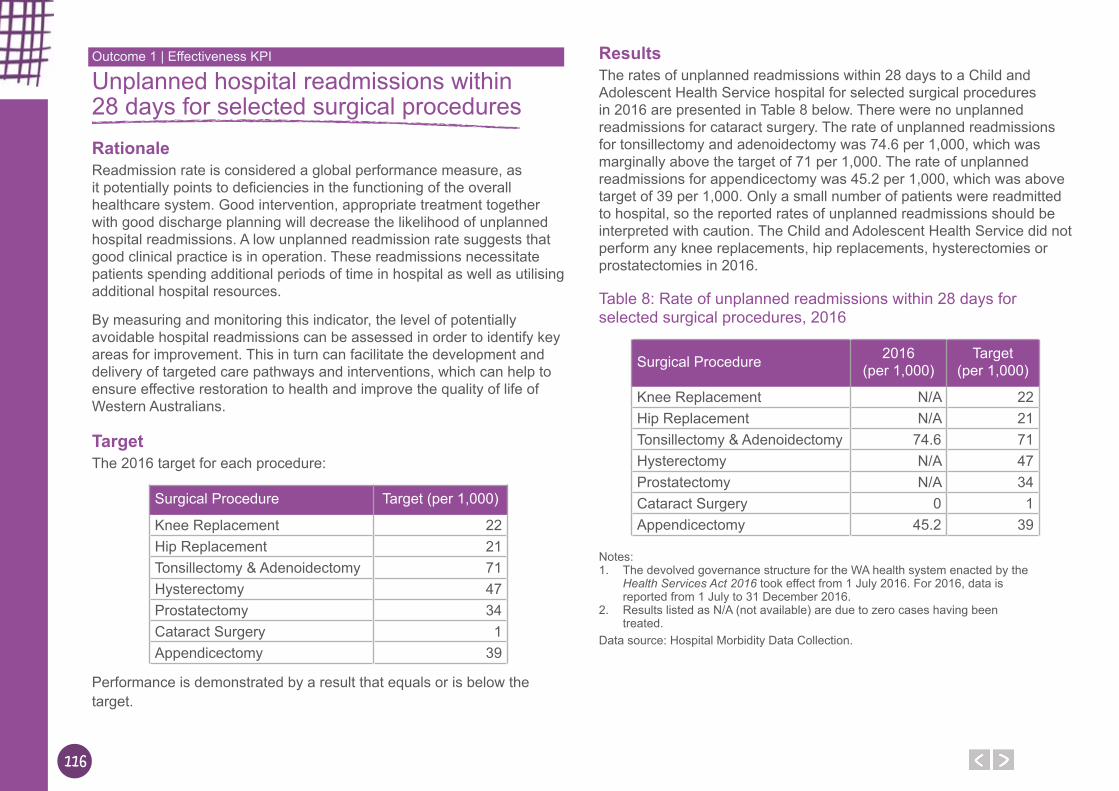
116
Unplanned hospital readmissions within 28 days for selected surgical proceduresRationaleReadmission rate is considered a global performance measure, as it potentially points to deficiencies in the functioning of the overall healthcare system. Good intervention, appropriate treatment together with good discharge planning will decrease the likelihood of unplanned hospital readmissions. A low unplanned readmission rate suggests that good clinical practice is in operation. These readmissions necessitate patients spending additional periods of time in hospital as well as utilising additional hospital resources.
By measuring and monitoring this indicator, the level of potentially avoidable hospital readmissions can be assessed in order to identify key areas for improvement. This in turn can facilitate the development and delivery of targeted care pathways and interventions, which can help to ensure effective restoration to health and improve the quality of life of Western Australians.
TargetThe 2016 target for each procedure:
Surgical Procedure Target (per 1,000)
Knee Replacement 22Hip Replacement 21Tonsillectomy & Adenoidectomy 71Hysterectomy 47Prostatectomy 34Cataract Surgery 1Appendicectomy 39
Performance is demonstrated by a result that equals or is below the target.
ResultsThe rates of unplanned readmissions within 28 days to a Child and Adolescent Health Service hospital for selected surgical procedures in 2016 are presented in Table 8 below. There were no unplanned readmissions for cataract surgery. The rate of unplanned readmissions for tonsillectomy and adenoidectomy was 74.6 per 1,000, which was marginally above the target of 71 per 1,000. The rate of unplanned readmissions for appendicectomy was 45.2 per 1,000, which was above target of 39 per 1,000. Only a small number of patients were readmitted to hospital, so the reported rates of unplanned readmissions should be interpreted with caution. The Child and Adolescent Health Service did not perform any knee replacements, hip replacements, hysterectomies or prostatectomies in 2016.
Table 8: Rate of unplanned readmissions within 28 days for selected surgical procedures, 2016
Surgical Procedure 2016 (per 1,000)
Target (per 1,000)
Knee Replacement N/A 22Hip Replacement N/A 21Tonsillectomy & Adenoidectomy 74.6 71Hysterectomy N/A 47Prostatectomy N/A 34Cataract Surgery 0 1Appendicectomy 45.2 39
Notes:1. The devolved governance structure for the WA health system enacted by the
Health Services Act 2016 took effect from 1 July 2016. For 2016, data is reported from 1 July to 31 December 2016.
2. Results listed as N/A (not available) are due to zero cases having been treated.
Data source: Hospital Morbidity Data Collection.
Outcome 1 | Effectiveness KPI
117117
Rate of unplanned readmissions within 28 days to the same hospital for a mental health conditionRationaleReadmission rate is considered a global performance measure because it potentially points to deficiencies in the functioning of the overall healthcare system. Admissions to a psychiatric facility following a recent discharge may indicate that inpatient treatment was incomplete or ineffective, or that follow-up care was inadequate to maintain the person out of hospital. These readmissions necessitate patients spending additional time in hospital and utilise additional hospital resources.
Good intervention and appropriate treatment together with good discharge planning will decrease the likelihood of unplanned hospital readmissions. A low unplanned readmission rate suggests that good clinical practice is in operation.
By measuring and monitoring this indicator, the level of potentially avoidable hospital readmissions for mental health patients can be assessed to identify key areas for improvement. This in turn can facilitate the development and delivery of targeted care pathways and interventions, which can aim to improve mental health and the quality of life of Western Australians.
For this indicator a sample period of three months is used, and relevant data is subjected to clinical review to ensure the accuracy of the readmission status – unplanned or otherwise.
TargetThe 2016 target is 66 unplanned readmissions per 1,000. Performance is demonstrated by a result that equals or is below the target.
ResultIn 2016, the rate of unplanned readmissions within 28 days to the same public hospital for a mental health condition was 18.6 per 1,000. This is below the target of 66 per 1,000 (Table 9).
Table 9: Rate of unplanned readmissions within 28 days to the same hospital relating to the previous mental health condition for which they were treated, 2016
2016 (per 1,000)
Target (per 1,000)
Unplanned readmissions 18.6 66Notes: 1. This indicator is based on a 3 month period each year. For 2016, data is reported
from 1 September to 30 November 2016.Data source: Hospital Morbidity Data Collection.
Outcome 1 | Effectiveness KPI
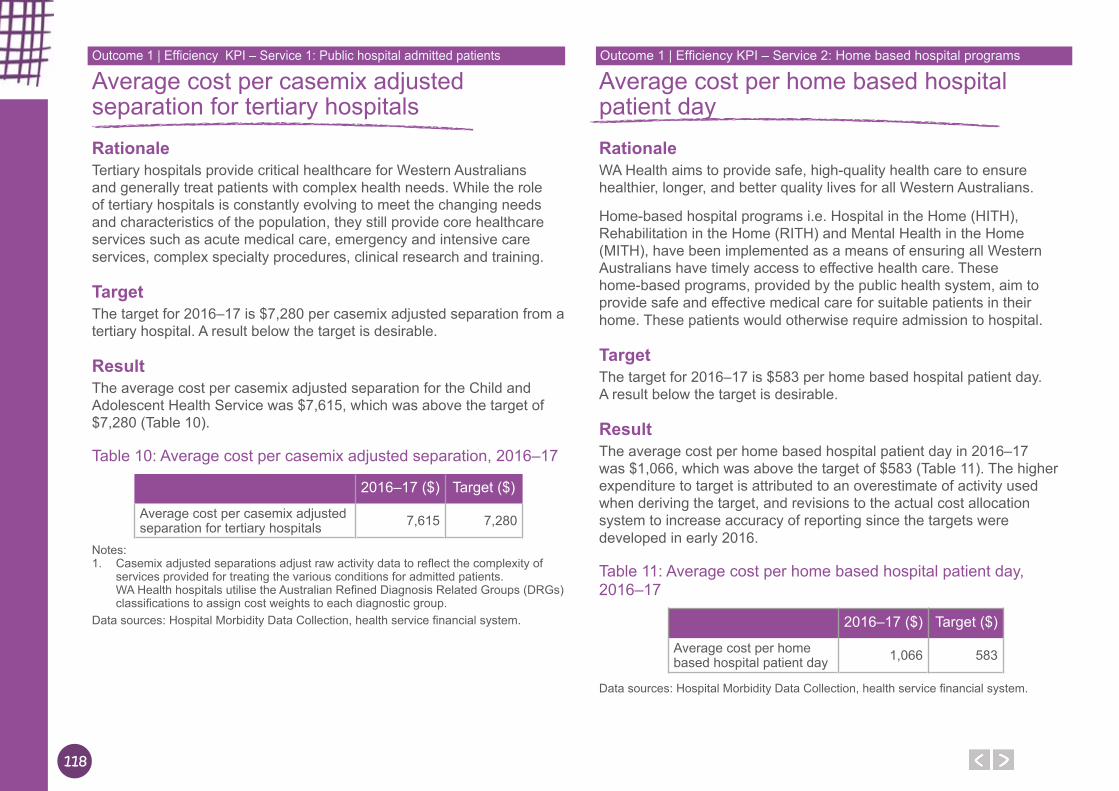
118
Average cost per casemix adjusted separation for tertiary hospitalsRationaleTertiary hospitals provide critical healthcare for Western Australians and generally treat patients with complex health needs. While the role of tertiary hospitals is constantly evolving to meet the changing needs and characteristics of the population, they still provide core healthcare services such as acute medical care, emergency and intensive care services, complex specialty procedures, clinical research and training.
TargetThe target for 2016–17 is $7,280 per casemix adjusted separation from a tertiary hospital. A result below the target is desirable.
ResultThe average cost per casemix adjusted separation for the Child and Adolescent Health Service was $7,615, which was above the target of $7,280 (Table 10).
Table 10: Average cost per casemix adjusted separation, 2016–17
2016–17 ($) Target ($)
Average cost per casemix adjusted separation for tertiary hospitals 7,615 7,280
Notes: 1. Casemix adjusted separations adjust raw activity data to reflect the complexity of
services provided for treating the various conditions for admitted patients. WA Health hospitals utilise the Australian Refined Diagnosis Related Groups (DRGs) classifications to assign cost weights to each diagnostic group.
Data sources: Hospital Morbidity Data Collection, health service financial system.
Average cost per home based hospital patient dayRationaleWA Health aims to provide safe, high-quality health care to ensure healthier, longer, and better quality lives for all Western Australians.
Home-based hospital programs i.e. Hospital in the Home (HITH), Rehabilitation in the Home (RITH) and Mental Health in the Home (MITH), have been implemented as a means of ensuring all Western Australians have timely access to effective health care. These home-based programs, provided by the public health system, aim to provide safe and effective medical care for suitable patients in their home. These patients would otherwise require admission to hospital.
TargetThe target for 2016–17 is $583 per home based hospital patient day. A result below the target is desirable.
ResultThe average cost per home based hospital patient day in 2016–17 was $1,066, which was above the target of $583 (Table 11). The higher expenditure to target is attributed to an overestimate of activity used when deriving the target, and revisions to the actual cost allocation system to increase accuracy of reporting since the targets were developed in early 2016.
Table 11: Average cost per home based hospital patient day, 2016–17
2016–17 ($) Target ($)
Average cost per home based hospital patient day 1,066 583
Data sources: Hospital Morbidity Data Collection, health service financial system.
Outcome 1 | Efficiency KPI – Service 1: Public hospital admitted patients Outcome 1 | Efficiency KPI – Service 2: Home based hospital programs
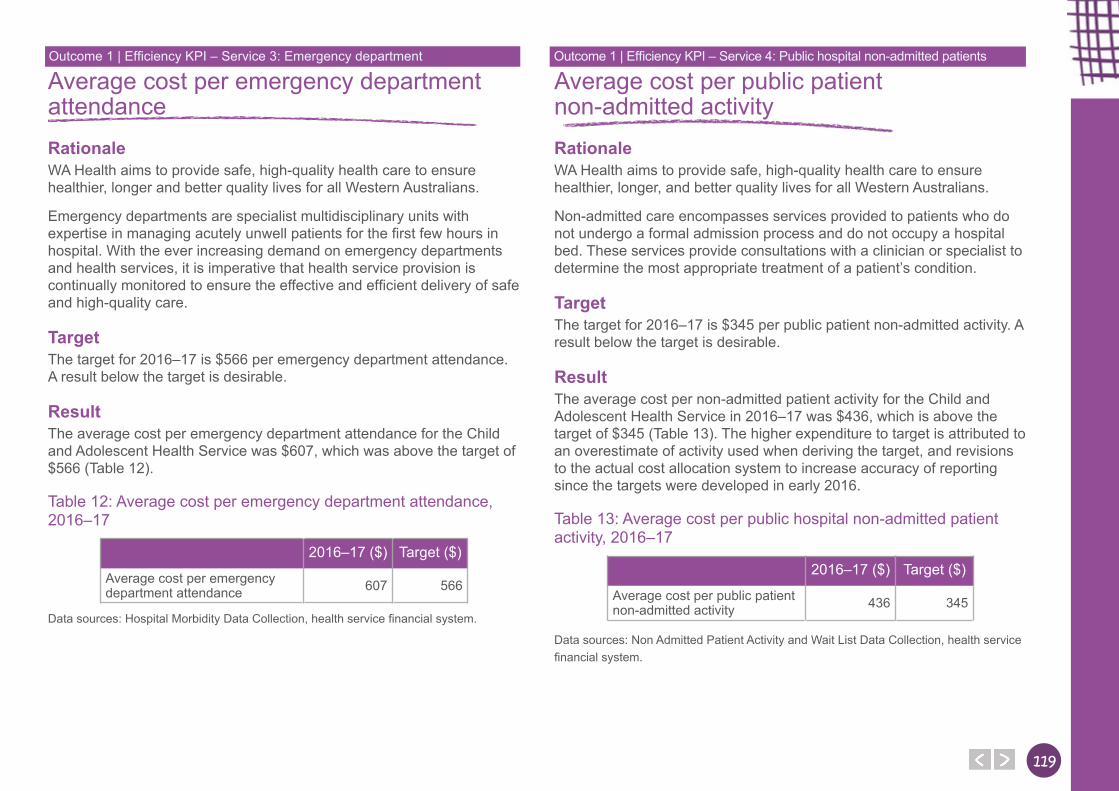
119119
Average cost per emergency department attendanceRationaleWA Health aims to provide safe, high-quality health care to ensure healthier, longer and better quality lives for all Western Australians.
Emergency departments are specialist multidisciplinary units with expertise in managing acutely unwell patients for the first few hours in hospital. With the ever increasing demand on emergency departments and health services, it is imperative that health service provision is continually monitored to ensure the effective and efficient delivery of safe and high-quality care.
TargetThe target for 2016–17 is $566 per emergency department attendance. A result below the target is desirable.
ResultThe average cost per emergency department attendance for the Child and Adolescent Health Service was $607, which was above the target of $566 (Table 12).
Table 12: Average cost per emergency department attendance, 2016–17
2016–17 ($) Target ($)
Average cost per emergency department attendance 607 566
Data sources: Hospital Morbidity Data Collection, health service financial system.
Average cost per public patient non-admitted activityRationaleWA Health aims to provide safe, high-quality health care to ensure healthier, longer, and better quality lives for all Western Australians.
Non-admitted care encompasses services provided to patients who do not undergo a formal admission process and do not occupy a hospital bed. These services provide consultations with a clinician or specialist to determine the most appropriate treatment of a patient’s condition.
TargetThe target for 2016–17 is $345 per public patient non-admitted activity. A result below the target is desirable.
ResultThe average cost per non-admitted patient activity for the Child and Adolescent Health Service in 2016–17 was $436, which is above the target of $345 (Table 13). The higher expenditure to target is attributed to an overestimate of activity used when deriving the target, and revisions to the actual cost allocation system to increase accuracy of reporting since the targets were developed in early 2016.
Table 13: Average cost per public hospital non-admitted patient activity, 2016–17
2016–17 ($) Target ($)
Average cost per public patient non-admitted activity 436 345
Data sources: Non Admitted Patient Activity and Wait List Data Collection, health service financial system.
Outcome 1 | Efficiency KPI – Service 3: Emergency department Outcome 1 | Efficiency KPI – Service 4: Public hospital non-admitted patients
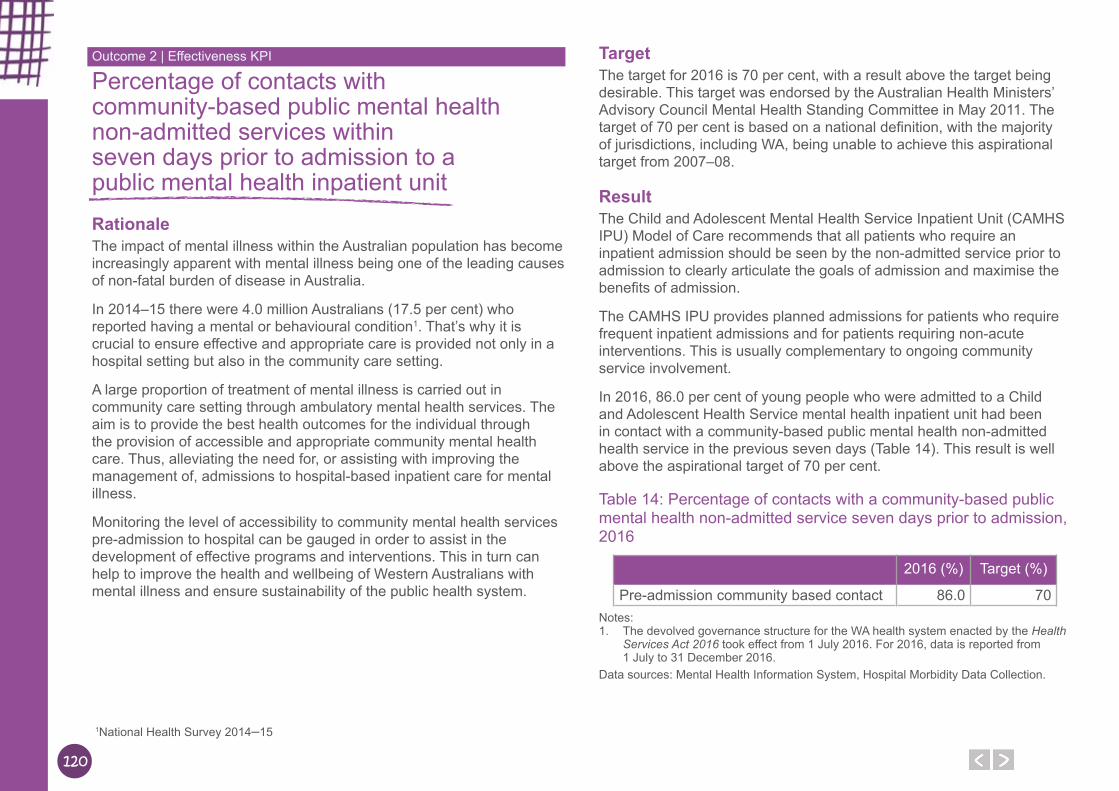
120
Percentage of contacts with community-based public mental health non-admitted services within seven days prior to admission to a public mental health inpatient unitRationaleThe impact of mental illness within the Australian population has become increasingly apparent with mental illness being one of the leading causes of non-fatal burden of disease in Australia.
In 2014–15 there were 4.0 million Australians (17.5 per cent) who reported having a mental or behavioural condition1. That’s why it is crucial to ensure effective and appropriate care is provided not only in a hospital setting but also in the community care setting.
A large proportion of treatment of mental illness is carried out in community care setting through ambulatory mental health services. The aim is to provide the best health outcomes for the individual through the provision of accessible and appropriate community mental health care. Thus, alleviating the need for, or assisting with improving the management of, admissions to hospital-based inpatient care for mental illness.
Monitoring the level of accessibility to community mental health services pre-admission to hospital can be gauged in order to assist in the development of effective programs and interventions. This in turn can help to improve the health and wellbeing of Western Australians with mental illness and ensure sustainability of the public health system.
TargetThe target for 2016 is 70 per cent, with a result above the target being desirable. This target was endorsed by the Australian Health Ministers’ Advisory Council Mental Health Standing Committee in May 2011. The target of 70 per cent is based on a national definition, with the majority of jurisdictions, including WA, being unable to achieve this aspirational target from 2007–08.
ResultThe Child and Adolescent Mental Health Service Inpatient Unit (CAMHS IPU) Model of Care recommends that all patients who require an inpatient admission should be seen by the non-admitted service prior to admission to clearly articulate the goals of admission and maximise the benefits of admission.
The CAMHS IPU provides planned admissions for patients who require frequent inpatient admissions and for patients requiring non-acute interventions. This is usually complementary to ongoing community service involvement.
In 2016, 86.0 per cent of young people who were admitted to a Child and Adolescent Health Service mental health inpatient unit had been in contact with a community-based public mental health non-admitted health service in the previous seven days (Table 14). This result is well above the aspirational target of 70 per cent.
Table 14: Percentage of contacts with a community-based public mental health non-admitted service seven days prior to admission, 2016
2016 (%) Target (%)
Pre-admission community based contact 86.0 70Notes: 1. The devolved governance structure for the WA health system enacted by the Health
Services Act 2016 took effect from 1 July 2016. For 2016, data is reported from 1 July to 31 December 2016.
Data sources: Mental Health Information System, Hospital Morbidity Data Collection.
Outcome 2 | Effectiveness KPI
1National Health Survey 2014–15
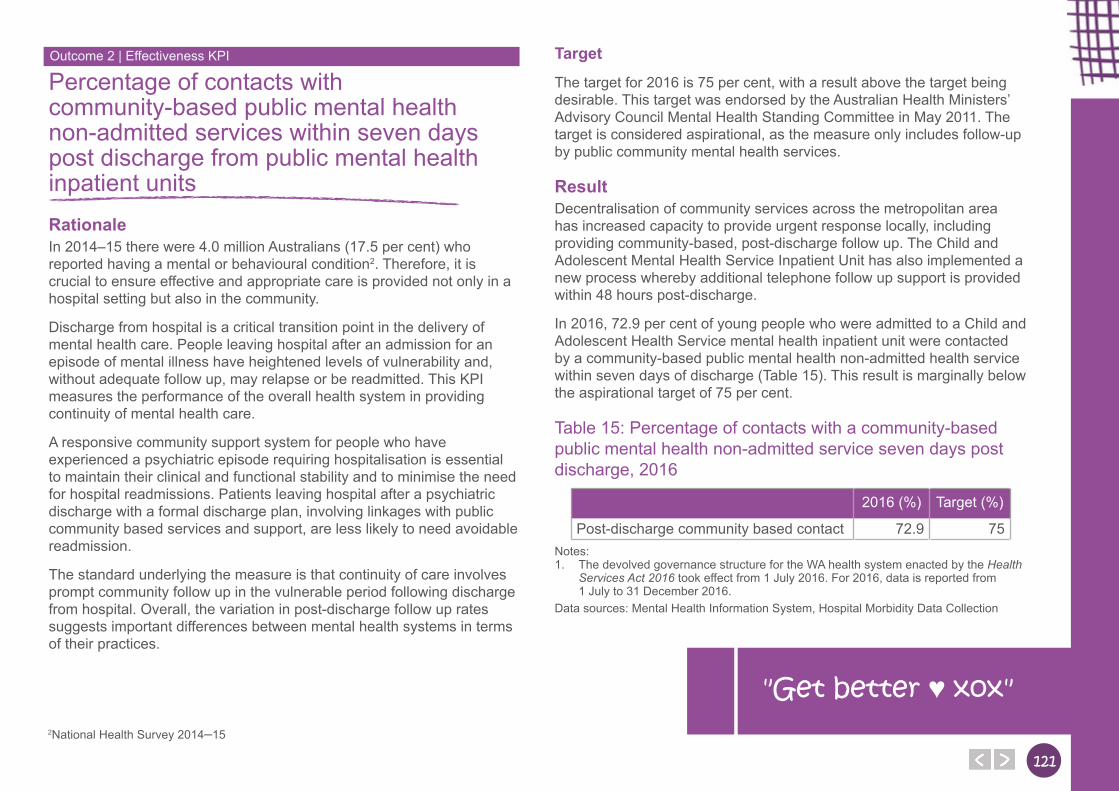
121121
Percentage of contacts with community-based public mental health non-admitted services within seven days post discharge from public mental health inpatient unitsRationaleIn 2014–15 there were 4.0 million Australians (17.5 per cent) who reported having a mental or behavioural condition2. Therefore, it is crucial to ensure effective and appropriate care is provided not only in a hospital setting but also in the community.
Discharge from hospital is a critical transition point in the delivery of mental health care. People leaving hospital after an admission for an episode of mental illness have heightened levels of vulnerability and, without adequate follow up, may relapse or be readmitted. This KPI measures the performance of the overall health system in providing continuity of mental health care.
A responsive community support system for people who have experienced a psychiatric episode requiring hospitalisation is essential to maintain their clinical and functional stability and to minimise the need for hospital readmissions. Patients leaving hospital after a psychiatric discharge with a formal discharge plan, involving linkages with public community based services and support, are less likely to need avoidable readmission.
The standard underlying the measure is that continuity of care involves prompt community follow up in the vulnerable period following discharge from hospital. Overall, the variation in post-discharge follow up rates suggests important differences between mental health systems in terms of their practices.
Target
The target for 2016 is 75 per cent, with a result above the target being desirable. This target was endorsed by the Australian Health Ministers’ Advisory Council Mental Health Standing Committee in May 2011. The target is considered aspirational, as the measure only includes follow-up by public community mental health services.
ResultDecentralisation of community services across the metropolitan area has increased capacity to provide urgent response locally, including providing community-based, post-discharge follow up. The Child and Adolescent Mental Health Service Inpatient Unit has also implemented a new process whereby additional telephone follow up support is provided within 48 hours post-discharge.
In 2016, 72.9 per cent of young people who were admitted to a Child and Adolescent Health Service mental health inpatient unit were contacted by a community-based public mental health non-admitted health service within seven days of discharge (Table 15). This result is marginally below the aspirational target of 75 per cent.
Table 15: Percentage of contacts with a community-based public mental health non-admitted service seven days post discharge, 2016
2016 (%) Target (%)
Post-discharge community based contact 72.9 75Notes: 1. The devolved governance structure for the WA health system enacted by the Health
Services Act 2016 took effect from 1 July 2016. For 2016, data is reported from 1 July to 31 December 2016.
Data sources: Mental Health Information System, Hospital Morbidity Data Collection
Outcome 2 | Effectiveness KPI
2National Health Survey 2014–15
"Get better ♥ xox"
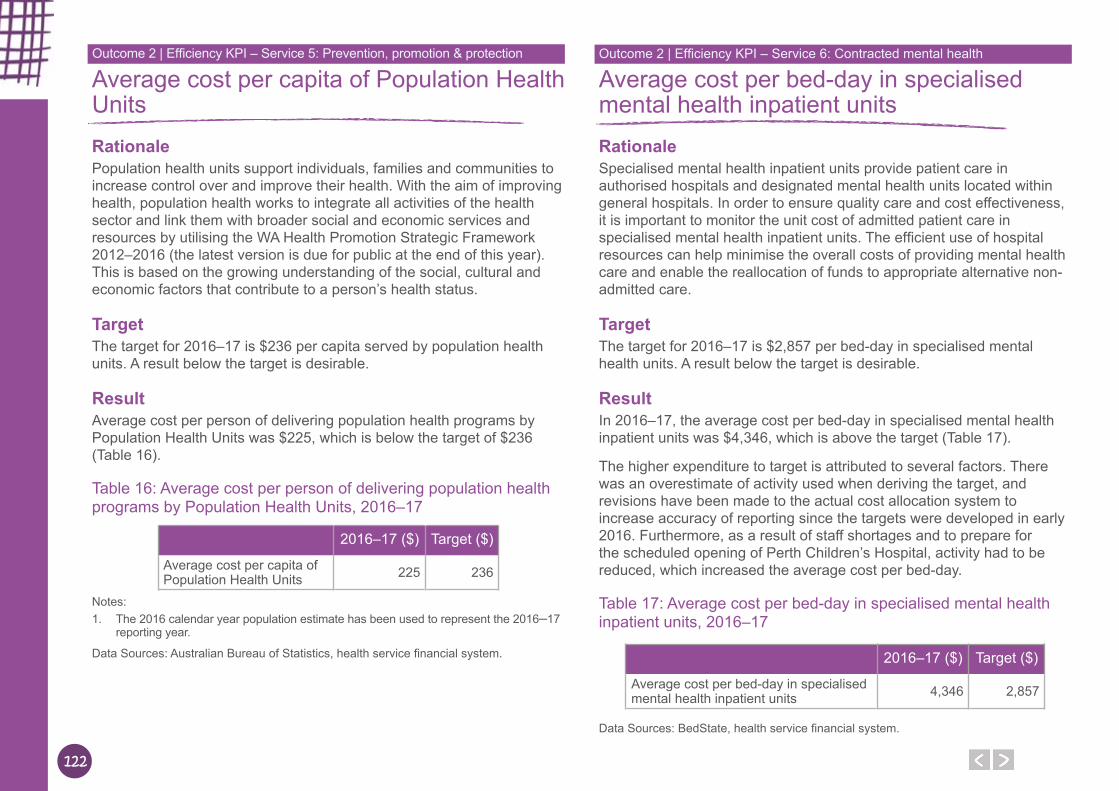
122
Average cost per capita of Population Health UnitsRationalePopulation health units support individuals, families and communities to increase control over and improve their health. With the aim of improving health, population health works to integrate all activities of the health sector and link them with broader social and economic services and resources by utilising the WA Health Promotion Strategic Framework 2012–2016 (the latest version is due for public at the end of this year). This is based on the growing understanding of the social, cultural and economic factors that contribute to a person’s health status.
TargetThe target for 2016–17 is $236 per capita served by population health units. A result below the target is desirable.
ResultAverage cost per person of delivering population health programs by Population Health Units was $225, which is below the target of $236 (Table 16).
Table 16: Average cost per person of delivering population health programs by Population Health Units, 2016–17
2016–17 ($) Target ($)
Average cost per capita of Population Health Units 225 236
Notes: 1. The 2016 calendar year population estimate has been used to represent the 2016–17
reporting year.
Data Sources: Australian Bureau of Statistics, health service financial system.
Average cost per bed-day in specialised mental health inpatient unitsRationaleSpecialised mental health inpatient units provide patient care in authorised hospitals and designated mental health units located within general hospitals. In order to ensure quality care and cost effectiveness, it is important to monitor the unit cost of admitted patient care in specialised mental health inpatient units. The efficient use of hospital resources can help minimise the overall costs of providing mental health care and enable the reallocation of funds to appropriate alternative non-admitted care.
TargetThe target for 2016–17 is $2,857 per bed-day in specialised mental health units. A result below the target is desirable.
ResultIn 2016–17, the average cost per bed-day in specialised mental health inpatient units was $4,346, which is above the target (Table 17).
The higher expenditure to target is attributed to several factors. There was an overestimate of activity used when deriving the target, and revisions have been made to the actual cost allocation system to increase accuracy of reporting since the targets were developed in early 2016. Furthermore, as a result of staff shortages and to prepare for the scheduled opening of Perth Children’s Hospital, activity had to be reduced, which increased the average cost per bed-day.
Table 17: Average cost per bed-day in specialised mental health inpatient units, 2016–17
2016–17 ($) Target ($)
Average cost per bed-day in specialised mental health inpatient units 4,346 2,857
Data Sources: BedState, health service financial system.
Outcome 2 | Efficiency KPI – Service 5: Prevention, promotion & protection Outcome 2 | Efficiency KPI – Service 6: Contracted mental health
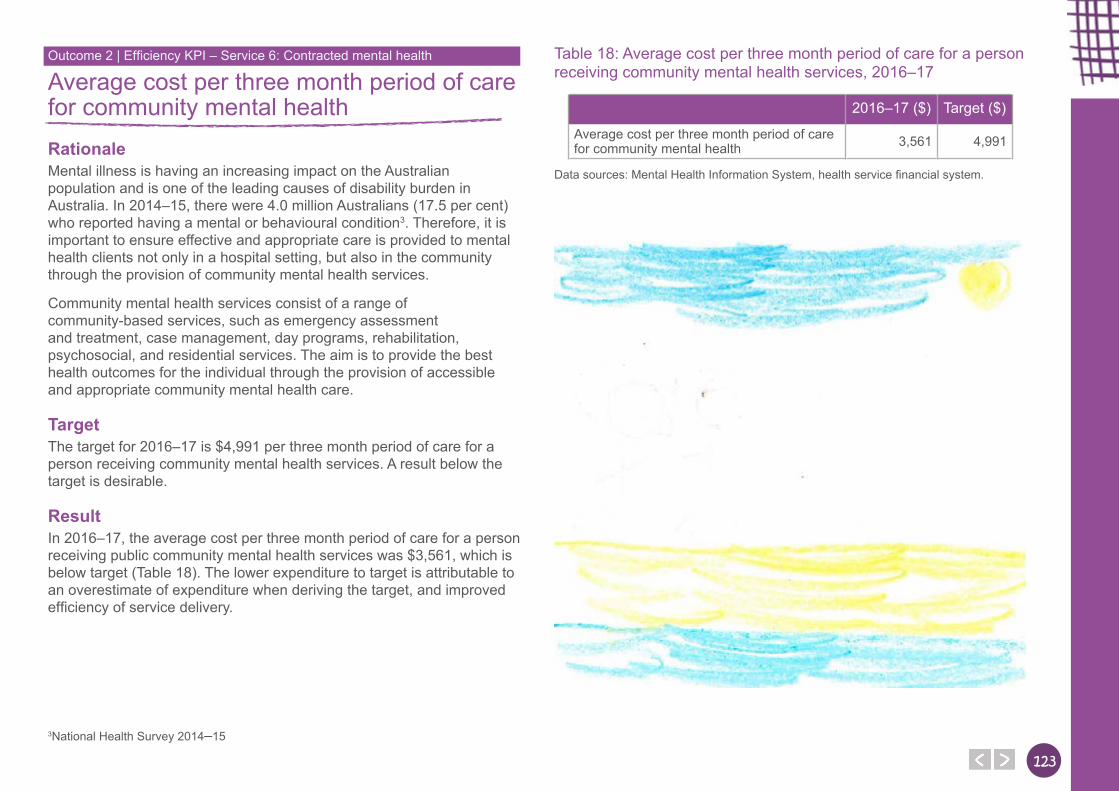
123123
Average cost per three month period of care for community mental healthRationaleMental illness is having an increasing impact on the Australian population and is one of the leading causes of disability burden in Australia. In 2014–15, there were 4.0 million Australians (17.5 per cent) who reported having a mental or behavioural condition3. Therefore, it is important to ensure effective and appropriate care is provided to mental health clients not only in a hospital setting, but also in the community through the provision of community mental health services.
Community mental health services consist of a range of community-based services, such as emergency assessment and treatment, case management, day programs, rehabilitation, psychosocial, and residential services. The aim is to provide the best health outcomes for the individual through the provision of accessible and appropriate community mental health care.
TargetThe target for 2016–17 is $4,991 per three month period of care for a person receiving community mental health services. A result below the target is desirable.
ResultIn 2016–17, the average cost per three month period of care for a person receiving public community mental health services was $3,561, which is below target (Table 18). The lower expenditure to target is attributable to an overestimate of expenditure when deriving the target, and improved efficiency of service delivery.
Table 18: Average cost per three month period of care for a person receiving community mental health services, 2016–17
2016–17 ($) Target ($)
Average cost per three month period of care for community mental health 3,561 4,991
Data sources: Mental Health Information System, health service financial system.
Outcome 2 | Efficiency KPI – Service 6: Contracted mental health
3National Health Survey 2014–15
124
Other Financial Disclosures
Other FinancialDisclosures
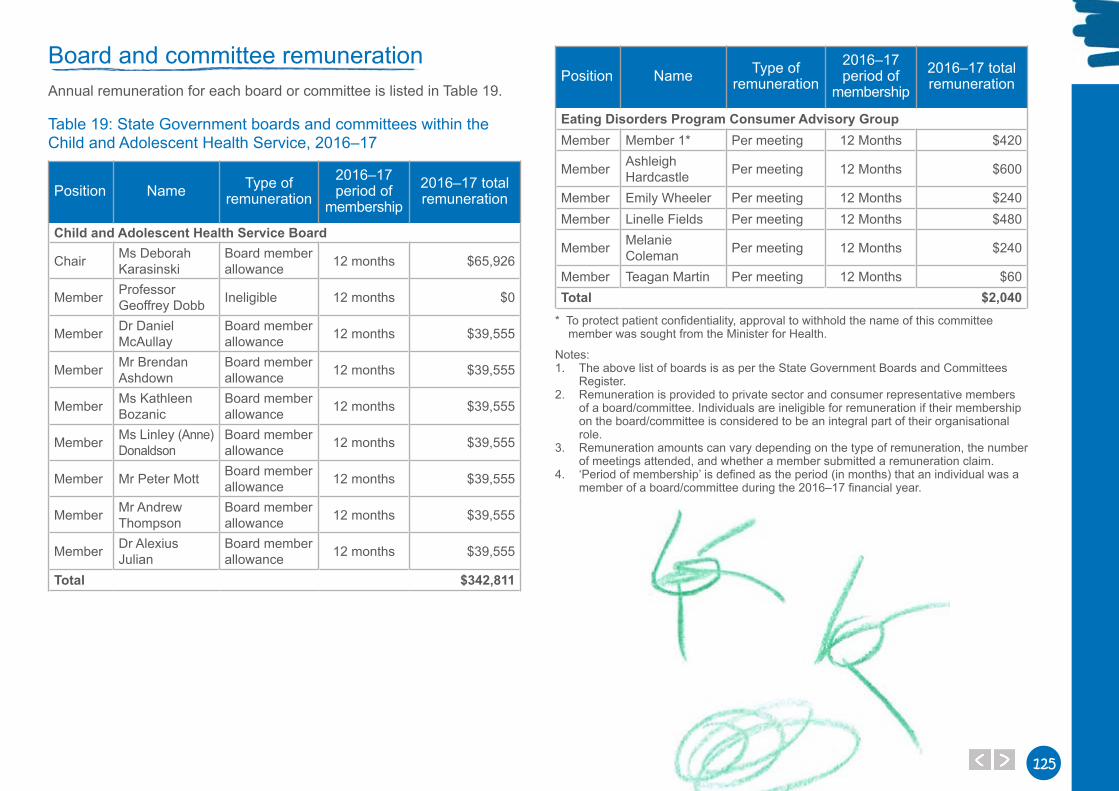
125125
Board and committee remunerationAnnual remuneration for each board or committee is listed in Table 19.
Table 19: State Government boards and committees within the Child and Adolescent Health Service, 2016–17
Position Name Type of remuneration
2016–17 period of
membership2016–17 total remuneration
Child and Adolescent Health Service Board
Chair Ms Deborah Karasinski
Board member allowance 12 months $65,926
Member Professor Geoffrey Dobb Ineligible 12 months $0
Member Dr Daniel McAullay
Board member allowance 12 months $39,555
Member Mr Brendan Ashdown
Board member allowance 12 months $39,555
Member Ms Kathleen Bozanic
Board member allowance 12 months $39,555
Member Ms Linley (Anne) Donaldson
Board member allowance 12 months $39,555
Member Mr Peter Mott Board member allowance 12 months $39,555
Member Mr Andrew Thompson
Board member allowance 12 months $39,555
Member Dr Alexius Julian
Board member allowance 12 months $39,555
Total $342,811
Position Name Type of remuneration
2016–17 period of
membership2016–17 total remuneration
Eating Disorders Program Consumer Advisory GroupMember Member 1* Per meeting 12 Months $420
Member Ashleigh Hardcastle Per meeting 12 Months $600
Member Emily Wheeler Per meeting 12 Months $240Member Linelle Fields Per meeting 12 Months $480
Member Melanie Coleman Per meeting 12 Months $240
Member Teagan Martin Per meeting 12 Months $60Total $2,040
* To protect patient confidentiality, approval to withhold the name of this committee member was sought from the Minister for Health.
Notes: 1. The above list of boards is as per the State Government Boards and Committees
Register. 2. Remuneration is provided to private sector and consumer representative members
of a board/committee. Individuals are ineligible for remuneration if their membership on the board/committee is considered to be an integral part of their organisational role.
3. Remuneration amounts can vary depending on the type of remuneration, the number of meetings attended, and whether a member submitted a remuneration claim.
4. ‘Period of membership’ is defined as the period (in months) that an individual was a member of a board/committee during the 2016–17 financial year.
126
Pricing policyThe National Health Reform Agreement 2011 sets the policy framework for the charging of public hospital fees and charges. Under the Agreement, an eligible person who receives public hospital services as a public patient in a public hospital or a publicly contracted bed in a private hospital is treated ‘free of charge’. This arrangement is consistent with the Medicare principles that are embedded in the National Health Reform Agreement.
The majority of hospital fees and charges for public hospitals are set under the Health Services (Fees and Charges) Order 2016 and the WA Health Fees and Charges Manual 2017/18, as established under the policy frameworks under the Health Services Act 2016, and are reviewed annually. These set WA public hospital patient fees and charges for:
● Compensable or ineligible patientsPatients who are either ‘private’ or ‘compensable’ and Medicare ineligible (overseas visitors, residents and students) may be charged an amount for public hospital services as determined by the State. Compensable and ineligible hospital accommodation fees are set at an appropriate recovery rate by the Department of Health.
● Private patients (Medicare eligible Australian residents)The Commonwealth Department of Health regulates the Minimum Benefit payable by health funds to privately insured patients for private shared ward and same day accommodation. To achieve consistency with the Commonwealth Private Health Insurance Act 2007, the State sets these fees at a level equivalent to the Commonwealth Minimum Benefit.
● VeteransHospital charges of eligible war service veterans or dependents are determined under a separate Commonwealth-State agreement with the Department of Veterans’ Affairs. Under this agreement, the Department of Health does not charge medical treatment to eligible patients. Instead, medical charges are fully recouped from the Department of Veterans’ Affairs.
● Other Patient ChargesThe following fees and charges also apply:
○ The Pharmaceutical Benefits Scheme regulates and sets the price of pharmaceuticals supplied to outpatients, patients on discharge and for day admitted chemotherapy patients. Inpatient medications are supplied free of charge.
○ There are other categories of fees specified under the WA Health Fees and Charges Manual 2016–17, which include the supply of surgically implanted prostheses, orthoses, diagnostic imaging services and pathology services. The pricing for these hospital services is determined according to Commonwealth schedules and to their cost of service as applicable.
Capital worksThe WA health system has a substantial Asset Investment Program that facilitates re-modelling and development of health infrastructure. Program initiatives include the continuation of major projects to reconfigure metropolitan tertiary hospitals, equipment replacement and minor building works.
Please refer to Table 20 and to the Department of Health Annual Report 2016–17 for financial details of the Child and Adolescent Health (CAHS)capital works program.
Table 20: Major Asset Investment Program works completed in 2016–17
Initiative 2016–17
Equipment Replacement Program $723,834Minor Building Works $398,288Total $1,122,122
127127
Employment profileCAHS is required to report a summary of the number of employees, by category, compared with the preceding financial year.
The devolved governance structure for the WA health system enacted by the Health Services Act 2016 took effect from 1 July 2016, so comparative figures for CAHS are not available. Table 21 shows the number of Full-time Equivalent (FTE) employees for 2016–17.
Table 21: Total full-time employees of CAHS, by category
Category Definition 2016–17
Administration & clerical
Includes all clerical-based occupations together with patient-facing (ward) clerical support staff. 721.8
AgencyIncludes the following occupational categories: administration and clerical, medical support, hotel services, site services, medical salaried (excludes visiting medical practitioners) and medical sessional.
46.4
Agency nursing
Includes workers engaged on a ‘contract for service’ basis. Does not include workers employed by NurseWest.
5.4
Assistants in nursing
Support registered nurses and enrolled nurses in delivery of general patient care. 5.7
Dental nursing Includes dental nurses and dental clinic assistants. 5.8
Hotel services Includes catering, cleaning, stores/supply laundry and transport occupations. 149.0
Medical salaried
Includes all salary-based medical occupations including interns, registrars and specialist medical practitioners. 324.5
Medical sessional
Includes specialist medical practitioners that are engaged on a sessional basis. 65.6
Medical support
Includes all Allied Health and scientific/technical related occupations. 608.6
Nursing Includes all nursing occupations. Does not include agency nurses. 1,158.3
Site services Includes engineering, garden and security-based occupations. 1.6
Other occupations
Includes, but is not limited to, Aboriginal and ethnic health employees. 16.2
Total 3,108.9
Notes:1. Data Source: HR Data Warehouse.2. FTE is calculated as the monthly average FTE and is the average hours worked
during a period of time divided by the Award full-time hours for the same period. Hours include ordinary time, overtime, all leave categories, public holidays, time off in lieu and workers compensation.
3. FTE figures provided are based on Actual (paid) month to date FTE.4. The devolved governance structure for the WA health system enacted by the Health
Services Act 2016 took effect from 1 July 2016, so results prior to this date are not available.
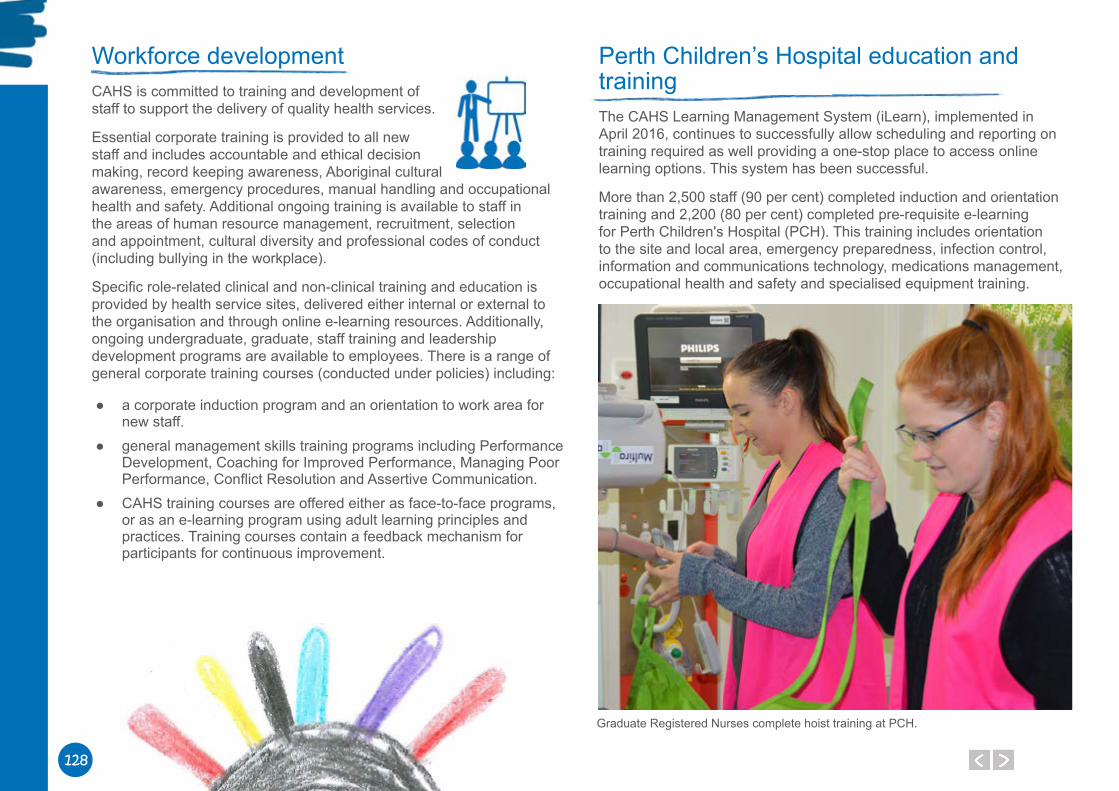
128
Workforce developmentCAHS is committed to training and development of staff to support the delivery of quality health services.
Essential corporate training is provided to all new staff and includes accountable and ethical decision making, record keeping awareness, Aboriginal cultural awareness, emergency procedures, manual handling and occupational health and safety. Additional ongoing training is available to staff in the areas of human resource management, recruitment, selection and appointment, cultural diversity and professional codes of conduct (including bullying in the workplace).
Specific role-related clinical and non-clinical training and education is provided by health service sites, delivered either internal or external to the organisation and through online e-learning resources. Additionally, ongoing undergraduate, graduate, staff training and leadership development programs are available to employees. There is a range of general corporate training courses (conducted under policies) including:
● a corporate induction program and an orientation to work area for new staff.
● general management skills training programs including Performance Development, Coaching for Improved Performance, Managing Poor Performance, Conflict Resolution and Assertive Communication.
● CAHS training courses are offered either as face-to-face programs, or as an e-learning program using adult learning principles and practices. Training courses contain a feedback mechanism for participants for continuous improvement.
Perth Children’s Hospital education and trainingThe CAHS Learning Management System (iLearn), implemented in April 2016, continues to successfully allow scheduling and reporting on training required as well providing a one-stop place to access online learning options. This system has been successful.
More than 2,500 staff (90 per cent) completed induction and orientation training and 2,200 (80 per cent) completed pre-requisite e-learning for Perth Children's Hospital (PCH). This training includes orientation to the site and local area, emergency preparedness, infection control, information and communications technology, medications management, occupational health and safety and specialised equipment training.
Graduate Registered Nurses complete hoist training at PCH.
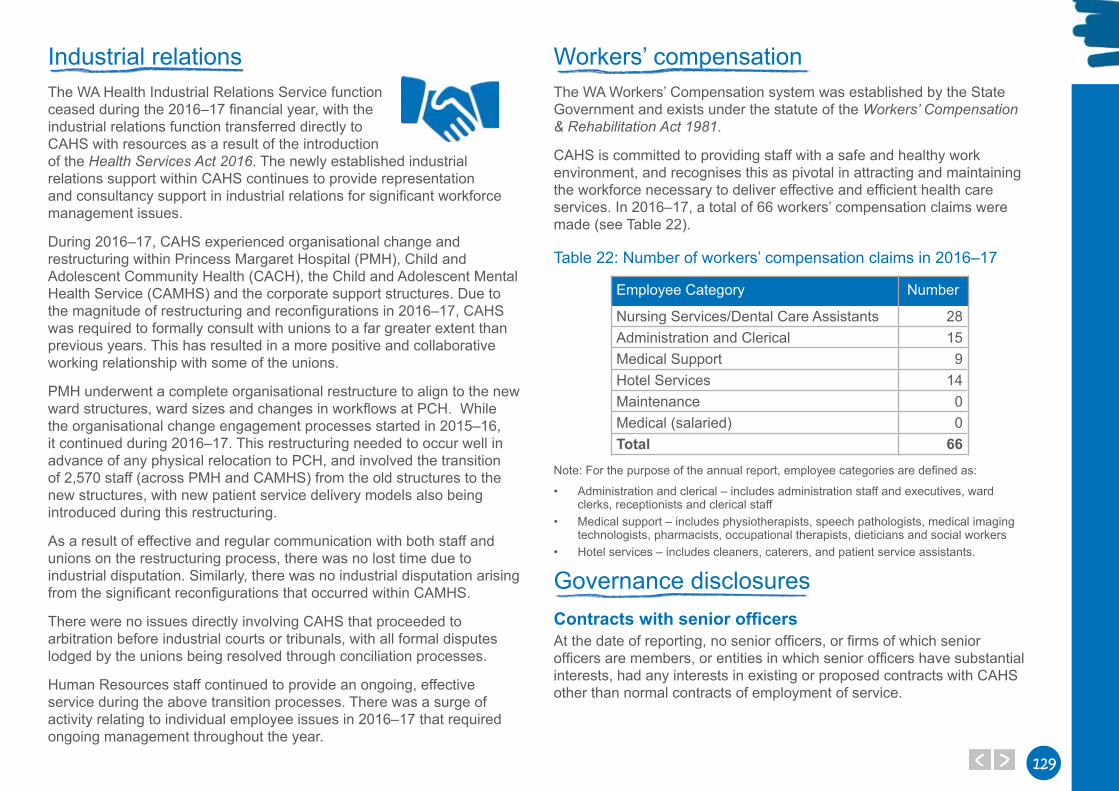
129129
Industrial relationsThe WA Health Industrial Relations Service function ceased during the 2016–17 financial year, with the industrial relations function transferred directly to CAHS with resources as a result of the introduction of the Health Services Act 2016. The newly established industrial relations support within CAHS continues to provide representation and consultancy support in industrial relations for significant workforce management issues.
During 2016–17, CAHS experienced organisational change and restructuring within Princess Margaret Hospital (PMH), Child and Adolescent Community Health (CACH), the Child and Adolescent Mental Health Service (CAMHS) and the corporate support structures. Due to the magnitude of restructuring and reconfigurations in 2016–17, CAHS was required to formally consult with unions to a far greater extent than previous years. This has resulted in a more positive and collaborative working relationship with some of the unions.
PMH underwent a complete organisational restructure to align to the new ward structures, ward sizes and changes in workflows at PCH. While the organisational change engagement processes started in 2015–16, it continued during 2016–17. This restructuring needed to occur well in advance of any physical relocation to PCH, and involved the transition of 2,570 staff (across PMH and CAMHS) from the old structures to the new structures, with new patient service delivery models also being introduced during this restructuring.
As a result of effective and regular communication with both staff and unions on the restructuring process, there was no lost time due to industrial disputation. Similarly, there was no industrial disputation arising from the significant reconfigurations that occurred within CAMHS.
There were no issues directly involving CAHS that proceeded to arbitration before industrial courts or tribunals, with all formal disputes lodged by the unions being resolved through conciliation processes.
Human Resources staff continued to provide an ongoing, effective service during the above transition processes. There was a surge of activity relating to individual employee issues in 2016–17 that required ongoing management throughout the year.
Workers’ compensationThe WA Workers’ Compensation system was established by the State Government and exists under the statute of the Workers’ Compensation & Rehabilitation Act 1981.
CAHS is committed to providing staff with a safe and healthy work environment, and recognises this as pivotal in attracting and maintaining the workforce necessary to deliver effective and efficient health care services. In 2016–17, a total of 66 workers’ compensation claims were made (see Table 22).
Table 22: Number of workers’ compensation claims in 2016–17
Employee Category Number
Nursing Services/Dental Care Assistants 28Administration and Clerical 15Medical Support 9Hotel Services 14Maintenance 0Medical (salaried) 0Total 66
Note: For the purpose of the annual report, employee categories are defined as:
• Administration and clerical – includes administration staff and executives, ward clerks, receptionists and clerical staff
• Medical support – includes physiotherapists, speech pathologists, medical imaging technologists, pharmacists, occupational therapists, dieticians and social workers
• Hotel services – includes cleaners, caterers, and patient service assistants.
Governance disclosuresContracts with senior officersAt the date of reporting, no senior officers, or firms of which senior officers are members, or entities in which senior officers have substantial interests, had any interests in existing or proposed contracts with CAHS other than normal contracts of employment of service.
130
Unauthorised use of credit cardsWA Health uses Purchasing Cards for purchasing goods and services to achieve savings through improved administrative efficiency and more effective cash management. The Purchasing Card is a personalised credit card that provides a clear audit trail for management.
WA Health credit cards are provided to employees who require one as part of their role. Credit cards are not for personal use by the cardholder. Should a cardholder use a credit card for a personal purpose, they must give written notice to the accountable authority within five working days and refund the total amount of expenditure.
Despite being made aware of obligations pertaining to the use of credit cards, one CAHS cardholder used their card for personal purposes. The transaction was identified just prior to the end of the reporting period, and the full amount ($102.90) was refunded after the new reporting period commenced (see Table 23).
Table 23: Credit card personal use expenditure 2016–17
Credit card personal use expenditure 2016–17
Aggregate amount of personal use expenditure for the reporting period $102.90
Aggregate amount of personal use expenditure settled by the due date (within 5 working days) $0
Aggregate amount of personal use expenditure settled after the period (after 5 working days) $102.90
Aggregate amount of personal use expenditure outstanding at the end of the reporting period $0
Government policy requirementsGovernment building contractsCAHS has a commitment to the Government Building Training Policy. CAHS included appropriate clauses in tender documentation and monitored compliance of in scope building, construction or maintenance contractors for projects with a duration of greater than three months and a value of greater than $2 million. As at 30 June 2017, no contracts subject to the Government Building Training Policy had been awarded.
Pecuniary interestsSenior officers of government are required to declare any interest in an existing or proposed contract that has, or could result in, the member receiving financial or other benefits.
Ms Deborah Karasinski (CAHS Board Chair) is the Chief Executive Officer of Senses Australia, which currently uses facilities at PMH and provides training to PMH staff. In 2016–17, Senses Australia entered into a new non-financial Service Agreement with PCH, which will maintain the long standing and mutually beneficial relationship it currently has with PMH. To avoid any perceived or potential conflict of interest, the Director General of the WA health system agreed to Ms Karasinski’s request that other parties from Senses Australia manage the new Service Agreement, which was signed by the President.
Professor Geoffrey Dobb (CAHS Board Member) is a member of the Australian Council on Healthcare Standards (ACHS), which will be responsible for accrediting PCH. In 2016–17, Professor Dobb did not take part in discussions, votes or any other matters in relation to PCH at meetings of the ACHS Board.
Ms Kathleen Bozanic (CAHS Board Member) declared that her partner is employed by the North Metropolitan Health Service (NMHS). Although the perceived or potential conflict of interest is considered minimal, Ms Bozanic requested that she not receive information that could be perceived to provide benefit to her partner, and to be excluded from any decision where NMHS Mental Health has potential to benefit or incur loss.
Mr Peter Mott (CAHS Board Member) is employed by a private healthcare provider that does not support the pursuit of private patient care in public hospitals, as it potentially devalues private health insurance. This conflict of interest is managed by Mr Mott excluding himself from any discussions, votes or other matters related to private patient treatment in public hospitals.
In 2016–17, the CAHS Director of Clinical Services declared that he is a surveyor for ACHS, which is the preferred accreditation body of the WA health system. Dr Mark Salmon undertakes surveys in other states and in WA private hospitals, with flights, accommodation and meals paid for by the ACHS. Dr Salmon’s role for ACHS does not constitute a conflict of interest, as he does not survey WA public hospitals.

131131
RequirementsOther Legal
132
Ministerial directivesTreasurer’s Instructions 903 (12) requires disclosing information on any written Ministerial directives relevant to the setting of desired outcomes or operational objectives, the achievement of desired outcomes or operational objectives, investment activities, and financing activities.
The Child and Adolescent Health Service (CAHS) received no Ministerial directives during 2016–17.
AdvertisingIn accordance with section 175Z of the Electoral Act 1907, CAHS incurred the following advertising expenditure in 2016–17 (see Table 24).
Table 24: Summary of advertising for 2016–17
Summary of advertising Amount ($)
Advertising agencies 0Market research organisations 0Polling organisations 0Direct mail organisations 0Media advertising organisations 783.37Total advertising expenditure 783.37
Adcorp was the only organisation to provide services in 2016–17.
Disability Access and Inclusion Plan The Disability Services Act 1993 was introduced to ensure that people with disability have the same opportunities to fully access the range of health services, facilities and information available in the public health system, and to participate in public consultation regarding WA Health services. As at June 2014, amendments to the Act require public authorities to ensure that people with disability have equal employment opportunities. CAHS ensures compliance with the act and all other principles through the implementation of a Disability Access and Inclusion Plan.
Access to Service and EventsA range of equipment is provided by CAHS to assist people with disabilities to access services. All relevant policies consider the access requirements of people with disabilities. Within PMH, events are held in venues that are accessible by people with disabilities.
Access to Buildings and Other FacilitiesAccess to buildings and facilities for people with disabilities is ensured through ongoing management and maintenance. Additionally, a CAHS Disability Access and Inclusion Plan (2016–21) continues to be refined as part of the transition to the new Perth Children's Hospital (PCH).
Access to InformationCAHS consumer publications are available in alternative formats and languages on request, including large print and audio formats for patients with literacy or vision difficulties. The health service website has capability to assist people who are hearing impaired, as well as providing details on where people can find information and make contact with services. The health service aims to achieve a minimum of level AA rating of the Web Content Accessibility Guidelines 2.0 on all internal and external websites, with clear guidelines around developing content on digital platforms.
Quality of Service by StaffAn e-learning package is available on the CAHS intranet for staff education on disability access and inclusion. New staff are advised of the importance of disability access and inclusion during CAHS wide corporate induction. Regular staff presentations continue in collaboration with the Disability Services Commission. An example of the improved quality of service includes the recent incorporation of an adult change table to cater to the toileting requirements of older children and adolescents.
Opportunity to Provide FeedbackAll staff are available to assist people with disabilities to provide feedback. A dedicated Child and Family Engagement Service is also available during office hours. There are also easily accessible comments, complaints, and suggestion boxes available throughout CAHS facilities.
133133
The CAHS website provides for comments, complaints, and suggestions to be sent via an email. Feedback is processed and managed through the Child and Family Engagement Service and discussed at the Consumer Advisory Council and the Disability Access Committee to ensure that any changes to policy or updates to services are considered.
Participation in Public ConsultationThe CAHS Disability Advisory Committee has recently been expanded to include a wider range of CAHS staff and consumer representation. Additionally, all venues for public consultation are required to meet the needs of people with disabilities.
Opportunities to Obtain and Maintain EmploymentCAHS uses inclusive recruitment practices and encourages people with disability to apply for positions advertised across the organisation. In the transition to PCH, CAHS will be working with disability employment providers to actively recruit and employ people with disabilities, and ensure that workplaces are tailored to employee needs.
Compliance with public sector standardsCAHS Human Resources (HR) maintains a database of all matters pertaining to discipline, performance, redeployment and grievances. Any breach claims that are received through CAHS HR or Health Support Services are recorded and addressed accordingly.
CAHS received three breach claims in the 2016–17 financial year. All were in relation to recruitment, selection and appointment processes.
The Learning and Development Department holds training sessions regularly throughout the year and managers who are involved in these processes are encouraged to attend.
In the 2016–17 financial year, updates were made to the WA Health Code of Conduct, WA Health Discipline Policy and WA Health Managing Unsatisfactory and Substandard Performance Policy.
These policies are introduced at the CAHS corporate induction for all new staff members. New staff members are advised of the process for reporting suspected breaches of discipline or unethical behaviour.
Code of Conduct posters are also displayed across CAHS. Further to this, it is mandatory for all staff to undertake Accountable and Ethical Decision Making training, which aligns with the themes of the WA Health Code of Conduct.
The Chief Executive (CE) has key performance indicators including compliance with legislative and administrative requirements (WA Health Code of Conduct and Public Sector Management Act). These are measured by participating in monthly and quarterly performance review meetings. Integrity and conduct-related matters are also discussed as part of the formal performance management process between the CE and Tier 2 employees.
CAHS has recently appointed a Manager of Integrity and Ethics who will participate in monitoring and assessing compliance.
In 2016–17, a total of 34 complaints alleging non-compliance with the Code of Conduct were lodged.
Suspected breaches of discipline including matters of reportable misconduct were dealt with through the WA Health Disciplinary Processes. Where breaches were substantiated, the decision maker determined the appropriate action in accordance with the Health Services Act.
CAHS HR has undertaken industrial relations training relating to the Discipline and Managing Unsatisfactory and Substandard Performance policies. This is to ensure that advice given to managers within CAHS is consistent and adheres to the relevant standards and policies. CAHS HR has also undertaken training regarding reportable misconduct through the Corporate Governance Directorate.
In November 2016, CAHS ran the ‘Voice of Staff’ survey. Questions sought feedback from staff relating to ethical behaviour, trust and respect within the organisation.
CAHS has an Ethical Conduct Review Committee that meets on a monthly basis to review all discipline and reportable misconduct matters within the organisation.
134
Recordkeeping plansThe State Records Act 2000 was established to mandate the standardisation of statutory recordkeeping practices for every State Government agency. Government agency practice is subject to the provision of the Act, the standards and policies. Government agencies are also subject to scrutiny by the State Records Commission.
Section 19 of the State Records Act 2000, states that every government organisation must have a Recordkeeping Plan (RKP) that has been approved by the State Records Commission. The CAHS RKP was approved by the State Records Commission on 26 November 2015. In accordance with section 28 of the State Records Act 2000, the CAHS RKP is to be reviewed within five years of its approval date. Once completed, a report of the review must be submitted to the State Records Office by November 2020.
CAHS has established procedures and guidelines to support staff capture and manage government information to comply with the State Records Act 2000. This includes access to:
● records awareness training enrolment and assessment. ● CAHS Records intranet hub where staff can access training videos,
quick help guides and frequently asked questions on how to manage their records.
● the official Electronic Document and Records Management System (EDRMS) for corporate records.
CAHS has conducted a health check of the EDRMS, identifying areas of improvement to deliver a more effective system in accordance with requirements outlined in the CAHS RKP.
An evaluation of the effectiveness of these procedures and guidelines, including coverage across CAHS, will be provided to the State Records Office in December 2017.
On 3 August 2016, a records team comprising three staff commenced for a fixed term of six months to address the major risks identified, and provide ongoing corporate recordkeeping support for CAHS. Following this initiative, a permanent position of Manager Records and Compliance position was established.
During the period 2016–17, over 92,000 records were captured into the official CAHS EDRMS.
Substantive equalityChild and Adolescent Community HealthThe Aboriginal Health Team (AHT) delivers services to Aboriginal children and families. Services are provided by a multidisciplinary team depending on the needs of the family. When an Aboriginal child is born in the metropolitan area, the AHT is notified via a birth notification. The first universal visit is conducted by the child health nurse. If the child health nurse is unable to contact the family after reasonable attempts, or if the family requests the service of AHT, the child is referred to AHT and is offered the Enhanced Aboriginal Child Health Schedule (EACHS).
EACHS sees Community Health Nurses working alongside Aboriginal Health Workers to provide a comprehensive and culturally acceptable primary health care service designed specifically to address the needs of Aboriginal families. The program is delivered predominantly as a home visiting model.
The Refugee Health Team (RHT) helps transitioning families to access local health services independently and supports young children to enter the child health service. All refugee families in the metropolitan area are referred to the RHT. Interpreters are used extensively by the RHT.
Child and Adolescent Mental Health Service Six Aboriginal Mental Health Workers and Aboriginal Liaison Officers were appointed in October 2016 to work within Child and Adolescent Mental Health Service (CAMHS) multidisciplinary teams. The role of these workers is to provide cultural support and advocacy for Aboriginal young people and their families who require access to CAMHS services. The addition of these six workers has increased the total number of Aboriginal Mental Health Workers within CAMHS to eight.
A large culturally and linguistically diverse community lives and works within the Warwick CAMHS catchment. To meet the needs of this culturally and linguistically diverse (CALD) community, the following two services are in operation in the area.
135135
● In partnership with Child and Adolescent Community Health (CACH), the Department of Education and Edmund Rice WA, Warwick CAMHS runs Integrated Service Centres at Koondoola Primary School and Thornlie Primary School. These centres support recent refugee and humanitarian entrant children who are enrolled in Intensive English Centres at these schools to transition into their new school environments. The centres also support families with accessing mainstream education, health care and community support systems. Two CAMHS Senior Social Workers work in these Integrated Service Centres, providing specialist mental health assessments and helping families to access mainstream mental health services
● Warwick Community CAMHS also has a specialist Cross Cultural Mental Health Clinician who provides mental health care to CALD children, adolescents and their families. This clinician uses a range of interventions when working with CALD families, including family therapy, individual psychotherapy, parental counselling, and group work. The Cross Cultural Clinician also develops and maintains collaborative working relationships with ethnic and mainstream service providers to raise community awareness of multicultural child and adolescent mental health issues. This aims to improve the delivery of culturally appropriate services for young people and their families within the community. The Cross Cultural Clinician also acts as a resource consultant for other mental health, health and community professionals within the scope of cross-cultural mental health issues.
Princess Margaret Hospital PMH provides culturally safe services to Aboriginal patients and their families. The Koorliny Moort ‘Walking with Families’ program provides care coordination for inpatients and out of hospital care to families who might find it hard to come into hospital for their appointment or who want to stay closer to home.
The Aboriginal Liaison Service provides cultural and practical support and advocacy to children and families identified as most vulnerable within the hospital or community setting.
The Refugee Service provides holistic health care to refugee children, adolescents and their families, humanitarian entrants, children presently in detention or waiting for immigration processing (e.g. on bridging visas) and review of refugee and asylum children during and after an inpatient episode of care.
Occupational safety, health and injuryChild and Adolescent Health Service (CAHS) is committed to the provision of a safe work environment for all employees, patients, clients, visitors, and contractors in accordance with the Occupational Safety and Health Act 1984 and the injury management requirements of the Workers’ Compensation and Injury Management Act 1981.
Commitment to occupational safety, health and injury managementCAHS takes a proactive approach to occupational safety and health (OSH). The OSH committees and Executives are supportive to raising the OSH profile and taking a proactive approach to OSH prevention and risk management.
Compliance with occupational safety, health and injury managementThe CAHS Executive is accountable for the occupational safety and health of all CAHS employees and, in particular, for providing leadership, support, direction and resources to ensure that CAHS meets its commitment to occupational safety and health. The CAHS Executive seeks the cooperation of all employees in achieving its occupational safety and health objectives, and in creating a safe and healthy working environment that benefits everyone.
To achieve this, CAHS:
● promotes a culture that integrates safety as a core activity into all aspects of work.
● ensures that managers and supervisory staff accept responsibility for the safety and health of themselves and others at work.
● provides instruction, supervision, training and ready access to information to all employees to enable safe work practices that minimise risk to health.
● complies with OSH legislation regulations and relevant Australian Standards.
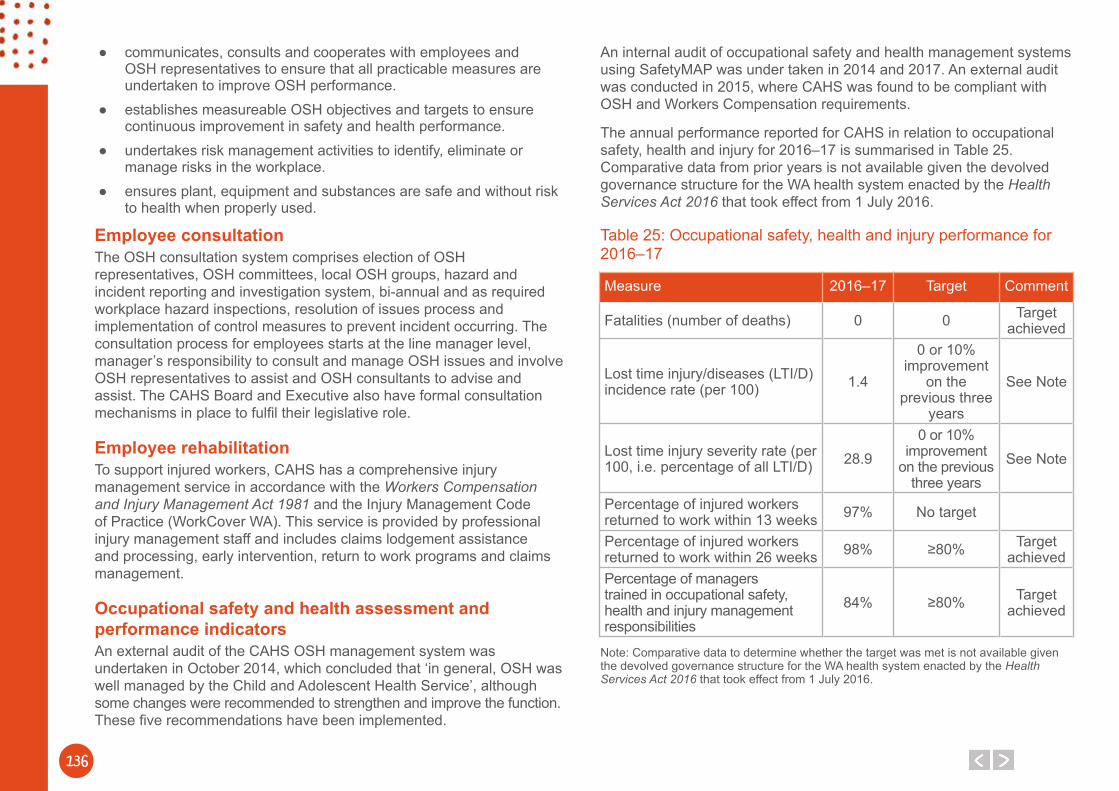
136
● communicates, consults and cooperates with employees and OSH representatives to ensure that all practicable measures are undertaken to improve OSH performance.
● establishes measureable OSH objectives and targets to ensure continuous improvement in safety and health performance.
● undertakes risk management activities to identify, eliminate or manage risks in the workplace.
● ensures plant, equipment and substances are safe and without risk to health when properly used.
Employee consultation The OSH consultation system comprises election of OSH representatives, OSH committees, local OSH groups, hazard and incident reporting and investigation system, bi-annual and as required workplace hazard inspections, resolution of issues process and implementation of control measures to prevent incident occurring. The consultation process for employees starts at the line manager level, manager’s responsibility to consult and manage OSH issues and involve OSH representatives to assist and OSH consultants to advise and assist. The CAHS Board and Executive also have formal consultation mechanisms in place to fulfil their legislative role.
Employee rehabilitationTo support injured workers, CAHS has a comprehensive injury management service in accordance with the Workers Compensation and Injury Management Act 1981 and the Injury Management Code of Practice (WorkCover WA). This service is provided by professional injury management staff and includes claims lodgement assistance and processing, early intervention, return to work programs and claims management.
Occupational safety and health assessment and performance indicatorsAn external audit of the CAHS OSH management system was undertaken in October 2014, which concluded that ‘in general, OSH was well managed by the Child and Adolescent Health Service’, although some changes were recommended to strengthen and improve the function. These five recommendations have been implemented.
An internal audit of occupational safety and health management systems using SafetyMAP was under taken in 2014 and 2017. An external audit was conducted in 2015, where CAHS was found to be compliant with OSH and Workers Compensation requirements.
The annual performance reported for CAHS in relation to occupational safety, health and injury for 2016–17 is summarised in Table 25. Comparative data from prior years is not available given the devolved governance structure for the WA health system enacted by the Health Services Act 2016 that took effect from 1 July 2016.
Table 25: Occupational safety, health and injury performance for 2016–17
Measure 2016–17 Target Comment
Fatalities (number of deaths) 0 0 Target achieved
Lost time injury/diseases (LTI/D) incidence rate (per 100) 1.4
0 or 10% improvement
on the previous three
years
See Note
Lost time injury severity rate (per 100, i.e. percentage of all LTI/D) 28.9
0 or 10% improvement
on the previous three years
See Note
Percentage of injured workers returned to work within 13 weeks 97% No target
Percentage of injured workers returned to work within 26 weeks 98% ≥80% Target
achievedPercentage of managers trained in occupational safety, health and injury management responsibilities
84% ≥80% Target achieved
Note: Comparative data to determine whether the target was met is not available given the devolved governance structure for the WA health system enacted by the Health Services Act 2016 that took effect from 1 July 2016.
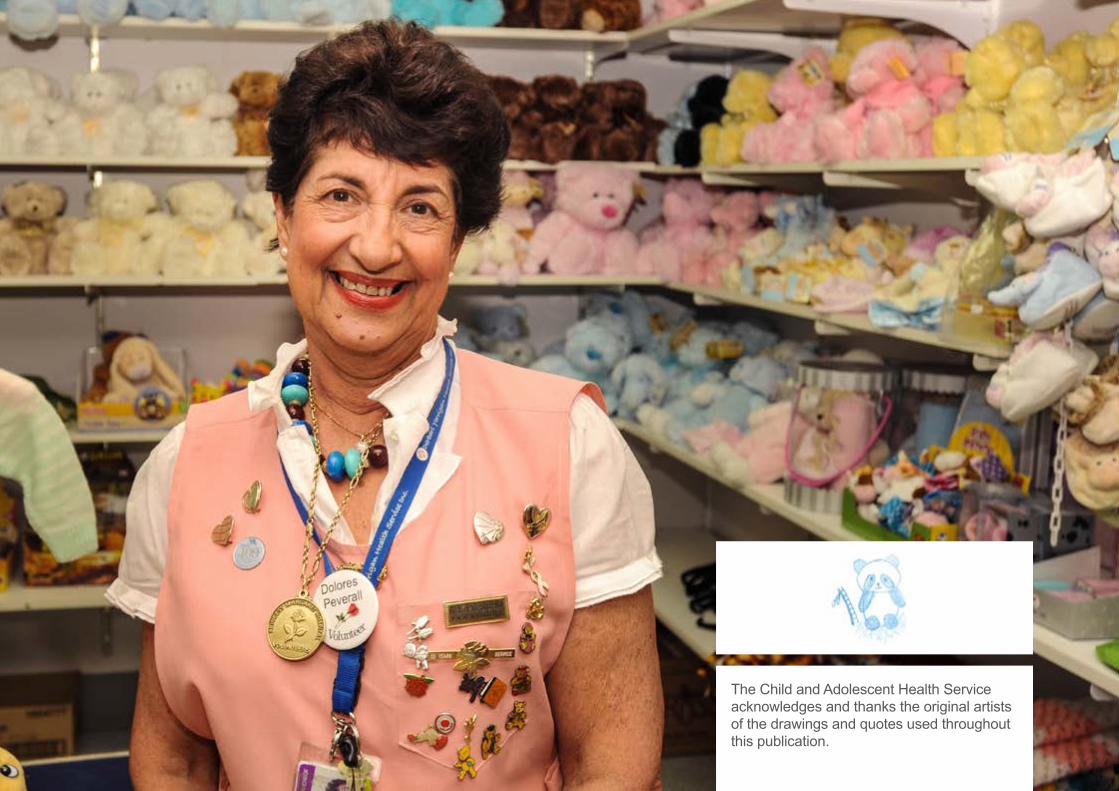
The Child and Adolescent Health Service acknowledges and thanks the original artists of the drawings and quotes used throughout this publication.
138
This work is copyright to the Child and Adolescent Health Service©, apart from the purposes of private study, research, criticism or review, no part of this publication may be re-used or re-produced under the provisions of the Copyright Act 1968 without written permission of the Child and Adolescent Health Service.
This document can be made available in alternative formats on request.


![Child and Adolescent Psychology ch10]](https://img.pdfslide.us/doc/110x75/5695cf6c1a28ab9b028e0b6a/child-and-adolescent-psychology-ch10.jpg)


![Child and Adolescent[1]](https://img.pdfslide.us/doc/110x75/577cc5661a28aba7119c455e/child-and-adolescent1.jpg)