Embed Size (px)
Citation preview
10 March 2021
Burkhard HeppeChief Technology OfficerNPL Markets [email protected]
Towards an optimal bank balance sheetafter Covid
Table of Contents
Overview 1
Credit portfoliomanagement after Covid
1
Champion model failure 3
Challenger models forchallenging times
5
Managing performing andnon-performing SMEexposures
5
Optimal bank portfolioallocation
10
References 12
Overview
The Covid-19 pandemic has dominated the agenda for banks for most of2020 and a number of economic sectors are experiencing seismic shifts. Theuse of historical data in risk modelling, stress testing and portfolio allocationhas been questioned in a crisis that differs fundamentally from previousperiods of economic stress. Bank stress test models are often linked to GDPgrowth and the unemployment rate and for the severe recession experiencedduring 2020 these models predict dramatic increases in loan defaults andlosses. However, the expected increases in defaults and losses have not yetmaterialised due to government support measures and payment moratoriathat econometric models do not capture. In this article, we discuss howreporting tools and advanced analytics with alternative challenger models canbe used to create forward-looking performance indicators of bank loanportfolios. We focus on lending to European non-financial corporates and theasymmetric impact of Covid on different industry sectors. We explain howsuch projections can help optimise bank lending including the use of expertoverrides to better account for the uniqueness of the current crisis. Onceforward-looking measures of risk and return are in place, portfolio theory canbe used for optimal portfolio allocation and management.
“Delayed recognition and poor management of deteriorating asset quality could easily clog up bank balance sheets withnon-performing loans for a fairly long period of time, making it more difficult for the banks to support viable customers andunderpin a faster economic recovery.” Andrea Enria, Chair of the ECB Supervisory Board
Credit portfolio management (CPM) after Covid
Every crisis is different and suffers from unique challenges. The global financial crisis of 2009 revealedsevere deficiencies in the analysis of subprime mortgages and related structured securities. The Covidpandemic of 2020 resulted in unprecedented lockdowns and disruptions to economic activity combinedwith numerous government intervention measures to mitigate the economic impact of the pandemic. Theresult was a steep economic recession in many countries that coexisted with stable or even decliningcorporate insolvencies and loan defaults contrary to econometric credit models which predicted large
© NPL Markets Ltd. 2021 1
increases in non-performing loans based on historically observed elasticities. Many credit portfoliomanagers wonder how to react to this apparent model failure and how to best stir the bank’s balancesheet through these challenging times.
Naturally given the circumstance, European banking supervisors pay close attention to the assetperformance as low asset quality affects bank capital. The Single Supervisory Mechanism specifies thepriorities for 2021 regarding credit risk: focus on credit risk management, operations, monitoring andreporting. Credit portfolio managers must identify, measure and mitigate the impact of credit risk, as wellas assess the bank’s operational capacity to manage the expected increase in distressed borrowers.Furthermore, the ECB places particular emphasis on the banks’ capacity to identify any deterioration inasset quality at an early stage as well as on the bank’s capacity to continue taking the necessary actionsto appropriately manage loan arrears and non-performing loans.
As an overview, we see the following steps towards an optimal bank balance sheet:1) Data preparation and enrichment. Identify the minimum data sets required for an impactful CPM
analysis. This includes data from finance and risk as well as operational data like staffing in theworkout department. For corporate borrowers, up to date financials as well as market prices fromthe loan, bond, CDS and equity markets are important.
2) Continuous monitoring of actual loan performance, borrower behaviour and collateral valuesincluding the use of government support programs and payment moratoria. Interactive reportingof watchlist, forbearance and workout exposures including the monitoring of detailed recoverycash flows and workout expenses. The latter will greatly facilitate any non-performing loan (NPL)disposal or securitisation strategies.
3) Flexible report generation to compare actual performance with predicted performance fromexisting or newly adjusted models. Use of flexible and simpler challenger models that are easier toadjust and explore than champion models in production (challenger model sandbox).
4) Automated market valuations to explore exit strategies also for illiquid loan exposures.5) Interactive evaluation of the economic benefits of the three main management strategies:
a) on-balance sheet management with organic run-off of suboptimal exposures based oninternal workout with restructuring and real estate owned strategies of NPL,
b) outright single or portfolio sales, andc) structured risk transfer transactions in form of synthetic or true sale securitisations.
6) Combine risk model predictions, expert views and market valuations to quantify the impact on thefuture balance sheet including risk and return profile of all relevant portfolio segments. Include therelevant regulatory changes from the prudential backstop and Basel III/IV.
7) Translate the predicted performance into optimal action steps by selecting the most efficientportfolio segments for each management strategy.
8) Use advanced analytics for structured transactions balancing investor demands with regulatoryand accounting benefits using cash flow models for tranched liabilities (cash & syntheticsecuritisation).
© NPL Markets Ltd. 2021 2
In this article we investigate how data and adjusted risk models can be used to update the credit portfoliomanagement tool box and account for the Covid effects more accurately. We offer a managementframework and analytics platform to support decisions towards an optimal balance sheet through anumber of remediating actions. The suggested steps to improve the risk-return profile in the bank bookare largely based on best practice CPM and should be equally useful after the pandemic has beenovercome. Here, we comment on different challenger models for corporate default risk (step 3) andoutline the use of portfolio theory for portfolio allocation (step 6). Data preparation (step 1) includingstandardisation and validation is available in the NPL Markets analytics platform. Continuousperformance monitoring with user defined segmentations and drill downs are a recent addition to theplatform (step 2). Evaluated corporate loan pricing in step 4 is discussed in a separate article availableupon request. The interactive analysis of different management strategies (steps 5 and 7) is available inthe investor and bank balance sheet analytics on the platform. The analytics for structured transactions(step 8) will be available on the platform shortly. For further research and information visitnplmarkets.com/en/research.
Champion model failure
Machine learning methods such as regressions, decision trees or neural networks are widely usedtechniques to model credit risk. They all rely on the principle that patterns and behaviors from the pastwill likely repeat in the future. Models identify these patterns in historical data and use them forpredictions. Much work has gone in the development of credit models using these machine learningmethods to link credit risk measures such as the probability of default or loss given default tomacroeconomic variables. The primary motivation for lenders to develop these models is to calculateregulatory capital charges under the internal ratings based approach, run supervisor stress test scenarios,and calculate loan loss provisions under IFRS 9. It appears that point-in-time models predicting defaultbased on the macro environment are not performing well during Covid. Those models would translate theunprecedented and repeated lockdowns, travel bans, physical distancing measures and the resultingslump in economic activity into steep increases in loan defaults and bankruptcies. On the other hand,extensive government support measures have been successful in shielding households and companiesfrom the worst consequences of the pandemic. While companies in the hardest hit economic sectorshave suffered dramatic reductions in total sales, the support measures thus far have prevented a newwave of bankruptcies and non-performing loans. Most credit models are not designed to capture theunprecedented relief measures as they had no precedent in the past.
In April 2020 during the lockdown of the first Covid wave, we predicted a doubling or tripling of the NPLratio in Europe and the US for 2020 and 2021 based on historical data and macro forecasts from the IMF.In Europe overall, the predicted large increase in loan defaults did not materialize in 2020. According toMoody’s, the US saw a doubling of the corporate default rate from 1.5% in 2019 to 3.1% in 2020, thehighest level since the financial crisis of 2009. For US consumer lending, however, default models would
© NPL Markets Ltd. 2021 3
translate the dramatic spike in the unemployment rate in Q2 2020 into a jump in delinquencies that wasnot observed. The flow into 90 days plus auto loan delinquencies actually declined throughout 2020. InEurope according to Q3 2020 data from EBA, the non-performing loan ratio has barely increased neitherfor loans to corporates nor to households. Given the continued economic stress with renewed lockdownsin Q4 2020 and Q1 2021, there is an expectation that the low NPL ratios will increase eventually once thesupport measures are phased out. Nevertheless, banks have found that many of their credit models didnot work well in this crisis.
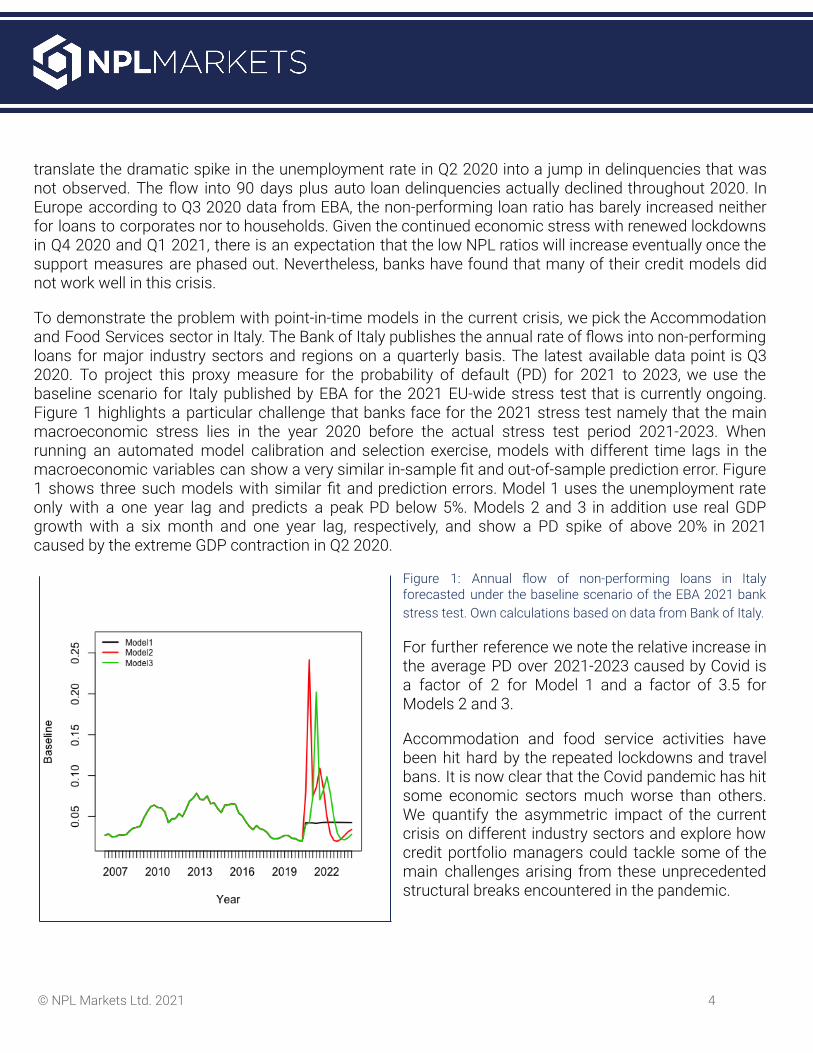
To demonstrate the problem with point-in-time models in the current crisis, we pick the Accommodationand Food Services sector in Italy. The Bank of Italy publishes the annual rate of flows into non-performingloans for major industry sectors and regions on a quarterly basis. The latest available data point is Q32020. To project this proxy measure for the probability of default (PD) for 2021 to 2023, we use thebaseline scenario for Italy published by EBA for the 2021 EU-wide stress test that is currently ongoing.Figure 1 highlights a particular challenge that banks face for the 2021 stress test namely that the mainmacroeconomic stress lies in the year 2020 before the actual stress test period 2021-2023. Whenrunning an automated model calibration and selection exercise, models with different time lags in themacroeconomic variables can show a very similar in-sample fit and out-of-sample prediction error. Figure1 shows three such models with similar fit and prediction errors. Model 1 uses the unemployment rateonly with a one year lag and predicts a peak PD below 5%. Models 2 and 3 in addition use real GDPgrowth with a six month and one year lag, respectively, and show a PD spike of above 20% in 2021caused by the extreme GDP contraction in Q2 2020.
Figure 1: Annual flow of non-performing loans in Italyforecasted under the baseline scenario of the EBA 2021 bankstress test. Own calculations based on data from Bank of Italy.
For further reference we note the relative increase inthe average PD over 2021-2023 caused by Covid isa factor of 2 for Model 1 and a factor of 3.5 forModels 2 and 3.
Accommodation and food service activities havebeen hit hard by the repeated lockdowns and travelbans. It is now clear that the Covid pandemic has hitsome economic sectors much worse than others.We quantify the asymmetric impact of the currentcrisis on different industry sectors and explore howcredit portfolio managers could tackle some of themain challenges arising from these unprecedentedstructural breaks encountered in the pandemic.
© NPL Markets Ltd. 2021 4
Challenger models for challenging times
The failure of macroeconometric time-series regression based models has motivated credit risk expertsto explore other corporate credit risk model types that are well known in the financial industry.Merton-style structural models link credit risk to the volatility of equity prices and credit spreads can beused to derive a market implied PD. Altman Z-score-style models predict corporate distress based onselected financial ratios. Z-score models have been proven to successfully discriminate between healthyand distressed borrowers across countries and industries (e.g. Altman 2014). Bank internal rating modelsoften include Z-score-like financial ratios which can help identify companies that are more likely to survivethe current crisis. As they do not use macroeconomic variables as input, Z-score default models areconsidered more through-the-cycle and less suitable for macroeconomic stress testing. In pastrecessions, broadly speaking, Z-score models kept their discriminatory power but they did not accuratelypredict the cyclical swings in default rates.
The pandemic emphasized the importance of having readily available challenger models. Model choicesare determined by the available data. Alternatives to the complex econometric champion models of largefinancial institutions help to estimate a range of expected losses given the current environment and underdifferent scenarios for the speed of economic recovery after Covid. A challenger model can be used toestimate losses of an entire portfolio or a specific segment. For instance, loans subject to paymentmoratoria or forbearance did not play a major role pre-Covid, but are much more significant now justifyingdedicated models for this segment. Another example for challenger models are industry sector specificmodels. Traditional Z-score models showed only modest variation by industry sector (Altman 2014) i.e.the sensitivities to the different financial ratios were fairly stable across countries and sectors.Point-in-time credit models, however, show that different sectors exhibit largely varying sensitivities to theeconomic cycle. The procyclical behaviour of some sectors is well known for cyclical equity sectorindices (e.g. discretionary consumer goods, construction or manufacturing) and non-cyclicals (e.g.non-discretionary consumer goods, utilities, healthcare).
Managing performing and non-performing SME exposures
Banks face a new set of challenges regarding corporate borrower solvency, liquidity, and profitability.Macro-based projections don’t reflect the highly heterogeneous impact on sectors. While food retailersand online gaming benefit, airlines and accommodation and food services are suffering dramaticreduction in sales. Historical financial statements, meanwhile, take time before they reflect the currentimpact on business and financials.
Sector-based cash flow analytics can help quantify risks and liquidity needs. Borrower cash flowforecasts should reflect liquidity positions and associated financing needs due to negative cash flowsand help identify which firms won’t be able to repay the debt. Banks need sector-based analytics for
© NPL Markets Ltd. 2021 5
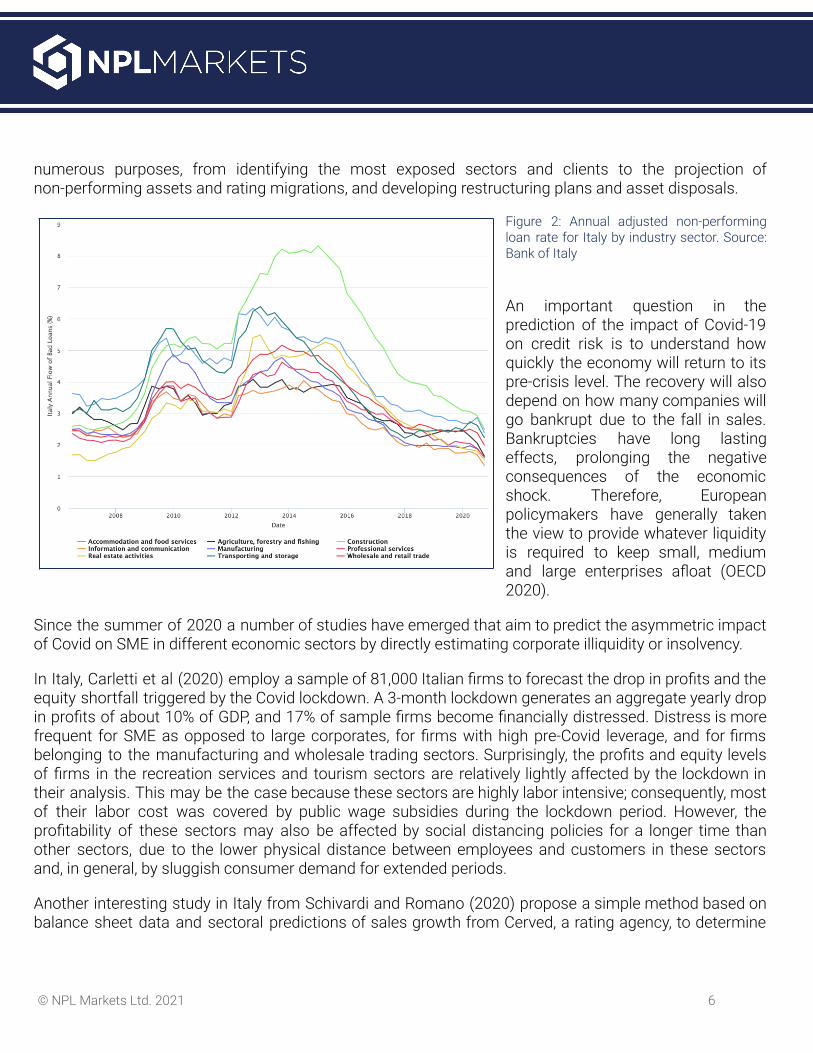
numerous purposes, from identifying the most exposed sectors and clients to the projection ofnon-performing assets and rating migrations, and developing restructuring plans and asset disposals.
Figure 2: Annual adjusted non-performingloan rate for Italy by industry sector. Source:Bank of Italy
An important question in theprediction of the impact of Covid-19on credit risk is to understand howquickly the economy will return to itspre-crisis level. The recovery will alsodepend on how many companies willgo bankrupt due to the fall in sales.Bankruptcies have long lastingeffects, prolonging the negativeconsequences of the economicshock. Therefore, Europeanpolicymakers have generally takenthe view to provide whatever liquidityis required to keep small, mediumand large enterprises afloat (OECD2020).
Since the summer of 2020 a number of studies have emerged that aim to predict the asymmetric impactof Covid on SME in different economic sectors by directly estimating corporate illiquidity or insolvency.
In Italy, Carletti et al (2020) employ a sample of 81,000 Italian firms to forecast the drop in profits and theequity shortfall triggered by the Covid lockdown. A 3-month lockdown generates an aggregate yearly dropin profits of about 10% of GDP, and 17% of sample firms become financially distressed. Distress is morefrequent for SME as opposed to large corporates, for firms with high pre-Covid leverage, and for firmsbelonging to the manufacturing and wholesale trading sectors. Surprisingly, the profits and equity levelsof firms in the recreation services and tourism sectors are relatively lightly affected by the lockdown intheir analysis. This may be the case because these sectors are highly labor intensive; consequently, mostof their labor cost was covered by public wage subsidies during the lockdown period. However, theprofitability of these sectors may also be affected by social distancing policies for a longer time thanother sectors, due to the lower physical distance between employees and customers in these sectorsand, in general, by sluggish consumer demand for extended periods.
Another interesting study in Italy from Schivardi and Romano (2020) propose a simple method based onbalance sheet data and sectoral predictions of sales growth from Cerved, a rating agency, to determine
© NPL Markets Ltd. 2021 6
the firms that will become illiquid. They apply the method to 650,000 Italian companies which producethree quarters of the Italian private sector output. Sales growth from more than 500 sectors is forecastedby Cerved. The authors develop a simple accounting framework to determine to what extent firms willhave liquidity constraints. A well known data challenge for private SME is that balance sheet data areoften outdated and published only annually and with significant delay. Hence, for many companies,lenders are still working with balance sheets and income information from the pre-Covid year end 2019.As of September 30, 2020, the predicted increase in illiquid and insolvent companies in Italy has not yetbeen observed. Figure 2 shows the annual flow of bad loans by borrower count and industry sector asreported by the Bank of Italy. The last two data points from Q2 and Q3 2020 show a drop in the rate of
new non-performingloans which is helpedby an increase inlending during thecrisis.
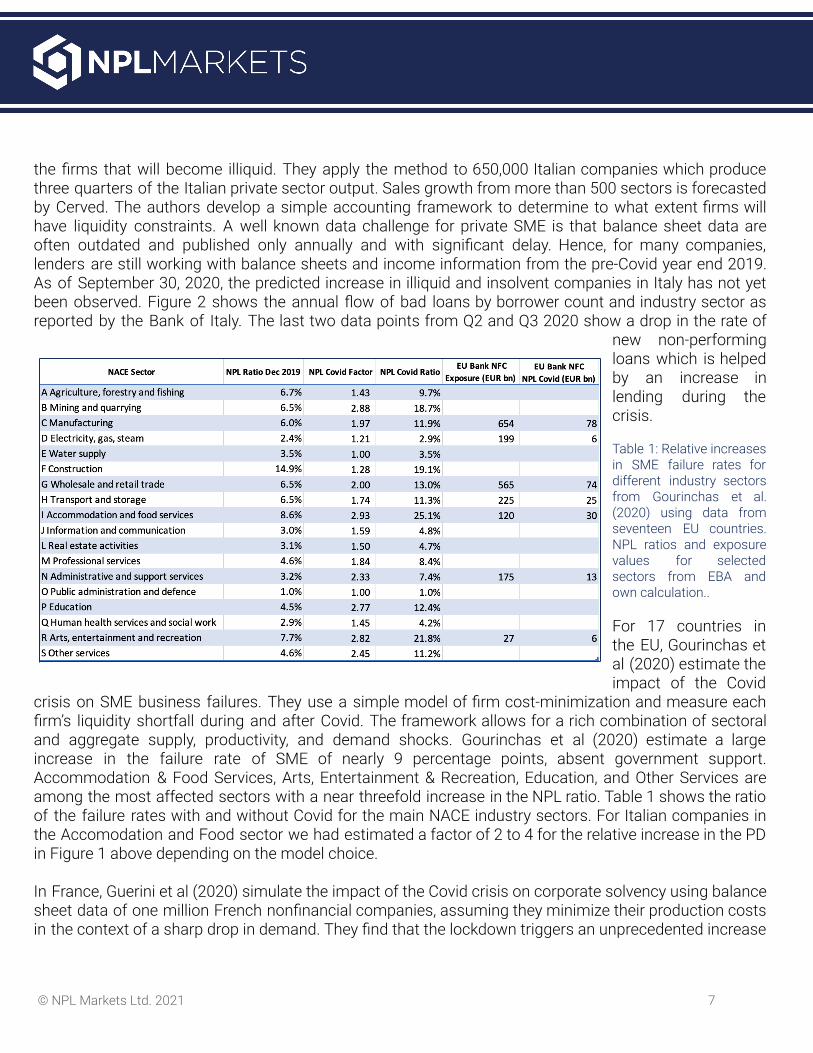
Table 1: Relative increasesin SME failure rates fordifferent industry sectorsfrom Gourinchas et al.(2020) using data fromseventeen EU countries.NPL ratios and exposurevalues for selectedsectors from EBA andown calculation..
For 17 countries inthe EU, Gourinchas etal (2020) estimate theimpact of the Covid
crisis on SME business failures. They use a simple model of firm cost-minimization and measure eachfirm’s liquidity shortfall during and after Covid. The framework allows for a rich combination of sectoraland aggregate supply, productivity, and demand shocks. Gourinchas et al (2020) estimate a largeincrease in the failure rate of SME of nearly 9 percentage points, absent government support.Accommodation & Food Services, Arts, Entertainment & Recreation, Education, and Other Services areamong the most affected sectors with a near threefold increase in the NPL ratio. Table 1 shows the ratioof the failure rates with and without Covid for the main NACE industry sectors. For Italian companies inthe Accomodation and Food sector we had estimated a factor of 2 to 4 for the relative increase in the PDin Figure 1 above depending on the model choice.
In France, Guerini et al (2020) simulate the impact of the Covid crisis on corporate solvency using balancesheet data of one million French nonfinancial companies, assuming they minimize their production costsin the context of a sharp drop in demand. They find that the lockdown triggers an unprecedented increase
© NPL Markets Ltd. 2021 7
in the share of illiquid and insolvent firms, with the former more than doubling relative to a scenariowithout Covid (growing from 3.8% to more than 10%) and insolvencies increasing by 80% (from 1.8% to3.2%). They find sectors such as hotels and restaurants, household services, and construction are themost vulnerable, while wholesale and retail trade, and manufacturing are more resilient.
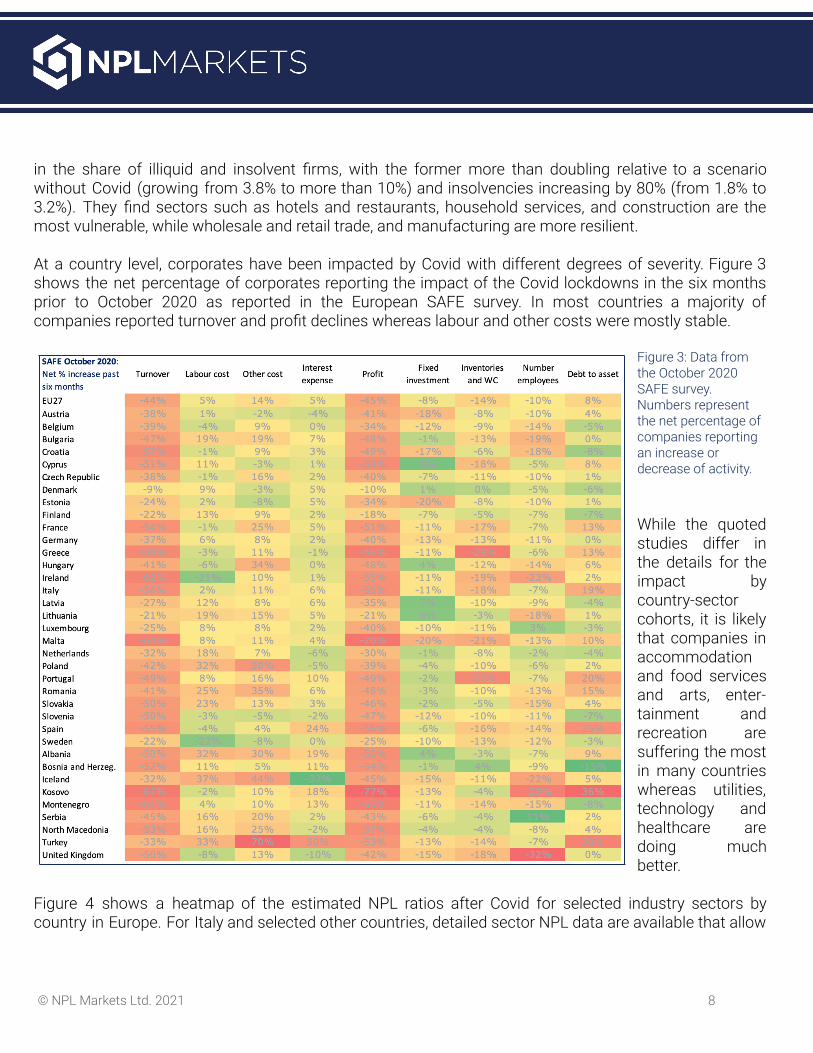
At a country level, corporates have been impacted by Covid with different degrees of severity. Figure 3shows the net percentage of corporates reporting the impact of the Covid lockdowns in the six monthsprior to October 2020 as reported in the European SAFE survey. In most countries a majority ofcompanies reported turnover and profit declines whereas labour and other costs were mostly stable.
Figure 3: Data fromthe October 2020SAFE survey.Numbers representthe net percentage ofcompanies reportingan increase ordecrease of activity.
While the quotedstudies differ inthe details for theimpact bycountry-sectorcohorts, it is likelythat companies inaccommodationand food servicesand arts, enter-tainment andrecreation aresuffering the mostin many countrieswhereas utilities,technology andhealthcare aredoing muchbetter.
Figure 4 shows a heatmap of the estimated NPL ratios after Covid for selected industry sectors bycountry in Europe. For Italy and selected other countries, detailed sector NPL data are available that allow
© NPL Markets Ltd. 2021 8
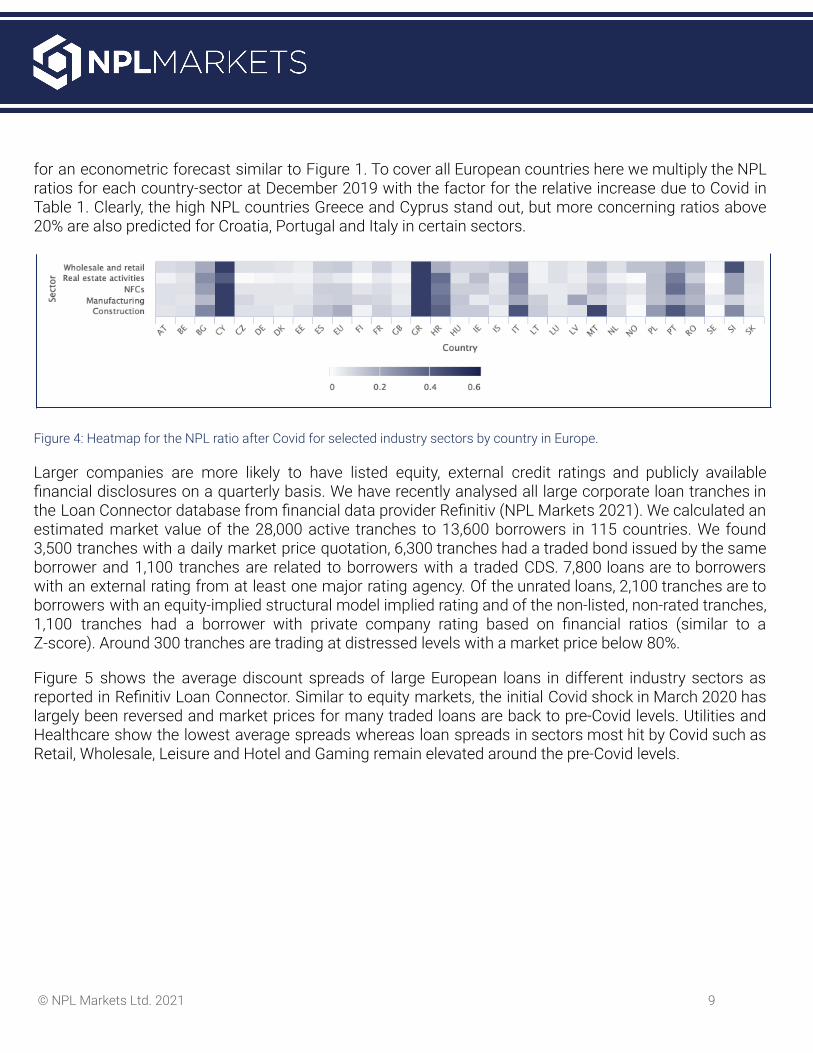
for an econometric forecast similar to Figure 1. To cover all European countries here we multiply the NPLratios for each country-sector at December 2019 with the factor for the relative increase due to Covid inTable 1. Clearly, the high NPL countries Greece and Cyprus stand out, but more concerning ratios above20% are also predicted for Croatia, Portugal and Italy in certain sectors.
Figure 4: Heatmap for the NPL ratio after Covid for selected industry sectors by country in Europe.
Larger companies are more likely to have listed equity, external credit ratings and publicly availablefinancial disclosures on a quarterly basis. We have recently analysed all large corporate loan tranches inthe Loan Connector database from financial data provider Refinitiv (NPL Markets 2021). We calculated anestimated market value of the 28,000 active tranches to 13,600 borrowers in 115 countries. We found3,500 tranches with a daily market price quotation, 6,300 tranches had a traded bond issued by the sameborrower and 1,100 tranches are related to borrowers with a traded CDS. 7,800 loans are to borrowerswith an external rating from at least one major rating agency. Of the unrated loans, 2,100 tranches are toborrowers with an equity-implied structural model implied rating and of the non-listed, non-rated tranches,1,100 tranches had a borrower with private company rating based on financial ratios (similar to aZ-score). Around 300 tranches are trading at distressed levels with a market price below 80%.
Figure 5 shows the average discount spreads of large European loans in different industry sectors asreported in Refinitiv Loan Connector. Similar to equity markets, the initial Covid shock in March 2020 haslargely been reversed and market prices for many traded loans are back to pre-Covid levels. Utilities andHealthcare show the lowest average spreads whereas loan spreads in sectors most hit by Covid such asRetail, Wholesale, Leisure and Hotel and Gaming remain elevated around the pre-Covid levels.
© NPL Markets Ltd. 2021 9
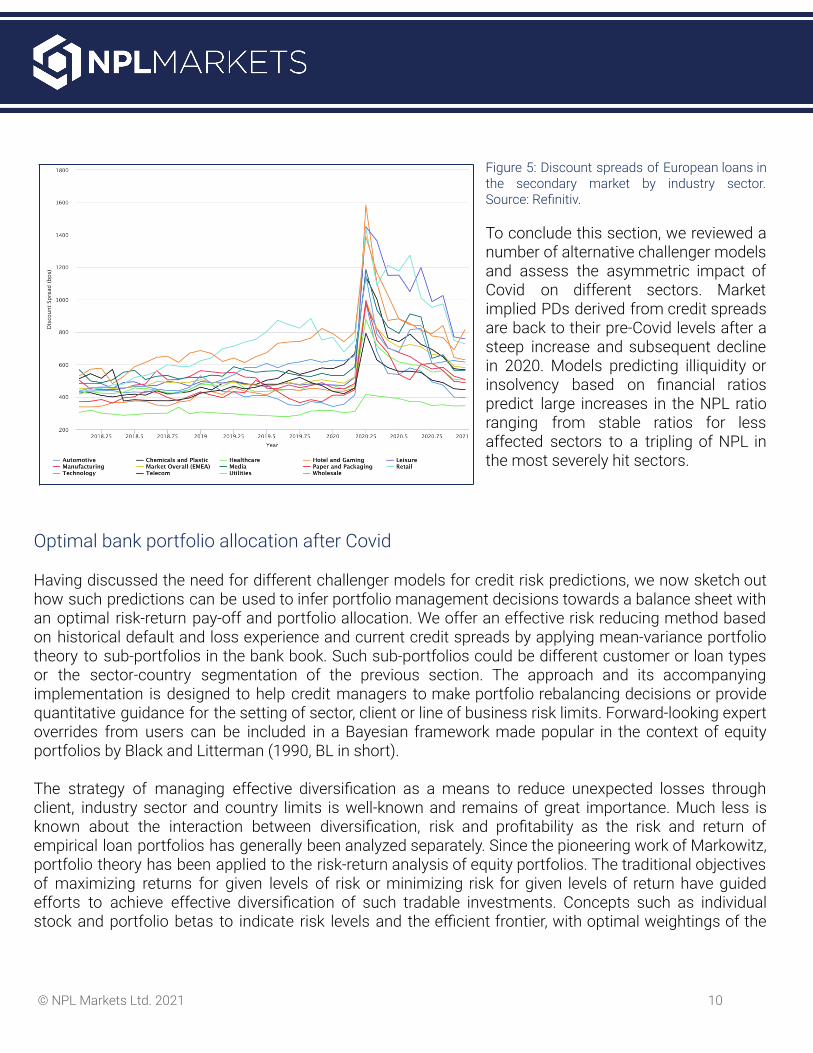
Figure 5: Discount spreads of European loans inthe secondary market by industry sector.Source: Refinitiv.
To conclude this section, we reviewed anumber of alternative challenger modelsand assess the asymmetric impact ofCovid on different sectors. Marketimplied PDs derived from credit spreadsare back to their pre-Covid levels after asteep increase and subsequent declinein 2020. Models predicting illiquidity orinsolvency based on financial ratiospredict large increases in the NPL ratioranging from stable ratios for lessaffected sectors to a tripling of NPL inthe most severely hit sectors.
Optimal bank portfolio allocation after Covid
Having discussed the need for different challenger models for credit risk predictions, we now sketch outhow such predictions can be used to infer portfolio management decisions towards a balance sheet withan optimal risk-return pay-off and portfolio allocation. We offer an effective risk reducing method basedon historical default and loss experience and current credit spreads by applying mean-variance portfoliotheory to sub-portfolios in the bank book. Such sub-portfolios could be different customer or loan typesor the sector-country segmentation of the previous section. The approach and its accompanyingimplementation is designed to help credit managers to make portfolio rebalancing decisions or providequantitative guidance for the setting of sector, client or line of business risk limits. Forward-looking expertoverrides from users can be included in a Bayesian framework made popular in the context of equityportfolios by Black and Litterman (1990, BL in short).
The strategy of managing effective diversification as a means to reduce unexpected losses throughclient, industry sector and country limits is well-known and remains of great importance. Much less isknown about the interaction between diversification, risk and profitability as the risk and return ofempirical loan portfolios has generally been analyzed separately. Since the pioneering work of Markowitz,portfolio theory has been applied to the risk-return analysis of equity portfolios. The traditional objectivesof maximizing returns for given levels of risk or minimizing risk for given levels of return have guidedefforts to achieve effective diversification of such tradable investments. Concepts such as individualstock and portfolio betas to indicate risk levels and the efficient frontier, with optimal weightings of the
© NPL Markets Ltd. 2021 10
portfolio assets, are common among investment professionals. The necessary data in terms of historicalreturns and correlations of returns between individual stocks are usually available to perform the portfoliooptimization analysis.
The application of mean-variance analysis to loan portfolios is relatively rare as the typical assumptionsof multivariate Gaussian returns do not apply to loans with their highly skewed loss distributions. Inaddition, long-term return data on loan pools are largely missing in the public domain and individual loanreturns are mostly not observable given the limited number of loans that have actively quoted prices inthe secondary loan market. Research has shown that mean-variance analysis may still be valid in anon-Gaussian context. The approach implemented by us follows the Basel-Vasicek framework andMencia (2012) in using the non-linear probit transformation to generate negatively skewed loan returns,but at the same time remains a function of a vector of underlying Gaussian state variables. In otherwords, while the systematic risk factors are assumed (multivariate) normal, loss and return distributionsare highly skewed as a result of the probit transformation. In this context, the means and variances ofportfolio returns remain valid measures of profitability and risk, respectively. As shown by Mencia, simplesingle-period returns for a homogeneous sub-portfolio are given by the difference of the credit spread netof funding and operational costs less the expected loss rate. While individual loan returns are mostly notobservable, the problem is usually addressed by bucketing loans with similar risk characteristics intosegments (aka sub-portfolios or replines), for which the historical performance is easy to observe.
Different champion and challenger loss models will predict different outcomes under the selectedmacroeconomic recovery scenarios after Covid. Linking returns to point-in-time expected losses opensup the possibility to use the same model for stress testing as for portfolio optimization, i.e. find theoptimal portfolio allocation for a given macroeconomic stress scenario. Forward-looking expertinformation can be included in a Bayesian BL style. Closed form expressions for the expected returns,variances, and covariances between different loans are available. The covariance matrix of returns doesnot only depend on the loss distribution, but also on the granularity of the portfolios. We calculateannualized returns (measured quarterly) as the difference between the currently observed credit spreadsnet of funding and other costs less the expected loss rate. Rather than minimizing risk as measured bythe return variance, we could directly minimize downside risk measures such as value at risk or expectedshortfall, which play a prominent role in the management of economic risk.
The approach pioneered by Black and Litterman, allows the users to blend their subjective views onindividual asset returns into a normally distributed reference model. BL provides a clear Bayesian way tospecify investors’ views and to blend the investors’ views with prior information. The assumption that theassets returns be normally distributed seems to prevent the application of BL to loan portfolios withhighly skewed return distributions. However, it has been shown in the work of Meucci (2010) how this isnot the case: as long as the systematic risk factors creating the randomness are normal, BL can beeffectively used to process views on these risk factors. Here we use the BL formula to process views onthe repline-specific probit-transformed loss rate that is assumed Gaussian as in the Basel-Vasicek model.BL addressed the important practical problem of how to include expert views in optimal asset allocation.
© NPL Markets Ltd. 2021 11

A view is a statement on the relative or absolute forward-looking performance of individual asset returns,which typically differs from the historical return or loss experience, a key feature in the current situationwhere prediction based on historical data may be misleading. A view corresponds to statements on theexpected return, whereas the covariance is assumed known. The BL mean and covariance matrix arethen used to determine the optimal allocation to the different portfolio segments that includes theexpert’s views.
As usual when optimizing portfolios certain boundary conditions and constraints must be obeyed. Inpractice a large number of constraints could be relevant like risk budgets, limits set by risk policy and boxconstraints which are effectively borrower, sector or country limits. The proposed framework andanalytics offers an intuitive and path towards a more efficient bank balance sheet.
References
Altman, E. I., M. Iwanicz-Drozdowska, E. K. Laitinen, and A. Suvas. 2014. Distressed firm and bankruptcy predictionin an international context: A review and empirical analysis of Altman’s z-score model. Working Paper, NYU.
Black, F., and Litterman, R. (1991) Global asset allocation with equities, bonds, and currencies, Fixed IncomeResearch. Goldman Sachs, 1991.
Carletti, Elena, Tommaso Oliviero, Marco Pagano, Loriana Pelizzon, and Marti Subrahmanyam, The COVID-19 Shockand Equity Shortfall: Firm-level Evidence from Italy, June 2020. CEPR Discussion Paper DP14831.
Gourinchas, P-O, S Kalemli-Ozcan, V Penciakova, and N Sander (2020), Covid-19 and SME failures, NBER WorkingPaper No. 27877.
Guerini, Mattia, Lionel Nesta, Xavier Ragot, and Stefano Schiavo, Firm liquidity and sol- vency under the Covid-19lockdown in France, OFCE Policy Brief, July 2020, (76).
Mencia, J. (2012), Assessing the risk-return trade-off in loan portfolios, Journal of Banking and Finance 36(6),1665–1677.
Meucci, A. (2010), The Black-Litterman Approach: Original Model and Extensions, Working paper
NPL Markets (2021), Evaluated pricing of corporate loans. Valuing illiquid bank loans with market data.nplmarkets.com/en/research
OECD, Coronavirus (COVID-19): SME Policy Responses, Note, OECD July 2020.
Schivardi, F and G Romano, A simple method to estimate firm's liquidity needs during the COVID-19 crisis with anapplication to Italy, Covid Economics, 2020, 35, 51–69.
© NPL Markets Ltd. 2021 12
About NPL Markets
NPL Markets is an innovative marketplace for illiquid loan trading, operating throughout Europe, that isbased upon four pillars: Data preparation, Marketplace execution and investor reach, Valuation, andReporting. NPL Markets helps sellers of NPL to prepare and standardize transaction data and select theoptimal transaction portfolio based on balance sheet impact. Our platform also supports investors withdeal screening and initial valuation with online revaluation and reporting tools.
With the help of its proprietary data mapping and transformation tool NPL Markets helps financialinstitutions to map their data to the data formats defined by EBA for NPL transactions, EBA for thevaluation in resolution, and by ESMA for securitisation disclosures. Once standardized and validated theloan-level data can be uploaded to the NPL Markets valuation tool to conduct a detailed discounted cashflow analysis using pre-populated pricing parameters in different macroeconomic scenarios across allmajor asset classes.
Disclaimer
This paper contains confidential information about NPL Markets, current at the date hereof. This presentation is not intended toprovide the sole basis for evaluating NPL Markets and should not be considered as a recommendation with respect to it or anyother matter.
This document and the information contained herein are not an offer of securities for sale in the United States and are not forpublication or distribution to persons in the United States (within the meaning of Regulation S under the United States SecuritiesAct of 1933, as amended).
This presentation and the information contained herein does not constitute or form part of any (i) offer or invitation orinducement to sell or issue, or any solicitation of any offer to purchase or subscribe for, any securities or (ii) invitation orinducement to engage in investment activity within the meaning of Section 21 of the United Kingdom Financial Services andMarkets Act 2000, as amended, nor shall any part of this presentation nor the fact of its distribution form part of or be relied onin connection with any contract or investment decision relating thereto.
© NPL Markets Ltd. 2021 13