Embed Size (px)
Citation preview

Chicago Board of TradeInterest Rate Products Market Development
2003 Taipei Interest Rate Futures Conference
November 20 - 21, 2003

CBOT Interest Rate Product Line
• Family of Curves in the Interest Rate Complex– Treasury– Credit Curves
• LIBOR (A to AA)• Agencies (AAA)
– Tax Exempt (AAA)– Federal Funds

Major Trends
• Late 1970s ~ 1989– Inflation Peaks and then Declines– The Era of Deficit Spending
• 1990 ~ 2000– From Record Deficits to Record Surplus– Series of Market Crises:
Asia/Russia/LTCM• 2000 ~
– The LIBOR Era– The Electronic Trading Era

Major Factors Affecting Growth
• Growing Debt Level and Supply of Treasury Securities. Growth in cash market trading
• Benefits of Futures:– Markets are Open and Transparent– Standardized Products– One Centralized Marketplace
• Electronic Trading– Speed of Execution– Global Distribution– Cost Efficiencies

Historical Timeline of the CBOT Interest Rate Product Line
• 1975 – GNMA Futures (Government National Mortgage Association)
• 1977 – U.S. Treasury Bond Futures. • 1979 – “Saturday Night Special” FED
changes policy to target the money supply.
• 1982 – Options on U.S. T-Bond futures; 10-Year U.S. Treasury Note futures.
• 1983 – US budget deficit hits record $200 bn.

Historical Timeline of the CBOT Interest Rate Product Line
• 1984 - Options on 10-year T-notes• 1985 – Municipal Bond futures • 1986 - Oil collapses to $10. 30 year T-
Bond yield drops to 7.11 %. “Street” caught in a giant squeeze in cash 9 ¼ T- Bonds of 2016 – basis explodes to 350/32nds.
• 1987 - Open Outcry “Evening Session”
• 1987 - October 19 stock market crash – Dow falls 22 % - huge bond market rally.
Historical Timeline of the CBOT Interest Rate Product Line
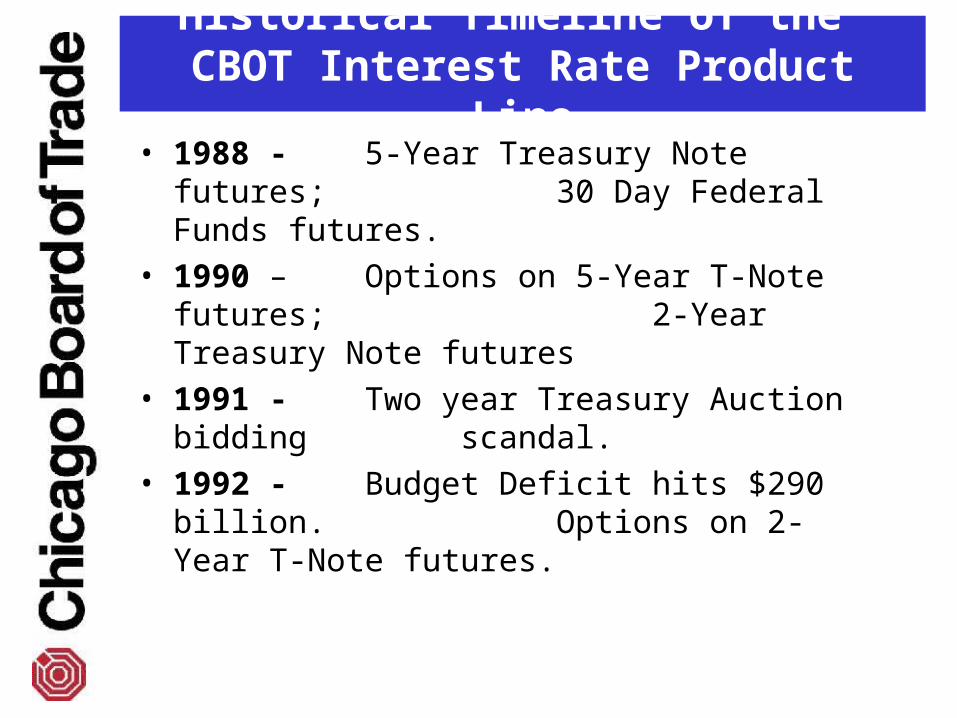
• 1988 - 5-Year Treasury Note futures; 30 Day Federal Funds
futures. • 1990 – Options on 5-Year T-Note
futures; 2-Year Treasury Note futures
• 1991 - Two year Treasury Auction bidding scandal.
• 1992 - Budget Deficit hits $290 billion. Options on 2-Year T-Note
futures.

Historical Timeline of the CBOT Interest Rate Product Line
• 1994 - Project A Afternoon Session• 1995 - Project A Night Session• 1997 - Asian currency crisis. • 1998 - Russia debt default. Long Term
Capital Management collapse. Credit spreads widen, treasury cross hedges lose some effectiveness.
• 1998 - Start of 4 years of budget surpluses.
• 2000 – 10-Year & 5-Year Agency Debt futures & options.
• 2000 - a/c/e platform replaces Project A.

Historical Timeline of the CBOT Interest Rate Product Line
• 2000 - Record budget surplus of $236 bn. FASB 133 – Hedge Accounting.
• 2001 - Treasury ends of 30-year bond. • 2001 – 10-Year & 5-Year Interest Rate
Swap futures and options. • 2001 - Electronic trading in treasury
futures at 25 % of total. • 2002 - Electronic trading in treasury
futures at 50% of total. • 2003 - Electronic trading in treasury
futures surpasses 75% of total volume.
• 2003 - Begin e-cbot Liffe Connect platform.

CBOT Product Lines by Share of Volume
82%
3%
15%
Interest Rates Equity index Commodity

Growth of U.S. Debt US Treasury Debt - US$ Billions
0
1,000
2,000
3,000
4,000
5,000
6,000
7,000
8,000
Mar
-92
Sep
-92
Mar
-93
Sep
-93
Mar
-94
Sep
-94
Mar
-95
Sep
-95
Mar
-96
Sep
-96
Mar
-97
Sep
-97
Mar
-98
Sep
-98
Mar
-99
Sep
-99
Mar
-00
Sep
-00
Mar
-01
Sep
-01
Mar
-02
Sep
-02
Mar
-03
Total Treasury Debt
FED & US Govt Held
Foreign Held

Growth of U.S. Debt
0%
10%
20%
30%
40%
50%
60%
70%
80%
90%
100%
Ma
r-9
2
Se
p-9
2
Ma
r-9
3
Se
p-9
3
Ma
r-9
4
Se
p-9
4
Ma
r-9
5
Se
p-9
5
Ma
r-9
6
Se
p-9
6
Ma
r-9
7
Se
p-9
7
Ma
r-9
8
Se
p-9
8
Ma
r-9
9
Se
p-9
9
Ma
r-0
0
Se
p-0
0
Ma
r-0
1
Se
p-0
1
Ma
r-0
2
Se
p-0
2
Ma
r-0
3
Se
p-0
3
Ma
r-0
4
Foreign Held as Percent of Total Privately Held
US FED & Govt Held as a Percent of Total Debt

CBOT Treasury Futures Average Daily Volume - Contracts
0
250,000
500,000
750,000
1,000,000
1,250,000
1,500,000
Jan-
80
Jan-
82
Jan-
84
Jan-
86
Jan-
88
Jan-
90
Jan-
92
Jan-
94
Jan-
96
Jan-
98
Jan-
00
Jan-
02
Jan-
04
2yr
5yr
10yr
30yr

CBOT Treasury Options Average Daily Volume - Contracts
0
100,000
200,000
300,000
400,000
500,000
Jan-
80
Jan-
81
Jan-
82
Jan-
83
Jan-
84
Jan-
85
Jan-
86
Jan-
87
Jan-
88
Jan-
89
Jan-
90
Jan-
91
Jan-
92
Jan-
93
Jan-
94
Jan-
95
Jan-
96
Jan-
97
Jan-
98
Jan-
99
Jan-
00
Jan-
01
Jan-
02
Jan-
03
Jan-
04
5yr
10yr
30yr

CBOT Treasury Futures vs. Cash
$Dollar Volume Comparisons Average Daily $volume June ~ Sept 2003In US$ Millions source: NY Fed , CBOT
0
20,000
40,000
60,000
80,000
100,000
120,000
140,000
160,000
2y 5y 10y 30y
Futures Cash

CBOT Treasury Futures Electronic Platform Share of Volume
0%
10%
20%
30%
40%
50%
60%
70%
80%
90%
100%
1998 1999 2000 2001 2002 2003

CBOT Credit & LIBOR Futures Average Daily Volume
0
2,000
4,000
6,000
8,000
10,000
12,000
14,000
16,000
18,000
20,000
Oct
-88
Oct
-89
Oct
-90
Oct
-91
Oct
-92
Oct
-93
Oct
-94
Oct
-95
Oct
-96
Oct
-97
Oct
-98
Oct
-99
Oct
-00
Oct
-01
Oct
-02
Oct
-03
10 Yr Muni
10 Yr Agency
10 Yr Swap

CBOT 30 Day Federal Funds Futures & Options - Average Daily Volume
0
20,000
40,000
60,000
80,000
100,000
120,000
Oc
t-8
8
Oc
t-8
9
Oc
t-9
0
Oc
t-9
1
Oc
t-9
2
Oc
t-9
3
Oc
t-9
4
Oc
t-9
5
Oc
t-9
6
Oc
t-9
7
Oc
t-9
8
Oc
t-9
9
Oc
t-0
0
Oc
t-0
1
Oc
t-0
2
Oc
t-0
3
Fed Funds Options
Fed Funds Futures

• pension funds• bankers• cash managers• governments• insurance
companies• mortgage bankers• thrifts• underwriters
• bond dealers• corporate treasurers• hedge fund
managers• investment bankers• mutual fund mangers• portfolio mangers• trust fund managers• arbitrage firms
Market Participants

CME/CBOT Common Clearing Link
• The Common Clearing Link (CCL) agreement was signed in April 2003 by the CBOT and the CME.
• The CCL will follow the same timetable as the switch to the new e-CBOT Powered by Liffe Connect®. When a product begins trading on the new e-CBOT platform, it will also begin clearing through the new CCL.
• The CCL will clear approximately 85 % of all U.S. futures and futures options.
CME/CBOT Common Clearing Link
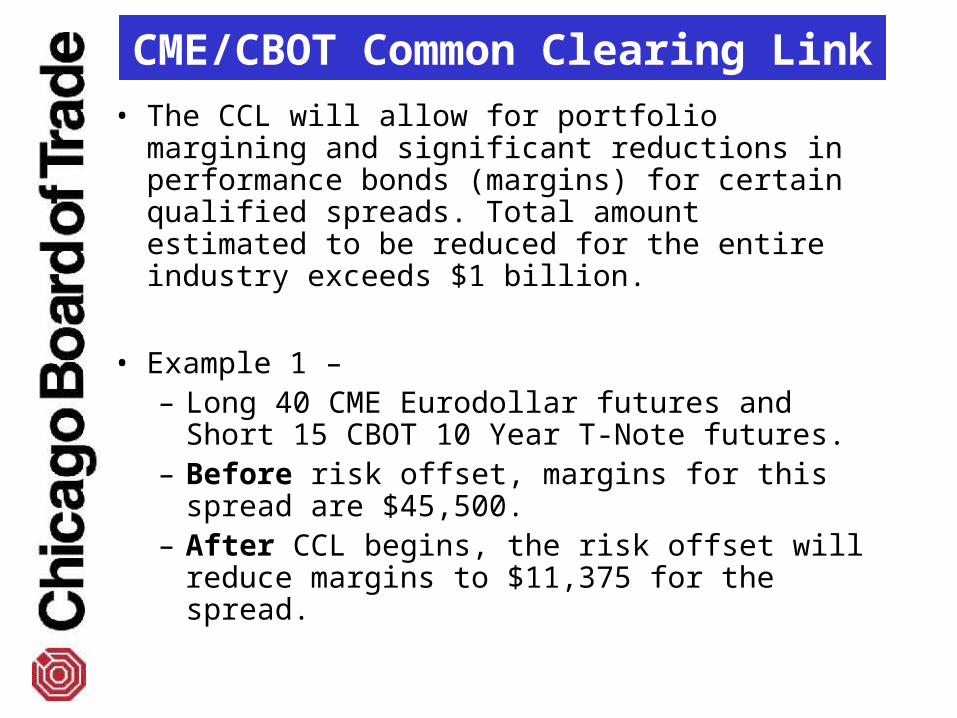
• The CCL will allow for portfolio margining and significant reductions in performance bonds (margins) for certain qualified spreads. Total amount estimated to be reduced for the entire industry exceeds $1 billion.
• Example 1 – – Long 40 CME Eurodollar futures and Short
15 CBOT 10 Year T-Note futures. – Before risk offset, margins for this spread
are $45,500. – After CCL begins, the risk offset will reduce
margins to $11,375 for the spread.

• State of the art electronic platform. – Host + Gateway + Network
• Over 110 Firms in 181 locations are participating in the migration to the new e-CBOT platform.
• Increased built-in functionality – – 32 option spread strategies – 6 futures strategies.
• Multiple trade matching algorithms: Price-Time and Pro-Rata.
e-CBOT Powered by LIFFE CONNECT®

e-CBOT Powered by LIFFE CONNECT®
• Timetable for transition– November 24, 2003
• Interest Rate Swap products• Federal Funds products• Municipal bond products• Dow Equity Index products
– January 2, 2004• Treasury complex products• Agency complex products• Agricultural complex products