Embed Size (px)
Citation preview
Report No. GTL-DOT-11-VOLTBAT
CHEVROLET VOLT BATTERY PACK TESTS
Prepared by
GENERAL TESTING LABORATORIES, INC. 1623 LEEDSTOWN ROAD
COLONIAL BEACH, VIRGINIA 22443
January 20, 2012
FINAL REPORT
Prepared For
U. S. DEPARTMENT OF TRANSPORTATION NATIONAL HIGHWAY TRAFFIC SAFETY ADMINISTRATION
ENFORCEMENT OFFICE OF VEHICLE SAFETY COMPLIANCE
1200 NEW JERSEY AVE., SE WASHINGTON, D.C. 20590
Technical Report Documentation Page 1. Title and Subtitle Chevrolet Volt Battery Pack Tests
2. Report Date: January 20, 2012
3. Author(s) Alan Aylor, General Testing Laboratories, Inc. Gerard Back, Hughes Associates, Inc. Clint Winchester, NSWC – Carderock Division
4. Performing Organ. Rep# GTL-DOT-11-VOLTBAT
5. Contract or Grant No.(s) DTNH22-12-P-01452 DTNH22-12-P-01464
6. Performing Organization Name and Address General Testing Laboratories, Inc. 1623 Leedstown Road Colonial Beach, Va 22443
8.Type of Report and Period Covered: November 4 2011 to January 6, 2012
12. Sponsoring Agency Name and Address U.S. Department of Transportation National Highway Traffic Safety Admin. Enforcement Office of Vehicle Safety Compliance (NVS-220) 1200 New Jersey Ave., S.E., Washington, DC 20590
This publication is distributed by the U.S. Department of Transportation, National Highway Traffic Safety Administration, in the interest of information exchange. The opinions, findings and conclusions expressed in this publication are those of the author(s) and not necessarily those of the Department of Transportation or the National Highway Traffic Safety Administration. The United States Government assumes no liability for its contents or use thereof. If trade or manufacturers' names or products are mentioned, it is only because they are considered essential to the object of the publication and should not be construed as an endorsement. The United States Government does not endorse products or manufacturers.
Prepared By: General Testing Laboratories, Alan Aylor
Prepared By: Hughes Associates, Gerard Back Prepared By: NSWC – Carderock, Clint Winchester
Date: January 20, 2012 FINAL REPORT ACCEPTANCE BY OVSC: Accepted By: Accepted Date:
CONTENTS Page 1.0 INTRODUCTION 1
2.0 TEST ITEM DESCRIPTION 2
3.0 BATTERY INSTRUMENTATION 4
3.1 Voltage 4
3.2 Temperature 4
3.3 Video 4
3.4 Gas Detection 5
4.0 TEST SETUP 7
4.1 Impact Block 7
4.2 Battery Cradle 8
4.3 Supports 9
4.4 Moving Barrier 10
4.5 Cooling System 11
5.0 TEST PROCEDURE 12
5.1 Rollover Procedures 13
5.2 Long Term Monitoring 13
6.0 TEST OBJECTIVES 14
7.0 BATTERY PACK TEST RESULTS 15
7.1 Battery Pack Test Results Overview 15
7.2 Test 1 and Test 2 Detailed Results 16
7.2.1 Test 1 and Test 2 Battery Fire 18
7.3 Test 3 Detailed Results 22
7.3.1 Instrumentation check 24
7.3.2 Battery Damage Operations 24
7.3.3 Arcing Scenario Description 28
7.4 Test 4 Detailed Results 28
7.5 Test 5 Detailed Results 29
7.6 Test 6 Detailed Results 32
8.0 CONDUCTIVITY TEST OF BATTERY COOLANT 33
9.0 CHEMICAL ANALYSIS 36
10.0 FINDINGS AND CONCLUSIONS 36

11.0 REFERENCES 37
ATTACHMENT 1 – REPORT ON CHEMICAL ANALYSIS
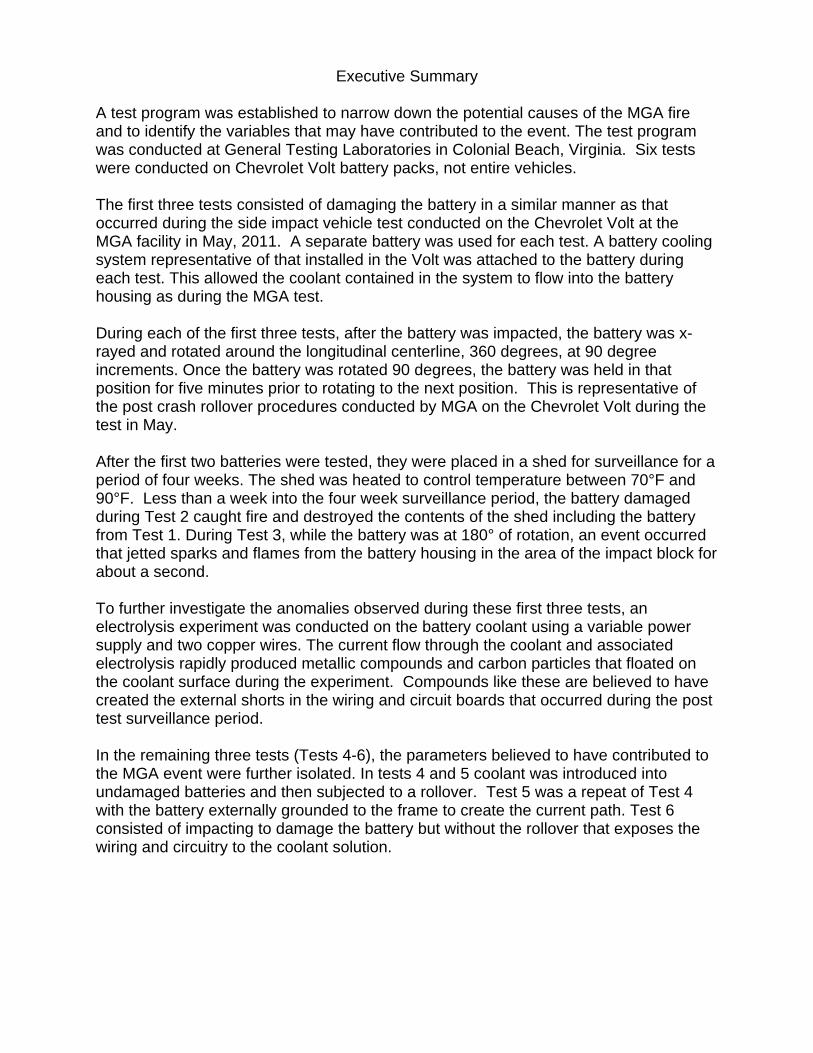
Executive Summary
A test program was established to narrow down the potential causes of the MGA fire and to identify the variables that may have contributed to the event. The test program was conducted at General Testing Laboratories in Colonial Beach, Virginia. Six tests were conducted on Chevrolet Volt battery packs, not entire vehicles. The first three tests consisted of damaging the battery in a similar manner as that occurred during the side impact vehicle test conducted on the Chevrolet Volt at the MGA facility in May, 2011. A separate battery was used for each test. A battery cooling system representative of that installed in the Volt was attached to the battery during each test. This allowed the coolant contained in the system to flow into the battery housing as during the MGA test. During each of the first three tests, after the battery was impacted, the battery was x-rayed and rotated around the longitudinal centerline, 360 degrees, at 90 degree increments. Once the battery was rotated 90 degrees, the battery was held in that position for five minutes prior to rotating to the next position. This is representative of the post crash rollover procedures conducted by MGA on the Chevrolet Volt during the test in May. After the first two batteries were tested, they were placed in a shed for surveillance for a period of four weeks. The shed was heated to control temperature between 70°F and 90°F. Less than a week into the four week surveillance period, the battery damaged during Test 2 caught fire and destroyed the contents of the shed including the battery from Test 1. During Test 3, while the battery was at 180° of rotation, an event occurred that jetted sparks and flames from the battery housing in the area of the impact block for about a second. To further investigate the anomalies observed during these first three tests, an electrolysis experiment was conducted on the battery coolant using a variable power supply and two copper wires. The current flow through the coolant and associated electrolysis rapidly produced metallic compounds and carbon particles that floated on the coolant surface during the experiment. Compounds like these are believed to have created the external shorts in the wiring and circuit boards that occurred during the post test surveillance period. In the remaining three tests (Tests 4-6), the parameters believed to have contributed to the MGA event were further isolated. In tests 4 and 5 coolant was introduced into undamaged batteries and then subjected to a rollover. Test 5 was a repeat of Test 4 with the battery externally grounded to the frame to create the current path. Test 6 consisted of impacting to damage the battery but without the rollover that exposes the wiring and circuitry to the coolant solution.
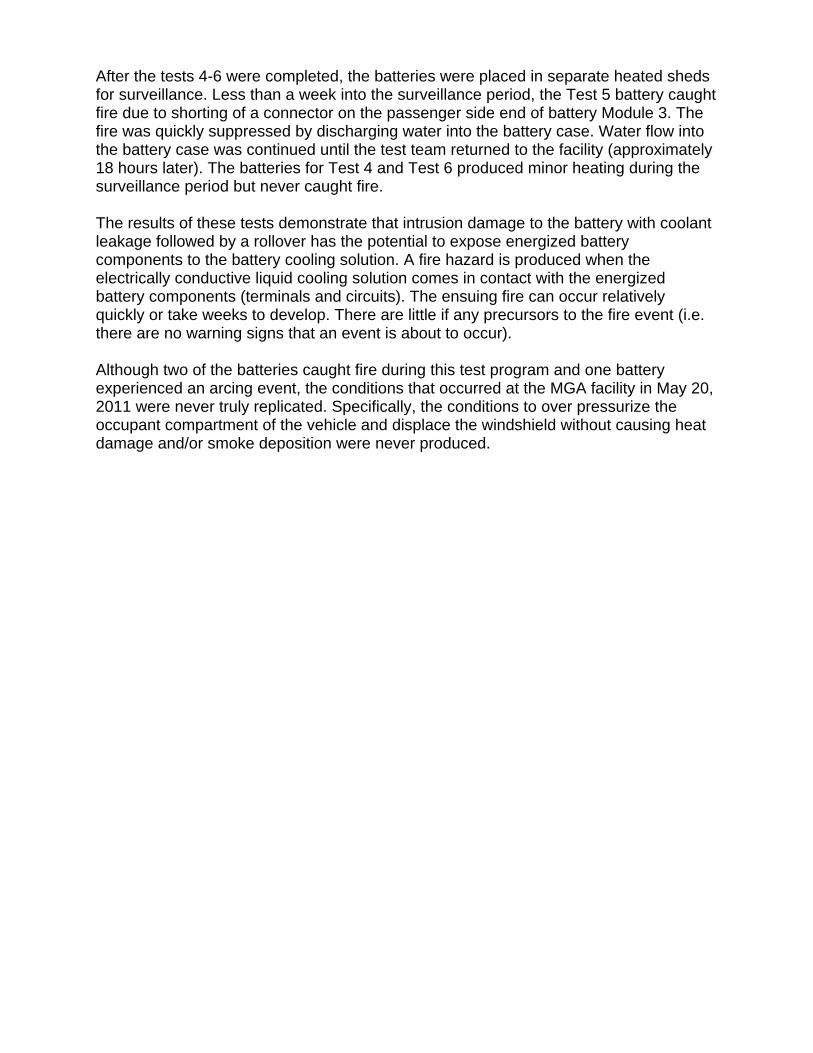
After the tests 4-6 were completed, the batteries were placed in separate heated sheds for surveillance. Less than a week into the surveillance period, the Test 5 battery caught fire due to shorting of a connector on the passenger side end of battery Module 3. The fire was quickly suppressed by discharging water into the battery case. Water flow into the battery case was continued until the test team returned to the facility (approximately 18 hours later). The batteries for Test 4 and Test 6 produced minor heating during the surveillance period but never caught fire. The results of these tests demonstrate that intrusion damage to the battery with coolant leakage followed by a rollover has the potential to expose energized battery components to the battery cooling solution. A fire hazard is produced when the electrically conductive liquid cooling solution comes in contact with the energized battery components (terminals and circuits). The ensuing fire can occur relatively quickly or take weeks to develop. There are little if any precursors to the fire event (i.e. there are no warning signs that an event is about to occur). Although two of the batteries caught fire during this test program and one battery experienced an arcing event, the conditions that occurred at the MGA facility in May 20, 2011 were never truly replicated. Specifically, the conditions to over pressurize the occupant compartment of the vehicle and displace the windshield without causing heat damage and/or smoke deposition were never produced.
1
1.0 INTRODUCTION
A fire occurred at the MGA Research facility in Burlington, Wisconsin over the weekend of June 3–6, 2011 involving a 2011 Chevrolet Volt.
NHTSA initiated a program to determine the cause of Chevrolet Volt fire. This program consisted of a thorough forensic examination of the burned vehicle and battery, a supplemental Chevrolet Volt crash test and a series of battery pack tests conducted at General Testing Laboratories (GTL) in Colonial Beach, Virginia. This report summarizes the battery pack tests and monitoring conducted at GTL during November and December 2011 and January 2012.

2
2.0 TEST ITEM DESCRIPTION
Six 2011 Chevrolet Volt Battery packs were tested during this program. For the remainder of this report, the term “battery” will refer to the lithium-ion propulsion battery in the Volt. Three of the batteries were removed from NHTSA vehicles and three were new batteries supplied by General Motors. The table below identifies each battery by test number.
Test Number Description 1 Removed from Vehicle 2 Removed from Vehicle 3 Removed from Vehicle 4 New 5 New 6 New
All batteries were inspected for mechanical and electrical soundness and were fully charged to a nominal 390 volts 87% state of charge (SOC) prior to testing.
An illustration of the battery is provided in Figure 2.1. The battery is “T” shaped and consists of 288 LG P1 pouch cells arranged in three modules. One side of each cell is adjacent to a cooling fin that contains a glycol/water solution designed to thermally manage the cell environment (both cooling and heating). The first module (Module 1) is located in the tunnel between the two front seats and contains 90 cells and 45 cooling fins. The second module (Module 2) is located in the tunnel just in front of the backseat and contains 72 cells and 36 cooling fins. The third module (Module 3) is located under the back seat of the vehicle and contains 126 cells and 63 cooling fins. From a numbering standpoint, the cells adjacent to the fins are; fin # times 2 minus 1 and fin # times 2. The cooling fins are numbered from the back of the battery working forward (i.e. fin 1 is on the driver’s side end of Module 3). The modules are shown from left to right in Figure 2.1. A photograph of an individual cell and cooling fin are provided as Figure 2.2.
As a general description of the LG P1 cell, each cell is about 5 inches wide, 7 inches tall and about ¼ inch thick. Each cell consists of 33 layers of alternating sheets of different metals referred to as current collectors. There are 16 cathode sheets (lithium manganese coated aluminum) and 17 anode sheets (carbon coated copper) in a LG P1 cell. These sheets are separated by a thin, ceramic coated film of plastic (polyethylene) referred to as a separator. The lithium ions travel between the anode and the cathode through a liquid referred to as an electrolyte which is a carbonate solution containing lithium hexafluorophosphate (LiPF6). The cell casing consists of a polymer coated aluminum pouch.

3
Figure 2.1 – Battery Configurations and Location
Figure 2.2 – LG P1 Cell and Cooling Fin
The battery is equipped with a voltage and temperature monitoring system. The system consists of four circuits boards referred to as Voltage Temperature Sub Modules (VTSMs). The VTSMs are located on the top of each battery module. The locations of the VTSMs are shown as the numbers on Figure 2.1.
The main power lines, referred to as bus bars, run along the outside of each module and can be seen in Figure 2.1 as the orange stripes along the sides of each module.
Module 3
Module 2
Module 1

4
3.0 BATTERY INSTRUMENTATION
With the exception of voltage measurement, all of the instrumentation described in this section was installed by The Naval Surface Warfare Center – Carderock Division.
3.1 VOLTAGE
Battery voltages were monitored during and after testing by utilizing the GM Can Bus and data acquisition software recorded on a separate computer for each battery.
3.2 TEMPERATURE
Type K thermocouples were installed at the following locations.
Thermocouple Number
Location
1 Top of forward electronics (VITM) 2 Top of positive bus bar forward of module 1 3 Top of black connector for VTSM* 1 Module 1 4 Center Top of VTSM 1 Module 1 5 Center Bottom of VTSM 1 Module 1 6 Top on negative bus bar between Modules 1 and 2 7 Top of black connector for VTSM 2 Module 2 8 Center Top of VTSM 2 Module 2 9 Center Bottom of VTSM 2 Module 2 10 Top of black connector for VTSM 3 Module 3 Passenger Side 11 Center Top of VTSM 3 Module 3 Passenger Side 12 Center Bottom of VTSM 3 Module 3 Passenger Side 13 Top of black connector for VTSM 4 Module 3 Driver Side 14 Center Top of VTSM 4 Module 3 Driver Side 15 Center Bottom of VTSM 4 Module 3 Driver Side
*VTSM refers to “Voltage and Temperature Sub Module” The thermocouples were monitored using an Argent 34970A data acquisition/switch unit. The data was continuously recorded throughout the testing and long term monitoring. This digital data has been supplied under separate cover.
3.3 VIDEO
The batteries used in tests 1, 2 and 3 had three internal miniature video cameras and led lights installed inside the batteries.
The testing was also monitored with stationary and hand held video cameras as required. For long term monitoring additional video cameras were installed in the storage sheds. All video was recorded on hard drives and has been delivered under separate cover.
5
3.4 GAS DETECTION
For the gas analysis portion of testing, Carderock used a Crowcon TriplePlus+ gas detector. It was configured to measure four gases: methane (CH4), ammonia (NH3), sulfur dioxide (SO2), and volatile organics (VO). Methane concentration was expressed using lower explosive limit values, and the remaining gases NH3, SO2 and VO had their concentrations recorded in parts per million (ppm).
The test setup required a 50 foot polyethylene tubing to extend from the battery cases to the Crowcon inlet port. A pump was installed inside of the Crowcon, which pulled the air source from the testing location to the internal sensors. When the gases reached the sensor, they exited the Crowcon through the inlet port. The outlet port was instrumented with a polyethylene tubing long enough for the exhaust to exit safely.
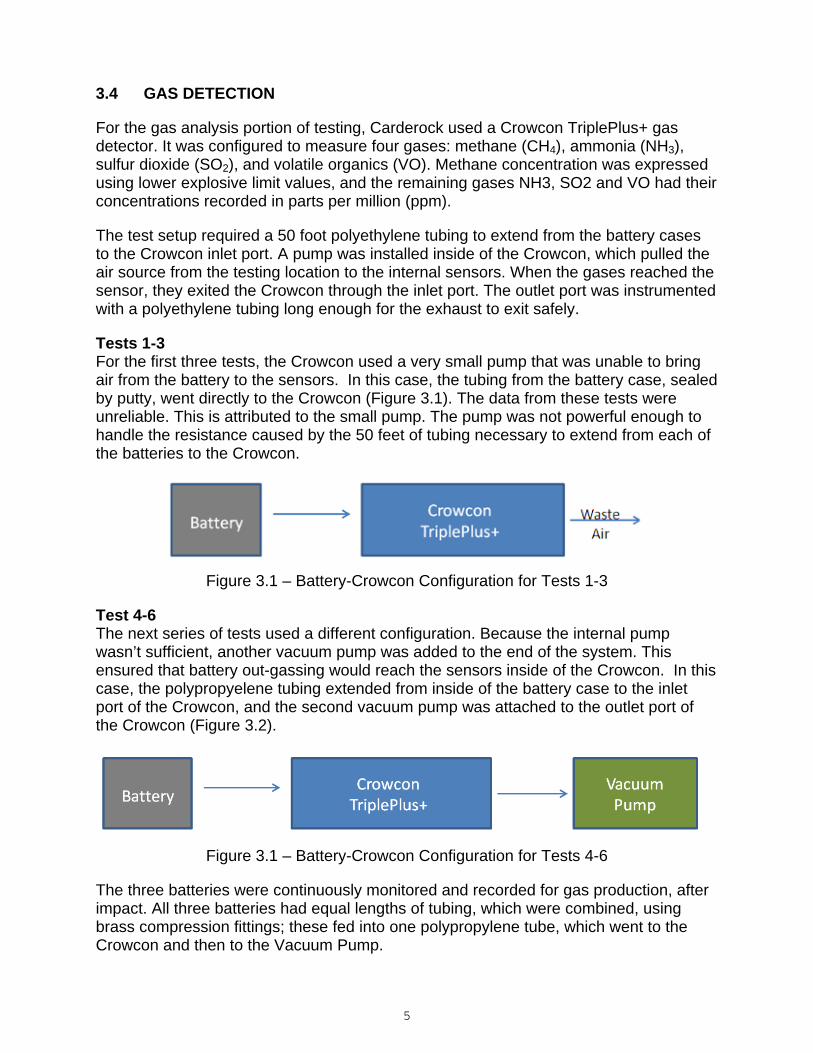
Tests 1-3 For the first three tests, the Crowcon used a very small pump that was unable to bring air from the battery to the sensors. In this case, the tubing from the battery case, sealed by putty, went directly to the Crowcon (Figure 3.1). The data from these tests were unreliable. This is attributed to the small pump. The pump was not powerful enough to handle the resistance caused by the 50 feet of tubing necessary to extend from each of the batteries to the Crowcon.
Figure 3.1 – Battery-Crowcon Configuration for Tests 1-3
Test 4-6 The next series of tests used a different configuration. Because the internal pump wasn’t sufficient, another vacuum pump was added to the end of the system. This ensured that battery out-gassing would reach the sensors inside of the Crowcon. In this case, the polypropyelene tubing extended from inside of the battery case to the inlet port of the Crowcon, and the second vacuum pump was attached to the outlet port of the Crowcon (Figure 3.2).
Figure 3.1 – Battery-Crowcon Configuration for Tests 4-6
The three batteries were continuously monitored and recorded for gas production, after impact. All three batteries had equal lengths of tubing, which were combined, using brass compression fittings; these fed into one polypropylene tube, which went to the Crowcon and then to the Vacuum Pump.

6
The data collected from the Crowcon was accessed using the Portables PC software, provided by Crowcon. The gas data was continuously recorded during testing and long term monitoring. The data has been supplied under separate cover.

7
4.0 TEST SETUP
4.1 IMPACTOR BLOCK NHTSA designed an impactor block to replicate the damage that the Volt battery received during the 214 pole test that resulted in a fire. NSWC – Carderock fabricated three of these impactor blocks and supplied them to GTL for the battery impact testing. See photograph at Figure 4.1.
Figure 4.1 – Impactor Block
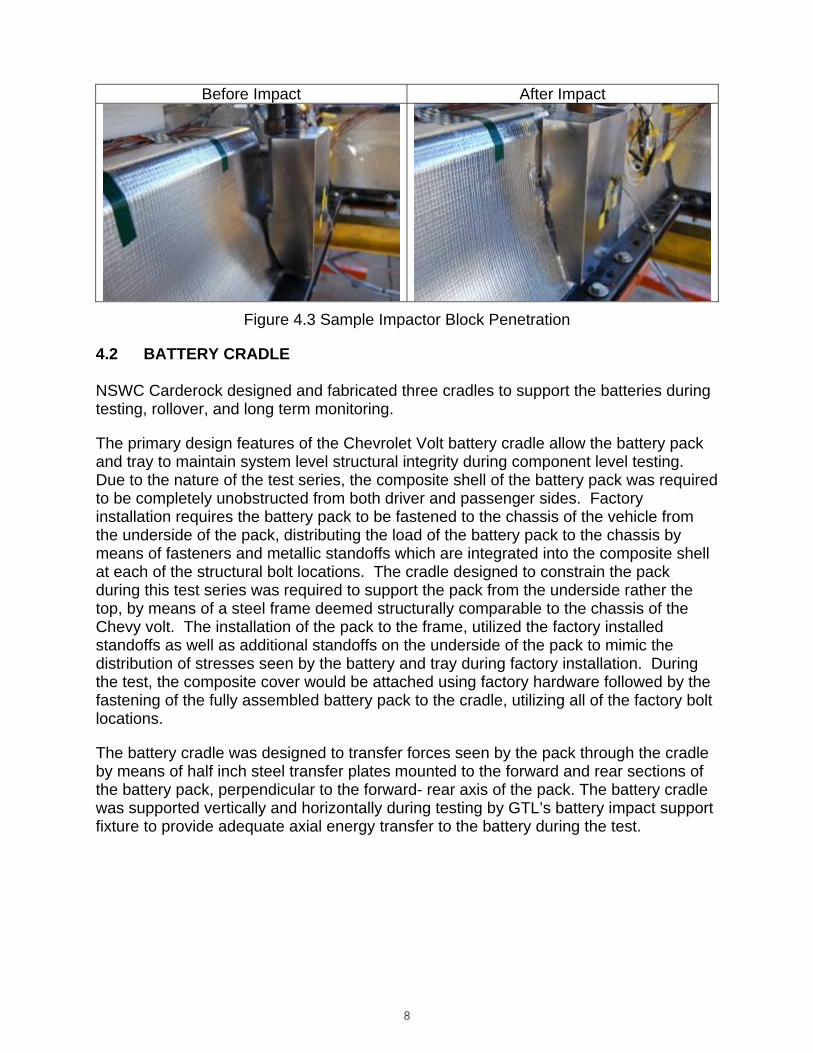
The impactor block was shaped to simulate the side of the tunnel and stiffener that penetrated the battery during the test at MGA. The impactor block was made of HY100 steel plate. The block was installed on the driver’s side of the battery at the junction between Modules 1 and 2. Two 1” diameter rods were connected to the impactor block, run through the opening between the two modules and through a wood block assembly on the opposite side of the battery. Crimp rings were installed on the rods in the center of the wooden block to keep the device in compression after impact. A photograph of the impactor block assembly is shown in Figure 4.2. Photographs of the impactor block in position both before and after impact are shown in Figure 4.3.
Figure 4.2 – Impactor Block Assembly
8
Before Impact After Impact
Figure 4.3 Sample Impactor Block Penetration
4.2 BATTERY CRADLE NSWC Carderock designed and fabricated three cradles to support the batteries during testing, rollover, and long term monitoring.
The primary design features of the Chevrolet Volt battery cradle allow the battery pack and tray to maintain system level structural integrity during component level testing. Due to the nature of the test series, the composite shell of the battery pack was required to be completely unobstructed from both driver and passenger sides. Factory installation requires the battery pack to be fastened to the chassis of the vehicle from the underside of the pack, distributing the load of the battery pack to the chassis by means of fasteners and metallic standoffs which are integrated into the composite shell at each of the structural bolt locations. The cradle designed to constrain the pack during this test series was required to support the pack from the underside rather the top, by means of a steel frame deemed structurally comparable to the chassis of the Chevy volt. The installation of the pack to the frame, utilized the factory installed standoffs as well as additional standoffs on the underside of the pack to mimic the distribution of stresses seen by the battery and tray during factory installation. During the test, the composite cover would be attached using factory hardware followed by the fastening of the fully assembled battery pack to the cradle, utilizing all of the factory bolt locations.
The battery cradle was designed to transfer forces seen by the pack through the cradle by means of half inch steel transfer plates mounted to the forward and rear sections of the battery pack, perpendicular to the forward- rear axis of the pack. The battery cradle was supported vertically and horizontally during testing by GTL’s battery impact support fixture to provide adequate axial energy transfer to the battery during the test.

9
Additional test procedures required the battery to be rotated 360 degrees about the forward rear axis of the pack. To accomplish this, two 1000 pound rated engine stands were attached to the steel transfer plates, about the assembly’s center of gravity, on the forward and rear ends of the cradle. The use of such engine stands allowed for full rotation of the test item as well as locking in position at 90 degree intervals. Throughout the procedure both engine stands remained attached for safety, transportation and storage purposes. See photograph at Figure 4.4.
Figure 4.4 – Battery Cradle with Engine Stand & Battery
4.3 SUPPORTS GTL designed and fabricated supports that were attached to its fixed impact barrier to hold the battery during testing. See photograph at Figure 4.5. These supports also acted as a stop for the impacting moving barrier.
Figure 4.5 – Battery supports

10
4.4 MOVING BARRIER GTL utilized its SAE J972 moving rigid barrier common carriage with a flat impact surface attached for impact testing of the batteries. A cone shaped jack stand was attached to the barrier face, herein after referred to as the “Stinger”. See photograph at Figure 4.6. The stinger has a 3 inch diameter acme threaded nose that provides a means to adjust the amount of stinger protrusion outward from the moving barrier face. See photograph at Figure 4.7.
Figure 4.6 – Stinger attached to moving barrier face
Figure 4.7 - Stinger

11
4.5 COOLING SYSTEM A cooling system was assembled to simulate the one that is installed in the Chevrolet Volt and was attached to the battery during each test. This allowed the coolant contained in the system to flow into the battery housing as observed during the MGA test. The cooling system consisted of a heat exchanger, a coolant reservoir, a coolant pump and the associated hoses to connect all of the components together. A photograph of the battery cooling system is shown in Figure 4.8.
Figure 4.8 Battery Cooling System Test Setup
The first three tests were conducted with a 50/50 mixture of commercially available Prestone DEX-COOL and de-mineralized water. The Prestone DEX-COOL is approved by GM for use in GM vehicles. The final three tests were conducted with a 50/50 mixture of GM DEX-COOL and de-mineralized water purchased from a General Motors dealer.
12
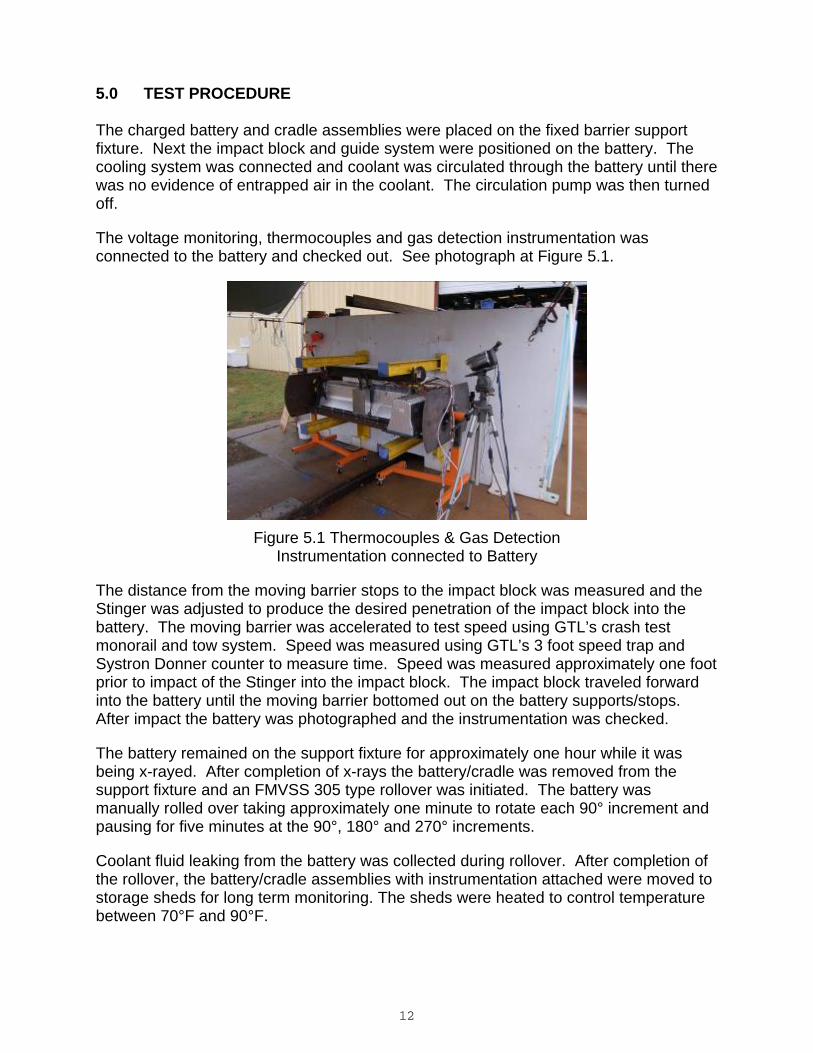
5.0 TEST PROCEDURE The charged battery and cradle assemblies were placed on the fixed barrier support fixture. Next the impact block and guide system were positioned on the battery. The cooling system was connected and coolant was circulated through the battery until there was no evidence of entrapped air in the coolant. The circulation pump was then turned off.
The voltage monitoring, thermocouples and gas detection instrumentation was connected to the battery and checked out. See photograph at Figure 5.1.
Figure 5.1 Thermocouples & Gas Detection
Instrumentation connected to Battery
The distance from the moving barrier stops to the impact block was measured and the Stinger was adjusted to produce the desired penetration of the impact block into the battery. The moving barrier was accelerated to test speed using GTL’s crash test monorail and tow system. Speed was measured using GTL’s 3 foot speed trap and Systron Donner counter to measure time. Speed was measured approximately one foot prior to impact of the Stinger into the impact block. The impact block traveled forward into the battery until the moving barrier bottomed out on the battery supports/stops. After impact the battery was photographed and the instrumentation was checked.
The battery remained on the support fixture for approximately one hour while it was being x-rayed. After completion of x-rays the battery/cradle was removed from the support fixture and an FMVSS 305 type rollover was initiated. The battery was manually rolled over taking approximately one minute to rotate each 90° increment and pausing for five minutes at the 90°, 180° and 270° increments.
Coolant fluid leaking from the battery was collected during rollover. After completion of the rollover, the battery/cradle assemblies with instrumentation attached were moved to storage sheds for long term monitoring. The sheds were heated to control temperature between 70°F and 90°F.

13
5.1 ROLLOVER PROCEDURES For tests that included rollover, the battery was rotated around the longitudinal axis 360 degrees at 90 degree increments as shown in Figure 5.2. The battery was rotated toward the passenger side of the vehicle. Once the battery was rotated each 90 degree increment, the battery was held in that position for five minutes prior to rotating to the next position. This is representative of the post crash procedures used by MGA on the Chevrolet Volt during the test in May 2011.
0 degrees 90 degrees 180 degrees 270 degrees 360 degrees
Figure 5.2 Battery Rollover Photographs
5.2 LONG TERM MONITORING After the test procedures were completed, the batteries were placed inside of sheds for long term monitoring. The batteries were stored and monitored for a period of four weeks. The instruments installed on each battery were scanned at one minute increments for the entire period.
Each shed was equipped with at least one video camera to visually monitor the battery and the conditions in the shed. Each shed was also equipped with a photo/ion smoke detector connected to an auto-dialer. In the event of an alarm, the auto-dialer would notify lab personnel of the incident. During the last three tests (Tests 4, 5 and 6), the data acquisition system was also programmed to provide an audible alarm if the battery temperatures exceeded 40oC. In addition a hose fitting and shut off valve was added to the battery case so that the battery case could be flooded with water in case of a fire event.
14
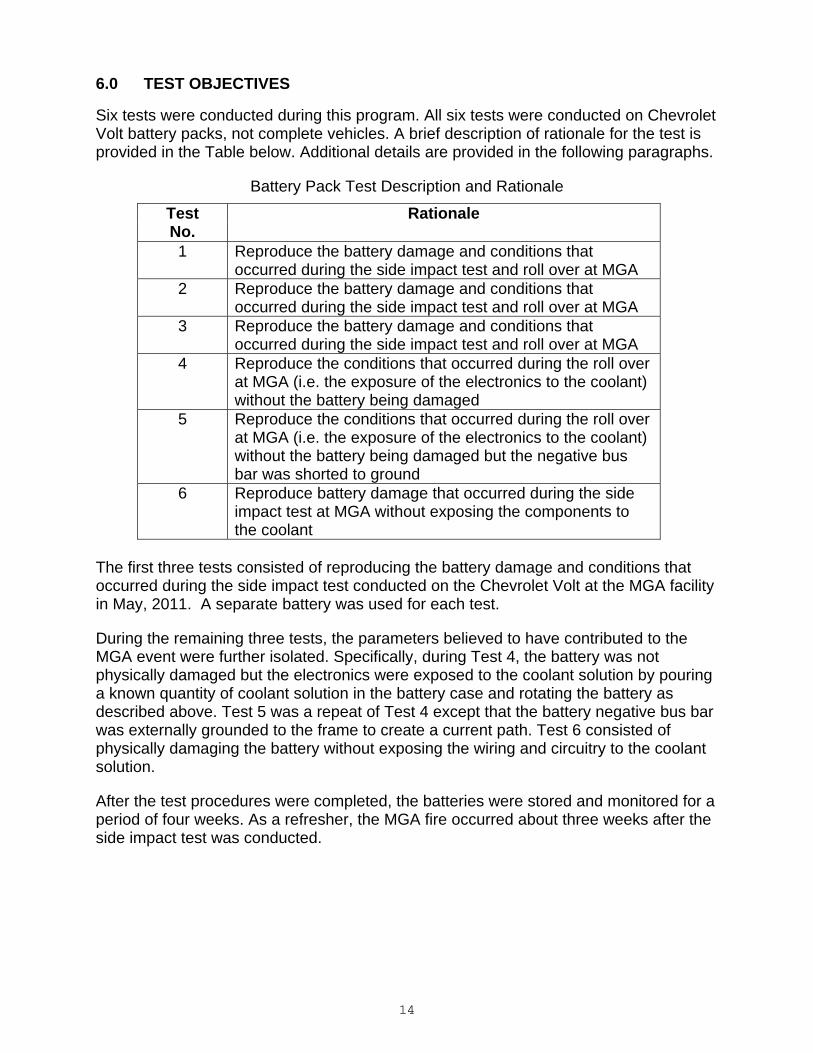
6.0 TEST OBJECTIVES Six tests were conducted during this program. All six tests were conducted on Chevrolet Volt battery packs, not complete vehicles. A brief description of rationale for the test is provided in the Table below. Additional details are provided in the following paragraphs.
Battery Pack Test Description and Rationale
Test No.
Rationale
1 Reproduce the battery damage and conditions that occurred during the side impact test and roll over at MGA
2 Reproduce the battery damage and conditions that occurred during the side impact test and roll over at MGA
3 Reproduce the battery damage and conditions that occurred during the side impact test and roll over at MGA
4 Reproduce the conditions that occurred during the roll over at MGA (i.e. the exposure of the electronics to the coolant) without the battery being damaged
5 Reproduce the conditions that occurred during the roll over at MGA (i.e. the exposure of the electronics to the coolant) without the battery being damaged but the negative bus bar was shorted to ground
6 Reproduce battery damage that occurred during the side impact test at MGA without exposing the components to the coolant
The first three tests consisted of reproducing the battery damage and conditions that occurred during the side impact test conducted on the Chevrolet Volt at the MGA facility in May, 2011. A separate battery was used for each test.
During the remaining three tests, the parameters believed to have contributed to the MGA event were further isolated. Specifically, during Test 4, the battery was not physically damaged but the electronics were exposed to the coolant solution by pouring a known quantity of coolant solution in the battery case and rotating the battery as described above. Test 5 was a repeat of Test 4 except that the battery negative bus bar was externally grounded to the frame to create a current path. Test 6 consisted of physically damaging the battery without exposing the wiring and circuitry to the coolant solution.
After the test procedures were completed, the batteries were stored and monitored for a period of four weeks. As a refresher, the MGA fire occurred about three weeks after the side impact test was conducted.

15
7.0 BATTERY PACK TEST RESULTS 7.1 BATTERY PACK TEST RESULTS OVERVIEW An overview of the six tests conducted during this program is provided in the table below.
Test # Type of Test
Intentional Grounding
Coolant in Battery Case
Test Speed (MPH)
Impactor Displacement Setting (Inches) NOTE 1
Notable Observations
How Introduced
Amount (L) Date
1 Impact with Rollover
None Leakage due to impact
2.871 7.58 2 ½ Destroyed during the 11/24 fire initiated by Test 2 battery
11/16/11
2 Impact with Rollover
Impact Block
Grounded to Battery Frame
Leakage due to impact
2.951 6.80 2 15/16 Battery caught fire on 11/24. Fire originated in Module 3
11/17/11
3 Impact with Rollover
Same as Test 2
Leakage due to impact
4.041 6.38 3 9/16 Spark and Flames jetted from the pack at the 180° mark of rollover. Battery disassembled. No surveillance period
11/18/11
4 Rollover None Poured through Flooding Port
2.341 N/A N/A Minor Heating, Discolored VTSM 1 wiring
12/05/11
5 Rollover Negative Bus Bar
Grounded to Battery Frame
Poured through Flooding Port
3.20 N/A N/A Rapid electrolysis observed at the 180°-270° mark. Battery caught fire on 12/12/11
12/05/11
6 Impact with Rollover
Same as Test 2
Leakage due to impact
5.07 6.86 3 ¼ Minor Heating, One Cell Group dropped to .2 volts.
12/06/11
NOTE 1: X-rays were used as a non-invasive method of assessing the post impact internal structural deformation to the battery. The x-rays were compared to the previous x-rays of the MGA side impact damaged battery that resulted in a fire. This information along with physical measurements were used as an aid in making adjustments to the impactor displacement and moving barrier speed for each test. The first three tests consisted of damaging the battery and conducting a post test rollover in a similar manner to the side impact test conducted on the Chevrolet Volt at

16
the MGA facility in May, 2011. Once the batteries were damaged during the first two tests and the test procedures were completed, the batteries were placed in a shed under surveillance for a period of four weeks. Less than a week into the four week surveillance period, the battery damaged during Test 2 caught fire and destroyed the contents of the shed including the battery from Test 1.
During Test 3, while the battery was inverted, an event occurred that jetted sparks and flames from the battery housing for about a second. An assessment of the battery remains from the first three tests indicated that the exposure to the coolant solution during the post damage roll-over was creating external shorts in the battery wiring and circuitry.
For the remaining three tests, the parameters believed to have contributed to the MGA event were isolated. Specifically, during the fourth test, the battery was not physically damaged but the electronics were exposed to the coolant solution. The fifth test was a repeat of the fourth with the battery externally grounded to the frame to create the current path produced by the physical damage to the battery in the MGA side impact test. The sixth test consisted of physically damaging the battery without exposing the wiring and circuitry to the coolant solution.
After the test procedures were completed for Tests 4, 5 and 6, the batteries were placed in separate sheds for surveillance. Less than a week into the surveillance period, the battery from Test 5 caught fire due to shorting of a connector on the passenger side end of battery Module 3. The fire was quickly suppressed by discharging water into the battery case. The battery was submersed until the test team had returned to the facility (approximately 18 hours later). The batteries from Test 4 and Test 6 produced minor heating during the surveillance period but never caught fire. The details of each test are provided in the following sections.
7.2 TEST 1 AND TEST 2 DETAILED RESULTS Test 1 and Test 2 were designed to reproduce the physical damage and conditions that occurred during the side impact test conducted at the MGA facility in May. Test 1 was conducted on November 16th and Test 2 was conducted on November 17th, 2011.
There were only two minor differences between the two tests. During Test 1, the impactor block was not intentionally grounded to the mounting frame as was the case for Test 2. In addition, the degree of physical damage was slightly increased for Test 2 by adjusting the depth of impact and increasing the test impact velocity. A photograph and an X-ray of the damage for the two tests are provided in Figures 7.1 and 7.2.

17
Figure 7.1 – Test 1 Battery Damage and X-Ray
Figure 7.2 – Test 2 Battery Damage and X-Ray
Other than the physical damage to the battery and cover, there were no signs of an ensuing reaction while the batteries were located on the test deck prior to being moved into the shed. There were no indications of either arcing or smoking within the battery case.
After the batteries were physically damaged and the test procedures were completed, the batteries were placed in a shed for surveillance for a period of four weeks. Less than one week into the four week surveillance period, the battery from Test 2 caught fire and destroyed the contents of the shed including the battery from Test 1. The details of the fire and the forensic examination of batteries are provided in the following sections.

18
7.2.1 TEST 1 AND TEST 2 BATTERY FIRE 7.2.1.1 Event Description The orientation of the two batteries within the shed is shown in Figure 7.3.
Figure 7.3 – Storage Configuration for Batteries from Tests 1 and 2
The fire occurred in the late afternoon on November 24, 2011 (Thanksgiving Day). There were no indications visually or empirically that a reaction was about to happen up to about an hour before the event. The following is a high level overview of the events that occurred on that day.
1. The cameras installed inside the Test 2 battery show smoke logging within the case at 4:30 PM
2. The thermocouples on the Test 2 battery began to increase about 4:35 PM 3. The thermocouples on the Test 2 battery heat from back to front (Section 3, Section 2
then Section 1) 4. Smoke detector triggered auto-dialer at about 4:38 PM 5. Video camera in shed shows smoke coming from the Test 2 battery about 4:40 PM 6. Video camera in shed is completely obscured with smoke by 4:45 PM 7. Video camera in shed shows sight of flames in the shed about 4:50 PM 8. About 4:50 PM, the cameras installed in the Test 2 battery began to malfunction 9. At 4:55 PM, the thermocouples in battery began heating faster 10. Ambient temperatures in the shed begin to increase shortly after 4:55 PM 11. Just before 5:00 PM temperatures spike in the batteries and shed and video is lost 12. GTL Tech/FF arrives on site shortly after 5:00, heavy smoke coming from shed eves 13. Doors of shed blew open shortly after arriving on scene (whoosh sound heard as door
blew open). This overpressure blew out the back window of the shed with pieces located over 10 ft away
14. Interior of shed significantly charred when door blew open indicating that the fire had been burning for a while prior to the pressure event. Test 2 battery fully involved, Test 1 battery heating but not involved.
15. Only the Test 2 battery is involved at the time of the initial attack 16. Flames jetting from drivers side end of Module 3 and opening in cover observed at that
location 17. Fire spreads to the Test 1 battery 18. Fire is extinguished about 7:30 PM 19. Fire burned for about 2 hours and 30 minutes total
Test 1 Battery
Test 2 Battery

19
Figure 7.4 – Photograph Showing Early Stage of Fire
Figure 7.5 – Photograph Showing Final Attack on Fire
Before After
Figure 7.6 – Photograph Showing the Contents of the Shed Before and After the Event

20
7.2.1.1 Forensic Investigation of the Shed and Contents The forensic investigation of the shed was performed on November 26th 2011.The investigation was conducted by Jerry Back of Hughes Associates Inc. and Ron Orlando of General Motors.
The forensic investigation is consistent with the measurements, video footage and observation solicited from the fire fighters that combated the fire. The damage to the shed structure, based on visual observations and char depth, supports the fire originating in Battery from Test 2. The area above and adjacent to the open end of Battery from Test 2 experienced the greatest damage during the event.
There were a number of potential ignition sources located in the shed other than the two batteries. These included a power distribution box, a duplex outlet, an electric light installed on the ceiling and an electric heater located in the center of the space. All of these components were inspected and showed no signs of shorting or arcing and were eliminated as potential ignition sources.
The damage is consistent with the following scenario: The fire originated in the Battery in Test 2. The fire then spread to the paper facing on the insulation installed on the inner surfaces of the shed. As the paper facing was consumed, the oxygen concentration in the shed dropped causing the fire to become oxygen limited. The fire then smoldered for about 10 minutes prior to the overpressure that blew open the door.
There are two potential causes for the over-pressure event; a rapid influx of air into the shed and/or a single or multiple cell rupture in Section 3 of Battery from Test 2. The likelihood of a rapid influx of air is extremely low based on the conditions of the shed before and after the event. In short, there were no openings into the shed to allow a rapid influx of air. In addition, there was little if any wind the day of the fire.
A single or multiple cell level event (i.e. rapid venting of electrolyte) is the most likely scenario. This would also explain the opening in the case at the driver’s side end - Module 3 of Battery from Test 2. A photograph of the opening is provided in Figure 7.7.
Figure 7.7 – Photograph Showing Cover Damage on the Driver’s Side end of Module 3
21
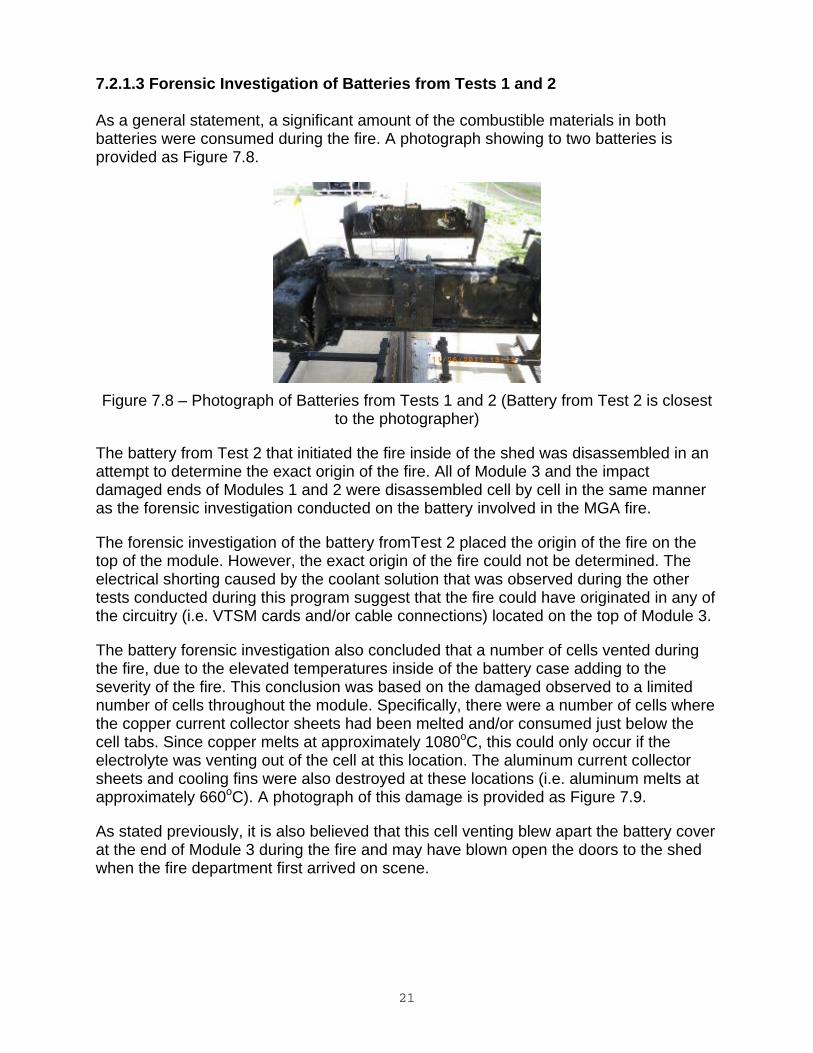
7.2.1.3 Forensic Investigation of Batteries from Tests 1 and 2 As a general statement, a significant amount of the combustible materials in both batteries were consumed during the fire. A photograph showing to two batteries is provided as Figure 7.8.
Figure 7.8 – Photograph of Batteries from Tests 1 and 2 (Battery from Test 2 is closest
to the photographer)
The battery from Test 2 that initiated the fire inside of the shed was disassembled in an attempt to determine the exact origin of the fire. All of Module 3 and the impact damaged ends of Modules 1 and 2 were disassembled cell by cell in the same manner as the forensic investigation conducted on the battery involved in the MGA fire.
The forensic investigation of the battery fromTest 2 placed the origin of the fire on the top of the module. However, the exact origin of the fire could not be determined. The electrical shorting caused by the coolant solution that was observed during the other tests conducted during this program suggest that the fire could have originated in any of the circuitry (i.e. VTSM cards and/or cable connections) located on the top of Module 3.
The battery forensic investigation also concluded that a number of cells vented during the fire, due to the elevated temperatures inside of the battery case adding to the severity of the fire. This conclusion was based on the damaged observed to a limited number of cells throughout the module. Specifically, there were a number of cells where the copper current collector sheets had been melted and/or consumed just below the cell tabs. Since copper melts at approximately 1080oC, this could only occur if the electrolyte was venting out of the cell at this location. The aluminum current collector sheets and cooling fins were also destroyed at these locations (i.e. aluminum melts at approximately 660oC). A photograph of this damage is provided as Figure 7.9.
As stated previously, it is also believed that this cell venting blew apart the battery cover at the end of Module 3 during the fire and may have blown open the doors to the shed when the fire department first arrived on scene.

22
Figure 7.9 – Photograph Showing Cell Level Damage within Module 3
7.3 TEST 3 DETAILED RESULTS During Test 3, while the battery was inverted, an event occurred within the battery pack that jetted flames and sparks (incandescent particles) out of the pack for about a second.
The impact penetration was slightly increased for each test in an attempt to reproduce the damage to the battery produced during the crash test conducted in May at the MGA facility in Wisconsin. The amount of battery coolant (ethylene glycol/water mix 50/50) leaked into the pack was also greater than that leaked during the first two tests. A photograph and an X-ray of the damage for this test is provided in Figures 7.10.
Figure 7.10 – Test 3 Battery Damage and X-Ray
23
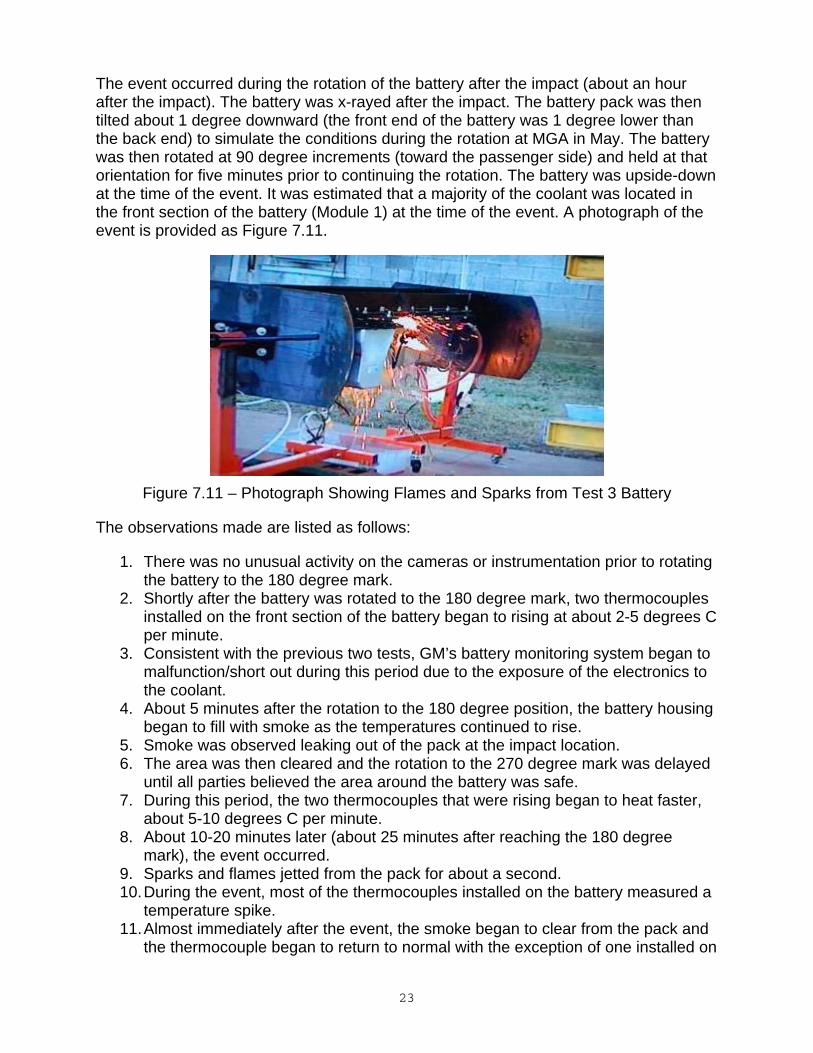
The event occurred during the rotation of the battery after the impact (about an hour after the impact). The battery was x-rayed after the impact. The battery pack was then tilted about 1 degree downward (the front end of the battery was 1 degree lower than the back end) to simulate the conditions during the rotation at MGA in May. The battery was then rotated at 90 degree increments (toward the passenger side) and held at that orientation for five minutes prior to continuing the rotation. The battery was upside-down at the time of the event. It was estimated that a majority of the coolant was located in the front section of the battery (Module 1) at the time of the event. A photograph of the event is provided as Figure 7.11.
Figure 7.11 – Photograph Showing Flames and Sparks from Test 3 Battery
The observations made are listed as follows:
1. There was no unusual activity on the cameras or instrumentation prior to rotating the battery to the 180 degree mark.
2. Shortly after the battery was rotated to the 180 degree mark, two thermocouples installed on the front section of the battery began to rising at about 2-5 degrees C per minute.
3. Consistent with the previous two tests, GM’s battery monitoring system began to malfunction/short out during this period due to the exposure of the electronics to the coolant.
4. About 5 minutes after the rotation to the 180 degree position, the battery housing began to fill with smoke as the temperatures continued to rise.
5. Smoke was observed leaking out of the pack at the impact location. 6. The area was then cleared and the rotation to the 270 degree mark was delayed
until all parties believed the area around the battery was safe. 7. During this period, the two thermocouples that were rising began to heat faster,
about 5-10 degrees C per minute. 8. About 10-20 minutes later (about 25 minutes after reaching the 180 degree
mark), the event occurred. 9. Sparks and flames jetted from the pack for about a second. 10. During the event, most of the thermocouples installed on the battery measured a
temperature spike. 11. Almost immediately after the event, the smoke began to clear from the pack and
the thermocouple began to return to normal with the exception of one installed on

24
the top of Module 1 of the battery pack. This thermocouple remained near 40oC (104oF) until the battery was disassembled the following week.
12. Once the battery was stable and all temperatures dropped below 40oC, the test sequence was continued and the battery was rotated to 270 degrees and held there for 5 minutes and then rotated back to the upright position (the 360 degree mark).
13. Once the battery was upright, smoke was again observed exiting the impact location.
14. The battery was left at that location overnight and then the following morning, moved inside a test camber for further monitoring and disassembly.
7.3.1 INSTRUMENTATION CHECK The first assessment conducted on the battery was to determine the potential involvement of the instrumentation, cameras and lighting installed in the battery pack to monitor the test. This assessment was conducted after the cover was removed from the battery. The findings are summarized as follows:
1. All 15 thermocouples worked properly after the test. There were no breaks in wiring or leaks to ground.
2. The accelerometers and wiring were still operational with no observable damage or leaks to ground.
3. Two video cameras were damaged during the event but the other two were still operational after the event. There were no breaks in wiring or leaks to ground.
4. All of the LED lights were operational after the event. There were no breaks in wiring or leaks to ground in 3 of the 4 lights. The 4th LED strip had a slight nick in the coating but showed no sign of any abnormal electrical activity at this location. It should be noted that these LED lights operate off of 12V with virtually no current draw.
It was concluded by the NHTSA team and agreed to by GM that the devices installed in the battery pack to monitor the test had no contribution to the event.
7.3.2 BATTERY DAMAGE OBSERVATIONS Impact damage looked similar to that of the MGA battery with the back end of Module 1 and the front end of Module 2 slightly crushed and pushed about an inch toward the passenger side of the vehicle. The cooling system was also breached at this location allowing the coolant to flow out of the pack into the battery enclosure.
At the time the cover was removed, all three modules were determined to be almost fully charged. Module 1 had just under 120V, Module 2 had just over 96V and Module 3 had approximately 170V. All three modules were discharge using an electrical heater provided by NSWC-Carderock. During the discharge of Module 1, a limited number of cells were observed to heat to about 90oF near the damage location. During the discharge, it was also determined that Module 1 was partially discharged and was being drained by the damaged electrical circuitry of the battery, probably VTSM1 located on top of Module 1.
25
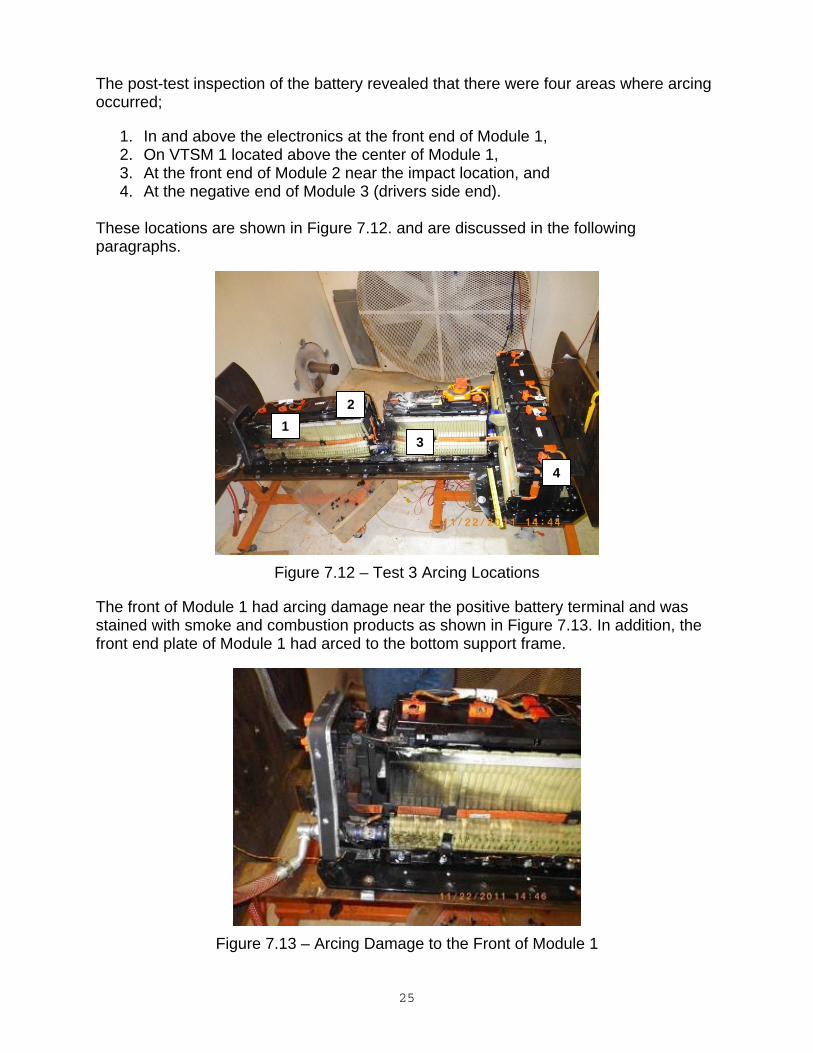
The post-test inspection of the battery revealed that there were four areas where arcing occurred;
1. In and above the electronics at the front end of Module 1, 2. On VTSM 1 located above the center of Module 1, 3. At the front end of Module 2 near the impact location, and 4. At the negative end of Module 3 (drivers side end).
These locations are shown in Figure 7.12. and are discussed in the following paragraphs.
Figure 7.12 – Test 3 Arcing Locations
The front of Module 1 had arcing damage near the positive battery terminal and was stained with smoke and combustion products as shown in Figure 7.13. In addition, the front end plate of Module 1 had arced to the bottom support frame.
Figure 7.13 – Arcing Damage to the Front of Module 1
1 2
4
3
26
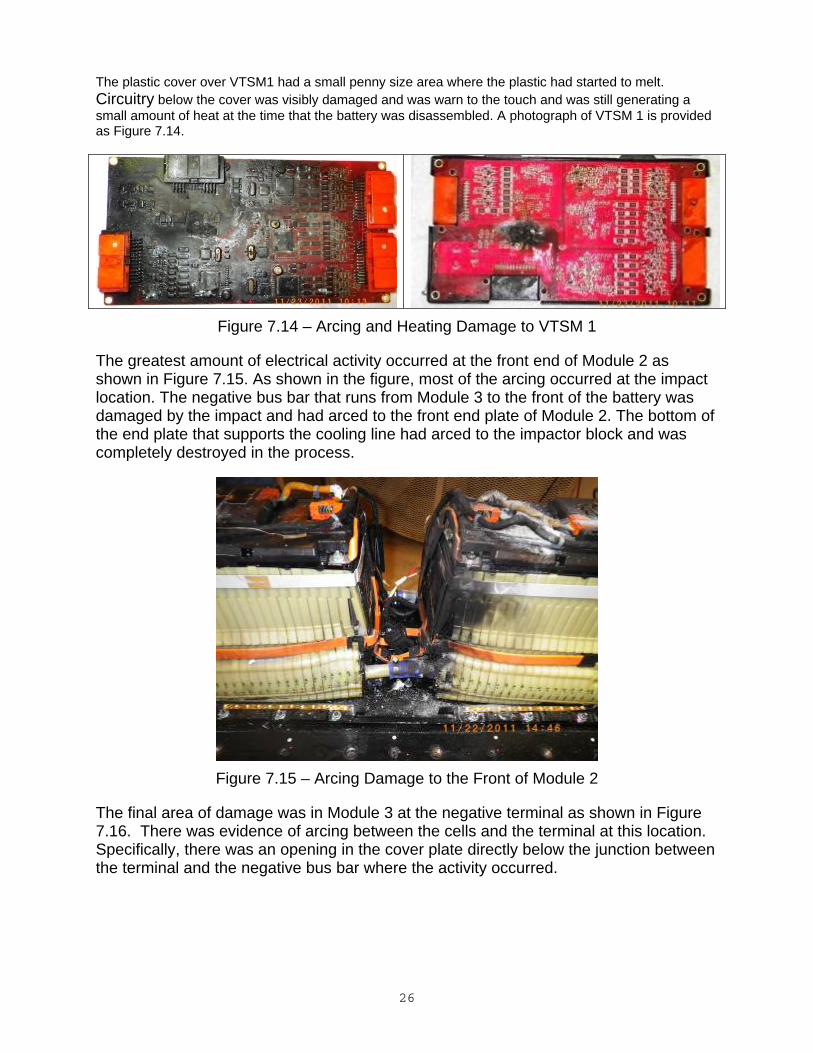
The plastic cover over VTSM1 had a small penny size area where the plastic had started to melt. Circuitry below the cover was visibly damaged and was warn to the touch and was still generating a small amount of heat at the time that the battery was disassembled. A photograph of VTSM 1 is provided as Figure 7.14.
Figure 7.14 – Arcing and Heating Damage to VTSM 1
The greatest amount of electrical activity occurred at the front end of Module 2 as shown in Figure 7.15. As shown in the figure, most of the arcing occurred at the impact location. The negative bus bar that runs from Module 3 to the front of the battery was damaged by the impact and had arced to the front end plate of Module 2. The bottom of the end plate that supports the cooling line had arced to the impactor block and was completely destroyed in the process.
Figure 7.15 – Arcing Damage to the Front of Module 2
The final area of damage was in Module 3 at the negative terminal as shown in Figure 7.16. There was evidence of arcing between the cells and the terminal at this location. Specifically, there was an opening in the cover plate directly below the junction between the terminal and the negative bus bar where the activity occurred.

27
Figure 7.16 – Arcing Damage at the Driver’s Side End of Module 3
Generally speaking, the arcing was attributed to both the structural damage to the battery caused by the impact, and the shorting of various components due to the exposure to the electrically conductive coolant solution.
28
7.3.3 ARCING SCENARIO DESCRIPTION The submersion of the electronics in front of, and on top of Module 1 caused a number of short circuits that altered the voltage potential and polarity of the battery pack. These short circuits generated heat and smoke that were observed by the cameras installed inside of the battery cover. The submersion of the electronics also produced electrolysis gases that along with the smoke became logged within the case. Within a few minutes of submersion, significant arcing occurred at numerous locations (at the front ends of both Module 1 and Module 2). The primary arcing location was in the front of Module 2. The arcing occurred between the negative return and the end plate of Module 2 and the impactor that was grounded to the battery frame. The arcing ignited the combustible smoke and electrolysis products logged in the case causing flames to momentarily jet from the case when the arcing occurred.
To further investigate the shorting that was observed during these first three tests, an electrolysis experiment was conducted on the battery coolant using a variable power supply and two copper wires. The current flow through the coolant and associated electrolysis rapidly produced metallic compounds and carbon particles that floated on the coolant surface during the experiment. These compounds are believed to have created the external shorts in the wiring and circuit boards during the post test surveillance period.
7.4 TEST 4 DETAILED RESULTS There were not any major electrical or thermal events noted within the battery from Test 4. The thermocouples located on the top of VSTM 1 and 3 showed continuous slow heating from 26°C to 34°C. The temperature fluctuated about 33° for the last few days of the monitoring period.
On January 6, 2012, 31 days from the test date, the battery was removed from the storage shed, deenergized, and retained at GTL.
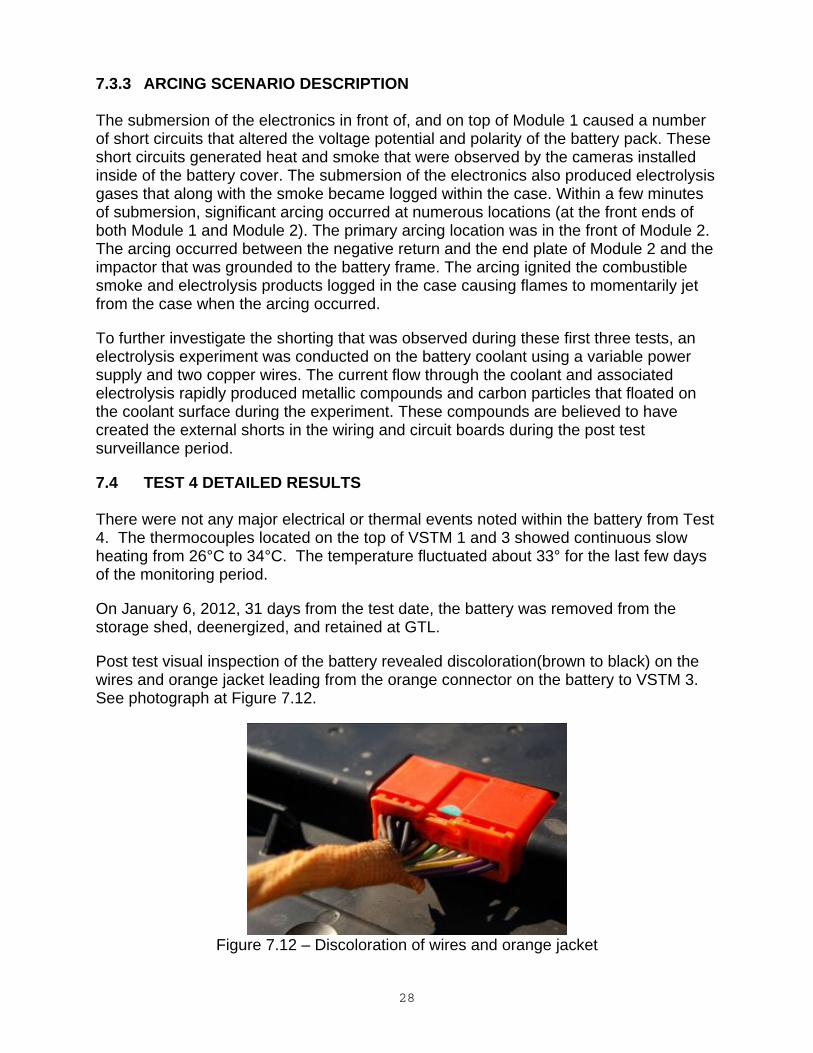
Post test visual inspection of the battery revealed discoloration(brown to black) on the wires and orange jacket leading from the orange connector on the battery to VSTM 3. See photograph at Figure 7.12.
Figure 7.12 – Discoloration of wires and orange jacket

29
7.5 TEST 5 DETAILED RESULTS Test 5 was a repeat of Test 4 with the exception that the negative bus bar running between modules 1 and 2 of the battery was grounded to the frame.
During the rollover portion of the test, between 180 degrees and 270 degrees, the coolant must have submersed the positive and negative terminals located on the driver’s side of Module 1 causing rapid electrolysis of the coolant. A vigorous boiling sound could be heard as the battery was rotated through this orientation. The electrolysis abruptly stopped as the battery approached the 270 degree orientation and no other adverse effects were observed. A photograph showing the battery at the 270 degree mark is provided as Figure 7.13. Smoke can still be seen in the area where the shorting and electrolysis is believed to have occurred.
Figure 7.13 – Test 5 with the Battery at the 270 degree orientation
Less than a week into the four week surveillance period, the Test 5 battery caught fire due to shorting of a connector on the passenger side end of battery Module 3. The location of the fire is shown in Figure7.14. The fire was quickly suppressed by discharging water into the battery case. The battery was submersed by flowing water through the battery case until the test team returned to the facility, approximately 18 hours later.

30
Figure 7.14 – Fire Damage to Passenger Side End of Module 3
Due to the rapid suppression of the fire, the exact origin of the fire could be determined. The forensic investigation of the battery revealed that the fire originated at the passenger side end of Module 3. Specifically, the fire originated at/in the connector on the battery between the voltage monitoring system bus bar and the cable for VTSM 3 as shown in Figure 7.15.
Pretest Post Test – Post Fire
Figure 7.15 – Fire Origin of Test 5 – Passenger Side End of Module 3
During the forensic inspection, Module 3 of Battery from Test 5 was disassembled cell by cell in the same manner as the forensic investigation conducted on the battery from Test 2.
The forensic inspection of the cells was consistent with the fire originating at the connection between the voltage monitoring system bus bar and the cable for VTSM 3. Specifically, there was no damage to any of the cells other than directly under the connector and there was no damage to VTSM 3. A photograph of VTSM 3 is provided as Figure 7.16.
Origin

31
Figure 7.16 – VTSM 3 – No Apparent Fire Damage
The voltage temperature monitoring system leads that run through the bus bar were destroyed between the connector location and the passenger’s side end of Module 3. These leads are fairly low gauge copper wires. Since copper melts at approximately 1080oC, this could only occur under high current flow conditions or if the electrolyte was vented out of the cell(s) directly below the leads. A photograph of these leads is provided as Figure 7.17.
Figure 7.17 – Fire Damage to the Bus Bar Leads
Missing Leads

32
7.6 TEST 6 DETAILED RESULTS There were not any major electrical or thermal events with the battery in Test 6. The thermocouples located on the top of VSTM 1 and 3 showed continuous slow heating from 26°C to 34°C. The temperature fluctuated about 33° for the last few days of the monitoring period.
One of the cell groups on the end of Module 1 located in the impact area slowly lost charge during the monitoring period. Voltage at the end of the monitoring period had dropped to 0.21 volts. A photograph and an X-ray of the damage for the test is provided in Figure 7.18.
Figure 7.18 – Test 6 Battery Damage and X-Ray
On January 6, 2012, 30 days from the test date, the battery was removed from the storage shed, de-energized, and retained at GTL.
33
8.0 CONDUCTIVITY TEST OF BATTERY COOLANT The impact of electrical conductivity of the glycol-water coolant mixture used in the battery coolant system of the Chevrolet Volt battery was highlighted during GM contracted Exponent testing and fire-event investigation of the MGA Volt vehicle fire. The tests performed by Exponent demonstrated that with highly doped glycol-water solutions (9% by weight table salt added) that dendrite growth could be established that would cause carbonization of the underlying supporting plastic in the battery BMS electronics between cells and series connections of cells within a few hours to days of exposure.
Literature values for glycol, and glycol-water solutions are available [1]. These are provided by glycol manufacturers, by various automotive test and documentations sites and MSDS sheets, and various activities including SAE publications. The values for conductivity of deminearlized water and ethylene/propylene glycol are cited as 1500 to 2500 S/cm.
During the initial three Volt battery tests, off-the-shelf Prestone 50-50 DEX-COO/WATER (GM approved) was utilized as the coolant fluid addition to the battery coolant circulation lines. This material met the specifications provided by GM representatives for the Chevrolet Volt battery to DOT/NHTSA representatives.
After the Test 3 arcing event, followed by the Test 2 fire event 11/24/11, a crude test was conducted on the conductivity of the DEX-COOL solution at relatively high voltages to approximate possible battery driven effects within the volume and spacing of the Volt battery protective cover. Discussions by GM representatives also indicated that the use of the Prestone 50/50 mixture with “demineralized” water was inadequate and that the GM specified coolant mixture utilized ”deionized” water.
A high voltage power supply (Sorenson 600-8) capable of providing 1200 watts of total power (1200 watt limiting power at combination of voltage and current) was utilized to evaluate the effects of moderate battery voltage through a test sample coolant from the Volt batteries. An impromptu set of electrodes were fashioned from AWG 12 wire cabling, exposing approximately 1” length with an electrode-to-electrode separation of approximately 1”. With the power supply set to 350 VDC and 4 ampere limit, a clean plastic container of DEX-COOL 50/50 was decanted and exposed to the electrodes. The coolant-electrode reaction was immediate with formation of bubbles, and dissolution of exposed copper wire. Approximately 150 ml of coolant was discolored and observed to have significant concentration of particulates floating after 30 seconds of exposure. Peak current was observed to be approximately 2.5 Amperes. 350 VDC was chosen as a moderately low voltage for the Volt battery. After 30 seconds, electrical arcs were visible through the coolant and mixture of water vapor and glycol were rising from the exposed material. Temperature of the sample had increased in temperature dramatically.
The exposure was repeated with a fresh sample at various voltages from 12 VDC stepping to 100, 200 and 300 VDC. At increasing voltages, increasing levels of reactions were observed. No tests were conducted above 350 VDC. Battery voltage
34
for the GTL test series were 390 VDC. Voltage for the MGA test event battery is estimated at 370 VDC.
Two samples of OEM supplied materials were provided by GM representatives. OEM GM source 50-50 mixture of glycol-water was obtained by DOT/NHTSA representative from GM maintenance and repair dealership shop. “Neat” undiluted Prestone DEX-COOL was also obtained.
The first batch of GM factory provided materials were provided in re-used 1-gallon plastic containers. A quick test of this material using the same technique described above resulted in the over-loading of the power supply from providing too much power and exceeding the 4 ampere limit imposed. This test was repeated twice, with similar results. This material was not used for additional tests.
A second batch of GM factory material was sent by GM representatives. Again, the containers used to provide this sample were 1-gallon plastic containers (labeling indicated original use was for cleaning solution and solvents). This material was tested and was found to be no worse (no more conductive) than the original Prestone non-Hybrid vehicle quality DEX-COOL 50/50 mixture of material.
GM OEM high purity DEX-COOL certified for use in HYBRID VEHICLE SYSTEMS was obtained by NHTSA/DOT personnel. This material was found to be equivalent at high voltages as the off-the-shelf Prestone DEX-COOL coolant mixtures.
A comparative test of conductivity was conducted on the five basic coolant fluids available; Prestone DEX-COOL, GM Supplied Coolant #1, GM Supplied Coolant #2, and GM OEM HYBRID DEX-COOL. Neat (undiluted) DEX-COOL although available was not tested in this sequence. These were compared with Distilled water acquired from local hardware store. These tests were conducted with a HANNA total dissolved solid/conductivity water quality test meter. The HANNA meter, Model HI9835, was provided by GM representatives.
(A) Distilled Water: 12.25 to 13.00 microSiemens (B) Prestone Pre-mix 50/50 DEX-COOL: 1900 - 2030 microS (used in initial tests) (C) OEM Sample #1 (original very conductive in HV test): 3600 microS (D) OEM Sample #2 (resend, last Fridays, issue): 1880 - 1900 microSiemens (E) Prestone 50/50 HYBRID Electrical System DEX-COOL Mix from GM Dealer): 1950 - 1960 microS (used in subsequent Tests #4-6) NOTE: The HANNA HI9835 electrode assembly was disassembled, washed and cleaned with purchased distilled water in between conductivity tests to prevent contamination effects.
These values ranges and levels match the observed high-voltage effects when exposed to 350 VDC. It should be noted that “neat” undiluted DEX-COOL (glycol) was observed to behavior very differently than literature values would allow inference when exposed to the 350 VDC source. Gylcol undiluted is reported to be more conductive that the 50/50 water mixture typically used or sold. During the high-voltage exposure tests, the glycol was observed to be initially less conductive, lower current flow, than any of the 50/50

35
glycol water mixtures. The reaction however did become seemingly more violent than any 50/50 mixture with apparent gassing or boiling of the glycol, ejecting substantial portions of the test sample out of the sample container.
A literature survey and review located a potential alternative source for the deposition of carbon films detailed by Exponent [2] have demonstrated that application of high voltages in a water glycol solution can support formation and deposition of graphite by electrolysis reactions. Although these experiments were driven for approximately 12 hours at a 3 to 4 times the applied voltage exposures anticipated in the VOLT battery coolant exposure, the lower-voltage and extended exposure times may be an alternate explanation for some behaviors observed.
36
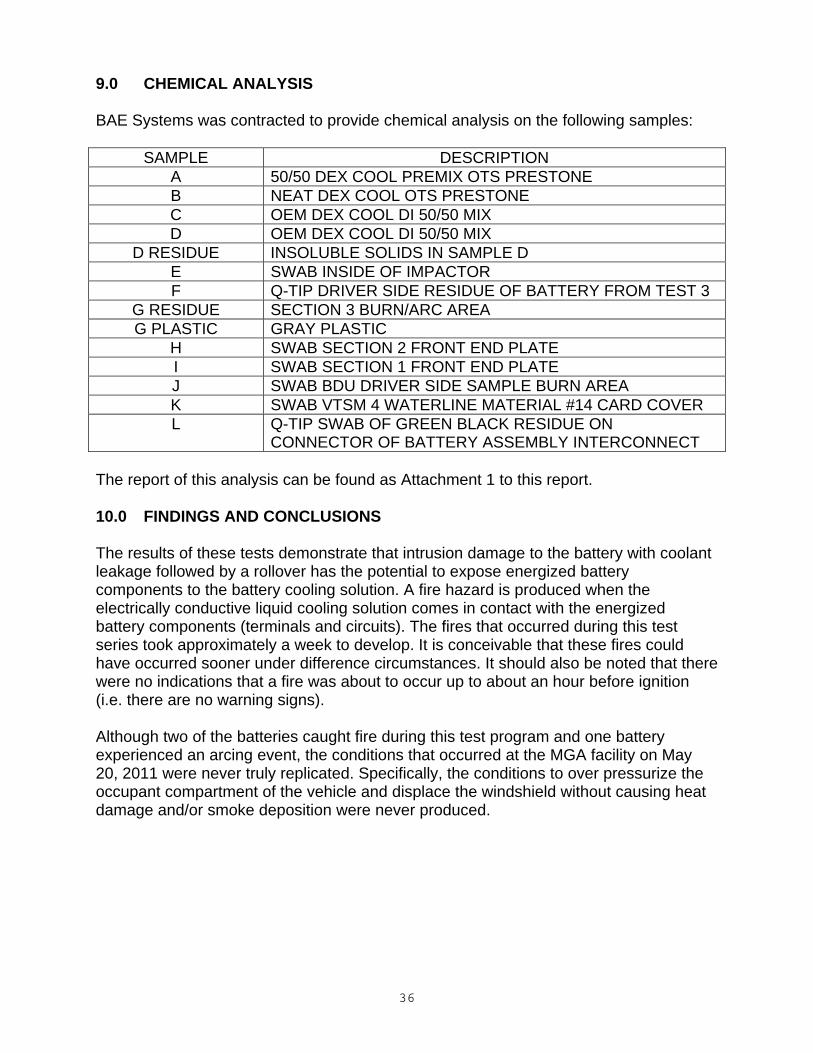
9.0 CHEMICAL ANALYSIS BAE Systems was contracted to provide chemical analysis on the following samples:
SAMPLE DESCRIPTION A 50/50 DEX COOL PREMIX OTS PRESTONE B NEAT DEX COOL OTS PRESTONE C OEM DEX COOL DI 50/50 MIX D OEM DEX COOL DI 50/50 MIX
D RESIDUE INSOLUBLE SOLIDS IN SAMPLE D E SWAB INSIDE OF IMPACTOR F Q-TIP DRIVER SIDE RESIDUE OF BATTERY FROM TEST 3
G RESIDUE SECTION 3 BURN/ARC AREA G PLASTIC GRAY PLASTIC
H SWAB SECTION 2 FRONT END PLATE I SWAB SECTION 1 FRONT END PLATE J SWAB BDU DRIVER SIDE SAMPLE BURN AREA K SWAB VTSM 4 WATERLINE MATERIAL #14 CARD COVER L Q-TIP SWAB OF GREEN BLACK RESIDUE ON
CONNECTOR OF BATTERY ASSEMBLY INTERCONNECT The report of this analysis can be found as Attachment 1 to this report. 10.0 FINDINGS AND CONCLUSIONS The results of these tests demonstrate that intrusion damage to the battery with coolant leakage followed by a rollover has the potential to expose energized battery components to the battery cooling solution. A fire hazard is produced when the electrically conductive liquid cooling solution comes in contact with the energized battery components (terminals and circuits). The fires that occurred during this test series took approximately a week to develop. It is conceivable that these fires could have occurred sooner under difference circumstances. It should also be noted that there were no indications that a fire was about to occur up to about an hour before ignition (i.e. there are no warning signs). Although two of the batteries caught fire during this test program and one battery experienced an arcing event, the conditions that occurred at the MGA facility on May 20, 2011 were never truly replicated. Specifically, the conditions to over pressurize the occupant compartment of the vehicle and displace the windshield without causing heat damage and/or smoke deposition were never produced.

37
11.0 REFERENCES [1] Electrical Conductivity of Typical Automotive Engine Compartment Fluids And A Method for Determining Their Effects When Inadvertently Present in Electrical Connectors of Powertrain Control Modules; Proceedings of the 57th International Wire and cabling Symposium; NK Medora et al. [2] Deposition of carbon films by electrolysis of a water-ethylene glycol, Suzuki et al, Journal of Material Science, 30 (1995) 2067-2069