Embed Size (px)
Citation preview

1
RESIDENTIAL PROPERTY MARKET REVIEW
February 2020
Chestertons Monthly
chestertons.com

2
CONTENTSEconomic Overview 01
Sales Market 03 National sales 03 London sales 06 New homes 08
Lettings Market 10 National lettings 10 London lettings 11
Investment market 13
Contact 15
“Welcome to our latest monthly
review of national and London residential
property markets.”
Nicholas Barnes – Head of Research
1
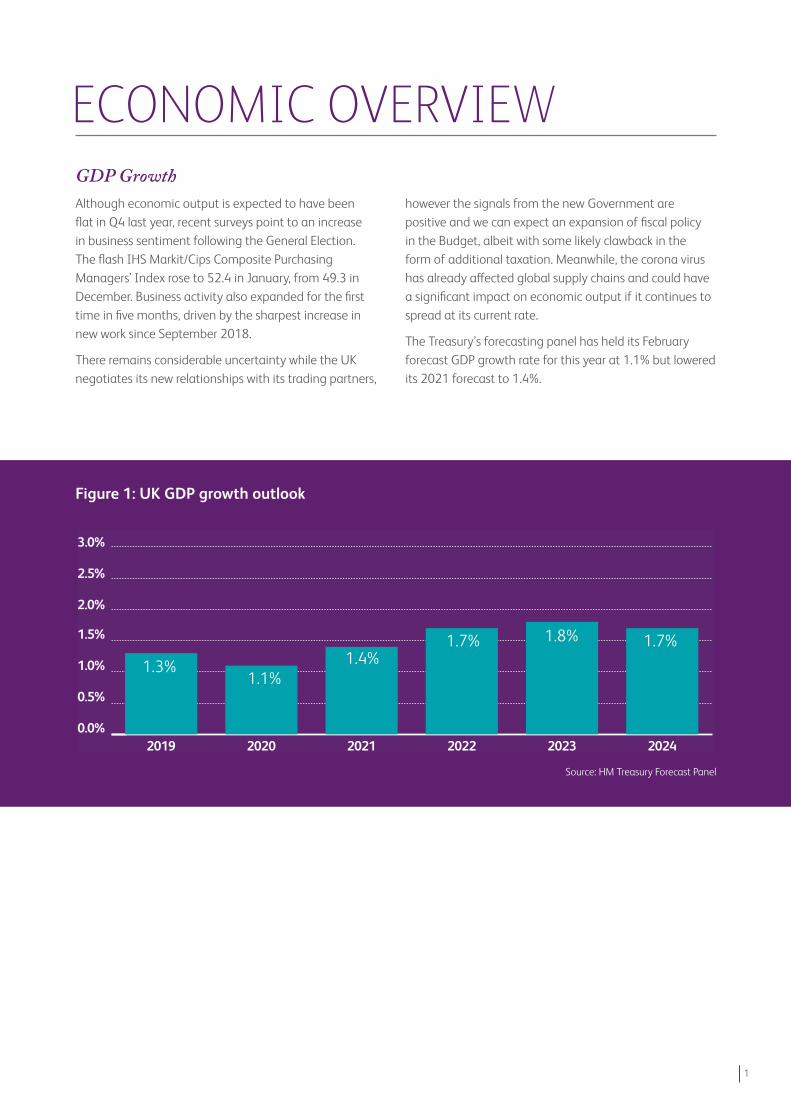
GDP GrowthAlthough economic output is expected to have been flat in Q4 last year, recent surveys point to an increase inꢀbusiness sentiment following the General Election. Theꢀflash IHS Markit/Cips Composite Purchasing Managers’ Index rose to 52.4 in January, from 49.3 in December. Business activity also expanded for the first time in five months, driven by the sharpest increase in newꢀwork since September 2018.
There remains considerable uncertainty while the UK negotiates its new relationships with its trading partners,
however the signals from the new Government are positive and we can expect an expansion of fiscal policy inꢀthe Budget, albeit with some likely clawback in the formꢀof additional taxation. Meanwhile, the corona virus has already affected global supply chains and could have a significant impact on economic output if it continues to spread at its current rate.
The Treasury’s forecasting panel has held its February forecast GDP growth rate for this year at 1.1% but lowered its 2021 forecast to 1.4%.
ECONOMIC OVERVIEW
0.0%
0.5%
1.0%
1.5%
2.0%
2.5%
3.0%
202420232022202120202019
1.7% 1.8% 1.7%1.3%
1.1%1.4%
Figure 1: UK GDP growth outlook
Source: HM Treasury Forecast Panel
2
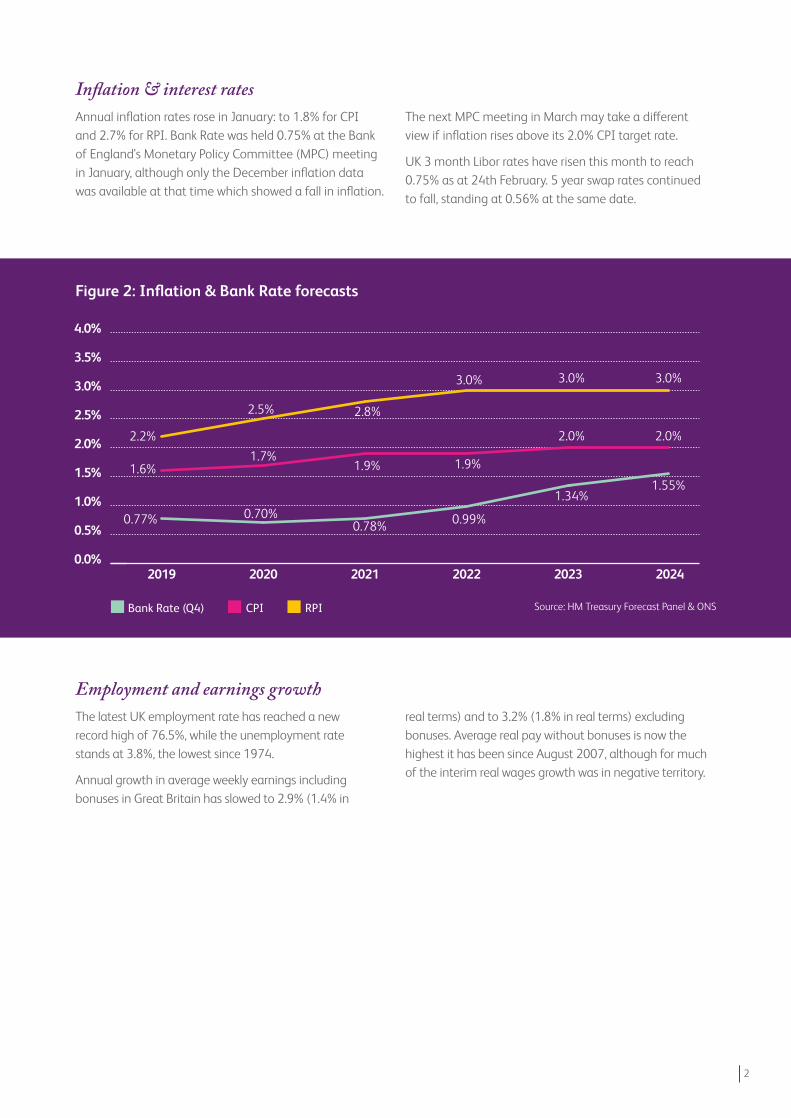
Figure 2: Inflation & Bank Rate forecasts
Bank Rate (Q4) CPI RPI
1.6%
0.77%
1.9%
0.78% 0.99%
1.34%
2.0%
3.0%
1.55%
2.0%
3.0%
2.5%
0.0%
0.5%
1.0%
1.5%
2.0%
2.5%
3.0%
3.5%
4.0%
202420232022202120202019
2.2%
2.8%
0.70%
1.7% 1.9%
3.0%
Source: HM Treasury Forecast Panel & ONS
Employment and earnings growthThe latest UK employment rate has reached a new recordꢀhighꢀof 76.5%, while the unemployment rate standsꢀat 3.8%, the lowest since 1974.
Annual growth in average weekly earnings including bonuses in Great Britain has slowed to 2.9% (1.4% in
realꢀterms) and to 3.2% (1.8% in real terms) excluding bonuses. Average real pay without bonuses is now the highest it has been since August 2007, although for much of the interim real wages growth was in negative territory.
Inflation & interest ratesAnnual inflation rates rose in January: to 1.8% for CPI andꢀ2.7% for RPI. Bank Rate was held 0.75% at the Bank of England’s Monetary Policy Committee (MPC) meeting in January, although only the December inflation data was available at that time which showed a fall in inflation.
The next MPC meeting in March may take a different viewꢀifꢀinflation rises above its 2.0% CPI target rate.
UK 3 month Libor rates have risen this month to reach 0.75% as at 24th February. 5 year swap rates continued toꢀfall, standing at 0.56% at the same date.
3
0
20,000
40,000
60,000
80,000
100,000
120,000
Jan-20Dec-19Nov-19Oct-19Sep-19Aug-19Jul-19Jun-19May-19Apr-19Mar-19Feb-19Jan-19
UK England
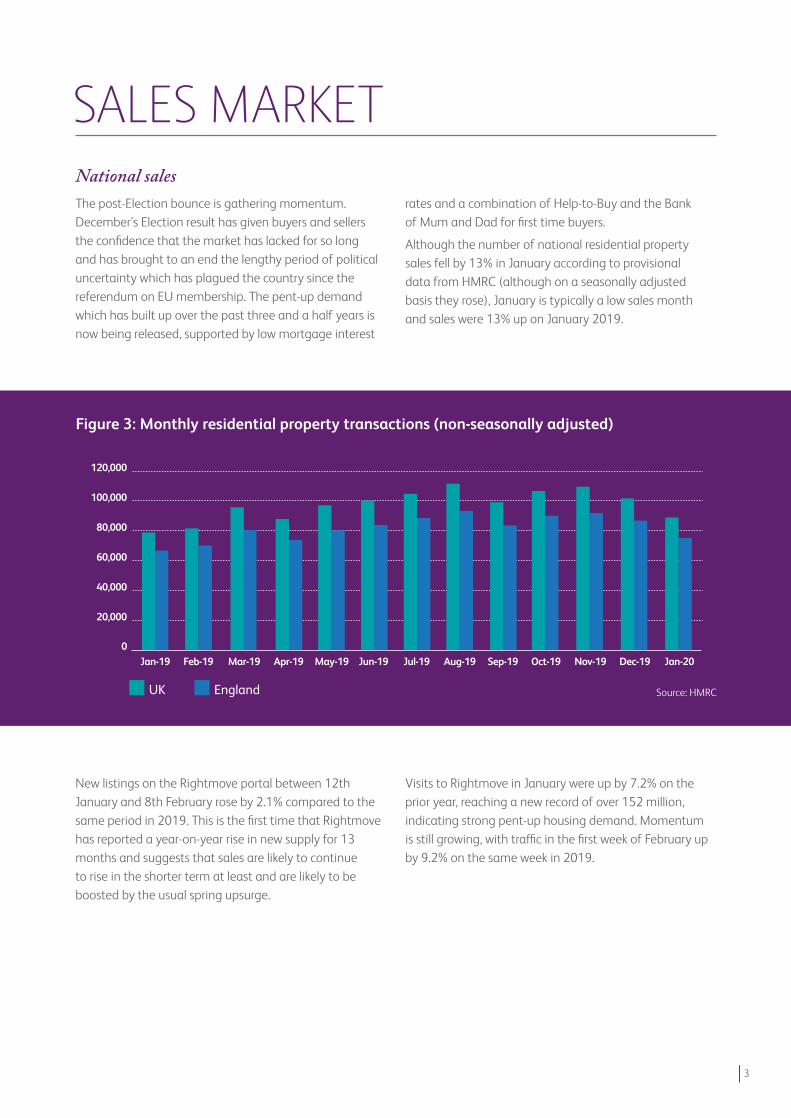
Figure 3: Monthly residential property transactions (non-seasonally adjusted)
Source: HMRC
National salesThe post-Election bounce is gathering momentum. December’s Election result has given buyers and sellers the confidence that the market has lacked for so long and has brought to an end the lengthy period of political uncertainty which has plagued the country since the referendum on EU membership. The pent-up demand which has built up over the past three and a half years is now being released, supported by low mortgage interest
rates and a combination of Help-to-Buy and the Bank ofꢀMum and Dad for first time buyers.
Although the number of national residential property sales fell by 13% in January according to provisional dataꢀfrom HMRC (although on a seasonally adjusted basisꢀthey rose), January is typically a low sales month and sales were 13% up on January 2019.
New listings on the Rightmove portal between 12th January and 8th February rose by 2.1% compared to the same period in 2019. This is the first time that Rightmove has reported a year-on-year rise in new supply for 13 months and suggests that sales are likely to continue to rise in the shorter term at least and are likely to be boosted by the usual spring upsurge.
Visits to Rightmove in January were up by 7.2% on the prior year, reaching a new record of over 152 million, indicating strong pent-up housing demand. Momentum isꢀstill growing, with traffic in the first week of February up by 9.2% on the same week in 2019.
SALES MARKET

4
£0
£50,000
£100,000
£150,000
£200,000
£250,000
£300,000
£350,000
£400,000
£450,000
£500,000
SouthEast
WestMidlands
NorthEast
NorthWest
South West
LondonEast of England
EastMidlands
Yorks &Humber
-1%
0%
1%
2%
3%
4%
5%
Avg prices 12 months growth
2.0%2.2%2.3%2.4%
2.8%
3.9%
1.8%1.4%
1.2%
Source: Land Registry
National house price growth accelerated again in December according to the Land Registry. Average pricesꢀrose by 2.2% in both the UK and England. The average house price in the UK now stands at £234,742
compared to £251,711 in England. For the first time in two years, every English region saw house prices increase on an annual measure, with Yorkshire & Humberside recording the strongest uplift (3.9%).
Average asking prices of property coming to market rose by 0.8% in February according to Rightmove, and were 2.9% up on February last year. Given the sharp rise in
new buyer enquiries and the fact that supply is lagging demand, this suggests that a further rise in achieved prices is likely.
Figure 5: Average regional house price & annual price growth (Dec 2019)
0%
1%
2%
3%
4%
Dec-19Nov-19Oct-19Sep-19Aug-19Jul-19Jun-19May-19Apr-19Mar-19Feb-19Jan-19Dec-18
UK England
Figure 4: Average annual house price growth: UK & England
Source: Land Registry/ONS
5
New mortgage lending fell again last December: loans to first time buyers (FTBs) were 4.4% down on the previous month, while loans to home movers fell by 4.4%. Compared to December 2018, loans to FTBs were marginally
higher (+0.3%) while loans to movers were 3.2% higher. Re-mortgaging was also lower in December – by 13% - although it was 2.7% higher than in December 2018.
0
5,000
10,000
15,000
20,000
25,000
30,000
35,000
40,000
Dec-19Nov-19Oct-19Sep-19Aug-19Jul-19Jun-19May-19Apr-19Mar-19Feb-19Jan-19Dec-18
First time buyers Home movers
Figure 7: Mortgage approvals for house purchase
Source: UK Finance
-2%
-1%
0%
1%
2%
3%
Feb-20Jan-20Dec-19Nov-19Oct-19Sep-19Aug-19Jul-19Jun-19May-19Apr-19Mar-19Feb-19
0.7%0.4%
0.3%
-1.0%
-0.2%
0.6%
-0.9%
2.3%
0.8%
-1.3%
1.1% 0.9%
-0.2%
Figure 6: Monthly change in average asking prices
Source: Rightmove
The average loan-to-value has risen over the past year, from 76.4 to 77.0 for FTBs and from 66.8 to 67.6
while the average loan size has risen by 4.3% for FTBs (£174,275) and by 6.4% for movers (£230,847).

6
London sales marketThere are further signs that the London market may have turned the corner in terms of activity and price growth. Rightmove reported that the number of sales agreed rose by 26.4% in February compared to the same month a year
ago. Buyer demand is outpacing supply, with the number of newly marketed properties up by 1.6% compared to February last year, the first time that Rightmove has seen a year-on-year rise since October 2018.
The rate of annual house price growth across Greater London accelerated in December according to the Land Registry, reaching 2.3% - the highest it has been since October 2017. This takes the average house price in the capital to £483,922, which is 2.1 times the UK average. More recent data reveals that asking prices are also rising: Rightmove reported that the average price of property
coming to market in February increased by 2.7% and theꢀannual growth rate stood at 2.4%, rising to 3.1% forꢀInner London.
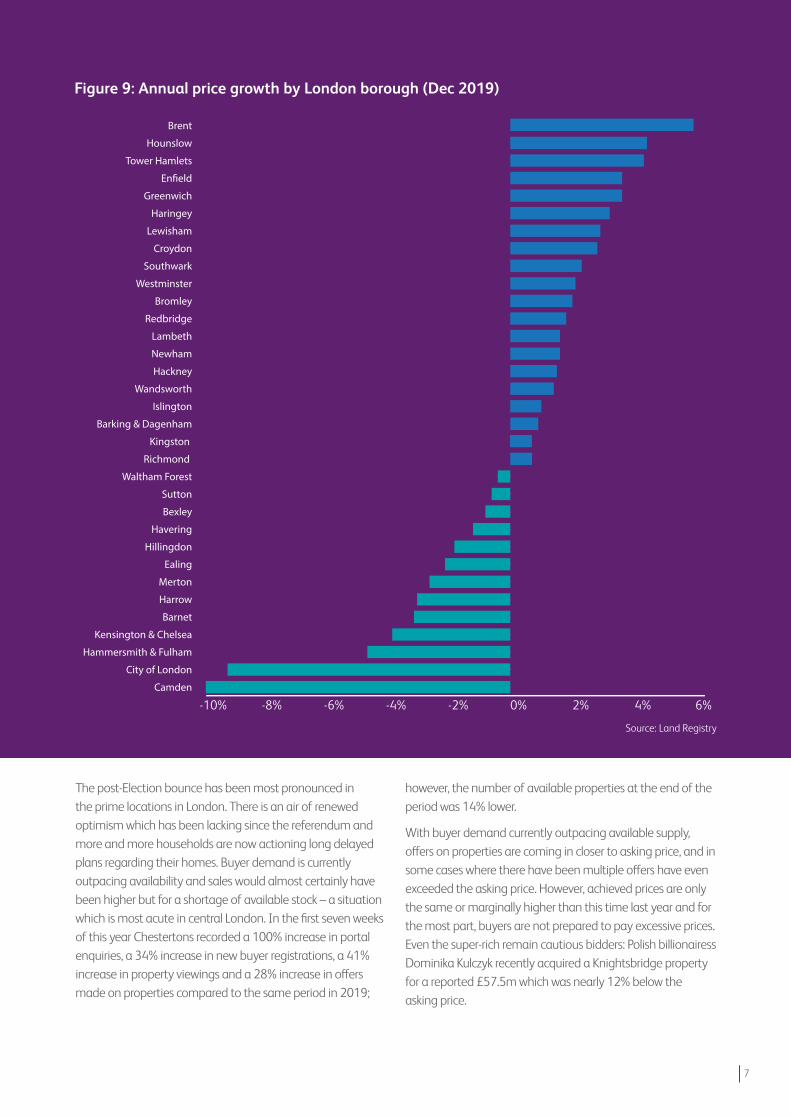
20 boroughs recorded price growth in the 12 months to December, one more than in the previous month. Brent (5.9%) recorded the strongest growth while Camden sawꢀprices fall by 9.8% over the period.
-3.5%
-2.5%
-1.5%
-0.5%
0.5%
1.5%
2.5%
Dec-19Nov-19Oct-19Sep-19Aug-19Jul-19Jun-19May-19Apr-19Mar-19Feb-19Jan-19Dec-18
Figure 8: Annual price growth in Greater London
Source: Land Registry
7
Figure 9: Annual price growth by London borough (Dec 2019)
Source: Land Registry
-10% -8% -6% -4% -2% 0% 2% 4% 6%Camden
City of London
Hammersmith & Fulham
Kensington & Chelsea
Barnet
Harrow
Merton
Ealing
Hillingdon
Havering
Bexley
Sutton
Waltham Forest
Richmond
Kingston
Barking & Dagenham
Islington
Wandsworth
Hackney
Newham
Lambeth
Redbridge
Bromley
Westminster
Southwark
Croydon
Lewisham
Haringey
Greenwich
Enꢀeld
Tower Hamlets
Hounslow
Brent
The post-Election bounce has been most pronounced in theꢀprime locations in London. There is an air of renewed optimism which has been lacking since the referendum and more and more households are now actioning long delayed plans regarding their homes. Buyer demand is currently outpacing availability and sales would almost certainly have been higher but for a shortage of available stock – a situation which is most acute in central London. In the first seven weeks of this year Chestertons recorded a 100% increase in portal enquiries, a 34% increase in new buyer registrations, a 41% increase in property viewings and a 28% increase in offers made on properties compared to the same period in 2019;
however, the number of available properties at the end of the period was 14% lower.
With buyer demand currently outpacing available supply, offers on properties are coming in closer to asking price, and in some cases where there have been multiple offers have even exceeded the asking price. However, achieved prices are only the same or marginally higher than this time last year and for the most part, buyers are not prepared to pay excessive prices. Even the super-rich remain cautious bidders: Polish billionairess Dominika Kulczyk recently acquired a Knightsbridge property for a reported £57.5m which was nearly 12% below the asking price.
8
The Government’s drive to reduce the country’s carbon footprint will have an increasing impact on the housing market, in particular new homes. Earlier in February, Barratt Developments, the UK’s biggest housebuilder, announced that it had become the first in the sector to commit to ‘science-based targets’ for reducing carbon emissions. The company has pledged to reduce its direct carbon emissions from its business operations, including offices, sites and show homes, by 29% by 2025 and to cut its indirect carbon emissions, such as those produced by completed Barratt homes over their lifetime and from across its supply chain, by 11% by 2030. How this will affect the pricing of new homes remains to be seen.
Meanwhile, the Government is consulting on its proposed First Homes scheme to help cut the cost of new homes by at least 30%. Eligibility will be for local people with priority given to first time buyers, current and former armed forces personnel and key workers – investors and second home owners will not be eligible. The discount will apply in perpetuity, so when the home is sold the new local buyer will also be able to purchase it at a discount. The discount will be paid for through the contributions that developers provide through the planning system and will not result in extra building costs according to the government.
North East North West Yorks & Humber West Midlands
Eastern South West London South East
East Midlands
0
5,000
10,000
15,000
20,000
25,000
2019201820172016201520142013201220112010
Figure 10: New home completions by English region
Source: NHBC
New homes marketNational
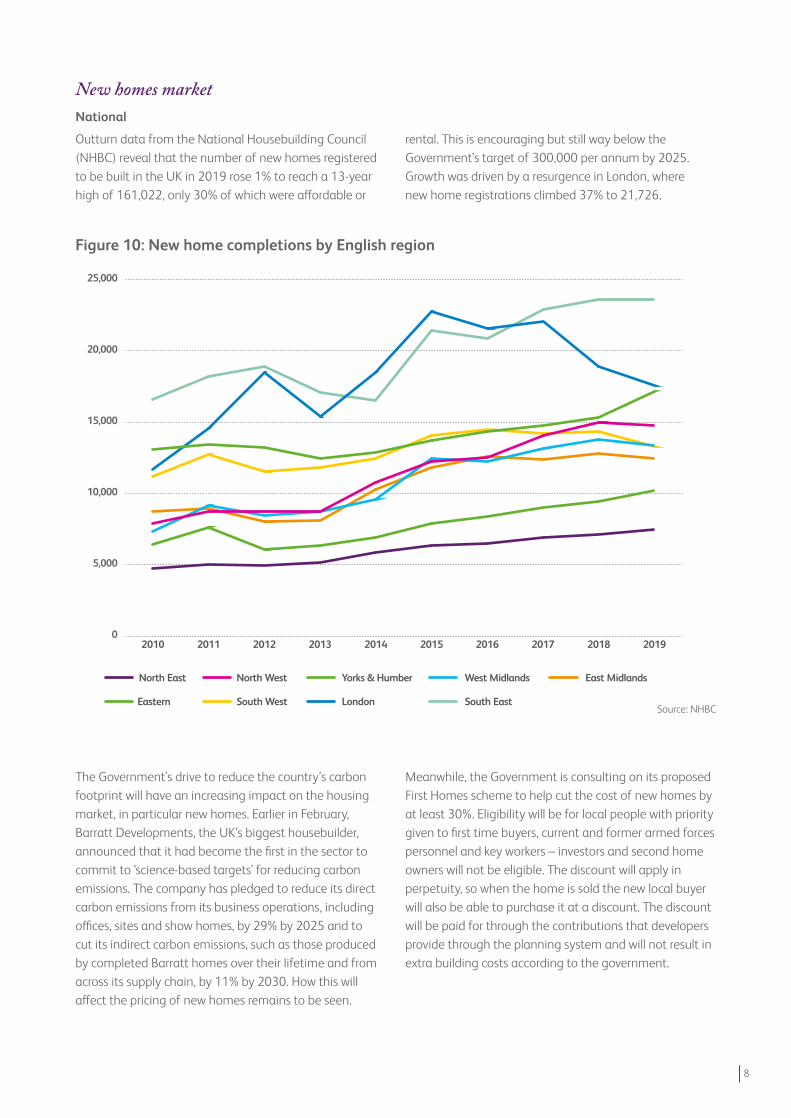
Outturn data from the National Housebuilding Council (NHBC) reveal that the number of new homes registered to be built in the UK in 2019 rose 1% to reach a 13-year high of 161,022, only 30% of which were affordable or
rental. This is encouraging but still way below the Government’s target of 300,000 per annum by 2025. Growth was driven by a resurgence in London, where newꢀhome registrations climbed 37% to 21,726.

9
The new homes build-to-rent sector in London has slowed over the past year. Construction starts fell by 37% in 2019 and completions were 14% lower. Sales to BTR investors also fell by 26% over the year, although they picked up in the final quarter, accounting for 31% of total new homes’ sales in the capital. The slowdown is a reflection of investors seeking better opportunities outside London – typically in the large regional centres where entry costs are lower and
yields are higher and where there is strong tenant demand – and developer reluctance to switch from the more lucrative mainstream sales market. With sales to SE Asian buyers – especially Chinese – affected by the corona virus epidemic, sales to BTR investors could increase again in the first quarter of this year if developers struggle to meet their sales targets.
Starts Completions Sales
0
1,000
2,000
3,000
4,000
5,000
6,000
7,000
8,000
9,000
20192018201720162015
Source: Molior
Figure 11: London Build-to-Rent starts, completions & sales
London

10
National lettingsAnnual rental growth in the UK slowed to 2.3% in January, with the average monthly rent reaching £953 (£793 excluding London). Rents rose fastest in the North East
(8.7%) and fell, albeit slightly, in three regions with the South West (-0.9%) recording the worst performance.
A government report suggests the private rental sector is attracting an increasing number of older tenants and as a result needs to change to accommodate this change. ‘Living Longer: Changes in Housing Tenure over Time’ is aꢀreport from the Office for National Statistics which says that although three-quarters of people aged 65 years and over in England own their home outright, an increasing proportion is renting. It also says younger people are more likely to be renting. People in their mid-30s to mid-40s are three times more likely to rent than 20 years ago, with aꢀthird of this age group renting from a private landlord inꢀ2017, compared with fewer than one in 10 in 1997.
There are growing concerns that the short-term letting industry is having a negative impact on the private rented
sector. A recent survey conducted by ARLA (Association of Residential Lettings Agents) and Capital Economic suggests that 16% of adults (equating to 8.2 million people) have let out all or part of their property at least once in the last two years. There is an increasing number of buy-to-let (BTL) landlords who are switching their properties from longer lets to the potentially more lucrative short let sector, where rents are typically much higher. This is removing mainstream private rental stock and exacerbating the already serious supply shortages. The ARLA survey estimates that 46,000 properties have already been removed from the mainstream rental market and around 10% of landlords surveyed were considering switching their portfolios to short lets.
LETTINGS MARKET
Figure 12: National & regional monthly rents & 12 month rental growth at Jan 2020
0
200
400
600
800
1,000
1,200
1,400
1,600
1,800
SouthWest
East OfEngland
SouthEast
West Midlands
NorthEast
UK(excl. London)
UKAverageꢀ
Yorks &Humber
GreaterLondon
EastMidlands
NorthWest
-2%
0%
2%
4%
6%
8%
10%
Monthly rent Annual growth
2.3%2.3%2.4%
4.4%5.1%
8.7%
1.1% 0.9%-0.1% -0.2%
-0.9%
Source: Homelet
11
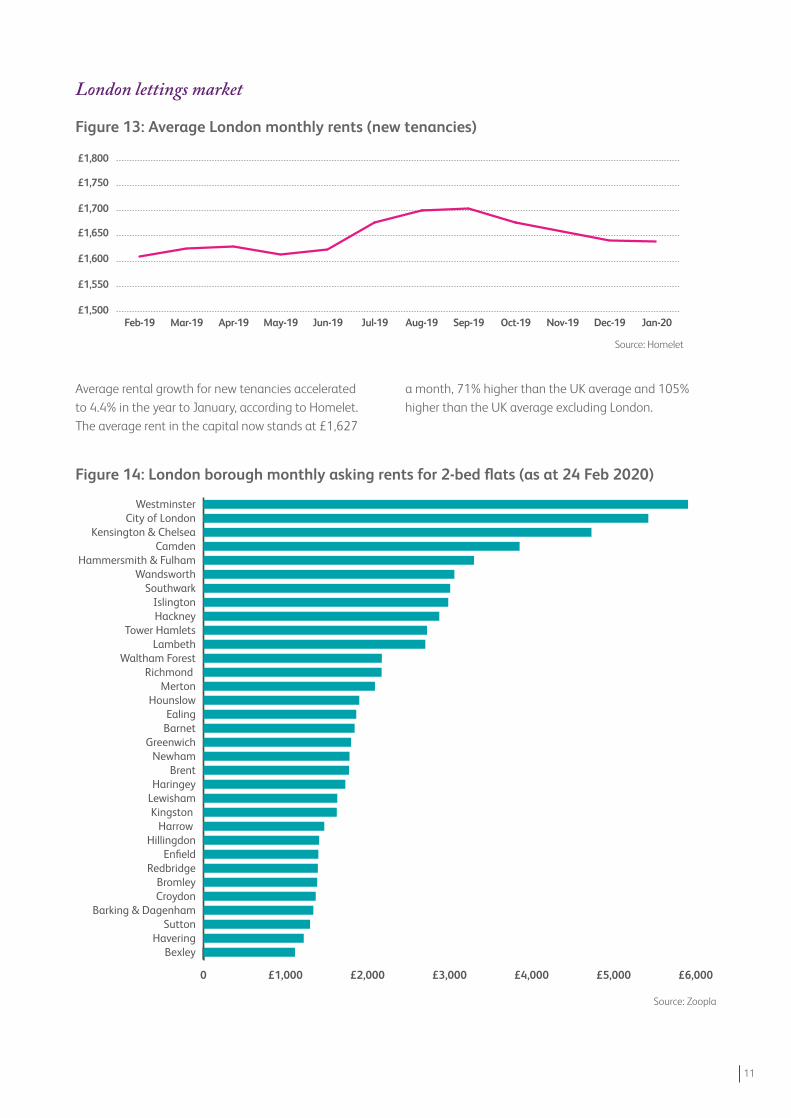
Average rental growth for new tenancies accelerated toꢀ4.4% in the year to January, according to Homelet. Theꢀaverage rent in the capital now stands at £1,627
aꢀmonth, 71% higher than the UK average and 105% higher than the UK average excluding London.
Figure 13: Average London monthly rents (new tenancies)
London lettings market
£1,500
£1,550
£1,600
£1,650
£1,700
£1,750
£1,800
Jan-20Dec-19Nov-19Oct-19Sep-19Aug-19Jul-19Jun-19May-19Apr-19Mar-19Feb-19
Source: Homelet
Figure 14: London borough monthly asking rents for 2-bed flats (as at 24 Feb 2020)
0 £1,000 £2,000 £3,000 £4,000 £5,000 £6,000
BexleyHavering
SuttonBarking & Dagenham
CroydonBromley
RedbridgeEnfield
HillingdonHarrowꢀ
Kingston LewishamHaringey
BrentNewham
GreenwichBarnetEaling
HounslowMerton
Richmond Waltham Forest
LambethTower Hamlets
HackneyIslington
SouthwarkWandsworth
Hammersmith & FulhamCamden
Kensington & ChelseaCity of London
Westminster
Source: Zoopla

12
Short lets are having the greatest impact on the mainstream rental market in London, which has the largest short let market in the country and is expanding rapidly – the ARLA survey calculates the number of short lets in the capital quadrupled between 2015 and 2019. Central London boroughs have the highest density of
short-term lets as measured by Airbnb listings and an estimated one fifth of Londoners have let out a property on a short-term basis in the last two years. Moreover, more than 10,000 Airbnb listings in London are seemingly in breach of the city’s 90-day limit on short-term rentals, according to City Hall.
Airbnb listings: Top 10 London boroughs
City of London 7.0%
Westminster 6.7%
Tower Hamlets 6.3%
Kensington and Chelsea 6.2%
Hackney 5.4%
Camden 5.2%
Islington 4.6%
Hammersmith and Fulham 4.4%
Southwark 3.5%
Lambeth 3.3%
Source: Airbnb, MHCLG & Capital Economics
Figure 15: Airbnb listing as % of total dwelling stock, October 2019
After a very active second half year in 2019, the prime lettings market has started relatively quietly so far this year. Lettings volumes in the first two months of 2020 are around 10% down on the same period last year, although this may be partly due to available supply having fallen
by nearly the same amount over the year. Nonetheless, rents are edging upwards and in some locations an acute shortage of available stock means that properties are being let very quickly at or close to asking rent.
13
INVESTMENT MARKET
0
2,000
4,000
6,000
8,000
10,000
12,000
14,000
16,000
18,000
Dec-19Nov-19Oct-19Sep-19Aug-19Jul-19Jun-19May-19Apr-19Mar-19Feb-19Jan-19Dec-18
House purchase Remortgage
Figure 16: BTL Mortgage Lending (number of loans approved)
Source: UK Finance
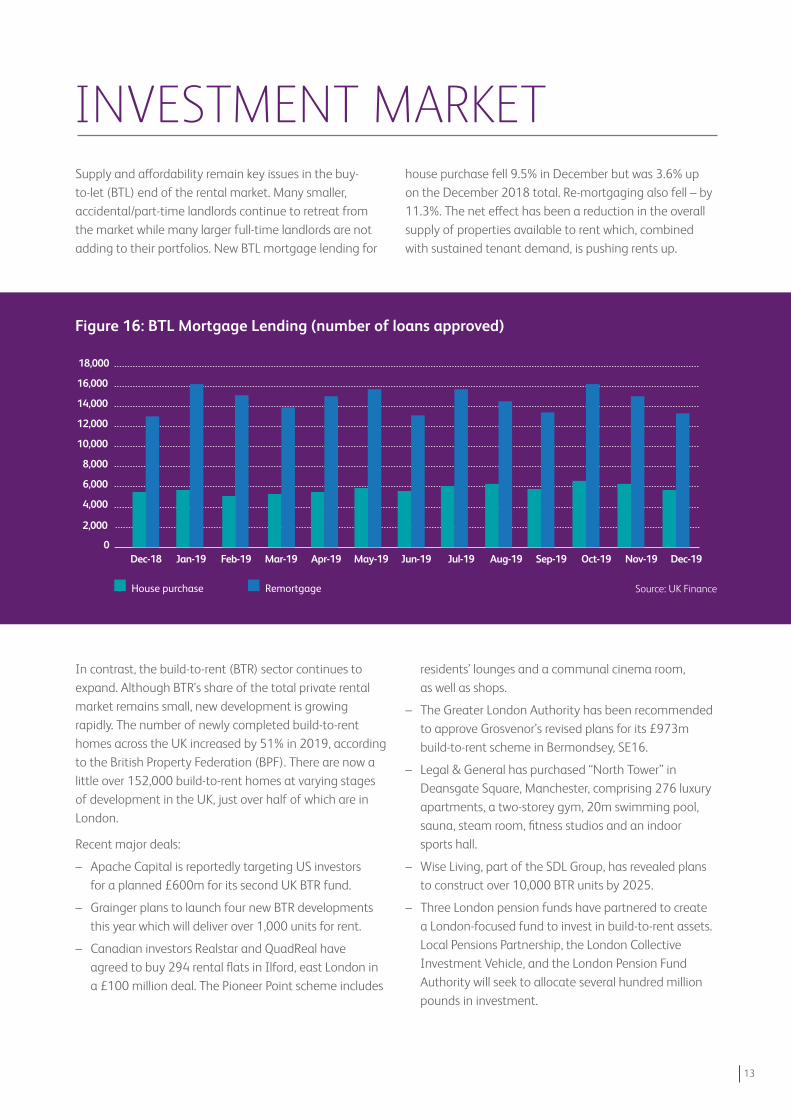
Supply and affordability remain key issues in the buy-to-let (BTL) end of the rental market. Many smaller, accidental/part-time landlords continue to retreat from the market while many larger full-time landlords are not adding to their portfolios. New BTL mortgage lending for
house purchase fell 9.5% in December but was 3.6% up on the December 2018 total. Re-mortgaging also fell – by 11.3%. The net effect has been a reduction in the overall supply of properties available to rent which, combined with sustained tenant demand, is pushing rents up.
In contrast, the build-to-rent (BTR) sector continues to expand. Although BTR’s share of the total private rental market remains small, new development is growing rapidly. The number of newly completed build-to-rent homes across the UK increased by 51% in 2019, according to the British Property Federation (BPF). There are now a little over 152,000 build-to-rent homes at varying stages of development in the UK, just over half of which are in London.
Recent major deals:
– Apache Capital is reportedly targeting US investors forꢀa planned £600m for its second UK BTR fund.
– Grainger plans to launch four new BTR developments this year which will deliver over 1,000 units for rent.
– Canadian investors Realstar and QuadReal have agreedꢀto buy 294 rental flats in Ilford, east London in a £100 million deal. The Pioneer Point scheme includes
residents’ lounges and a communal cinema room, asꢀwell as shops.
– The Greater London Authority has been recommended to approve Grosvenor’s revised plans for its £973m build-to-rent scheme in Bermondsey, SE16.
– Legal & General has purchased “North Tower” in Deansgate Square, Manchester, comprising 276 luxury apartments, a two-storey gym, 20m swimming pool, sauna, steam room, fitness studios and an indoor sports hall.
– Wise Living, part of the SDL Group, has revealed plans to construct over 10,000 BTR units by 2025.
– Three London pension funds have partnered to create a London-focused fund to invest in build-to-rent assets. Local Pensions Partnership, the London Collective Investment Vehicle, and the London Pension Fund Authority will seek to allocate several hundred million pounds in investment.
14
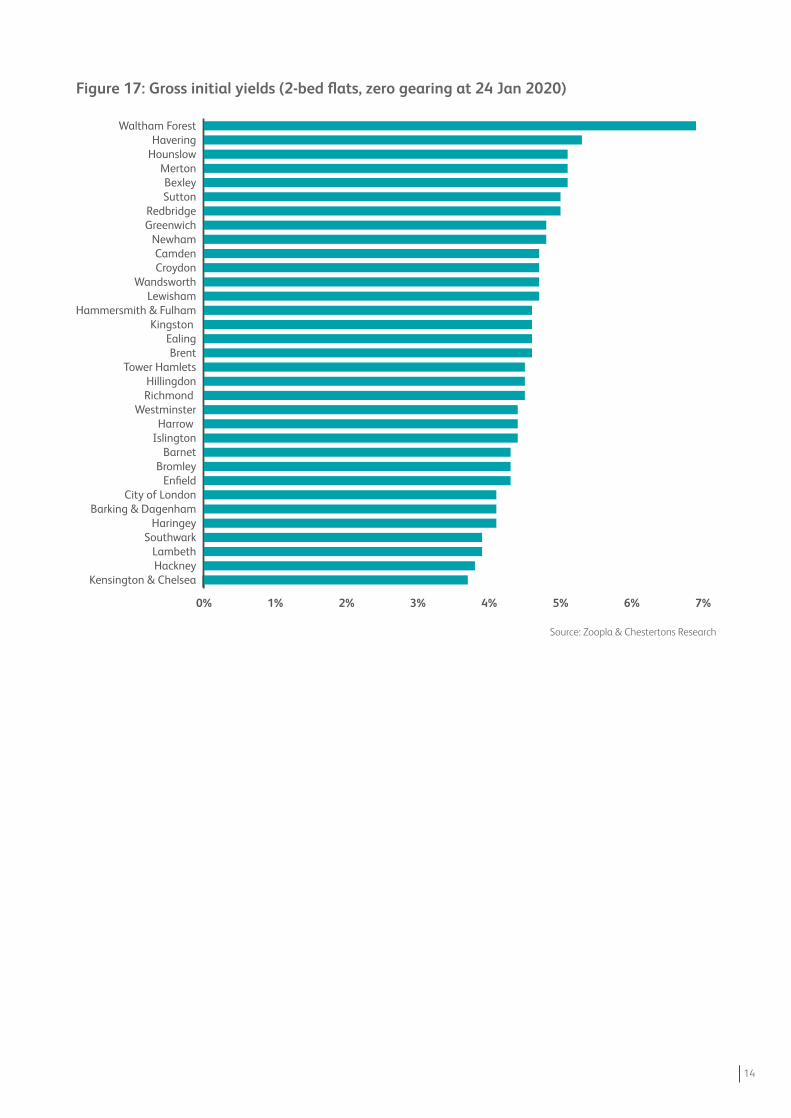
Figure 17: Gross initial yields (2-bed flats, zero gearing at 24 Jan 2020)
0% 1% 2% 3% 4% 5% 6% 7%
Kensington & ChelseaHackneyLambeth
SouthwarkHaringey
Barking & DagenhamCity of London
EnfieldBromley
BarnetIslingtonHarrowꢀ
WestminsterRichmond Hillingdon
Tower HamletsBrent
EalingKingston
Hammersmith & FulhamLewisham
WandsworthCroydonCamden
NewhamGreenwichRedbridge
SuttonBexley
MertonHounslowHavering
Waltham Forest
Source: Zoopla & Chestertons Research

15
The contents of this report are intended for the purpose of general information and should not be relied upon as the basis for decision taking on the part of the reader. Although every effort has been made to ensure the accuracy of the information contained within this report at the time of writing, no liability is accepted by Chesterton Global for any loss or damage resulting from its use. Reproduction of this report in whole or in part is not permitted without the prior written approval of Chesterton Global. February 2020.
Contact
Nicholas BarnesHead of Research
T: +44 (0) 20 3040 8406 E: [email protected]
John Woolley Head of Valuation
T: +44 (0) 20 3040 8513 E: [email protected]
Anshul Raja Director, Key Clients
T: +44 (0) 207 201 2063 E: [email protected]


![Foliations of asymptotically flat manifolds by surfaces of ... · Foliations of asymptotically flat manifolds using constant mean curvature surfaces have been considered in [9],](https://img.pdfslide.us/doc/110x75/5fdb240cc1f24f434c4bc542/foliations-of-asymptotically-iat-manifolds-by-surfaces-of-foliations-of-asymptotically.jpg)