Embed Size (px)
Citation preview
Chesapeake Bay Watershed
Implementation Plan
Chesapeake’s Local Strategies
January 2012
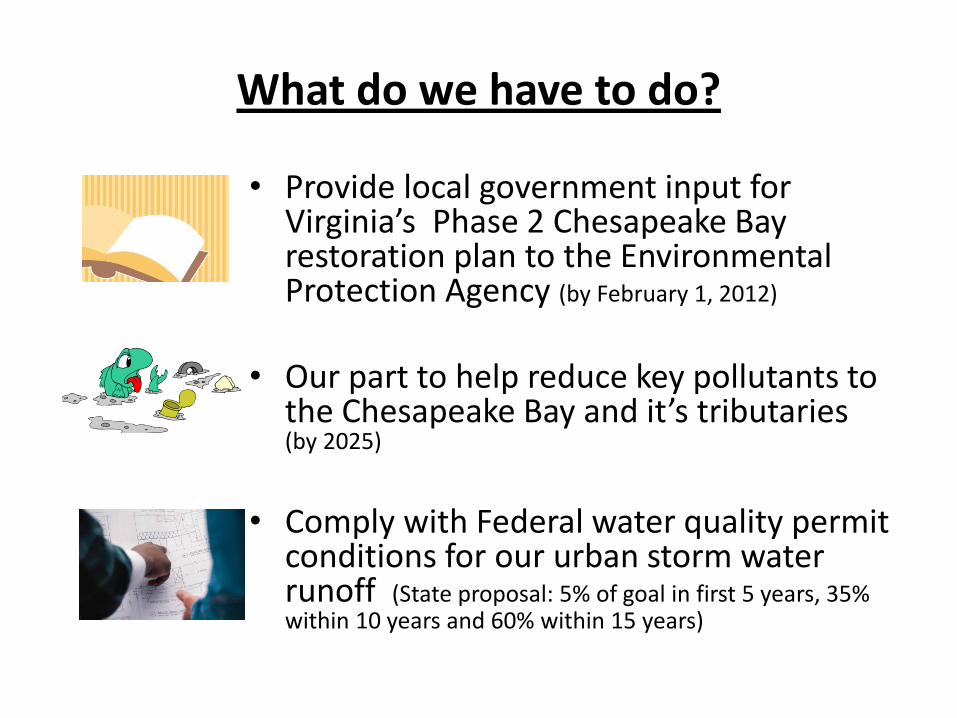
What do we have to do?
• Provide local government input for Virginia’s Phase 2 Chesapeake Bay restoration plan to the Environmental Protection Agency (by February 1, 2012)
• Our part to help reduce key pollutants to
the Chesapeake Bay and it’s tributaries (by 2025)
• Comply with Federal water quality permit
conditions for our urban storm water runoff (State proposal: 5% of goal in first 5 years, 35% within 10 years and 60% within 15 years)
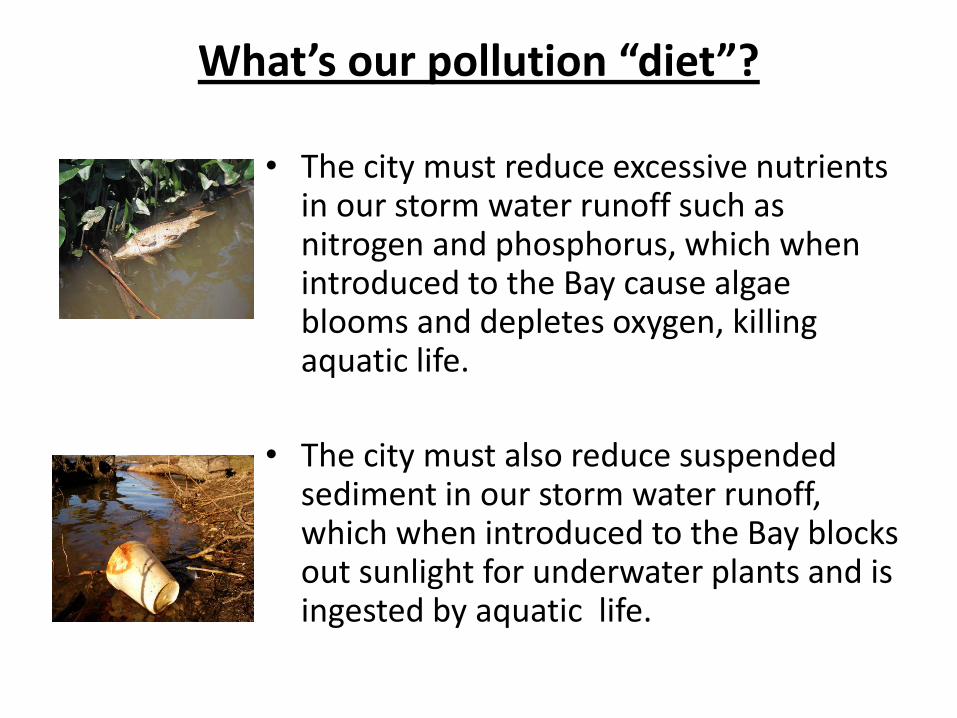
What’s our pollution “diet”?
• The city must reduce excessive nutrients in our storm water runoff such as nitrogen and phosphorus, which when introduced to the Bay cause algae blooms and depletes oxygen, killing aquatic life.
• The city must also reduce suspended sediment in our storm water runoff, which when introduced to the Bay blocks out sunlight for underwater plants and is ingested by aquatic life.
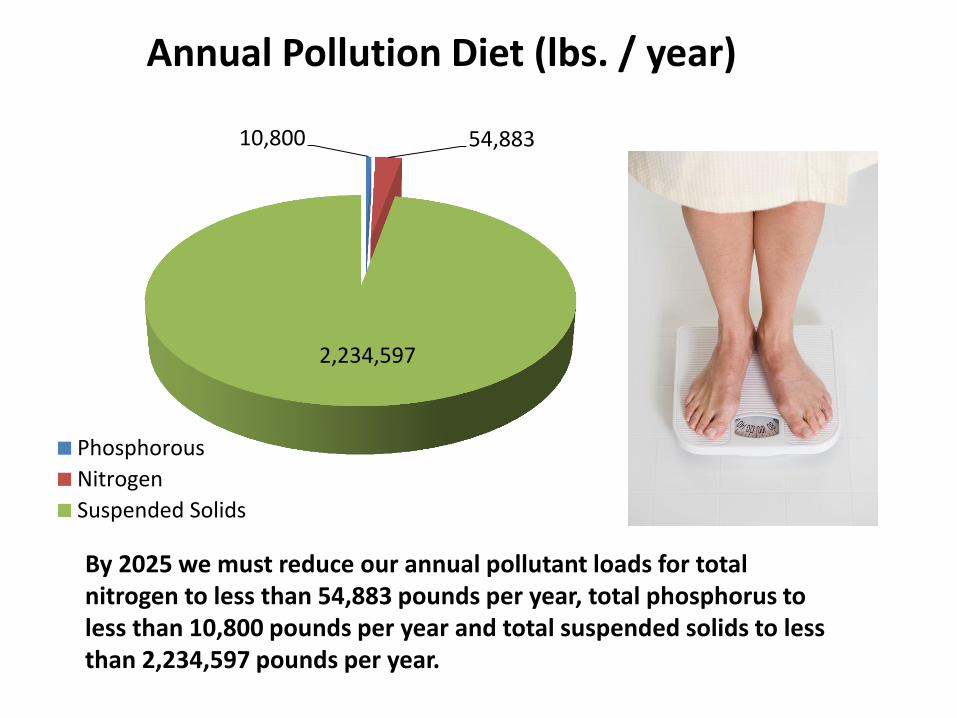
10,800 54,883
2,234,597
Annual Pollution Diet (lbs. / year)
Phosphorous
Nitrogen
Suspended Solids
By 2025 we must reduce our annual pollutant loads for total nitrogen to less than 54,883 pounds per year, total phosphorus to less than 10,800 pounds per year and total suspended solids to less than 2,234,597 pounds per year.
Local strategy Issues
• EPA’s Bay model built for macro bay watershed segment analysis and not local sub watershed level.
• Bay model inaccurately identified the City’s agricultural land uses and farm animal populations
• Watershed boundaries were inaccurate
• Only BMPs installed after 2006 are allowed for credit in the Bay model
• Several current VPDES permit pollution reduction activities are not captured (or credited) in the model
Therefore, our strategies are based on actual ground truth not inaccurate modeling parameters
$0
$0
$0
$0
$0
$1
$1
$1
$1
$1
$1
0
500,000
1,000,000
1,500,000
2,000,000
2,500,000
Corrected Land UseAcreages
ManufacturedBMPs
Erosion AndSediment Control
(rcn)
Erosion AndSediment Control
(rex)
Street Sweeping
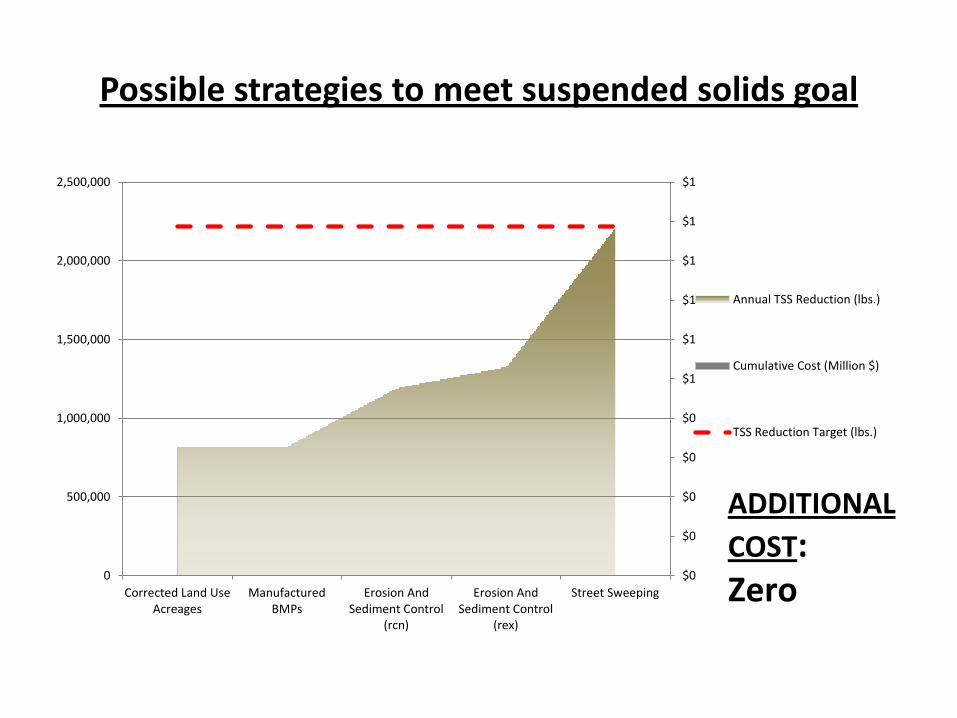
Annual TSS Reduction (lbs.)
Cumulative Cost (Million $)
TSS Reduction Target (lbs.)
ADDITIONAL
COST: Zero
Possible strategies to meet suspended solids goal
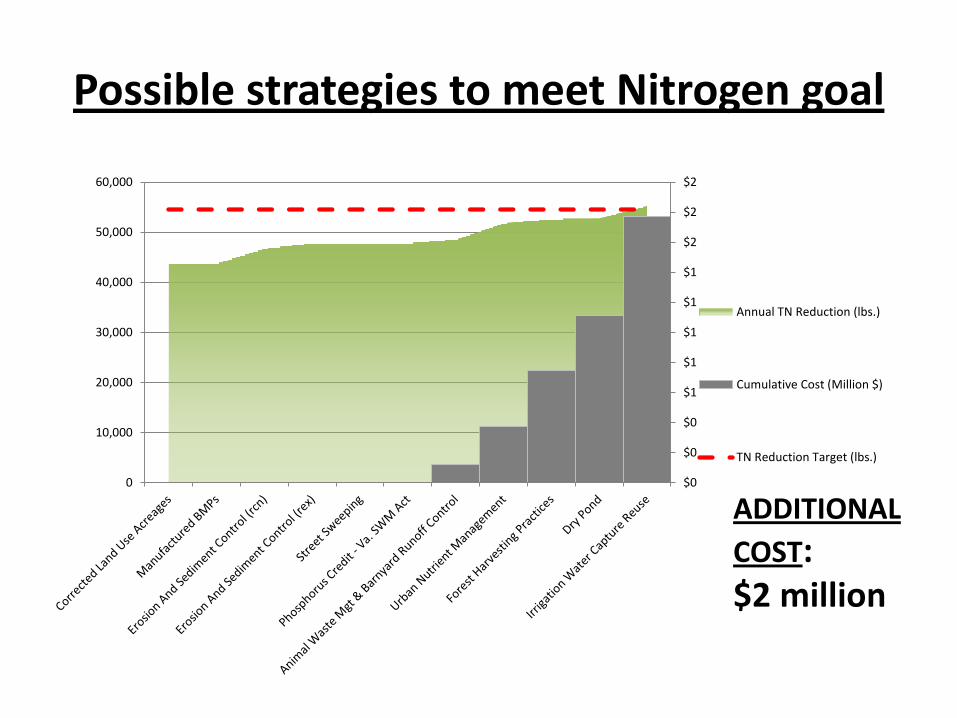
Possible strategies to meet Nitrogen goal
$0
$0
$0
$1
$1
$1
$1
$1
$2
$2
$2
0
10,000
20,000
30,000
40,000
50,000
60,000
Annual TN Reduction (lbs.)
Cumulative Cost (Million $)
TN Reduction Target (lbs.)
ADDITIONAL
COST: $2 million
$0
$10
$20
$30
$40
$50
$60
0
2,000
4,000
6,000
8,000
10,000
12,000
14,000
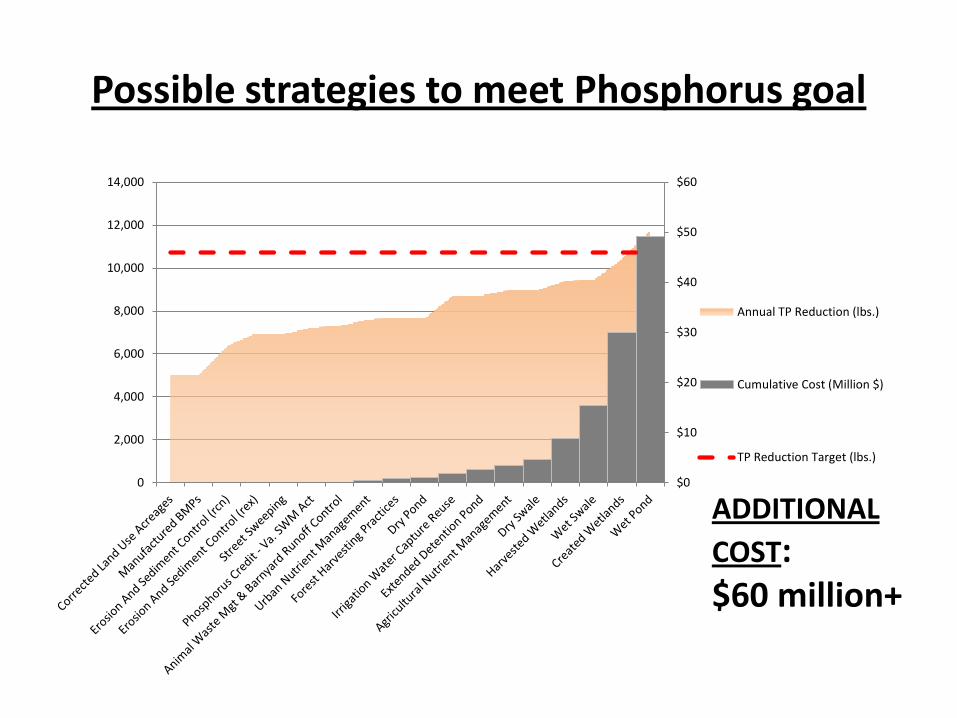
Annual TP Reduction (lbs.)
Cumulative Cost (Million $)
TP Reduction Target (lbs.)
ADDITIONAL
COST: $60 million+
Possible strategies to meet Phosphorus goal
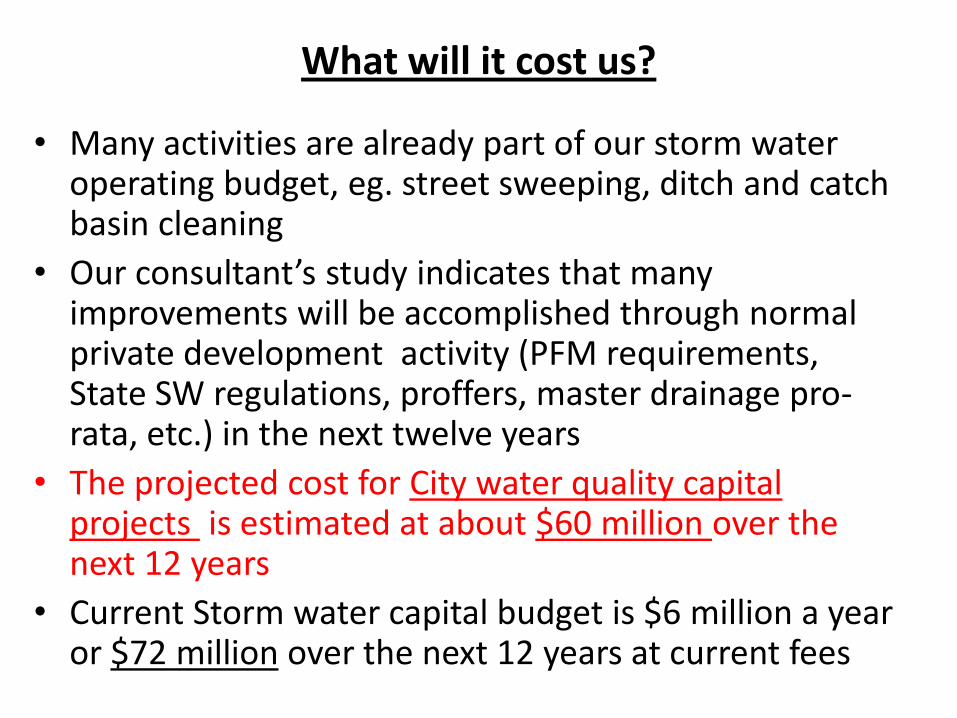
What will it cost us?
• Many activities are already part of our storm water operating budget, eg. street sweeping, ditch and catch basin cleaning
• Our consultant’s study indicates that many improvements will be accomplished through normal private development activity (PFM requirements, State SW regulations, proffers, master drainage pro-rata, etc.) in the next twelve years
• The projected cost for City water quality capital projects is estimated at about $60 million over the next 12 years
• Current Storm water capital budget is $6 million a year or $72 million over the next 12 years at current fees
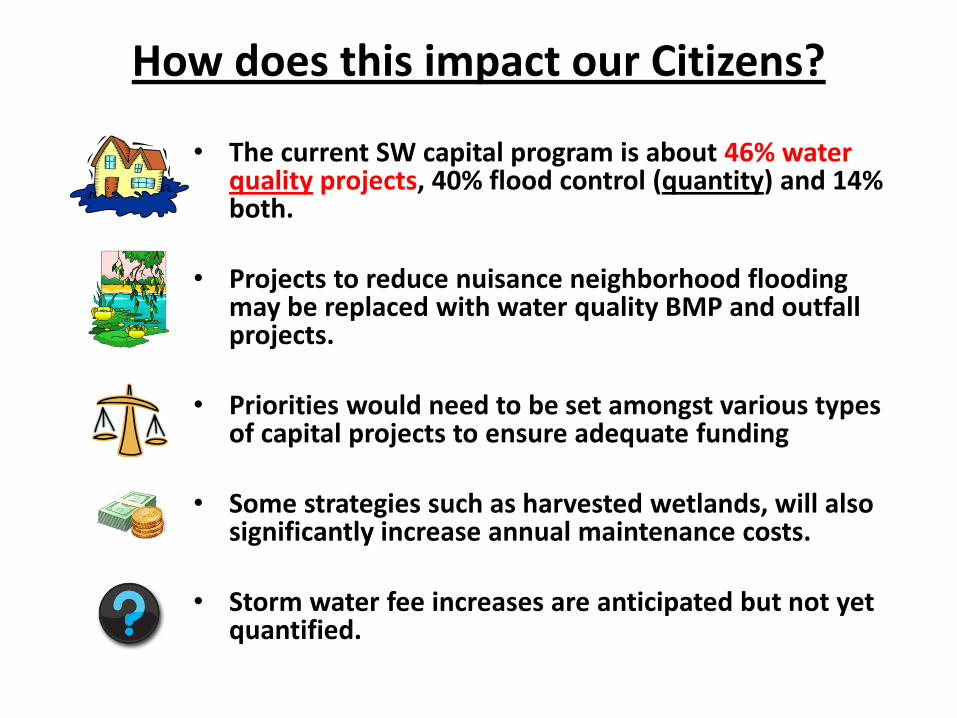
How does this impact our Citizens?
• The current SW capital program is about 46% water quality projects, 40% flood control (quantity) and 14% both.
• Projects to reduce nuisance neighborhood flooding may be replaced with water quality BMP and outfall projects.
• Priorities would need to be set amongst various types of capital projects to ensure adequate funding
• Some strategies such as harvested wetlands, will also significantly increase annual maintenance costs.
• Storm water fee increases are anticipated but not yet quantified.
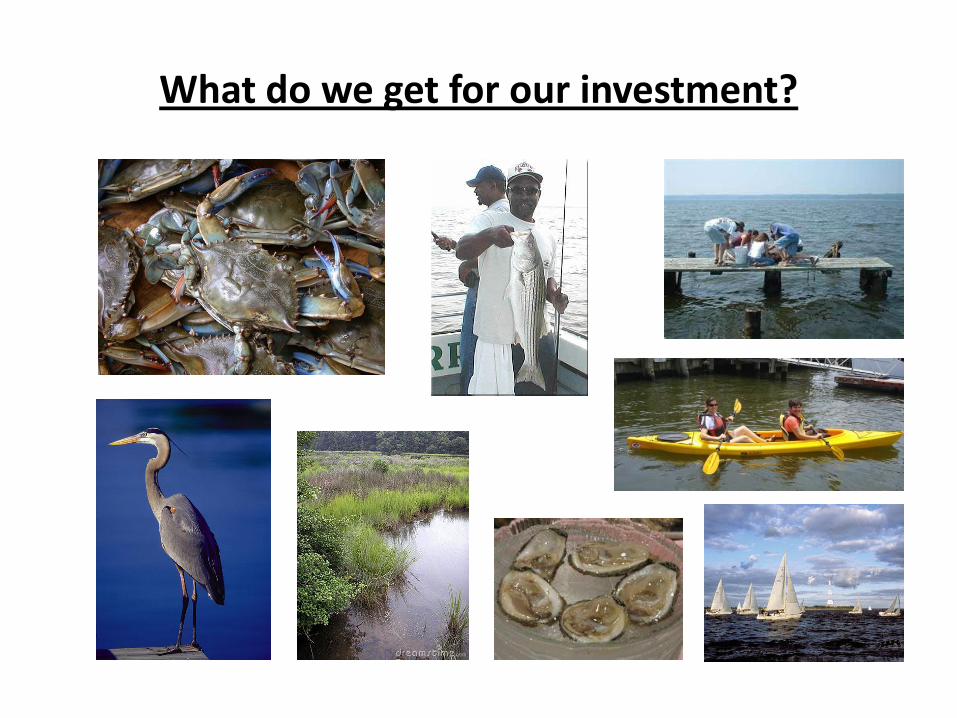
What do we get for our investment?
Next Steps
• Formal City Council action not required
• Submit deliverables to the Department of Conservation and Recreation before the February 1, 2012 deadline
• Continue coordination and discussions with regional partners and DCR
• Begin to identify specific local projects and programs with our City TMDL implementation team to begin implementation of strategies
• Identify additional resource needs via the annual budget process

![C Series 66,500 Material Handling Machine - equipint.com Brochures/Sennebogen 825… · 66,500lbs. green line Material Handling Machine ... [5,730] 10,800 [5,730] 10,800 [5,730] 10,800](https://img.pdfslide.us/doc/110x75/5aace4fa7f8b9aa06a8d9e4e/c-series-66500-material-handling-machine-brochuressennebogen-82566500lbs.jpg)