Embed Size (px)
DESCRIPTION
Chesapeake Bay Shallow Water Monitoring - Progress on Implementation and Analysis. Bruce Michael Director, Tidewater Ecosystem Assessment Division MSC Meeting, May 17, 2006. Chesapeake Bay Shallow Water Monitoring Design Consists of 2 Components Integrated with Other Forms of Monitoring. - PowerPoint PPT Presentation
Citation preview

Chesapeake Bay Shallow Water Monitoring - Progress on
Implementation and Analysis
Bruce MichaelDirector, Tidewater Ecosystem
Assessment Division
MSC Meeting, May 17, 2006
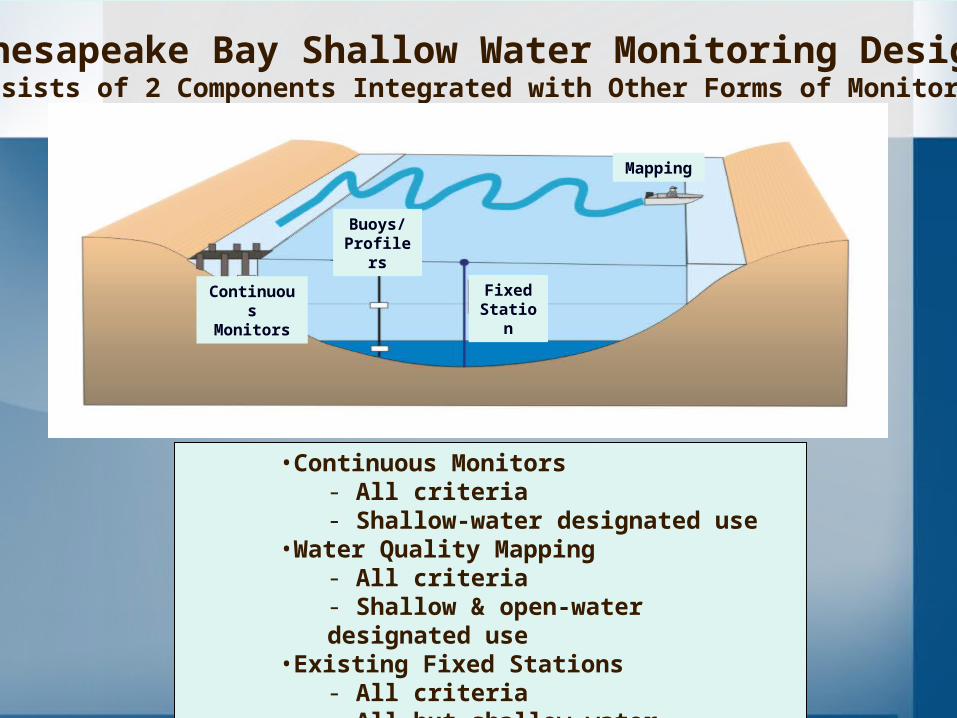
Chesapeake Bay Shallow Water Monitoring DesignConsists of 2 Components Integrated with Other Forms of Monitoring
•Continuous Monitors- All criteria- Shallow-water designated use
•Water Quality Mapping- All criteria - Shallow & open-water designated use
•Existing Fixed Stations- All criteria - All but shallow-water designated use
ContinuousMonitors
Buoys/Profilers
Mapping
Fixed Station

Continuous Monitors
YSI 6600 EDS – Measures Dissolved Oxygen, Turbidity, Chlorophyll, Water Temperature,Salinity, pH
• Generally, deployed April – October, over a 3-year period
• A subset of meters are telemetered real-time to website
• Measures water quality parameters every 15 minutes

• Monthly cruises, April – October, over a 3-year period• Measures water quality parameters every 4 seconds
YSI 6600 EDS – Measures Dissolved Oxygen, Turbidity, Chlorophyll, Water Temperature, Salinity, pH
Dataview Real – Time GIS Software
Electronics
YSI/Flow Unit
Water Quality Mapping Stowaway
Water Quality Mapping


Virginia – 2006 Proposed Tidal Monitoring Sites

Better Coordination with OtherLong-Term Monitoring Programs
New 2006 Segments and Partners
• Entire Potomac• CBL• SMCM• VA DEQ• VIMS• COG• GMU• CBOS• EPA• NOAA• USGS• US Army• St. Mary’s Co.
• Choptank• HPL• USDA• Creekwatchers
• Wicomico• SU & HPL• Creekwatchers• NERRS


Org. Area Day
SWCM St. Mary’s Mon/Tue
CBL Lower Pot. Monday
DNR Piney Pt. Monday
DNR Nomini Monday
CBL Upper Pot Tuesday
DNR Upper Olig. Tuesday
DNR Lower Olig. Tuesday
DNR Dahlgren Friday
SMCM MD Tribs Mon/Fri


12.5 - 19
10 - 12.5
7.5 - 10
5 - 7.5
2.5 - 5
0 - 2.5
Dissolved Oxygen (mg/l)
100 +
60 - 100
50 - 60
40 - 50
30 - 40
20 - 30
10 - 20
0 - 10
Chlorophyll (ug/l)
37.5 +
30 - 37.5
22.5 - 30
15 - 22.5
7.5 - 15
0 - 7.5
Turbidity (NTU)
Water Quality MappingPotomac River
April 10-14th 2006

Water Quality Criteria Assessment Protocols (CAP) Workgroup
The Chesapeake Bay Program established this workgroup to:
- develop assessment methods to evaluate attainment of the criteria and designated uses,
- address many unresolved issues regarding assessment of water quality criteria

CAP Workgroup’s SWM Chlorophyll/Turbidity/DO Analysis Team
Elgin Perry – statistics consultant Ken Moore - VIMS Walter Boynton - CBL Julie Baldizar – USGS Bill Romano – MD DNR Mark Trice – MD DNR MD & VA State and Federal partners

CAP Workgroup SWM Tasks
- Shallow water issues * water clarity assessment procedures * chlorophyll assessment procedures * use of fixed stations for high frequency DO measurements * temporal adjustment of spatial mapping data
- Reporting * how should assessment results be reported * what type of information should be reported * how should information be managed/stored * what is the schedule for reporting assessment results

Directions Needed for Potential
Water Clarity Assessment
1.Baywide Consistency
2.Simplicity
3.Use of CFD for Clarity Assessment

SAV Area A
SAV Area B
Clarity Criteria Assessment Method 1 (MD&VA)
Attainment ofSAV Acreage Goal
Attainment Defined as:
SAV Acreage > SAV Goal
Single Best Year
AttainmentDepth
Contour

SAV Area A
SAV Area B
Clarity Criteria Assessment Method 2 (VA)
Attainment ofWater Clarity Acreage Goal
Attainment Defined as:
SAV Acreage < SAV Goal
Water Clarity Acreage > WC Goal
Single Best Year
Water Clarity Area B
Water Clarity Area A
AttainmentDepth
Contour
SAV Area A
SAV Area B
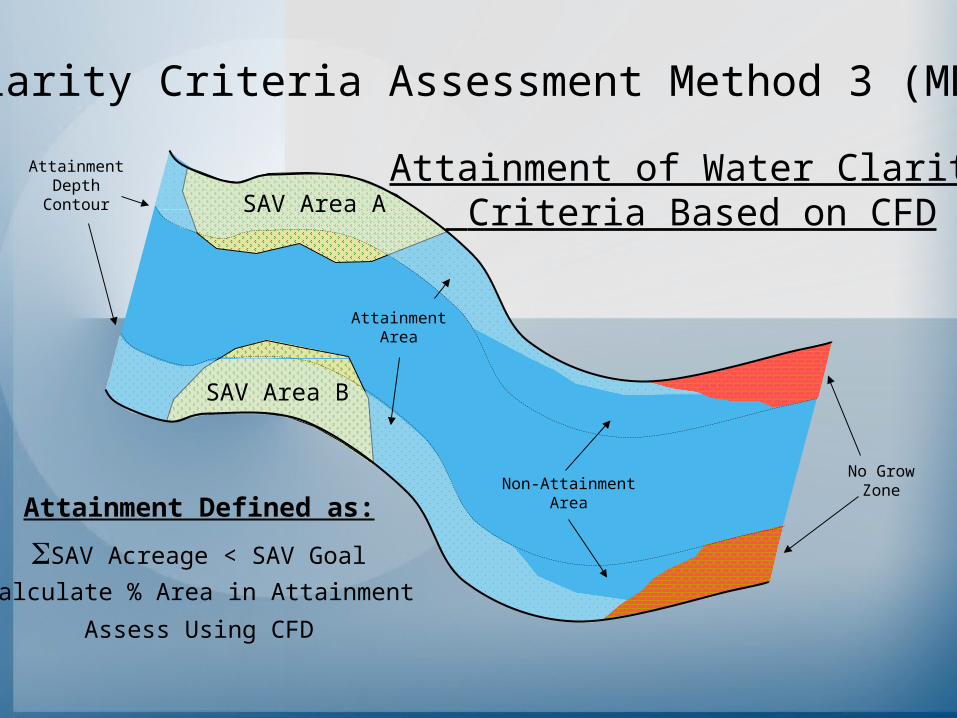
Clarity Criteria Assessment Method 3 (MD)
Attainment of Water Clarity Criteria Based on CFD
AttainmentDepth
Contour
Attainment Defined as:
SAV Acreage < SAV Goal
Calculate % Area in Attainment
Assess Using CFD
No GrowZone
AttainmentArea
Non-AttainmentArea

SAV Area A
SAV Area B
Clarity Criteria Assessment Method 4 (MD)
Attainment of CombinedSAV & WC Acreage Goals
AttainmentDepth
Contour
Attainment Defined as:
SAV Acreage < SAV Goal
SAV Acreage + WC Acreage) > SAV Goal
No GrowZone
Clarity AttainmentArea
Non-AttainmentArea
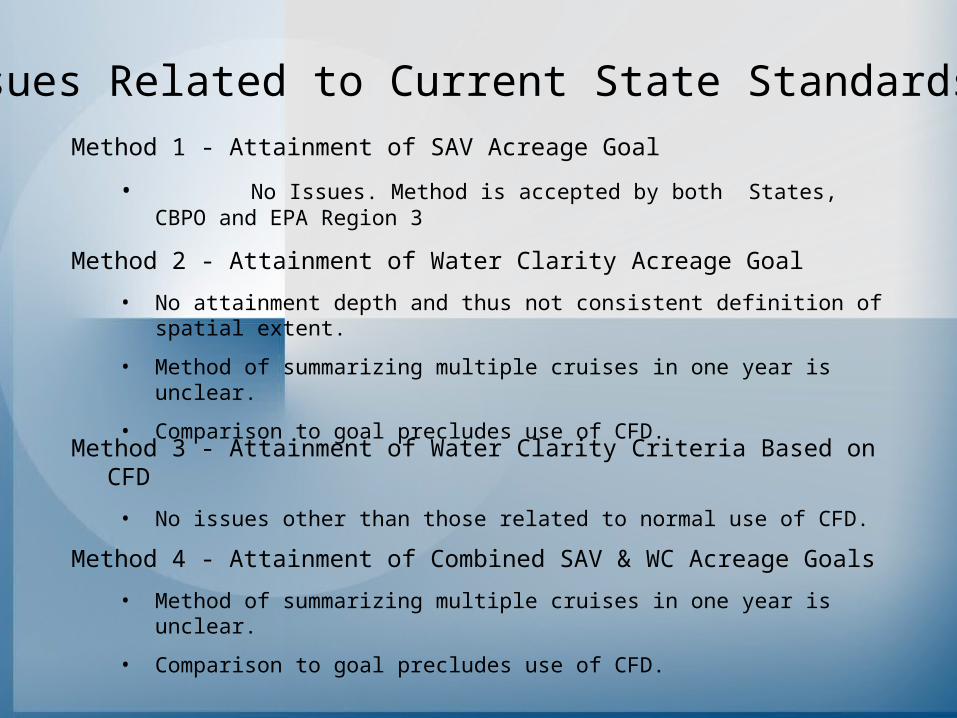
Issues Related to Current State Standards
Method 1 - Attainment of SAV Acreage Goal
• No Issues. Method is accepted by both States, CBPO and EPA Region 3
Method 2 - Attainment of Water Clarity Acreage Goal
• No attainment depth and thus not consistent definition of spatial extent.
• Method of summarizing multiple cruises in one year is unclear.
• Comparison to goal precludes use of CFD.
Method 3 - Attainment of Water Clarity Criteria Based on CFD
• No issues other than those related to normal use of CFD.
Method 4 - Attainment of Combined SAV & WC Acreage Goals
• Method of summarizing multiple cruises in one year is unclear.
• Comparison to goal precludes use of CFD.

Chlorophyll and Turbidity Measurement Issues
Although YSI 6600 chlorophyll approximates extractive chlorophyll a at many stations, the criteria will be in terms of chlorophyll a
kd will be used to evaluate the Bay water clarity standards, so turbidity would be used at shallow water sites
kd can also be used in the Gallegos optical model to partition light attenuation into TSS and chlorophyll components

Develop a post-calibration chlorophyll model
Match extractive and YSI 6600 chlorophyll Outlier prediction model to remove data Test for significant differences (adjust all
data, or only for significant differences?) Geographical differences Background fluorescence adjustment Photo-inhibition (diel study conducted on
the Patuxent estuary)


Develop a kd model
Using linear regression, USGS found that turbidity was the best single variable predictor of kd at 5 of 10 sites (r2 from 0.23 to 0.62)
Turbidity was significant, but not best at one site
Other than turbidity, TP, DOC, salinity, TN, DIN, and TVS were found to good predictors of kd
VA found that in general, turbidity was the best predictor of kd in their systems

Next steps
Complete assembling multiyear shallow water monitoring database (MD and VA)
Determine best model approach based on spatial distribution (lumping or splitting)
Evaluate models using both continuous and water quality mapping data
Provide documentation for review Publish by late 2006

7
7.5
8
8.5
9
9.5
12:00:00 AM 4:48:00 AM 9:36:00 AM 2:24:00 PM 7:12:00 PM 12:00:00 AM 4:48:00 AM
Time
DO
(m
g/l
)
Time of Day Averaged Continuous Monitoring DOMagothy R., April 15 - October 31, 2001

Average 15-minute intervals of Continuous Monitoring DO data from a 2-week period surrounding a water quality mapping cruise (8/22/01).
Fit 3rd-order polynomial regression of averaged continuous monitoring DO data from 5am to 1-hr after DATAFLOW cruise.
Use regression equation to obtain time-based correction factor for water quality mapping and adjust to daily minimum (0600).
Mapping Data - (Predicted (Tcollected) - Predicted T0600)
y = -60.124x3 + 96.685x2 - 40.923x + 11.81
R2 = 0.9792
6
6.5
7
7.5
8
8.5
12:00:00 AM 2:24:00 AM 4:48:00 AM 7:12:00 AM 9:36:00 AM 12:00:00 PM 2:24:00 PM
Time
DO
(m
g/l
)
Correcting DO Data for Time of Day to “Normalize” Water Quality Mapping

2.53
3.54
4.55
5.56
6.57
7.58
8.5
8:24:00 8:52:48 9:21:36 9:50:24 10:19:12 10:48:00 11:16:48 11:45:36
Time
DO
(m
g/l
)
Uncorrected DO Corrected DO
Water Quality Mapping:Uncorrected vs. Corrected (to daily min.)
08/22/01 Magothy River
0
10
20
30
40
50
60
70
80
2_3 3_4 4_5 5_6 6_7 7_8
DO Range (mg/l)
% M
ago
thy
Are
a
%Area_Uncorrected
%Area_Corrected
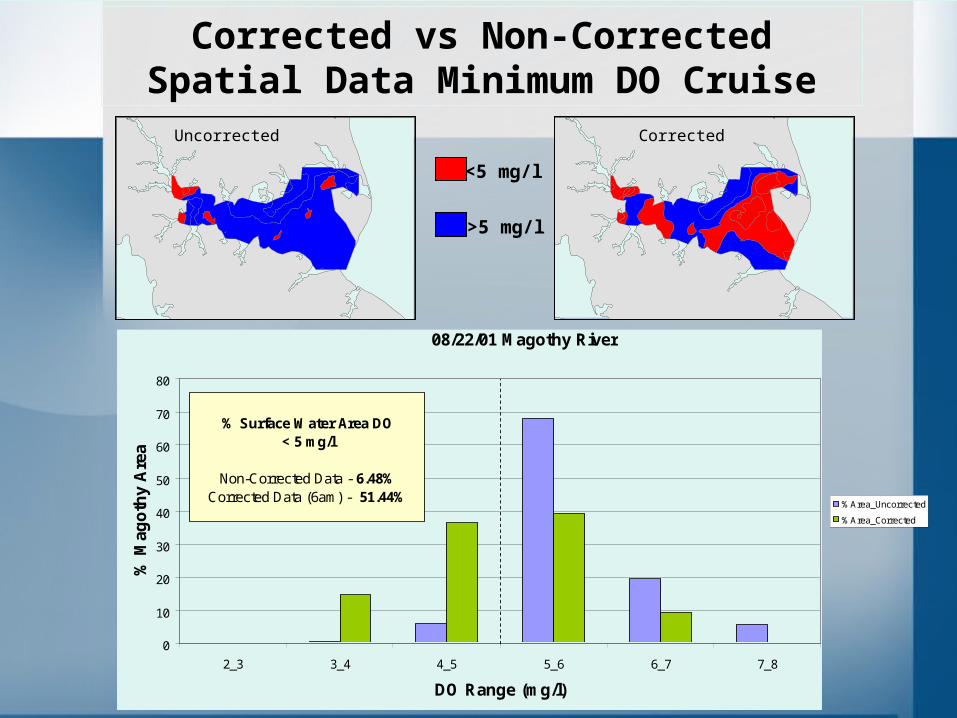
% Surface Water Area DO < 5 mg/l
Non-Corrected Data - 6.48%Corrected Data (6am) - 51.44%
Uncorrected Corrected
<5 mg/l
>5 mg/l
Corrected vs Non-Corrected Spatial Data Minimum DO Cruise

Water Quality Criteria Assessment Protocols Workgroup
SCHEDULE
- Workgroup efforts initiated in spring 2005
- Assessment results for States 2006 impaired waters listing for dissolved oxygen and shallow water SAV coverage completed in November 2005
- Concerted efforts beginning January 2006 to complete tasks by June 2006 meeting of Water Quality Steering Committee to review efforts.
- Develop draft document addressing criteria assessment issues for science review - summer 2006
- Complete/release technical report by December 2006 for States to consider in updating regulations