Embed Size (px)
Citation preview

Chesapeake Bay Chesapeake Bay InitiativesInitiatives
John KennedyJohn KennedyVA DEQ, Chesapeake Bay ProgramVA DEQ, Chesapeake Bay Program
[email protected]@deq.virginia.gov804-698-4312804-698-4312
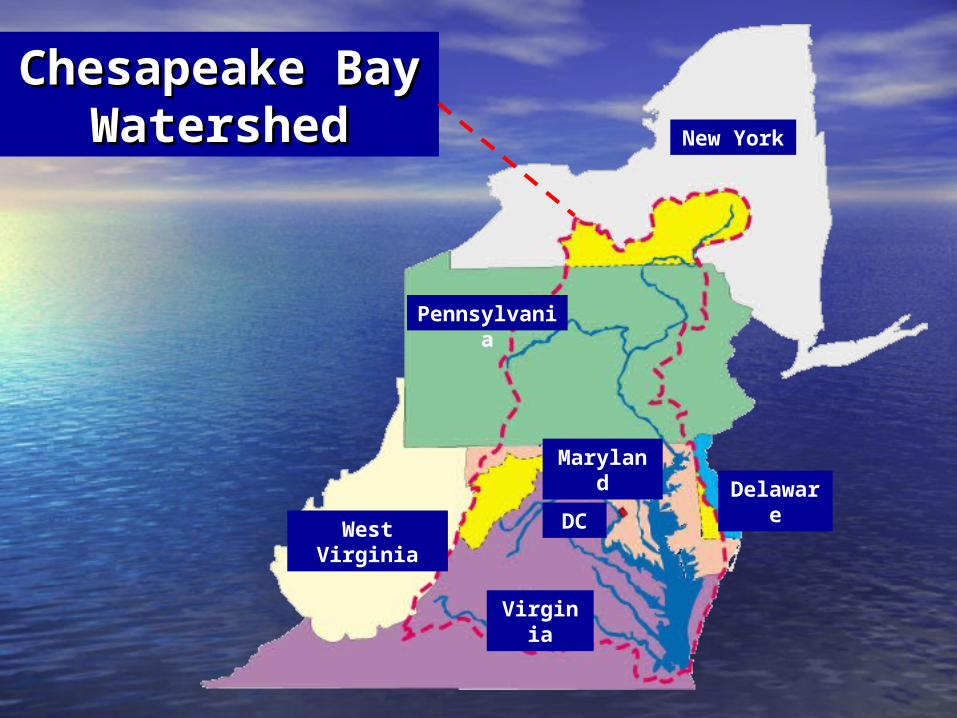
Maryland
Delaware
New York
DC
Virginia
West Virginia
Pennsylvania
Chesapeake Chesapeake Bay Bay
WatershedWatershed
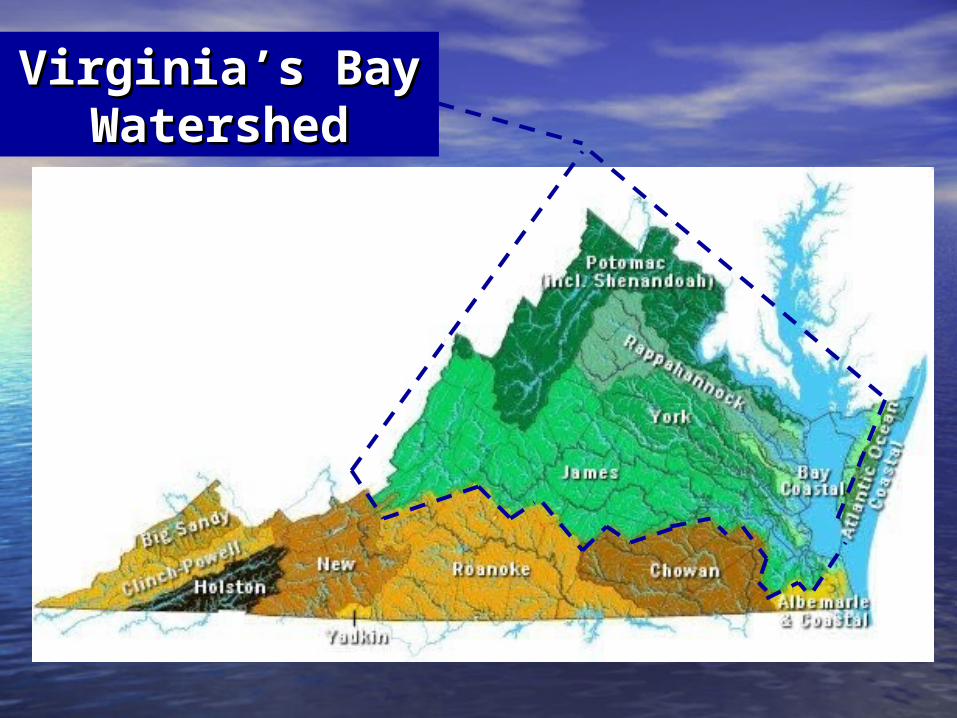
Virginia’s Bay Virginia’s Bay WatershedWatershed
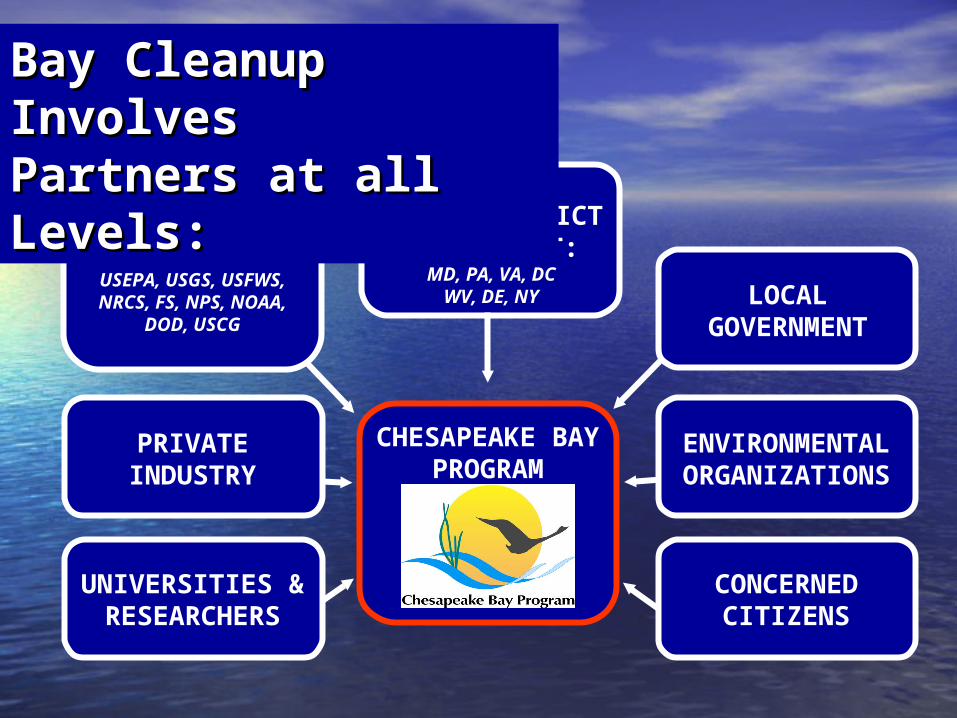
FEDERAL GOVERNMENT:USEPA, USGS, USFWS, NRCS, FS, NPS, NOAA,
DOD, USCG
STATE/DISTRICTGOVERNMENT:
MD, PA, VA, DCWV, DE, NY LOCAL
GOVERNMENT
PRIVATE INDUSTRY
ENVIRONMENTAL ORGANIZATIONS
CHESAPEAKE BAY PROGRAM
UNIVERSITIES & RESEARCHERS
CONCERNED CITIZENS
Bay Cleanup Bay Cleanup InvolvesInvolvesPartners at all Partners at all Levels:Levels:
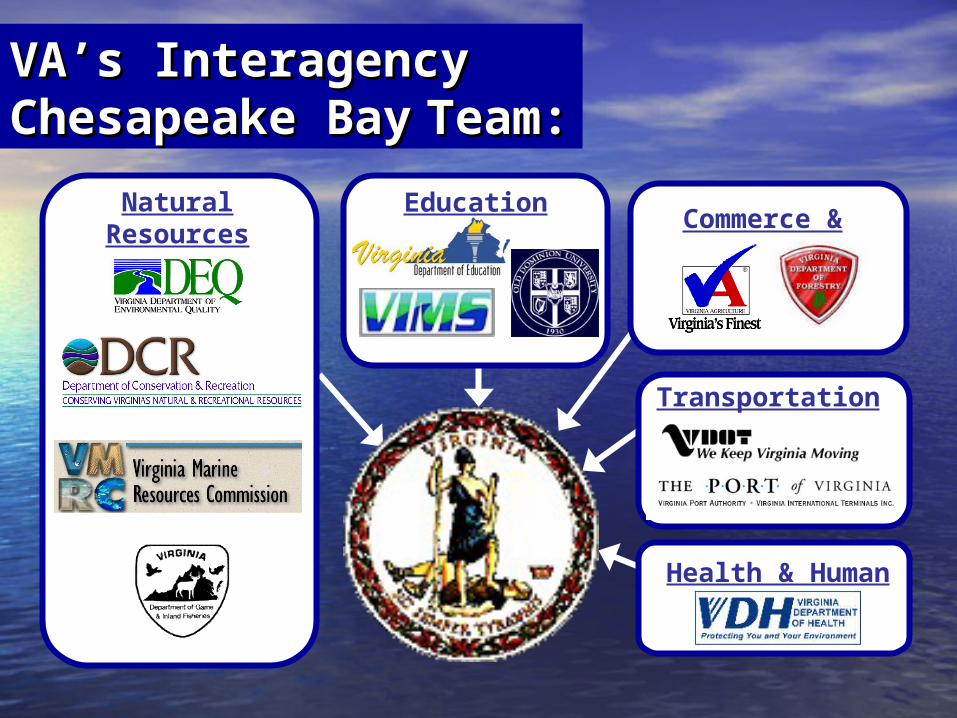
Natural Resources Education
Transportation
Health & Human Res.
VA’s InteragencyVA’s InteragencyChesapeake BayChesapeake Bay
Team:Team:Commerce & Trade
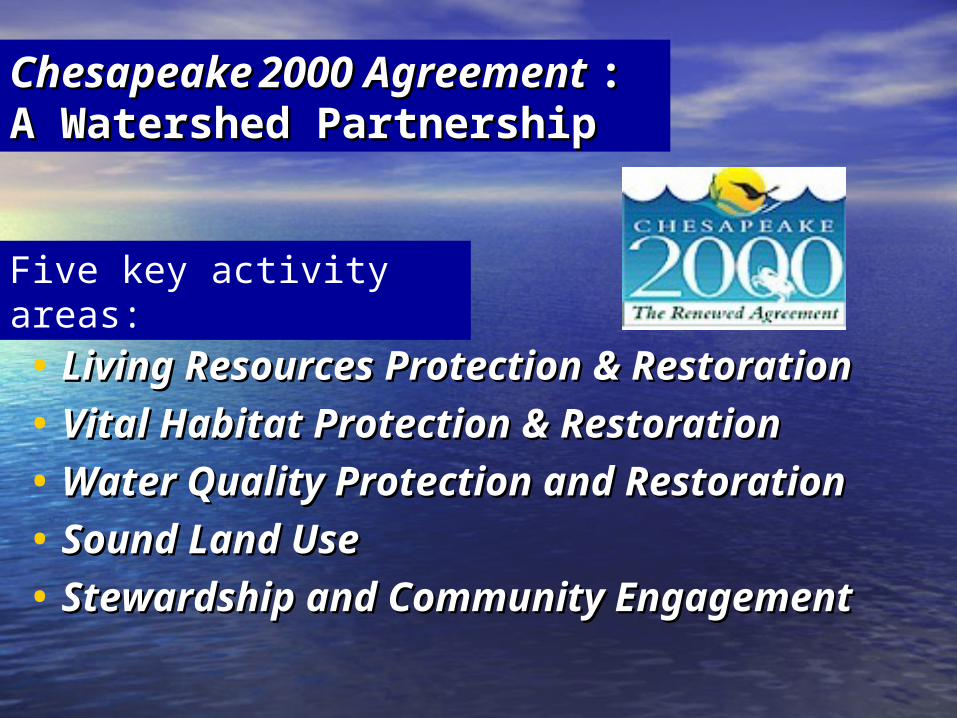
• Living Resources Protection & RestorationLiving Resources Protection & Restoration
• Vital Habitat Protection & RestorationVital Habitat Protection & Restoration
• Water Quality Protection and RestorationWater Quality Protection and Restoration
• Sound Land UseSound Land Use
• Stewardship and Community EngagementStewardship and Community Engagement
Five key activity areas:
ChesapeakeChesapeake 2000 2000 Agreement Agreement : : A Watershed PartnershipA Watershed Partnership
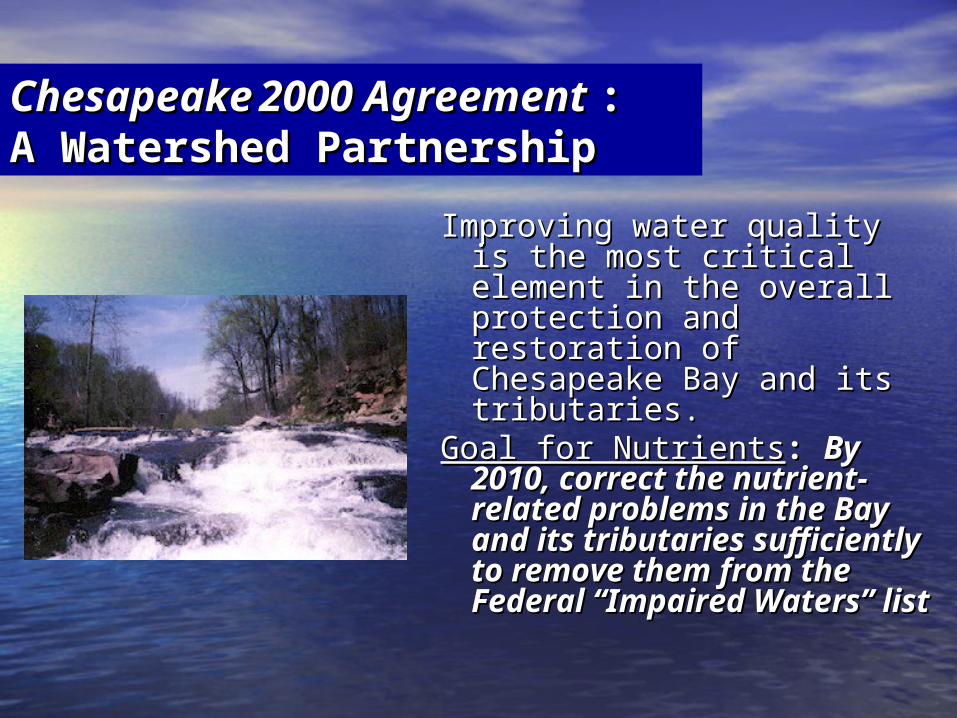
Improving water quality is Improving water quality is the most critical element in the most critical element in the overall protection and the overall protection and restoration of Chesapeake restoration of Chesapeake Bay and its tributaries. Bay and its tributaries.
Goal for NutrientsGoal for Nutrients: : By 2010, By 2010, correct the nutrient-correct the nutrient-related problems in the related problems in the Bay and its tributaries Bay and its tributaries sufficiently to remove sufficiently to remove them from the Federal them from the Federal “Impaired Waters” list“Impaired Waters” list
ChesapeakeChesapeake 2000 2000 Agreement Agreement : : A Watershed PartnershipA Watershed Partnership
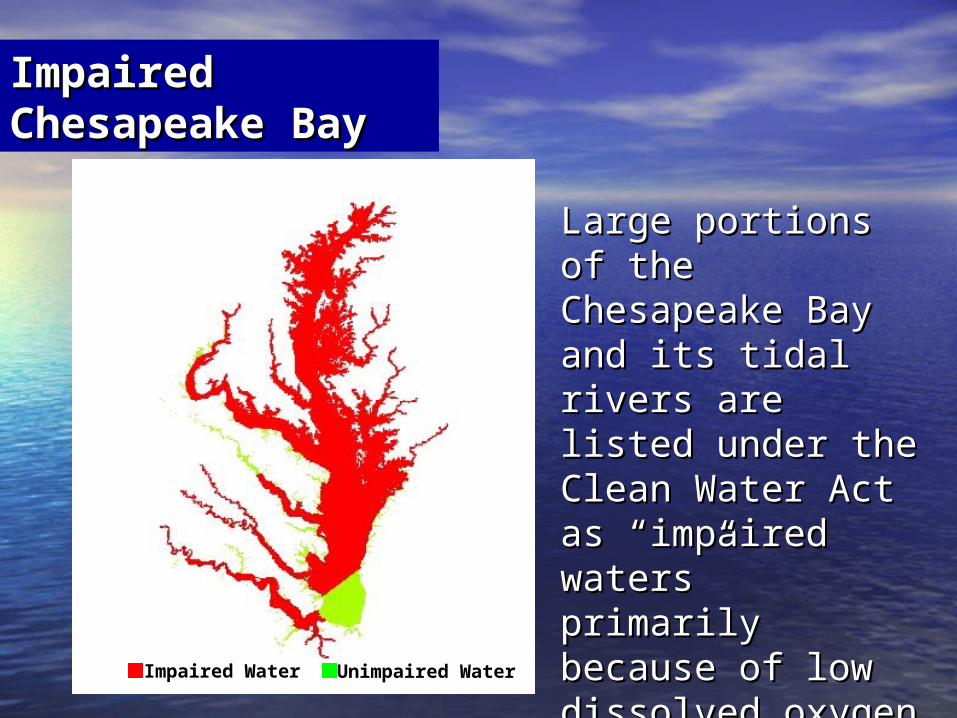
Large portions of Large portions of the Chesapeake the Chesapeake Bay and its tidal Bay and its tidal rivers are listed rivers are listed under the Clean under the Clean Water Act as Water Act as “impaired waters” “impaired waters” primarily because primarily because of low dissolved of low dissolved oxygen levels and oxygen levels and other problems other problems related to nutrient related to nutrient pollution.pollution.
Impaired Water Unimpaired Water
ImpairedImpairedChesapeake BayChesapeake Bay
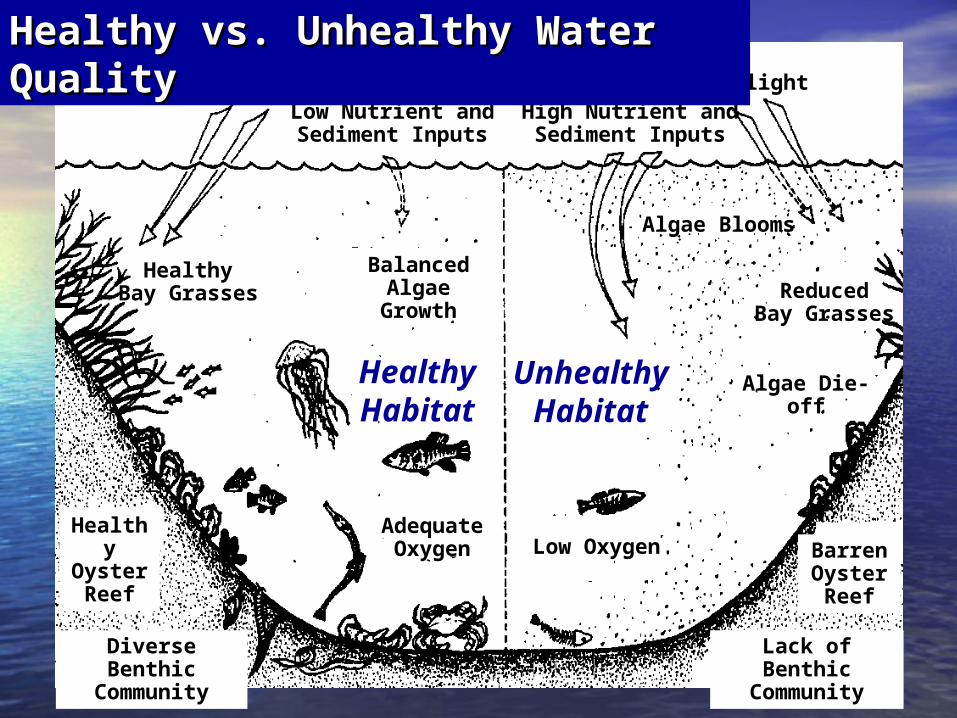
Sunlight Sunlight
HealthyHabitat
UnhealthyHabitat
BalancedAlgae Growth
Low Nutrient and Sediment Inputs
High Nutrient and Sediment Inputs
HealthyBay Grasses Reduced
Bay Grasses
Algae Die-off
Algae Decomposition
Low Oxygen
Lack of Benthic Community
Diverse Benthic Community
HealthyOyster Reef
AdequateOxygen
Algae Blooms
Barren Oyster Reef
Healthy vs. Unhealthy Water Healthy vs. Unhealthy Water QualityQuality
The Chesapeake Bay:How is it Doing?
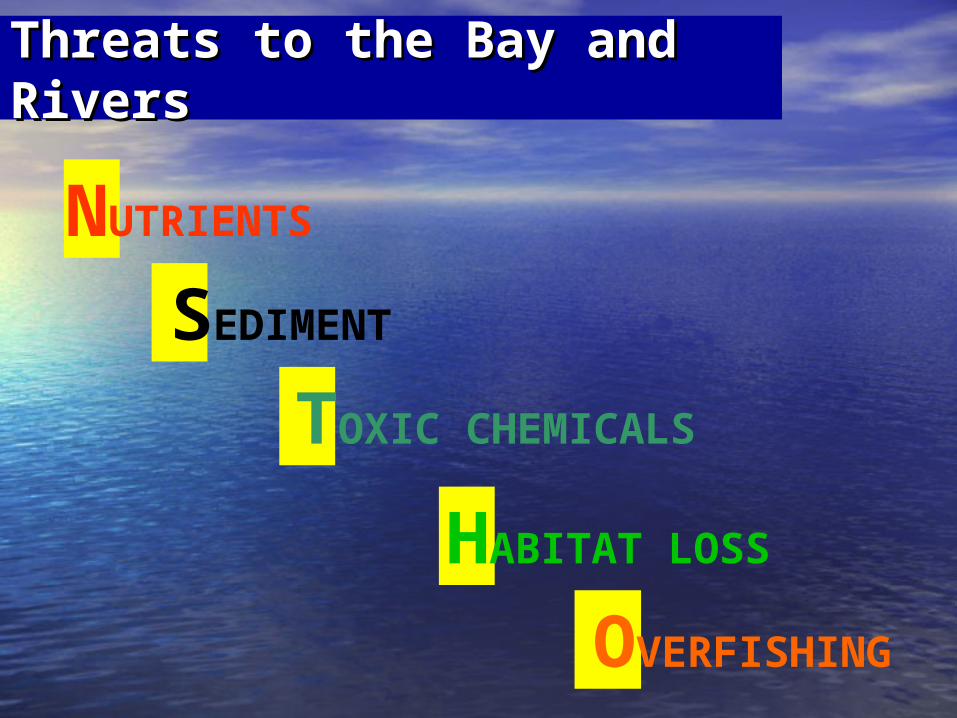
Threats to the Bay and Threats to the Bay and RiversRivers
NUTRIENTS
SEDIMENT
TOXIC CHEMICALS
HABITAT LOSS
OVERFISHING

Industry ReducesIndustry ReducesChemical Chemical ReleasesReleases
Industrial plants have achieved a voluntary goal of reducing releases and transfers of chemicals by 65% from 1988 to 2000.
Since the YR 2000 goal has been achieved, the Bay Program is working with industry to set new targets.
1988 1989 1990 1991 1992 1993 1994 1995 1996 1997 1998
Mill
ions
of l
bs/y
r
300
250
200
150
100
50
0
OriginalGoal
0
20
40
60
80
100
120
140
160
180
1984
1985
1986
1987
1988
1989
1990
1991
1992
1993
1994
1995
1996
1997
1998
1999
2000
2001
2002
2003
2004
2005
Bay
Gra
sses
(x
1,00
0 ac
res)
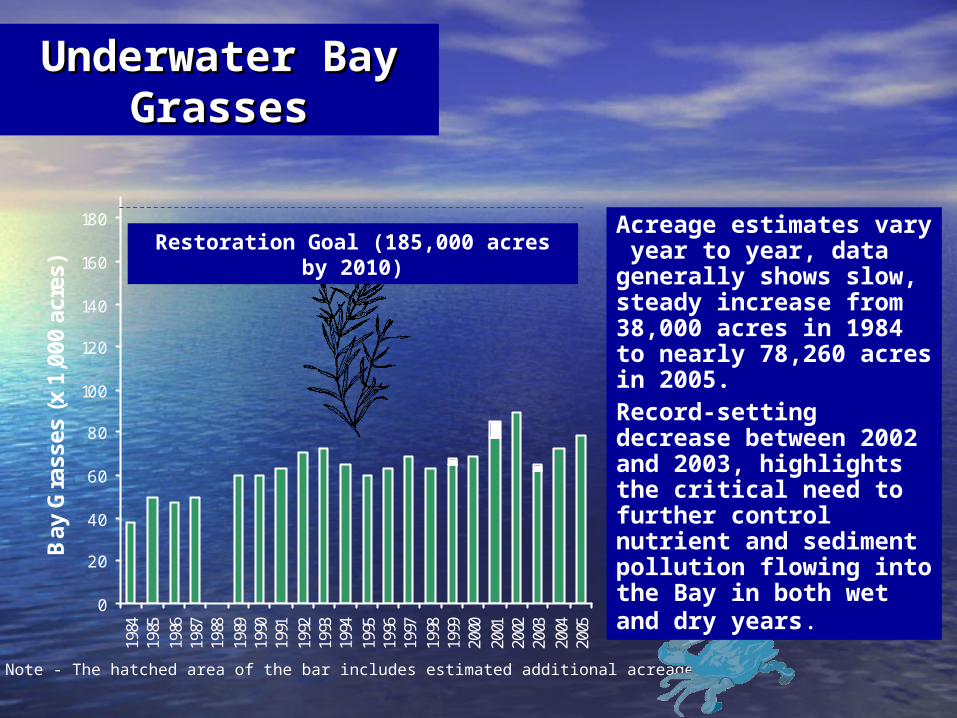
* Note - The hatched area of the bar includes estimated additional acreage.
Restoration Goal (185,000 acres by 2010)Acreage estimates vary year to year, data generally shows slow, steady increase from 38,000 acres in 1984 to nearly 78,260 acres in 2005.Record-setting decrease between 2002 and 2003, highlights the critical need to further control nutrient and sediment pollution flowing into the Bay in both wet and dry years.
Underwater BayUnderwater BayGrassesGrasses
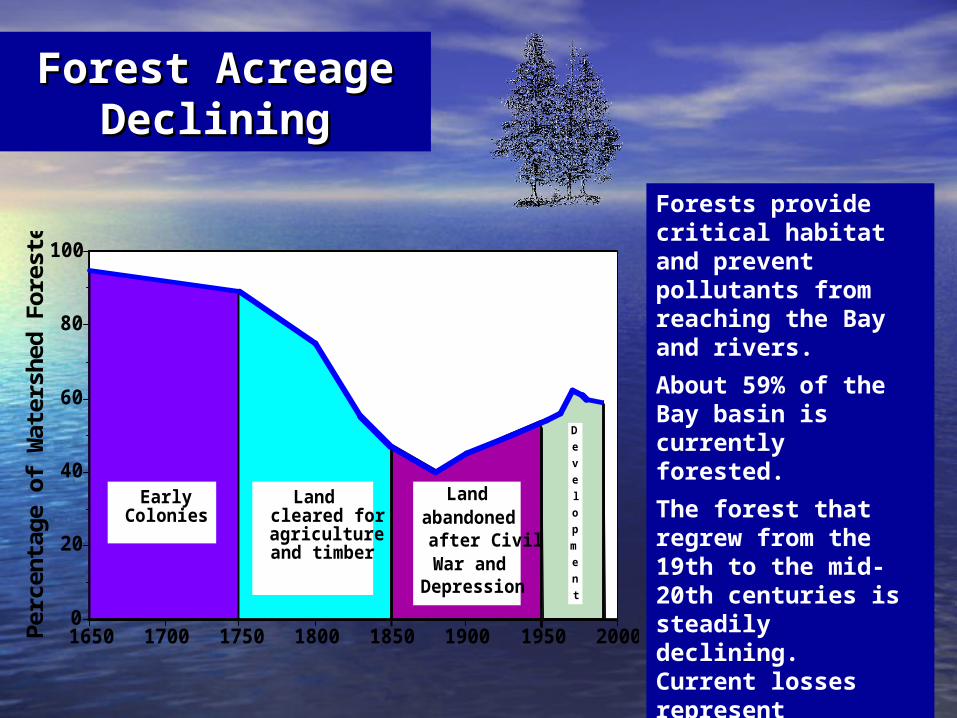
Forest Acreage Forest Acreage DecliningDeclining
Landcleared foragricultureand timber
EarlyColonies
Landabandonedafter CivilWar and
Depression
D
e
v
e
l
o
p
m
e
n
t
1650 1700 1750 1800 1850 1900 1950 20000
20
40
60
80
100
Per
cen
tag
e o
f W
ater
shed
Fo
rest
ed
Forests provide critical habitat and prevent pollutants from reaching the Bay and rivers.
About 59% of the Bay basin is currently forested.
The forest that regrew from the 19th to the mid-20th centuries is steadily declining. Current losses represent permanent conversions.
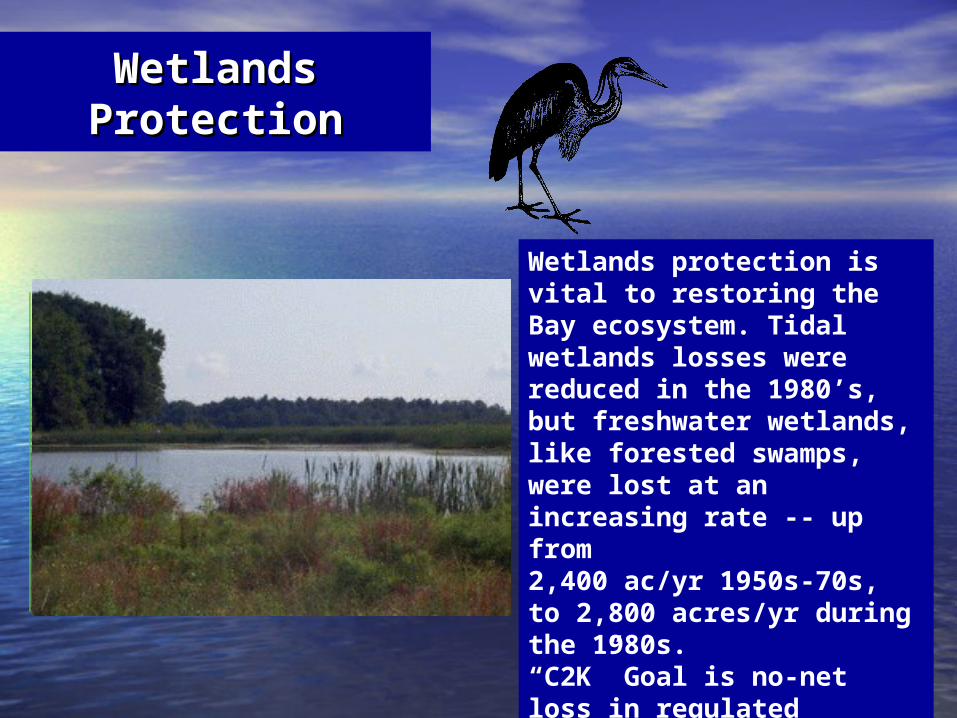
Wetlands protection is vital to restoring the Bay ecosystem. Tidal wetlands losses were reduced in the 1980’s, but freshwater wetlands, like forested swamps, were lost at an increasing rate -- up from2,400 ac/yr 1950s-70s, to 2,800 acres/yr during the 1980s.“C2K” Goal is no-net loss in regulated wetlands, and a net resource gain of 25,000 acres of tidal and non-tidal wetlands by 2010.
Wetlands Wetlands ProtectionProtection
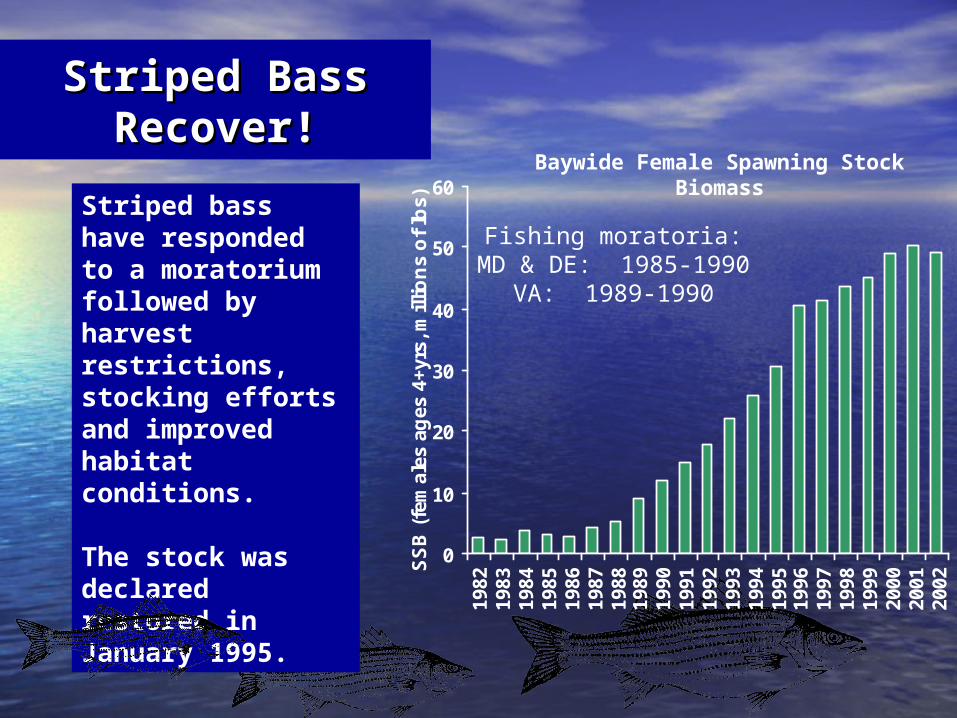
Striped bass have responded to a moratorium followed by harvest restrictions, stocking efforts and improved habitat conditions.
The stock was declared restored in January 1995.
Fishing moratoria:MD & DE: 1985-1990
VA: 1989-1990
Baywide Female Spawning Stock Biomass
0
10
20
30
40
50
60
1982
1983
1984
1985
1986
1987
1988
1989
1990
1991
1992
1993
1994
1995
1996
1997
1998
1999
2000
2001
2002
SS
B (
fem
ales
ag
es 4
+yrs
, mill
ion
s o
f lb
s)
Striped Bass Striped Bass Recover!Recover!
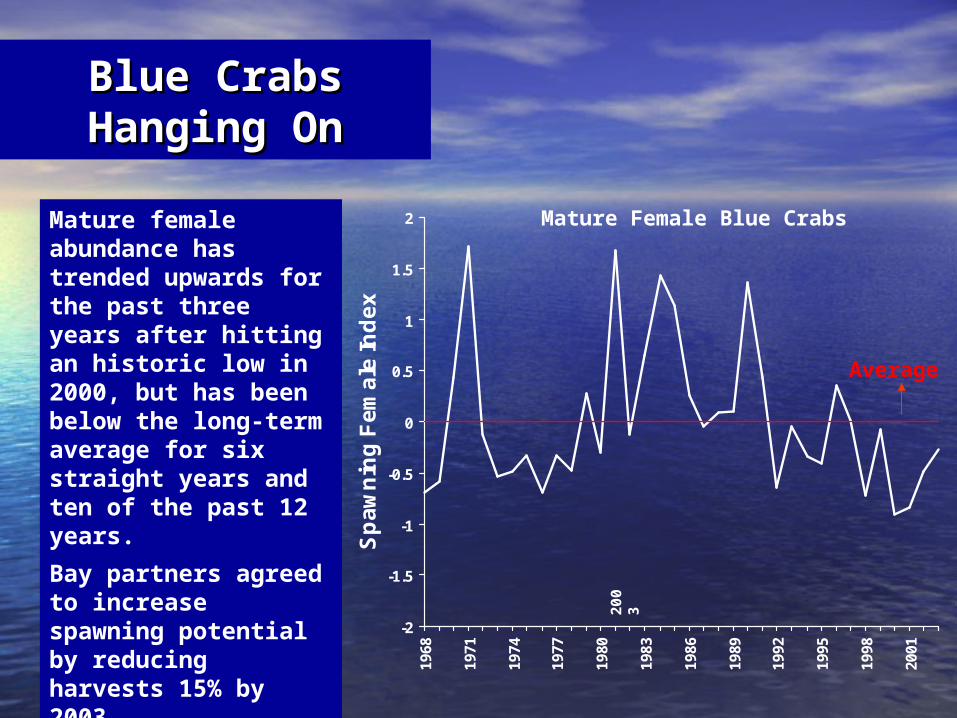
Mature Female Blue Crabs
-2
-1.5
-1
-0.5
0
0.5
1
1.5
2
1968
1971
1974
1977
1980
1983
1986
1989
1992
1995
1998
2001
Sp
aw
nin
g F
em
ale
Ind
ex
Average
2003
Mature female abundance has trended upwards for the past three years after hitting an historic low in 2000, but has been below the long-term average for six straight years and ten of the past 12 years.
Bay partners agreed to increase spawning potential by reducing harvests 15% by 2003.
Blue Crabs Blue Crabs Hanging OnHanging On

A “keystone” species: filter feeding an important part of Bay ecosystem.
Oyster harvests are only 2% of harvest highs recorded in the 1950s.Declines since the 1950s are due to overharvest, disease, pollution and loss of oyster reef habitat.
2002
0
5
10
15
20
25
30
35
40
53 58 63 68 73 78 83 88 93 98
Co
mm
erci
al L
and
ing
s (m
illi
on
lb
s)
VA
MD
Oyster Harvests Oyster Harvests and Population are and Population are
DownDown
Watershed Approach Watershed Approach to Nutrient Reductionto Nutrient Reduction
• Virginia’s Virginia’s Tributary StrategiesTributary Strategies define needed define needed point and nonpoint source control actionspoint and nonpoint source control actions
• Point source (wastewater treatment) controls Point source (wastewater treatment) controls recognized as highly reliable, cost effective, recognized as highly reliable, cost effective, measurable, enforceable, and critical to measurable, enforceable, and critical to achievement of water quality objectivesachievement of water quality objectives
• Remaining nutrient reduction must be Remaining nutrient reduction must be accomplished by nonpoint source runoff accomplished by nonpoint source runoff controlscontrols
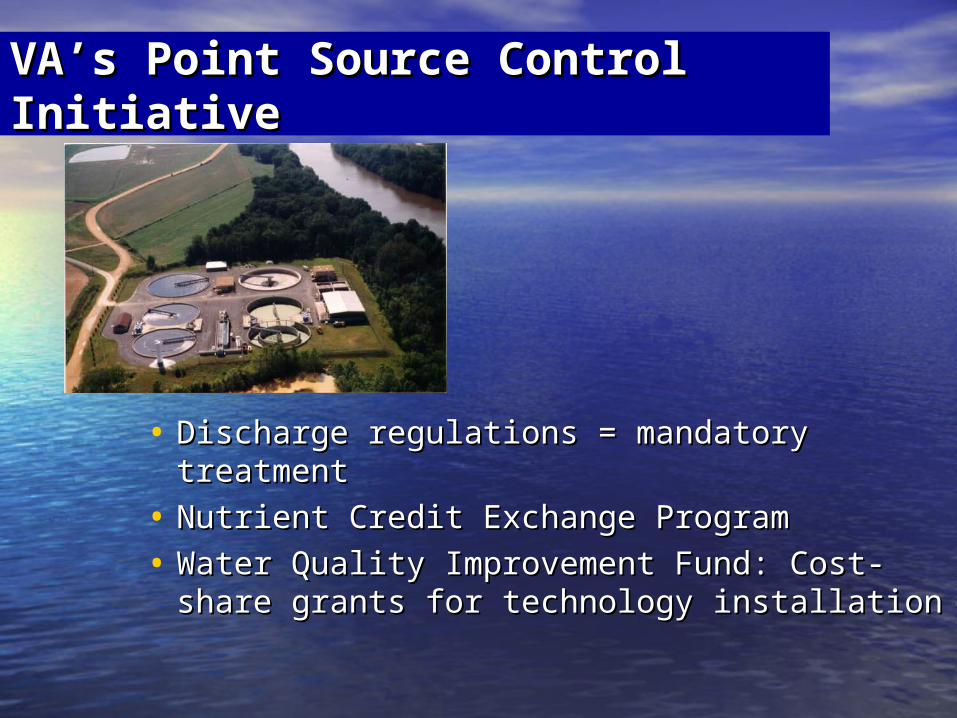
VA’s Point Source Control VA’s Point Source Control InitiativeInitiative
• Discharge regulations = mandatory Discharge regulations = mandatory treatmenttreatment
• Nutrient Credit Exchange ProgramNutrient Credit Exchange Program
• Water Quality Improvement Fund: Cost-Water Quality Improvement Fund: Cost-share grants for technology installationshare grants for technology installation
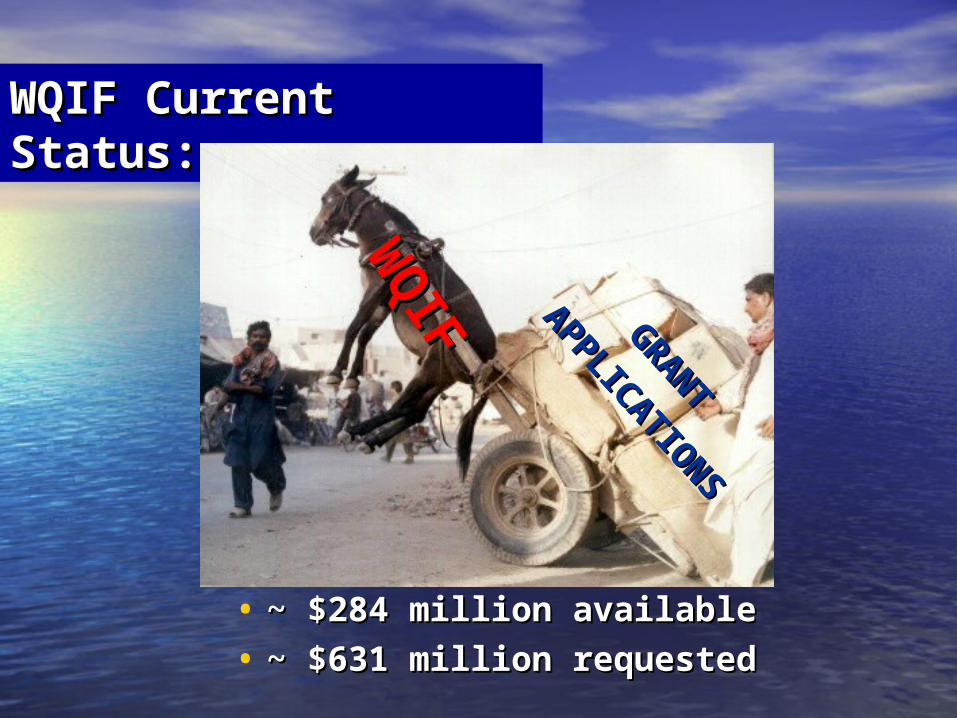
WQIF Current WQIF Current Status:Status:
• ~ $284 million available~ $284 million available
• ~ $631 million requested~ $631 million requested
WQ
IFW
QIF
G
RANT
GRANT
APPLICATIONS
APPLICATIONS

WQIF Funding WQIF Funding Prospects:Prospects:
• Grant funds available ~ $284 millionGrant funds available ~ $284 million
• Grant Funds needed through 2025: Grant Funds needed through 2025: ~$750 M - $1 B~$750 M - $1 B– Cost range: depends on compliance Cost range: depends on compliance
dates, project scheduling, technology, dates, project scheduling, technology, construction market, trading, etc.construction market, trading, etc.
– 60 – 70% of funds needed by ~201160 – 70% of funds needed by ~2011– $17 M appropriated in FY07-08 for $17 M appropriated in FY07-08 for
projects outside Ches Bay watershedprojects outside Ches Bay watershed
• General Assembly Policy: General Assembly Policy: “…provide annually “…provide annually its share of financial support…to fulfill the its share of financial support…to fulfill the Commonwealth’s responsibilities under Commonwealth’s responsibilities under Article XI of Constitution of VA”Article XI of Constitution of VA” ( (§10.1-2128.B)§10.1-2128.B)
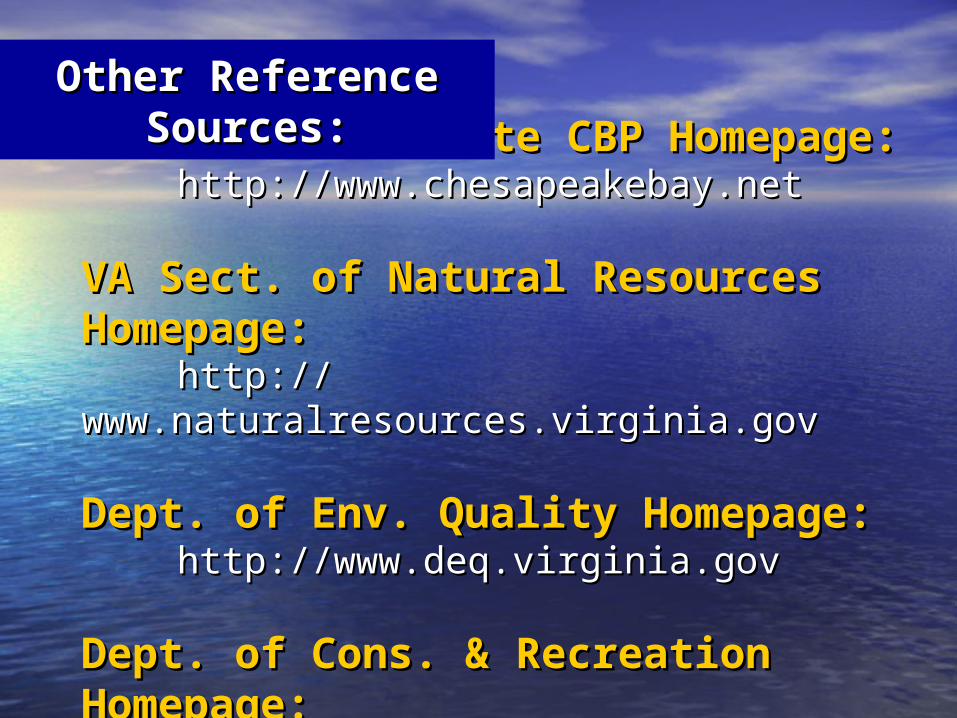
Federal-Interstate CBP Homepage:Federal-Interstate CBP Homepage:http://www.chesapeakebay.nethttp://www.chesapeakebay.net
VA Sect. of Natural Resources Homepage:VA Sect. of Natural Resources Homepage:http://www.naturalresources.virginia.govhttp://www.naturalresources.virginia.gov
Dept. of Env. Quality Homepage:Dept. of Env. Quality Homepage:http://www.deq.virginia.govhttp://www.deq.virginia.gov
Dept. of Cons. & Recreation Homepage:Dept. of Cons. & Recreation Homepage:http://www.dcr.virginia.govhttp://www.dcr.virginia.gov
Other Reference Other Reference Sources:Sources:
Questions?Questions?