Embed Size (px)
Citation preview
STUDIES ON THE EXPRESSION OF RESISTANCE TO STEM RUST
OF WHEAT CAUSED BY Puccinia graminis f.sp. tritici
CHERYL LYNNE LENNOX
Submitted in partial fulfilment of the
requirements for the Ph.D. degree
in the
Department of Microbiology and Plant Pathology,
University of Natal
Pietermaritzburg
1991
ABSTRACT
LENNOX C.L. (1991) Studies on the expression of resistance to stem rust
of wheat caused by Puccinia graminis f.sp. tritici.
Ph.D. thesis, University of Natal, South Africa. 148pp.
The endogenous cytokinin levels of healthy primary leaves and seeds of a stem-rust
susceptible wheat cultivar Little Club were compared with those of Little Club containing
the stem rust resistance gene Sr25. Use was made of paper, column and high
performance liquid chromatography techniques to separate the endogenous cytokinins
in the plant material, and the soybean callus bioassay was used to test for cytokinin-like
activity of the chromatography fractions. Leaf material of the resistant Little Club Sr25
had a higher level of total cytokinin activity than Little Club, whereas seed material of
Little Club Sr25 did not always have higher levels of cytokinins than Little Club. A
number of cultivars would have to be tested before the usefulness of cytokinin levels
as an indicator of resistance could be determined.
The development of urediospore-derived infection structures of Puccinia graminis
f.sp. tritici in wheat, barley, sorghum and maize was examined by scanning electron
microscopy (SEM). Infection on and in the four species followed a similar pattern up
to, and including, primary infection hyphae formation. In wheat, barley and maize,
when a primary infection hypha abutted onto a host epidermal cell, a septum was laid
i
down delimiting a primary haustorial mother cell (HMC); primary HMCs did not form
in sorghum. Secondary infection hyphae arose on the substomatal vesicle side of the
primary HMC septum; infection did not progress further in maize, but in wheat and
barley secondary infection hyphae branched, and proliferated intercellularly forming the
fungal thallus. Secondary HMCs were delimited when an intercellular hypha abutted
onto host cells. In all four species atypical infection structures were also observed.
In an attempt to determine the timing and expression of stem rust resistance gene Sr5,
infection structure development of Puccinia graminis f.sp. tritici race 2SA2 in a
resistant line (ISr5Ra) and a susceptible line (ISr8Ra) was compared quantitatively
using a fluorescence microscopy technique. The results indicated that there were no
significant differences in numbers of specific infection structures observed in the two
near-isogenic lines up to, and including, 48 hpi, by which time race 2SA2 had
successfully formed secondary H MCs in both lines.
ii
PREFACE
The experimental work described in Chapter 1 of this thesis was carried out in the
Department of Botany, University of Natal, Pietermaritzburg, under the supervision of
Professor J. Van Staden. Research for Chapters 2, 3 and 4 was conducted in the
Department of Microbiology and Plant Pathology, University of Natal, Pietermaritzburg,
under the supervision of Professor F.H.J. Rijkenberg.
Chapters 2 and 3 have been combined and published [Lennox C.L. & Rijkenberg
F.H.J. (1989) Scanning electron microscopy of infection structure formation of
Puccinia graminis f.sp. tritici in host and non-host cereal species. Plant
Pathology 38, 547-556].
iii
DECLARATION
I hereby declare that the studies presented in this thesis represent original work by the
author and have not been submitted in any form to another University. Where use was
made of the work of others, it has been duly acknowledged in the text.
C.L LENNOX
iv

ACKNOWLEDGEMENTS
I would like to thank the following people for their contributions to the work presented
in this thesis.
Professor F. H .J. Rijkenberg for his guidance, encouragement and constructive criticism
through the course of this study.
Professor J. Van Staden for his guidance in planning the experimental procedures
used in the extraction and separation of cytokinins, and in evaluating the results
presented in Chapter 1.
The Wheat-Board of South Africa for financial support in the form of a research grant.
The Foundation for Research Development for their generous financial assistance in
the form of a post-graduate bursary.
Dr. J. Le Roux, Small Grain Centre, Bethlehem, for supplying the rust races and wheat
cultivars used in this study, and his helpful advice during this study.
The staff and students of the Department of Microbiology and Plant Pathology,
University of Natal, for making the Department my "home from home".
Mr. Vijay Bandu, Mrs. Priscilla Donnelly, Mrs. Belinda White and Mr. Tony Bruton of the
E.M. Unit, University of Natal, for teaching me the ropes of electron microscopy and
electron micrograph preparation.
Mrs. Fran Scharf of the Botany Department, University of Natal, for her advice and
assistance in carrying out the experimental work presented in Chapter 1.
v

Teresa Coutinho for her help and encouragement, especially during the writing-up
phase of this thesis.
My parents, Gran and family for their endless support, patience and encouragement
throughout my years as a student.
vi
ABSTRACT
PREFACE
DECLARATION
ACKNOWLEDGEMENTS
CONTENTS
CONTENTS
CYTOKININS IN PLANT PATHOGENESIS
iii
iv
v
vii
1
CHAPTER 1 LEVELS OF CYTOKININS IN SUSCEPTIBLE AND
RESISTANT WHEAT-STEM RUST INTERACTIONS
INTRODUCTION
MATERIALS AND METHODS
RESULTS
DISCUSSION
LITERATURE CITED
32
33
38
55
74
CHAPTER 2 SCANNING ELECTRON MICROSCOPY STUDY OF
INFECTION STRUCTURE FORMATION BY Puccinia
graminis f.sp. tritici ON AND IN THE UNIVERSAL
SUSCEPTIBLE WHEAT CULTIVAR McNAIR
INTRODUCTION
MATERIALS AND METHODS
OBSERVATIONS
DISCUSSION
LITERATURE CITED
vii
78
79
80
87
90
CHAPTER 3 SCANNING ELECTRON MICROSCOPY STUDY OF
INFECTION STRUCTURE FORMATION BY Puccinia
graminis f.sp. tritici ON AND IN THREE CEREAL
SPECIES
INTRODUCTION
MATERIALS AND METHODS
OBSERVATIONS
DISCUSSION
LITERATURE CITED
CHAPTER 4 EXPRESSION OF STEM RUST RESISTANCE
GENE Sr5
INTRODUCTION
MATERIALS AND METHODS
RESULTS
DISCUSSION
LITERATURE CITED
APPENDIX 1.1 to 1.4
APPENDIX 2.1
APPENDIX 3.1
APPENDIX 4.1 to 4.2
viii
93
94
94
102
105
108
109
110
114
124
131
144
145
146
CYTOKININS IN PLANT PATHOGENESIS
Growth and metabolism of plants are dynamic yet finely controlled processes, and
years of research have revealed that plant hormones such as the auxins, cytokinins,
gibberellins, ethylene and abscisic acid play vital roles in the regulation of plant
growth a(ld metabolism. Symptoms such as gall formation, stunting, tumour
formation and epinasty, immediately indicate that the normal growth of the plant has
been disturbed, and growth hormones have been implicated in a number of plant
pathogen interactions. Not so obvious is the involvement of growth regulators in
diseases in which the symptoms do not involve gross morphological changes of the
host. The green island phenomenon, in which the areas around infection sites
remain green following leaf chlorosis is an example. Daly & Knoche (1976),
Dekhuijzen (1976), Fraser & Whenham (1982), Pegg (1976a, b), Schroder (1987),
Sequeira (1963, 1973), Surico (1986) and Tandon (1987) have reviewed the
literature on the involvment of growth regulators in fungal, bacterial and viral
diseases.
In the present investigation the relationship between endogenous cytokinins and
resistance expression was examined. It was therefore deemed necessary to review
the literature on the cytokinins and their potential role in microbial plant
pathogenesis.
The· discovery of cytokinins was a direct consequence of tissue culture. studies by
Skoog & Tsui (1948) and Jablonski & Skoog (1954). These workers found that
coconut milk, extracts of vascular tissue, or malt extract, induced cell division in pith
explants of Nicotiana tabacum L. during culture. Later, a purine-like compound
capable of stimulating cell division was isolated. It proved to be an artifact resulting
from the breakdown, during autoclaving, of herring sperm deoxyribonucleic acid
(DNA). The highly active compound was identified as 6-furfuryl-aminopurine and
termed kinetin (Miller et al., 1956). Although kinetin does not occur in plant tissues
1
(Skoog & Armstrong, 1970), compounds exhibiting similar activity have been
detected in plants. The first naturally occurring compound capable of inducing cell
division was isolated from the endosperm of immature Zea mays L. caryopses and
identified as 6-( 4-hydroxy-3-methyl-trans-z-butenyl-amino) purine, or commonly
termed zeatin (Letham, 1963; Miller, 1965). Since the isolation of zeatin, many
other naturally occurring cytokinins have been extracted from diverse higher plant
genera, bacteria, fungi and algae, as well as some insects (Letham, 1978), and
Kende (1971) stated that as such, the cytokinins can thus be regarded as being
ubiquitous.
Skoog & Armstrong (1970) defined the structural requirements for high-order
cytokinin activity as being an intact adenine moiety with an N6 - substituent of
moderate molecular length.
A gradual documentation of largely circumstantial evidence has indicated that the
roots are the prime site of synthesis, and today it is generally accepted that this is
the case (Letham, 1978; Van Staden & Davey, 1979). Biosynthesis of free
cytokinins in plant cells appears to represent a minute secondary pathway of the
ubiquitous compound adenine, and the experimental difficulties created by this
situation have greatly hindered progress towards elucidation of the pathway (McGaw
et a/., 1984). There exist two schools of thought as to the biosynthesis of free
cytokinins, namely that they are produced by the breakdown of tRNA (Klemen &
Klambt, 1974; Maas & Klambt, 1981 a, b), or they are synthesized de novo
(Burrows, 1978 a, b; Chen, 1981; Nishinari & Syono, 1980 a, b; Stuchbury et
a/., 1979). Dickinson (1985) has stated that whereas there is no direct evidence
for cytokinin production by the breakdown of cytokinin-containing RNA, there are
definite indications suggesting the existence of pathways for the production of free
cytokinins independent of tRNA turnover.
Cytokinins have been detected in both xylem sap (Gordon et aI., 1974; Hewett &
Wareing, 1974; Horgan et a/., 1973; Letham, 1974; Purse et a/., 1976) and in
phloem sap (Hall & Baker, 1972; Hoad, 1973; Phillips & Cleland, 1972; Van
2
Staden, 1976; Vonk, 1974;), and Van Staden & Davey (1979) stated that this
indicates that these hormones are probably transported through both living and non
living translocatory tissue. Zeatin and ribosylzeatin are the major translocational
forms of cytokinins in both xylem and phloem sap (Gordon et a/., 1974; Hewett
& Wareing, 1974; Letham, 1974; Phillips & Cleland, 1972).
With regard to the fate of cytokinins, at least three possible metabolic routes should
be considered (Van Staden & Davey, 1979): (1) that cytokinins are metabolised
during utilization by being attached or incorporated into other molecules; (2) that
they are broken down by catabolic processes and thus destroyed; and (3) that
they are converted to "inactiveli storage forms which, under certain conditions, may
be reversibly sequestrated to liactiveli forms. While N 6(~2-iso-pentenyladenine,
zeatin, dihydrozeatin, benzyladenine and their 9-ribosyl (and in the case of zeatin
and dihydrozeatin their O-glucosyl) derivatives, are generally very active, cytokinin
activity is markedly reduced in the 7- and 9-glucosyl and 9-alanyl conjugates
(McGaw, 1987). Cytokinin glucosides may be storage and bound forms (Parker &
Letham, 1973; Van Staden, 1976) and work with endogenous cytokinins (Henson
& Wareing, 1976) and labelled zeatin (Davey & Van Staden, 1981) has established
that zeatin-like derivatives are transported to the leaves via the transpiration stream
where they are metabolised rapidly to glucosylated forms. Thus glucosylation could
occur whenever cytokinins are no longer required for active growth, providing the
plant with a potential reservior of free cytokinins (Van Staden & Davey, 1979).
Horgan (1987) reviewed current knowledge of the possible genetic control of
cytokinin levels in plants via endogenous cytokinin and auxin biosynthetic and
metabolic genes.
It is generally accepted that cytokinins are involved in cell division (Fosket et a/.,
1977; Miller, 1961), they retard senescence by maintaining chlorophyll content,
photosynthesis and chloroplast structure (Dennis et al., 1967), and by maintaining
protein and nucleic acid synthesis (Osborne, 1962; Richmond & Lang, 1957) and
that they bring about nutrient mobilization within plant tissues (Mothes et a/., 1959;
Mothes & Engelbrecht, 1961; Mothes et a/., 1961). Patrick (1987) stated that the
3
potential role of endogenous hormones as regulants of assimilate transport awaits
clarification.
The level or site at which cytokinins are active within the cell is not known. The
mode of action of cytokinins is poorly understood and insufficient evidence exists
to identify any biochemical point of action conclusively (Horgan, 1984). However,
they appear to exert their effect on plant metabolism as mediators, promotors or
inhibitors of growth at a level close to, although not necessarily at, the genome
(Burrows, 1975).
A number of plant pathogens which induce gross morphological changes in their
hosts have been shown to produce cytokinins in culture, and the infected host
tissue often has elevated levels of cytokinins when compared to the levels in healthy
tissue. It is for these reasons that the cytokinins have been implicated in the
development of abnormal growth after infection.
Barthe & Bulard (1974) working with Taphrina cerasi (Fuckel) Sadebeck, the
organism that causes witches'-broom on cherries (Prunus cerasus L.), identified
zeatin in the culture media of the fungus, and Kern & Naef-Roth (1975) working with
a number of Taphrina species, identified zeatin and iso-pentenyladenosine in the
culture filtrates of all the species examined. Sziraki et al. (1975) found that the
neoplastic tissue of peach leaves (Persica vulgaris Mill.) induced by Taphrina
deformans (Berk.) Tul. had increased cytokinin and auxin levels and a new
cytokinin, not present in healthy tissue, was detected. This seemed to indicate the
active production of cytokinins by the fungus and not just an alteration in the normal
metabolism of cytokinins.
A number of cytokinins were identified in the culture media of Pseudomonas
syringae pv. savastanoi (Smith) Young, Dye & Wilkie, the causal organism of
olive knot disease (Surico et al., 1975). The investigation of Surico et al. (1985)
showed that both indoleacetic acid and cytokinins are needed to form the knots,
and the size and anatomy of the knots are controlled by the balance of the two
4
growth regulators. When assayed during mid-log growth phase, cultures of wild-type
P. syringae savastanoi produced 1 000 times more cytokinin than comparable
cultures of Agrobacterium tumefasciens (Smith & Townsend) Conn.
(MacDonald ef ai., 1986). Cytokinin biosynthesis in strains of P. syringae
savastanoi is, in part, specified by plasmid-borne genes (MacDonald et aI., 1986;
Roberto & Kosuge, 1987).
Corynebacterium fascians (Tilford) Dowson, Which causes fasciation or leafy
gall on many annual or perennial herbaceous ornamentals, has been found to
produce cytokinins in culture (Helgeson & Leonard, 1966; Thimann & Sachs,
1966). This organism has been shown to stimulate lateral bud growth in host
plants, an effect also attributed to cytokinin action (Whitney, 1976). Rathbone &
Hall (1972) found that at pH 7, C. fascians releases small amounts of iso
pentenyladenosine, whereas under acid conditions, as used by many other
researchers, highly elevated levels of iso-pentenyladenosine were recorded. The
release of iso-pentenyladenosine from tRNA of the bacterial cells under acid
conditions is thought to be responsible for these elevated levels. Thimann & Sachs
(1966) suggested that the bacterium stimulates the host tissue production of
cytokinin by modifying the host metabolism, or by supplying a precursor from which
the cytokinin is readily formed.
Club root diseases of cruciferous plants is found wherever plants of the mustard
family grow. This disease is caused by a member of the Plasmodiophorales,
Plasmodiophora brassicae Woron., and symptoms consist of small or large
spindlelike, spherical, knobbly, or club-shaped swellings on the roots and rootlets.
Serious losses are incurred when susceptible varieties of any cruciferous species
are grown in infested fields (Agrios, 1988). Explants of tumour tissue have been
found to produce caltus on tissue culture media which do not have added growth
substances, such as auxins or cytokinins. However, the presence of active
vegetative plasmodia in the cells is essential for growth of the callus (Dekhuijzen &
Overeem, 1971; Ingram, 1969). Clubroot tissue has been found to be three times
more active in a cytokinin bioassay than healthy root material and partially purified
5
extracts from healthy and _clubbed roots co-chromatographed on paper and on thin
layer silica gel with zeatin and zeatin riboside (Dekhuijzen & Overeem, 1971).
Dekhuijzen (1981) showed that the contents of bound and free cytokinins are
different in host cell cytoplasm and plasmodia of the pathogen, and proposed that
the plasmodia release cytokinins into the host cells. Evidence for direct
biosynthesis of trans-zeatin from adenine by young plasmodia was found by Muller
& Hilgenberg (1986).
Crown gall of woody and herbaceous plants is worldwide in distribution and is
characterised by the formation of tumours or galls at the crown of the plant.
Wyndaele et al. (1985) found that tissue from the green tumour line of soybean
crown gall had two to three times higher cytokinin levels when compared to tissue
from the pale line. The causal organism of this disease, Agrobacterium
tumefasciens, has been shown to contain a class of large plasmids, the Ti
plasmids (Zaenen et al., 1974). Upon infection, a portion (the T-DNA) is
transferred to the host plant cells and is replicated there (Chilton et a/., 1977).
Once present in transformed tissues, the T-DNA is transcribed to RNA (Drummond
et a/., 1977) which is presumably then translated. It has been suggested that the
T-DNA codes directly for cytokinin biosynthesis and may effect the endogenous
cytokinin levels (Garfinkel et al., 1981). Cytokinins have been found to accumulate
in the culture media of tumour tissue (Palni, 1984), and a complex of several
cytokinins has been found to be responsible for tumourigenesis in the crown gall
of tomato (Nandi et a/., 1989).
Many micro-organisms have been shown to produce cytokinin-like substances in
culture (Mahadevan, 1984), and production has been found to increase during the
formation of fungal fructification organs (Vizarova, 1975a). Greene (1980) reviewed
the literature on cytokinins produced by micro-organisms and stated that it is
possible that microbes originally obtained the genetic information necessary for
zeatin synthesis from plants. The iso-pentenyl -group of cytokinins is the most
common of these growth regulators detected in fungi (Johnstone & Trione, 1974).
6
Both pathogenic and non-pathogenic isolates of Cylindriocarpon destructans
(Zinssm.) Scholten have been shown to produce cytokinin-like substances in culture
(Strzelczyk & Kampert, 1983), but no correlation could be found between
pathogenicity of fungal isolates of Cylindrocarpon destructans (Kriesel, 1987)
or Fusarium culmorum (W.G.Sm.) Sacco (Michniewicz et aI., 1984) and their
ability to produce cytokinin-like substances. Surico (1986) and Surico et al. (1985)
on the other hand, found that the bacterial strains of Pseudomonas syringae
which were capable of producing high amounts of indoleacetic acid and cytokinins
were more virulent pathogens. Virulence assays indicated that both indoleacetic
acid and cytokinins function as virulence factors in this plant-pathogen interaction
(Roberto & Kosuge, 1987).
Green island is the term used in reference to a ring or spot of living green tissue
which is centred around an infection site and which is surrounded by yellowing
(chlorotic) tissue. Both biotrophic and facultative microbial plant pathogens have
been shown to produce green islands in nature (Bushnell, 1967), as have insect
infections (Engelbrecht, 1971). Stakman (1914), as cited by Bushnell (1967),
applied the term "green islands" to the spot of green that occurred with certain
incompatible host-parasite combinations with stem rust (Puccinia graminis f.sp.
tritici Eriks. & E. Henn.) of wheat (Triticum aestivum L.). This type of green
island in part characterises infection type 2 with stem rust of wheat (Stakman et al . ,
1962). Compatible combinations of host and parasite can produce green islands,
but the islands are not usually seen unless the senescence of infected leaves is
accelerated by a lack of adequate light, by darkness, or by detachment of leaves
from plants. A leaf that is ageing slowly and normally in a well-lighted environment
is less apt to show green islands than one that is yellowing rapidly in a suboptimal
environment (Bushnell, 1967). On the other hand, Sziraki et al. (1976) noted that
they regularly observed the appearance of green islands in both susceptible and
resistance wheat-stem rust combinations.
The culture filtrates of a number of facultative plant-pathogenic fungi evoke the
formation of green islands in detached host leaves (Suri & Mandahar, 1984, 1985;
7
Vizarova., 1975a; Yadav & Mandahar, 1981) and a mimicking of the green island
effect has also been observed when water-soluble components obtained from the
conidia of powdery mildew (Erysiphe graminis DC) (a biotroph) were applied to
detached leaves of barley (Hordeum vulgare L.) (Bushnell & Allen, 1962;
Vizarova, 1974a). Similarly, Angra & Mandahar (1985) found that green islands
were produced in excised maize leaves (Zea mays L.) underneath spore
suspension drops of Drechs/era carbonum Ullstrup and Bipolaris maydis
Nisikado after incubation in the dark.
Green islands were first described by Cornu in 1881 (Bushnell, 1967), and in spite
of the many studies since, much controversy surrounds the formation of such
islands (Scholes & Farrar, 1987). Cytokinins have been implicated in the formation
of green islands as the exogenous application of these compounds to detached
leaves has been shown to mimic green island formation induced by plant pathogens
(Angra & Mandahar, 1985). These compounds have also been shown to delay
senescence or effect a juvenile condition in plant tissues by delaying chlorophyll
breakdown, enhancing protein synthesis and mobilizing metabolites, all of which
have been shown to be characteristics of green-island tissue. However, exogenous
application of cytokinin to intact plants does not result in green island formation
(Atkin & Neilands, 1972) as the cytokinins are rapidly metabolized by the plant
tissue (Fox, 1966).
Yadav (1981) found that green islands were produced on detached barley and
wheat leaves by spore-containing infection drops of Bipolaris sorokiniana
(Sacc.) Shoem. soon after host penetration had occurred. These green islands had
higher cytokinin-like activity and a greater accumulation of sugars and starch than
uninfected tissue (Yadav & Mandahar, 1981). The conclusion these researchers
came to was that, as gramineaceous leaves do not produce cytokinins, the
cytokinins were produced by the germinating conidia and by the fungal mycelium
in the initial stages of pathogenesis, and that this creates translocatory sinks
ensuring a regular supply of nutrients to the pathogen. Dekhuijzen & Staples (1968)
found that none of the mobilization-promoting fractions in urediospores and isolated
8
bean rust, Uromyces phaseoli (Pers.) Wint., mycelium had ~ values similar to
those in extracts from infected leaves of bean plants which had been placed under
low light intensities to encourage green-island formation. They implied that factors
leading to green island formation are strictly of host origin.
Another point of controversy in green island formation is whether there is a
continuous maintenance of, or increase in, chlorophyll throughout disease
development as proposed by Bushnell (1967), Scholes & Farrar (1987) and Sziraki
et al., (1984), or whether there is an initial breakdown of chlorophyll followed later
by "re-greening" (Allen, 1924, 1926; Allen, 1942; Mares & Cousen, 1977; So &
Thrower, 1976).
Aggab & Cooke (1981) reported observing that tissues surrounding sites of
sclerotium formation of Scleroti nia curreyana (Berk.) Karst. in Juncus effusus
L. culms remained green, while general chlorosis occurred in the culm tissue. They
found that the highest chlorophyll levels occurred in the sclerotium-surrounding
tissue, and stated that maintenance of the host's photosynthetic potential at sites
of sclerotium differentiation ensures a supply of carbohydrate to the parasite during
this critical stage of its development. Green-island tissue resulting from Albugo
candida (Pers.) infection of Brassica juncea L. cotyledons was seen to have
a five times higher 14C02 fixation than non-infected tissue (Harding et al., 1968)
and chloroplast breakdown was delayed in the infected green-island tissue. Camp
& Whittingham (1975), working with powdery mildew infected barley leaves, found
that although the chloroplasts of green-island tissue were enlarged and fewer in
number than healthy tissue, they retained their green colour because of sufficient
pigment synthesis and adequate chloroplast lamella number.
Whenham (1989) found that green islands, induced in tobacco (Nicotiana
tabacum L.) leaves by systemic tobacco mosaic virus infection, contained a
reduced concentration of free cytokinins and exhibited an increased rate of cytokinin
catabolism. This author suggested that increased free cytokinin concentration is not
involved in biogenesis of green islands.
9
Possibly the specific peculiarities of each of the plant-pathogen interactions have
added to the confusion over the formation of green islands, and as such each
interaction should be considered on its own.
From the observations that many facultative plant pathogens have been shown to
produce cytokinin-like substances in culture, it is feasible to assume that these
substances may contribute to the cytokinin pool of infected plants.
The fact that the infection of plants by fungal pathogens might alter the quality of
cytokinins is presented and discussed in the paper by Mills & Van Staden (1978).
Wheat plants infected by Fusarium culmorum were found to have more auxin
like, gibberellin-like and cytokinin-like substances than healthy plants, and a quality
change in cytokinin was detected after infection (Michniewicz et al., 1986a).
Bist & Ram (1986), investigated the malformation of mango inflorescences
(Mangifera indica L.) and found that cytokinin changes in healthy and malformed
tissues followed a similar pattern, although cytokinin concentrations were always
higher in the malformed inflorescences. Some qualitative differences were detected
between chromatographs of cytokinins from malformed and healthy inflorescences,
and they concluded that these changes were probably due to the association of
fungi reported to be present in malformed panicles. Most workers consider
Fusarium moniliforme var. subglutinans Wr. & Reink. to be the responsible
organism for malformation, although data provided are not absolutely conclusive
(Nicholson, 1986). Higher levels of endogenous cytokinins in material from
malformed mango inflorescences than that from healthy inflorescences were also
reported by Nicholson & Van Staden (1988), as were qualitative differences in the
cytokinin complement extracted from healthy and malformed inflorescence material.
The presence of iso-pentenyladenine in malformed flowers (Nicholson & Van
Staden, 1988) and in cultures of Fusarium moniliforme var. subglutinans (Van
Staden & Nicholson, 1989), but not in healthy inflorescences, implies that the fungus
is creating a hormonal imbalance in malformed inflorescences. Studies of
Fusarium moniliforme var. subglutinans in culture have shown that this
10
fungus can synthesize cytokinins, notably iso-pentenyl adenine and trans-zeatin
(Van Staden & Nicholson, 1989). Van Staden et al. (1989) stated that the extent
to which the fungus can interconvert the synthesized compounds is relevant to the
possible involvement of cytokinins in flower malformation. From the results of
experiments using eH]iso-pentenyladenineand [8·14C]trans-zeatinfed Fusarium
moniliforme var. subgluti nans cultures, these authors concluded that the major
contribution of the fungus to cytokinin production in the mango flower may be that
it rapidly produces iso-pentenyl derivatives and/or converts trans-zeatin to such
derivatives, thus reducing the production of dihydrozeatin compounds necessary for
normal growth, flower development and fruit production.
Both work on rust diseases (Dekhuijzen & Staples, 1968; Kiraly et al., 1967;
Sziraki et al., 1976; Vizarova et al., 1986) and powdery mildew diseases (Kern
et aI., 1987; Mandahar & Garg, 1976; Vizarova, 1974a, b, 1975b, 1979, 1987)
have shown an increase in cytokinin activity with infection.
There has been much debate as to the source of the cytokinin increase in infected
plants. Yadav & Mandahar (1981) were of the opinion that these increased levels
reflect secretion of cytokinins by the pathogen. Such cytokinins would create
localized translocatory sinks towards which nutrients would move from the
surrounding areas. Dekhuijzen (1976) however, concluded that infection stimulates
the production of cytokinins by the host plant. Dekhuijzen & Staples (1968) found
that although the urediospores and mycelium of bean rust have cytokinin-like
compounds, these are not the same as those found in infected tissue. Thus they
conclude that the cytokinin increase observed is strictly of host origin. Qualitative
changes in cytokinins observed in barley and wheat cultivars after infection by
powdery mildew (Vizarova, 1974b, 1979, 1987; Vizarova et al., 1986) and stem
rust (Vizarova, et aI., 1986; Vizarova, et al., 1988) indicate that the products of
the pathogen do have an influence on the cytokinin metabolism of the plant. At this
stage, the extent to which the pathogen contributes to the cytokinin pool of the
infected plant, or the level at which products Of the pathogen interfere with the
metabolism of cytokinins in the infected plant is unclear.
11
The manipulation of the host's metabolism by the pathogen is a key factor in the
establishment of the complex interaction between obligate parasites such as the rust
and mildew fungi (Barnes et a/., 1988). Many of the changes in metabolism of
host plants detected after infection could be, at least in part, attributed to increased
cytokinin activity in the infected tissue.
The mobilization of metabolites and the accumulation of substances in the infected
tissue has been shown by a number of authors (Allen, 1942; Dekhuijzen & Staples,
1968; Hwang et aI., 1986; Kiraly et a/., 1967; Livne & Daly, 1966; Poszar &
Kiraly, 1966; Shaw, 1961). This abnormal transport of nutrients to the locus of
infection has been shown to be at the expense of young actively growing tissue,
which as a result is ultimately smaller is size (Livne & Daly, 1966; Poszar & Kiraly,
1966). Ahmed et a/. (1982) found potassium and phosphorus to accumulate in
barley leaves infected with brown rust. This, they state, can be explained entirely
by relatively unaltered xylem import into diseased leaves and reduced export of the
phloem-mobile ions, and that there is no confirmation of production of cytokinin-like
substances by the fungus which directs transport to infection areas.
Delayed senescence of infected tissue has been found to be due to delayed
chloroplast break-down and chlorophyll retention (Mukherjee & Shaw, 1962; Singh
et a/., 1982; Sziraki et a/., 1984). The higher levels of all photosynthetic
pigments during later stages of pathogenesis can be explained by increased
synthesis in the diseased leaves (Singh et a/., 1982). Elevated levels of nucleic
acid have also been detected in infected tissues (Barnes ef a/., 1988; Chakravorty
e tal., 1974; Heitefuss, 1966; Manners & Scott, 1984) and these could contribute
to delayed senescence. Such a delay in the onset of senescence could be a great
ecological advantage to an obligately parasitic fungus in allowing its continued
growth and sporulation (Harding et a/., 1968).
Detached wheat leaves, when floated on water, retain their green colour for a few
days only and are usually chlorotic within a week. However, leaves floated on 30 _
100 p.p.m. benzimidazole retain their green colour and their capacity to support
12
growth of leaf and stem rust for periods of up to a month (Person et a/., 1957) .
With detachment, normally incompatible reactions of attached leaves are altered to
greater susceptibility (Forsyth & Samborski, 1958; Mayama et al., 1975). This
breakdown of resistance can be prevented by floating leaves in solution of
benzimidazole or kinetin (Cole & Fernandes, 1970; Dekker, 1963; Edwards, 1983;
Person et al., 1957; Samborski et aL, 1958; Shaw, 1963; Wang et al., 1961).
Contrary to these findings, Mayama et al. (1975) found that floating the leaf pieces
on kinetin did not prevent the increase in susceptibility. Cole & Fernandes (1970)
and Edwards (1983) reported an actual increase in resistance by treatment with
cytokinin. Liu & Bushnell (1986) were of the opinion that in these cases, kinetin
may have directly inhibited fungus development instead of enhancing host
resistance, especially in view of the inhibitory effects of kinetin on development of
the powdery mildew fungus in their own study, and in that of Edwards (1983).
Enhancement of the hypersensitive reaction (H R) by kinetin has been shown for
stem rust of wheat (Mayama et al. , 1975), in which the HR sites were more
numerous and larger than in attached leaves, and powdery mildew of barley (Liu &
Bushnell, 1986), where there was a doubling in the number of cells that died at
each infection site, suggesting that kinetin had increased the spread of killing factors
beyond the cells that contained primary haustoria. Zeatin had no effect on the HR
of barley to powdery mildew (Liu & Bushnell, 1986).
The development of a number of powdery mildew fungi was checked completely by
floating inoculated host leaf disks on aqueous solutions of kinetin, but this
compound was inactive against Botrytis fabae Sardina and Uromyces
appendiculatus (Pers.) Unger (Dekker, 1963). Attempts to control powdery
mildew (Erysiphe cichoracearum DC. ex Merat of intact cucumber (Cucumis
sativus L.) plants, by application of kinetin solutions to bare roots and as foliar
sprays, failed, and insufficient transport of the chemical in plant tissue could be a
factor contributing to this failure (Dekker, 1963). Hopkins (1985) found that foliar
applications of kinetin to grape cultivars (Vitis vinifera L.) susceptible to Pierce's
disease (caused by a xylem-limited bacterium) did not prevent symptoms in
13
inoculated plants, whereas in a moderately resistant cultivar, kinetin prevented the
development of symptoms and prevented the accumulation of the bacterium in the
leaves, hence the cultivar became more resistant.
The effect of kinetin on the in vitro development of Cy/indrocarpon
destructans (Kriesel, 1987), and Fusarium cu/morum (Michniewicz et a/.,
1984) has been documented. At low concentrations (10-9 - 10-6 M), kinetin has no
effect, or a slight stimulatory effect on spore germination (Kriesel, 1987;
Michniewicz e t aI., 1984), whereas at higher concentrations (1 O-SM) germination
is inhibited. Hyphal growth in culture was not affected at 10-9 - 10-6 M (Kriesel,
1987), is inhibited at 10-6 - 10-sM kinetin (Kriesel , 1987; Michniewicz et a/., 1984)
and stimulated at 108 - 106 M (Michniewicz et a/. , 1984). Most sensitive to kinetin
were fungi in the earlier phases of growth (Michniewicz et a/., 1984). Fungal
sporulation was slightly stimulated by low concentrations (10-9 - 10-8M) of kinetin,
and was inhibited at higher concentration (106 - 10-SM) (Michniewicz et a/., 1984).
No correlation was found between the pathogenicity of the isolates and their
susceptibility to kinetin (Michniewicz et a/., 1984). Michniewicz et a/_ (1986b)
found that the highest production level of cytokinin-like substances was present in
five-day-old Fusarium cu/morum cultures, that is, at a stage in which Michniewicz
et aI., (1984) found the sensitivity of th is fungus, to exogenous kinetin, to be low.
Kinetin treatment of detached leaves resulted in the formation of swollen appressoria
of Erysiphe cichoracearum on tobacco (Cole & Fernandes, 1970), but had no
effect on appressorium formation by Erysiphe graminis on attached leaves of
barley (Liu & Bushnell, 1986). An inhibition of kinetin of appressorium formation of
Erysiphe graminis on nitrocellulose membranes suggests that exogenously
applied kinetin affects fungus development on the host directly rather than indirectly
through changes in host cells (Liu & Bushnell, 1986). Haustorium development is
inhibited by kinetin (Dekker, 1963; Liu & Bushnell, 1986) and the haustoria which
do develop are usually malformed (Liu & Bushnell, 1986). Vizarova. (1987) found
zeatin and its derivative (at 100J..Lg per 3 cms) to have an absolute inhibitory effect
on the growth of Erysiphe graminis compared to kinetin and benzylaminopurine
14
which had only slight inhibitory effects. On the other hand, Liu & Bushnell (1986),
could find no effects of zeatin (at concentrations of 10-6
- 10-4
M) on the
development of this fungus on detached barley coleoptiles. It is possible that
differences in time of application of the compounds, tissues used, and
concentrations used, could account for these differences.
Barley cultivars resistant to powdery mildew have been shown to have higher levels
of cytokinin activity before infection than susceptible cultivars and a close correlation
has been found between resistance and cytokinin levels (Kern et aI., 1987;
Viza.rova., 1975b, 1979, 1987; Viza.rova. & Paulech, 1979; Viza.rova., et al., 1988).
Higher levels of endogenous cytokinins were also found in dried seed of both barley
and wheat cultivars resistant to powdery mildew, than in those of susceptible
cultivars (Vizarova. & Muzikova, 1981; Viza.rova. & Vozar, 1984; Vizarova., et al.,
1988), and Viza.rova. (1987) found that resistant cultivars of these two cereals have
higher cytokinin activity in their entire ontogeny than susceptible cultivars. These
results point to the possible important role of free endogenous cytokinins in the
resistance of cereals against powdery mildew.
Viza.rova. and her co-workers have spent more than a decade investigating the role
of endogenous cytokinins in the barley- and wheat-powdery mildew interaction
(Vizarova., 1973, 1974a, 1975b, 1979, 1987; Vizarova. & Kova.cova., 1980;
Vizarova. & Minarcic, 1974; Vizarova. & Muzikova, 1981; Viza.rova. & Paulech,
1979; Viza.rova., et al., 1988; Viza.rova. & Vozar, 1984). They have found that with
infection of both resistant and susceptible cultivars, there is an initial decrease
during fungal incubation (0 - 4 days post-inoculation, dpi), followed by a rapid
increase until 6 dpi (when spore production is initiated in the susceptible cultivars).
In the susceptible cultivar, the cytokinin activity continues to rise as spore
production continues, whereas in the resistant cultivar a decline is noted at 6 dpi.
In both resistant and susceptible cultivars, inoculated leaves had higher cytokinin
activity than healthy leaves, however, the susceptible cultivars show a much greater
overall increase than resistant cultivars. Similar changes in endogenous cytokinins
of the 5th leaf of resistant and susceptible barley cultivars, inoculated with powdery
15
mildew, were noted by Kern et a/. (1987).
Levels of endogenous cytokinins in root tissue of barley and wheat cultivars have
been shown to change on infection of the above ground parts by powdery mildew
fungi (Vizeirovei, 1973, 1974b, 1975b, 1979; Vizeirovei & Minarcic, 1974; Vizarovei
& Paulech, 1979; Vizeirovei et a/.,1986). In root tissue of both resistant and
susceptible cultivars, there is an initial increase in activity between 0 and 4 dpi, this
increase being greatest in the resistant cultivar. In the susceptible cultivars, levels
remained high until the first spores formed. Following this increase there was a
steady drop back to a level near to that recorded in healthy root material of both the
resistant and susceptible cultivars. The overall decrease in cytokinin activity of root
material is greatest in the susceptible cultivars, indicating a greater removal from
these roots.
Vizeirovei & Minarcic (1974) found that, associated with increased free cytokinin
content of root material of a susceptible cultivar at 4 dpi, there was an inhibition of
elongation growth, inhibition of growth and formation of lateral roots, and changes
in morphology and anatomy of roots at segments related to 4 dpi. This, according
to these authors, indicates a decreased translocation to above-ground parts on that
day. They are of the opinion that at 4 dpi the parasite inhibits the transport of
cytokinins from the roots to the leaves and in support of this opinion they cite Cole
& Fernandes (1970) as having found that the cytokinins influence the growth of the
parasite in a negative way. Thus the reaction of the parasite would be a defensive
reaction.
Qualitative changes in cytokinin activity have been detected in susceptible barley
and wheat cultivars after the onset of powdery mildew spore production ( 6 - 10
dpi) (Vizeirovei, 1973, 1974b, 1979, 1987; Vizeirovei et a/., 1988). Before infection,
both resistant and suspeptible cultivars were shown to have cytokinin activity which
co-chromatographed with zeatin. At 6 dpi susceptible cultivars were found to
contain, in addition to zeatin, iso-pentenyladenine (2iP) and its derivatives, whereas
the resistant cultivars only had zeatin activity. Vizeirovei (1987) supposed that,
16
during sporulation the fungus produces 2iP and its derivatives in the susceptible
host plant.
Very few studies have examined the changes in endogenous cytokinins of wheat
cultivars infected with stem rust. Sziraki et al. (1976) found that the rust-induced
increase in cytokinin activity was greater in the susceptible cultivar. The susceptible
cultivar Little Club (Triticum compactum) was seen to have a slightly higher level
of cytokinin activity than the resistant cultivar Vernal (Triticum dicoccum) before
inoculation. The differences in genetic backgrounds of the two cultivars could
account for these differences in cytokinin levels. An identical pattern of changes in
endogenous cytokinin levels as recorded for powdery mildew infected barley leaves
was seen in wheat leaves infected by Puccinia graminis f.sp. tritici (Vizarova
et al., 1988; Vizarova et al., 1986). In a susceptible and a moderately resistant
cultivar, a new zone of cytokinin activity was detected in rust-infected leaf material,
whereas no new zone was detected in resistant cultivars. The new zone detected
in the wheat cultivars is the same as that detected in powdery mildew susceptible
barley cultivars and identified as 2iP and its derivatives by Vizarova (1987).
This literature review has highlighted the possible roles of cytokinins in plant
pathogenesis, and emphasizes the fact that many discrepancies and contradictions
appear in the literature. The reports by Vizarova and her co-workers on the
possible important role of free endogenous cytokinins in the resistance of cereals
against powdery mildew stimulated the present author's interest in the role of these
substances in the resistance of wheat to stem rust.
LITERATURE CITED
Aggab A.M. & Cooke R.e. (1981) Green islands in Sclerotinia curreyana
infected culms of Juncus effusus. Transactions of the British
mycological Society 76, 166-168.
Agrios G.N. (1988) Plant Pathology. Third edition, pp. 288-291. Academic
Press, San Diego.
17
Ahmed I., Owera S.A.P., Farrar J.F. & Whitbread R. (1982) The distribution of five
major nutrients in barley plants infected with brown rust. Physiological
Plant Pathology 21, 335-346.
Allen R.F. (1924) Cytological studies of infection of Baart, Kanred, and Mindum
wheats by Puccinia graminis tritici forms III and XIX. Journal of
Agricultural Research 24, 571-604.
Allen R.F. (1926) Cytological studies of forms 9, 21, and 27 of Puccinia
graminis tritici, on Khapli emmer. Journal of Agricultural Research
32, 701-725.
Allen P.J. (1942) Changes in the metabolism of wheat leaves induced by infection
with powdery mildew. American Journal of Botany 29, 425-435.
Angra R. & Mandahar C.L. (1985) Pathogenesis of maize leaves by
Helminthosporium spp.: production and possible significance of "green
islands". Research Bulletin of the Panjab University, Science 36,
239-243.
Atkin C.L. & Neilands J.B. (1972) Leaf infections: siderochromes (natural
polyhydroxamates) mimic the "green island" effect. Science 176,300-301.
Barnes M.F., Scott P.G. & Ooi K.H. (1988) The RNase of leaves of resistant and
susceptible barley cultivars after infection with leaf rust (Puccinia hordei
Otth.). Physiological and Molecular Plant Pathology 33, 263-269.
Barthe P. & Bulard C. (1974) Identification d'une cytokinine par chromatographie
en phase gaze use a partir de cultures pures de Taphrina cerasi.
Canadian Journal of Botany 52, 1515-1518.
Bist L.D. & Ram S. (1986) Effect of malformation on changes in endogenous
gibberellins and cytokinins during floral development of mango. Scientia
Horticulturae 28, 235-241.
Burrows W.J. (1975) Mechanism of action of cytokinins. Current Advances in
Plant Science 21,837-847.
Burrows W.J. (1978a) Evidence in support of biosynthesis de novo of free
cytokinins. Planta 138,53-57.
Burrows W.J. (1978b) Incorporation of 3H-adenine into free cytokinins of
cytokinin autonomous tobacco callus tissue. Biochemical and
18
Biophysical Research Communications 84, 743-748.
Bushnell W.R. (1967) Symptom development in mildewed and rusted tissues. In:
The Dynamic Role of Molecular Constituents in Plant Parasite
Interaction (Ed. by C.J. Mirocha & I. Uritani), pp. 21-39. The American
Phytopathological Society, St Paul.
Bushnell W.R. & Allen P.J. (1962) Induction of disease symptoms in barley by
powdery mildew. Plant Physiology 37, 50-59.
Camp R.R. & Whittingham W.F. (1975) Fine structure of chloroplasts in "green
islands" and in surrounding chlorotic areas of barley leaves infected by
powdery mildew. American Journal of Botany 62, 403-409.
Chakravorty A.K. , Shaw M. & Scrubb L.A. (1974) Ribonuclease activity of wheat
leaves and rust infection. Nature 247, 577-580.
Chen C-M. (1981) Biosynthesis and enzymic regulation of the interconversion of
cytokinin. In: Metabolism and Molecular Activities of Cytokinins
(Ed. by J. Guern & C. Peaud-Lenoel), pp. 34-43. Springer-Verlag, Berlin.
Chilton M-D, Drummond M.H., Merlo D.J., Sciaky D., Montoya AL, Gordon M.P.
& Nester E.W. (1977) Stable incorporation of plasmid DNA into higher
plant cells: the molecular basis of crown gall tumorigenesis. Cell 11, 263-
271.
Cole J.S. & Fernandes D.L. (1970) Changes in the resistance of tobacco leaf to
Erysiphe cichoracearum DC. induced by topping, cytokinins and
antibiotics. Annals of Applied Biology 66, 239-243.
Daly J.M. & Knoche H.W. (1976) Hormonal involvement in metabolism of host
parasite interactions. In: Biochemical Aspects of Plant-Parasite
Relationships (Ed. by J. Friend & D.R. Threlfall), pp. 117-133. Academic
Press, London.
Davey J.E. & Van Staden J. (1981) Cytokinin activity in Lupinus albus. V.
Translocation and metabolism of {8- 14C} zeatin applied to the xylem of
fruiting plants. Physiologia Plantarum 51, 45-48.
Dekhuijzen H.M. (1976) Endogenous cytokinins in healthy and diseased plants. In:
Physiological Plant Pathology (Ed. by R. Heitefuss & P.H . Williams).
pp. 526-559. Springer-Verlag, Berlin.
19
Dekhuijzen H.M. (1981) The occurrence of free and bound cytokinins in plasmodia
of Plasmodiophora brassicae isolated from tissue culture of clubroots.
Plant Cell Reports 1, 18-20.
Dekhuijzen H.M. & Overeem J.C. (1971) The role of cytokinins in clubroot
formation. Physiological Plant Pathology 1, 151-161.
Dekhuijzen H.M. & Staples R.C. (1968) Mobilization factors in uredospores and
bean leaves infected with bean rust fungus. Contributions from Boyce
Thompson Institute for Plant Research 24, 39-52.
Dekker J. (1963) Effect of kinetin on powdery mildew. Nature 197, 1027-1028.
Dennis D.T., Stubbs M. & Coultate T .P. (1967) The inhibition of brussel sprout leaf
senescence by kinins. Canadian Journal of Botany 45, 1019 -1024.
Dickinson J.R. (1985) {B- 14 C}-Adenine and {1- 14 C}-/sopentenyl
Pyrophosphate -Precursors for Root-Produced Cytokinins in the
Tomato (Lycopersicon esculentum Mill.). M.Sc. Thesis, University of
Natal.
Drummond M.H., Gordon M.P., Nester E.W. & Chilton M-D. (1977) Foreign DNA
of bacterial plasmid origin is transcribed in crown gall tumors. Nature 269,
535-536.
Edwards H.H. (1983) Effect of kinetin, abscisic acid, and cations on host-parasite
relations of barley inoculated with Erysiphe graminis f.sp. hordei.
Phytopathologische Zeitschrift 107, 22-30.
Engelbrecht L. (1971) Cytokinin activity in larval infected leaves. Biochemie und
Physiologie der Pflanzen 162, 9-27.
Forsyth F.R. & Samborski D.J. (1958) The effect of various methods of breaking
resistance on stem rust reaction and content of soluble carbohydrate and
nitrogen in wheat leaves. Canadian Journ?-' of Botany 37,717-723.
Fosket D.E., Volk M.J. & Goldsmith M.R. (1977) Polyribosome formation in
relation to cytokinin-induced cell division in suspension cultures of Glycine
max (L) Merr. Plant Physiology 60, 554-562.
Fraser R.S.S. & Whenham R.J. (1982) Plant growth regulators and virus
infection: a critical review. Plant Growth Regulation 1,37-59.
Fox J.E. (1966) Incorporation of a kinin, N,6-benzyladenine into soluble RNA.
20
Plant Physiology 41, 75-82.
Garfinkel D.J., Simpson R.B., Ream L.W., White F.F., Gordon M.P. & Nester E.W.
(1981) Genetic analysis of crown gall: fine structure map of the T-DNA by
site-directed mutogenesis. Cell 27, 143-153.
Gordon M.E., Letham D.S. & ParkerC.W. (1974) The metabolism and translocation
of zeatin in intact radish seedlings. Annals of Botany 38, 809-825.
Greene E.M. (1980) Cytokinin production by micro-organisms. Botanical
Review 46, 25-74.
Hall S.M. & Baker D.A. (1972) The chemical composition of Ricinus phloem
exudate. Planta 106, 131-140.
Harding H., Williams P.H. & McNabola S.S. (1968) Chlorophyll changes,
photosynthesis, and ultrastructure of chloroplasts in Albugo candida
induced "green islands" on detached Brassica juncea cotyledons.
Canadian Journal of Botany 46, 1229-1234.
Heitefuss R. (1966) Untersuchungen zur physiologie des temperaturgesteuerten
vertraglichkeitsgrades von weizen und Puccinia graminis tritici.
Phytopathologische Zeitscrift 55, 67-85.
Helgeson J.P. & Leonard N.J. (1966) Cytokinins: identification of compounds
isolated from Corynebacterium fascians. Proceedings of the
National Academy of Science U.S.A. 56, 60-63.
Henson I.E. & Wareing P.F. (1976) Cytokinins in Xanthium strumarium L.:
Distribution in the plant and production in the root system. Journal of
Experimental Botany 27, 1268-1278.
Hewett E.W. & Wareing P.F. (1974) Cytokinin changes during chilling and bud
burst in woody plants. In: Mechanisms of Regulation of Plant
Growth (Ed. by R.L. Bieleski, A.R. Ferguson & M.M. Creswell), pp. 693-701.
Bulletin 12, The Royal SOCiety of N.Z., Wellington.
Hoad G.v. (1973) Hormones in the phloem of higher plants. In: Transactions
of the Third Symposium on Accumulation and Translocation of
Nutrients and Regulators in Plant Organisms, pp. 17-30. Warsaw,
Jablona, Skierniewice, Brezna, Krakow.
Hopkins D.L. (1985) Effects of plant growth regulators on development of
21
Pierce's disease symptoms in grapevine. Plant Disease 69, 944-946.
Horgan R. (1984) Cytokinins. In: Advanced Plant Physiology (Ed. by M.B.
Wilkins), pp. 53-75. Pitman, London.
Horgan R. (1987) Cytokinin genes. In: Hormone Action in Plant
Development - A Critical Appraisal (Ed. by G.v. Hoad, J.R. Lenton,
M.B. Jackson & R.K. Atkin), pp. 119-130. Butterworths, London.
Horgan R., Hewett E.W. , Purse J.G., Horgan J.M. & Wareing P.F. (1973)
Identification of a cytokinin in sycamore sap by gas chromatography - mass
spectrometry. Plant Science Letters 1,321-324.
Hwang B.K., Ibenthal W-D. & Heitefuss R. (1986) 14C02-assimilation, translocation
of 14C, and 14C-carbonate uptake in different organs of spring barley plants
in relation to adult-plant resistance to powdery mildew. Annals
Phytopathological Society of Japan 52, 201-208.
Ingram D.S. (1969) Abnormal growth of tissues infected with Plasmodiophora
brassicae. Journal of General Microbiology 56, 55-67.
Jablonski J.R. & Skoog F. (1954) Cell enlargement and cell division in excised
tobacco pith tissue. Physiologia Plantarum 7, 16-36.
Johnston J.C. & Trione E.J. (1974) Cytokinin production by the fungi Taphrina
cerasi and Taphrina deformans. Canadian Journal of Botany 52,
1583-1589.
Kende H. (1971) The cytokinins. International Review of Cytology 31,301-
338.
Kern M., Ibenthal W. -D. & Heitefuss R. (1987) Endogene phytohormone in
sommergerstensorten mit unterscheidlicher resistenz gegenuber dem echten
mehltau (Erysiphe graminis f.sp. hordei). Angewandte Botanik 61,
243-253.
Kern H. & Naef-Roth S. (1975) Zur bildung von auxinen und cytokininen
durch Taphrina-Arten. Phytopathologische Zeitschrift 83, 193-222.
Kiraly Z. , EI Hammady M ~ & Pozsar B.1. (1967) Increased cytokinin activity of rust
infected bean and broad bean leaves. Phytopathology 57, 93-94.
Klemen F. & Klambt D. (1974) Half-life of sRNA from primary roots of Zea mays.
A contribution to the cytokinin production. Physiologia Plantarum 31,
22
186-188.
Kriesel K. (1987) The role of growth regulators in the host-parasite relationship
between pine seeds (Pinus sylvestris L.) and isolates of
Cylindrocarpon destructans (Zins. Scholt.). II. Cytokinins. Bulletin of
the Polish Academy of Sciences, Biological Sciences 35,315-321.
Letham D.S. (1963) Zeatin, a factor inducing cell division from Zea mays. Life
Sciences 8, 569-573.
Letham D.S. (1974) Regulators of cell division in plant tissues. XX. The cytokinins
of coconut milk. Physiologia Plantarum 32, 66-70.
Letham D.S. (1978) Cytokinins. In: Phytohormones and Related
Compounds - A Comprehensive Treatise. 1. (Ed. by D.S. Letham, P.B.
Goodwin & T.JV. Higgins), pp. 205-263. Elsevier, Amsterdam.
Liu Z. & Bushnell W.R. (1986) Effects of cytokinins on fungus development and
host responses in powdery mildew of barley. Physiological and
Molecular Plant Pathology 29, 41-52.
Livne A. & Daly J. M. (1966) Translocation in healthy and rust-affected beans.
Phytopathology 56, 170-175.
Maas H. & Klambt D. (1981a) On the biogenesis of cytokinins in roots of
Phaseolus vulgaris. Planta 151,353-358.
Maas H. & Klambt D. (1981b) Cytokinin biosynthesis in higher plants. In:
Metabolism and Molecular Activities of Cytokinins (Ed. by J. Guern
& C. Peaud-Lenoel), pp. 27-33. Springer-Verlag, Berlin.
MacDonald E.M.S., Powell G.K., Regier D.A., Glass N.L., Roberto F., Kosuge T.&
Morris R.O. (1986) Secretion of zeatin, ribosylzeatin, and ribosyl-1 "
methylzeatin by Pseudomonas savastanoi. Plant Physiology 82,742-
747.
Mahadevan A. (1984) Growth Regulators, Microorganisms and Diseased
Plants. Oxford & IBH, New Delhi.
Mandahar C.L. & Garg 1.0. (1976) Cytokinin activity of powdery mildew infected
leaves of Abelmoschus esculentus. Phytopathologische Zeitschrift
84,86-89.
Manners J.M. & Scott K.J. (1984) The effect of infection by Erysiphe graminis
23
f.sp. hordei on protein synthesis in vivo in leaves of barley. Plant and
Cell Physiology 25, 1307-13 11 .
Mares D.J. & Cousen S. (1977) The interaction of yellow rust (Puccinia
strii f ormis) with winter wheat cultivars showing adult plant resistance:
macroscopic and microscopic events associated with the resistant reaction.
Physiological Plant Pathology 10,257-274.
Mayama S., Rehfeld D.W. & Daly J.M. (1975) The effect of detachment on the
development of rust disease and the hypersensitive response of wheat leaves
infected with Puccinia graminis tritici . Phytopathology 65, 1139-
1142.
McGaw B.A. (1987) Cytokinin biosynthesis and metabolism. In: Plant Hormones
and Their Role in Plant Growth and Development (Ed. by P.J.
Davies), pp. 76-93. Nijhoff, Dordrecht.
McGaw B.A. , Scott I.M. & Horgan R. (1984) Cytokinin biosynthesis and
metabolism. In: The Biosynthesis and Metabolism of Plant
Hormones (Ed. by A. Crozier & J.R. Hillman), pp. 105-133. Cambridge
University Press, Cambridge.
Michniewicz M., Michalski L. , Rozej B. & Kruszka G. (1986a) Phytohormone
changes in leaves of wheat plants infected by Fusarium culmorum
(W.G.Sm.) Sacco Acta Physiologiae Plantarum 8, 21-31 .
Michniewicz M., Rozej B. & Bobkiewicz W. (1986b) The production of growth
regulators by Fusarium culmor um (W.G.Sm.) Sacco as related to the age
of mycelium. Acta Physiologiae Plantarum 8, 85-91 .
Michniewicz M., Rozej B. & Kruszka G. (1984) Control of growth and development
of isolates of Fusarium culmorum (W.G.Sm.) Sacco of different
pathogenicity to wheat seedlings by plant growth regulators. III. Cytokinins.
Acta Physiologiae Plantarum 6, 3-11.
Miller C.O. (1961) Kinetin and related compounds in plant growth. Annual
Revi ew of Plant Physiology 12, 395-408.
Miller C.O. ( 1965) Evidence for the natural occurrence of zeatin and derivatives:
compounds from maize which promote cell division. Proceedings of the
National Academy of Science U.S.A. 54, 1052-1058.
24
Miller C.O., Skoog F., Okumura F.S., Von Saltza M.H. & Strong F.M. (1956)
Isolation, structure and synthesis of kinetin, a substance promoting cell
division. Journal of the American Chemical Society 78, 1375-1380.
Mills L.J. & Van Staden J. (1978) Extraction of cytokinins from maize, smut
tumours of maize and Ustilago maydis cultures. Physiological Plant
Pathology 13, 73-80 .
Mothes K. & Engelbrecht L. (1961) Kinetin-induced directed transport of
substances in excised leaves in the dark. Phytochemistry 1,58-62.
Mothes K., Engelbrecht L. & Kulajewa O. (1959) Uber die Wirkung des Kinetins auf
Stickstoffverteilung und Eiweiss-synthese in Isolierten Blattem. F lor a
(Jena). 147, 445-465.
Mothes K., Engelbrecht L. & Schutte H.R. (1961) Uber die akkumulation von a
aminoisobuttersaure in Blattgewebe unter dem Einfluss von kinetin.
Physio/ogia Plantarum 14, 72-75.
Mukherjee K.L. & Shaw M. (1962) The physiology of host-parasite relations. XI.
The effect of stem rust on phosphate fraction in wheat leaves. Canadian
Journal of Botany 40, 975-985.
Muller P. & Hilgenberg W. (1986) Isomers of zeatin and zeatin riboside in clubroot
tissue: evidence for trans-zeatin biosynthesis by Plasmodiophora
brassicae. Physiologia Plantarum 66, 245-250.
Nandi S.K., Palni L.M.S., Letham D.S. & Wong O.C. (1989) Identification of
cytokinins in primary crown gall tumours of tomato. Plant, Cell and
Environment 12, 273-283.
Nicholson R.I.D. (1986) The Role of Cytokinins in Mango Malformation.
MSc. Thesis, University of Natal.
Nicholson R.I.D. & Van Staden J. (1988) Cytokinins and mango flower malformation.
I. Tentative identification of the complement in healthy and matformed
inflorescences. Journal of Plant Physiology 132,720-724.
Nishinari N. & Syono K. (1980a) Biosynthesis of cytokinins by tobacco cell
cultures. Plant and Cell Phys i ol ogy 21, 1143-1150.
Nishinari N. & Syono K. (1980b) Cell-free biosynthesis of cytokinins in cultured
tobacco cells. Zeitschrift fur Pflanzenphysiologie 99, 383-392.
25
Osborne D.J. (1962) Effect of kinetin on protein and nucleic acid metabolism in
Xanthium leaves during senescence. Plant Physiology 37 , 595-602 .
Palni L.M.S. (1984) Cytokinin accumulation in the culture medium of Vinca rosea
L. crown-gall tissue: a time-course study. Australian Journal of Plant
Physiology 11 , 129-136.
Parker C.W. & Letham D.S. (1973) Regulators of cell division in plant tissues. XVI.
Metabolism of zeatin by radish cotyledons and hypocotyls. Planta 114,
199-218.
Patrick J.W. (1987) Are hormones involved in assimilate transport? In: Hormone
Action in Plant Development - A Critical Appraisal (Ed . by G.v.
Hoad, J.R. Lenton, M.B. Jackson & R.K. Atkin), pp. 175-187. Butterworths,
London.
Pegg G.F. (1976a) Endogenous auxins in healthy and diseased plants. In :
Encyclopedia of Plant Physiology, New Series 4,560-581.
Pegg G.F. (1976b) The involvement of ethylene in plant pathogenesis. In:
Encyclopedia of Plant Physiology, New Series 4,582-591.
Person C., Samborski D.J. & Forsythe F.R. (1957) Effect of benzimidazole on
detached wheat leaves. Nature 180, 1294-1295.
Phillips D.A & Cleland C.F. (1972) Cytokinin activity from the phloem sap of
Xanthium strumarium L. Planta 102, 173-178.
Pozsar B.1. & Kiraly Z. (1966) Phloem transport in rust infected plants and the
cyto~inin-directed long d istance movement of nutrients.
Phytopathologische Zeitschrift 56, 297-309.
Purse J.G., Horgan R. , Horgan J.M. & Wareing P.F. (1976) Cytokinins in
sycamore spring sap. Planta 132, 1-8.
Rathbone M.P. & Hall R.H. (1972) Concerning the presence of the cytokinin, N6 -
(f:l2 - isopentenyl) adenine, in cultures of Corynebacterium
fascians. Planta 108, 93-102 .
Richmond AE. & Lang A (1957) Effect of kinetin on the protein content and
survival of detached Xanthium leaves. Science 125, 650-651.
Roberto F. & Kosuge T. (1987) Phytohormone metabolism in Pseudomonas
syringae sub. sp. savastanoi. In: Molecular Biology of Plant
26
Growth Control (Ed. by E. Fox & M. Jacobs) pp. 371-380. Liss, New
York.
Samborski D.J., Forsythe F.R. & Person C. (1958) Metabolic changes in
detached wheat leaves floated on benzimidazole and the effect of these
changes on rust reaction. Canadian Journal of Botany 36,591-601.
Scholes J.D. & Farrar J.F. (1987) Development of symptoms of brown rust of
barley in relation to the distribution of fungal mycelium, starch accumulation
and localized changes in the concentration of chlorophyll. New
Phy tologist 107, 103-117.
Schroder J. (1987) Plant hormones in plant-microbe interactions. In: Plant
Mic r obe Interactions: Molecular and Genetic Perspectives .
Volume 2. (Ed. by T. Kosuge & E.W. Nester), pp. 40-63. Macmillan, New
York.
Sequeira L. (1963) Growth regulators in plant disease. Annual Review of
Phytopathology 1,5-30.
Sequeira L. (1973) Hormone metabolism in diseased plants. Annual Review of
Plant Physiology 24, 353-380.
Shaw M. (1961) The physiology of host-parasite relations. IX. Further
observations on the accumulation of radioactive substances at rust infections.
Canadian Journal of Botany 39, 1393-1407.
Shaw M. (1963) The physiology of host-parasite relationships. Annual Review
of Phytopathology 1, 259-294.
Singh H., Agarwal p.o., Bhattacharya G. & Sethi I. (1982) Changes in chloroplast
pigments in wheat leaves infected with Puccinia graminis tritici.
Phytopathologische Zeitschrift 104, 193-201.
Skoog F. & Armstrong D.J. (1970) Cytokinins. Annual Review of Plant
Physiology 21, 359-384.
Skoog F. & Tsui C. (1948) Chemical control of growth and bud formation in
tobacco stem segments and callus cultured in vitro. American Journal
of Botany 35, 782-787.
So M.L. & Thrower L.B. (1976) The host-parasite relationship between Vigna
sesquipedalis and Uromyces appendiculatus. I. Development of
27
parasitic colonies and the pattern of photosynthesis. Phytopatho/ogische
Zeitschrift 85, 320-332.
Stakman E.C., Stewart D.M. & Loegering W.Q. (1962) Identification of physiologic
races of Puccinia graminis var. tritici. U.S.D.A. Bull, E617 (Revised).
Strzelczyk E. & Kampert M. (1983) Production of cytokinin-like substances by
Cylindrocarpon destructans (Zins.) Scholt. Isolates pathogenic and
non-pathogenic to fir (Abies alba Mill.) seedlings. Phytopatho/ogische
Zeitschrift 106,90-96.
Stuchbury T. , Palni L.M.S., Horgan R. & Wareing P.F. (1979) The biosynthesis of
cytokinins in crown-gall tissue of Vinca rosea. Planta 147,97-102.
Suri R.A. & Mandahar C.L. (1984) Secretion of cytokinins in vivo and in vitro by
Alternaria brassicicola and their role in pathogenesis . Experientia 40 ,
462-463.
Suri R.A. & Mandahar C.L. (1985) Involvement of cytokinin-like substances in the
pathogenesis of Alternaria brassicae (Berk.) Sacco Plant Science 41,
105-109.
Surico G. (1986) Indoleacetic acid and cytokinins in the olive knot disease. An
overview of their role and their genetic determinants. In: Biology and
Molecular Biology of Plant -Pathogen Interactions (Ed. by J.A.
Bailey), pp. 315-329. Springer-Verlag, Berlin.
Surico G., lacobellis N.S. & Sisto A. (1985) Studies of indole-3-acetic acid and
cytokinins in the formation of knots on olive and oleander plants by
Pseudomonas syringae pv. savastanoi. Physiological Plant
Pathology 26, 309-320.
Surico G., Sparapano L., Lerario P., Durbin R.D. & lacobellis N.S. (1975) Cytokinin
like activity in extracts from culture filtrates of Pseudomonas savastanoi.
Experientia 31, 929-930.
Sziraki I., Balazs E. & Kiraly Z. (1975) Increased levels of cytokinin and
indoleacetic acid in peach leaves infected with Taphrina deformans.
Physiological Plant Pathology 5, 45-50.
Sziraki I., Barna B., Waziri S.E. & Kiraly Z. (1976) Effect of rust infection on the
cytokinin level of wheat cultivars susceptible and resistant to Puccinia
28
graminis f.sp. tritici. Acta Phytopathologica Academiae
Scientiarum Hungaricae 11, 155-160.
Sziraki I., Mustardy L.A., Faludi-Daniel A. & Kiraly Z. (1984) Alterations in
chloroplast ultrastructure and chlorophyll content in rust-infected Pinto beans
at different stages of disease development. Phytopathology 74,77-84.
Tandon P. (1987) Hormonal regulation of abnormal growth in plants. In:
Hormonal Regulation of Plant Growth and Development, Volume
2 (Ed. by S.S. Purohit), pp. 45-63. Martinus Nijhoff, Dordrecht.
Thimann K. & Sachs T. (1966) The role of cytokinins in the "fasciation" disease
caused by Corynebacterium fascians. American Journal of Botany
53,731-739.
Van Staden J. (1976) The identification of zeatin glucoside from coconut milk.
Physiologia Plantarum 36, 123-126.
Van Staden J., Bayley A.D. & Macrae S. (1989) Cytokinin and mango flower
malformation III. The metabolism of [3H]iso-pentenyladenine and
[8014
C]zeatin by Fusarium moniliforme. Physiological and Molecular
Plant Pathology 35, 433-438.
Van Staden J. & Davey J.E. (1979) The synthesis, transport and metabolism of
endogenous cytokinins. Plant, Cell and Environment 2,93-106.
Van Staden J. & Nicholson RI.D. (1989) Cytokinins and mango flower malfor
mation II. The cytokinin complement produced by Fusarium moniliforme
and the ability of the fungus to incorporate [8014C] adenine into cytokinins.
Physiological and Molecular Plant Pathology 35,423-431.
Vizarova Go (1973) Contribution to the study of barley infected by powdery
mildew. Proceedings of the Research Institute of Pomology,
Skierniewice, Poland. Series E 3, 559-564.
Vizarova G. (1974a) Level of free cytokinins in susceptible and resistant cultivars
of barley infected by powdery mildew. Phytopathologische Zeitschrift
79,310-314.
Vizarova G. (197 4b) Free cytokinins in roots and leaves of barley during
pathogenesis of powdery mildew (Erysiphe graminis f.sp. hordei
Marchal) Biol6gia (Bratislava) 29, 551-558.
29
Vizarova G. (1975a) Contribution to the study of cytokinin production by
phytopathogenic fungi. Biologia Plantarum (Praha) 17, 380-382.
Vizarova G. (1975b) Effect of powdery mildew on the level of endogenous
cytokinins in barley with regard to resistance. Phytopathologische
Zeitschrift 84, 105-114.
Vizarova G. (1979) Changes in the level of endogenous cytokinins of barley during
the development of powdery mildew. Phytopafhologische Zeitschrift
95, 329-341.
Vizarova -G. (1987) Possible role of cytokinins in cereals with regard to the
resistance to obligatE! fungus parasites. Biologia Plantarum (Praha) 29,
230-233.
Vizarova G. & Kovacova M. (1980) studium vol'nych cytokininov v korehoch
ja~mena v procese patogenezy mu~natky tenkovrstevnou chromatografiou.
Biol6gia (Brastis/ava) 35, 727-732.
Vizarova G. & Minarcic P. (1974) The influence of powdery mildew upon the
cytokinins and the morphology of barley roots. Phytopatho/ogische
Zeitschrift 81,49-55.
Vizarova G. & Muzikova D. (1981) The content of free endogenous cytokinins in
the grain of barley and wheat in relation to their resistance to mildew.
Polnohospodarstvo 27, 1109-1115.
Vizarova G. & Paulech C. (1979) studium vol'nych endogennych cytokininov v
ja~meni a ich vztah k rezistencii oproti mu~natke. Biol6gia (Bratislava)
34,31-37.
Vizarova G., Shashkova, L.S. & Andreev L.N. (1988) On the question of the
relationship between free zeatin content and resistance of wheat to biotrophic
fungi. Acta Phytopathologica et Entomologica Hungarica 23, 385-
392.
Vizarova G. & Shashkova L.S. , Mazin V.v., Vozar I. & Paulech C. (1986) Free
cytokinins in Puccinia graminis Pers. f. sp. tritici Eriks. & E. Henn.
affected wheat leaves (In Russian). Mikologiya i Fitopatologiya 20, 281-
285.
Vizarova G. & Vozar I. (1984) Free endogenous cytokinin content in the seeds
of barley and wheat cultivars with different resistance to powdery mildew.
Biochemie und Physiologie der Pflanzen 179,767-774.
30
Vonk C.R. (1974) Studies on phloem exudation from Vacca f1accida Haw. XIII.
Evidence for the occurrence of a cytokinin nucleotide in the exudate. Acta
Botanica Neerlandica 23, 541-548.
Wang D., Hao M.S.H. & Waygood E.R. (1961) Effect of benzimidazole analogues
on stem rust and chlorophyll metabolism. Canadian Journal of Botany
39, 1029-1036.
Whenham R.J. (1989) Effect of systemic tobacco mosaic virus infection on
endogenous cytokinin concentration in tobacco (Nicotiana tabacum L.)
leaves: consequence for the control of resistance and symptom
development. Physiological and Molecular Plant Pathology 35,85-
95.
Whitney R.J. (1976) Microbial Plant Pathology. Hutchinson, London.
Wyndaele R., Van Onckelen H., Christiansen J., Rudelsheim P., Hermans R. & De
Greef J. (1985) Dynamics of endogenous IAA and cytokinins during the
growth cycle of soybean crown gall and untransformed callus. Plant and
Cell Physiology 26, 1147- 1154.
Yadav B.S. (1981) Green islands on leaves under infection of He/minthosporium
sativum P.K. and B. Geobios 8, 83-84.
Yadav B.S. & Mandahar C.L. (1981) Secretion of cytokinin-like substances in vivo
and in vitro by Helminthosporium sativum and their role in
pathogenesis. Zeitschrift fur Pflanzenkrankheiten und
Pflanzenschutz 88, 726-733.
Zaenen I., Van Larabeke N., Teuchy H., Van Montagu M. & Schell J. (1974)
Supercoiled circular DNA in crown-gall inducing Agrobacterium strains.
Journal of Molecular Biology 86, 109-127.
31
CHAPTER 1
LEVELS OF CYTOKININS IN SUSCEPTIBLE AND RESISTANT
WHEAT-STEM RUST INTERACTIONS
INTRODUCTION
A number- of investigations have shown that barley and wheat cultivars resistant to
powdery mildew infections have higher levels of endogenous cytokinins before
infection than susceptible cultivars, and a close correlation has been found between
resistance and cytokinin activity (Kern et a/., 1987; Viza.rova. , 1975b, 1979, 1987;
Viza.rova. & Paulech, 1979). Dried seed material of resistant cultivars of these two
cereals was also found to contain higher levels of endogenous cytokinins (Vizarova.
& Muzikova, 1981; Viza.rova. & Vozar, 1984), and Viza.rova. (1987) found that the
resistant cultivars of these two cereals have higher cytokinin activity during their
entire ontogeny than the susceptible cultivars. These results pOint to the possible
important role of free endogenous cytokinins in the resistance of cereals against
powdery mildew (Vizarova., 1987) and stimulated the present interest in the role of
endogenous cytokinins in the resistance of wheat to stem rust.
Few studies have examined the changes in endogenous cytokinins of wheat
cultivars induced by stem rust infection. However, the pattern of changes detected
in stem rust infected wheat leaves was seen to be the same as that in powdery
mildew infected barley leaves (Vizarova. et aI., 1988; Viza.rova. et a/., 1986).
Infection of barley with powdery mildew (Viza.rova., 1974a, b, 1975b, 1979;
Viza.rova. & Kova.~ova., 1980; Viza.rova. & Minarcic, 1974), and wheat with stem rust
or powdery mildew (Kern et a/., 1987; Sziraki et a/., 1976; Viza.rova. et a/.,
1988; Vizarova. et a/., 1986) has been shown to induce an increase in the levels
of endogenous cytokinins in both susceptible and resistant cultivars, however the
increase in susceptible cultivars was far greater than that in the resistant cultivars.
Qualitative changes in cytokinin activity detected in susceptible cultivars of barley
32
infected with powdery mildew (Vizarova, 1973, 1974b, 1979, 1987), and
susceptible or moderately resistant wheat cultivars infected with stem rust (Vizarova
et al., 1986) indicate that, during spore production, these pathogens produce
cytokinins in the host plants and in so doing would contribute to the cytokinin pool
of the infected plant. Cytokinin production by these pathogens in fully resistant
cultivars has not been detected, as these cultivars have the same cytokinin activity
as healthy resistant cultivars (Vizarova et al. , 1988).
This research was aimed at determining whether wheat cultivars resistant to stem
rust have higher levels of endogenous cytokinins than susceptible cultivars, and the
potential of cytokinin levels as an indicator of resistance in wheat breeding selection
criterion. The work has been restricted to endogenous cytokinin levels of disease
free plants, because for a plant breeder, the ability to carry out disease resistance
selections, without the complication of the pathogen, would be a great advantage.
The susceptible wheat cultivar Little Club (Triticum compactum) and the resistant
isogenic line Little Club $r25 were selected to minimise differences caused by
genetic background. Stem rust race 2SA4 is the most common race in South
Africa, and gives an infection type 4 on Little Club, and 2 on Little Club $r25 on the
Stakman scale (Stakman et al., 1962).
MATERIALS AND METHODS
Two separate experiments were carried out in this study, both aimed at a
comparative quantitative and qualitative analysis of the endgenous cytokinins in the
leaf and seed material of a susceptible cultivar and an isogenic resistant wheat line
of the susceptible cultivar. The general techniques used in this investigation are
presented initially, and this is followed by the presentation of the spectfic
methodology employed in each of the two experiments.
Plant material. For the analysis of leaf material, the wheat cultivar Little Club and
the isogenic wheat line Little Club $r25, were grown in trays (26.5 by 18.5 by 6.5
33
cm) of washed river sand in a Conviron at 26°C/16°C, 12 hour/12 hour day/night
regime. Primary leaves were harvested 15 days after sowing, flash frozen in liquid
nitrogen, packed into polythene bags and stored at -20°C until required. Dried seed
material was milled when required.
Extraction of cytokinins from plant material. In both experiments, cytokinins
were extracted from 5 g of leaf and 2 g of seed material by homogenising the
sample in 100 ml of 80% ethanol and being allowed to stand for 24 hours at 5°C.
The homogenates were then filtered through Whatman No. 1 filter paper and the
residues were washed with 80% ethanol. The extracts were then concentrated to
dryness in vacuo at 30°C and resuspended in accordance with the
chromatographic technique to be employed.
Chromatographic Techniques:-
Paper chromatography. Extracts were resuspended in 2 ml of 80% ethanol,
filtered through 0.45 j.Lm Millipore filters and strip-loaded onto Whatman No. 1
chromatography paper. The constituents were separated by descending
chromatography using iso-propanol:25% NH40H:water (10: 1: 1 vjv) (PAW) until the
solvent front had advanced approximately 30 cms from the origin. Thereafter, the
solvent fronts were marked and the chromatograms dried in a drying oven at 25°C
for 24 hours. The dry chromatograms were divided into ten equal zones. If at this
point, the chromatographed extracts were to be analysed for cytokinin activity, the
strip of paper corresponding to each F\ zone was cut up and placed into a 50 ml
Erlenmeyer flask and subsequently assayed for cell-division promoting activity using
the soybean callus bioassay (Miller, 1963, 1965). The chromatograms were stored
at -20°C if further analysis was necessary.
Column chromatography. Column chromatography was used to fractionate
extracts so that the cytokinins could be tentatively identified on a basis of co-elution
with authentic cytokinin markers.
34
The technique used was based on that of Armstrong et a/ . (1969). The columns
(90 x 2.5 cms) were packed with Sephadex LH-20 which had been swollen in 35%
ethanol. They were eluted with 35% ethanol at a flow rate of 15 ml per hour at
20°C. Dried extracts were resuspended in 1 ml 35% ethanol and loaded onto the
columns. After elution through the columns, the fractions were combined in 40 ml
fractions in Erlenmeyer flasks. Ten ml aliquots of each fraction were assayed for
cell division activity using the soybean callus bioassay (Miller, 1963, 1965) and the
remainder was dried on a hot plate (30°C) in a stream of air and stored until
required for further analysis.
High performance liquid chromatography_ High performance liquid
chromatography separation of authentic cytokinins, and cytokinins from plant
extracts was achieved by reversed phase high performance liquid chromatography
(HPLC). The column used was a Hypersil 5 ODS column (250 x 4 mm Ld.) with a
flow rate of 1 ml per minute. This was maintained by a 3 500 pounds per square
inch single piston reciprocating pump, absorbance was recorded with a Varian
variable wavelength monitor at 265 nm, which was fitted with an 8 J.Lm flow-through
cell. Separation was achieved using a Varian 5 000 liquid chromatogram and the
data output recorded using a Vista 4 000 data system.
Partially purified extracts obtained after paper chromatography or Sephadex LH-20
column chromatography were redisolved in methanol and filtered through a 0.22 J.Lm
Millipore filter. 100 J.LI aliquots were injected into the chromatograph. At the start
of the programme the mobile phase consisted of methanol:0.2M acetic acid
buffered to pH 3.5 using triethylamine (5:95) at a flow rate of 1 ml per minute and
a column temperature of 30°C. Aliquots of 1 or 2 ml from each sample run were
collected, air dried and then assayed for cell division activity.
In order to obtain the elution times of various endogenous cytokinins occurring in
plant material, authentic cytokinin standards were run through the same column
using the same programme.
Soybean Callus Bioassay. The soybean cotyledonary callus bioassay was used
35
to determine cytokinin-like activity of plant extracts separated on paper, column and
HPLC chromatograms. Of the various cytokinin assay systems in use, tissue culture
bioassays are regarded as being the most sensitive. According to Van Staden &
Davey (1979), the soybean (Glycine max L. cv. Acme) callus bioassay is probably
the best tissue culture assay to use because it exhibits a linear relationship between
response and concentration over a wide range of cytokinin concentrations.
Advantages of this bioassay are that microbial growth is eliminated and also that no
natural cytokinins have been detected in soybean callus maintained on kinetin (Van
Staden & Davey, 1977).
The procedure described by Miller (1963, 1965) was followed in obtaining callus
from the cotyledons of soybean. This was maintained by three-weekly subculture.
Four stock solutions were prepared and the nutrient medium made up as outlined
in Appendix 1.1. Twenty ml of medium was added to 50 ml Erlenmeyer flasks
containing 0.2 g 'of agar, non-absorbant cotton wool bungs were used to stopper
the flasks and these were then covered with aluminium foil. The flasks were
autoclaved at a pressure of 1.05 Bars for twenty minutes before being transferred
to a sterile transfer cabinet. The inside of the transfer cabinet was then sprayed
with 100% Thymol and left to dry for six hours. Thereafter, three pieces of soybean
stock callus, each of approximately 10 mg, were placed on the medium in each
flask. The flasks were then incubated in a growth room where a constant
temperature (26°C ± 2°C) was maintained. The three pieces of callus were massed
Simultaneously after twenty-eight days. The amount of callus growth relative to the
control value was plotted. Kinetin standards were included with each bioassay.
Experiment 1: Determination of endogenous cytokinin levels in a susceptible
wheat cuttivar and a resistant isogenic wheat line, and the tentative
identification of these cytokinins using paper and high performance liquid
chromatography
In this experiment, the cytokinins in the plant material extracts were initially
36
separated using the paper chromatographic technique described previously.
Each dried chromatogram was cut in half, one half of which was used for a soybean
callus bioassay immediately, the other half of which was stored at -20°C, to be used
for HPLC and then soybean callus bioassay once the bioassay results of the first
half were known.
Each of the remaining half chromatograms were cut at the 0.5 Rf value, cut up into
100 ml Erlenmeyer flasks and the cytokinins eluted from the paper by two, two hour
washes in 50 ml 80% redistilled ethanol. The extracts were then evaporated to a
smaller volume in 500 ml Buchi flasks, transferred to small pear shaped Buchi flasks
and evaporated to dryness. The extracts were then resuspended in 400 J.LI H PLC
grade methanol, filtered and 100 J.LI injected into the chromatograph as previously
described. Aliquots of 1 ml per minute over a period of 90 minutes were collected
from each sample run. These were washed into 25 ml Erlenmeyer flasks, dried on
a hot plate at 30°C in a stream of air and then prepared for the soybean callus
bioassay. The remaining 300 J.LI of each sample was dried and stored in Eppendorf
tubes.
Experiment 2: Determination of endogenous cytokinin levels in a susceptible
wheat cultivar and a resistant isogenic wheat line, and the tentative
identification of these cytokinins using column and high performance liquid
chromatography
In experiment 2, the cytokinins in the four plant material extracts were initially
separated using the column chromatography technique described.
Soybean callus bioassays were carried out on 10 ml of each 40 ml fraction for each
of the four samples, the remainder was evaporated to dryness and stored until the
bioassay results were known. Two repititions of each sample were analysed.
The dried extracts from the Sephadex columns (forty flasks for each of eight
37
samples) were resuspended in two washes of 5 ml 80% redistilled ethanol with the
five groups of fractions being pooled and dried under vacuum. The extracts were
then resuspended in 1 ml 80% ethanol, passed through a 0.22 J.Lm Millipore filter
into a clean glass vial. The extracts were then dried in vacuo using a vacuum
centrifuge and then resuspended in 300 J.LI of 80% HPLC grade methanol. The
extracts were then filtered again through a 0.22 J.Lm Millipore filter and loaded onto
the HPLC column as described previously. The fraction collector was set to collect
2 ml fractions every two minutes for ninety minutes. These fractions were then
washed into 25 ml Erlenmeyer flasks, dried on a hot plate (30°C) in a stream of air
and then prepared for assay using the soybean callus bioassay. The remaining 200
J .. d of extract was reduced to dryness in the vial in vacuo on a vacuum centrifuge
and stored at 10°C until required.
RESULTS
For the sake of clarity the following abbreviations have been used in the text, tables
and figures:- Z = zeatin, ZR = ribosylzeatin, ZG = glucosylzeatin,
Ade = adenine, Ado = adenosine, ZOG = zeatin-O-glucoside, Z9G = zeatin-9-
glucoside, tZ = trans-zeatin, DHZ = dihydrozeatin, DHZOG = dihydrozeatin-O
glucoside, tZR = trans-ribosylzeatin, DHZR = dihydroribosylzeatin,
2iP = iso-pentenyladenine, 2iP9G = iso-pentenyladenine-9-glucoside,
iPA = iso -pentenyladenosine.
Soybean callus yield (g/flask) obtained for the kinetin standards (at concentrations
of 0, 1, 10 an 50 J.Lg/l) of each bioassay run are indicated on each graph of
cytokinin-like activity. (See also APPENDIX 1.2).
38
Experiment 1
Paper chromatography
The Rf values of authentic cytokinin markers are superimposed on the figures of
cytokinin-like activity detected in the plant material using the soybean callus
bioassay.
Leaf material (Fig. 1. 1.a, see also APPENDIX 1.3 Table 1)
Two peaks of cytokinin-like activity were detected in the extract of the resistant
material, namely a peak corresponding to ~ 0.6 which co-chromatographed with
Z and ZR, and a peak corresponding to ~ 1.0 which did not co-chromatograph with
any of the markers used. In the extract of the susceptible material, significant
peaks were detected at ~s 0.6, 0.7, 0.8, 0.9 and 1.0. The peak at ~ 0.6 detected
in the resistant material was larger than the corresponding peak in the susceptible
material.
Seed material (Fig. 1.1.b, see also APPENDIX 1.3 Table 1)
In the resistant material, a number of peaks of biological activity were detected,
namely peaks at Rf 0.1, 0.2, 0.4, 0.6, 0.7, 0.8, 0.9 and 1.0. In the susceptible
material slow-moving peaks recovered at ~ 0.2, 0.3 and 0.4 which co
chromatographed with ZG were detected, as was a faster-moving peak which
corresponded to ~s 0.6 and 0.7. The peaks corresponding to ~ 0.3 and 0.4 co
chromatographed with ZG, and the results indicate higher levels of ZG in susceptible
than resistant material. The peaks corresponding to ~ 0.6 and 0.7 in both cultivars
co-chromatographed with ZR and Z, and the results indicate that the resistant line
has higher levels of these two cytokinins than does the susceptible cultivar.
39
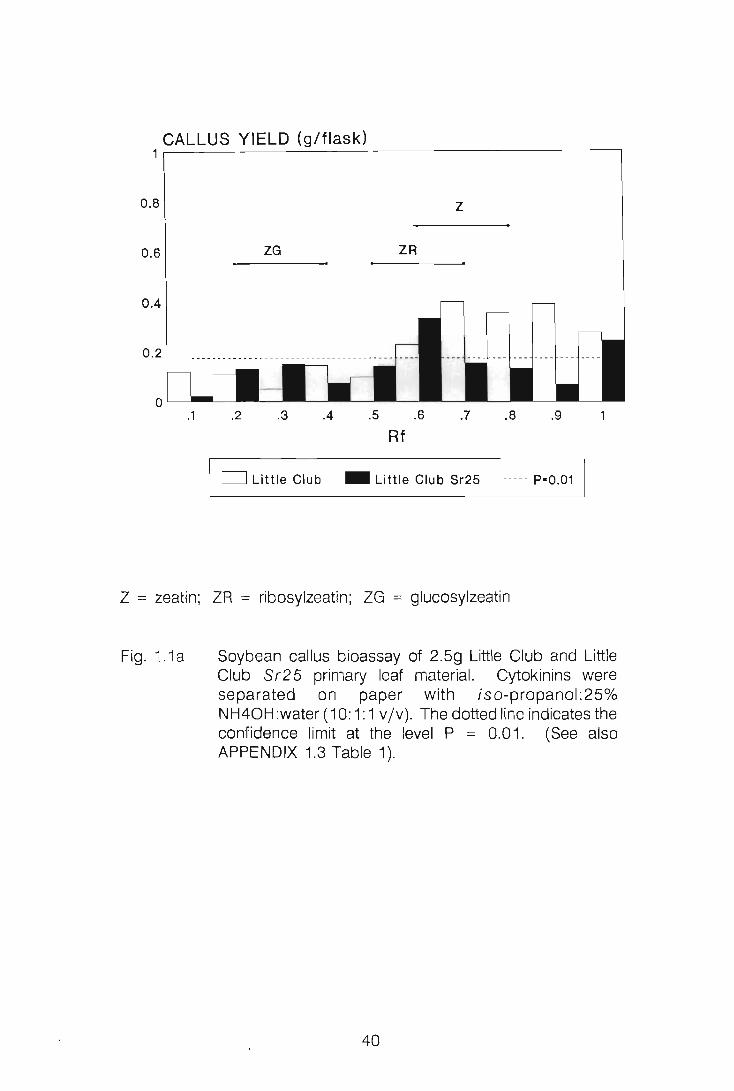
CALLUS YIELD (g/flask) 1~------------~----------------------------'
0.8 Z
0.6 ZG ZR
0.4
0.2
0'---'--.1 .2 .3 .4 .5 .6 .7 .8 .9
Rf
o Little Club _ Little Club Sr25 -- --- P-0.01
Z = zeatin; ZR = ribosylzeatin ; ZG = glucosylzeatin
Fig. 1.1a Soybean callus bioassay of 2.5g Little Club and Little Club 5r25 primary leaf material. Cytokinins were separated on paper with iso-propanol:25% NH40H:water (10: 1: 1 v Iv). The dotted line indicates the confidence limit at the level P = 0.01. (See also APPENDIX 1.3 Table 1).
40
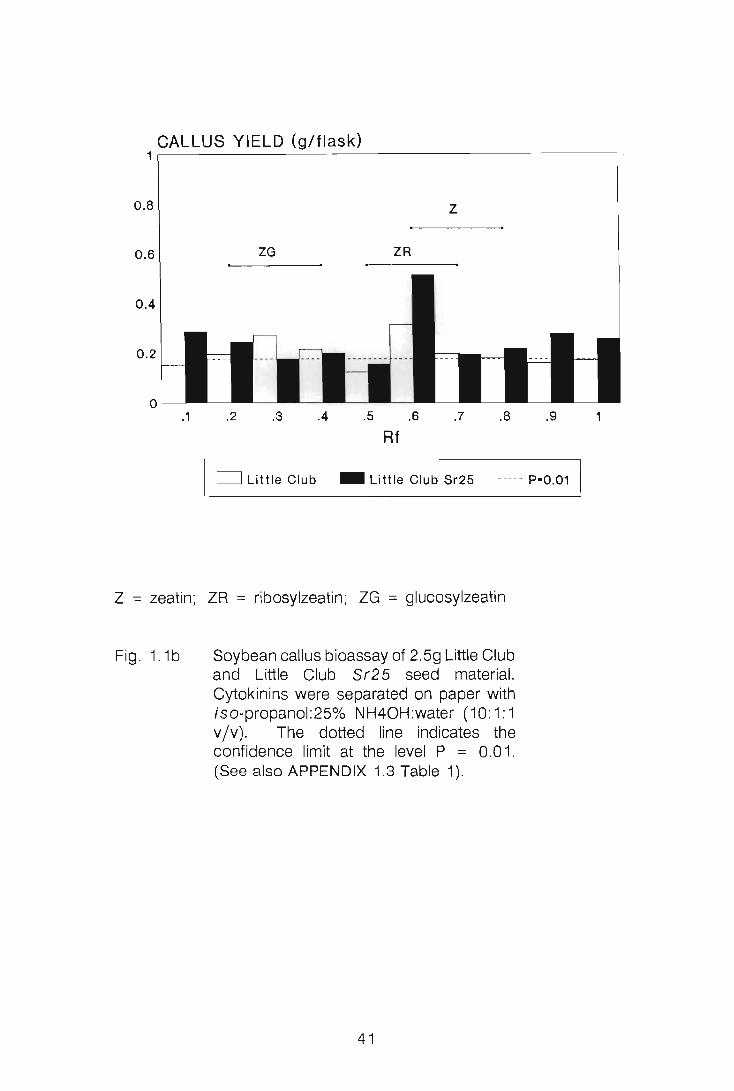
CALLUS YIELD (g/flask) 1 ~------------------------------------------1
0.8 Z
0.6 ZG ZR
0 .4
0.2
o .1 .2 .3 .4 .5 .6 .7 .8 .9
Rf
D Little Club _ Little Club Sr25 --- -- P-0.01
Z = zeatin ; ZR = ribosylzeatin; ZG = glucosylzeatin
Fig. 1.1b Soybean callus bioassay of 2.5g Little Club and Little Club Sr25 seed material. Cytokinins were separated on paper with iso-propanol:25% NH40H:water (10:1:1 v Iv) . The dotted line indicates the confidence limit at the level P = 0.01. (See also APPENDIX 1.3 Table 1).
41
1
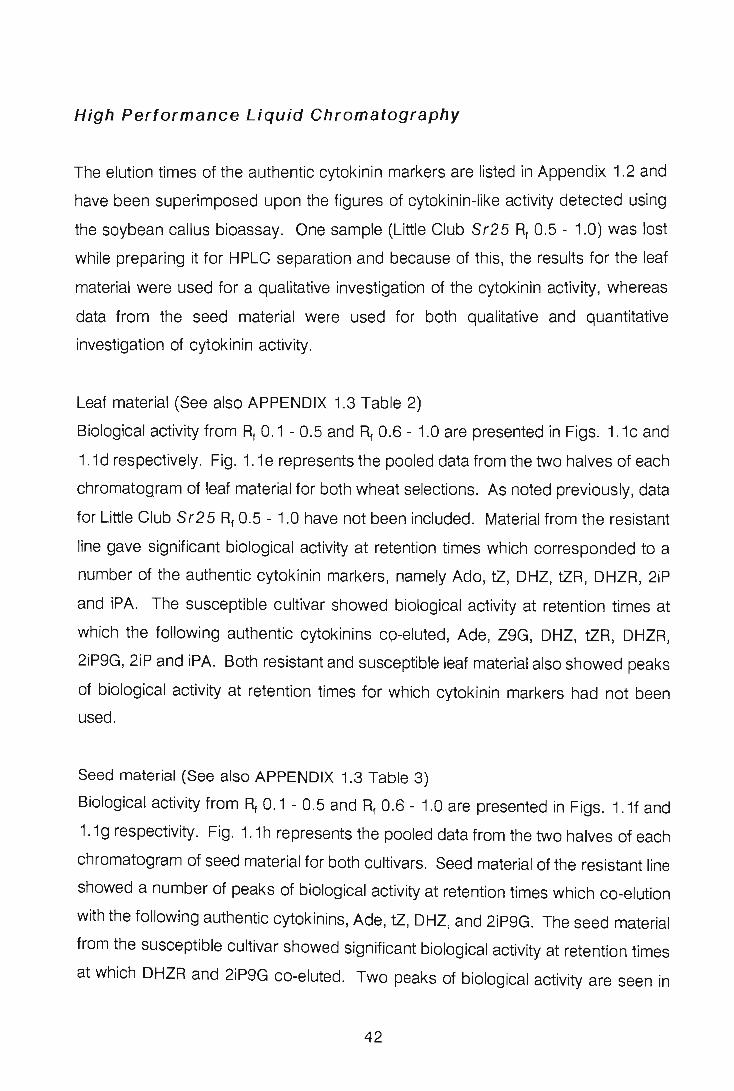
High Performance Liquid Chromatography
The elution times of the authentic cytokinin markers are listed in Appendix 1.2 and
have been superimposed upon the figures of cytokinin-like activity detected using
the soybean callus bioassay. One sample (Little Club Sr25 ~ 0.5 - 1.0) was lost
while preparing it for H PLC separation and because of this, the results for the leaf
material were used for a qualitative investigation of the cytokinin activity, whereas
data from the seed material were used for both qualitative and quantitative
investigation of cytokinin activity.
Leaf material (See also APPENDIX 1.3 Table 2)
Biological activity from ~ 0.1 - 0.5 and ~ 0.6 - 1.0 are presented in Figs. 1.1c and
1.1d respectively. Fig. 1.1e represents the pooled data from the two halves of each
chromatogram of leaf material for both wheat selections. As noted previously, data
for Little Club Sr25 Rf 0.5 - 1.0 have not been included. Material from the resistant
line gave significant biological activity at retention times which corresponded to a
number of the authentic cytokinin markers, namely Ado, tZ, DHZ, tZR, DHZR, 2iP
and iPA. The susceptible cultivar showed biological activity at retention times at
which the following authentic cytokinins co-eluted, Ade, Z9G, DHZ, tZR, DHZR,
2iP9G, 2iP and iPA. Both resistant and susceptible leaf material also showed peaks
of biological activity at retention times for which cytokinin markers had not been
used.
Seed material (See also APPENDIX 1.3 Table 3)
Biological activity from ~ 0.1 - 0.5 and f\ 0.6 - 1.0 are presented in Figs. 1.1f and
1. 1 g respectivity. Fig. 1. 1 h represents the pooled data from the two halves of each
chromatogram of seed material for both cultivars. Seed material of the resistant line
showed a number of peaks of biological activity at retention times which co-elution
with the following authentic cytokinins, Ade, tZ, DHZ, and 2iP9G. The seed material
from the susceptible cultivar showed significant biological activity at retention times
at which DHZR and 2iP9G co-eluted. Two peaks of biological activity are seen in
42
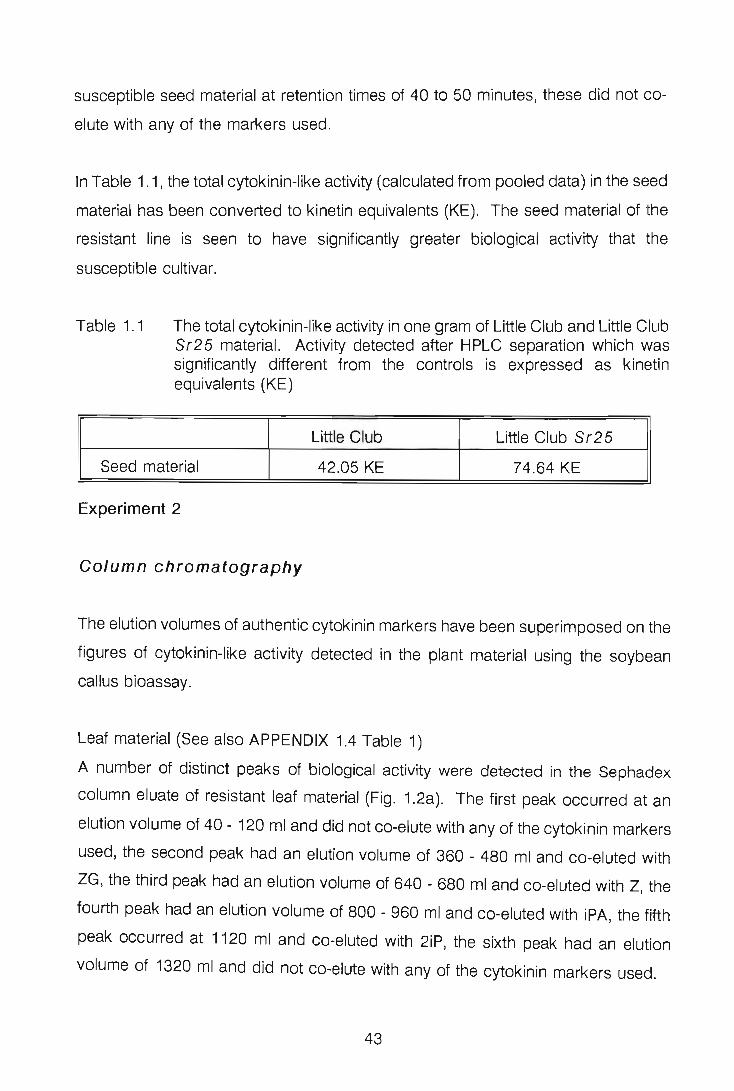
susceptible seed material at retention times of 40 to 50 minutes, these did not co
elute with any of the markers used.
In Table 1.1, the total cytokinin-like activity (calculated from pooled data) in the seed
material has been converted to kinetin equivalents (KE). The seed material of the
resistant line is seen to have significantly greater biological activity that the
susceptible cultivar.
Table 1.1 The total cytokinin-like activity in one gram of Little Club and Little Club Sr25 material. Activity detected after HPLC separation which was significantly different from the controls is expressed as kinetin equivalents (KE)
Little Club Little Club Sr25
Seed material 42.05 KE 74.64 KE
Experiment 2
Column chromatography
The elution volumes of authentic cytokinin markers have been superimposed on the
figures of cytokinin-like activity detected in the plant material using the soybean
callus bioassay.
Leaf material (See also APPENDIX 1.4 Table 1)
A number of distinct peaks of biological activity were detected in the Sephadex
column eluate of resistant leaf material (Fig. 1.2a). The first peak occurred at an
elution volume of 40 - 120 ml and did not co-elute with any of the cytokinin markers
used, the second peak had an elution volume of 360 - 480 ml and co-eluted with
ZG, the third peak had an elution volume of 640 - 680 ml and co-eluted with Z, the
fourth peak had an elution volume of 800 - 960 ml and co-eluted with iPA, the fifth
peak occurred at 1120 ml and co-eluted with 2iP, the sixth peak had an elution
volume of 1320 ml and did not co-elute with any of the cytokinin markers used.
43
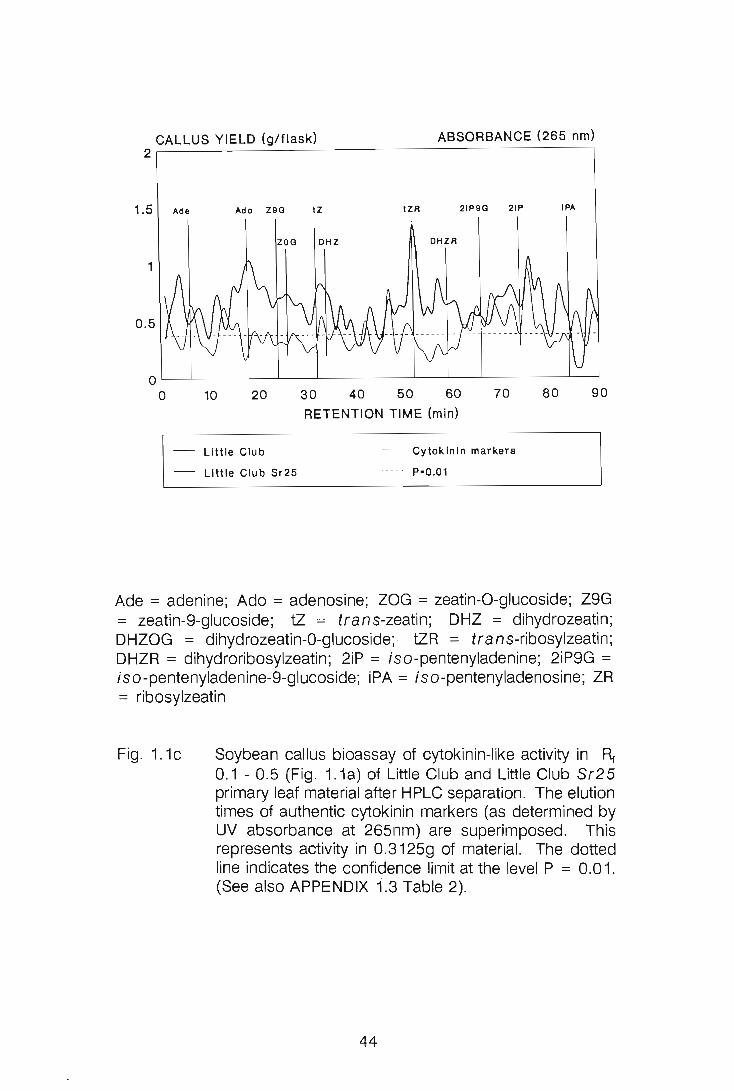
ABSORBANCE (265 nm) CALLUS YIELD (g/flask) 2~--------~------------------------------~
1.5 Ade Ado Z9G IZ IZR 21P9G 21P IPA
ZOG DHZ DHZR
1
0.5
10 20 30 40 50 60 70 80 90 RETENTION TIME (min)
- Little Club Cytokinin markers
P·O.01 - Little Club Sr25
Ade = adenine; Ado = adenosine; ZOG = zeatin-O-glucoside; Z9G = zeatin-9-glucoside; tZ = trans-zeatin; DHZ = dihydrozeatin; DHZOG = dihydrozeatin-O-glucoside; · tZR = trans-ribosylzeatin; DHZR = dihydroribosylzeatin; 2iP = iso-pentenyladenine; 2iP9G = iso-pentenyladenine-9-glucoside; iPA = iso-pentenyladenosine; ZR = ribosylzeatin
Fig. 1.1c Soybean callus bioassay of cytokinin-like activity in F\ 0.1 - 0.5 (Fig. 1.1a) of Little Club and Little Club Sr25 primary leaf material after HPLC separation. The elution times of authentic cytokinin markers (as determined by UV absorbance at 265nm) are superimposed. This represents activity in 0.3125g of material. The dotted line indicates the confidence limit at the level P = 0.01. (See also APPENDIX i .3 Table 2).
44
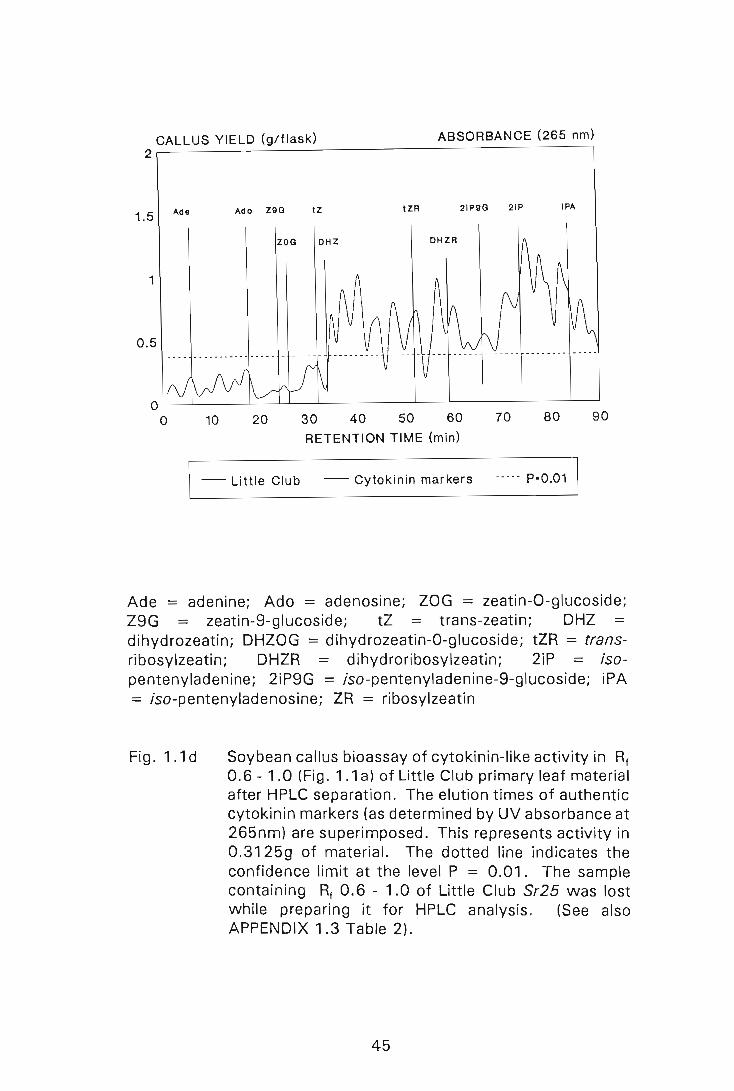
2 ~CA~LL~U~S~Y~IE~L:.:D=----:..(9:::/~f.:..::::la:..=.S.:..:.k)~ ______ A_B_S_O_R_B_A_N_C_E_ (2_6_5_n_mi)
1.5 Ade Ado Z9G IZ IZR 21P9G 21P IPA
1
0.5
10 20 30 40 50 60 70 80 90 RETENTION TIME (min)
- Little Club - Cytokinin markers ----- P-0.01
Ade = adenine; Ado = adenosine; ZOG = zeatin-O-glucoside; Z9G = zeatin-9-glucoside; tZ = trans-zeatin; DHZ dihydrozeatin; DHZOG = dihydrozeatin-O-glucoside; tZR = transribosylzeatin; DHZR = dihydroribosylzeatin; 2iP = isopentenyladenine; 2iP9G = iso-pentenyladenine-9-glucoside; iPA = iso-pentenyladenosine; ZR = ribosylzeatin
Fig. 1.1 d Soybean callus bioassay of cytokinin-like activity in Rf
0.6 - 1.0 (Fig. 1.1 a) of Little Club primary leaf material after HPLC separation. The elution times of authentic cytokinin markers (as determined by UV absorbance at 265nm) are superimposed. This represents activity in 0.3125g of material. The dotted line indicates the confidence limit at the level P = 0.01. The sample containing Rf 0.6 - 1.0 of Little Club Sr25 was lost while preparing it for HPLC analysis. (See also APPENDIX 1.3 Table 2).
45
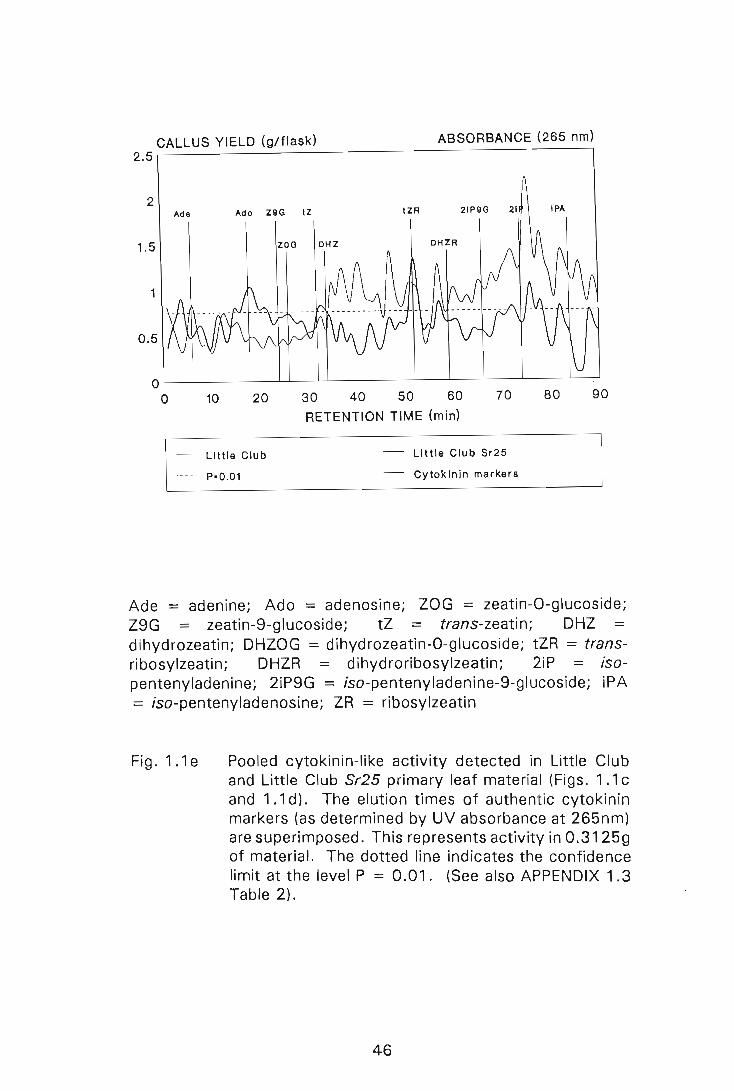
2.5 ~C~A~LL~U~S~Y~IE~L~D~(9~/~fl=aS~k~) _____________ A_B_S_O_R_B_A_N_C_E_(_2_6_5_n~m)
2 Ade Ado Z9G tZ tZR 21P9G IPA
1.5 ZOG DHZ DHZR
1
0.5
OL--L ____ -L __ Ll __ Ll ________ ~ __ L-~ __ ~ ____ ~~
o 10 20 30 40 50 60 70 80 90
Little Club
P·O .01
RETENTION TIME (min)
Little Club Sr25
Cytokinin markers
Ade = adenine; Ado = adenosine; ZOG = zeatin-O-glucoside; Z9G = zeatin-9-glucoside; tZ = trans-zeatin; DHZ dihydrozeatin; DHZOG = dihydrozeatin-O-glucoside; tZR = transribosylzeatin; DHZR = dihydroribosylzeatin; 2iP isopentenyladenine; 2iP9G = iso-pentenyladenine-9-glucoside; iPA = iso-pentenyladenosine; ZR = ribosylzeatin
Fig.1.1e Pooled cytokinin-like activity detected in Little Club and Little Club Sr25 primary leaf material (Figs. 1.1 c and 1.1 d). The elution times of authentic cytokinin markers (as determined by UV absorbance at 265nm) are superimposed. This represents activity in 0.3125g of material. The dotted line indicates the confidence limit at the level P = 0.01. (See also APPENDIX 1.3 Table 2).
46
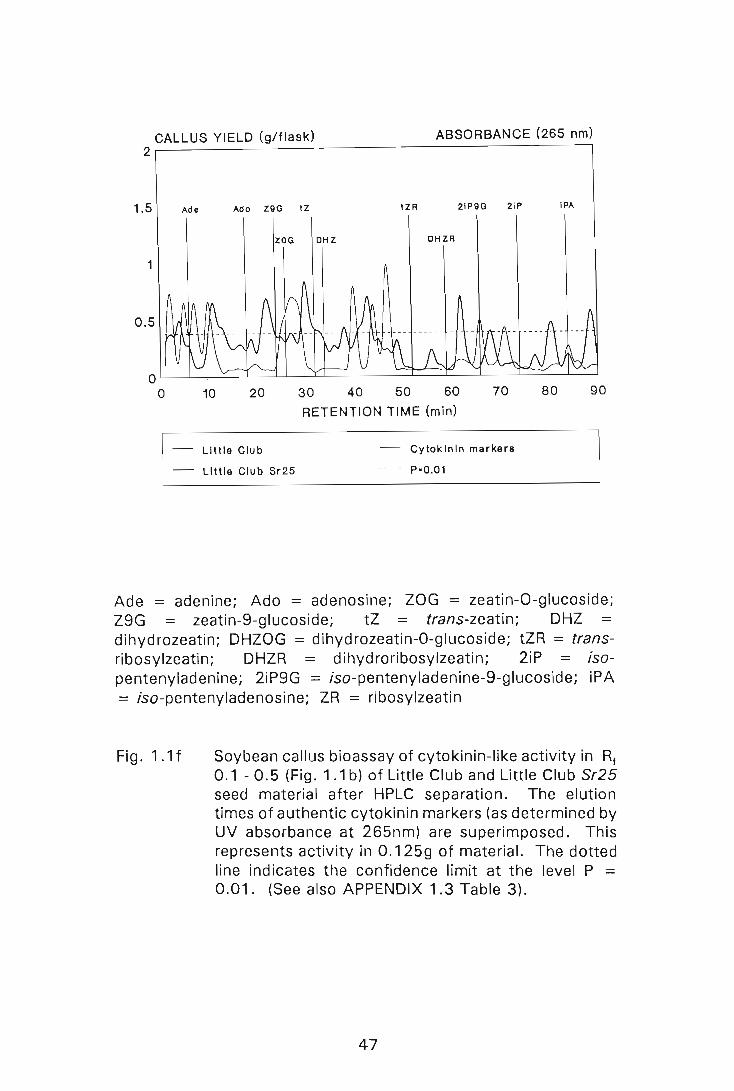
ABSORBANCE (265 nm) CALLUS YIELD (g/flask) 2~--------~~------------------------------~
1.5 Ade
1
0.5
Ado Z9G tZ tZR 21P9G 21P
ZOG DHZ DHZR
10 20 30 40 50 60 70
RETENTION TIME (min)
Little Club
Little Club 5r25
Cytokinin markers
P·O.01
IPA
80 90
Ade = adenine; Ado = adenosine; ZOG = zeatin-O-glucoside; Z9G = zeatin-9-glucoside; tZ = trans-zeatin; DHZ = dihydrozeatin; DHZOG = dihydrozeatin-O-glucoside; tZR = transribosylzeatin; DHZR = dihydroribosylzeatin; 2iP = isopentenyladenine; 2iP9G = iso-pentenyladenine-9-glucoside; iPA = iso-pentenyladenosine; ZR = ribosylzeatin
Fig. 1.1f Soybean callus bioassay of cytokinin-like activity in Rf 0.1 - 0.5 (Fig. 1.1 b) of Little Club and Little Club Sr25 seed material after HPLC separation. The elution times of authentic cytokinin markers (as determined by UV absorbance at 265nm) are superimposed. This represents activity in 0.125g of material. The dotted line indicates the confidence limit at the level P = 0.01. (See also APPENDIX 1.3 Table 3).
47
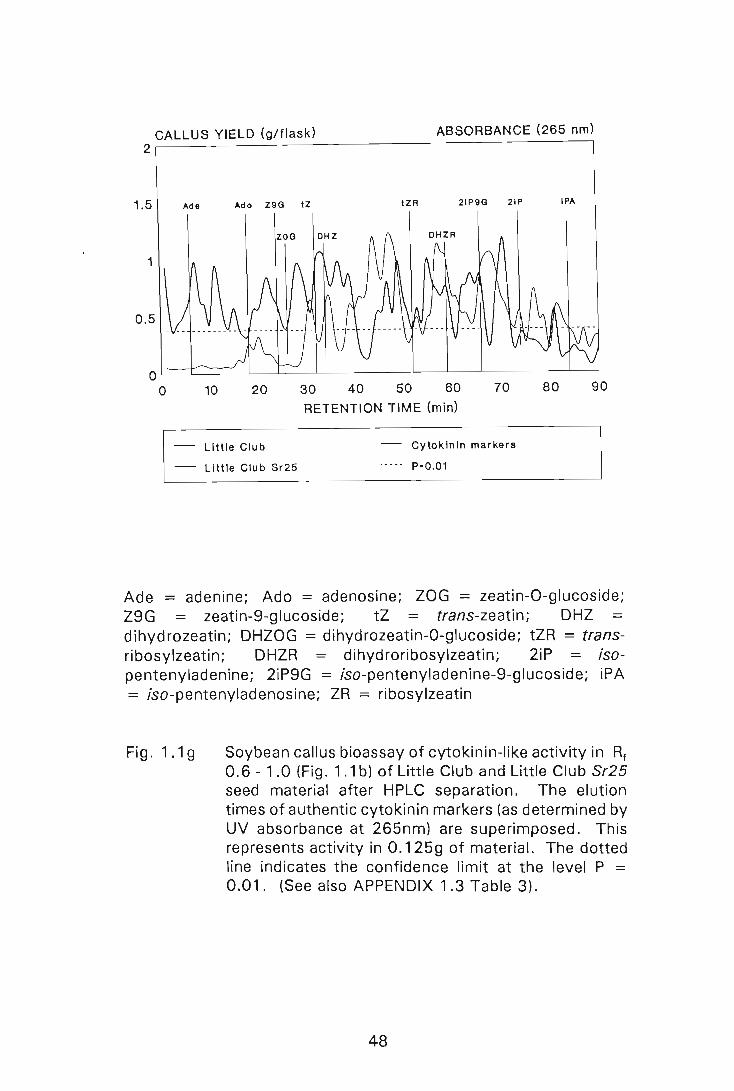
ABSORBANCE (265 nm) CALLUS YIELD (g/flask) 2~~~----~------------------------------1
1.5 Ade
1
0.5
Ado Z9G IZ IZR 21P9G 21P
10 20 30 40 50 60 70
RETENTION TIME (min)
Little Club
Little Club Sr25
Cytokinin markers
P·O.01
IPA
80 90
Ade = adenine; Ado = adenosine; ZOG = zeatin-O-glucoside; Z9G = zeatin-9-glucoside; tZ = trans-zeatin; DHZ = dihydrozeatin; DHZOG = dihydrozeatin-O-glucoside; tZR = transribosylzeatin; DHZR = dihydroribosylzeatin; 2iP = isopentenyladenine; 2iP9G = iso-pentenyladenine-9-glucoside; iPA = iso-pentenyladenosine; ZR = ribosylzeatin
Fig. 1.1 9 Soybean callus bioassay of cytokinin-like activity in Rf
0.6 - 1.0 (Fig. 1.1 b) of Little Club and Little Club Sr25 seed material after HPLC separation. The elution times of authentic cytokinin markers (as determined by UV absorbance at 265nm) are superimposed. This represents activity in 0.125g of material. The dotted line indicates the confidence limit at the level P = 0.01. (See also APPENDIX 1.3 Table 3).
48
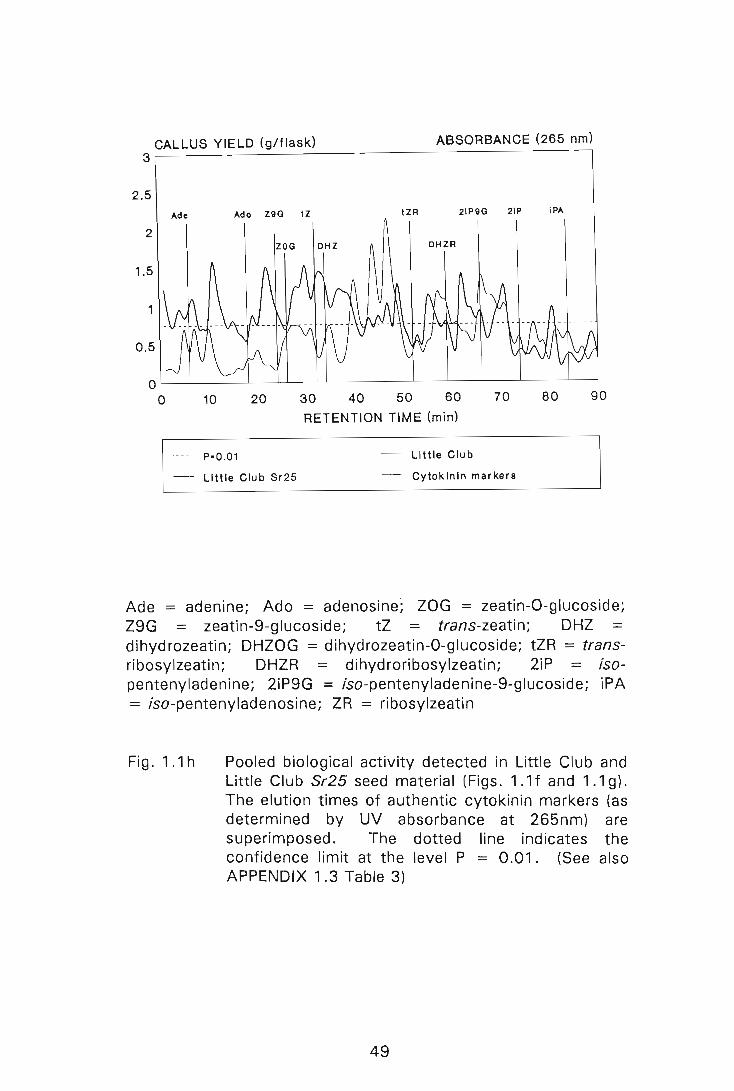
ABSORBANCE (265 nm) CALLUS YIELD (g/flask) 3~~~----~----------------------------~
2.5
Ade Ado Z9G IZ IZR 21P9G 21P IPA
2 ZOG DHZ DHZR
1.5
1
0.5
10 20 30 40 50 60 70 80 90
RETENTION TIME (min)
P·O.01 Little Club
Little Club Sr25 Cytokinin markers
Ade = adenine; Ado = adenosine; ZOG = zeatin-O-glucoside; Z9G = zeatin-9-glucoside; tZ trans-zeatin; DHZ =
dihydrozeatin; DHZOG = dihydrozeatin-O-glucoside; tZR = transribosylzeatin; DHZR = dihydroribosylzeatin; 2iP = isopentenyladenine; 2iP9G = iso-pentenyladenine-9-glucoside; iPA = iso-pentenyladenosine; ZR = ribosylzeatin
Fig. 1.1 h Pooled biological activity detected in Little Club and Little Club Sr25 seed material (Figs. 1.1f and 1.1 g). The elution times of authentic cytokinin markers (as determined by UV absorbance at 265nm) are superimposed. The dotted line indicates the confidence limit at the level P = 0.01. (See also APPENDIX 1.3 Table 3)
49
Fewer significant peaks of activity were detected in the Sephadex column eluate of
the susceptible leaf material (Fig. 1.2a). The first peak occurred at an elution
volume of 40 - 120 ml, the second peak had an elution volume of 1000 ml and co
eluted with iPA, the third peak had an elution volume of 1160 ml and co-eluted with
2iP, the fourth peak had an elution volume of 1400 ml. The first and fourth peaks
of biological activity detected in this material did not co-elute with any of the markers
used.
Seed material (See also APPENDIX 1.4 Table2)
Three peaks of biological activity were detected in resistant seed material (Fig.
1.2b). The first peak had an elution volume of 480 ml and co-eluted with ZR, the
second peak and third peaks had elution volumes of 1000 - 1040 ml and 1280 ml
respectively, and did not co-elute with any of the markers used.
Five peaks were detected in susceptible seed material (Fig. 1.2b). The first peak
had an elution volume of 80 - 120 ml but did not co-elute with any of the cytokinin
markers used, the second peak had an elution volume of 320 ml and co-eluted with
ZG, the third peak had an elution volume of 520 -600 ml and co-eluted with ZR, the
fourth peak had an elution volume of 680 - 760 ml and co-eluted with Z, the fifth
peak had an elution volume of 1200 -1280 ml and did not co-eluted with any of the
markers used.
To obtain a better understanding of the role of cytokinins in resistance, the levels
of cytokinin activity in leaf and seed material were considered and were expressed
as kinetin equivalents (KE). The information is presented in Table 1.2. The results
indicate that the leaf material of the resistant line has a greater level of cytokinin
activity than the susceptible cultivar, however, the seed material of the susceptible
cultivar has higher levels of cytokinin activity than the resistant line.
50
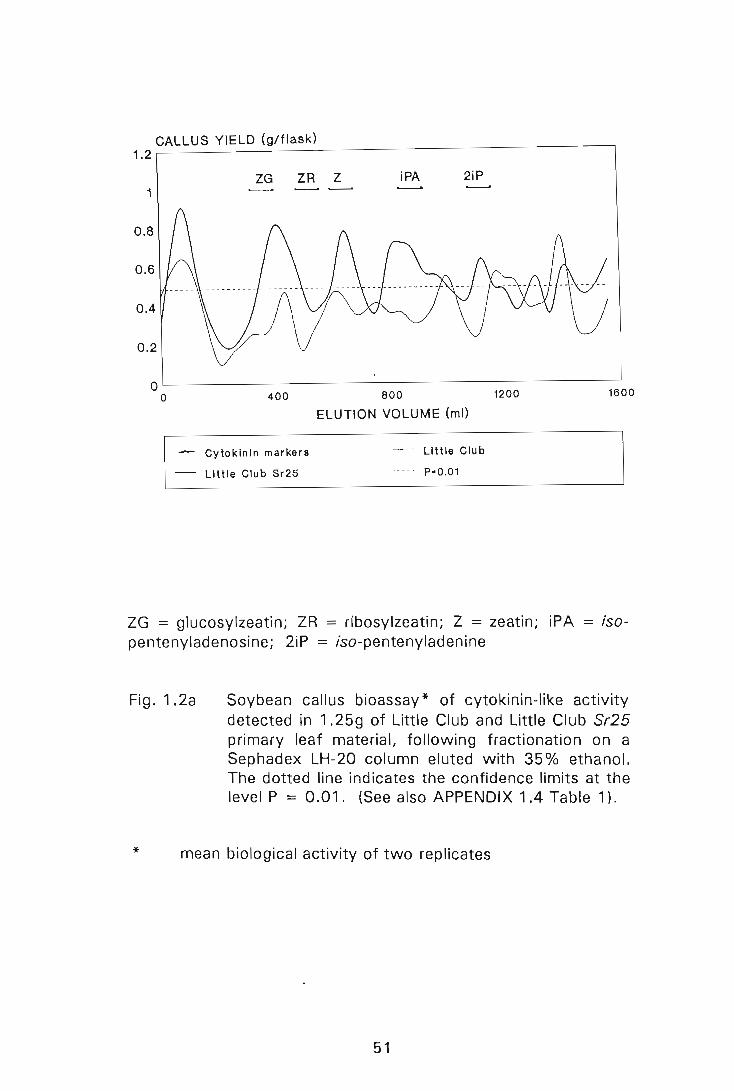
1.2 ~CA~L~L~U~S~Y~IE~L=D~(9~/~fl~aS~k~) ______________________________ 1
ZG ZR Z iPA 2iP 1
0.8
0.6
0.4
0 .2
o L-----------------------------------------~ o 400 800 1200 1600
Cytokinin markers
Little Club Sr25
ELUTION VOLUME (m!)
Little Club
P·0.01
ZG = glucosylzeatin; ZR = ribosylzeatin; Z = zeatin; iPA = isopentenyladenosine; 2iP = iso-pentenyladenine
Fig. 1.2a Soybean callus bioassay * of cytokinin-like activity detected in 1.25g of Little Club and Little Club Sr25 primary leaf material, following fractionation on a Sephadex LH-20 column eluted with 35% ethanol. The dotted line indicates the confidence limits at the level P = 0.01. (See also APPENDIX 1.4 Table 1).
* mean biological activity of two replicates
51
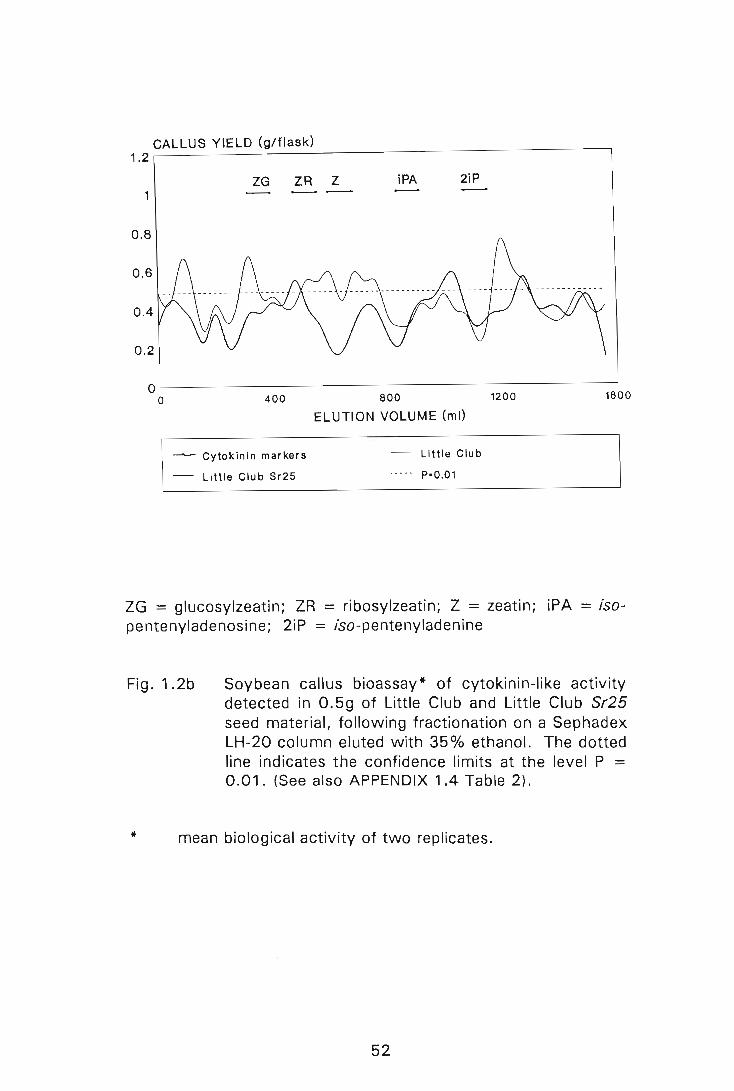
1.2 ~C~A~L~LU~S~Y~I=E=LD~(~g/~f~la~S_k~) ______________________________ ~
ZG ZR Z iPA 2iP 1
0.8
0.6
0.4
oL---------------------------------------------~ o 400 800 1200 1600
- Cytokinin markers
- Little Club Sr25
ELUTION VOLUME (m\)
Little Club
P·0.01
ZG = glucosylzeatin; ZR = ribosylzeatin; Z = zeatin; iPA = isopentenyladenosine; 2iP = iso-pentenyladenine
Fig. 1.2b Soybean callus bioassay* of cytokinin-like activity detected in 0.5g of Little Club and Little Club Sr25 seed material, following fractionation on a Sephadex LH-20 column eluted with 35 % ethanol. The dotted line indicates the confidence limits at the level P = 0.01. (See also APPENDIX 1.4 Table 2).
* mean biological activity of two replicates.
52
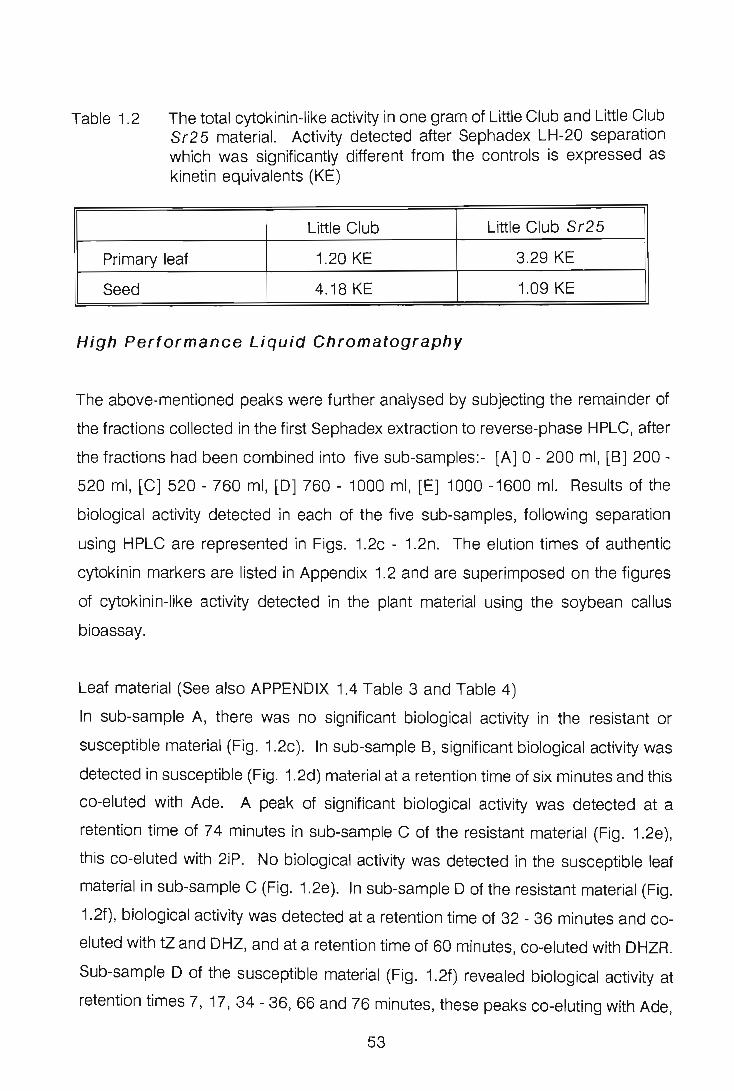
Table 1.2 The total cytokinin-like activity in one gram of Little Club and Little C~ub Sr25 material. Activity detected after Sephadex LH-20 separation which was significantly different from the controls is expressed as kinetin equivalents (KE)
Little Club Little Club Sr25
Primary leaf 1.20 KE 3.29 KE
Seed 4.18 KE 1.09 KE
High Performance Liquid Chromatography
The above-mentioned peaks were further analysed by subjecting the remainder of
the fractions collected in the first Sephadex extraction to reverse-phase HPLC, after
the fractions had been combined into five sub-samples:- [A] 0 - 200 ml, [8] 200 -
520 ml, [C] 520 - 760 ml, [0] 760 - 1000 ml, [E] 1000 -1600 ml. Results of the
biological activity detected in each of the five sub-samples, following separation
using HPLC are represented in Figs. 1.2c - 1.2n. The elution times of authentic
cytokinin markers are listed in Appendix 1.2 and are superimposed on the figures
of cytokinin-like activity detected in the plant material using the soybean callus
bioassay.
Leaf material (See also APPENDIX 1.4 Table 3 and Table 4)
In sub-sample A, there was no significant biological activity in the resistant or
susceptible material (Fig. 1.2c). In sub-sample B, significant biological activity was
detected in susceptible (Fig. 1.2d) material at a retention time of six minutes and this
co-eluted with Ade. A peak of significant biological activity was detected at a
retention time of 74 minutes in sub-sample C of the resistant material (Fig. 1.2e),
this co-eluted with 2iP. No biological activity was detected in the susceptible leaf
material in sub-sample C (Fig. 1.2e). In sub-sample 0 of the resistant material (Fig.
1.2f), biological activity was detected at a retention time of 32 - 36 minutes and co
eluted with tZ and DHZ, and at a retention time of 60 minutes, co-eluted with DHZR.
Sub-sample 0 of the susceptible material (Fig. 1.2f) revealed biological activity at
retention times 7, 17, 34 - 36,66 and 76 minutes, these peaks co-eluting with Ade,
53
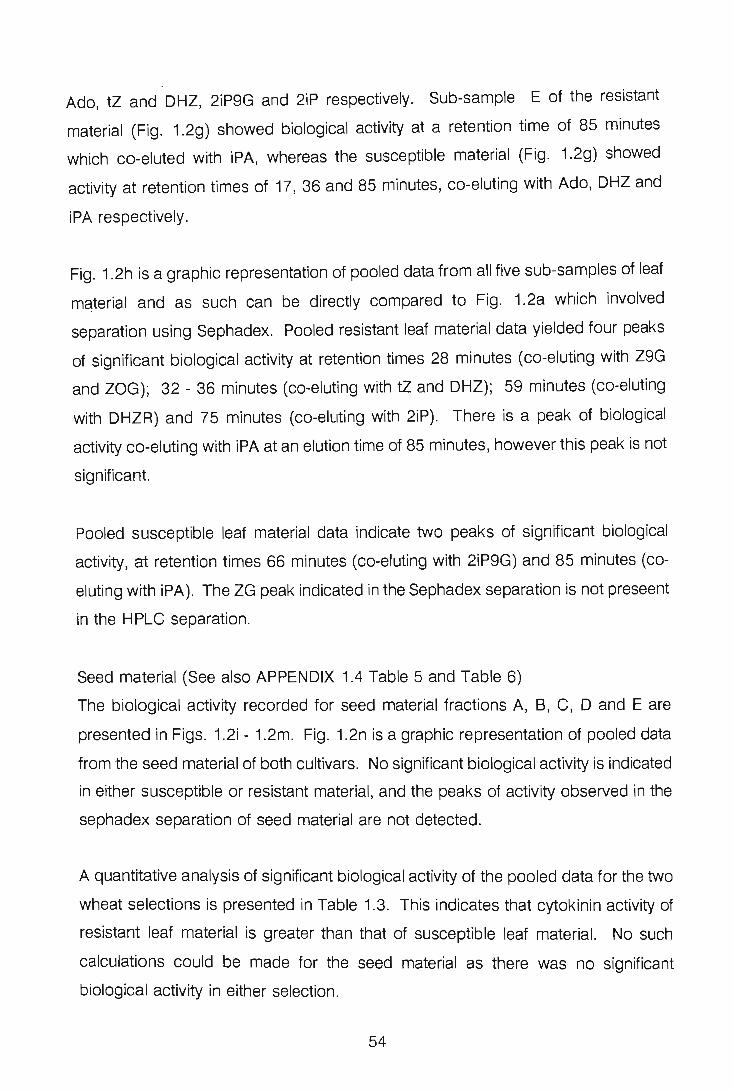
Ado, tZ and DHZ, 2iP9G and 2iP respectively. Sub-sample E of the resistant
material (Fig. 1.2g) showed biological activity at a retention time of 85 minutes
which co-eluted with iPA, whereas the susceptible material (Fig. 1.2g) showed
activity at retention times of 17, 36 and 85 minutes, co-eluting with Ado, DHZ and
iPA respectively.
Fig. 1.2h is a graphic representation of pooled data from all five sub-samples of leaf
material and as such can be directly compared to Fig. 1.2a which involved
separation using Sephadex. Pooled resistant leaf material data yielded four peaks
of significant biological activity at retention times 28 minutes (co-eluting with Z9G
and ZOG); 32 - 36 minutes (co-eluting with tZ and DHZ); 59 minutes (co-eluting
with DHZR) and 75 minutes (co-eluting with 2iP). There is a peak of biological
activity co-eluting with iPA at an elution time of 85 minutes, however this peak is not
significant.
Pooled susceptible leaf material data indicate two peaks of significant biological
activity, at retention times 66 minutes (co-eluting with 2iP9G) and 85 minutes (co
eluting with iPA). The ZG peak indicated in the Sephadex separation is not preseent
in the HPLC separation.
Seed material (See also APPENDIX 1.4 Table 5 and Table 6)
The biological activity recorded for seed material fractions A, B, C, D and E are
presented in Figs. 1.2i - 1.2m. Fig. 1.2n is a graphic representation of pooled data
from the seed material of both cultivars. No significant biological activity is indicated
in either susceptible or resistant material, and the peaks of activity observed in the
sephadex separation of seed material are not detected.
A quantitative analysis of significant biological activity of the pooled data for the two
wheat selections is presented in Table 1.3. This indicates that cytokinin activity of
resistant leaf material is greater than that of susceptible leaf material. No such
calculations could be made for the seed material as there was no significant
biological activity in either selection.
54
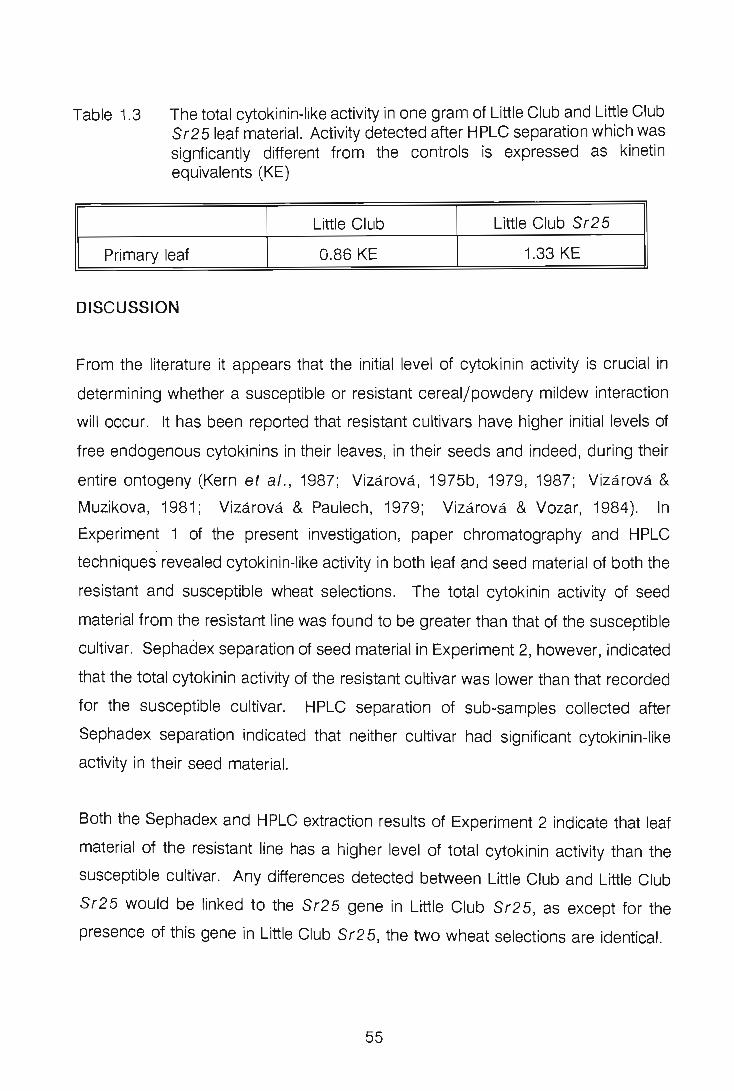
Table 1.3 The total cytokinin-like activity in one gram of Little Club and Little Club Sr25 leaf material. Activity detected after HPLC separation which was signficantly different from the controls is expressed as kinetin equivalents (KE)
Little Club Little Club Sr25
Primary leaf 0.86 KE 1.33 KE
DISCUSSION
From the literature it appears that the initial level of cytokinin activity is crucial in
determining whether a susceptible or resistant cereal/powdery mildew interaction
will occur. It has been reported that resistant cultivars have higher initial levels of
free endogenous cytokinins in their leaves, in their seeds and indeed, during their
entire ontogeny (Kern ef aI., 1987; Vizarova, 1975b, 1979, 1987; Vizeirovei &
Muzikova, 1981; Vizeirova & Paulech, 1979; Vizarova & Vozar, 1984). In
Experiment 1 of the present investigation, paper chromatography and HPLC
techniques revealed cytokinin-like activity in both leaf and seed material of both the
resistant and susceptible wheat selections. The total cytokinin activity of seed
material from the resistant line was found to be greater than that of the susceptible
cultivar. Sephadex separation of seed material in Experiment 2, however, indicated
that the total cytokinin activity of the resistant cultivar was lower than that recorded
for the susceptible cultivar. HPLC separation of sub-samples collected after
Sephadex separation indicated that neither cultivar had significant cytokinin-like
activity in their seed material.
Both the Sephadex and HPLC extraction results of Experiment 2 indicate that leaf
material of the resistant line has a higher level of total cytokinin activity than the
susceptible cultivar. Any differences detected between Little Club and Little Club
Sr25 would be linked to the Sr25 gene in Little Club Sr25, as except for the
presence of this gene in Little Club Sr25, the two wheat selections are identical.
55
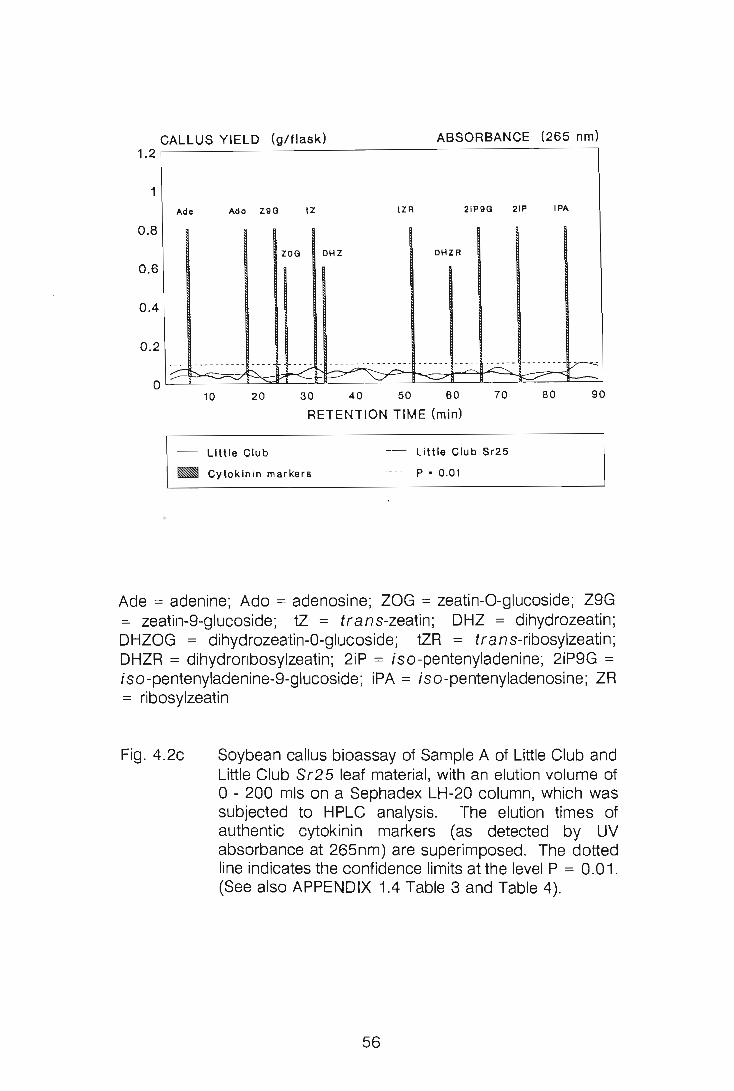
ABSORBANCE (265 nm) CALLUS YIELD (g/flask) 1.2.-----------~------------------------------~
1
Ade Ado Z9G IZ IZR 21P9G 21P IPA
0.8
ZOG DHZ DHZR
0.6
0.4
0.2 - ---------------- ------ ----- ------ -- -- -----v--= ~ ---------- ~ --
o - ~ ~- ~ /">0 ~ ~
.7 "--"" ./ t----
10 20 30 40 50 60 70 80 90
RETENTION TIME (min)
- LIttle Club LIttle Club Sr25
P • 0 .01 _ Cytokinin markers
Ade = adenine; Ado = adenosine; ZOG = zeatin-O-glucoside; Z9G = zeatin-9-glucoside; tZ = trans-zeatin; DHZ = dihydrozeatin; DHZOG = dihydrozeatin-O-glucoside; tZR = trans-ribosylzeatin; DHZR = dihydroribosylzeatin; 2iP = iso -pentenyladenine; 2iP9G =
iso-pentenyladenine-9-glucoside; iPA = iso-pentenyladenosine; ZR = ribosylzeatin
Fig.4.2c Soybean callus bioassay of Sample A of Little Club and Little Club Sr25 leaf material, with an elution volume of o - 200 mls on a Sephadex LH-20 column, which was subjected to HPLC analysis. The elution times of authentic cytokinin markers (as detected by UV absorbance at 265nm) are superimposed. The dotted line indicates the confidence limits at the level P = 0.01. (See also APPENDIX 1.4 Table 3 and Table 4).
56
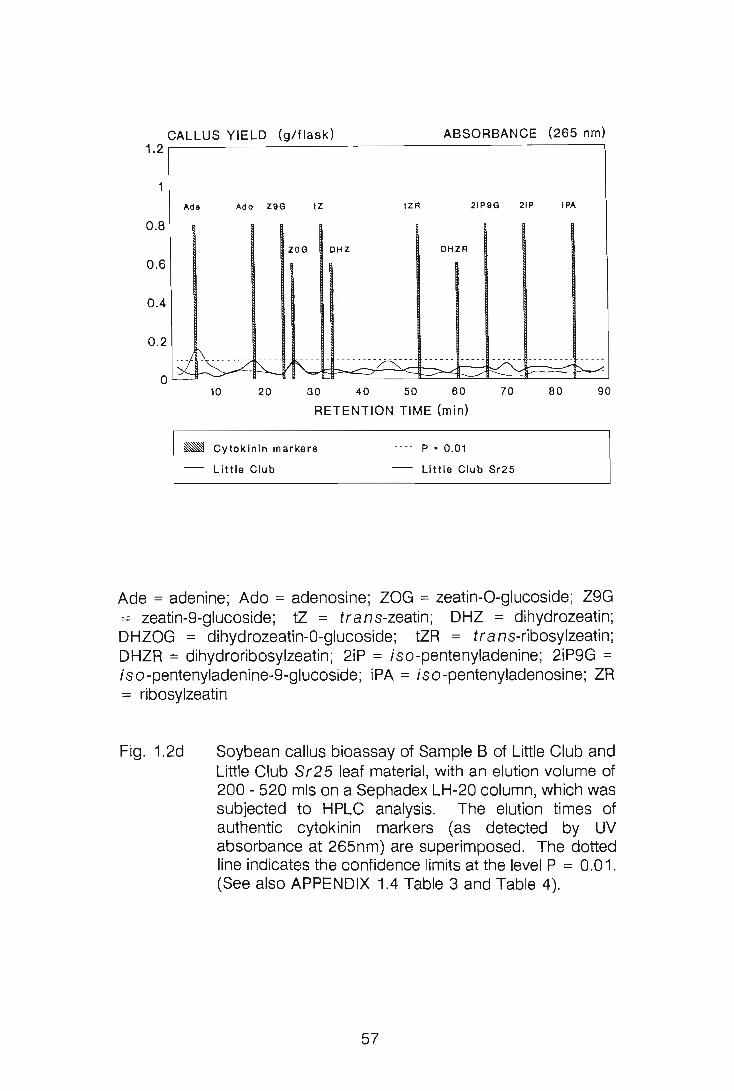
CALLUS YIELD (g/flask) 1 .2~----------~-------------------------------'
ABSORBANCE (265 nm)
Ade Ado Z9G tZ t ZR 21P9G 21P IPA
0.8
ZOG DH Z DHZR
0.6
0.4
0.2
o :;!. ~---2 r\:-~ V , --- - --------~-- - --~ --;~ -------- - ---~
10 20 30 40 50 60 70 80 90
RETENTION TIME (min)
_ Cytokinin markers
- Little Club
---- p. 0.01
- Little Club Sr25
Ade = adenine; Ado = adenosine; ZOG = zeatin-O-glucoside; Z9G = zeatin-9-glucoside; tZ = trans-zeatin; DHZ = dihydrozeatin; DHZOG = dihydrozeatin-O-glucoside; tZR = trans-ribosylzeatin; DHZR = dihydroribosylzeatin; 2iP = iso-pentenyladenine; 2iP9G = iso-pentenyladenine-9-glucoside; iPA = iso-pentenyladenosine; ZR = ribosylzeatin
Fig. 1.2d Soybean callus bioassay of Sample B of Little Club and Little Club Sr25 leaf material, with an elution volume of 200 - 520 mls on a Sephadex LH-20 column, which was subjected to HPLC analysis. The elution times of authentic cytokinin markers (as detected by UV absorbance at 265nm) are superimposed. The dotted line indicates the confidence limits at the level P = 0.01 . (See also APPENDIX 1.4 Table 3 and Table 4).
57
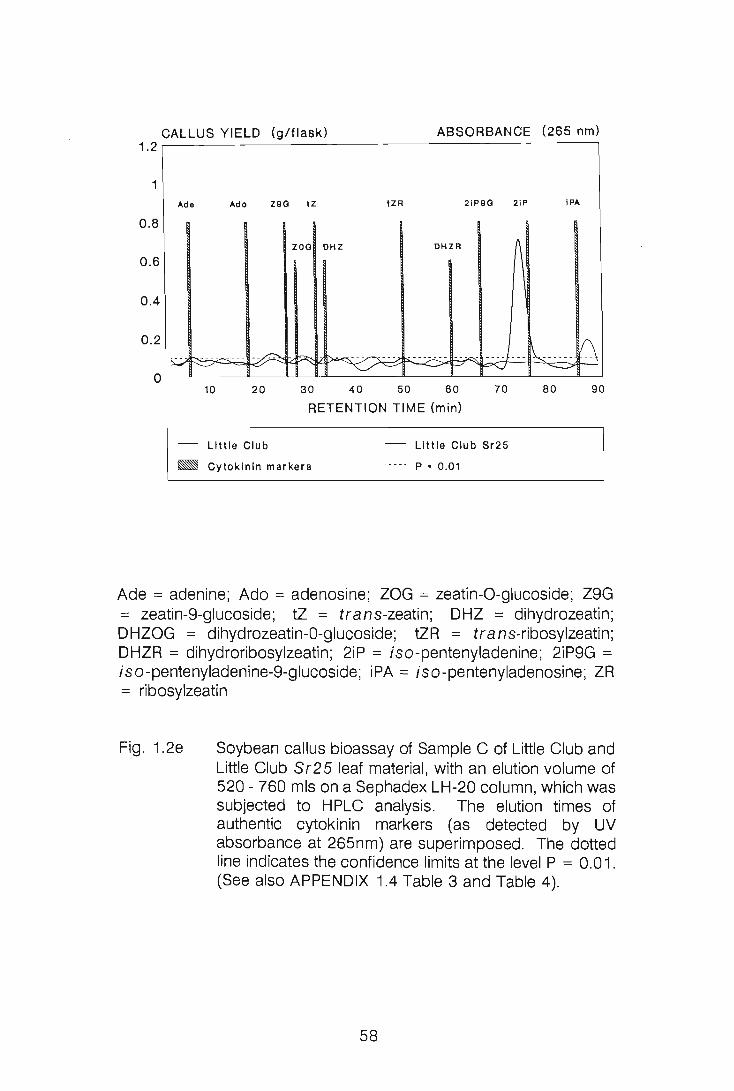
1.2
1
0.8
0.6
0.4
0.2
o
CALLUS YIELD (g/flask) ABSORBANCE (265 nm)
Ade Ado Z9G IZ IZR 21P9G
ZOG CHZ CHZR
I;':;" - --- --- - -~ I=-
~3 -- - - ---- --~- - ---
'----' - F"'"'V
10 20 30 40 50 60 70
RETENTION TIME (min)
- Little Club
_ Cytokinin markers
Little Club Sr25
P • 0.01
21P IPA
A
--- ~---- - - ~ -80 90
Ade = adenine; Ado = adenosine; ZaG = zeatin-a-glucoside; Z9G = zeatin-9-glucoside; tZ = trans-zeatin; DHZ = dihydrozeatin; DHZOG = dihydrozeatin-O-glucoside; tZR = trans-ribosylzeatin; DHZR = dihydroribosylzeatin; 2iP = iso-pentenyladenine; 2iP9G = iso-pentenyladenine-9-glucoside; iPA = iso-pentenyladenosine; ZR = ribosylzeatin
Fig. 1.2e Soybean callus bioassay of Sample C of Little Club and Little Club Sr25 leaf material, with an elution volume of 520 - 760 mls on a Sephadex LH-20 column, which was subjected to HPLC analysis. The elution times of authentic cytokinin markers (as detected by UV absorbance at 265nm) are superimposed. The dotted line indicates the confidence limits at the level P = 0.01. (See also APPENDIX 1.4 Table 3 and Table 4).
58
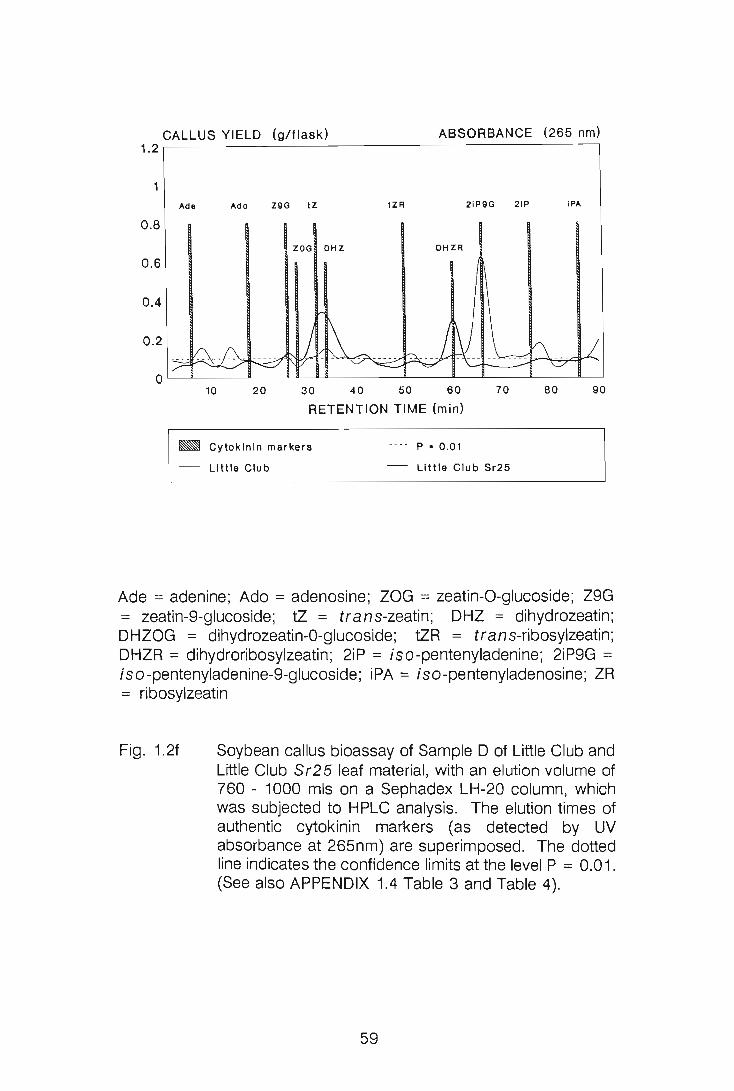
CALLUS YIELD (g/flask) ABSORBANCE (265 nm) 1.2~------------------------------------------~
0 .8
0.6
0.4
0.2
0
"de -"do Z9G t Z tZR 21P9G 21P
ZOG DHZ DHZR
10 20 30 40 50 60 70
RETENTION TIME (min)
P • 0 .01 _ Cytokinin markers
- Little Club Little Club Sr25
I P"
80 90
Ade = adenine; Ado = adenosine; ZOG = zeatin-O-glucoside; Z9G = zeatin-9-glucoside; tZ = trans-zeatin; DHZ = dihydrozeatin; DHZOG = dihydrozeatin-O-glucoside; tZR = trans-ribosylzeatin; DHZR = dihydroribosylzeatin; 2iP = iso-pentenyladenine; 2iP9G = iso-pentenyladenine-9-glucoside; iPA = iso-pentenyladenosine; ZR = ribosylzeatin
Fig. 1.2f Soybean callus bioassay of Sample D of Little Club and Little Club Sr25 leaf material, with an elution volume of 760 - 1000 mls on a Sephadex LH-20 column, which was subjected to H PLC analysis. The elution times of authentic cytokinin markers (as detected by UV absorbance at 265nm) are superimposed. The dotted line indicates the confidence limits at the level P = 0.01. (See also APPENDIX 1.4 Table 3 and Table 4).
59
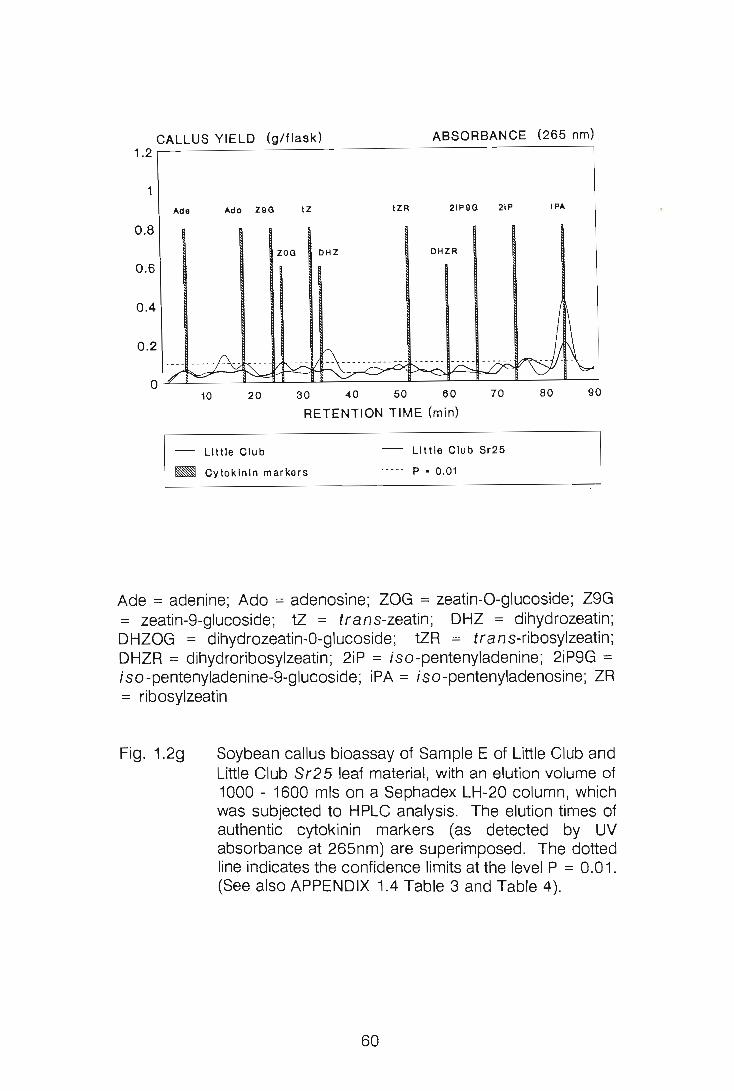
ABSORBANCE (265 nm) CALLUS YIELD (g/flask) 1.2~----------~------------------------------~
1
0.8
0.6
0.4
0.2
Ade Ado Z9G IZ IZR 21P9G 21P
ZOG DHZ DHZR
10 20 30 40 50 60 70
RETENTION TIME (min)
- Little Club
_ Cytokinin markers
Little Club Sr25
P • 0 .01
IPA
80
Ade = adenine; Ado = adenosine; ZOG = zeatin-O-glucoside; Z9G = zeatin-9-glucoside; tZ = trans-zeatin; DHZ = dihydrozeatin; DHZOG = dihydrozeatin-O-glucoside; tZR = trans-ribosylzeatin; DHZR = dihydroribosylzeatin; 2iP = iso-pentenyladenine; 2iP9G = iso-pentenyladenine-9-glucoside; iPA = iso-pentenyladenosine; ZR = ribosylzeatin
Fig. 1.2g Soybean callus bioassay of Sample E of Little Club and Little Club Sr25 leaf material, with an elution volume of 1000 - 1600 mls on a Sephadex LH-20 column, which was subjected to H PLC analysis. The elution times of authentic cytokinin markers (as detected by UV absorbance at 265nm) are superimposed. The dotted line indicates the confidence limits at the level P = 0.01. (See also APPENDIX 1.4 Table 3 and Table 4).
60
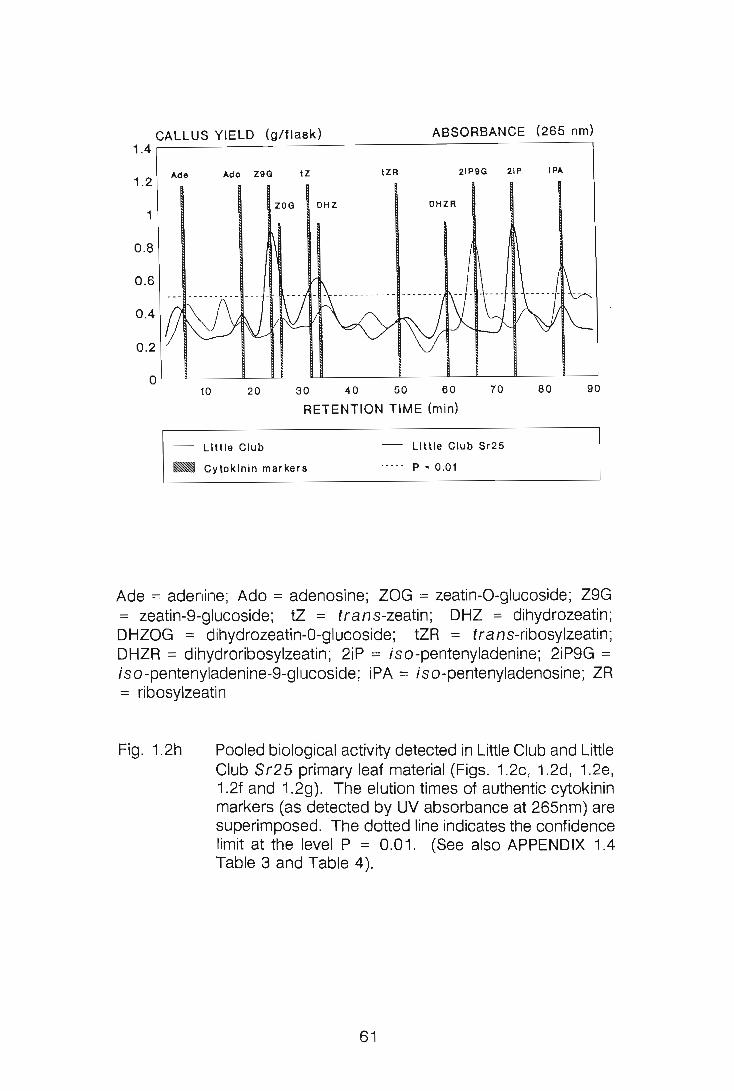
ABSORBANCE (265 nm) CALLUS YIELD (g/flask) 1.4~~~----~~-----------------------------'
1.2
0.8
0.6
0.4
0.2
"de "do Z9G IZ IZR 21P9G
ZOG DHZ DHZR
10 20 30 40 50 60 70
RETENTION TIME (min)
-- Little Club
_ Cytokinin markers
-- Little Club Sr25
.---- p. 0.01
21P IP"
80 90
Ade = adenine; Ado = adenosine; ZOG = zeatin-O-glucoside; Z9G = zeatin-9-glucoside; tZ = trans-zeatin; DHZ = dihydrozeatin; DHZOG = dihydrozeatin-O-glucoside; tZR = trans-ribosylzeatin; DHZR = dihydroribosylzeatin; 2iP = iso-pentenyladenine; 2iP9G = iso-pentenyladenine-9-glucoside; iPA = iso-pentenyladenosine; ZR = ribosylzeatin
Fig. 1.2h Pooled biological activITy detected in Little Club and Little Club $r25 primary leaf material (Figs. 1.2c, 1.2d, 1.2e, 1.2f and 1.2g). The elution times of authentic cytokinin markers (as detected by UV absorbance at 265nm) are superimposed. The dotted line indicates the confidence limit at the level P = 0.01. (See also APPENDIX 1.4 Table 3 and Table 4).
61
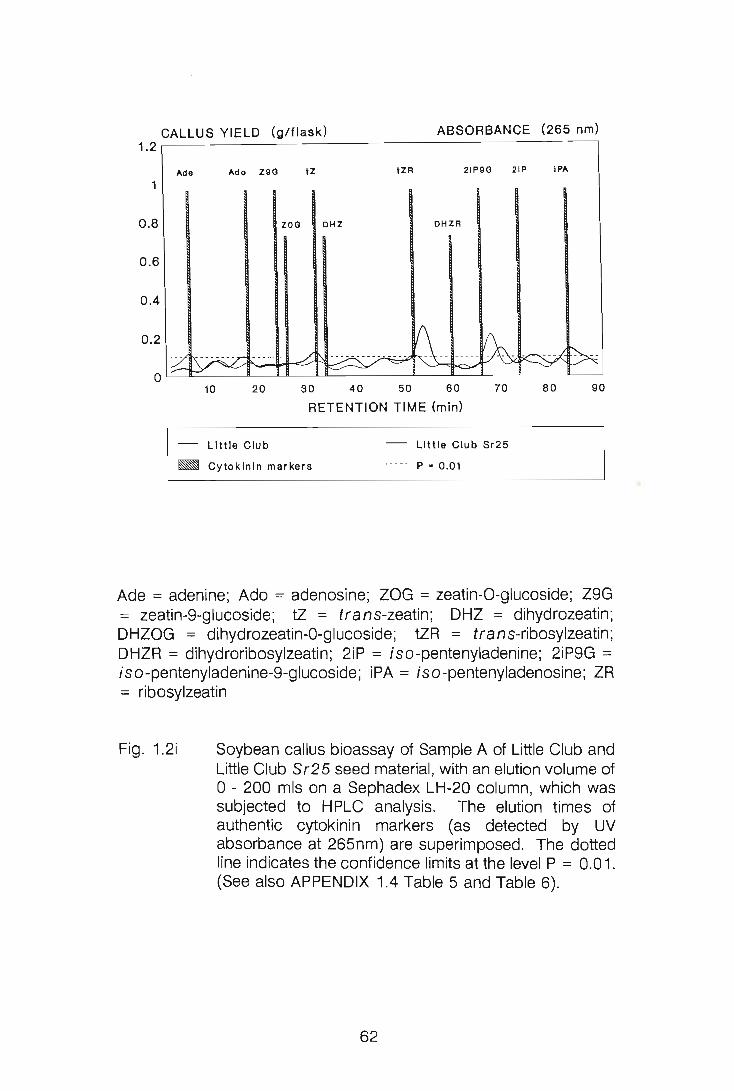
CALLUS YIELD (g/flask) ABSORBANCE (265 nm) 1.2
1
0.8
0.6
0.4
0.2
0
Ada Ado Z9G tZ tZR 21P9G
ZOG DHZ DHZR
10 20 30 40 50 60 70
RETENTION TIME (min)
- Little Club
_ Cytokinin markers
Little Club Sr25
P • 0.01
21P IPA
80 90
Ade = adenine; Ado = adenosine; ZOG = zeatin-O-glucoside; Z9G = zeatin-9-glucoside; tZ = trans-zeatin; DHZ = dihydrozeatin; DHZOG = dihydrozeatin-O-glucoside; tZR = trans-ribbsylzeatin; DHZR = dihydroribosylzeatin; 2iP = iso-pentenyladenine; 2iP9G = iso-pentenyladenine-9-glucoside; iPA = iso-pentenyladenosine; ZR = ribosylzeatin
Fig. 1.2i Soybean callus bioassay of Sample A of Little Club and Little Club Sr25 seed material, with an elution volume of o - 200 mls on a Sephadex LH-20 column, which was subjected to HPLC analysis. The elution times of authentic cytokinin markers (as detected by UV absorbance at 265nm) are superimposed. The dotted line indicates the confidence limits at the level P = 0.01. (See also APPENDIX 1.4 Table 5 and Table 6).
62

ABSORBANCE (265 nm) CALLUS YIELD (g/flask) 1.2 ~=-=-~-==-=-------:-=---------------~
Ade Ado Z9G tZ tZR 21P9G 21 P IPA
1
0.8 ZOG DH Z DHZR
0.6
0.4
0.2 ---------- ------ -- - - - - -- - -- -- - --- --------
0 ~·~~--1- ~--=--=-~=--=- 1-~--~- -~~~~t=~~~~=~~~~--~~~~~=t~ 10 20 30 40 50 60 70 80 90
RETENTION TIME (min)
- Little Club Little Club Sr25
P • 0.01 _ Cytokinin markers
Ade = adenine; Ado = adenosine; ZaG = zeatin-a-glucoside; Z9G = zeatin-9-glucoside; tZ = trans-zeatin; DHZ = dihydrozeatin; DHZOG = dihydrozeatin-O-glucoside; tZR = trans-ribosylzeatin; DHZR = dihydroribosylzeatin; 2iP = iso -pentenyladenine; 2iP9G = iso-pentenyladenine-9-glucoside; iPA = iso -pentenyladenosine; ZR = ribosylzeatin
Fig. 1.2j Soybean callus bioassay of Sample B of Little Club and Little Club Sr25 seed material, with an elution volume of 200 - 520 mls on a Sephadex LH-20 column, which was subjected to HPLC analysis. The elution times of authentic cytokinin markers (as detected by UV absorbance at 265nm) are superimposed. The dotted line indicates the confidence limits at the level P = 0.01 . (See also APPENDIX 1.4 Table 5 and Table 6).
63
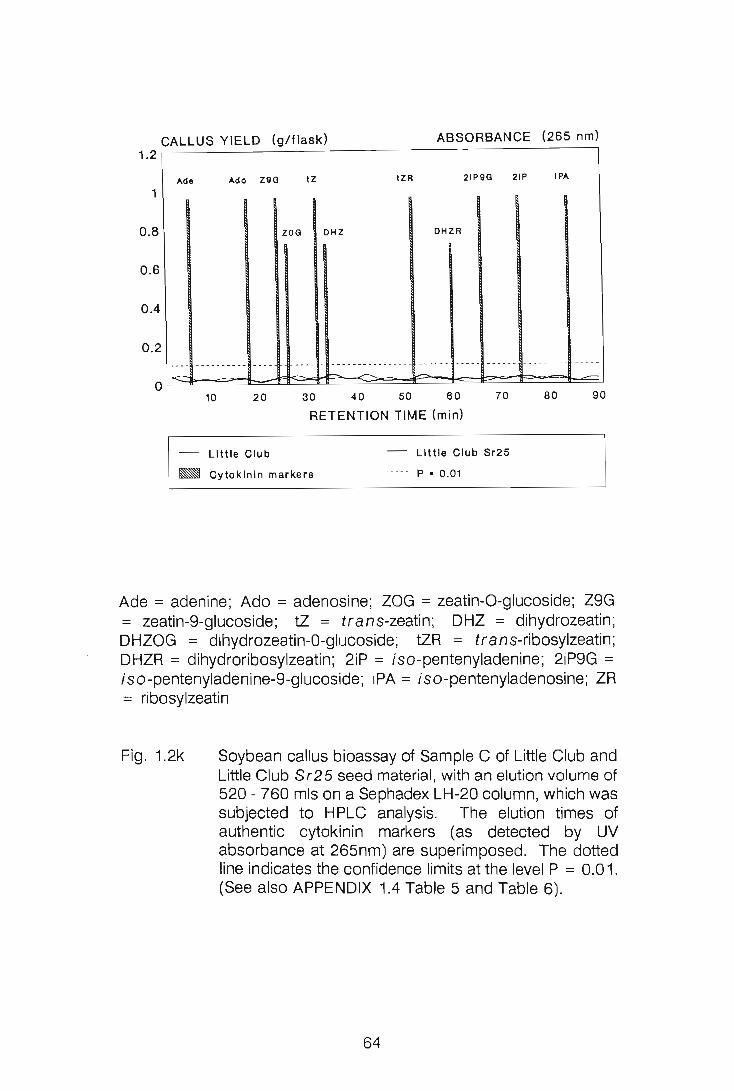
ABSORBANCE (265 nm) CALLUS YIELD (g/flask) 1.2~~~----~----------------------------~
1
0.8
0.6
0.4
0.2
"de Ado zeG IZ I ZR 21P9G 21P IP"
ZOG DHZ DHZR
10 20 30 40 50 60 70
RETENTION TIME (min)
-- little Club
_ Cytokinin markers
Little Club Sr25
P • 0.01
80 90
Ade = adenine; Ado = adenosine; ZaG = zeatin-a-glucoside; Z9G = zeatin-9-glucoside; tZ = trans-zeatin ; DHZ = dihydrozeatin; DHZOG = dihydrozeatin-O-glucoside; tZR = trans-ribosylzeatin; DHZR = dihydroribosylzeatin; 2iP = iso-pentenyladenine; 2iP9G = iso-pentenyladenine-9-glucoside; iPA = iso-pentenyladenosine; ZR = ribosylzeatin
Fig. 1.2k Soybean callus bioassay of Sample C of Little Club and Little Club Sr25 seed material, with an elution volume of 520 - 760 mls on a Sephadex LH-20 column, which was subjected to H PLC analysis. The elution times of authentic cytokinin markers (as detected by UV absorbance at 265nm) are superimposed. The dotted line indicates the confidence limits at the level P = 0.01. (See also APPENDIX 1.4 Table 5 and Table 6).
64
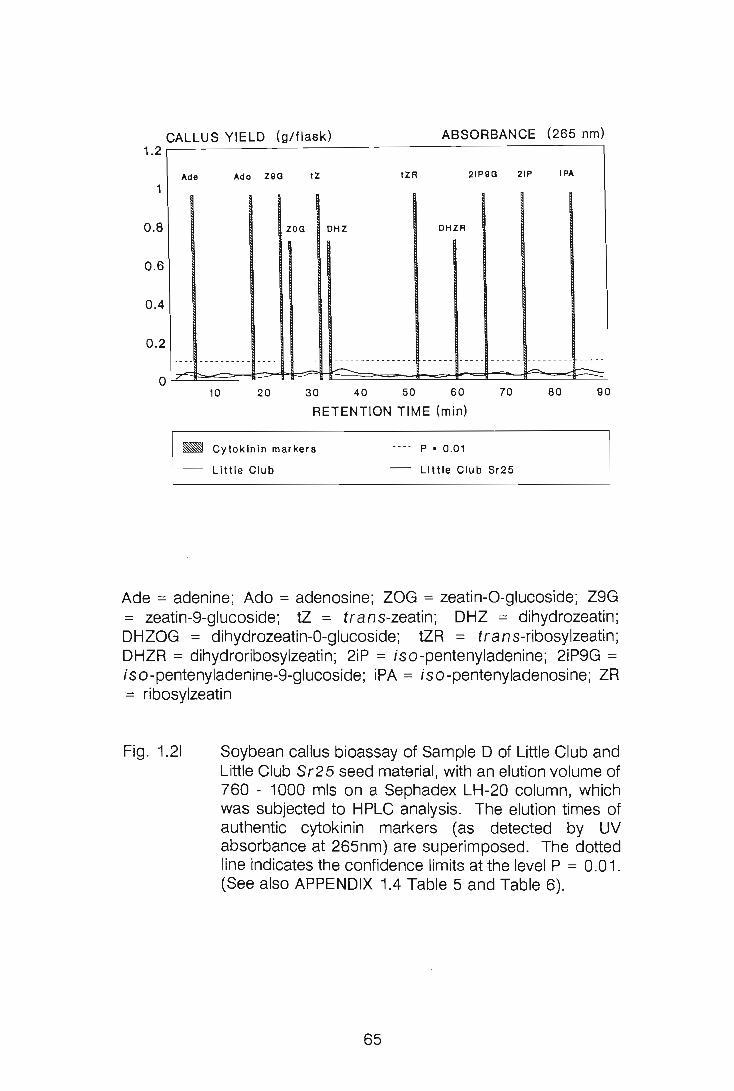
ABSORBANCE (265 nm) CALLUS YIELD (g/flask) 1.2~----------~------------------------------~
1
0.8
0.6
0.4
0.2
Ade Ado Z9G tZ tZR 21P9G 21P IPA
ZOG DHZ DHZR
10 20 30 40 50 60 70 80
RETENTION TIME (min)
P • 0.01 _ Cytokinin markers
LIttle Club LIttle Club Sr25
90
Ade = adenine; Ado = adenosine; ZOG = zeatin-O-glucoside; Z9G = zeatin-9-glucoside; tZ = trans-zeatin; DHZ = dihydrozeatin; DHZOG = dihydrozeatin-O-glucoside; tZR = trans-ribosylzeatin; DHZR = dihydroribosylzeatin; 2iP = iso-pentenyladenine; 2iP9G = iso-pentenyladenine-9-glucoside; iPA = iso-pentenyladenosine; ZR = ribosylzeatin
Fig. 1.21 Soybean callus bioassay of Sample D of Little Club and Little Club Sr25 seed material, with an elution volume of 760 - 1000 mls on a Sephadex LH-20 column, which was subjected to HPLC analysis. The elution times of authentic cytokinin markers (as detected by UV absorbance at 265nm) are superimposed. The dotted line indicates the confidence limits at the level P = 0.01. (See also APPENDIX 1.4 Table 5 and Table 6).
65
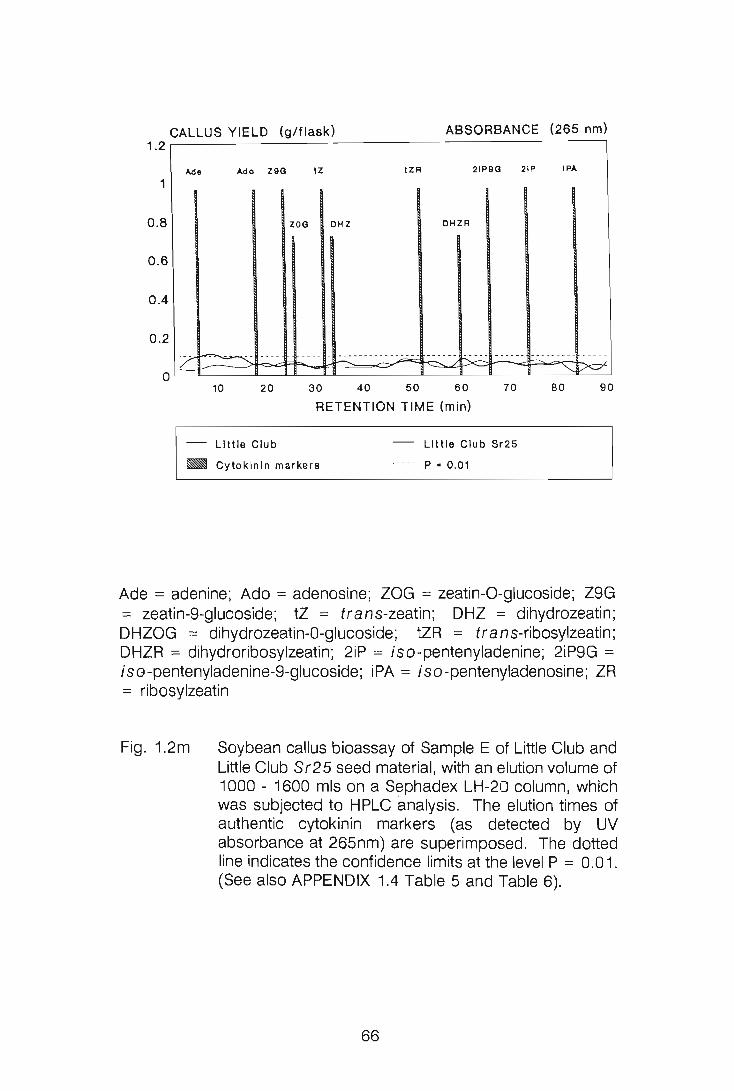
ABSORBANCE (265 nm) CALLUS YIELD (g/flask) 1.2 ~----------~------------------------------~
"de .\do Z9G tZ tZR 21P9G 21P I P"
1
0.8 ZOG OH Z OHZR
0.6
0.4
0.2 i L ~- ---- --- - -~--- --- ---.;,;.- - - - - ~- -~ ------ .:.:.----; ~
O L-~----~~~~~------~~~~~--~--~~--
10 20 30 40 50 60 70 80 90
RETENTION TIME (m in)
-- Little Club Little Club Sr25
P • 0 .01 _ Cytokinin markers
Ade = adenine; Ado = adenosine; ZaG = zeatin-a-glucoside; Z9G = zeatin-9-glucoside; tZ = trans-zeatin ; DHZ = dihydrozeatin; DHZOG = dihydrozeatin-O-glucoside; tZR = trans-ribosylzeatin ; DHZR = dihydroribosylzeatin; 2iP = iso -pentenyladenine; 2iP9G = iso-pentenyladenine-9-glucoside; iPA = iso-pentenyladenosine; ZR = ribosylzeatin
Fig. 1.2m Soybean callus bioassay of Sample E of Little Club and Little Club Sr25 seed material, with an elution volume of 1000 - 1600 mls on a Sephadex LH-20 column, which was subjected to HPLC analysis. The elution times of authentic cytokinin markers (as detected by UV absorbance at 265nm) are superimposed. The dotted line indicates the confidence limits at the level P = 0.01 . (See also APPENDIX 1.4 Table 5 and Table 6).
66
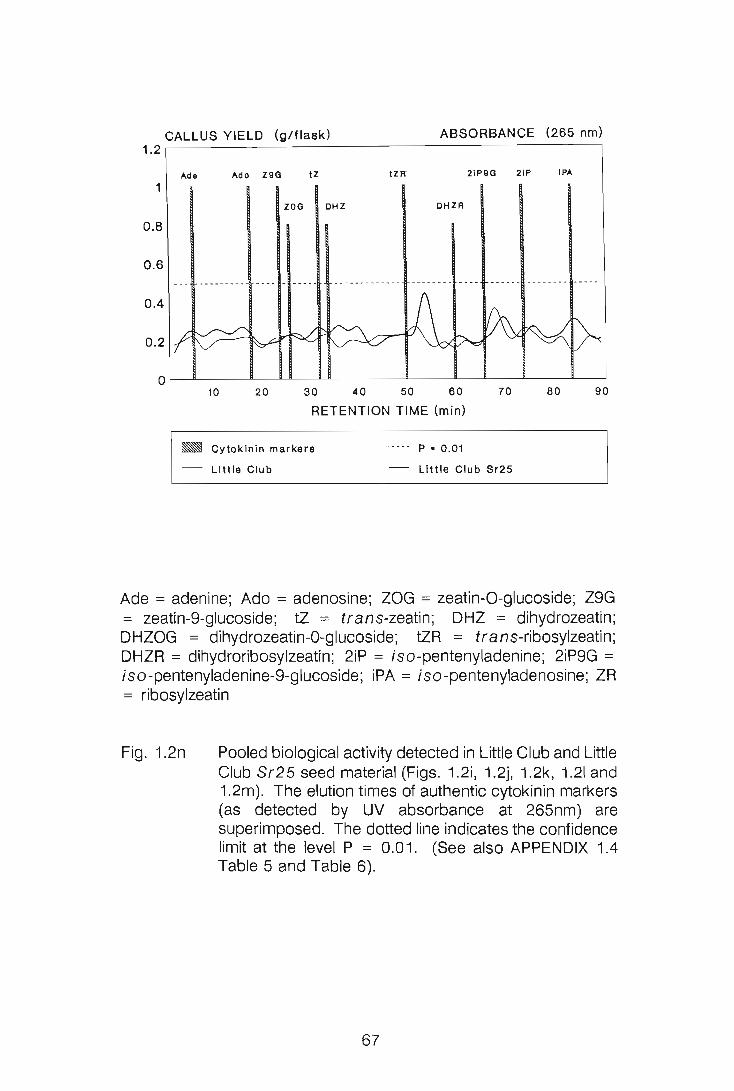
CALLUS YIELD (g/flask) ABSORBANCE (265 nm) 1.2~------------------------------------------~
1
0.8
0.6
0.4
0.2
Ade Ado Z9G tZ tZR 21P9G 21P IPA
ZOG DHZ DHZR
10 20 30 40 SO 60 70 80
RETENTION TIME (min)
P • 0.01 _ Cytokinin markers
- Little Club Little Club Sr25
90
Ade = adenine; Ado = adenosine; ZaG = zeatin-a-glucoside; Z9G = zeatin-9-glucoside; tZ = trans-zeatin; DHZ = dihydrozeatin; DHZOG = dihydrozeatin-O-glucoside; tZR = trans-ribosylzeatin; DHZR = dihydroribosylzeatin; 2iP = iso-pentenyladenine; 2iP9G = iso-pentenyladenine-9-glucoside; iPA = iso-pentenyladenosine; ZR = ribosylzeatin
Fig. 1.2n Pooled biological activity detected in Little Club and Little Club Sr25 seed material (Figs. 1.2i, 1.2j, 1.2k, 1.21 and 1.2m). The elution times of authentic cytokinin markers (as detected by UV absorbance at 265nm) are superimposed. The dotted line indicates the confidence limit at the level P = 0.01. (See also APPENDIX 1.4 Table 5 and Table 6).
67
In the resistance reaction, the fungus is seen to infect the host and some level of
colonization occurs. It is possible that the high initial cytokinin levels are fungitoxic
at the early stages of infection. The high sensitivity of fungi, in early stages of
growth, to cytokinins (Michniewicz ef al., 1984), and the findings of Vizarova
(1987) that zeatin and its derivatives (at 100 J..Lg per 3 cm3) have an absolute
inhibitory effect on the growth of Erysiphe graminis do, in part, support this
proposal.
Cytokinin-like substances have been detected in wheat grains (Bhardwaj & Dua,
1975; Herzog & Geisler, 1977; Jameson ef al., 1982; Reda, 1976; Thomas ef
aI., 1978; Wheeler, 1972, 1976). Changes in levels of these substances in
developing wheat grains have been demonstrated to follow a set pattern (Jameson
ef al., 1982), in that activity is barely detectable at ear emergence but increases
markedly at pollination. Levels then increase rapidly until four days after anthesis
after which an equally rapid loss occurred. No activity could be detected 21 days
after ear emergence. Wheeler (1972) also found that wheat grains had negligible
amounts of cytokinin activity. A similar pattern of changes in cytokinin activity has
been found in maize (Hocart ef al. , 1988; Michael & Seiler-Kelbitsch, 1972) and
rice (Saha ef al., 1984; Saha ef al., 1986). In the present investigation, seed
material of both cultivars in Experiment 2 were found to have very low levels of
cytokinin-like activity when compared to the levels detected in the leaf material.
Zeatin, ribosylzeatin and glucosylzeatin have been tentatively identified in developing
wheat grains (Jameson ef al., 1982), mature barley and wheat grains (Vizarova &
Muzikova, 1981; Vizarova & Vozar, 1984) and mature rice grains (Saha ef aI.,
1984). In Experiment 1 of the present investigation, these compounds and a
number of other cytokinins were tentatively identified in the seed material of the two
wheat selections. Pooled data from H PLC separation of seed material in Experiment
2 indicate that although there was no signficant biological activity in either resistant
or susceptible seed material, peaks of activity could be detected.
68
Cytokinin activity which co-chromatographed with zeatin, glucosylzeatin and
ribosylzeatin was detected in the first leaf of barley and wheat cultivars (Viza.rova.,
1987; Viza.rova. et al., 1986) and rice cultivars (Saha et al., 1986). In the HPLC
separation of leaf material in Experiment 2, the following cytokinins were tentatively
identified in the line cultivar, zeatin-9-glucoside, zeatin-O-glucoside, trans-zeatin,
dihydrozeatin, dihydroribosylzeatin and iso-pentenyladenine. Sephadex separation
of resistant leaf material indicated the presence of iso-pentenyladenine, however,
this compound could not be tentatively identified in the HPLC separation of this
material. The susceptible cultivar was seen to have significant biological activity at
retention times at which is 0 -pentenyladenine-9-glucoside and is 0-
pentenyladenosine markers eluted. The presence of iso-pentenyladenosine was
also detected in the Sephadex separation of susceptible leaf material. As mentioned
previously, Vizarova. (1987) found that zeatin and its derivatives (at 100 j..Lg per 3
cm3) had an absolute inhibitory effect on the growth of Erysiphe graminis. Liu
& Bushnell (1986) found no effects of zeatin (at concentrations of 10-6 - 10.4 M) on
the development of this fungus on detached barley coleoptiles. The differences in
concentrations, tissues and time of application could account for the different
response observed by these two authors. The effect (if any) of the compounds
identified in the resistant line of this study on the growth of Puccinia graminis
f.sp. trifici, compared to the effect of those in the susceptible cultivar still needs
to be determined.
Invasion of a resistant or susceptible host by a biotrophic plant pathogen ultimately
results in an increase in the levels of endogenous cytokinins in both host types.
However, the increase in the susceptible host has been found to be much greater
than that in the resistant cultivar (Kern ef al., 1987; Sziraki et al. , 1976;
Vizarova., 1974a, b, 1975b, 1979; Vizarova. & Kova.~ova., 1980; Viza.rova. &
Minarcic, 1974; Viza.rova. et aJ. , 1986). From the literature, the role of the
pathogen in the changes of endogenous cytokinin levels detected, or the extent to
which the pathogen contributes to the cytokinin pool of the infected plant, is unclear.
Yadav & Mandahar (1981) were of the opinion that these increased levels reflect
secretion of cytokinins by the pathogen, resulting in the formation of translocatory
69
sinks towards which nutrients would move. Dekhuijzen & Staples (1968) found that
the cytokinin-like compounds detected in urediospores and mycelium of bean rust
were not the same as those detected in infected plant tissue. Dekhuijzen (1976)
thus concluded that infection stimulated the production of cytokinins by the host
plant.
Qualitative changes in cytokinins have been observed after infection of barley with
powdery mildew (Vizarova, 1973, 1974b, 1979, 1987) and wheat with stem rust
(Vizarova et al., 1986) and these authors supposed that the new compounds
detected are produced by the pathogen in the host plants. What their results
actually indicate is that the products of the pathogen do have an influence on the
cytokinins detected in infected plants. However, it is unclear whether the new
compounds detected are of pathogen origin or are the result of an influence of the
products of the pathogen on the host metabolism of cytokinins. Evidence for the
fact that the infection of plants by fungal pathogens might alter the quality of
cytokinins detected in the infected plant material was presented by Mills & Van
Staden (1978) and Nicholson & Van Staden (1988).
Vizarova and her co-workers (Vizarova, 1973, 1974a, b, 1975a, b, 1979, 1987;
Vizarova & Kova~ova, 1980; Vizarova & Minarcic, 1974) investigating the role of
endogenous cytokinins in the barley- and wheat-powdery mildew interaction, have
found that changes in cytokinin levels follow set patterns in resistant and susceptible
plants. In both host types, there is an initial temporary decrease in cytokinin activity
present in the leaf tissue while the pathogen becomes established, and a
concomitant increase in cytokinin activity in the roots. The present author is of the
opinion that at this stage of infection, in which there is the establishment of the
biotrophic relationship between the host and the pathogen, there is active movement
of metabolites into cells invaded by the fungus, possible enhanced by secretion by
the fungus of cytokinin-like substances. The leaf, in order to re-establish the
equilibrium of both cytokinin-like substances and metabolites, then a) moves
cytokinins in from surrounding tissues, b) converts storage forms (glucosides) to
active forms, c) induces the roots to biosynthesize more cytokinins. The temporary
70
rise recorded in the roots at this time (Viza.rova., 1974b, 1975b, 1979; Viza.rova. &
Minarcic, 1974) is an indication of increased biosynthesis or reduced export of
cytokinins in the roots. Viza.rova. & Minarcic (1974) are of the opinion that, at 4dpi,
the parasite actively inhibits the transport of cytokinins from the roots to the leaves,
hence the increase in free cytokinins noted in roots at this time. In support of thi~
opinion they cite Cole & Fernandes (1970) as having found that the cytokinins
influence growth of the parasite in a negative way.
From an examination of the results of Vizarova. (1975b, 1979) it would appear that
the cytokinins in the roots move up into the above-ground parts of the plant,
accumulating preferentially at the infection sites, hence the decrease in activity noted
in the root tissue, and increase noted in the leaf tissue. The level in the root tissue
of both resistant and susceptible cultivars drops back to the level in healthy controls
while the levels in the leaves rise, reaching at peak at 6dpi in the resistant cultivar
and rising continuously in the susceptible cultivar. It is during this period that spore
formation is initiated in the susceptible cultivar, and as a result the fungus would
require greatly enhanced levels of nutrients. With an increased cytokinin level there
would be an increased mobilization of metabolites (Mothes & Engelbrecht, 1961;
Mothes et a/., 1959;) to the infection sites. Viza.rova. (1975a) noted an enhanced
production of cytokinin-like substances during the formation of fungal fructification
organs in cultures of non-biotropic fungi. Possibly a similar increase in production
by the powdery mildew fungus occurs in the susceptible host.
In the susceptible leaf tissue the activity is seen to rise through the period of spore
formation and liberation (Viza.rova., 1974b, 1975b, 1979), and this is reflected in the
root as there is a great overall decrease in cytokinin activity measured in root tissue
as the infection progresses (Viza.rova., 1974b, 1975b, 1979; Viza.rova. & Minarcic,
1974). In the resistant leaf the activity is seen to rise temporarily (2 days) indicating
that the cytokinins produced in the roots earlier are being transported to the infected
leaves. The activity in the roots thus dropping back to the level seen in the roots
of uninfected plants. After the rise seen at 6dpi there is then a decrease in activity
measured in the leaf of resistant cultivars, to a level above that of the leaves of
uninoculated plants (Viza.rova., 1975b, 1979).
71
As there is no further increase detected in the roots of susceptible cultivars after the
increase at 4dpi, yet the level in the leaf tissue rises (Vizarova, 1974b, 1975b,
1979; Vizarova & Minarcic, 1974), it is possible that in a susceptible reaction the
fungus is able to produce cytokinins and these then move into the host leaf tissue
and enhance the accumulation of metabolites and protein synthesis. Vizarova
(1973, 1974b, 1979, 1987) is of the opinion that the appearance of a new zone of
activity, corresponding to iso-pentenyladenine and its derivatives, in susceptible
leaves could be an indication of cytokinin production by the fungus as this
compound is not detected in susceptible cultivar roots, or in leaf and root material
of resistant cultivars. Vizarova et al. (1986) detected the same zone of new
activity in susceptible and moderately resistant wheat cultivars infected with
Puccinia graminis f.sp. tritici, but not in fully resistant wheat cultivars. In the
present investigation, in the absence of the pathogen, iso-pentenyladenine was
tentatively identified in the resistant cultivar, and iso-pentenyladenine-9-glucoside
in the susceptible line.
The maximum cytokinin activity measured at 6dpi in resistant cultivars (Vizarova,
1975b, 1979) indicates that the cytokinins produced in the roots (seen at 4dpi) have
been transported to the infected leaves. The decrease seen at 6 - 10dpi indicates
that once the cytokinins transported to the leaves become bound (used up ???),
they are not replaced by movement of cytokinins from the fungus. The resistant
reaction could thus come about as a result of the fungus, in the specific pathogen
host interaction, not being able to produce large amounts of cytokinins and thus
failing to induce mobilization of metabolites preferentially into the cells with fungal
haustoria. The degree of resistance of specific cultivars could depend on the
cytokinin inducing/or producing capacities of the fungus once the biotrophic
relationship has been established.
In the investigation of Vizarova (1979) the final level of cytokinin activity in the root,
in both resistant and susceptible reactions, is lower than the initial activity in both
healthy and inoculated plants. However, the activity in the final root reading (1 Odpi)
for the susceptible cultivar is lower for the infected plants than the healthy controls,
indicating a net removal of cytokinins from the roots of infected plants. In the
72
resistant cultivar, the final reading indicates that the root material of infected plants
has a higher level than healthy control plants, thus indicating that removal of the
cytokinins from the roots has been hampered, or stopped, or is not as intensive as
that seen in the susceptible cultivar. This is a reflection of the situation in the leaf
where in the resistant cultivar the "call for" cytokinins is not as great later in the
interaction, while in the susceptible cultivar, excessive amounts of cytokinins are
required for contribution to spore development and formation.
Hence, a measure of the differences in cytokinin activity between healthy and
inoculated leaf material, at a time after inoculation with the pathogen would be
sporulating in the susceptible cultivar, would possibly give an indication of the level
of resistance that the cultivar has to the specific pathogen (taking into consideration
the race and biotype, etc.). A resistant cultivar would have a much smaller overall
increase in cytokinin activity than a susceptible cultivar. In the resistance interaction
the fungus is thus unable either to produce greatly increased levels of cytokinins
itself or to induce the biosynthesis of cytokinins by the host to any great extent.
The genetics of the interaction would playa key controlling role here.
Thus, from the results of the present investigation, it can be concluded that leaf
material of the wheat line Little Club Sr25, which is resistant to stem rust race
2SA4, does have a higher level of total cytokinin activity than that of the susceptible
cultivar Little Club. Seed material of the resistant line did not always have higher
levels of cytokinins than the susceptible cultivar. This is the first reporting of a
comparison between cytokinin levels of isogenic wheat selections. A large number
of cultivars would need to be tested before the usefulness of cytokinin levels as an
indicator of resistance could be determined. The methodology used in this
investigation would prove to be too labour-intensive and time-consuming for the
plant breeder, and so if the cytokinin levels of wheat cultivars were found to be
useful as an indicator of resistance in wheat breeding, more appropriate methods
would need to be used.
73
LITERATURE CITED
Armstrong D.J., Burrows W.T., Evans P.K. & Skoog F. (1969) Isolation of
cytokinins from tRNA. Biochemical and Biophysical Research
Communications 37, 415-456.
Bhardwaj S.N. & Dua I.S. (1975) A study of the competitive interrelationship
between grain setting and growth in Aestivum wheats in relation to the
production of growth regulating substances. Indian Journal of Plant
Physiology 17, 39-43.
Cole J.S. & Fernandes D.L. (1970) Changes in the resistance of tobacco leaf to
Erysiphe cichoracearum DC. induced by topping, cytokinins and
antibiotics. Annals of Applied Biology 66, 239-243.
Dekhuijzen H.M. (1976) Endogenous cytokinins in healthy and diseased plants.
In: Physiological Plant Pathology (Ed. by R. Heitefuss & P.H. Williams).
pp. 526-559. Springer-Verlag, Berlin.
Dekhuijzen H.M. & Staples R.C. (1968) Mobilization factors in uredospores and
bean leaves infected with bean rust fungus. Contributions from Boyce
Thompson Institute for Plant Research 24, 39-52.
Herzog H. & Geisler G. (1977) Der einfluss von cytokininapplikation auf die
assimilateinlagerung-und die endogene cytokininaktivitat der karyopsen bei
zwei sommerweizensorten. Zeitschrift fur Acker-und Pflanzenbau
144, 230-242.
Hocart C.H., Badenoch-Jones J., Parker C.W., Letham D.S. & Summons R.E.
(1988) Cytokinins of dry Zea mays seed: quantification by
radioimmunoassay and gas chromatography-mass spectrometry. Journal
of Plant Growth Regulation 7, 179-196.
Jameson P.E., McWha J.A. & Wright G.J. (1982) Cytokinins and changes in their
activity during the development of grains of wheat (Triticum aestivum L.).
Zeitschrift fur Pflanzenphysiologie 106,27-36.
Kern M., Ibenthal W-O. & Heitefuss R. (1987) Endogene phytohormone in
sommergerstensorten mit unterscheidlicher resistenz gegenuber dem echten
mehltau (Erysiphe graminis f.sp. hordei) Angewandte Botanik 61,
74
243-253.
Liu Z. & Bushnell W.R. (1986) Effects of cytokinins on fungus development and
host responses in powdery mildew of barley. Physiological and
Molecular Plant Pathology 29, 41-52.
Michael G. & Seiler-Kelbitsch H. (1972) Cytokinin contents and kernel size of barley
as affected by environment and genetic factors. Crop Science 12, 162-
165.
Michniewicz M., Rozej B. & Kruszka G. (1984) Control of growth and development
of isolates of Fusarium culmorum (W.G.Sm.) Sacco of different
pathogenicity to wheat seedlings by plant growth regulators. III. Cytokinins.
Acta Physiologiae Plantarum 6, 3-11.
Miller C.O. (1963) Kinetin and kinetin-like compounds. In : Modern Methods of
Plant Analysis 6 (Ed. by K. Paech & M.v. Tracey), pp. 194-202.
Springer-Verlag, Berlin.
Miller C.O. (1965) Evidence for the natural occurrence of zeatin and derivatives:
compounds from maize which promote cell division. Proceedings of the
National Academy of Science U.S.A. 54, 1052-1058.
Mills L.J. & Van Staden J. (1978) Extraction of cytokinins from maize, smut tumours
of maize and Ustilago maydis cultures. Physiological Plant
Pathology 13, 73-80.
Mothes K. & Engelbrecht L. (1961) Kinetin-induced directed transport of
substances in excised leaves in the dark. Phytochemistry 1,58-62.
Mothes K., Engelbrecht L. & Kulajewa O. (1959) Uber die Wirkung des Kinetins auf
Stickstoffverteilung und Eiweiss-synthese in Isolierten Blattem. Flora
(Jena) 147, 445-465.
Nicholson R.I.D & Van Staden J. (1988) Cytokinins and mango flower
malformation. I. Tentative identification of the complement in healthy and
malformed inflorescences. Journal of Plant Physiology 132, 720-724.
Reda F. (1976) Endogenous cytokinins in vernalised winter wheat grains. Planta
130, 265-268.
Saha S., Nagar P.K. & Sircar P.K. (1984) Changes in cytokinin activity during seed
germination in rice (Oryza sativa L.). Annals of Botany 54, 1-5.
75
Saha S., Nagar P.K. & Sircar P.K. (1986) Cytokinin concentration gradient in the
developing grains and upper leaves of rice (Oryza sativa) during grain
filling. Canadian Journal of Botany 64, 2068-2072.
Stakman E.C., Stewart D.M. & Loegering W.Q. (1962) Identification of physiologic
races of Puccinia graminis var. tritici. United States Department
of Agriculture Bulletin E617 (Revised).
Sziraki I., Barna B., Waziri S.E. & Kiraly Z. (1976) Effect of rust infection on the
cytokinin level of wheat cultivars susceptible and resistant to Puccinia
graminis f.sp. tritici. Acta Phytopatho/ogica Academiae
Scientiarum Hungaricae 11, 155-160.
Thomas T.H., Khan A.A. & 0' Toole D.F. (1978) The location of cytokinins and
gibberellins in wheat seeds. Physio/ogia Plantarum 42,61-66.
Van Staden J. & Davey J.E. (1977) The metabolism of zeatin and zeatin riboside
by soya bean callus. Annals of Botany 41, 1041-1048.
Van Staden J. & Davey J.E. (1979) The synthesis, transport and metabolism of
endogenous cytokinins. Plant, Cell and Environment 2,93-106.
Viza.rova. G. (1973) Contribution to the study of barley infected by powdery mildew.
Proceedings of the Research Institute of Pomo/ogy,
Skierniewice, Poland. Series E 3, 559-564.
Viza.rova. G. (1974a) Level of free cytokinins in susceptible and resistant cultivarsof
barley infected by powdery mildew. Phytopatho/ogische Zeitschrift
79, 310-314.
Viza.rova. G. (1974b) Free cytokinins in roots and leaves of barley during
pathogenesis of powdery mildew (Erysiphe graminis f.sp. hordei
Marchal) Bio/6gia (Bratislava) 29, 551-558.
Viza.rova. G. (1975a) Contribution to the study of cytokinin production by
. phytopathogenic fungi. Bio/ogia Plantarum (Praha) 17, 380-382
Viza.rova. G. (1975b) Effect of powdery mildew on the level of endogenous
cytokinins in barley with regard to resistance. Phytopathologische
Zeitschrift 84, 105-114.
Viza.rova. G. (1979) Changes in the level of endogenous cytokinins of barley during
the development of powdery mildew. Phytopatho/ogische Zeitschrift
95, 329-341.
76
Vizarova G. (1987) Possible role of cytokinins in cereals with regard to the
resistance to obligate fungus parasites. Biologia Plantarum (Praha) 29 ,
230-233.
Vizarova G. & Kovacova M. (1980) studium vol'nych cytokininov v korenoch
ja~mena v procese patogenezy mu~natky tenkovrstevnou chromatografiou.
Biol6gia (Brastislava) 35, 727-732.
Vizarova G. & Minarcic P. (1974) The influence of powdery mildew upon the
cytokinins and the morphology of barley roots. Phytopathologische
Z eitschrift 81, 49-55.
Vizarova G. & Muzikova D. (1981) The content of free endogenous cytokinins in
the grain of barley and wheat in relation to their resistance to mildew.
Polnohospodarstvo 27, 1109-1115.
Vizarova G. & Paulech C. (1979) studium vol'nych endogennych cytokininov v
ja~meni a ich vztah k rezistencii oproti mu~natke. Biol6gia (Bratislava)
34,31-37.
Vizarova G., Shashkova, L.S. & Andreev L.N. (1988) On the question of the
relationship between free zeatin content and resistance of wheat to biotrophic
fungi. Acta Phytopathologica et Entomologica Hungarica 23, 385-
392 .
Vizarova G. & Shashkova L.S., Mazin V.V. , Vozar I. & Paulech C. (1986) Free
cytokinins in Puccinia graminis Pers. f. sp. tritici Eriks. & E. Henn.
affected wheat leaves (In Russian). Mikologiya i Fitopatologiya 20, 281-
285.
Vizarova G. & Vozar I. (1984) Free endogenous cytokinin content in the seeds
of barley and wheat cultivars with different resistance to powdery mildew.
Biochemie und Physi%gie der Pflanzen 179,767-774.
Wheeler A.W. (1972) Changes in growth substance contents during growth of
wheat grains. Annals of Applied Biology 72, 237-334.
Wheeler A.W. (1976) Some treatments affecting growth substances in developing
wheat ears. Annals of Applied Biology 83, 455-462.
Yadav B.S. & Mandahar C.L. (1981) Secretion of cytokinin-like substances in vivo
and in vitro by Helminthosporium sativum and their role in
pathogenesis. Zeitschrift fur Pflanzenkrankheiten und
Pflanzenschutz 88, 726-733.
77
CHAPTER 2
SCANNING ELECTRON MICROSCOPY STUDY OF INFECTION
STRUCTURE FORMATION BY Puccinia graminis f.sp. tritici
ON AND IN THE UNIVERSAL SUSCEPTIBLE WHEAT
CULTIVAR McNAIR
INTRODUCTION
Infection structure morphology of rust fungi pathogenic on grasses and cereals
shows a considerable intertaxon variation and studies have indicated that infection
structure morphology could proviqe additional distinctive traits to characterize rust
species and subspecific taxa, especially independently from the host (Niks, 1986;
Niks et a/., 1989)
Allen (1923) described her light microscope observations of infection structure
development of Puccinia graminis f .sp. tritici Eriks. & Henn. in wheat. Today,
her study remains remarkable for the detail it provides, the quality of which was
rarely surpassed until the advent of electron microscopy. Scanning electron
microscopy techniques especially are potentially valuable in the study of the
morphology and ontogeny of infection structures. However, until recently, scanning
electron microscopy studies of early infection structure formation of the rusts were
limited to those describing structures differentiated from urediospores on artificial
surfaces (Paliwal & Kim, 1974; Wynn, 1976; and Heath, M.G., (unpublished cited
in Littlefield & Heath, 1979). The reason for this paucity of information is that leaf
fracture methods of the type described by Gold et a/. (1979), Mims (1981), and
Beckett & Porter (1982) lend themselves to the examination of large fungal
proliferations within host tissues rather than to the findings of early infection stages.
Hughes & Rijkenberg (1985) described a leaf-fracturing technique which was
adapted from the methods of Michelmore & Ingram (1981) and AI-Issa & Sigee
78
(1982). They used this technique to described the ontogeny and morphology of
infection structures formed by Puccinia sorghi Schw. in the leaf of its uredial
host, Zea mays L. Davies & Butler (1986) used a similar techique to describe the
development of infection structures of the rust, Puccinia porri (Sow.) Wint., in
leek (Allium porrum L.) leaves, as did Ferreira & Rijkenberg (1989) in describing
development of Uromyces transversalis (Thum.) in gladiolus (Gladiolus L.)
leaves.
The objective of the present study was to describe the formation and morphology
of infection structures by Puccinia graminis f.sp. tritici in the universal stem
rust-susceptible wheat cultivar McNair employing the leaf fracturing technique of
Hughes & Rijkenberg (1985).
MATERIALS AND METHODS
Rust propagation and inoculation. Freshly harvested urediospores of Puccinia
graminis f.sp. tritici Eriks. & Henn. produced on 15-day-old susceptible wheat
(Triticum aestivum L.) cv. Morocco plants in a greenhouse (18 - 30°C), were
used to inoculate the first leaf of seven-day-old wheat cv. McNair at an inoculum
dose of 50 mg urediospores per ml of Soltrol® 130 (Phillips Chemical Co.). A
modified Andres & Wilcoxson (1984) inoculator was used to inoculate the seedlings.
The Soltrol on the seedlings was allowed to evaporate for a hour and these were
then placed in a dew chamber at 20°C and 100% relative humidity in the dark. A
12h/12h dark/light regime was followed. The inoculated leaves of ten seedlings
were harvested at 6, 12, 24, 48, 96 and 144 hours-post-inoculation (hpi). At 24 hpi
the remaining seedlings were removed from the dew chamber and placed on a
bench in a greenhouse at a maximum temperature of 24°C.
Specimen preparation. The harvested leaf pieces were fixed in 3% glutaraldehyde
in a 0.05 M sodium cacodylate buffer, pH 6.82 - 7.24, for 8 h or overnight, washed
twice in buffer, post-fixed for 2 hours in 2% osmium tetroxide in buffer, washed
79
twice in buffer, and dehydrated in a graded ethanol series. The material was then
critical point dried in carbon dioxide after a graded transition from ethanol to amyl
acetate. The leaf pieces were cut into 3 x 3 mm squares and mounted on stubs.
The leaf fracture technique of Hughes & Rijkenberg (1985) was performed on
material harvested at 12 - 96 hpi. Leaf pieces harvested at 6 and 144 hpi were left
unfractured. All specimens were gold/palladium-coated in a Polaron® Sputter
coater and examined using a Hitachi® S-570 scanning electron microscope
operating at 5 or 8 kV. Since infection structures remain attached to the epidermis,
only the stripped epidermis of fractured material was examined, whereas inoculated
leaf surfaces of material harvested at 6 and 144 hpi were scanned.
OBSERVATIONS
The leaves of wheat are parallel-veined and have stomata regularly arranged in
longitudinal rows along their length. The long axes of the stomata are orientated
parallel to the long axis of the leaf.
At germination, a germ tube is extruded through a germ pore in the urediospore wall
and ramifies over the leaf surface, generally perpendicularly to the long axis of the
leaf (Plate 1 Fig. a). Short exploratory branches are formed at the anticlinal walls
of any epidermal cell encountered (Plate 1 Fig. a). Once a stoma is located, a
terminal appressorium is formed (Plate 1 Fig. b). Appressoria were observed at 6
hpi. Collapsed appressoria remain adherent to the leaf surface even after 144 hpi.
In a number of cases two appressoria were seen over a single stoma.
The lower appressorial surface has a rugose texture. A ridge that follows the
external contours of the stomatal slit develops on the lower appressorial surface,
and from this ridge, a single infection peg arises and penetrates at one end of the
stomatal slit. In the substomatal chamber, the infection peg swells into a
substomatal vesicle (SSV) initial (Plate 1 Fig. c), the blade-shaped connection (see
remnant viewed from above in Plate 1 Fig. c and from the side in Plate 1 Fig. d)
80
between the appressorium and the SSV having been termed the interconnective
tube by Hughes & Rijkenberg (1985). From a size analysis of 30 SSVs at 12 hpi,
it appears that, on emergence from the stomatal slit, the SSV initial elongates
parallel to the stomatal slit, the smallest SSV observed measuring 6.8 by 3.6 J,Lm.
The SSV initial progressively swells to a more rounded shape (approximately 8.6 by
6.4 J,Lm) and then increases in size in both dimensions until it attains a size of
approximately 12 by 8 J,Lm. Further increase in length is associated with a slight
increase in breadth, the most mature SSVs at 12 hpi measuring 15 - 17 by 6 - 7
J,Lm. A sample of material harvested at 6 hpi which was inadvertently fractured
revealed a few ovoid SSVs indicating that SSV development closely follows
appressorium formation.
The SSVs were orientated such that their long axes were parallel to the long axis
of the stomatal chamber and hence the long axis of the leaf (Plate 2 Figs. a - c).
Near-spherical SSVs observed at later sampling times, as well as collapsed SSVs,
were considered to be aborted structures. A number of stomata were seen on
which two SSVs had developed (Plate 3 Fig. a). The SSVs then elongate
unilaterally, closely appressed to the inner epidermal surface, in a direction parallel
to the long axis of the leaf, to form a primary infection hypha (Plate 3 Fig. c).
Primary infection hyphae are approximately 4 J,Lm wide and are thus narrower than
SSVs. Where a primary infection hypha abuts on to a host cell, a septum forms,
delimiting a haustorial mother cell (HMC) at the tip (Plate 4 Fig. a). Primary HMCs
were commonly seen to abutt onto the epidermal cell adjacent to the swollen end
of a stomatal guard cell (Plate 4 Figs. a-d), and were never seen to form in
association with the subsidiary cell. By 12 hpi, although primary infection hyphae
had been formed at some infection sites, at the majority of sites early stages of SSV
development were found. Small numbers of collapsed SSVs were also observed
at 12 hpi (Table 1). Relatively more collapsed SSV initials were recorded at 48 and
96 hpi although numbers were low (Table 1). Some SSVs (often spherical)
produced primary infection hyphae that were very elongated, and which showed no
septum formation (Plate 3 Fig. b). Since none of such structures was seen to have
developed beyond this stage, these were regarded as abortive. Low numbers of
81
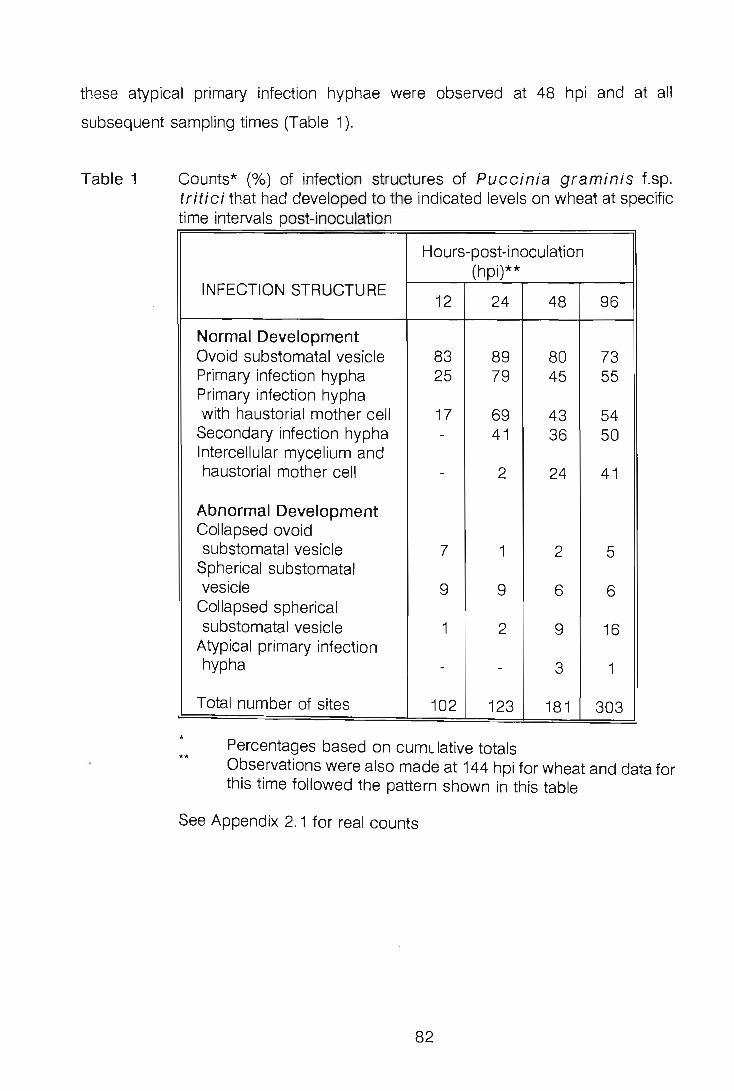
these atypical primary infection hyphae were observed at 48 hpi and at all
subsequent sampling times (Table 1).
Table 1 Counts* (0/0) of infection structures of Puccinia graminis f.sp. tritici that had developed to the indicated levels on wheat at specific time intervals post-inoculation
• ..
Hours-post-inoculation (hpi)**
INFECTION STRUCTURE 12 24 48 96
Normal Development Ovoid substomatal vesicle 83 89 80 73 Primary infection hypha 25 79 45 55 Primary infection hypha with haustorial mother cell 17 69 43 54
Secondary infection hypha - 41 36 50 Intercellular mycelium and haustorial mother cell - 2 24 41
Abnormal Development Collapsed ovoid substomatal vesicle 7 1 2 5
Spherical substomatal vesicle 9 9 6 6
Collapsed spherical substomatal vesicle 1 2 9 16
Atypical primary infection hypha - - 3 1
Total number of sites 102 123 181 303
Percentages based on cumulative totals Observations were also made at 144 hpi for wheat and data for this time followed the pattern shown in this table
See Appendix 2.1 for real counts
82

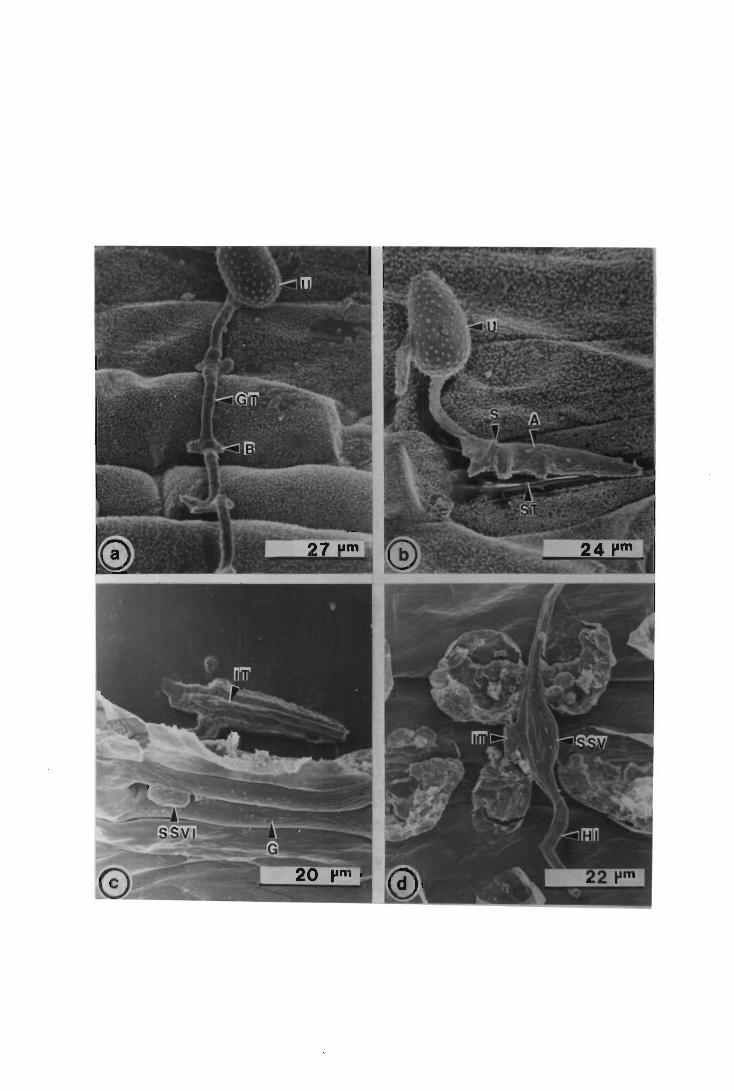
PLATE 2
Development of Puccinia graminis f.sp. tritici on and in the
susceptible wheat cv. McNair
(a) Near-spherical substomatal vesicle initial in wheat at 12 hpi
(b) Elongate substomatal vesicle in wheat at 12 hpi
(c) Mature substomatal vesicle in wheat at 24 hpi
Abbreviations:
SSVI = Substomatal vesicle initial
SSV = Substomatal vesicle
G = Guard cell
84
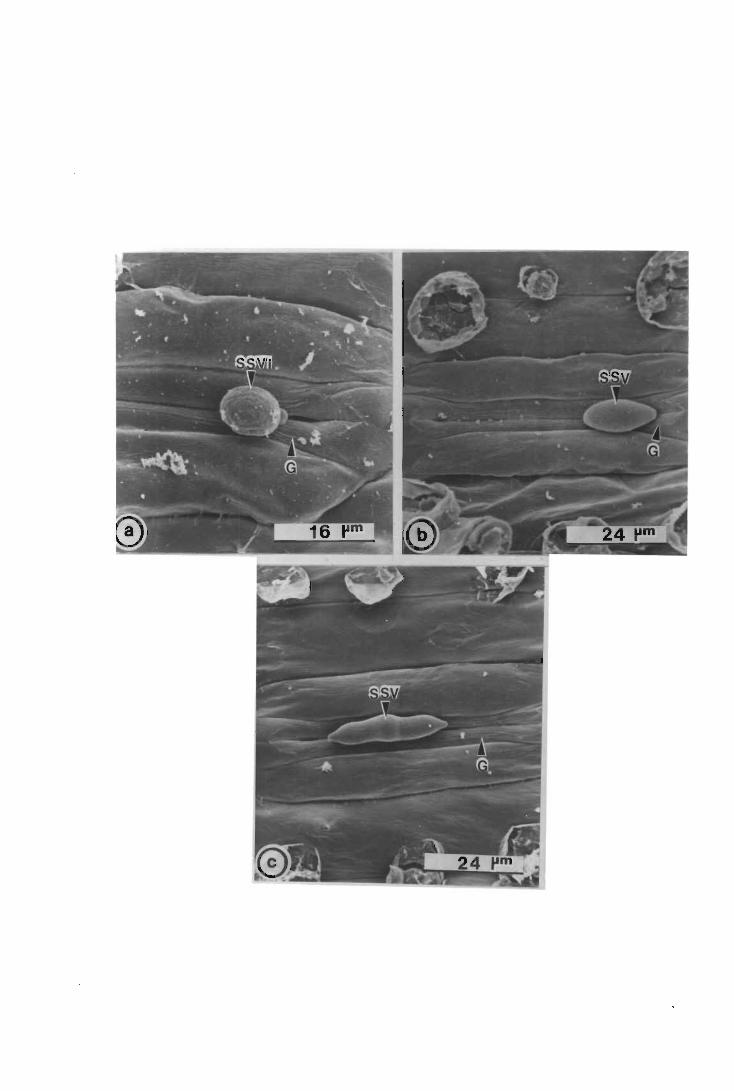
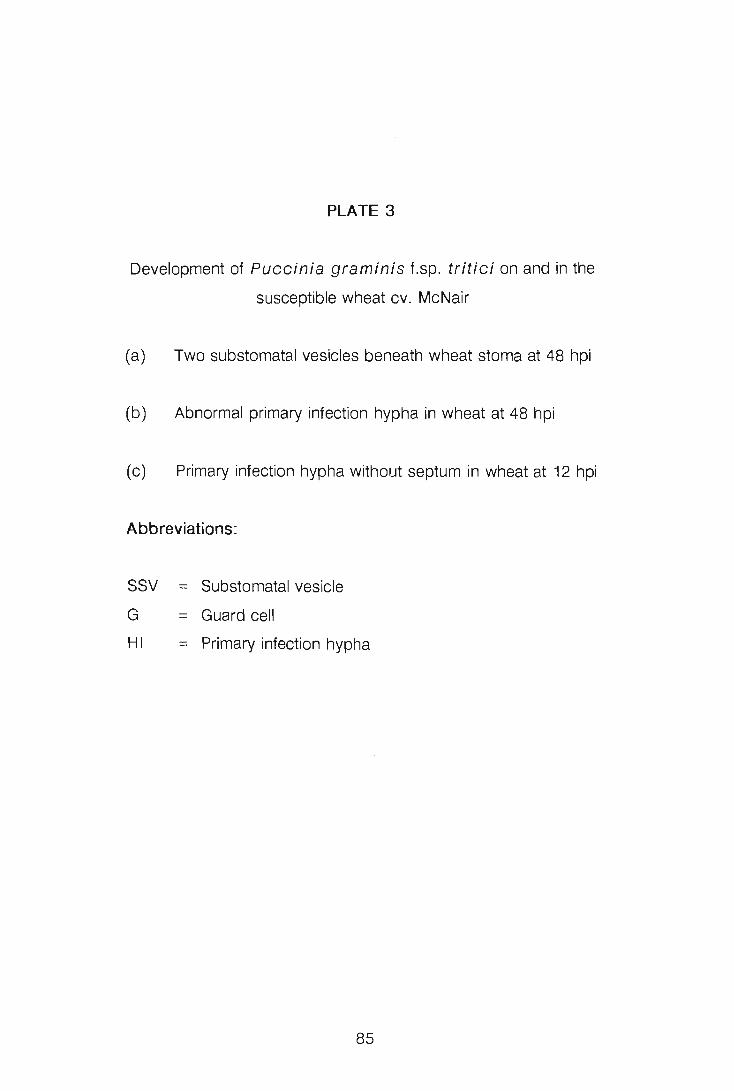
PLATE 3
Development of Puccinia graminis f.sp. tritici on and in the
susceptible wheat cv. McNair
(a) Two substomatal vesicles beneath wheat stoma at 48 hpi
(b) Abnormal primary infection hypha in wheat at 48 hpi
(c) Primary infection hypha without septum in wheat at 12 hpi
Abbreviations:
SSV = Substomatal vesicle
G = Guard cell
HI = Primary infection hypha
85
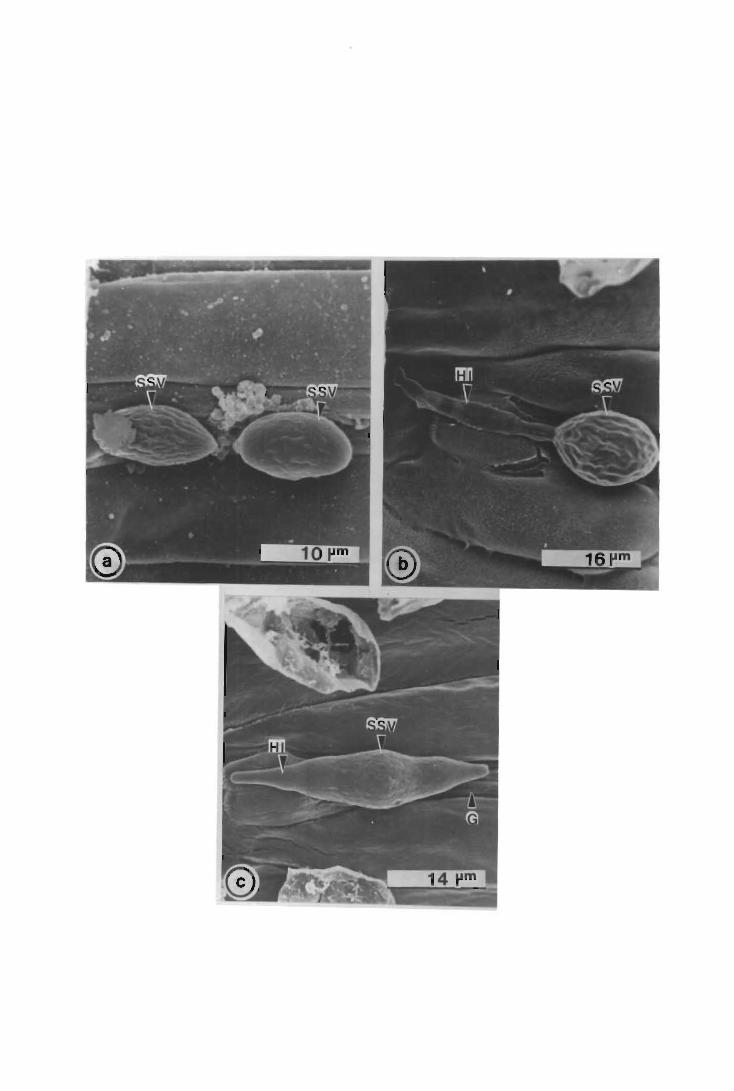
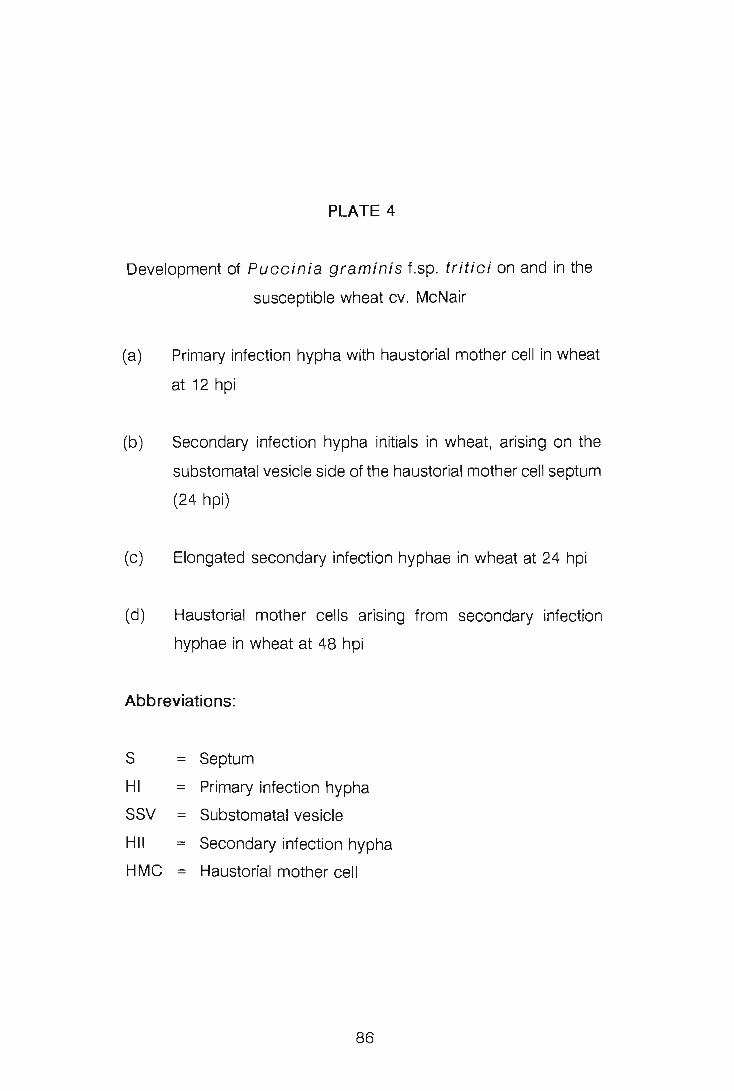
PLATE 4
Development of Puccinia graminis f.sp. tritici on and in the
susceptible wheat cv. McNair
(a) Primary infection hypha with haustorial mother cell in wheat
at 12 hpi
(b) Secondary infection hypha initials in wheat, arising on the
substomatal vesicle side of the haustorial mother cell septum
(24 hpi)
(c) Elongated secondary infection hyphae in wheat at 24 hpi
(d) Haustorial mother cells arising from secondary infection
hyphae in wheat at 48 hpi
Abbreviations:
S = Septum
HI = Primary infection hypha
SSV = Substomatal vesicle
HII = Secondary infection hypha
HMC = Haustorial mother cell
86
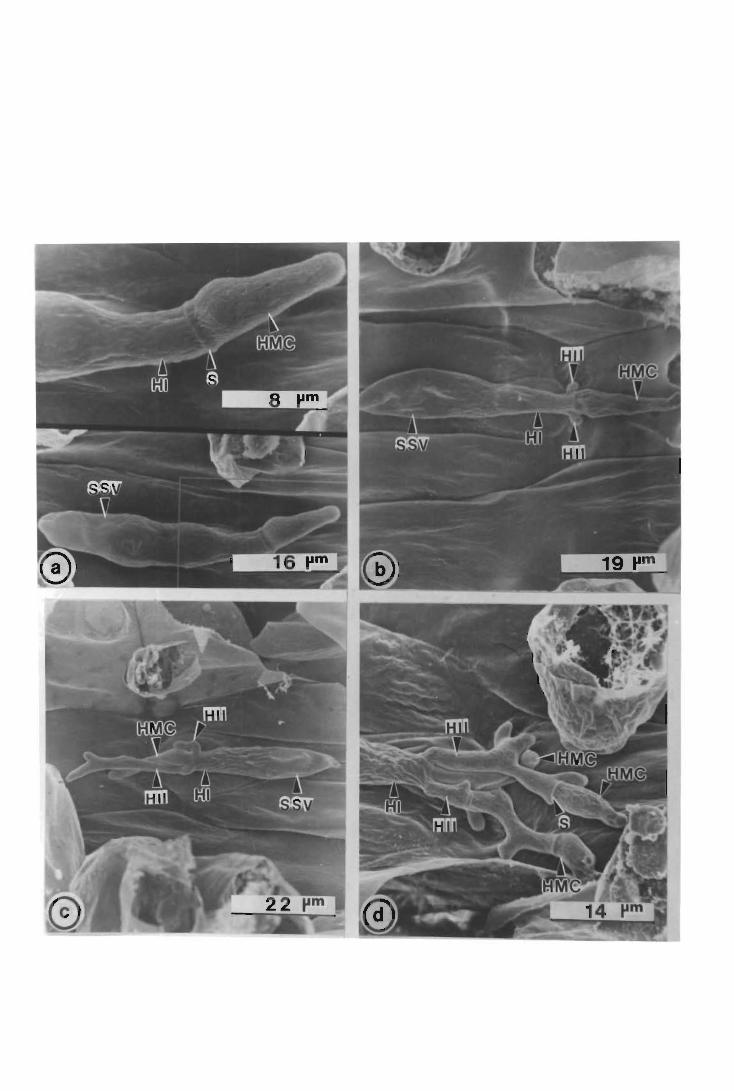
Once the SSV and primary infection hypha have expanded fully, and the first HMC
has been delimited on the primary hypha, secondary infection hyphae emerge at a
position on the SSV side of the septum separating the HMC from the primary
infection hyphae (Plate 4 Fig. b). Generally two secondary infection hyphae emerge
at the septum, though three and four have been observed. By 24 hpi there were
secondary infection hyphae at most infection sites (Table 1). Secondary infection
hyphae elongate (Plate 4 Fig. c), and, by septum formation, cut off a terminal HMC
(Plate 4 Fig. d). HMCs were first observed on secondary infection hyphae at 24 hpi
in two out of 123 sites examined (Table 1). By 48 hpi many secondary hyphae had
formed HMCs (Table 1). HMCs are generally larger in diameter than primary or
secondary infection hyphae, and intercellular hyphae. Further branching occurs on
the proximal side of the HMC septum. Secondary infection hyphae with HMCs give
rise to the intercellular hyphae and in this manner the fungal thallus develops.
At 144 hpi, uredia with a number of immature urediospores were observed.
DISCUSSION
Littlefield & Heath (1979) have reviewed the literature on infection structure
formation. The general sequence of infection structure formation and development
of Puccinia graminis f.s8. tritici on the susceptible wheat cv. McNair closely
follows that described by Allen (1923) for Puccinia graminis f.sp. tritici on the
susceptible wheat cv. Baart.
The germ tubes of Puccinia graminis f.sp. tritici were seen to extend
perpendicularly to the long axis of the leaf. Johnson (1934) first noted that
urediospore germ tubes of Puccinia graminis f.sp. tritici grow predominantly
along the transverse axis of the plant leaf. He postulated that the directional growth
may be a thigmotropic response to the plant surface. Lewis & Day (1972)
proposed that, as the epicuticular wax layer is the only leaf part in direct contact
with the germ tube, this must be the structure to which the germ tube responds.
87
Wynn (1976) demonstrated that the germ tubes of Uromyces phaseoli var.
typica grow at right angles to the large ridges formed by the curvature of the host
epidermis cells. However, Hughes & Rijkenberg (1985) recorded that Puccinia
sorghi germ tubes grow towards maize stomata randomly as they traverse both
axes of the leaf surface, not only by extending across epidermal cells, but also by
following the depressions along both the short and the long anticlinal walls of
epidermal cells.
Allen (1923) observed a septum separating the germ tube and appressorium of
Puccinia graminis f.sp. tritici. This septum was observed in the present SEM
study on Puccinia graminis f .sp. tritici.
The blade-like infection peg which the appressorium pushes through the stomatal
slit prior to SSV initial formation was first described for Puccinia graminis f.sp.
tritici by Allen (1923). Hughes & Rijkenberg (1985) presented evidence that the
infection peg of Puccinia sorghi may penetrate the stomatal slitfirst at both ends
of the stoma, then centripetally. In the present study, the infection peg was
observed to arise unilaterally from the appressorial ridge, progressive intrusion lining
the stomatal slit, giving rise to the blade-like wedge. The septum between SSV and
interconnective tube observed by Hughes & Rijkenber;g (1985) and Davies & Butler
(1986) could not be demonstrated unequivocally for Puccinia graminis f.sp.
tritici as the SEM technique is not always capable of resolving septa.
The SSV initial balloons out near-spherically in the substomatal chamber before
assuming an ovoid shape prior to formation of the primary hypha. The considerable
number of spherical and ovoid SSVs, in both collapsed and non-collapsed state,
persisting at later sampling times, indicates their inability to establish normal host
pathogen interactions, and supports the contention of Hughes & Rijkenberg (1985)
that uredial propagules are not equal in inherent aggressiveness, or that some form
of host resistance is expressed even in the susceptible host. The relatively high
numbers of SSV initials and SSVs, which failed to develop further, observed at the
later harvesting times (48 and 96 hpi) might also indicate that some urediospores
88
take much longer to germinate and infect the host. Niks (1990) found that within
leaves of barley (Hordeum vulgare L) great variation in fate among individual
sporelings of Puccinia hordei Otth., and a negative association was evident
between germ tube length of sporelings and i) the chance of successful colony
establishment, and ii) the size of the established colony. This author suggested that
the formation of a long germ tube decreases the amount of energy available to the
sporeling to infect the host. It is probable that variation in germ tube lengths of
urediospores in part contributes to the variation in fate of the propagules in the
present investigation. It appears that approximately 50% of all infections following
successful penetration have aborted by 96 hpi.
The observation, in this study, of more than one apparently functional substomatal
vesicle occupying the same stomatal chamber, has previously been recorded in a
number of host-rust interactions (Allen, 1923; Davies & Butler, 1986; Ferreira &
Rijkenberg , 1989; Hughes & Rijkenberg , 1985).
Transmission electron microscopy will be required to confirm whether, unlike the
two-celled primary infection hyphae of Puccinia sorghi (Hughes & Rijkenberg,
1985) and Puccinia porri (Davies & Butler, 1986), those of Puccinia graminis
f.sp. tritici are single celled. The terminal cell of the primary hypha of Puccinia
sorghi (Hughes & Rijkenberg, 1985) and Puccinia p~rri (Davies & Butler, 1986)
was observed to be a haustorium mother cell. A fluorescence microscopy
investigation (Lennox & Rijkenberg, 1989) demonstrated the presence of a
haustorium within the host epidermal cell onto which the terminal cell of a primary
hypha abutted. Thus it can be concluded that these terminal cells are haustoria I
mother cells. Hughes & Rijkenberg (1985) suggested that secondary hypha
formation, and subsequent development of the vegetative mycelium, is dependent
on the prior establishment of successful host-pathogen relations by the primary
hypha via the formation of a haustorium.
In Puccinia sorghi (Hughes & Rijkenberg, 1985), and Puccinia graminis f.sp.
tritici, secondary infection hyphae arise on the SSV side of the septum. Such
89
secondary hyphae delimit HMCs and further proliferate into the intercellular
mycelium.
A comparison of the developmental time frame recorded for Puccinia sorghi by
Hughes & Rijkenberg (1985) with that of Puccinia graminis f.sp. tritici in the
present study, reveals that these two rusts are very similar in the time required to
reach a particular infection stage. Both rusts have formed at least some SSV initials
by 6 hpi and primary infection hyphae by 12 to 14 hpi. By 48 hpi, both rusts have
formed secondary infection hyphae, and haustorium mother cells have been
delimited from such hyphae.
The leaf-fracturing technique described by Hughes & Rijkenberg (1985) is simple
to perform on leaf tissues that fracture easily, as wheat did, and is particularly useful
for studies on the infection structure morphology of rust fungi which initially
proliferate in a horizontal, rather than a vertical manner in the leaf. The present
investigation has provided a clear picture of infection structure formation and
morphology of Puccinia graminis f.sp. tritici in wheat.
LITERATURE CITED
Allen R.F. (1923) A cytological study of infection of Baart and Kanred wheats by
Puccinia graminis tritici. Journal of Agricultural Research 23,
121-152.
AI-Issa A.N. & Sigee D.C. (1982) The hypersensitive reaction in tobacco leaf tissue
infiltrated with Pseudomonas pisi. 1. Active growth and division in
bacteria entrapped at the surface of mesophyll cells. Phytopathologische
Zeitschrift 104, 101-114.
Andres M.W. & Wilcoxson R.D. (1984) A device for uniform deposition of liquid
suspended urediospores on seedling and adult cereal plants.
Phytopathology 74, 550-552.
Beckett A. & Porter R. (1982) Uromyces viciae-fabae on Vicia faba:
Scanning electron microscopy of frozen-hydrated material. Protoplasma
90
111, 28-37.
Davies M.E. & Butler G.M. (1986) Development of infection structures of
Uromyces porri, on leek leaves. Transactions of the British
mycological Society 86, 475-479.
Ferreira J.F. & Rijkenberg F.H.J. (1989) Development of infection structures of
Uromyces transversalis in leaves of the host and a nonhost.
Canadian Journal of Botany 67,429-433.
Gold R.E., Littlefield L.J. & Statler G.D. (1979) Ultrastructure of the pycnial and
aecial stage of Puccinia recondita. Canadian Journal of Botany
57,74-86.
Hughes F.L. & Rijkenberg F.H.J. (1985) Scanning electron microscopy of early
infection in the uredial stage of Puccinia sorghi in lea mays. Plant
Pathology 34,61-68.
Johnson T. (1934) A tropic response in germ tubes of urediospores of Puccinia
graminis tritici. Phytopathology 24, 80-82.
Lennox C.L. & Rijkenberg F.H.J. (1989) Fluorescence microscopy of Puccinia
graminis f.sp. tritici in the universal susceptible wheat cultivar McNair.
Proceedings of the Electron Microscopy Society of Southern
Africa 19,81-82.
Lewis B.G. & Day J.R. (1972) Behaviour of urediospore germ-tubes of Puccinia
graminis tritici in relation to the fine structure of wheat leaf surfaces.
Transactions of the British mycological Society 58, 139-145.
Littlefield L.J. & Heath M.C. (1979) Ultrastructure of Rust Fungi. Academic
Press. New York.
Michelmore R.W. & Ingram D.S. (1981) Origin of gametangia in heterothallic
isolates of Bremia lactucae.
mycological Society 76, 425-432.
Transactions of the British
Mims C.W. (1981) Scanning electron microscopy of aeciospore formation in
Puccinia bolleyana. Scanning Electron Microscopy 3, 299-304.
Niks R.E. (1986) Variation of mycelial morphology between species and formae
speciales of rust fungi of cereals and grasses. Canadian Journal of
Botany 64, 2976-2983.
91
Niks R.E. (1990) Effect of germ tube length on the fate of sporelings of Puccinia
hordei in susceptible and resistant barley. Phytopathology 80, 57-60.
Niks R.E., Dekens R.G. & Van Ommeren A. (1989) The abnormal morphology of
a very virulent Moroccan isolate belonging or related to Puccinia hordei.
Plant Disease 73,28-31.
Paliwal Y.C. & Kim W.K. (1974) Scanning electron microscopy of differentiating and
non-differentiating urediosporelings of wheat stem rust fungus (Puccinia
graminis f.sp. tritici) on an artificial substance. Tissue and Cell 6, 391-
397.
Wynn W.K. (1976) Appressorium formation over stomates by the bean rust fungus:
Response to a surface contact stimulus. Phytopathology 66, 136-146.
92
CHAPTER 3
SCANNING ELECTRON MICROSCOPY STUDY OF INFECTION
STRUCTURE FORMATION BY Puccinia graminis f.sp.
tritici ON AND IN THREE CEREAL SPECIES
INTRODUCTION
The infection of higher plants by organisms, normally pathogenic on other species
or genera, results in the expression of the most common, and the most effective
forms of naturally occurring disease resistance (Heath, 1977). Non-host plants of
of pathogens are a potential source of resistance genes for host plants of a
pathogen (Niks, 1987) and a study of the resistance mechanisms expressed by the
non-hosts could provide valuable information in the selection of new resistant host
plants. The elucidation of the mechanisms of non-host resistance has been the
subject of a number of investigations and review articles (Fernandez & Heath,
1985; Heath, 1972; Heath, 1974; Heath, 1977; Heath, 1981; Heath, 1982;
Heath, 1983; Heath & Stumpf, 1986; Leath & Rowell, 1966; Leath & Rowell,
1969; Leath & Rowell, 1970; Niks, 1983; Niks & Dekens, 1987; Sellam &
Wilcoxson, 1976; Stumpf & Heath, 1985; Wood & Heath, 1986). All of these
studies have involved the use of light or transmission electron microscopy
techniques. Hughes & Rijkenberg (1985) published a leaf-fracturing technique
which facilitates the observation of within-leaf infection structures. This technique
has been used in a preliminary study describing the development of Puccinia
graminis f.sp. tritici in a susceptible and a resistant wheat cultivar (Lennox &
Rijkenberg, 1985) and a similar technique was used by Ferreira & Rijkenberg (1989)
to describe development of infection structures of Uromyces transversalis
(Thum.) Winter in leaves of the host (Gladiolus L.) and a non-host (Zea mays L.).
The objectives of the present study were to describe and compare the development
of Puccinia graminis f.sp. tritici infection structures in non-host plant species
93
and to compare their development with those on the susceptible wheat cultivar
McNair as described in Chapter 2.
MATERIALS AND METHODS
Rust propagation and inoculation. Freshly harvested urediospores of Puccinia
graminis f.sp. tritici Eriks. & Henn., produced on 1S-day-old susceptible wheat
(Triticum aestivum L.) cv. Morocco plants in a greenhouse (18 - 3S0C), were
used to inoculate the adaxial surfaces of the third leaf of 7 -day-old sorghum
(Sorghum caffrorum L.) cultivar PNR 8469, the second leaf of 7-day-old barley
(Hordeum vulgare L.) cultivar Diamant and the third leaf of 1S-day-old maize
(Zea mays L.) cultivar B 14rp, at an inoculum dose of SO mg urediospores per ml
of Soltrol® 130 (Phillips Chemical Co.). An investigation of Puccina graminis
f.sp. tritici development on and in the susceptible wheat cultivar McNair (Chapter
2) was conducted simultaneously with the present investigation, the resutts of which
were used for comparative purposes in the present study. A modified Andres &
Wilcoxson (1984) inoculator was used to inoculate the plants. The seedlings were
allowed to dry for an hour and were then placed in a dew chamber at 20°C and
100% RH in the dark. A 12h/12h dark/light regime was followed. The inoculated
leaves of ten seedlings of each plant type were harvested at 6, 12, 24, 48 and 96
hours-post-inoculation (hpi). At 24 hpi the remaining seedlings were removed from
the dew chamber and placed on a bench in a greenhouse at a maximum
temperature of 24°C.
Specimen preparation. The same specimen preparation methods as those
described in Chapter 2 were followed in this study. In addition to the observations
on infection structures within the leaf at 6, 12, 24, 48, and 96 hpi, the outer
epidermal surfaces of non-host material sampled at six hpi were also examined.
OBSERVATIONS
The morphology of infection structures and the pattern of infection structure
94
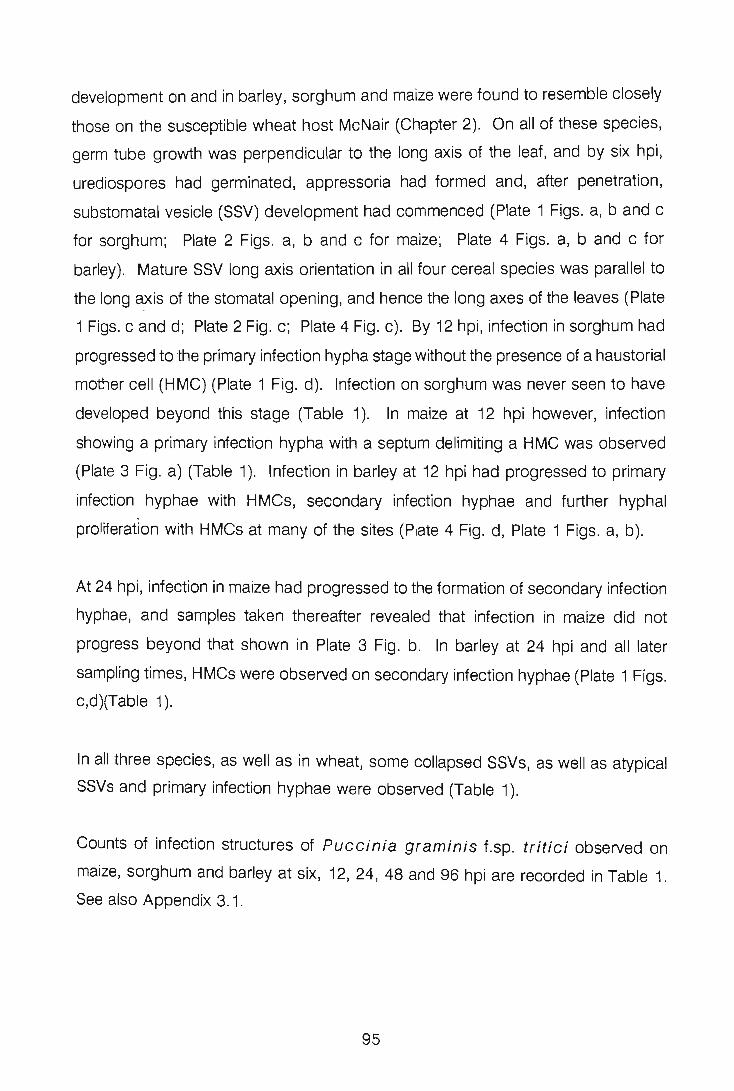
development on and in barley, sorghum and maize were found to resemble closely
those on the susceptible wheat host McNair (Chapter 2). On all of these species,
germ tube growth was perpendicular to the long axis of the leaf, and by six hpi,
urediospores had germinated, appressoria had formed and, after penetration,
substomatal vesicle (SSV) development had commenced (Plate 1 Figs. a, band c
for sorghum; Plate 2 Figs. a, band c for maize; Plate 4 Figs. a, band c for
barley). Mature SSV long axis orientation in all four cereal species was parallel to
the long axis of the stomatal opening, and hence the long axes of the leaves (Plate
1 Figs. c and d; Plate 2 Fig. c; Plate 4 Fig. c). By 12 hpi, infection in sorghum had
progressed to the primary infection hypha stage without the presence of a haustorial
mother cell (HMC) (Plate 1 Fig. d). Infection on sorghum was never seen to have
developed beyond this stage (Table 1). In maize at 12 hpi however, infection
showing a primary infection hypha with a septum delimiting a H MC was observed
(Plate 3 Fig. a) (Table 1). Infection in barley at 12 hpi had progressed to primary
infection hyphae with HMCs, secondary infection hyphae and further hyphal
proliferation with HMCs at many of the sites (Plate 4 Fig. d, Plate 1 Figs. a, b).
At 24 hpi, infection in maize had progressed to the formation of secondary infection
hyphae, and samples taken thereafter revealed that infection in maize did not
progress beyond that shown in Plate 3 Fig. b. In barley at 24 hpi and all later
sampling times, HMCs were observed on secondary infection hyphae (Plate 1 Figs.
c,d)(Table 1).
In all three species, as well as in wheat, some collapsed SSVs, as well as atypical
SSVs and primary infection hyphae were observed (Table 1).
Counts of infection structures of Puccinia graminis f.sp. tritici observed on
maize, sorghum and barley at six, 12, 24, 48 and 96 hpi are recorded in Table 1.
See also Appendix 3.1.
95
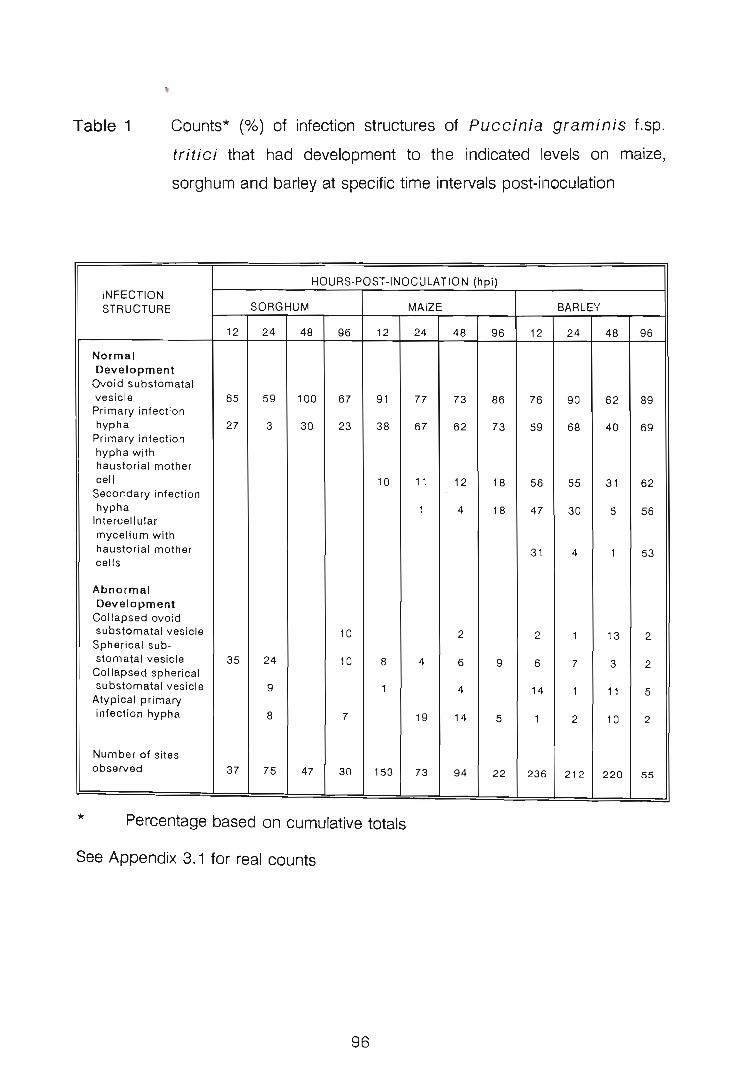
•
Table 1 Counts* (%) of infection structures of Puccinia graminis f.sp.
tritici that had development to the indicated levels on maize,
sorghum and barley at specific time intervals post-inoculation
HOURS-POST-INOCULATION (hpi) INFECTION STRUCTURE SORGHUM MAIZE BARLEY
12 24 48 96 12 24 48 96 12 24 48 96
Normal Development
Ovoid substomatal vesi cle 65 59 100 67 91 Primary infection
77 73 86 76 90 62 89
hypha 27 3 30 23 38 67 62 73 59 68 40 69 Pr imary infection hypha with haustorial mother cell 10 11 12
Secondary Infection 18 56 55 31 62
hypha 1 Intercell u lar
4 18 47 30 5 56
mycelium with haustorial mother cells
3 1 4 1 53
Abnormal Development
Collapsed ovo id substomata l ves icle 10 2 2 1 13 2
Spherical sub-stomatal vesicle 35 24 10 8 4 6 9 6 7 3 2
Collapsed spherical substomatal vesicle 9 1 4 14 1 11 5 Atypical primary infection hypha 8 7 19 14 5 1 2 10 2
Number of sites observed 37 75 47 30 153 73 94 22 236 212 220 55
* Percentage based on cumulative totals
See Appendix 3. 1 for real counts
96
PLATE 1
Development of Puccinia graminis f.sp. tritici on and in the
sorghum cv. PNR 8469
(a) Germ tube and appressorium on sorghum at 6 hpi
(b) Substomatal vesicle initial in sorghum at 6 hpi
(c) Substomatal vesicle in sorghum at 6 hpi
(d) Primary infection hypha without septum, at 12 hpi in sorghum
Abbreviations:
U = Urediospore
GT = Germ tube
A = Appressorium
SSVI = Substomatal vesicle initial
SSV = Substomatal vesicle
G = Guard cell
HI = Primary infection hypha
97
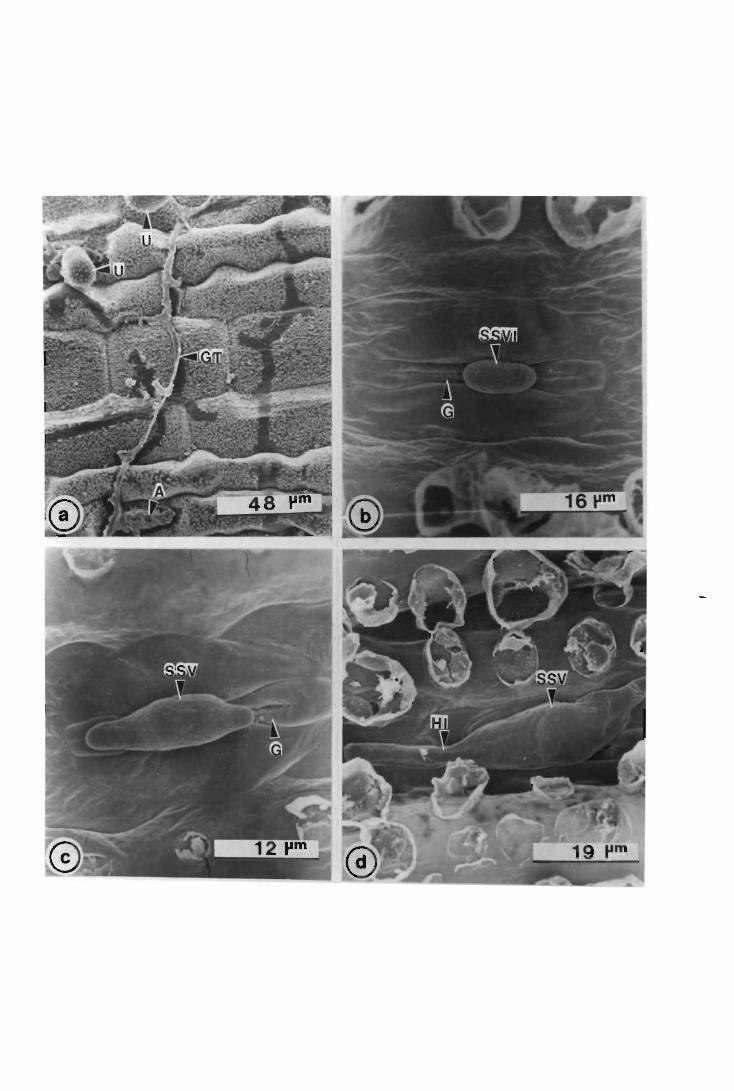
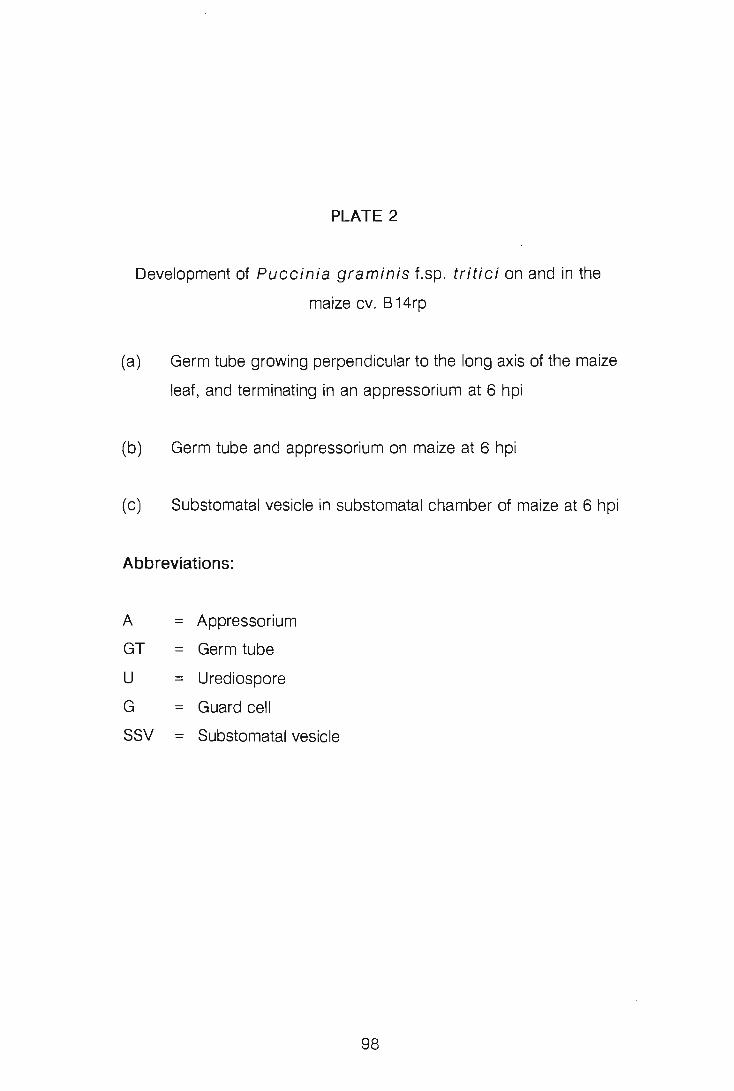
PLATE 2
Development of Puccinia graminis f.sp. tritici on and in the
maize cv. B 14rp
(a) Germ tube growing perpendicular to the long axis of the maize
leaf, and terminating in an appressorium at 6 hpi
(b) Germ tube and appressorium on maize at 6 hpi
(c) Substomatal vesicle in substomatal chamber of maize at 6 hpi
Abbreviations:
A = Appressorium
GT = Germ tube
U = Urediospore
G = Guard cell
SSV = Substomatal vesicle
98
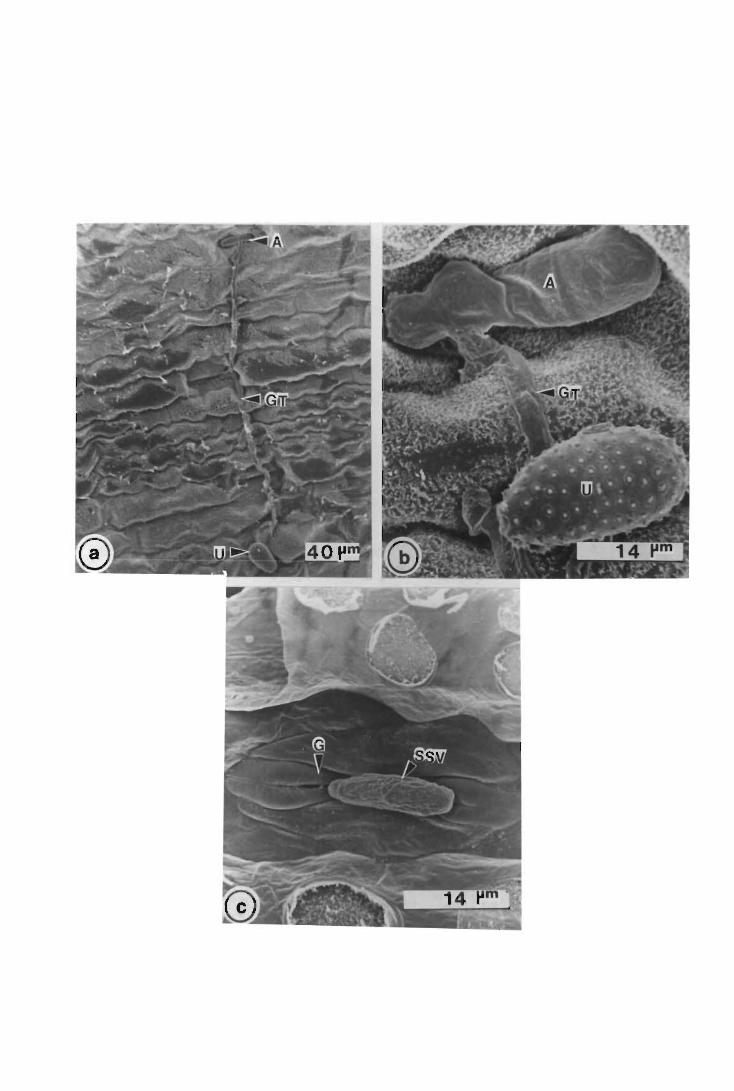
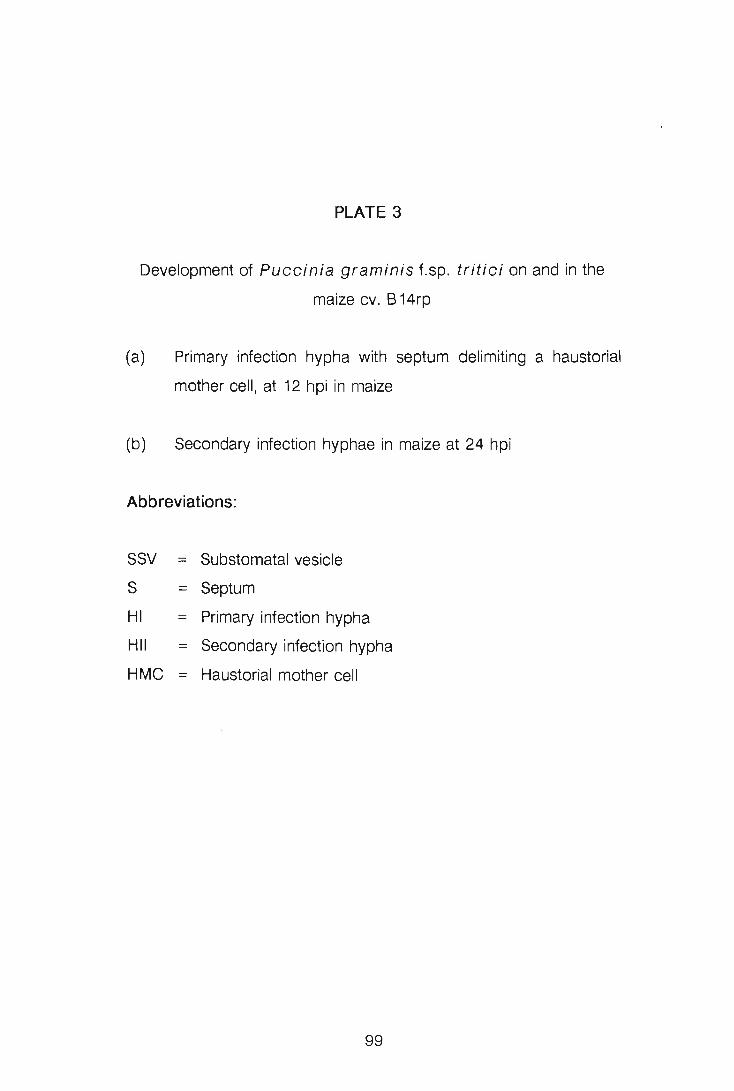
PLATE 3
Development of Puccinia graminis f.sp . tritici on and in the
maize cv. B 14rp
(a) Primary infection hypha with septum delimiting a haustorial
mother cell, at 12 hpi in maize
(b) Secondary infection hyphae in maize at 24 hpi
Abbreviations:
SSV = Substomatal vesicle
S = Septum
HI = Primary infection hypha
HII = Secondary infection hypha
HMC = Haustorial mother cell
99
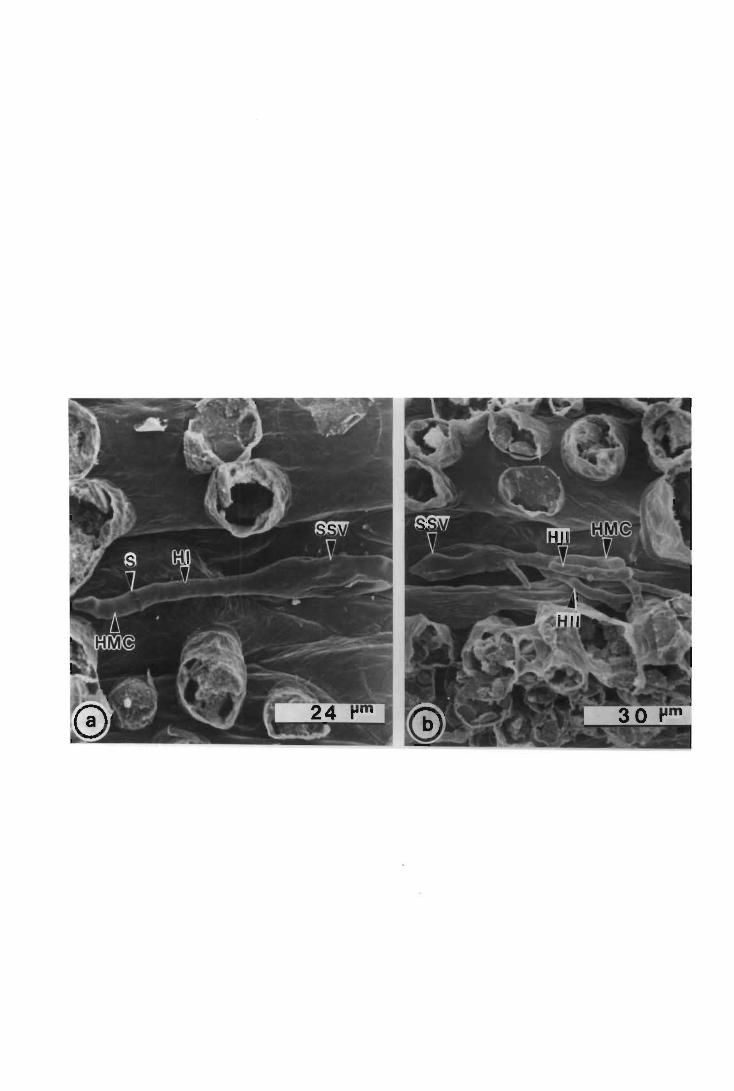
PLATE 4
Development of Puccinia graminis f.sp. tritici on and in the
barley cv. Diamant
(a) Germ tube and appressorium on barley at 6 hpi
(b) Substomatal vesicle initial in barley at 6 hpi
(c) Substomatal vesicle in barley at 6 hpi
(d) Primary infection hypha with haustorial mother cell, at 12 hpi in
barley
Abbreviations:
U = Urediospore
GT = Germ tube
A = Appressorium
SSVI = Substomatal vesicle initial
SSV = Substomatal vesicle
G = Guard cell
HI = Primary infection hypha
S = Septum
HMC = Haustorial mother cell
100
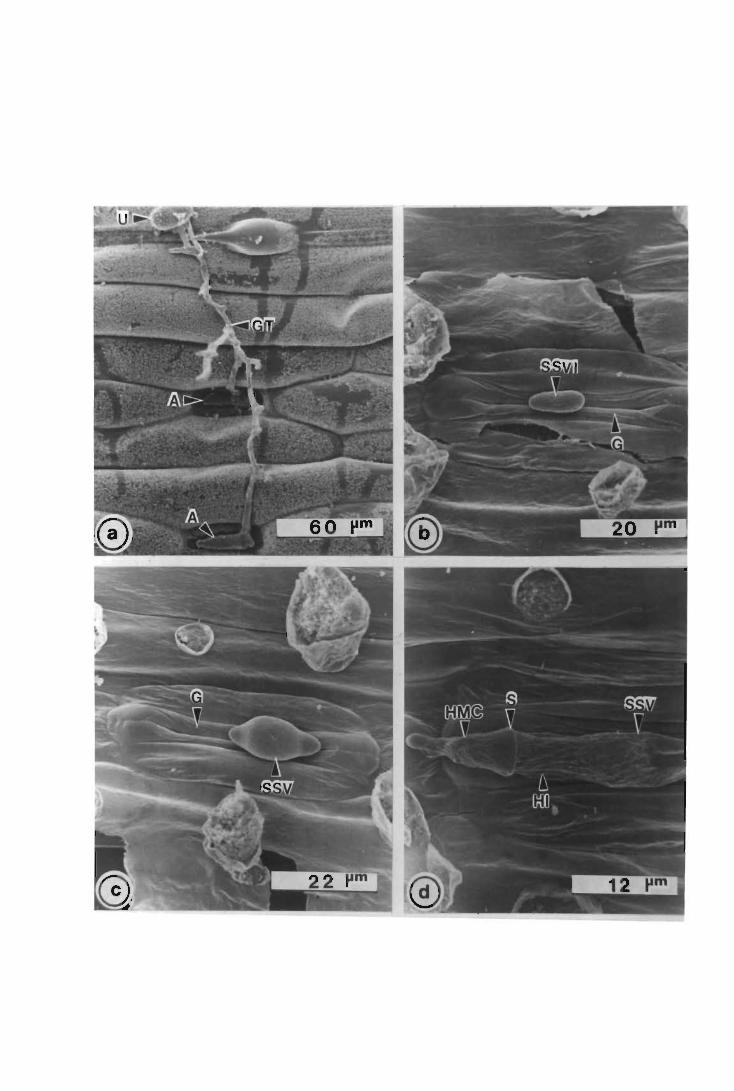
PLATE 5
Development of Puccinia graminis f.sp. tritici on and in the
barley cv. Diamant
(a) Secondary infection hyphae in barley at 12 hpi
(b) Thallus formation in barley at 12 hpi
(c) Haustorial mother cells at tips of secondar infection hyphae in
barley at 24 hpi
(d) Hyphal branch arising from behind the haustorial mother cell
septum of a secondary infection hypha in barley at 24 hpi
Abbreviations:
SSV = Substomatal vesicle
HI = Primary infection hypha
HII = Secondary infection hypha
S = Septum
HMC = Haustorial mother cell
H = Hyphal branch
101
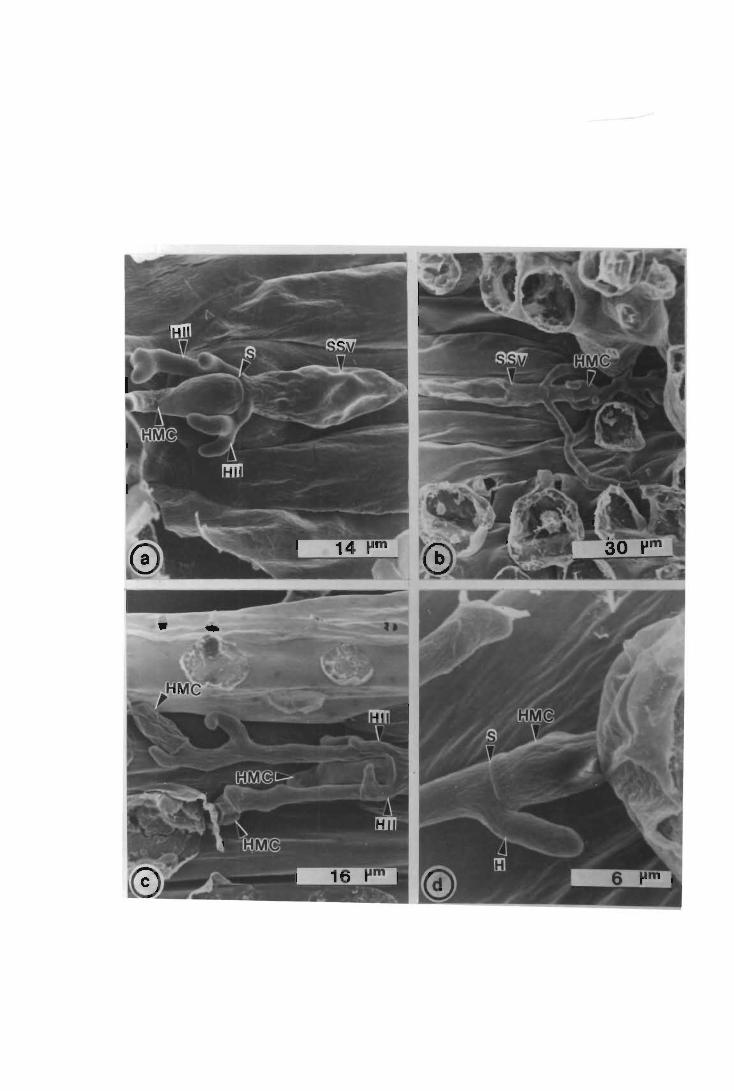
DISCUSSION
The morphology and general pattern of initial development of Puccinia graminis
f.sp. tritici infection structures on sorghum, maize and barley is the same as that
found on the susceptible wheat cultivar McNair (Chapter 2). Niks (1986) showed
that a number of rust species have a characteristic morphology of infection
structures, irrespective of the plant in which they had formed, and that these
characteristics could be used to identify rust taxa of single sporelings at least to the
species level in the absence of the host.
As the research for Chapter 2 was conducted at the same time and under the same
conditions as the components of the study presented here, comparisons of
observations on and in host and non-host plants could validly be made. Heath
(1974; 1977) observed that the surface characteristics of non-host leaves, such as
hirsuteness and waxiness, may play an important practical part in non-host
resistance in the field as these may reduce the number of urediospores which
encounter favourable conditions for germination.
On the three non-hosts species in the present study, germ tubes grew in a direction
perpendicular to the long axis of the leaf, then forming appressorium identical in
morphology to those observed on McNair (Chapter 2). Directional growth towards
a stoma, and the subsequent induction of an appressorium seems to be a response
to the particular topographical features of the leaf surface (Wynn & Staples, 1981).
According to Heath (1977) , whether the behaviour of a rust propagule on the leaf
surface plays a significant role in non-host resistance, essentially depends on
whether such behaviour results in fewer attempts at penetration into the leaf than
are found on the host plant. Leath & Rowell (1966) found no differences in
attempts at leaf penetration by Puccinia graminis on wheat or maize, and an
analysis of resistance components by Niks & Dekens (1987) indicated that stomatal
penetration on an inappropriate (non-) host species by Puccinia recondita f.sp.
tritici and Puccinia recondita recondita is not hampered significantly.
Ferreira & Rijkenberg (1989) found that many of the germ tubes of gladiolus rust
102
aborted on maize leaves, and of those that successfully formed appressoria on
maize, many were unable to penetrate the stomatal slit. Heath (1974, 1977)
observed a reduction in penetration attempts in only certain non-host species and
she concluded that reduced penetration may be an important source of resistance
of at least some non-host plants in the field.
The results presented here indicate that resistance within leaves expresses itself at
different times in each non-host species. The internal restriction mechanisms of
sorghum showed fungal development to have been arrested at the primary infection
hypha stage without the cutting off of a HMC. Later sampling revealed that the
fungus does not develop beyond this. Heath (1977) found that in non-host plants,
fungal growth commonly ceased before the formation of a primary HMC, and this
cessation in growth did not appear to be the result of the presence of a growth
inhibitor, but rather the result of the absence of a septum delimiting the HMC. In the
present investigation, the absence of HMCs on hyphae in sorghum would indicate
that in this non-host, Puccinia graminis f.sp. tritici does not "recognize" the
environment and is not stimulated to form the septum which would delimit a HMC
from the primary infection hypha.
In maize at 12 hpi however, primary infection hyphae with associated HMCs were
observed, and at 24 hpi, secondary infection hyphae were present. Secondary
infection hyphae constituted the most advanced stage observed on maize. Leath
& Rowell (1966) recorded that HMCs were not formed in maize leaves infected with
wheat stem rust, and these two authors (Leath & Rowell, 1966; Leath & Rowell,
1969; Leath & Rowell, 1970) proposed that the presence of a growth inhibitor
could account for the resistance of maize to wheat stem rust. Heath (1974),
investigating the growth of cowpea rust (Uromyces phaseoli (pers.) Wint. var
vignae (Barcl.) Arth.) in a number of non-host plants, observed that in non-host
plants in which HMCs formed, very few haustoria were seen, and ultrastructural
investigations suggested that haustorium formation could be inhibited by at least
three mechanisms: depostion of osmiophilic material on adjacent non-host walls,
loss of contact between HMC and non-host cell, or fungal death prior to haustorium
103
initiation. Heath (1977) working with non-host interactions of maize, sunflower and
cowpea rusts, found that whether a haustorium formed or not, secondary hyphae
sometimes started to develop from the region of the infection hyphae adjacent to
the HMC. These secondary infection hyphae remained short and never developed
HMCs or haustoria of their own. The observations of Puccinia graminis f.sp.
tritici in the non-host maize made in the present study are similar to those made
by Heath (1977).
The development of Puccinia graminis f.sp. tritici on the barley cultivar
Diamant, was more advanced than that on the susceptible host McNair at 12 hpi,
and the secondary infection hyphae observed in barley were well developed, many
with a HMC. There is no sporulation of Puccinia graminis f.sp. graminis on
barley cultivar Diamant (personal observation by author), thus, clearly this barley
cultivar is resistant to race 2SA2 of this pathogen. A light microscopy study of the
development of Puccinia graminis f.sp. tritici on resistant and susceptible
barley cultivars by Sellam & Wilcoxson (1976) revealed that there were no significant
differences between resistant and susceptible cultivars in urediospore germination,
appressorium formation or penetration however, growth of the pathogen was
restricted in leaves of resistant, but not susceptible cultivars. From the results of the
present study, it would appear that resistance to Puccinia graminis f.sp. tritici
race 2SA4 is expressed in a similar manner to that shown by the resistant barley
cultivars examined by Sellam & Wilcoxson (1976), ie. expressed after penetration
has occurred and once the hyphae have begun to colonize the leaf tissue. It was
not possible to explain why the counts of infection structures at 12 hpi in barley
were higher than counts made at 24 and 48 hpi .
Heath (1982) stated that non-host responses typically occur during the earliest
stages of infection and are usually characterized by the cessation of fungal growth
before the formation of the first haustorium. Thus from the observations presented
in this paper and in previous investigations, it can be concluded that sorghum and
maize are typical non-hosts of Puccinia graminis f.sp. tritici whereas barley can
be placed in the host range of this rust fungus.
104
LITERATURE CITED
Andres M.W. & Wilcoxson R.D. (1984) A device for uniform deposition of liquid-
. suspended urediospores on seedling and adult cereal plants.
Phytopathology 74, 550-552.
Fernandez M.R. & Heath M.C. (1985) Cytological responses induced by five
phytopathogenic fungi in a non-host plant, Phaseolus vulgaris.
Canadian Journal of Botany 64,648-657.
Ferreira J.F. & Rijkenberg F.H.J. (1989) Development of infection structures of
Uromyces transversalis in leaves of the host and a nonhost. Canadian
Journal of Botany 67, 429-433.
Heath M.C. (1972) Ultrastructure of host and non-host reactions to cowpea
rust. Phytopathology 62, 27-38.
Heath M.C. (1974) Light and electron microscope studies of the interaction of host
and non-host plants with cowpea rust -Uromyces phaseoli var. vignae.
Physiological Plant Pathology 4, 403-414.
Heath M.C. (1977) A comparative study of non-host interactions with rust
fungi. Physiological Plant Pathology 10, 73-88.
Heath M.C. (1981) Nonhostresistance.ln: Plant Disease Control: Resistance
and Susceptibility. (Ed. by R.C. Staples & G.H. Toenniessen), pp. 201-
217. John Wiley & Sons, New York.
Heath M.G. (1982) Host defense mechanisms. In: The Rust Fungi. (Ed. by K.J.
Scott & A.K. Ghakravorty), pp. 223-245. Academic Press, London.
Heath M.G. (1983) Relationship between developmental stage of the bean rust
fungus and increased susceptibility of surrounding bean tissue to the
cowpea rust fungus. Physiological Plant Pathology 22, 45-50.
Heath M.C. & Stumpf M.A. (1986) Ultrastructural observations of penetration sites
of the cowpea rust fungus in untreated and silicon-depleted French bean
cells. Physiological and Molecular Plant Pathology 29, 27-39.
Hughes F.L. & Rijkenberg F.H.J. (1985) Scanning electron microscopy of early
infection in the uredial stage of Puccinia sorghi in Zea mays. Plant
Pathology 34, 61-68.
105
Leath K.T. & Rowell J.B. (1966) Histological study of the resistance of Zea mays
to Puccinia graminis. Phytopathology 56, 1305-1309.
Leath K.T. & Rowell J.B. (1969) Thickening of corn mesophyll cell walls in response
to invasion by Puccinia graminis. Phytopathology 59, 1654-1656.
Leath K.T. & Rowell J.B. (1970) Nutritional and inhibitory factors in the resistance
of Zea mays to Puccinia graminis. Phytopathology 60, 1097-1100.
Lennox C.L. & Rijkenberg F.H.J. (1985) Infection structure formation in two near
isogenic wheat varieties by the wheat stem rust fungus. Proceedings of
the Electron Microscopy Society of Southern Africa 15,95-96.
Niks R.E. (1983) Haustorium formation by Puccinia hordei in leaves of
hypersensitive, partially resistant, and nonhost plant genotypes.
Phytopathology 73, 64-66.
Niks R.E. (1986) Variation of mycelial morphology between species and formae
speciales of rust fungi of cereals and grasses. Canadian Journal of
Botany 64, 2976-2983.
Niks R.E. (1987) Nonhost plant species as donors for resistance to pathogens with
narrow host range. I. Determination of nonhost status. Euphytica 36, 841-
852.
Niks R.E. & Dekens R.G. (1987) Histological studies on the infection of triticale,
wheat and rye by Puccinia recondita f.sp. tritici and P. recondita
f.sp. recondita. Euphytica 36, 275-285.
Sellam M.A. & Wilcoxson R.D. (1976) Development of Puccinia graminis f.sp.
tritici on resistant and susceptible barley cultivars. Phytopathology 66,
667-668.
Stumpf M.A. & Heath M.C. (1985) Cytological studies of the interactions between
the cowpea rust fungus and silicon-depleted French bean plants.
Physiological Plant Pathology 27, 369-385.
Wood L.A. & Heath M.C. (1986) Light and electron microscopy of the interaction
between the sunflower rust fungus (Puccinia helianthi) and leaves of the
non-host plant, French bean (Phaseolus vulgaris). Canadian Journal
of Botany 64, 2476-2486.
Wynn W.K. & Staples R.C. (1981) Tropisms of fungi in host recognition. In: Plant
106
Disease Control: Resistance and Susceptibility. (Ed. by R.e. Staples
& G.H. Toenniessen), pp. 45-69. John Wiley & Sons, New York.
107
CHAPTER 4
EXPRESSION OF STEM RUST RESISTANCE GENE Sr5
INTRODUCTION
Histological studies have played an important role in the elucidation of the timing
and expression of mechanisms in by plants which confer resistance to infection by
the rust fungi. They have enabled researchers to determine whether the response
is one of a host or a non-host plant (Niks, 1987), whether a non-host reaction is
based on some kind of avoidance or on true resistance (Niks, 1981) and, whether
resistance in plants to the rust fungi is expressed pre-haustorially or post
haustorially. Heath (1982b) concluded that non-host reactions to rusts are usually
of the pre-haustorial type, whereas major-genic host resistance to the rusts is often
post -haustorial.
A number of comparative histological light microscopy investigations have been
conducted in an attempt to relate histological observations of wheat (Triticum
aestivum L.) - stem rust (Puccinia graminis (Pers.) f.sp. tritici Erikks. &
Henn.) interactions to specific stem rust (Sr) genes known to be present in the
wheat cultivar. Rohringer et a/. (1979) reported differences in response to infection
among nearly-isogenic lines of wheat containing Sr5, Sr6, SrB and Sr22 genes
for resistance to stem rust, while a number of researchers have investigated the
effect of temperature sensitive Sr genes in wheat lines, for example, Sr6 (Harder
et a/. 1979 a, b; Manocha, 1975; Mayama et a/., 1975; Samborski et a/.,
1977; Skipp & Samborski, 1974; Skipp et a/. 1974), Sr15 (Gousseau & Deverall,
1986; Gousseau et a/., 1985), Sr9b and Sr14 (Gousseau et a/., 1985)
The aim of this investigation was to determine the timing and expression of
resistance conditioned by the stem rust resistance gene Sr5, and use was made
of a quantitative histological technique to study the pre-penetration, penetration, and
post-penetration phases of infection of race 2SA2 of the wheat stem rust fungus
108
formed on and in the wheat line ISr5Ra compared with those formed on the wheat
line ISraRa.
MATERIALS AND METHODS
Plant material and inoculation
The wheat (Triticum aestivum L.) lines used were ISr5Ra (C.1. 14159) and
ISraRa (C.1. 14167) which have stem rust resistance genes Sr5 and SrB
respectively (Roelfs & McVey, 1979). Seedlings were grown and inoculated with
race 2SA2 of the wheat stem rust fungus Puccinia graminis f.sp. tritici as
described in Chapter 2. Race 2SA2 (standard race 21) has an avirulence / virulence
formula of 5,6, 8b, 9b, ge, 13, 17,21,22,24,25,26,27,29,30,31,32,35,36,
dp2, Tt3/ 7a, 7b, 8a, 9a, 9d, 9f, 9g, 10, 11, 14, 16, 18, 19,20,28 (Le Raux, 1986)
and gives a highly resistant infection type (0;) on ISr5Ra and a fully susceptible
infection type (4) on ISraRa on the Stakman scale (Stakman et a/., 1962).
Ten rust-infected primary leaves of each line were collected at 48 hours post
inoculation (hpi). Leaves were cut into 3 cm lengths, fixed, and stained with a 0,1%
solution of t~e optical brightener Blancophor® BA 267% (Bayer, South Africa) as
described by Kuck et a/. (1981) and Rohringer et a/. (1977). A previous study
(Lennox & Rijkenberg, 1989) on the usefulness of a number of fluorochromes in the
visualization of Puccinia graminis f.sp. tritici in wheat, revealed that Blancophor
allowed for a better visualization of fungal infection structures than did Calcofluor~
White ST (American Cyanamid Company, New Jersey). Consequently, Blancophor
was used in the present investigation.
The leaf pieces were examined using a Zeiss research microscope fitted with
epifluorescence equipment (light source HBO 50, red suppression filter BG 38,
exciter filter BP 390-440, chromatic beam splitter FT 460, barrier filter LP475).
Colour photographs were taken using Ektachrome 160 Professional 35 mm film.
At each infection site, the stage to which the fungal infection had advanced was
109
noted and, if present, the number of secondary haustorial mother cells were
recorded.
Modifications to the method of Rohringer et al. (1977) by Kuck et al. (1981) for
visualizing rust haustoria failed to stain haustoria reliably in the present investigation,
limitations also noted by Southerton & Deverall (1989). Consequently, numbers of
haustoria were not quantified in the present investigation.
Four replicates in time of the experiment were conducted and the results were
compared 'statistically using a one-way and multivariate ANOVA test.
RESULTS
Infection types
Primary leaf infection types recorded 12 days post inoculation as described by
Stakman et al. (1962) were 0; on ISr5Ra and 4 on ISrBRa.
Fluorescence microscopy observations and analysis of data
Rust development in lines ISr5Ra and ISrBRa followed the same pattern as that
found in the universal stem rust susceptible wheat cultivar McNair and described in
Chapter 2 of this thesis. Germ tubes, appressoria, substomatal vesicles, primary
infection hyphae, secondary infection hyphae and haustorial mother cells fluoresced
a bright yellow. Haustorial mother cells exhibited a much more intense fluorescence
than that observed in the other fungal structures. Occasionally, haustoria were
detected as small brightly fluorescing structures within the host cell. In this study,
as in the fluorescence microscopy observations of stem rust in the universal stem
rust susceptible wheat cultivar McNair (Lennox & Rijkenberg, 1989), the terminal
cells of primary infection hyphae were seen to be haustorial mother cells, as
haustoria were detected in the host cells onto which these terminal cells abutted.
110
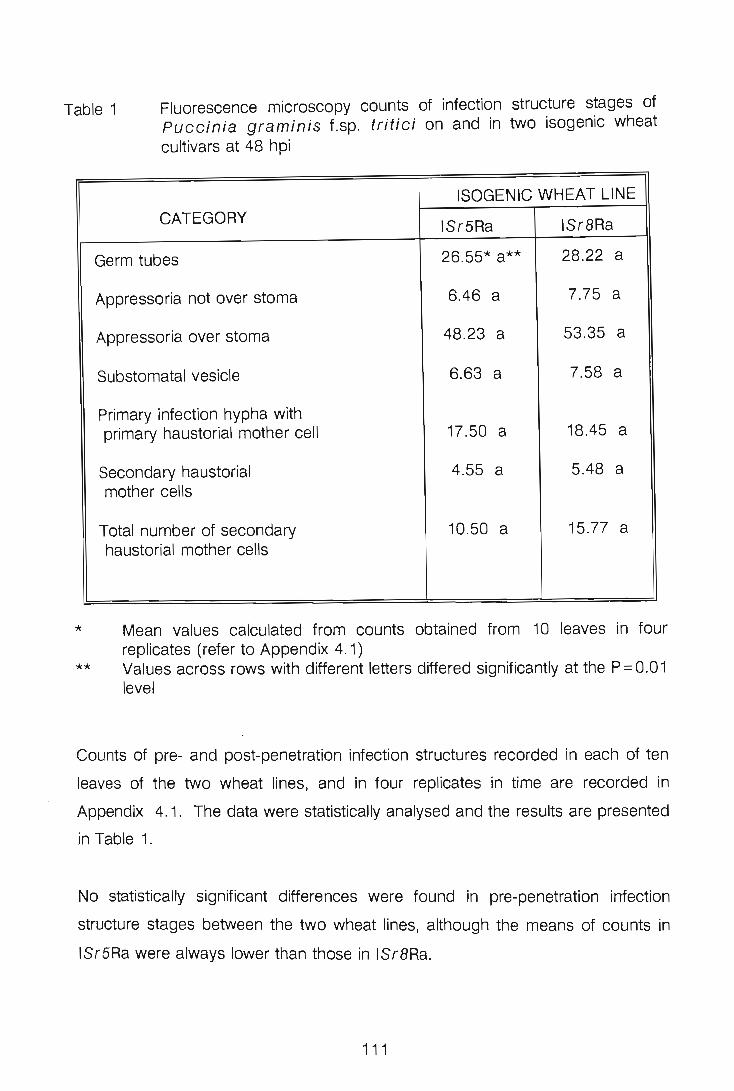
Table 1 Fluorescence microscopy counts of infection structure stages of Puccinia graminis f.sp. tritici on and in two isogenic wheat cultivars at 48 hpi
*
**
ISOGENIC WHEAT LINE CATEGORY
ISr5Ra ISrBRa
Germ tubes 26.55* a** 28.22 a
Appressoria not over stoma 6.46 a 7.75 a
Appressoria over stoma 48.23 a 53.35 a
Substomatal vesicle 6.63 a 7.58 a,
Primary infection hypha with primary haustorial mother cell 17.50 a 18.45 a
Secondary haustorial 4.55 a 5.48 a mother cells
Total number of secondary 10.50 a 15.77 a haustorial mother cells
Mean values calculated from counts obtained from 10 leaves in four replicates (refer to Appendix 4.1) Values across rows with different letters differed significantly at the P = 0.0 1 level
Counts of pre- and post-penetration infection structures recorded in each of ten
leaves of the two wheat lines, and in four replicates in time are recorded in
Appendix 4. 1. The data were statistically analysed and the results are presented
in Table 1.
No statistically significant differences were found in pre-penetration infection
structure stages between the two wheat lines, although the means of counts in
ISr5Ra were always lower than those in ISr8Ra.
111
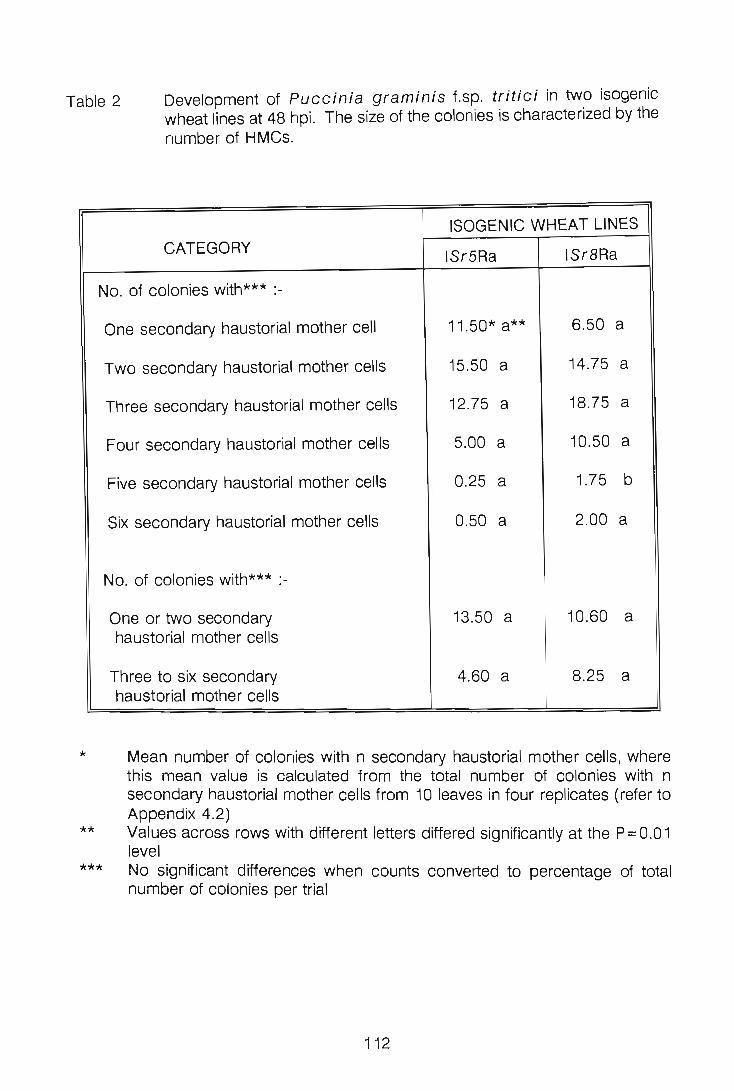
Table 2 Development of Puccinia graminis f.sp. tritici in two isogenic wheat lines at 48 hpi. The size of the colonies is characterized by the number of HMCs.
*
**
***
ISOGENIC WHEAT LINES CATEGORY
ISr5Ra ISr8Ra
No. of colonies with*** :-
One secondary haustorial mother cell 11.50* a** 6.50 a
Two secondary haustorial mother cells 15.50 a 14.75 a
Three secondary haustorial mother cells 12.75 a 18.75 a
Four secondary haustorial mother cells 5.00 a 10.50 a
Five secondary haustorial mother cells 0.25 a 1.75 b
Six secondary haustorial mother cells 0.50 a 2.00 a
No. of colonies with*** :-
One or two secondary 13.50 a 10.60 a haustorial mother cells
Three to six secondary 4.60 a 8.25 a haustorial mother cells
Mean number of colonies with n secondary haustorial mother cells, where this mean value is calculated from the total number of colonies with n secondary haustorial mother cells from 10 leaves in four replicates (refer to Appendix 4.2) Values across rows with different letters differed significantly at the P = 0.0 1 level No significant differences when counts converted to percentage of total number of colonies per trial
112
Rust colonies in ISr5Ra were typically associated with autofluorescing host cells
which fluoresced an orange-yellow colour, whereas cells of ISrBRa were seldomly
seen to exhibit this autofluorescence. Uninfected host cells showed a slight green
fluorescence. Autofluorescing host cells were not quantified in this investigation.
Statistical analysis of post-penetration infection structure stages also showed that
there were no significant differences in counts of these stages between the two
wheat lines, however, means of counts were lower in ISr5Ra.
From visual observations it appeared that ISr5Ra housed fewer infection sites (or
colonies) with higher numbers of secondary haustorial mother cells than ISrBRa.
A comparison of the numbers of colonies and the number of secondary haustorial
mother cells originating from them was made between the two wheat lines (Table
2). The two wheat lines differed significantly in only one category, namely ISr5Ra
had significantly lower numbers of colonies with five haustorial mother cells,
although caution must be exercised in in determining the significance of this finding
as the numbers of colonies with five or six haustorial mother cells were very low in
both wheat lines at 48 hpi.
A study of the results in Table 2 indicate a distribution of the rust population into two
distinct groups of colonies. The first group consisted of colonies with one or two
secondary haustorial mother cells. There were higher numbers of this group in
ISr5Ra (Table 2) than in ISrBRa, although the difference was not statistically higher.
The second group consisted of colonies with three to six secondary haustorial
mother cells. Higher numbers (although not significantly higher) of this group were
found in ISrBRa (Table 2).
A comparison of the pooled results of colonies with one to two secondary haustorial
mother cells, and three to six secondary haustorial mother cells (Table 2) revealed
that although ISr5Ra had higher numbers of colonies with one to two secondary
haustorial mother cells, and ISrBRa had higher numbers of colonies with three to
six secondary haustorial mother cells, the numbers did not differ significantly.
113
DISCUSSION
With rust infections, it is commonly recognized that there is usually considerable
variation in the behaviour of the fungus and the host at different sites in anyone
tissue, but that resistance genes seem to increase the frequencies of certain types
of responses dramatically (Heath, 1982a; Niks, 1990). Most types of responses
however, are found on most plant genotypes to some extent (Niks, 1990). Heath
(1982a) cautions that the common practice of analysing data averaged from many
infection sites may serve to obscure relationships between host response and fungal
growth.
The appearance of hypersensitive flecks (IT 0;) in the ISr5Ra - race 2SA2
interaction indicated that growth of the fungus had been restricted and host damage
was minimal in this interaction. The ISrBRa - race 2SA2 interaction resulted in large
sporulating pustules and could be classified as a fully susceptible interaction (IT 4).
Luig & Rajaram (1972) noted that the expressions of Sr 5 and SrB are stable at
temperatures normally encountered in the glasshouse, and that high temperatures
did not influence the resistance expression of S r 5 in the genetic backgrounds of
Reliance and Kanred.
Previous studies have shown that the expression of resistance of S r 5 is altered by
the genetic background of the wheat host. In wheat cultivars Reliance, Prelude and
Marquis, Sr5 gave a 0 (immune) reaction type, whereas in Chinese Spring
macroscopically visible flecks (IT 0;) were seen (Rohringer et a/. (1979). Tiburzy
et al. (1990) noted that in Prelude, Sr5 conditioned a 0; IT, whereas in cultivars
with Sr5 and additional resistance genes (Sr6, Sr7a , Sr9g, Sr22) a 0 or immune
reaction resulted.
The results presented in this paper indicated that, based on the characteristics
examined, there are no significant differences between the two lines up to, and
including, 48 hpi, by which time race 2SA2 had successfully formed secondary
haustorial mother cells in both of these lines. These results are in keeping with
114
those of Tiburzy et a/. (1990) who found that the effect of Sr5 on the fungus is not
expressed significantly until atter 48 hpi. Rohringer et a/. (1979) on the other hand,
found that resistance conditioned by Sr5 was significantly expressed by 24 hpi
irrespective of the background of the host. Here it must be noted that Rohringer
et al. (1979) used Puccinia graminis f.sp. tritici race C17, Tiburzy et a/.
(1990) race 32, and the present investigation made use of race 2SA2. The
differences in timing of expression of Sr5 are possibly due to the different host
cultivar /pathogen-race combinations used in each study.
The present investigation's results are in keeping with the results of other
researchers working on major resistance gene effects (Heath, 1982b), in that these
major genes for resistance do not affect the development of the fungus prior to the
establishment of the primary haustorium. Heath (1982b) stated that this is a
common, although not universal, finding in rust-host interactions.
A number of pre-haustorial effects on rust development have been documented
however (Heath, 1982b), and the work of Tani et a/ . (1975) is of particular
interest. These researchers found that pre-haustorial elongation of infection hyphae
was retarded in an incompatible oat-rust combination.
With major-gene resistance, resistance is usually first expressed when the first host
cell is invaded, ie. with the formation of the first haustorium (Heath, 1981). Tiburzy
et a/. (1990) found that in the resistant wheat line Prelude-Sr5, which gives a 0;
reaction type, inhibition of fungal growth was not detected before the first
haustorium was formed, but occurred after the hypersensitive reaction of the host
cells that were penetrated by the first haustoria.
The species-specific form of a substomatal infection structure pre-determines the
host cell or tissue type that is preferentially penetrated by the first haustorium. In
many rust species the first cell penetrated is a mesophyll cell (Tiburzy et a/ . 1990).
This does not seem to be the case in wheat-stem-rust interactions, as Skipp &
Samborski (1974) investigating the Sr6/P6 interaction, found that 34 to 49% of all
115
penetrants formed the first haustorium in an epidermal cell, and Tiburzy et a/.
(1990) observed that in wheat lines with Sr5, epidermal cells were penetrated by
the first haustorium in up to 95% of all infection sites, whereas fewer than 3% of the
infection sites had haustoria in mesophyll cells. Scanning electron microscopy
observations of Pucci nia graminis f.sp. tritici in the universal susceptible wheat
cultivar McNair, presented in Chapter 2 of this thesis, indicated that the first
haustorial mother cell commonly forms abutting onto an epidermal cell adjacent to
one of the swollen ends of the guard cells
The autofluorescence of host cells in the ISr5Ra-race 2SA2 interaction is indicative
of the hypersensitive response (HR) conditioned by a number of major resistance
genes (Rohringer et a/., 1979). Fluorescing host cells in a resistant Sr5 interaction
were assumed to be necrotic (Rohringer et a/., 1979), an assumption supported
by the ultrastructural investigation of the Sr5- wheat stem rust interaction described
by Harder et a/. (1979a) and Harder et a/. (1979b). In the present investigation,
the virtual absence of autofluorescence of infected host cells in the susceptible
ISrBRa-race 2SA2 interaction is similar to the observation by Tiburzy et a/. (1990)
that infected susceptible host cells did not fluoresce in the time period 20 to 40 hpi.
Hence, with Sr5, it would appear that autofluorescence is an indication of
incompatibility .
In the literature there has been much debate over the significance of the
hypersensitive response (host necrosis) in the expression of major-gene resistance
to rust fungi (Heath, 1976; Kiraly & Barna, 1985; Kiraly et a/., 1972). The results
of some investigations have been interpreted as indicating that necrosis has a
primary role in resistance (Heath 1982a; Jones & Deverall, 1977; Keen & Littlefield,
1979; Maclean et a/., 1974; Samborski et a/., 1977; Skipp & Samborski, 1974),
while others have been suggested to show that necrosis is not mandatory for
resistance or that it may be a consequence rather than the cause of the ces.sation
of fungal growth (Barna et a/., 1974; Brown et a/., 1966; Campbell & Deverall,
1980; Kiraly & Barna, 1985; Kiraly et a/., 1972; Mayama et a/., 1975; Ogle &
Brown, 1971). Rohringer et a/. (1979) found that colony inhibition in resistant
116
wheat possessing Sr5 was not significantly associated with fluorescing host cells,
and as such host cell necrosis is not correlated with inhibition of fungal growth in
this interaction, whereas Tiburzy et a/ . (1990) showed that inhibition of the fungus
was closely associated with autofluorescence of the infected epidermal cell and
concluded that the hypersensitive reaction is closely associated with resistance
controlled by the Sr5 gene, and is possibly the determining factor. Heath (1982a)
stated that the fact that there is no simple relationship between fungal growth and
the amount of necrosis in some types of rust resistance may not necessarily imply
that necrosis has no importance in restricting fungal development and concluded
that rather than host necrosis per se, it may be the timing of necrosis relative to
haustorium development, and the effect of this necrosis on haustorium function,
which is critical in determining the role of such necrosis in host resistance to rust
fungi. Bushnell (1982), after reviewing the available evidence, concluded that each
resistance gene conditions incompatibility in a different unique way, that is, the
amount of tissue involved and the amount of fungus growth varies depending upon
the gene conditioning incompatibility.
Beardmore et a/. (1983) used a number of techniques in an effort to characterize
the autofluorescing compounds found in resistant wheat cultivars, in particular those
with Sr5 and Sr6. Their results indicated an initial phenolic accumulation followed
by lignification of the whole cell contents and the authors stated that such cells are
irreversibly changed with loss of viability, collapse and contraction, and the reaction
forms an incompatible ring of necrotic cells around the penetration site. Tiburzy &
Reisener (1990) levelled the following criticism at the work of Beardmore et a/.
(1983): they had examined the accumulation of compounds in necrotic mesophyll
cells in an advanced stage of the infection process, whereas Tiburzy et a/. (1990)
had found that resistance based on the S r 5 gene is first expressed in epidermal
cells as early as 32 hpi, and that mesophyll cells were completely unpenetrated at
many infection sites. Using autoradiographic and histochemical tests, Tiburzy &
Reisener (1990) determined that there was an accumulation of polymeric phenolics,
lignin or lignin-like material and callose in autofluorescing necrotic cells of wheat with
resistance based on the Sr5 gene. They also found a correlation between the
117
inhibition of synthesis of lignin or lignin-like polymers and reduced resistance, and
suggested that this supports the hypothesis that cellular lignification is an important
factor in resistance in this system.
Bushnell (1982) stated that in the stem rust - wheat interaction, Sr5 is the only
studied gene that commonly gives a determinant hypersensitivity reaction i.e. the
hypersensitive response leads to the complete halt in fungus growth. This author
referred to the work of Rohringer et a/. (1979) as an illustration of the determinant
hypersensitivity reaction expressed by Sr5, and noted that this response is only
found in certain genetic backgrounds. The results of Tiburzy et a/. (1990)
indicated that Sr5 in the wheat line Prelude had a determinant hypersensitivity
reaction when inoculated with stem rust race 32, as growth of the fungus was
completely inhibited three days post-inoculation.
S r 5 in Prelude or in Chinese Spring backgrounds had a significant effect on the
linear growth of the rust colonies of race C17 as early as 24 hpi (Rohringer et a/.,
1979) whereas Tiburzy et a/. (1990) found that Sr5 had a significant effect on the
colony growth of race 32 in the wheat cultivar Prelude three days after inoculation,
an effect which resulted in the cessation of fungal growth in the resistant line. A
higher resolution time course study of fungal development by Tiburzy et a/. (1990)
revealed that inhibition of fungal growth was apparent at 32 hpi. Once again, the
specific host-cultivar jpathogen-race combinations are possibly the cause of variation
in expression of resistance.
Tiburzy et a/. (1990) and Rohringer et a/. (1979) used the number of haustoria I
mother cells to characterise the size of a colony, and Tiburzy et a/. (1990) found
that over a six day period the rust population in a resistant cultivar with Sr5 was
distributed into two distinct groups of colonies namely, those with one to three
haustorial mother cells and those with more than five haustorial mother cells. The
majority of the colonies with one to three haustorial mother cells were associated
with intensely fluorescing epidermal cells, and haustoria in these cells remained
small and spherical. Fluoresecence of infected mesophyll cells occurred in about
118
one third of these infection sites and most of the colonies with more than five
haustorial mother cells were associated with fluorescing mesophyll cells and no, or
only faint, fluorescence in infected epidermal cells.
In the present study, ISr5Ra appeared to house infection sites with smaller numbers
of secondary haustorial mother cells than did ISrBRa and statistical analysis of
counts revealed that ISrBRa had significantly higher numbers of colonies with five
secondary haustorial mother cells. The importance of this difference is somewhat
debatable as both lines had very low numbers of colonies with five and six
secondary haustorial mother cells. A grouping of the colonies with secondary
haustorial mother cells into those with one or two , and those with three to six
secondary haustorial mother cells, revealed that ISr5Ra had higher numbers of
colonies with one or two secondary haustorial mother cells, whereas ISrBRa had
higher numbers of colonies with three to six secondary haustorial mother cells,
although these numbers were not significantly higher. Thus it appeared that Sr5
had some influence on the fungus at 48 hpi.
Rohringer et al. (1979) found that the host genetic background determined the
number of haustorial mother cells found in rust colonies in cultivars with Sr5-
dependent rust resistance. In Prelude, Marquis and Reliance backgrounds, few
colonies developed more than two haustorial mother cells, whereas in Chinese
Spring background, one third of the colonies had developed more than five
haustorial mother cells at 72 hpi.
Inhibition of haustorial development was correlated with the intensity of fluorescence
of necrotic epidermal cells (Tiburzy et al. 1990). Intensely fluorescing epidermal
cells contained small spherical haustoria, the growth of which was not terminated
before the haustorial bodies had reached a size of about 4J.'m in diameter, whereas
weakly fluorescing cells contained haustoria that were intermediate in size between
those in intensely fluorescing cells and those in susceptible host cells.
Growth of the colony and the number of secondary haustorial mother cells in
119
incompatible interactions was closely correlated with the state of the first
haustorium, in that colonies with a medium-sized or large first haustorium developed
more than five secondary haustorial mother cells, whereas hypha associated with
a small first haustorium in an intensely fluorescing epidermal cell were inhibited after
the differentiation of one, two or three secondary haustorial mother cells (Tiburzy et
aI., 1990).
It is generally unclear how the necrosis detected by light microscope techniques
relates to the various stages of cellular disorganization visualized under the electron
microscope (Heath, 1982b). Rohringer et a/. (1979) and Tiburzy et al. (1990)
reported that in the Sr5/P5 interaction, both mesophyll and epidermal cells
fluoresced when invaded by an avirulent race, although Rohringer e t a/. (1979)
noted that the fluorescing epidermal cells were not collapsed. Transmission electron
microscopy investigations of the incompatible interaction of race C 17 in wheat
cultivar Marquis (Sr5) in epidermal (Harder et a/., 1979a) and mesophyll (Harder
et a/., 1979b) cells revealed that infected epidermal and mesophyll cells were
necrotic. Necrosis of infected epidermal cells was detected at 36 hpi (ie. 24 hours
after the end of the 12 hour dark period) and usually occurred during the early
expansion phase of the development of the first haustorium. Haustoria in necrotic
epidermal cells usually remained limited in size (3 - 4 ~m in diameter). In their
fluorescence microscopy investigation of race 32 in Prelude-Sr5, Tiburzy et a/.
(1990) also noted that the growth of haustoria in fluorescing epidermal cells was not
terminated before haustorial bodies had reached a size of about 4 ~m in diameter.
This, they said, reflects the minimum time required to develop the resistance
response from its induction to its deleterious effect on the haustorium. Harder et
at. (1979a) noted that symptoms of haustorial disorganization in epidermal cells
involved premature vacuolation of the haustoria and irregularities in the sheath
structure and that where haustorial necrosis occurred, epidermal cell necrosis was
also present.
Resistance expression of Sr6 has been studied extenSively by a number of
researchers using both light and electron microscopy techniques (Kim et aI., 1977;
120
Harder ef a/., 1979 a,b; Manocha, 1975; Mayama ef a/., 1975; Samborski ef
a/., 1977; Skipp & Samborski, 1974; Skipp ef a/., 1974) and investigations have
shown that incompatibility in leaves containing this gene is expressed in mesophyll
cells only (Rohringer ef a/., 1979; Harder ef a/., 1979a). Intracellular symptoms
of incompatibility in mesophyll cells of Sr5/P5 interactions were found by Harder
ef at. (1979b) to be similar to those of the Sr6/P6 interactions. In host cells
possessing either Sr5 or Sr6, early ultrastructural symptoms of incompatibility were
a more electron-dense and often perforated invaginated host-plasmalemma,
disruptions of the non-invaginated host-plasmalemma, vacuolation of the cytoplasm,
and accumulations of electron-dense material along the membranes of the vacuoles.
A gradual increase in the size of electron-dense accumulations along vacuole
membranes, and chloroplast and mitochondrial membranes followed, and ultimately,
the entire protoplast was electron-dense and collapsed. Necrosis of fungal tissue
followed a different pattern from that of host cells in that incompatibility in haustoria
was usually first expressed by a uniform increase in electron density of the
protoplast, which eventually obscured the organelles. Incompatibility was usually
expressed in haustoria before it became evident in the associated haustorial mother
cells.
Harder e f a/. (1979b) noted that haustorial necrosis commonly occurred in
association with, or was evident before there was any indication of host necrosis,
although in a few instances, an invaded host cell was necrotic without evidence of
disorganization in the associated haustorium. They stated that products from a
necrotic haustorium or a necrotic cell do not appear to be responsible for necrosis
of the other partiCipant of the interaction.
The interaction ISr5Ra - race 2SA2 fulfils Flor's gene-for- gene hypothesis, a
situation which implies a differential interaction between the race of the pathogen
and the host cultivar (Van der Plank, 1975). This interaction also implies the
recognition of a specific fungal product (an elicitor) by a host receptor (Callow,
1984), with recognition being controlled by the gene for resistance in the plant
(Keen, 1982). From the observations of Tiburzy ef al. (1990), Harder ef at.
121
(1979a) and Harder et a/. (1979b) that the first signs of incompatibility in Sr5-
dependent resistant cultivars commonly occurs once a haustorium has been formed
in the host cell, it would appear that the recognition between the two reacting
partners takes place at the plasma membrane. A number of researchers working
on a variety of gene-for-gene interactions have come to a similar conclusion as to
the site of recognition in these interactions (Callow, 1984; Keen, 1982).
Differentiation of a haustorial mother cell and initiation of host cell penetration is the
start of the "parasitic phase" of a rust infection, the phase in which most race
specific interactions leading to compatibility or incompatibility are expressed, and the
phase at which host defences begin in incompatible interactions (Mendgen et a/.,
1988).
The zone of interaction between intracellular host-parasite surfaces has been found
to be complex and highly specialized (Littlefield & Heath, 1979) and although the
structure of this zone is becoming better known (Chong & Harder, 1982; Chong
et a/., 1986; Knauf et a/ . , 1989; Plotnikova et a/., 1979), less is known of the
chemical components involved. This paucity of information is due to the fact that
conventional methods of biochemical analysis have not proved useful in the
elucidation of the biochemistry of interactions at the host-paraSite interface in rust
diseases. What is required are more precise methods which locate chemical
components and/or changes at the intracellular level (Harder & Mendgen, 1982).
Kogel et a/. (1984) identified galactolipid receptors on the outer surface of wheat
plasma membranes which specifically bound certain lectins, and Kogel e tal. (1985)
found evidence for the direct involvement of these galactoconjugates in the process
of host-paraSite recognition.
Reisener et a/. (1986) reported that from extracts of germinated uredospores of
Puccinia graminis f.sp. tritici they isolated a fraction that was able to elicit the
characteristic hypersensitive response in an Sr5-dependent resistant wheat line.
The elicitor showed a differential effect when tested against Sr5 and sr5 near
isogenic lines. They stated that the elicitor is most probably a glycoprotein.
122
Glycoproteins related to specificity were identified in intercellular washing fluids from
stem rust-affected wheat leaves (Rohringer & Martens, 1987) and Harder et al.
(1989) stated that one possible in vivo location of these glycoproteins is the fungal
cell surface, however conventional processing for electron microscopy has not
proved useful in demonstrating the materials that may coat the surface of rust
fungus cells which ramify intercellularly in the host.
The use of novel techniques has shed some light on the nature of extramural
materials of intercellular fungal cells. Mendgen et al. (1985), using the binding
properties of lectins and enzymes were able to determine that substomatal vesicles
and infection hyphae of Puccinia coronata and Uromyces appendiculatus
have mainly glucans on their outer surfaces. Making use of a variety of tissue
processing techniques, Harder et al. (1989) were able to demonstrate the
presence of considerable amounts of extramural material occurring in several
different configurations on rust fungus intercellular hyphae. They concluded that
roles of the components in specificity related to compatibility or incompatibility, and
to adhesion, remain to be elucidated.
Cessation of fungal growth may not be primarily due to shortage of nutrients but
may result from effects of antifungal compounds such as phytoalexins. However,
with wheat there is as yet little evidence for the existence of such compounds
(Tiburzy et al., 1990) and Reisener et aI., (1986) stated that it is highly unlikely
that phytoalexins are involved in the expression of the Sr5 resistance response.
Brodny et al. (1986) investigating the residual and interactive expression of
"defeated" wheat stem rust resistance genes, concluded that Sr6, SrB and Sr9a
each has a residual expression when confronted by matching virulence genes. This
residual expression of SrB in ISrBRa would reduce the differences in counts
between ISr5Ra and ISrBRa and hence affect the interpretation of resistance
expressed by Sr5 in ISr5Ra.
From the results of the present investigation, and those of previous studies
123
presented in this discussion, the following sequence of events in the expression of
the Sr5 gene at an infection site can be concluded: (i) formation of pre-penetration
infection structures without inhibition; (ii) formation of a substomatal vesicle, primary
infection hypha, and primary haustorial mother cell without inhibition; (iii) penetration
of a host cell {epidermal or mesophyll} and the formation of the first haustorium;
(iv) recognition by the resistance gene of the host cell of an elicitor from the
avirulent pathogen; (v) inhibition of the expansion growth of the haustorium and
initiation of necrosis of the haustorium; (vi) necrosis of the infected host cell
accompanied by an accumulation of lignin or lignin-like compounds; (vii) inhibition
or cessation of growth of intercellular hyphae and a restriction in the number of
secondary haustorial mother cells.
The timing and expression of resistance conditioned by S r 5 is influenced by the
host cultivar and the race of the pathogen and it is essential that this is taken into
account when comparing the results of investigations into the expression of
resistance conditioned by this gene.
LITERATURE CITED
Barna B., Ersek T. & Mashaal S.F. (1974) Hypersensitive reaction of rust-infected
wheat in compatible host-parasite relationships. Acta Phytopathologica
Acadamiae Scientiarum Hungaricae 9, 293-300.
Beardmore J., Ride J.P. & Granger J.W. (1983) Cellular lignification as a factor in
the hypersensitive resistance of wheat to stem rust. Physiological
Plant Pathology 22, 209-220.
Brodny U., Nelson R.R. & Gregory L.V. (1986) The residual and interactive
expressions of "defeated" wheat stem rust resistance genes.
Phytopathology 76, 546-549.
Brown J.F., Shipton W.A. & White N.H. (1966) The relationship between
hypersensitive tissue and resistance in wheat seedlings infected with
Puccinia graminis tritici. Annals of Applied Biology 58, 279-290.
124
Bushnell W.R. (1982) Hypersensitivity in rusts and powdery mildews. In: Plant
Infection: The Physiological and Biochemical Basis (Ed. by Y.
Asada, W.R. Bushnell, S. Ouchi & C.P. Vance), pp. 97-116. Springer-Verlag,
Berlin.
Callow J.A. (1984) Cellular and molecular recognition between higher plants and
fungal pathogens. In: Cellular Interactions, Encyclopedia of Plant
Physiology, New Series, Volume 17, (Ed. by H.F. Linskens & J. Heslop
Harrison), pp. 212-237. Springer-Verlag, Berlin.
Campbell G.K. & Deverall B.J. (1980) The effects of light and a photosynthetic
inhibitor on the expression of the Lr20 gene for resistance to leaf rust in
wheat. Physiological Plant Pathology 16,415-423.
Chong J. & Harder D.E. (1982) Ultrastructure of haustorium development in
Puccinia coronata avenae: Some host responses. Phytopathology
72, 1527-1533.
Chong J., Harder D.E. & Rohringer R. (1986) Cytochemical studies on Puccinia
graminis f.sp. tritici in a compatible wheat host. II. Haustorium mother cell
walls at the host cell penetration site, haustorial walls, and the extrahaustorial
matrix. Canadian Journal of Botany 64, 2561-2575.
Gousseau H.D.M. & Deverall B.J. (1986) Effects of the Sr15 allele for resistance
on development of the stem rust fungus and cellular responses in wheat.
Canadian Journal of Botany 64, 626-631.
Gousseau H.D.M., Deverall B.J. & Mcintosh R.A. (1985) Temperature-sensitivity
of the expression of resistance to Puc c i n i a g ram i n is conferred by the S r
15, Sr 9b and Sr 14 genes in wheat. Physiological Plant Pathology
27, 335-343.
Harder D.E., Chong J., Rohringer R. , Mendgen K., Schneider A., Welter K. & Knauf
G. (1989) Ultrastructure and cytochemistry of extramural substances
associated with intercellular hyphae of several rust fungi. Canadian
Journal of Botany 67, 2043-2051.
Harder D.E. & Mendgen K. (1982) Filipin-sterol complexes in bean rust- and oat
crown rust- fungal/plant interactions: freeze-etch electron microscopy.
Protoplasma 112, 46-54.
125
Harder D.E., Rohringer R., Samborski D.J., Rimmer S.R., Kim W.K. & Chong J.
(1979a) Electron microscopy of susceptible and resistant near-isogenic
(sr6/Sr6) lines of wheat infected by Puccinia graminis tritici. II.
Expression of incompatibility in mesophyll and epidermal cells and the effect
of temperature on host-parasite interactions in these cells. Canadian
Journal of Botany 57,2617-2625.
Harder D.E., Samborski D.J., Rohringer R., Rimmer S.R., Kim W.K. & Chong J.
(1979b) Electron microscopy of susceptible and resistant near -isogenic
(sr6/Sr6) lines of wheat infected by Puccinia graminis tritici. III.
Ultrastructure of incompatible interactions. Canadian Journal of Botany
57, 2626-2634.
Heath M.C. (1976) Hypersensitivity, the cause or the consequence of rust
resistance? Phytopathology 66, 935-936.
Heath M.C. (1981) Resistance of plants to rust infection. Phytopathology 71,
971-974.
Heath M.C. (1982a) Fungal growth, haustorial disorganization, and host necrosis
in two cultivars of cowpea inoculated with an incompatible race of the
cowpea rust fungus. Physiological Plant Pathology 21,347-359.
Heath M.C. (1982b) Host defence mechanisms against infection by rust fungi. In:
The Rust Fungi (Ed. by K.J. Scott & A.K. Chakravorty), pp. 223-245.
Academic Press, London.
Jones D.R. & Deverall B.J. (1977) The effect of the Lr20 resistance gene in wheat
on the development of leaf rust Puccinia recondita. Physiological
Plant Pathology 10, 275-284.
Keen N.T. (1982) Specific recognition in gene-for-gene host-parasite systems. In:
Advances in Plant Pathology. Volume 1. (Ed. by D.S. Ingram & P.H.
Williams), pp. 35-82. Academic Press, New York.
Keen N.T. & Littlefield L.J. (1979) The possible association of phytoalexins with
resistance gene expression in flax to Melampsora lini. Physiological
Plant Pathology 14, 265-280.
Kim W.K., Rohringer R., Samborski D.J. & Howes N.K. (1977) Effect of blasticidin
S, ethionine, and polyoxin 0 on stem rust development and host-cell necrosis
126
in wheat near-isogenic for gene Sr6. Canadian Journal of Botany 55,
568-571.
Kiraly Z. & Barna B. (1985) Hypersensitivity revisited. Acta Phytopathologica
Academiae Scientiarum Hungaricae 20,3-6.
Kiraly Z., Barna B. & Ersek T. (1972) Hypersensitivity as a consequence, not the
cause, of plant resistance to infection. Nature 239, 456-457.
Knauf G.M., WelterK., Muller M. & Mendgen K. (1989) The haustorial host-parasite
interface in rust-infected bean leaves after high pressure freezing .
Physiological and Molecular Plant Pathology 34,519-530.
Kogel K.H., Ehrlich-Rogozinski S., Reisener H.J. & Sharon N. (1984) Surface
galactolipids of wheat protoplasts as receptors for soybean agglutinin and
their possible relevance to host-parasite interaction. Plant Physiology 76,
924-928.
Kogel K.H., Schrenk F., Sharon N. & Reisener H.J. (1985) Suppression of the
hypersensitive response in wheat stem rust interaction by reagents with
affinity for wheat plasma membrane galactoconjugates. Journal of Plant
Physiology 118, 343-352.
Kuck K.H., Tiburzy R., Hanssler G. & Reisener H.J. (1981) Visualization of rust
haustoria in wheat leaves by using fluorochromes. Physiological Plant
Pathology 19, 439-441.
Lennox C.L. & Rijkenberg F.H.J. (1989) Fluorescence microscopy of Puccinia
graminis f.sp. tritici in the universal susceptible wheat cultivar McNair.
Proceedings of the Electron Microscopy Society of Southern
Africa 19,81-82.
Le Roux J. (1986) Studies on the Pathogenicity of Puccinia graminis f.sp.
tritici and the Nature of Host Resistance in Wheat. Ph.D. Thesis.
University of Natal.
Littlefield L.J. & Heath M.C. (1979) Ultrastructure of Rust Fungi. Academic
Press, New York .
Luig N.H. & Rajaram S. (1972) The effect of temperature and genetic background
on host gene expression and interaction to Puccinia graminis tritici.
Phytopathology 62, 1171-1174.
127
Maclean D.J., Sargent J.A., Tommerup I.C. & Ingram D.S. (1974) Hypersensitivity
as the primary event in resistance to fungal parasites. Nature 249, 186-187.
Manocha M.S. (1975) Autoradiography and fine structure of host-parasite interface
in temperature-sensitive combinations of wheat stem rust.
Phytopathologische Zeitschrift 82,207-215
Mayama S., Daly J.M., Rehfeld D.W. & Daly C.R. (1975) Hypersensitive response
of near-isogenic wheat carrying the temperature-sensitive Sr6 allele for
resistance to stem rust. Physiological Plant Pathology 7,35-47.
Mendgen K., Lange M. & Bretschneider K. (1985) Quantitative estimation of the
surface carbohydrates on the infection structures of rust fungi with enzymes
and lectins. Archives of Microbiology 140, 307-311.
Mendgen K., Schneider A. , Sterk M. & Fink W. (1988) The differentiation of
infection structures as a result of recognition events between some biotrophic
parasites and their hosts. Journal of Phytopathology 123, 259-272.
Niks R.E. (1981) Appressorium formation of Puccinia hordei on partially
resistant barley and two non-host species. Netherlands Journal of
Plant Pathology 87, 201-207.
Niks R.E. (1987) Nonhost plant species as donors for resistance to pathogens
with narrow host range. I. Determination of nonhost status. Euphytica 36,
841-852.
Niks R.E. (1990) Effect of germ tube length on the fate of sporelings of Puccinia
hordei in susceptible and resistant barley. Phytopathology 80, 57-60.
Ogle H.J. & Brown J.F. (1971) Quantitative studies of the post-penetration phase
of infection· by Puccinia graminis tritici. Annals of Applied Biology
67,309-319.
Plotnikova Y.M., Littlefield L.J. & Miller J.D. (1979) Scanning electron microscopy
of the haustorium-host interface regions in wheat infected with Puccinia
graminis f.sp. tritici. Physiological Plant Pathology 14, 37-39.
Reisener H.J., Tiburzy R., Kogel K.H ., Moerschbacher B. & Heck B. (1986)
Mechanism of resistance of wheat against stem rust in the Sr5/P5
interaction. In: Biology and Molecular Biology of Plant-Pathogen
Interactions (Ed. by J.A. Bailey), pp. 141-148. Springer-Verlag, Berlin.
128
Roelfs A.P. & McVey D.V. (1979) Low infection types produced by Puccinia
graminis f.sp. tritici and wheat lines with designated genes for resistance .
Phytopathology 69, 722-730.
Rohringer R., Kim W.K. & Samborski D.J. (1979) A histological study of interactions
between avirulent races of stem rust and wheat containing resistance genes
Sr5, Sr6, Sr8, or Sr22. Canadian Journal of Botany 57,324-331.
Rohringer R., Kim W.K., Samborski D.J. & Howes N.K. (1977) Calcofluor: an optical
brightener for fluorescence microscopy of fungal plant parasites in leaves.
Phytopathology 67,808-810
Rohringer R. & Martens J.W. (1987) Infection-related proteins in intercellular
washing fluids from stem rust-affected wheat leaves: race-associated protein
differences revealed by PAGE and Con A blotting. Physiological and
Molecular Plant Pathology 31 , 375-386.
Samborski D.J., Kim W.K., Rohringer R., Howes N.K. & Baker R.J. (1977)
Histological studies on host-cell necrosis conditioned by the ·Sr6 gene for
resistance in wheat to stem rust. Canadian Journal of Botany 55, 1445-
1452.
Skipp R.A., Harder D.E. & Samborski D.J. (1974) Electron microscopy studies on
infection of resistant (S r 6 gene) and susceptible near -isogenic wheat lines
by Puccinia graminis f.sp. tritici. Canadian Journal of Botany 52,
2615-2620.
Skipp R.A. & Samborski D .J. (1974) The effect of the S r 6 gene for host resistance
on histological events d~ring the development of stem rust in near-isogenic
wheat lines. Canadian Journal of Botany 52, 1107-1115.
Southerton S.G. & Deverall B.J. (1989) Histological studies of the expression of the
Lrg, Lr20 and Lr28 alleles for resistance to leaf rust in wheat. Plant
Pathology 38, 190-199.
Stakman E.C., Stewart D.M. & Loegering W.Q. (1962) Identification of physiologic
races of Puccinia graminis var tritici. United States Department of
Agriculture Bulletin E617 (Revised).
Tani T., Yamamoto H., Onoe T. & Naito N. (1975) Initiation of resistance and host
cell collapse in the hypersensitive reaction of oat leaves against Puccinia
129
coronata avenae. Physiological Plant Pathology 7,231-242.
Tiburzy R., Noll U. & Reisener H.J. (1990) Resistance of wheat to Puccinia
gram in is f.sp. tritici: Histological investigation of resistance caused by the
Sr5 gene. Physiological and Molecular Plant Pathology 36,95-108.
Tiburzy R. & Reisener H.J. (1990) Resistance of wheat to Puccinia graminis
f.sp. tritici: Association of the hypersensitive reaction with the cellular
accumulation of lignin-like material and callose. Physiological and
Molecular Plant Pathology 36, 109-120.
Van der Plank J.E. (1975) Principles of Plant Pathology. Academic Press,
London.
130
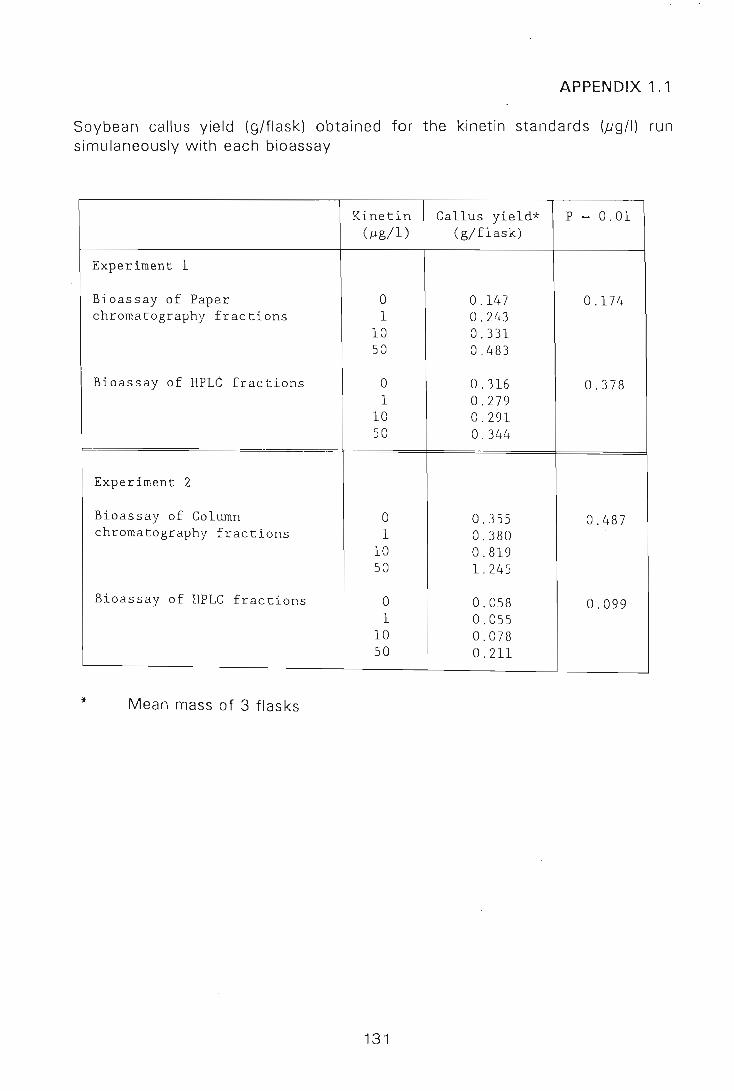
APPENDIX 1.1
Soybean callus yield (g/flask) obtained for the kinetin standards (jig/I) run simulaneously with each bioassay
Kinetin Callus yie1d* P = 0.01 . (,",gil) (g/flask)
Experiment 1
Bioassay of Paper 0 0.147 0.174 chromatography fractions 1 0.243
10 0.331 50 0.483
Bioassay of HPLC fractions 0 0.316 0.378 1 0.279
10 0.291 50 0.344
Experiment 2
Bioassay of Column 0 0.355 0.487 chromatography fractions 1 0.380
10 0.819 50 1.245
Bioassay of HPLC fractions 0 0.058 0.099 1 0.055
10 0.078 50 0 .211
* Mean mass of 3 flasks
131
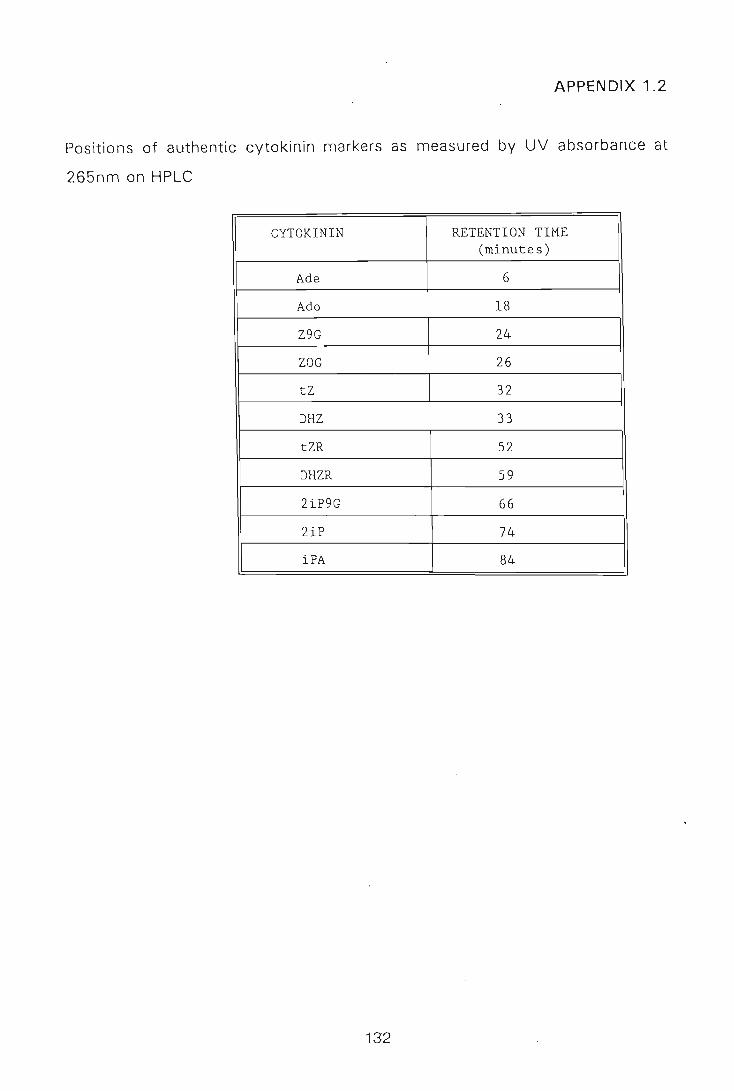
APPENDIX 1.2
Positions of authentic cytokinin markers as measured by UV absorbance at
265nm on HPLC
CYTOKININ RETENTION TIME (minutes)
Ade 6
Ado 18
Z9G 24
ZOG 26
tZ 32
DHZ 33
tZR 52
DHZR 59
2iP9G 66
2iP 74
iPA 84
132
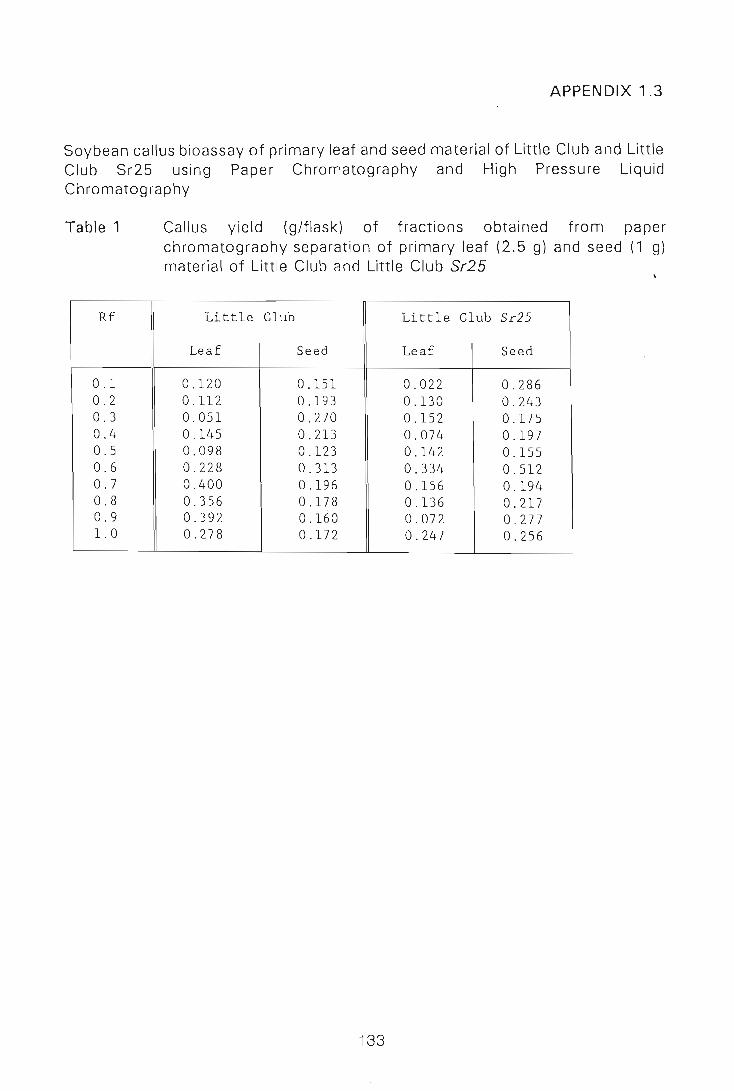
APPENDIX 1.3
Soybean callus bioassay of primary leaf and seed material of Little Club and Little Club Sr25 using Paper Chromatography and High Pressure Liquid Chromatography
Table 1
Rf
0 . 1 0 . 2 0.3 0.4 0.5 0 . 6 0.7 0 . 8 0.9 1.0
Callus yield (g/flask) of fractions obtained from paper chromatography separation of primary leaf (2.5 g) and seed (1 g) material of Little Club and Little Club 5r25
Little Club Little Club Sr25
Leaf Seed Leaf Seed
0 . 120 0.151 0.022 0 . 286 0 . 112 0.193 0.130 0.243 0.051 0.270 0.152 0.175 0.145 0.213 0 . 074 0 . 197 0 . 098 0.123 0.142 0 . 155 0.228 0.313 0 . 334 0.512 0.400 0.196 0.156 0.194 0 . 356 0.178 0.136 0.217 0.392 0.160 0 . 072 0 . 277 0.278 0 . 172 0.247 0 . 256
133
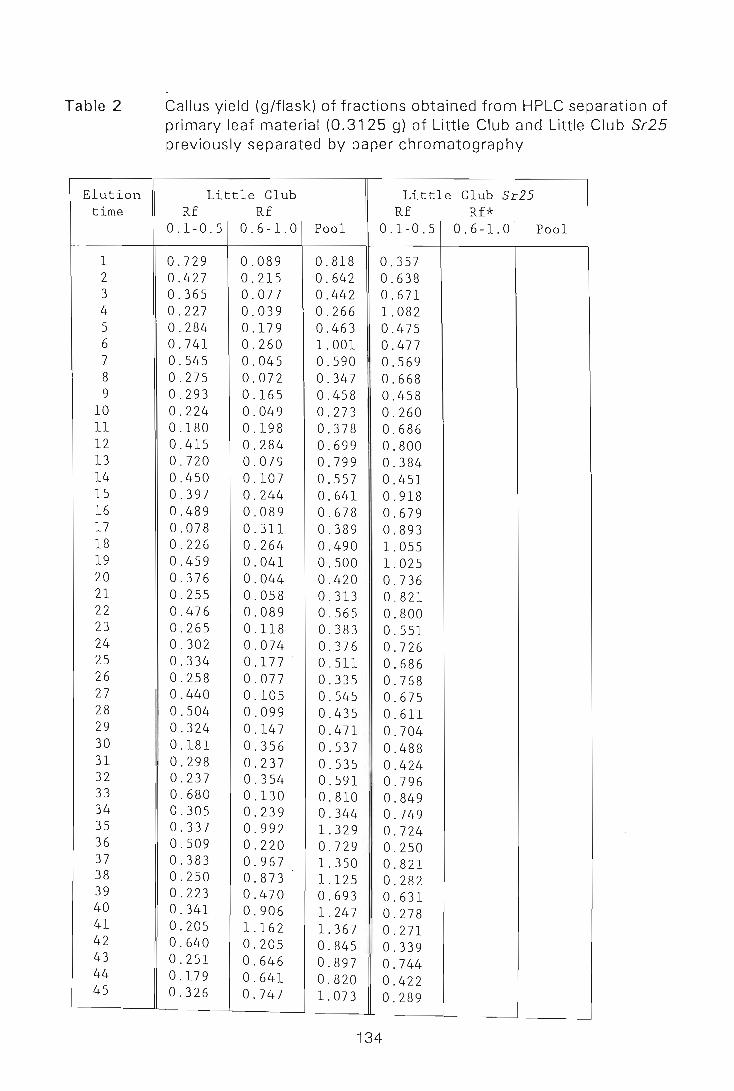
Table 2
Elution time
1 2 3 4 5 6 7 8 9
10 11 12 13 14 15 16 17 18 19 20 21 22 23 24 25 26 27 28 29 30 31 32 33 34 35 36 37 38 39 40 41 42 43 44 45
Callus yield (g/flask) of fractions obtained from HPLC separation of primary leaf material (0.3125 g) of Little Club and Little Club Sr25 previously separated by paper chromatography
Little Club Little Club Sr25 Rf Rf Rf Rf*
0.1-0.5 0 . 6-1.0 Pool 0.1-0.5 0.6-1.0 Pool
0.729 0.089 0.818 0.357 0.427 0.215 0.642 0.638 0 . 365 0.077 0.442 0.671 0.227 0 . 039 0.266 1. 082 0 . 284 0.179 0.463 0 . 475 0.741 0 . 260 1. 001 0.477 0.545 0 . 045 0.590 0 . 569 0 . 275 0 . 072 0.347 0 . 668 0 . 293 0.165 0 . 45 8 0 . 458 0.224 0.049 0.273 0 .2 60 0.180 0 . 198 0.378 0 . 686 0.415 0.284 0 . 699 0.800 0 . 720 0.079 0.799 0.384 0 . 450 0.107 0.557 0.451 0.397 0.244 0.641 0 . 918 0.489 0.089 0.678 0 . 679 0.078 0.311 0 . 389 0 . 893 0.226 0 . 264 0.490 1. 055 0.459 0.041 0 . 500 1. 025 0.376 0.044 0.420 0.736 0.255 0.058 0 . 313 0 . 821 0.476 0.089 0 . 565 0 . 800 0.265 0.118 0.383 0 . 551 0.302 0.074 0 . 376 0 . 726 0.334 0.177 . 0.511 0.686 0.258 0.077 0.335 0.768 0 . 440 0.105 0.545 0.675 0.504 0.099 0 . 435 0 . 611 0.324 0.147 0 . 471 0.704 0.181 0.356 0.537 0.488 0.298 0.237 0.535 0 . 424 0.237 0 . 354 0 . 591 0.796 0.680 0.130 0.810 0 . 849 0.305 0.239 0.344 0.749 0.337 0.992 1. 329 0.724 0.509 0.220 0.729 0 . 250 0.383 0.967 1. 350 0.821 0.250 0.873 1.125 0.282 0.223 0 . 470 0.693 0 . 631 0.341 0.906 1. 247 0.278 0.205 1.162 1. 367 0.271 0.640 0 . 205 0.845 0.339 0.251 0.646 0.897 0.744 0.179 0.641 0 . 820 0.422 0.326 0.747 1.073 0.289
134
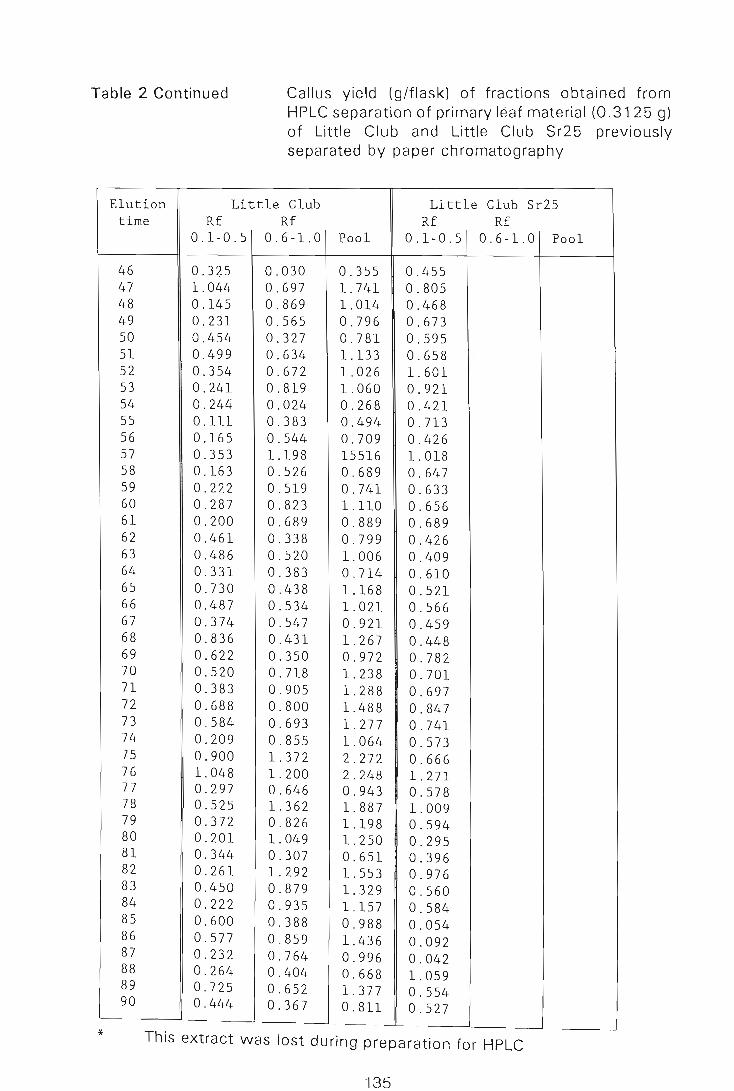
Table 2 Continued Callus yield (g/flask) of fractions obtained from HPLC separation of primary leaf material (0.3125 g) of Little Club and Little Club Sr25 previously separated by paper chromatography
Elution Little Club Little Club Sr25 time Rf Rf Rf Rf
0.1-0.5 0.6-1.0 Pool 0.1-0.5 0.6-1.0 Pool
46 0 . 325 0.030 0.355 0.455 47 1.044 0.697 1. 741 0 . 805 48 0.145 0 . 869 1. 014 0.468 49 0.231 0.565 0.796 0.673 50 0.454 0.327 0.781 0.595 51 0.499 0.634 1.133 0.658 52 0 .3 54 0.672 1. 026 1.601 53 0.241 0.819 1. 060 0.921 54 0.244 0.024 0.268 0.421 55 0.111 0.383 0.494 0.713 56 0.165 0.544 0.709 0.426 57 0.353 1.198 15516 1. 018 58 0.163 0.526 0.689 0.647 59 0.222 0.519 0.741 0.633 60 0 .2 87 0.823 1.110 0 . 656 61 0.200 0.689 0.889 0.689 62 0.461 0.338 0.799 0.426 63 0.486 0.520 1. 006 0.409 64 0.331 0.383 0.714 0.610 65 0.730 0.438 1.168 0.521 66 0 . 487 0.534 1. 021 0 . 566 67 0.374 0.547 0.921 0.459 68 0.836 0 . 431 1. 267 0.448 69 0 . 622 0.350 0.972 0.782 70 0.520 0 . 718 1. 238 0.701 71 0.383 0.905 1. 288 0.697 72 0.688 0.800 1. 488 0.847 73 0.584 0.693 1.277 0.741 74 0.209 0.855 1. 064 0.573 75 0.900 1.372 2.272 0.666 76 1.048 1. 200 2.248 l.271 77 0.297 0.646 0.943 0.578 78 0.525 1. 362 1. 887 1. 009 79 0.372 0.826 1.198 0.594 80 0.201 1. 049 1. 250 0.295 81 0.344 0 . 307 0.651 0.396 82 0.261 1. 292 1. 553 0.976 83 0.450 0.879 1. 329 0.560 84 0.222 0.935 1.157 0.584 85 0.600 0.388 0 .9 88 0.054 86 0.577 0.859 1.436 0.092 87 0 . 232 0.764 0.996 0.042 88 0.264 0.404 0.668 l. 059 89 0.725 0 . 652 1.377 0.554 90 0.444 0.367 0.811 0.527
* This extract was lost during preparation for HPLC
135
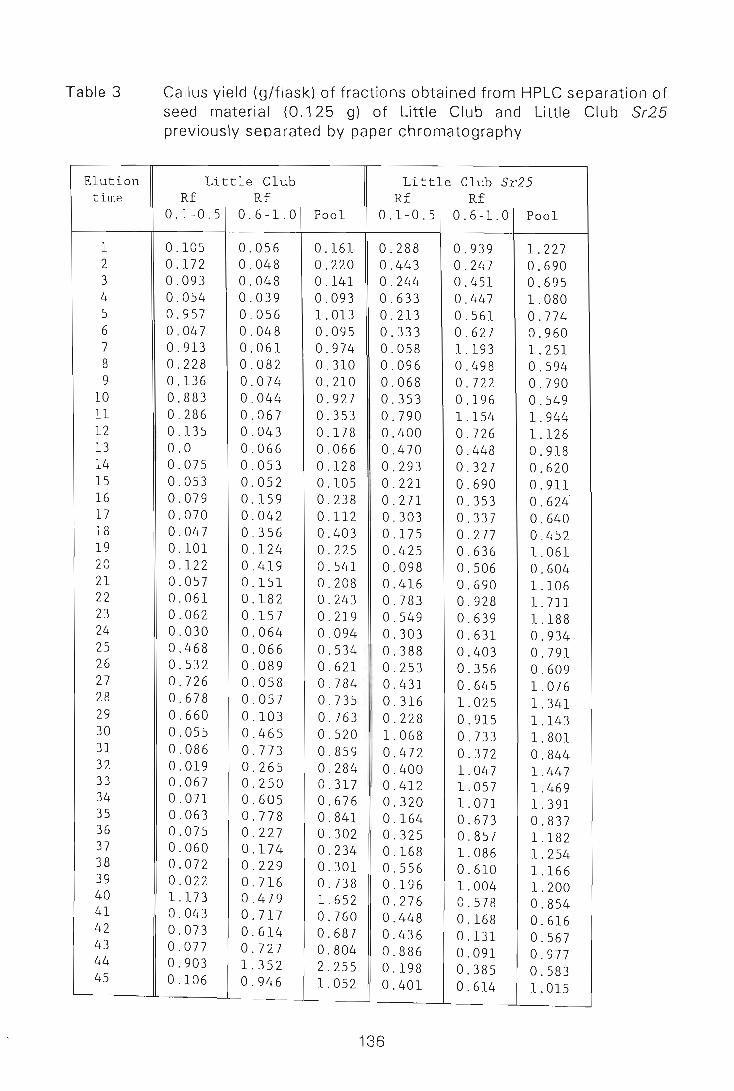
Table 3
Elution time
1 2 3 4 5 6 7 8 9
10 11 12 13 14 15 16 17 18 19 20 21 22 23 24 25 26 27 28 29 30 31 32 33 34 35 36 37 38 39 40 41 42 43 44 45
Callus yield (g/flask) of fractions obtained from HPLC separation of seed material (0.125 g) of Little Club and Little Club Sr25 previously separated by paper chromatography
Little Club Little Club Sr25 Rf Rf Rf Rf
0.1-0.5 0.6-1.0 Pool 0.1-0.5 0.6-1.0 Pool
0.105 0.056 0.161 0.288 0.939 1. 227 0 . 172 0.048 0.220 0 . 443 0.247 0.690 0.093 0.048 0.141 0 .244 0 . 451 0.695 0 . 054 0.039 0.093 0.633 0.447 1. 080 0.957 0 . 056 1.013 0 .2 13 0.561 0.774 0.047 0.048 0.095 0.333 0.627 0.960 0.913 0 . 061 0 .9 74 0 . 058 1.193 1. 251 0 .22 8 0.082 0.310 0.096 0.498 0.594 0.136 0.074 0.210 0 . 068 0.722 0.790 0.883 0.044 0.927 0.353 0.196 0.549 0.286 0.067 0.353 0 . 790 1.154 1.944 0.135 0.043 0.178 0.400 0 . 726 1.126 0.0 0.066 0.066 0.470 0 .448 0.918 0 .075 0 . 053 0.128 0.293 0 . 327 0.620 0.053 0.052 0.105 0.221 0.690 0.911 0.079 0.159 0.238 0.271 0.353 0.624' 0.070 0.042 0.112 0.303 0 .33 7 0.640 0.047 0.356 0.403 0.175 0 .2 77 0.452 0.101 0.124 0.225 0 .42 5 0 . 636 1. 061 0.122 0.419 0 .541 0.098 0.506 0.604 0.057 0.151 0.208 0.416 0.690 1.106 0 . 061 0.182 0.243 0.783 0.928 1.711 0.062 0.157 0.219 0.549 0.639 1.188 0 . 030 0.064 0.094 0.303 0.631 0.934 0.468 0.066 0.534 0.388 0 . 403 0.791 0.532 0.089 0.621 0.253 0.356 0.609 0.726 0.058 0.784 0.431 0.645 1. 076 0.678 0.057 0.735 0.316 1. 025 1.341 0.660 0.103 0.763 0.228 0.915 1.143 0.055 0.465 0.520 1. 068 0.733 1.801 0.086 0.773 0.859 0.472 0.372 0.844 0.019 0.265 0.284 0.400 1.047 1.447 0.067 0.250 0 . 317 0 . 412 1. 057 1.469 0.071 0.605 0.676 0.320 1. 071 1. 391 0.063 0.778 0.841 0.164 0.673 0.837 0.075 0.227 0.302 0 . 325 0.857 1.182 0 . 060 0.174 0.234 0.168 1. 086 1. 254 0.072 0.229 0.301 0.556 0.610 1.166 0.022 0.716 0.738 0 . 196 1.004 1.200 1.173 0.479 1.652 0.276 0 . 578 0.854 0.043 0.717 0.760 0.448 0.168 0.616 0.073 0.614 0.687 0.436 0 . 131 0.567 0.077 0 . 727 0.804 0.886 0.091 0.977 0.903 1 . . 352 2 . 255 0.198 0.385 0 . 583 0.106 0.946 1. 052 0.401 0.614 1. 015
136
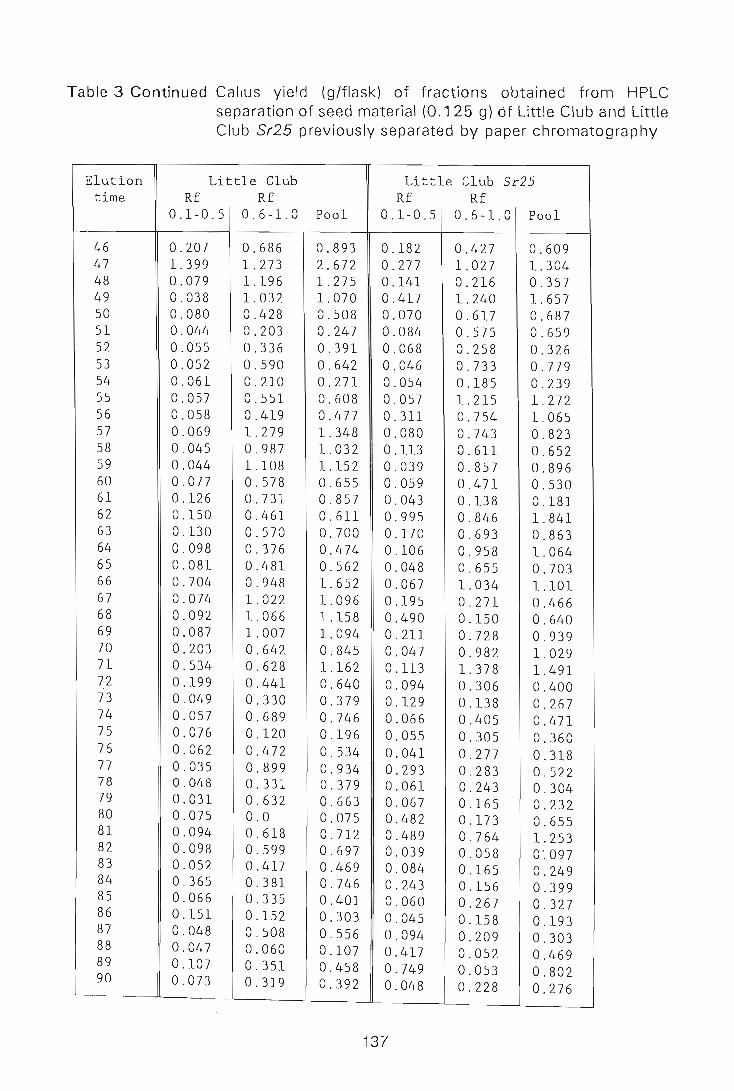
Table 3 Continued Callus yield (g/flask) of fractions obtained from HPLC separation of seed material (0.125 g) cif Little Club and Little Club Sr25 previously separated by paper chromatography
Elution Little Club Little Club Sr25 time Rf Rf Rf Rf
0.1-0.5 0.6-1.0 Pool 0.1-0.5 0.6-1.0 Pool
46 0.207 0.686 0.893 0.182 0.427 0.609 47 1. 399 1.273 2.672 0.277 1.027 1. 304 48 0.079 1. 196 1. 275 0.141 0 .216 0.357 49 0.038 1. 032 1. 070 0.417 1.240 1. 657 50 0.080 0.428 0.508 0.070 0.617 0.687 51 0.044 0.203 0.247 0.084 0.575 0.659 52 0.055 0 . 336 0.391 0.068 0.258 0.326 53 0.052 0.590 0.642 0.046 0.733 0.779 54 0.061 0.210 0.271 0.054 0.185 0.239 55 0.057 0.551 0 . 608 0.057 1. 215 1.272 56 0.058 0.419 0.477 0.311 0.754 1. 065 57 0.069 1. 279 1.348 0.080 0.743 0.823 58 0.045 0.987 1. 032 0.113 0.611 0.652 59 0.044 1.108 1.152 0.039 0.857 0.896 60 0.077 0.578 0.655 0.059 0.471 0.530 61 0.126 0.731 0.857 0.043 0.138 0 . 181 62 0.150 0 . 461 0.611 0.995 0.846 1.841 63 0.130 0.570 0.700 0.170 0.693 0.863 64 0.098 0.376 0.474 0.106 0.958 1. 064 65 0.081 0.481 0.562 0.048 0 . 655 0.703 66 0.704 0.948 1.652 0.067 1. 034 1.101 67 0.074 1. 022 1.096 0.195 0.271 0.466 68 0.092 1. 066 1.158 0.490 0.150 0.640 69 0.087 1. 007 1 . 094 0.211 0.728 0.939 70 0.203 0.642 0.845 0.047 0.982 1. 029 71 0.534 0.628 1.162 0.113 1. 378 1.491 72 0.199 0.441 0.640 0.094 0.306 0.400 73 0.049 0.330 0.379 0.129 0.138 0.267 74 0.057 0.689 0.746 0.066 0.405 0.471 75 0.076 0.120 0.196 0.055 0.305 0.360 76 0 .0 62 0.472 0.534 0.041 0.277 0.318 77 0.035 0.899 0.934 0.293 0.283 0.522 78 0.048 0.331 0.379 0.061 0.243 0.304 79 0.031 0.632 0.663 0.067 0.165 0.232 80 0.075 0.0 0.075 0.482 0 .173 0.655 81 0.094 0.618 0.712 0.489 0.764 1. 253 82 0.098 0.599 0.697 0.039 0.058 0 '.097 83 0.052 0.417 0.469 0.084 0.165 0.249 84 0.365 0.381 0.746 0.243 0.156 0.399 85 0.066 0.335 0.401 0.060 0.267 0.327 86 0.151 0 . 152 0.303 0.045 0.158 0.193 87 0.048 0.508 0.556 0.094 0.209 0.303 88 0.047 0.060 0.107 0.417 0.052 0.469 89 0.107 0.351 0.458 0.749 0.053 0.802 90 0 . 073 0.319 0.392 0.048 0.228 0.276
137
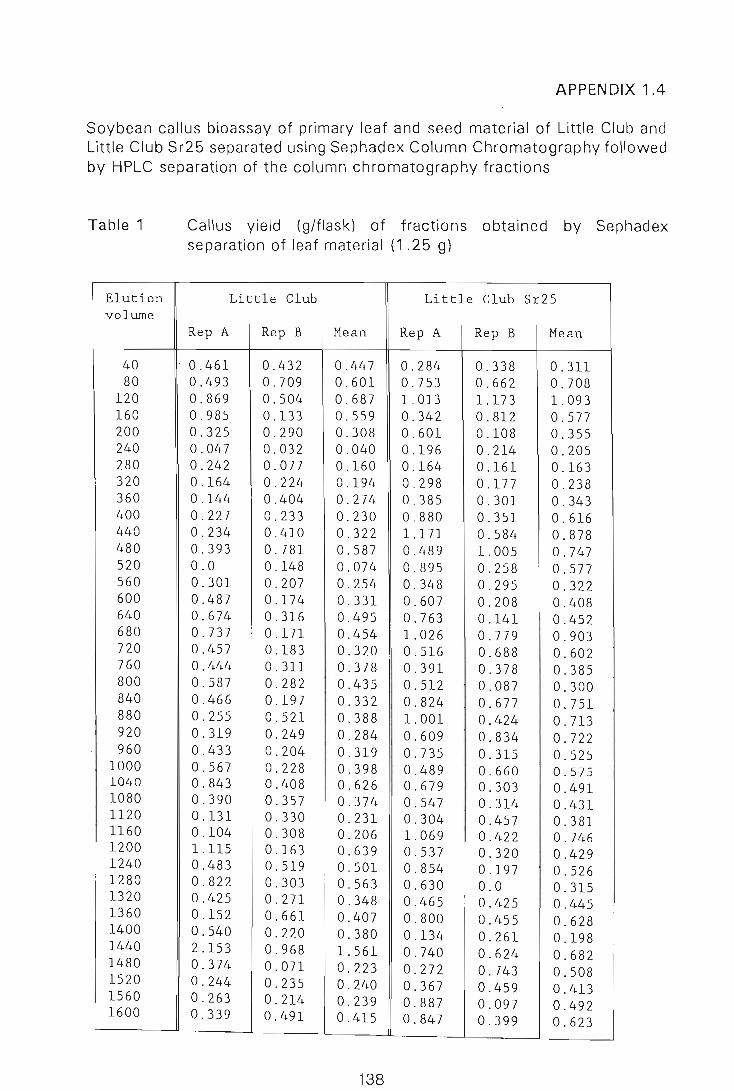
APPENDIX 1.4
Soybean callus bioassay of primary leaf and seed material of Little Club and Little Club Sr25 separated using Sephadex Column Chromatography followed by HPLC separation of the column chromatography fractions
Table 1
Elution volume
40 80
120 160 200 240 280 320 360 400 440 480 520 560 600 640 680 720 760 800 840 880 920 960
1000 1040 1080 1120 1160 1200 1240 1280 1320 1360 1400 1440 1480 1520 1560 1600
Callus yield (g/flask) of fractions obtained by Sephadex separation of leaf material (1.25 g)
Little Club Little Club Sr25
Rep A Rep B Mean Rep A Rep B Mean
. 0.461 0.432 0 . 447 0.284 0.338 0.311 0.493 0.709 0 . 601 0 . 753 0 . 662 0.708 0 . 869 0.504 0 . 687 1.013 1.173 1. 093 0.985 0.133 0 . 559 0.342 0.812 0 . 577 0.325 0.290 0 . 308 0 . 601 0 . 108 0.355 0 . 047 0.032 0.040 0.196 0 . 214 0.205 0.242 0.077 0.160 0 . 164 0.161 0 . 163 0.164 0.224 0 . 194 0 . 298 0.177 0.238 0 . 144 0 . 404 0 . 274 0.385 0 . 301 0 . 343 0.227 0 . 233 0 . 230 0 . 880 0.351 0 . 616 0.234 0 . 410 0.322 1.171 0.584 0 . 878 0.393 0.781 0 . 587 0 . 489 1. 005 0.747 0.0 0.148 0.074 0.895 0 . 258 0.577 0.301 0.207 0 . 254 0.348 0.295 0.322 0.487 0.174 0.331 0.607 0.208 0.408 0.674 0.316 0 . 495 0.763 0 . 141 0.452 0.737 0.171 0.454 1. 026 0 . 779 0.903 0.457 0.183 0.320 0.516 0.688 0.602 0.444 0.311 0.378 0.391 0.378 0.385 0.587 0.282 0.435 0.512 0.087 0.300 0.466 0 . 197 0.332 0.824 0.677 0.751 0.255 0.521 0.388 1. 001 0.424 0.713 0 . 319 0.249 0.284 0.609 0.834 0.722 0 . 433 0.204 0.319 0 . 735 0.315 0 . 525 0.567 0.228 0.398 0 . 489 0 . 660 0.575 0.843 0.408 0.626 0.679 0.303 0.491 0 . 390 0 . 357 0 . 374 0.547 0.314 0.431 0.131 0.330 0.231 0.304 0.457 0.381 0.104 0.308 0.206 1. 069 0 . 422 0 . 746 1.115 0.163 0 . 639 0 . 537 0.320 0.429 0.483 0.519 0 . 501 0 . 854 0 . 197 0 . 526 0.822 0.303 0.563 0.630 0 . 0 0.315 0.425 0 . 271 0.348 0 . 465 0.425 0.445 0.152 0 . 661 0 . 407 0 . 800 0.455 0.628 0.540 0 . 220 0.380 0.134 0.261 0.198 2.153 0.968 1. 561 0.740 0.624 0 . 682 0.374 0.071 0.223 0.272 0.743 0.508 0.244 0 . 235 0.240 0.367 0.459 0 . 413 0.263 0.214 0.239 0.887 0.097 0.492 0 . 339 0.491 0 . 415 0.847 0.399 0.623
138
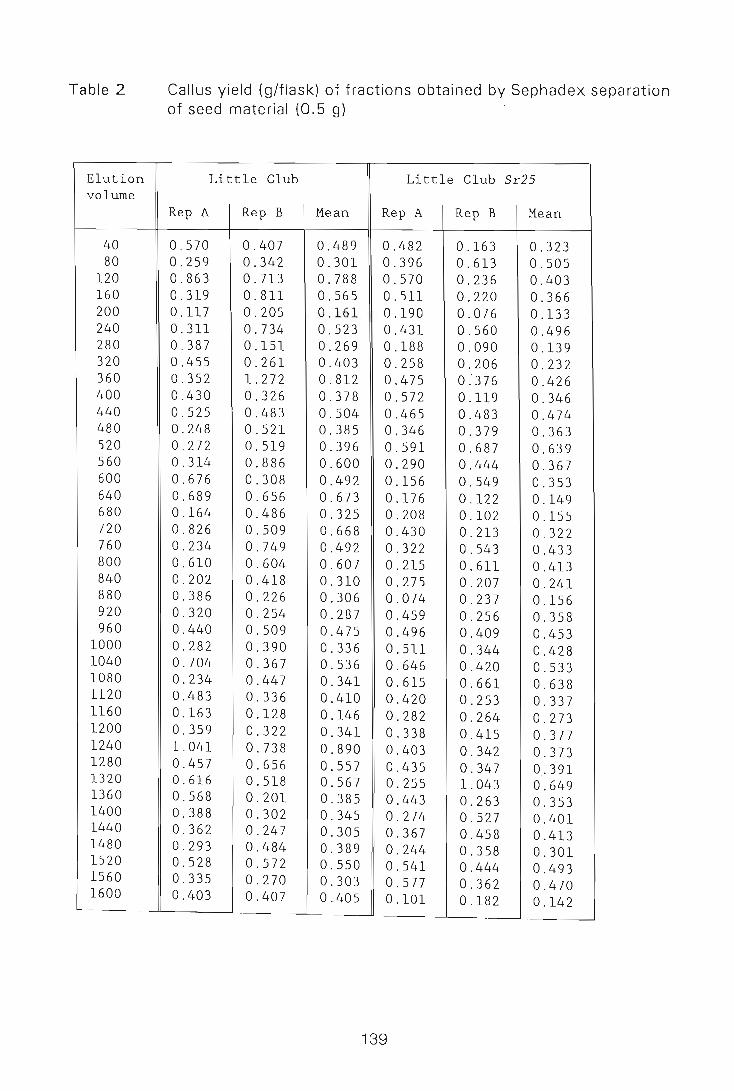
Table 2
Elution volume
40 80
120 160 200 240 280 320 360 400 440 480 520 560 600 640 680 720 760 800 840 880 920 960
1000 1040 1080 1120 1160 1200 1240 1280 1320 1360 1400 1440 1480 1520 1560 1600
Callus yield (g/flask) of fractions obtained by Sephadex separation of seed material (0.5 g)
Little Club Little Club Sr25
Rep A Rep B Mean Rep A Rep B Mean
0.570 0 . 407 0.489 0 . 482 0.163 0.323 0.259 0.342 0.301 0 . 396 0.613 0 . 505 0.863 0 . 713 0.788 0.570 0.236 0.403 0 . 319 0.811 0.565 0.511 0.220 0.366 0 . 117 0.205 0 . 161 0.190 0.076 0.133 0.311 0.734 0.523 0.431 0.560 0.496 0.387 0.151 0.269 0.188 0 . 090 0.139 0.455 0.261 0.403 0 . 258 0.206 0 . 232 0 . 352 1.272 0 . 812 0 . 475 0.'376 0 .426 0 . 430 0.326 0 . 378 0 . 572 0 . 119 0.346 0 . 525 0 . 483 0 . 504 0.465 0.483 0.474 0.248 0 . 521 0.385 0 . 346 0 . 379 0.363 0.272 0.519 0.396 0.591 0 . 687 0.639 0 . 314 0.886 0.600 0.290 0.444 0.367 0 . 676 0.308 0.492 0.156 0.549 0.353 0.689 0.656 0 . 673 0 . 176 0.122 0.149 0 . 164 0 . 486 0.325 0 . 208 0.102 0 . 155 0 . 826 0 . 509 0.668 0.430 0.213 0 . 322 0.234 0.749 0 . 492 0 . 322 0.543 0 .433 0 . 610 0.604 0 . 607 0 . 215 0.611 0.413 0 . 202 0.418 0.310 0 . 275 0.207 0.241 0.386 0.226 0.306 0.074 0.237 0 . 156 0.320 0 . 254 0.287 0.459 0.256 0.358 0.440 0 . 509 0.475 0.496 0.409 0.453 0.282 0.390 0.336 0.511 0.344 0.428 0.704 0.367 0.536 0.646 0.420 0.533 0.234 0.447 0 . 341 0.615 0.661 0.638 0 . 483 0.336 0 . 410 0.420 0.253 0.337 0 . 163 0.128 0.146 0 . 282 0.264 0 . 273 0.359 0.322 0.341 0.338 0.415 0.377 1.041 0.738 0.890 0.403 0.342 0.373 0.457 0.656 0.557 0 . 435 0.347 0.391 0 . 616 0.518 0.567 0 . 255 1 . 043 0.649 0.568 0.201 0.385 0.443 0 . 263 0.353 0.388 0.302 0.345 0.274 0.527 0 . 401 0.362 0.247 0.305 0.367 0 . 458 0.413 0 . 293 0 . 484 0.389 0 . 244 0 . 358 0.301 0.528 0.572 0 . 550 0.541 0.444 0.493 0 . 335 0.270 0.303 0.577 0 . 362 0.470 0.403 0.407 0.405 0 . 101 0.182 0.142
139
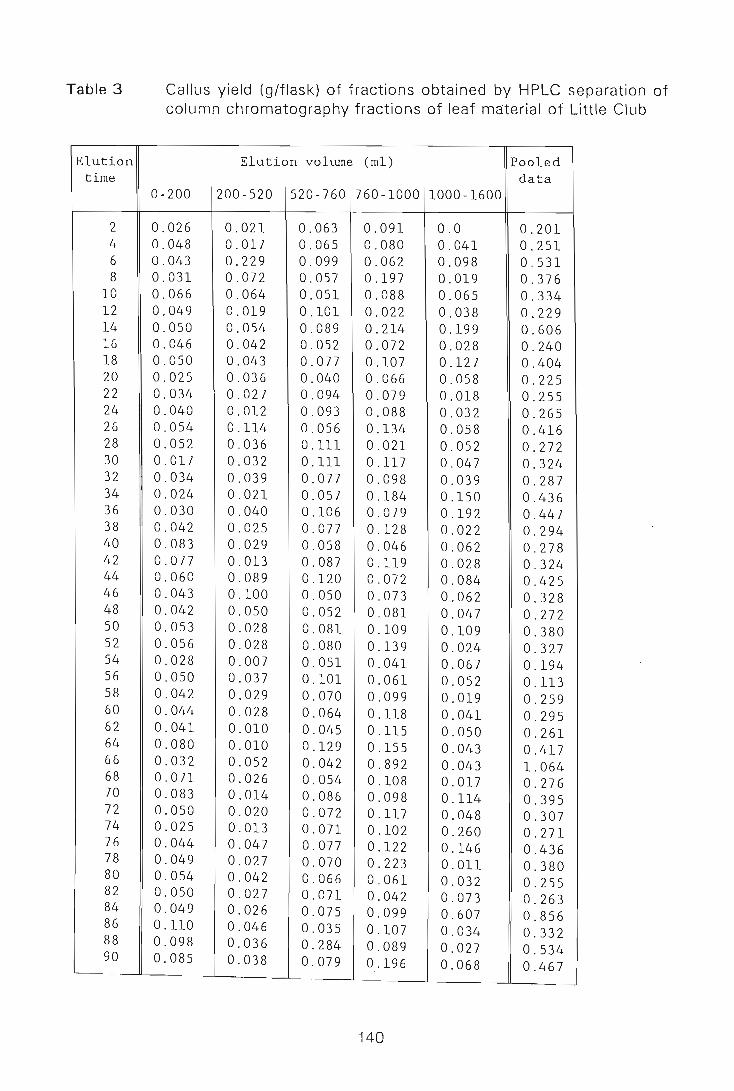
Table 3
Elution time
2 4 6 8
10 12 14 16 18 20 22 24 26 28 30 32 34 36 38 40 42 44 46 48 50 52 54 56 58 60 62 64 66 68 70 72 74 76 78 80 82 84 86 88 90
Callus yield (g/flask) of fractions obtained by HPLC separation of column chromatography fractions of leaf material of Little Club
Elution volume (ml) Pooled data
0-200 200-520 520-760 760-1000 1000-1600
0.026 0 . 021 0 . 063 0.091 0 . 0 0.201 0.048 0 . 017 0 .065 0.080 0.041 0.251 0.043 0.229 0.099 0.062 0.098 0.531 0.031 0 . 072 0 . 057 0.197 0.019 0.376 0.066 0.064 0.051 0 . 088 0.065 0.334 0.049 0 . 019 0.101 0.022 0.038 0.229 0.050 0.054 0 . 089 0.214 0 . 199 0 . 606 0.046 0 . 042 0 . 052 0 . 072 0 . 028 0 . 240 0.050 0.043 0 . 077 0 . 107 0.127 0.404 0.025 0.036 0 . 040 0 . 066 0 . 058 0.225 0 . 034 0 . 027 0 . 094 0.079 0.018 0.255 0.040 0 . 012 0 . 093 0.088 0.032 0.265 0.054 0 . 114 0 . 056 0.134 0 .058 0 . 416 0 . 052 0 . 036 0 . 111 0.021 0.052 0.272 0.017 0.032 0 . 111 0.117 0.047 0.324 0.034 0.039 0.077 0.098 0.039 0.287 0.024 0.021 0.057 0.184 0.150 0 . 436 0.030 0.040 0.106 0 . 079 0.192 0.447 0.042 0.025 0.077 0 . 128 0.022 0.294 0 . 083 0.029 0.058 0.046 0 . 062 0 . 278 0.077 0 . 013 0 . 087 0 . 119 0.028 0 . 324 0 . 060 0.089 0.120 0.072 0.084 0.425 0.043 0 . 100 0.050 0 . 073 0.062 0.328 0.042 0.050 0.052 0.081 0.047 0 . 272 0.053 0 . 028 0 . 081 0 . 109 0.109 0 . 380 0 . 056 0 . 028 0.080 0 . 139 0.024 0.327 0 . 028 0 . 007 0.051 0 . 041 0 . 067 0 . 194 0.050 0.037 0.101 0.061 0.052 0.113 0.042 0.029 0.070 0 . 099 0.019 0.259 0 . 044 0 . 028 0.064 0.118 0 . 041 0.295 0.041 0.010 0.045 0 . 115 0.050 0.261 0.080 0 . 010 0.129 0.155 0 . 043 . 0.417 0.032 0.052 0.042 0 . 892 0.043 1.064 0 . 071 0.026 0.054 0 . 108 0.017 0.276 0.083 0.014 0.086 0.098 0.114 0.395 0.050 0 . 020 0 . 072 0 . 117 0 . 048 0.307 0.025 0.013 0 . 071 0.102 0.260 0.271 0.044 0 . 047 0.077 0.122 0.146 0.436 0.049 0.027 0 . 070 0 . 223 0 . 011 0.380 0 . 054 0 . 042 0.066 0 . 061 0 . 032 0.255 0.050 0.027 0.071 0.042 0.073 0.263 0.049 0 . 026 0.075 0 . 099 0.607 0.856 0.110 0.046 0.035 0.107 0.034 0.332 0.098 0.036 0.284 0.089 0.027 0 . 534 0.085 0.038 0 . 079 0.196 0.068 0.467
140
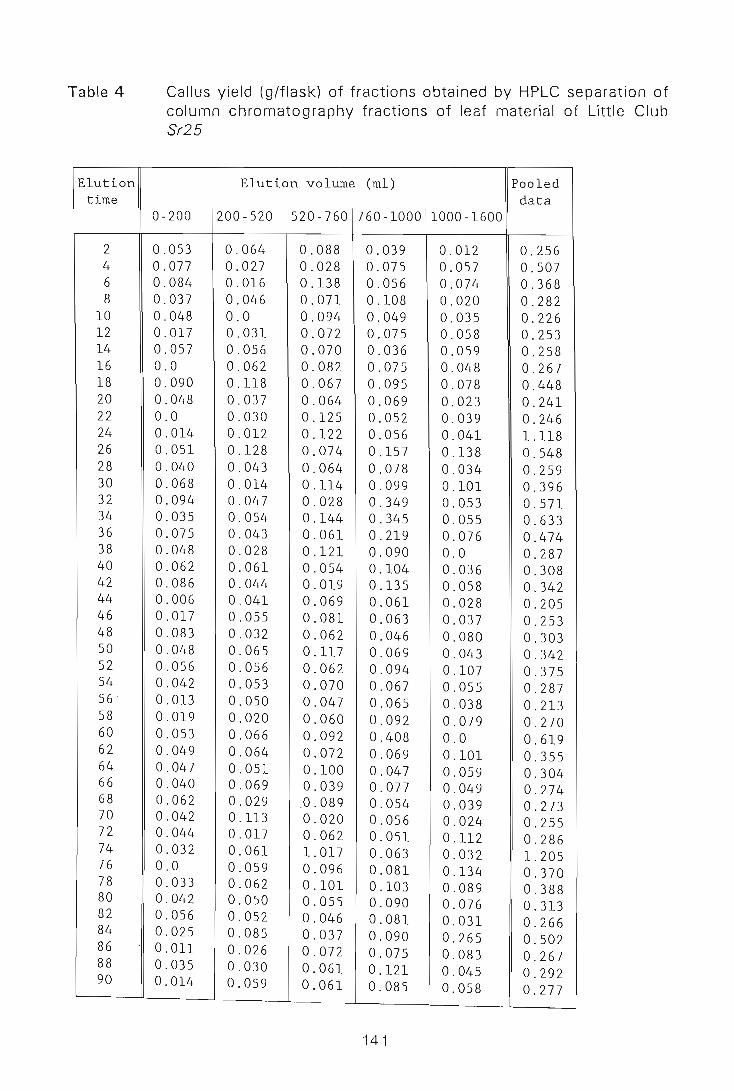
Table 4
Elution time
2 4 6 8
10 12 14 16 18 20 22 24 26 28 30 32 34 36 38 40 42 44 46 48 50 52 54 56 58 60 62 64 66 68 70 72 74 76 78 80 82 84 86 88 90
Callus yield (g/flask) of fractions obtained by HPLC separation of column chromatography fractions of leaf material of Little Club Sr25
Elution volume (m1) Pooled data
0-200 200-520 520-760 760-1000 1000-1600
0 . 053 0.064 0 . 088 0 . 039 0 . 012 0.256 0 . 077 0.027 0.028 0 . 075 0.057 0.507 0 .084 0 . 016 0 . 138 0.056 0 . 074 0 . 368 0 . 037 0.046 0.071 0 . 108 0 . 020 0.282 0.048 0.0 0.094 0.049 0.035 0 . 226 0.017 0 . 031 0.072 0.075 0.058 0.253 0.057 0.056 0.070 0.036 0.059 0.258 0.0 0.062 0 . 082 0.075 0.048 0 . 267 0 . 090 o .1l8 0 . 067 0 . 095 0 .078 0.448 0.048 0 . 037 0.064 0.069 0 . 023 0 . 241 0 . 0 0 . 030 0 . 125 0 . 052 0 . 039 0.246 0.014 0 . 01 2 0.12 2 0.056 0 . 041 1 . ll8 0.051 0 . 128 0.074 0 . 157 0 . 138 0 . 548 0 . 040 0 . 04 3 0.06 4 0 . 078 0.034 0.259 0 . 068 0 . 014 0.114 0.099 0 .101 0.396 0 . 094 0 . 047 0.028 0 . 349 0.053 0.571 0.035 0 . 054 0.144 0.345 0 . 055 0 . 633 0.075 0 . 043 0.061 0 . 219 0 . 076 0 . 474 0.048 0 . 028 0.121 0.090 0 . 0 0 . 287 0.062 0.061 0.054 0.104 0.036 0 . 308 0 . 086 0 . 044 0 . 019 0 . 135 0 . 058 0 . 342 0 . 006 0 . 041 0 . 069 0.061 0 . 028 0 . 205 0 . 017 0 . 055 0 . 081 0 . 063 0.037 0 . 253 0 .083 0 . 032 0 . 062 0 . 046 0.080 0 . 303 0 .048 0.065 0.117 0 . 069 0.043 0.342 0.056 0 . 056 0 . 062 0 . 094 0 . 107 0.375 0 .042 0 . 053 0 . 070 0 . 067 0 . 055 0.287 0 . 0l3 0 . 050 0.047 0 . 065 0 . 038 0.213 0 . 019 0.020 0.060 0 . 092 0.079 0 . 270 0.053 0.066 0.092 0.408 0.0 0.619 0 . 049 0.064 0.072 0.069 0 . 101 0 . 355 0 . 047 0.051 0 . 100 0.047 0 . 059 0.304 0.040 0 . 069 0.039 0.077 0.049 0 . 274 0 . 062 0 . 029 .0 . 089 0 . 054 0.039 0 . 273 0.042 0.1l3 0.020 0.056 0 . 024 0.255 0.044 0.017 0 . 062 0.051 0 . 1l2 0.286 0.032 0.061 l. 017 0 . 063 0.032 l. 205 0 . 0 0.059 0.096 0 . 081 0 . l34 0 . 370 0.033 0.062 0.101 0.103 0 . 089 0 . 388 0 . 042 0 . 050 0.055 0 . 090 0.076 0.313 0.056 0 . 052 0 . 046 0.081 0 . 031 0.266 0.025 0.085 0.037 0.090 0.265 0.502 O. Oll 0 . 026 0 . 072 0.075 0 . 083 0 . 267 0 . 035 0.030 0.061 0 . 121 0.045 0.292 0.014 0.059 0 . 061 0.085 0.058 0.277
141
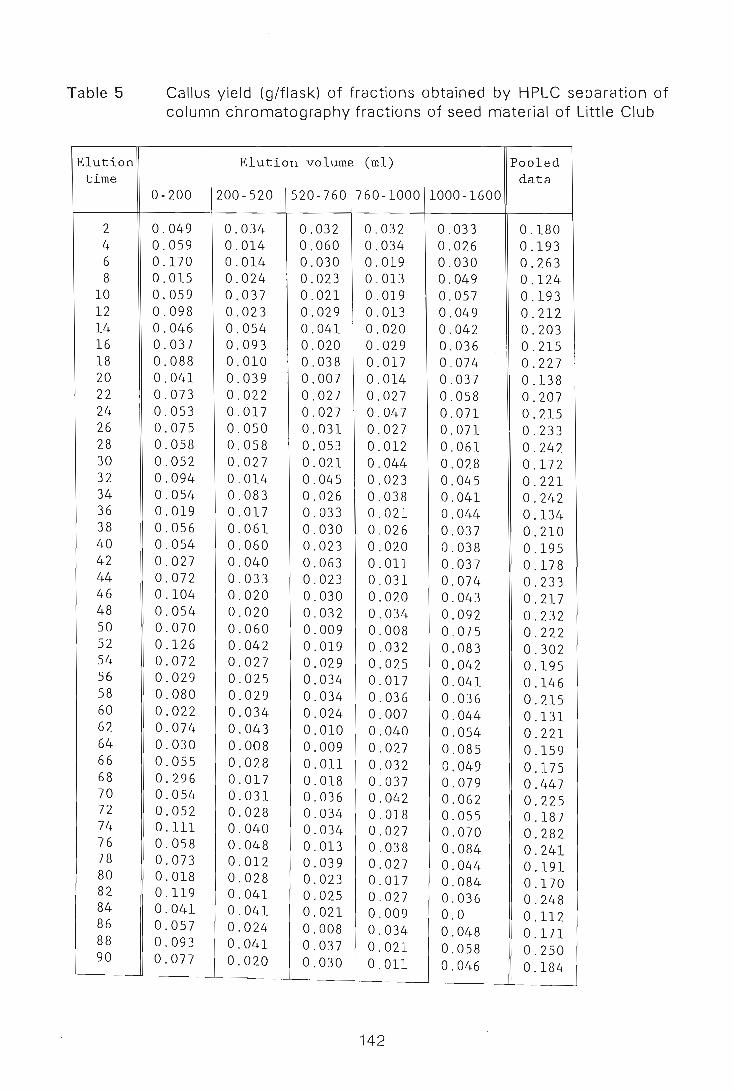
Table 5
Elution time
2 4 6 8
10 12 14 16 18 20 22 24 26 28 30 32 34 36 38 40 42 44 46 48 50 52 54 56 58 60 62 64 66 68 70 72 74 76 78 80 82 84 86 88 90
Callus yield (gfflask) of fractions obtained by HPLC separation of column chromatography fractions of seed m-aterial of Little Club
Elution volume (ml) Pooled data
0-200 200-520 520-760 760-1000 1000-1600
0.049 0 . 034 0.032 0 . 032 0 . 033 0 . 180 0.059 0 . 014 0.060 0.034 0 . 026 0.193 0.170 0.014 0.030 0.019 0.030 0.263 0.015 0.024 0.023 0.013 0 . 049 0.124 0.059 0.037 0.021 0.019 0 .057 0.193 0.098 0.023 0.029 0.013 0.049 0.212. 0.046 0.054 0.041 0.020 0.042 0.203 0.037 0.093 0.020 0 . 029 0.036 0.215 0.088 0.010 0.038 0.017 0 . 074 0.227 0.041 0.039 0.007 0 . 014 0.037 0.138 0.073 0.022 0.027 0.027 0.058 0.207 0.053 0 . 017 0.027 0 .047 0 . 071 0.215 0.075 0.050 0.031 0 . 027 0 . 071 0.233 0 . 058 0.058 0.053 0 . 012 0.061 0.242 0.052 0.027 0.021 0.044 0.028 0.172 0.094 0.014 0.045 0 . 023 0.045 0.221 0.054 0.083 0.026 0.038 0 . 041 0.242 0.019 0.017 0.033 0.021 0.044 0.134 0.056 0 . 061 0.030 0.026 0.037 0.210 0.054 0.060 0.023 0 . 020 0.038 0.195 0.027 0.040 0 . 063 O.Oll 0.037 0.178 0.072 0.033 0 . 023 0 . 031 0.074 0.233 0.104 0.020 0 . 030 0 . 020 0.043 0.217 0.054 0.020 0.032 0.034 0.092 0.232 0.070 0.060 0 . 009 0.008 0 . 075 0.222 0.126 0.042 0.019 0.032 0.083 0.302 0.072 0.027 0.029 0.025 0.042 0.195 0.029 0.025 0.034 0 . 017 0.041 0.146 0.080 0.029 0.034 0 . 036 0.036 0.215 0.022 0.034 0.024 0 . 007 0 .044 0.131 0.074 0.043 0 . 010 0.040 0.054 0.221 0.030 0.008 0.009 0.027 0 .085 0.159 0.055 0.028 O.Oll 0.032 0 . 049 0.175 0.296 0.017 0.018 0.037 0.079 0.447 0.054 0.031 0.036 0 . 042 0.062 0.225 0.052 0.028 0.034 0.018 0.055 0.187 0.111 0.040 0.034 0 . 027 0.070 0.282 0.058 0.048 0.013 0.038 0.084 0.241 0.073 0.012 0.039 0.027 0.044 0.191 0.018 0.028 0.023 0.017 0.084 0.170 0.119 0 . 041 0.025 0 . 027 0 . 036 0.248 0.041 0.041 0.021 0 . 009 0 .0 0.ll2 0.057 0.024 0.008 0 . 034 0.048 0.171 0.093 0.041 0.037 0 . 021 0.058 0 . 250 0.077 0 . 020 0.030 O.Oll 0.046 0.184
142
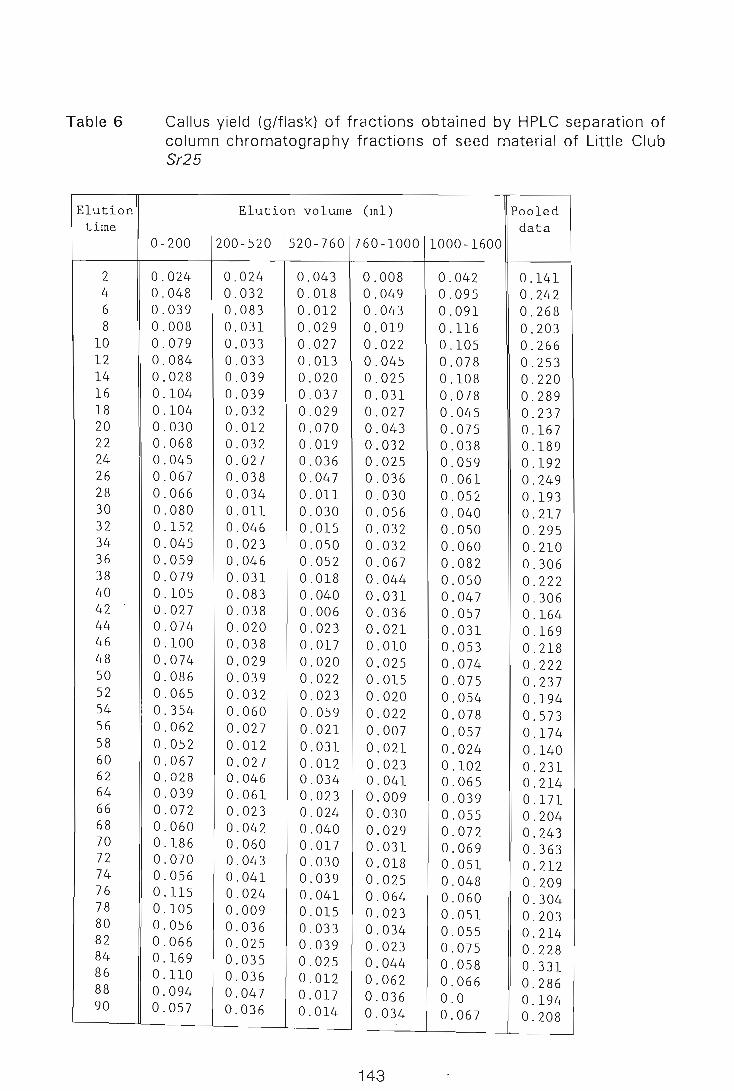
Table 6
Elution time
2 4 6 8
10 12 14 16 18 20 22 24 26 28 30 32 34 36 38 40 42 -44 46 48 50 52 54 56 58 60 62 64 66 68 70 72 74 76 78 80 82 84 86 88 90
Callus yield (g/flask) of fractions obtained by HPLC separation of column chromatography fractions of seed material of Little Club Sr25
Elution volume (ml) Pooled data
0-200 200-520 520-760 760-1000 1000-1600
0.024 0.024 0.043 0.008 0.042 0.141 0.048 0.032 0.018 0.049 0.095 0.242 0.039 0.083 0.012 0.043 0.091 0.268 0.008 0.031 0.029 0.019 0.116 0.203 0.079 0.033 0.027 0.022 0.105 0.266 0.084 0.033 0.013 0.045 0.078 0.253 0.028 0.039 0.020 0.025 0.108 0.220 0.104 0.039 0.037 0.031 0.078 0.289 0.104 0.032 0.029 0.027 0.045 0.237 0.030 0.012 0.070 0.043 0.075 0.167 0.068 0.032 0 . 019 0.032 0.038 0.189 0.045 0.027 0.036 0.025 0.059 0.192 0.067 0.038 0.047 0.036 0.061 0.249 0.066 0.034 0.011 0.030 0.052 0.193 0.080 0.011 0.030 0.056 0.040 0.217 0.152 0.046 0.015 0.032 0.050 0.295 0.045 0.023 0.050 0.032 0.060 0.210 0.059 0.046 0.052 0.067 0.082 0.306 0.079 0.031 0.018 0.044 0.050 0.222 0.105 0.083 0.040 0.031 0.047 0.306 0.027 0.038 0.006 0.036 0.057 0.164 0.074 0.020 0.023 0.021 0.031 0.169 0.100 0.038 0.017 0.010 0.053 0.218 0.074 0.029 0.020 0.025 0.074 0.222 0.086 0.039 0.022 0.015 0.075 0.237 0.065 0.032 0.023 0.020 0.054 0.194 0.354 0.060 0.059 0.022 0.078 0.573 0.062 0.027 0.021 0.007 0.057 0.174 0.052 0.012 0.031 0.021 0.024 0.140 0.067 0.027 0.012 0.023 0.102 0.231 0.028 0.046 0.034 0.041 0.065 0.214 0.039 0.061 0.023 0.009 0.039 0.171 0.072 0.023 0.024 0.030 0.055 0.204 0.060 0.042 0.040 0.029 0.072 0.243 0.186 0.060 0.017 0.031 0.069 0.363 0.070 0.043 0.030 0.018 0.051 0.212 0.056 0.041 0.039 0.025 0.048 0.209 0.115 0.024 0.041 0.064 0.060 0.304 0.105 0.009 0.015 0.023 0.051 0.203 0.056 0.036 0.033 0.034 0 .055 0.214 0.066 0.025 0.039 0.023 0.075 0.228 0.169 0.035 0.025 0.044 0.058 0.331 0.110 0.036 0.012 0.062 0.066 0.286 0 . 094 0.047 0.017 0.036 0.0 0.194 0.057 0.036 0.014 0.034 0.067 0.208
143
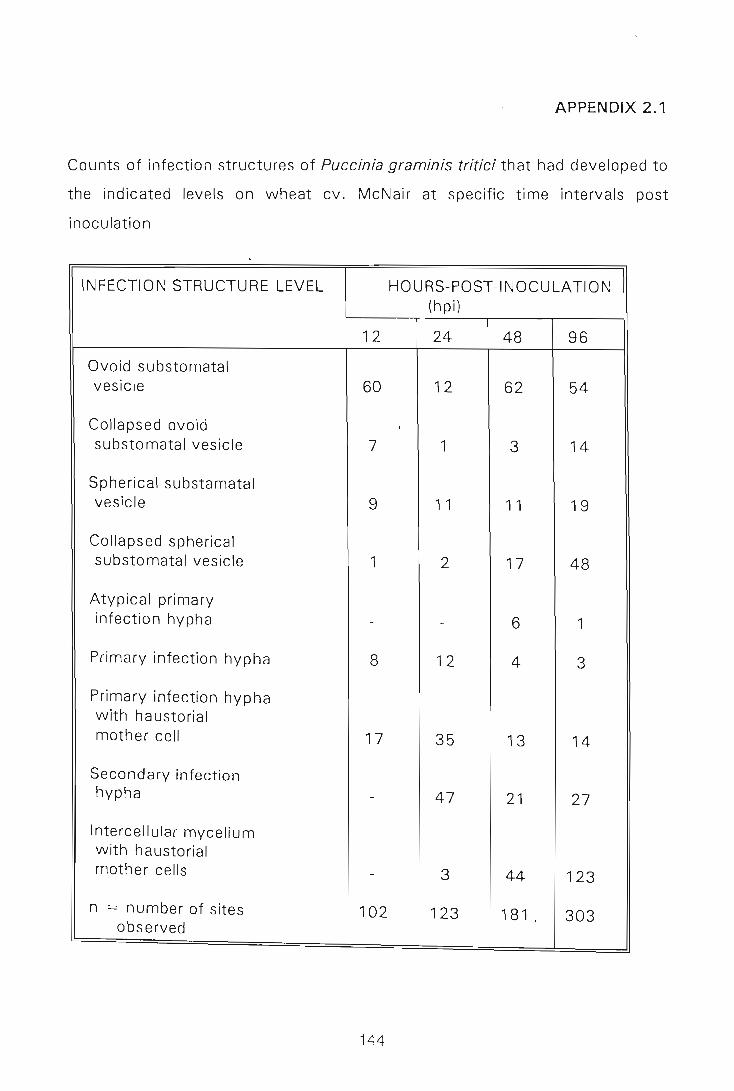
APPENDIX 2.1
Counts of infection structures of Puccinia graminis tritici that had developed to
the indicated levels on wheat cv. McNair at specific time intervals post
inoculation
INFECTION STRUCTURE LEVEL HOURS-POST-INOCULATION (hpi)
12 24 48 96
Ovoid substomatal vesicle 60 12 62 54
Collapsed ovoid . substomatal vesicle 7 1 3 14
Spherical substamatal vesicle 9 11 11 19
Collapsed spherical substomatal vesicle 1 2 17 48
Atypical primary infection hypha - - 6 1
Primary infection hypha 8 12 4 3
Primary infection hypha with haustorial mother cell 17 35 13 14
Secondary infection hypha - 47 21 27
Intercellular mycelium with haustorial mother cells - 3 44 123
n = number of sites 102 123 181 , 303 observed
144
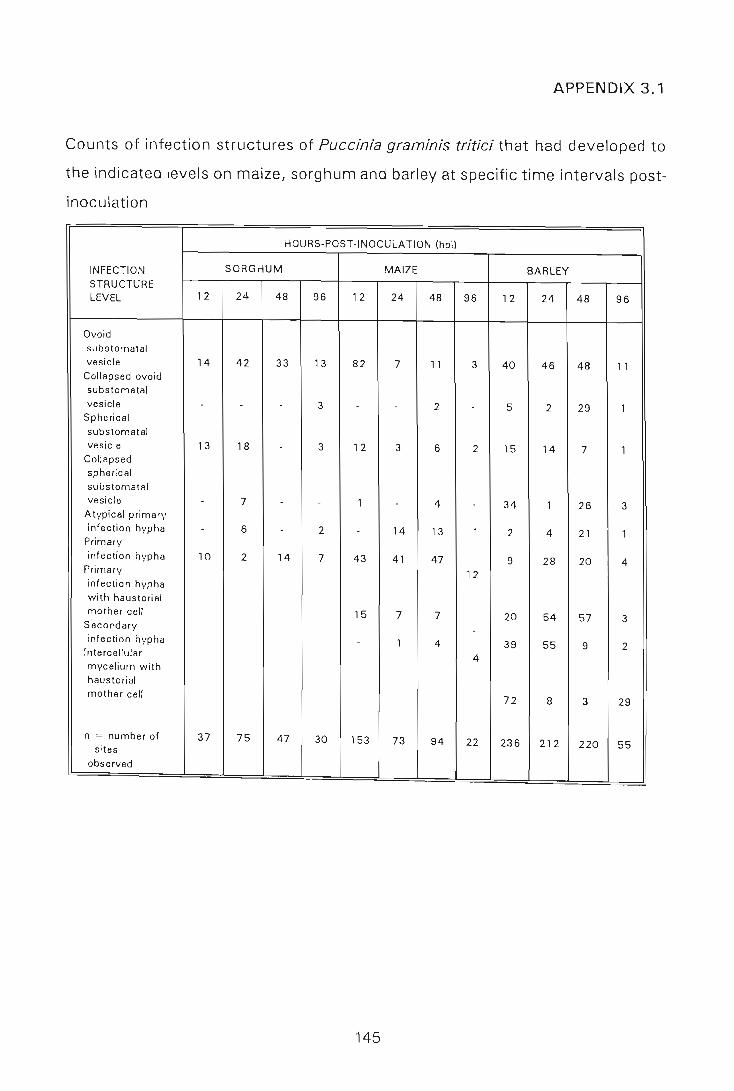
APPENDIX 3.1
Counts of infection structures of Puccinia graminis tritici that had developed to
the indicated levels on maize, sorghum and barley at specific time intervals post
inoculation
HOURS-POST-INOCULATION (hpi)
INFECTION SORGHUM MAIZE BARLEY STRUCTURE LEVEL 12 24 48 96 12 24 48 96 12 24 48 96
-
Ovoid substomatal vesicle 14 42 33 13 82
Collapsed ovoid 7 11 3 40 46 48 11
substomatal vesicle - - - 3 - - 2 5 2 29 1
Spherical substomatal vesicle 13 18 - 3 12
Collapsed 3 6 2 15 14 7 1
spherical substomatal vesicle - 7 - - 1
Atypical primary - 4 - 34 1 26 3
infection hypha - 6 - 2 -Primary
14 13 1 2 4 21 1
infection hypha 10 2 14 7 43 41 47 9 28 20 4 Primary 12
infection hypha with haustorial mother cell 15 7 7 20 54 57 3 Secondary -infection hypha - 1 4 39 55 9 2 Intercellular
4 mycelium with haustorial mother cell
72 8 3 29
n = number of 37 75 47 30 153 73 94 22 236 212 220 55 sites observed
145
APPENDIX 4.1
Counts of infection structures of Puccinia graminis f,sp. tritici race 2SA2 that had
developed to the indicated levels on ISr5Ra and ISrBRa by 48 hpi.
ISr5Ra
LEAF NUMBER CATEGORY REP
- 1 2 3 4 5 6 7 8 9 10 X· X··
Germ tubes 1 5 18 37 11 13 21 21 30 23 32 21.1 2 34 57 34 47 30 32 48 54 30 47 38.3 3 19 ' 16 29 19 14 28 16 19 17 31 20 .8 4 14 35 9 34 45 36 35 4 13 35 26 .0 26 .55
Appressoria not 1 2 1 11 3 2 3 11 2 6 14 4 .5 over stoma 2 6 22 8 17 18 10 10 23 7 7 12 .8
3 5 6 6 9 7 4 3 3 1 3 4 .7 4 3 3 8 2 3 5 6 1 3 5 3 .9 6.46
Appressoria over 1 13 21 38 26 35 22 53 27 22 31 28.8 s toma 2 40 80 46 64 114 29 71 70 47 75 63 .6 3 54 29 84 36 30 76 29 48 67 41 49.4 4 44 68 26 52 53 38 107 38 14 71 51 .1 48.23
Substomatal vesicle 1 6 1 8 3 11 5 19 0 6 34 9.3 2 30 4 11 3 3 1 10 2 11 6 8.1 3 1 1 12 2 8 2 9 2 2 2 4 .1 4 12 6 0 8 4 4 12 4 0 0 5 .0 6.63
Primary infe ction 1 33 5 34 4 8 20 22 10 1 27 16.4 hypha with 2 44 11 34 61 7 39 88 3 28 60 37 .5 primary haustorial 3 3 14 2 2 9 3 10 15 0 6 6 .4 mother cell 4 29 12 5 6 19 19 6 2 8 1 9 .7 17.50
Secondary 1 0 0 0 0 0 3 0 0 0 0 0.3 haustorial mother 2 6 0 7 7 2 7 26 1 13 7 7.6 cells 3 1 17 5 0 4 0 4 16 1 3 5 .1 4 6 8 3 2 10 8 1 2 11 1 5.2 4.55 Total number of 1 7 0 .7 secondary 2 9 0 16 17 4 15 49 1 22 16 14.9 haustorial 3 1 40 13 0 12 0 8 52 1 9 13.6 mother cells 4 15 16 9 6 24 15 2 7 33 1 12.8 10.50
x ' Mean of counts from 10 leaves
X" Overall mean of four replicates
146
ISr8Ra
LEAF NUMBER CATEGORY REP
1 2 3 4 5 6 7 8 9 10 X' X"
Germ tubes 1 38 23 20 35 6 16 14 18 33 8 19 .1 2 21 35 29 41 24 24 71 70 61 102 47.8 3 39 15 15 15 12 31 23 13 36 21 20.0 4 17 40 21 13 45 36 31 19 24 14 26.0 28.22
Appressoria not 1 13 14 0 7 1 2 4 10 3 10 6.4 over stoma 2 9 18 12 11 4 11 12 18 13 38 14.6
3 12 11 5 3 4 6 2 3 10 3 5 .9 4 3 9 3 1 10 4 2 5 2 2 4.1 7.75
Appressoria over 1 29 40 16 47 8 12 11 36 33 41 27.3 stoma 2 16 41 88 20 16 77 140 66 64 146 67.4 3 90 46 29 33 63 47 28 40 29 61 46.6 4 93 98 38 33 99 110 50 84 63 53 72 .1 53.35
Substomatal vesicle 1 17 8 1 11 1 4 4 28 30 14 11.8 2 6 19 6 10 5 8 16 9 11 15 10.5 3 4 2 6 0 8 1 19 2 7 1 5.0 4 3 0 5 3 1 10 3 2 0 3 3 .0 7.58
Primary infection 1 29 61 2 43 11 12 12 34 66 57 31.7 hypha with 2 37 63 14 25 32 16 22 31 18 4 26.2 primary haustorial 3 14 2 9 11 11 6 2 10 7 11 8.3 mother cell 4 17 11 17 8 5 2 13 5 0 8 7.6 18.45
Secondary infection 1 6 1 0 1 1 0 0 1 1 0 1 . 1 hypha 2 13 13 6 2 22 3 1 6 4 0 7.0 3 4 4 4 5 19 7 1 12 17 0 7.3 4 6 2 12 11 4 0 17 1 0 12 6.5 5.48
Total number of 1 23 3 0 2 3 0 0 1 1 0 3.3 secondary 2 36 39 9 6 61 9 1 14 14 0 18.9 haustorial 3 10 14 9 13 51 15 1 39 47 0 19.9 mother cells 4 11 9 37 38 12 0 62 2 0 39 21.0 15 .77
X' Mean of counts from 10 leaves
X" Overall mean of four replicates
147
APPENDIX 4.2
Numbers of secondary haustorial mother cells (HMC) associated with infection sites
(colonies) in four replicates of 10 leaves of ISr5Ra and ISr8Ra
ISr5Ra
Total Number of Colonies with n Haustorial Mother Cells. REP where n =
1 2 3 4 5 6
1 0 2 1 0 0 0
2 27 29 16 4 0 0 3 9 12 19 10 0 1
4 10 19 15 6 1 1
Mean 11.5 15 .5 12 .8 5 0.25 0.5
ISr8Ra
Total Number of Colonies with n Haustorial Mother Cells . REP where n =
1 2 3 4 5 6
1 2 2 4 1 1 0 2 9 18 30 11 1 1 3 10 25 20 13 3 2 4 5 14 21 17 2 5
Mean 6.5 14.8 18.8 10 .5 1.8 2
148