Embed Size (px)
Citation preview
This is the author’s version of a work that was submitted/accepted for pub-lication in the following source:
Chen, YiKai, He, Jie, King, Mark, Chen, WuWei, & Zhang, WeiHua (2012)Effect of driving conditions and suspension parameters on dynamic load-sharing of longitudinal-connected air suspensions. Science China Tech-nological Sciences, 56(3), pp. 666-676.
This file was downloaded from: http://eprints.qut.edu.au/58799/
Notice: Changes introduced as a result of publishing processes such ascopy-editing and formatting may not be reflected in this document. For adefinitive version of this work, please refer to the published source:
http://dx.doi.org/10.1007/s11431-012-5091-3
SCIENCE CHINA Technological Sciences
© Science China Press and Springer-Verlag Berlin Heidelberg 2012 tech.scichina.com www.springerlink.com
*Corresponding author (email: [email protected])
• RESEARCH PAPER • March 2013 Vol.56 No.3: 666–676
doi: 10.1007/s11431-012-5091-3
Effect of driving conditions and suspension parameters on dynamic load-sharing of longitudinal-connected air suspensions
CHEN YiKai1,2*, HE Jie3, KING Mark4, CHEN WuWei5 & ZHANG WeiHua1
1 School of Transportation Engineering, Hefei University of Technology, Hefei 230009, China; 2 Traffic Management Research Institute of the Ministry of Public Security, Wuxi 214151, China;
3 School of Transportation, Southeast University, Nanjing 210096, China; 4 Centre for Accident Research and Road Safety-Queensland, Queensland University of Technology, Kelvin Grove 4059, Australia;
5 School of Mechanical and Automotive Engineering, Hefei University of Technology, Hefei 230009, China
Received August 16, 2012; accepted November 5, 2012; published online December 18, 2012
The objective of this research was to investigate the effects of driving conditions and suspension parameters on dynamic load-sharing of longitudinal-connected air suspensions of a tri-axle semi-trailer. A novel nonlinear model of a multi-axle semi-trailer with longitudinal-connected air suspension was formulated based on fluid mechanics and thermodynamics and was validated through test results. The effects of driving conditions and suspension parameters on dynamic load-sharing and road-friendliness of the semi-trailer were analyzed. Simulation results indicate that the road-friendliness metric–DLC (dynamic load coefficient) is not always in accordance with the load-sharing metric–DLSC (dynamic load-sharing coefficient). The ef-fect of employing larger air lines and connectors on the DLSC optimization ratio gives varying results as road roughness in-creases and as driving speed increases. When the vehicle load reduces, or the static pressure increases, the DLSC optimization ratio declines monotonically. The results also indicate that if the air line diameter is always assumed to be larger than the con-nector diameter, the influence of air line diameter on load-sharing is more significant than that of the connector.
driving condition, dynamic load-sharing, longitudinal-connected air suspension, heavy truck
Citation: Chen Y K, He J, King M, et al. Effect of driving conditions and suspension parameters on dynamic load-sharing of longitudinal-connected air sus-pensions. Sci China Tech Sci, 2013, 56: 666676, doi: 10.1007/s11431-012-5091-3
1 Introduction
Extensive studies of “road-friendly” heavy vehicles have been performed during the last few decades to reduce road damage and increase the rated load of vehicles. However, the load-sharing ability of multi-axle heavy vehicles, which has a strong correlation with road-friendliness, has been far from being adequately investigated. Load-sharing is defined as the equalization of the axle group load across all wheels/axles [1]. When a multi-axle heavy vehicle with leaf
suspensions travels on a rough road or hits a bump/ pothole, such as a bridge-head, or speed control humps, unequally distributed loads among the axles of an axle group tend to appear due to the ineffectiveness of the load-sharing mech-anism (centrally pivoted walking beam, trunnion shaft, etc.) and the high stiffness of leaf springs [2]. This phenomenon causes overloading of a single axle of the axle group, which has at least two disadvantages: (a) It increases the possibil-ity of a tire bursting as well as reducing the maneuverability and stability of the vehicle; (b) it accelerates the rutting and fatigue that contributes to pavement damage [3]. As a con-sequence, the improvement of load-sharing within axle groups has attracted much attention among both vehicle
Chen Y K, et al. Sci China Tech Sci March (2013) Vol.56 No.3 667
manufacturers and road management departments. Load-sharing performances of axle groups are specified
in regulations for road-friendly vehicles in many countries. The DIVINE (Dynamic Interaction between Vehicle and Infrastructure Experiment) project undertaken by OECD (Organization for Economic Cooperation and Development) suggests that to qualify as a road-friendly tandem suspen-sion, the average load variation per unit of relative vertical suspension displacement must be less than 0.3 kN/mm [4]. The Australian specification for road-friendly suspensions nominates that road-friendly suspensions must have static load-sharing, i.e., load-sharing when the vehicle is station-ary, to a defined value, between axles in an axle group or tires in an axle group. However, the formal methodology to determine the static load-sharing value on a heavy vehicle is not defined [5]. In Europe, an air suspension needs to have fully-functioning hydraulic shock absorbers to pass a static road-friendliness test [6], and heavy vehicles with road- friendly suspensions are allowed higher static axle loads. A common problem for these regulations is that only the static load-sharing of vehicles is specified, there is no requirement for suspensions to retain their dynamic load-sharing per-formance, i.e., load-sharing when the vehicle is driving.
Many other load-sharing metrics have also been pro-posed by researchers. LSC (load-sharing coefficient) [7] and DLSC (dynamic load-sharing coefficient) [8] have been used to evaluate static and dynamic load-sharing, respec-tively. Note that perfect load equalization would give a LSC of 1.0 [9]; LSC values for steel suspensions were docu-mented in the range 0.791 to 0.957 [7]. Air suspensions with conventional-size longitudinal air lines were placed in the middle of this range with LSCs of 0.904 to 0.925 [10]. More recent studies commissioned by the National Road Transport Commission of Australia found that installation of larger air lines on multi-axle air suspensions increased longitudinal air flow between air springs on adjacent axles [11, 12]. Follow-up tests funded by the Queensland De-partment of Main Roads discovered that an improvement in DLSC of 4%–30% for a tri-axle coach and 37%–77% for a tri-axle semi-trailer were obtained by alternating the con-ventional-size longitudinal air connection (three 6.5 mm inside diameter connectors connecting 6.5 mm inside diam-eter air lines) with a larger air connection (three 20 mm in-side diameter connectors connecting 50 mm inside diameter air lines) [13, 14]. However, due to the limitations of labor-atory equipment, only vehicle speed and a limited number of air connections were considered in most tests, such that the effect of some other factors, such as the static absolute air pressure of the air spring, static height of the air spring, road class, and vehicle load, on load-sharing have not yet been reported before.
Limitations of laboratory and on-road tests can be ad-dressed by developing realistic models of longitudinal- connected air suspensions. Potter et al. developed a simpli-fied tandem bogie model, and by changing the damping coefficient and torsional stiffness of the leveling beam of
the model [2], it can represent load-leveling steel suspen-sions, independent steel suspensions, longitudinal-con- nected air suspensions, and independent air suspensions, respectively. Davis proposed a model of a tri-axle semi- trailer with longitudinal-connected air suspensions [13], and used a variable “load-sharing fraction” to represent the load- sharing ability of the suspension. However, the physical meaning of the variable was unclear. A more realistic model of a similar tri-axle semi-trailer was developed by Roebuck et al. based on aerodynamics and thermodynamics [15]. In the model, the volumetric flow rate (m3/s) between two air springs was assumed to be simply proportional to the dif-ference in air pressure with a constant coefficient Cflow (m3/ kPa s); in addition, the volumes and effective areas of the air springs were simplified as constants while the vehicle was travelling.
Unfortunately, these simplifications of nonlinearities re-duced the precision of the proposed models. A more realis-tic model of longitudinal-connected multi-axle air suspen-sions is urgently needed for precise analysis and optimiza-tion of load-sharing in multi-axle semi-trailers.
The rest of this paper is organized in the following order. In Section 2, a novel nonlinear model of longitudinal-con- nected tri-axle air suspensions is derived based on fluid mechanics and thermodynamics. The accuracy of the model is validated and load-sharing criteria are chosen in Section 3. Based on the model, the effects of driving conditions (road class, vehicle speed and vehicle load) and air suspension parameters (static height and static absolute air pressure of air spring, inside diameters of air line and connector) on dynamic load-sharing are analyzed in Section 4 and Section 5, respectively. Finally, Section 6 presents a summary of the results and draws conclusions.
2 Integrated model of vehicle and road excita-tion
2.1 Mathematic model of the tri-axle semi-trailer
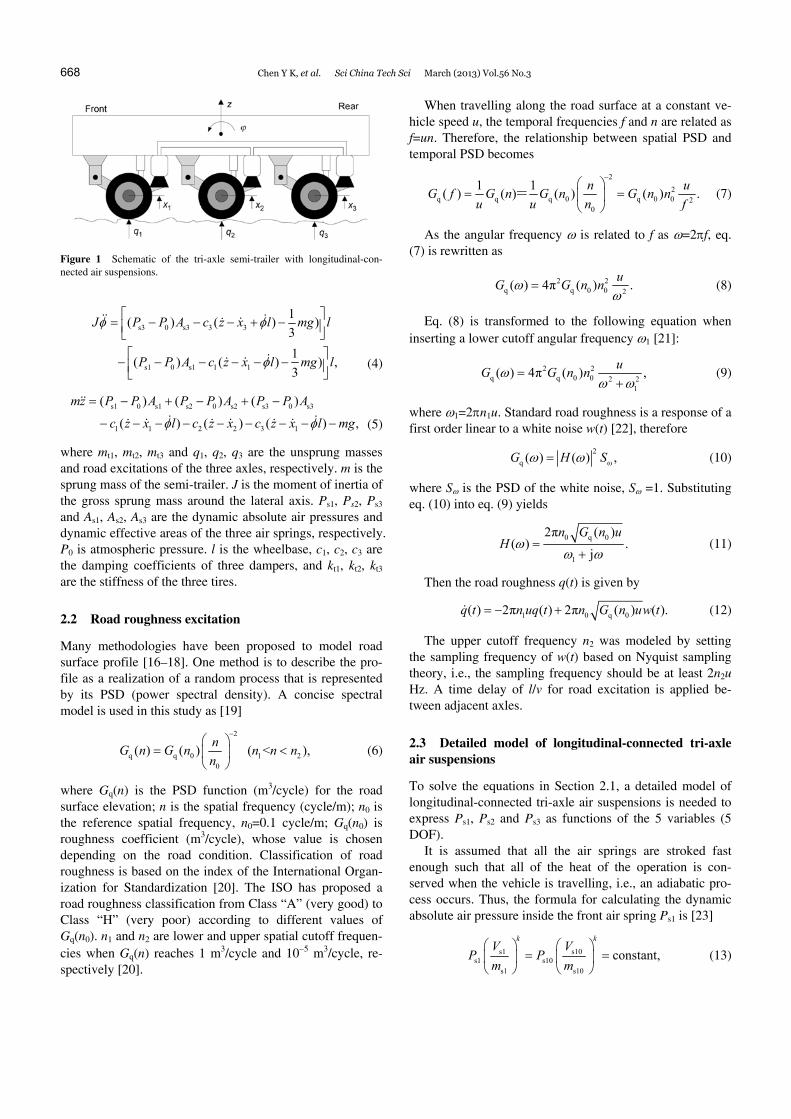
A basic half model representing a typical tri-axle semi- trailer with longitudinal-connected air suspensions in most western countries was employed, as shown in Figure 1. This model includes five degrees of freedom (DOF), which are vertical displacement of sprung mass and three unsprung masses, z, x1, x2, x3, as well as the pitch angle of the sprung mass .
The equations of motion of the semi-trailer are given by
t1 1 1 1 t1 1 1 s1 0 s1
1( ) ( ) ( ) ,
3m x q x k c z x l P P A mg (1)
t2 2 2 2 t2 2 2 s2 0 s2
1( ) ( ) ( ) ,
3m x q x k c z x P P A mg (2)
t3 3 3 3 t3 3 3 s3 0 s3
1( ) ( ) ( ) ,
3m x q x k c z x l P P A mg (3)
668 Chen Y K, et al. Sci China Tech Sci March (2013) Vol.56 No.3
Figure 1 Schematic of the tri-axle semi-trailer with longitudinal-con- nected air suspensions.
s3 0 s3 3 3
s1 0 s1 1 1
1( ) ( ) )
3
1 ( ) ( ) ) ,
3
J P P A c z x l mg l
P P A c z x l mg l
(4)
s1 0 s1 s2 0 s2 s3 0 s3
1 1 2 2 3 1
( ) ( ) ( )
( ) ( ) ( ) ,
mz P P A P P A P P A
c z x l c z x c z x l mg
(5)
where mt1, mt2, mt3 and q1, q2, q3 are the unsprung masses and road excitations of the three axles, respectively. m is the sprung mass of the semi-trailer. J is the moment of inertia of the gross sprung mass around the lateral axis. Ps1, Ps2, Ps3 and As1, As2, As3 are the dynamic absolute air pressures and dynamic effective areas of the three air springs, respectively. P0 is atmospheric pressure. l is the wheelbase, c1, c2, c3 are the damping coefficients of three dampers, and kt1, kt2, kt3 are the stiffness of the three tires.
2.2 Road roughness excitation
Many methodologies have been proposed to model road surface profile [16–18]. One method is to describe the pro-file as a realization of a random process that is represented by its PSD (power spectral density). A concise spectral model is used in this study as [19]
2
q q 0 1 20
( ) ( ) ( < ),n
G n G n n n nn
(6)
where Gq(n) is the PSD function (m3/cycle) for the road surface elevation; n is the spatial frequency (cycle/m); n0 is the reference spatial frequency, n0=0.1 cycle/m; Gq(n0) is roughness coefficient (m3/cycle), whose value is chosen depending on the road condition. Classification of road roughness is based on the index of the International Organ-ization for Standardization [20]. The ISO has proposed a road roughness classification from Class “A” (very good) to Class “H” (very poor) according to different values of Gq(n0). n1 and n2 are lower and upper spatial cutoff frequen-cies when Gq(n) reaches 1 m3/cycle and 105 m3/cycle, re-spectively [20].
When travelling along the road surface at a constant ve-hicle speed u, the temporal frequencies f and n are related as f=un. Therefore, the relationship between spatial PSD and temporal PSD becomes
2
2q q q 0 q 0 0 2
0
1 1( ) ( ) ( ) ( ) .
n uG f G n G n G n n
u u n f
= (7)
As the angular frequency is related to f as =2f, eq. (7) is rewritten as
2 2q q 0 0 2( ) 4π ( ) .
uG G n n
(8)
Eq. (8) is transformed to the following equation when inserting a lower cutoff angular frequency 1 [21]:
2 2q q 0 0 2 2
1
( ) 4π ( ) ,u
G G n n
(9)
where 1=2n1u. Standard road roughness is a response of a first order linear to a white noise w(t) [22], therefore
2
q ω( ) ( ) ,G H S (10)
where S is the PSD of the white noise, S =1. Substituting eq. (10) into eq. (9) yields
0 q 0
1
2π ( )( ) .
j
n G n uH
(11)
Then the road roughness q(t) is given by
1 0 q 0( ) 2π ( ) 2π ( ) ( ).q t n uq t n G n uw t (12)
The upper cutoff frequency n2 was modeled by setting the sampling frequency of w(t) based on Nyquist sampling theory, i.e., the sampling frequency should be at least 2n2u Hz. A time delay of l/v for road excitation is applied be-tween adjacent axles.
2.3 Detailed model of longitudinal-connected tri-axle air suspensions
To solve the equations in Section 2.1, a detailed model of longitudinal-connected tri-axle air suspensions is needed to express Ps1, Ps2 and Ps3 as functions of the 5 variables (5 DOF).
It is assumed that all the air springs are stroked fast enough such that all of the heat of the operation is con-served when the vehicle is travelling, i.e., an adiabatic pro-cess occurs. Thus, the formula for calculating the dynamic absolute air pressure inside the front air spring Ps1 is [23]
s1 s10s1 s10
s1 s10
constant,
k kV V
P Pm m
(13)

Chen Y K, et al. Sci China Tech Sci March (2013) Vol.56 No.3 669
where Vs1, Vs10 are the dynamic volume, and static volume of the front air spring; ms1, ms10 are the dynamic air mass, and static air mass inside the front air spring; and Ps10 is the static absolute air pressure inside the front air spring. The value of the above exponent k varies with the gas used and is a function of the specific heat of the gas. Air suspension operation is characterized by neither an isothermal nor an adiabatic process, but it is instead polytropic. In normal use, however, the process is much closer to adiabatic than iso-thermal. Accordingly the value of k is set to 1.4.
Ps1 is obtained from eq. (13) as follows:
1.4
s10 s1s1 s10
s1 s10
,V m
P PV m
(14)
where Vs1 is a function of the dynamic height of the front air spring, and is given by
s1 1 s1 s10( ) ,V z x l A V (15)
where As1 can also be approximated as a function of dy-namic height based on experimental data. ms1 depends on the air flow rate inside the front connector G1(kg/s) and is given by
s1 10 10
d . t
m m G t (16)
Since only small variations of temperature, air pressure and air spring volume exist when the semi-trailer is travel-ling, the air flow inside the front connector is considered to be an incompressible steady flow, which satisfies the fol-
lowing formula, according to Bernoulli’s equation [24]:
2 2s1 f1s1 f1
1 1,
2 2
P Pv v
(17)
where Pf1 is the dynamic absolute air pressure inside the front connector; vs1, vf1 are the air flow speeds (m/s) inside the front air spring and the front connector, respectively; and the air inside all the air springs, connectors and the air line is assumed to have a same constant density , when the semi-trailer is travelling; Af1 is the effective area of the front connector, which is equal to the actual area multiplied by a contraction coefficient 0.7 [25].
Note that As1 is related to Af1 because As1vs1=Af1vf1; in-serting vs1=Af1vf1/As1 into eq. (17) yields
2f1
f1 s1 f1 2s1
21 .
Av P P
A
(18)
vf1 is modified with a coefficient cd (0.8) to reflect the fric-tion of the connector. Therefore, the actual air flow speed inside the front connector f1v and G1 are given by
2f1
f1 d s1 f1 2s1
21 ,
Av c P P
A
(19)
2f1
1 f1 s1 d f1 s1 f1 2s1
sgn( ) 2 1 .A
G P P c A P PA
(20)
Substituting eqs. (15), (16) and (20) into eq. (14) yields
1.42f1
s10 10 f1 s1 d f1 s1 f1 20
s1
s1 s101 1 10 10
sgn( ) 2 1 d
.( )
t
s s s
AV m P P c A P P t
AP P
z x l A V m (21)
The dynamic absolute air pressures inside the three con-nectors and the longitudinal air line are assumed to have the same value Pf1 during travel. Thus, similar expressions for the air flow rates inside the middle and rear connectors (G2 and G3), as well as the dynamic absolute air pressures inside the middle and rear air springs (Ps2 and Ps3) are derived as follows:
2f2
2 f1 s2 d f2 s2 f1 2s2
sgn( ) 2 1 ,A
G P P c A P PA
(22)
2f3
3 f1 s3 d f3 s3 f1 2s3
sgn( ) 2 1 ,A
G P P c A P PA
(23)
1.42f2
s20 20 f1 s2 d f2 s2 f1 20
s2
s2 s202 s2 s20 s20
sgn( ) 2 1 d
,( )
t A
V m P P c A P P tA
P Pz x A V m
(24)
1.42f3
s30 30 f1 s3 d f3 s3 f1 20
s3
s3 s303 s3 s30 s30
sgn( ) 2 1 d
,( )
t A
V m P P c A P P tA
P Pz x l A V m
(25)
670 Chen Y K, et al. Sci China Tech Sci March (2013) Vol.56 No.3
where Ps20, Vs20, ms20 are the static absolute air pressure, static volume and static air mass of the middle air spring, Ps30, Vs30, ms30 are the corresponding parameters for the rear air spring; and Af2, Af3 are the areas of the middle and rear connectors, respectively. The three air springs have the same static absolute air pressure, static volume and static air mass, and the three connectors have the same inside diame-ter.
The air line is made of steel, so the volume of air line is constant. Based on eq. (14), the dynamic absolute air pres-sure inside the air line Pf1 is expressed as a function of the
static air mass of the air line m10, the static absolute air pressure inside the air line Ps10, and the gross air flow rate inside the air line G1:
1.4
l0 l0
f1 s10l0
d,
t
m G tP P
m (26)
l 1 2 3.G G G G (27)
Substituting eqs. (20), (22), (23) and (27) into eq. (26) yields:
21.4 f1
f1 l0 sl0 l0 f1 s1 d f1 s1 f1 f1 s2 d f220
s1
22f3f2
s2 f1 f1 s3 d f3 s3 f12 2s2 s3
sgn( ) 2 1 sgn( )
2 1 sgn( ) 2 1 d
t A
P m P m P P c A P P P P c AA
AAP P P P c A P P t
A A
1.4
.
(28)
Based on the equations in Sections 2.1, 2.2 and eqs. (21), (24), (25) and (28), an integrated model of road excitation and a fully-loaded tri-axle semi-trailer with longitudinal- connected air springs was developed with Matlab/Simulink. Parts of the key parameters are tabulated in Table 1. The expression of the effective area of each air spring as a func-tion of the dynamic height of corresponding air spring will be obtained based on test results in Section 3.2.
3 Load-sharing criteria and model validation
3.1 Load-sharing criteria
Criteria need to be chosen to evaluate the load-sharing of the semi-trailer. A metric often used to characterize the magnitude of dynamic forces of a wheel in an axle group is the DLC (dynamic load coefficient) [7], defined as
mean
( ) ,( )
iDLC iF i
(29)
where i denotes the standard deviation of wheel-force i, and Fmean(i) denotes the mean wheel-force of wheel i. Alt-hough DLC is usually referred to as a road-friendliness cri-terion and has been criticized for its mutual exclusivity with another load-sharing criterion LSC [1], it still has been widely used as one measure to differentiate suspension type from each other (e.g., steel vs. air) [13, 14, 26]
De Pont points out that LSC does not address dynamic load-sharing [8]. The DLSC was proposed as an alternative to LSC to account for the dynamic nature of wheel-forces and instantaneous load-sharing during travel, and is defined as [8]
2
1 1
1( ( ) ( ))
,
k k
i ij j
i
DLS j DLS jk
DLSCk
(30)
Table 1 Parameters of the tri-axle semi-trailer model
Parameter Value Dimension Description
As10 0.0783 m2 static effective area of each air spring
Vs10 0.0125 m3 static volume of each air spring
hs0 0.16 m static height of each air spring
df 0.0065 m inside diameter of each connector
ds 0.0065 m inside diameter of the longitudinal air line
Ps10 464288 Pa static absolute air pressure inside each air spring, each connector and the air line
P0 101325 Pa atmosphere pressure
m 8700 kg gross sprung mass of the semi-trailer
mt1 336 kg unsprung mass of each air spring
J 5684 kg m2 moment of inertia of the gross sprung mass around the lateral axis
kt1
1960000 N/m stiffness of dual tires on each hub
6.5417 kg/m3 density of air inside air springs, air con-nectors and the air line
crebound 288600 N s/m damping coefficient of each damper when dynamic height of respective suspension is increasing
cbump 184500 N s/m damping coefficient of each damper when dynamic height of respective suspension is decreasing
The dynamic load-sharing of wheel i, DLSi(j), is
1
( )( ) ,
( )
ii n
ii
nF jDLS j
F j
(31)
where n is the number of wheels on one side of an axle group; k is the number of terms in the dataset; and Fi(j) is the instantaneous force at wheel i.
In this study, the average DLSC of tires on the same side of the semi-trailer axle group was employed as a metric of load-sharing. The average DLC of tires on the same side of the semi-trailer axle group was used to evaluate road- friendliness as well as to analyze the relationship between load-sharing and road-friendliness.

Chen Y K, et al. Sci China Tech Sci March (2013) Vol.56 No.3 671
3.2 Model validation
The prototype of the tri-axle semi-trailer was tested on var-ious road sections for verification of the integrated model of vehicle and road excitation, as shown in Figure 2. The tests were part of a joint project between Queensland University of Technology (QUT) and the Department of Transport and Main Roads, Queensland (TMR) [27].
The setups of the tests are shown in Figure 2 [27]. Two types of longitudinal connections were used to connect the passive air suspensions on the same side: conventional (three 6.5 mm inside diameter connectors connecting a 6.5 mm inside diameter air line) and large (three 20 mm inside diameter connectors connecting a 50 mm inside diameter air line). Strain gauges (one per hub) were mounted on the neu-tral axis of each axle between the spring and the hub to rec-ord the shear force on the hubs, i.e., air spring force, and accelerometers were mounted as closely as possible to each hub and to the corresponding upper positions at the chassis to derive the height of each air spring. In addition, six air pressure transducers were employed to obtain the pressures inside the air springs, and a TRAMANCO P/L on-board CHEK-WAY telemetry system was used to record all the data.
The dynamic force of each tire was derived based on the shear force on the respective hub and the acceleration on the respective axle. The effective area of each air spring was obtained by dividing the respective shear force by the re-spective pressure inside the air spring, and the volume of each air spring was derived by multiplying the respective effective area by the respective spring height.
The tests comprised driving the semi-trailer over three typical urban road sections at speeds ranging from 60 km/h to 80 km/h; the sections of road varied from smooth with long undulations to rough with short undulations. The IRI (international roughness index) values of each road section were provided by TMR, and the IRI is related to Gq(n0) in
eq. (6) as 3q 0IRI 0.78 10 ( )G n [28]. Ten seconds of
dynamic signal data were recorded per road section, and this
Figure 2 Setups of the tests. (a) Prime mover and test semi-trailer with test load; (b) large longitudinal air line.
was done for both experimental cases (i.e., conventional longitudinal connection vs. large longitudinal connection) for the fully loaded condition.
Thus, the dynamic effective area of each air spring is ap-proximated as a function of the dynamic height of corre-sponding air spring y based on the experimental results, i.e.,
3 2
1 7.670500 2.866880 0.354226
0.093002.sA y y y
(32)
The effective area multiplied by the dynamic spring height yields
4 3 2
s1 7.670500 2.866880 0.354226
0.093002 .
V y y y
y
(33)
The comparisons between the test and simulation results in terms of load-sharing performance are listed in Table 2 and Figure 3.
As shown in Table 2 and Figure 3, a reasonable agree- ment exists between test and simulation results for both
Table 2 Tests and simulation results
Test/simulation number
Type of longitudinal connection
IRI Velocity (km/h)
Load-sharing criteria Test results Simulation
results Error ratio (compared with
the test results) (%)
1 conventional 6.213 60 DLC 0.0791 0.0733 7.3
DLSC 0.0505 0.0431 14.6
2 large 6.213 60 DLC 0.0699 0.0637 8.9
DLSC 0.0440 0.0357 18.8
3 conventional 7.602 70 DLC 0.1034 0.1001 3.2
DLSC 0.0851 0.0721 15.3
4 large 7.602 70 DLC 0.0983 0.0926 5.8
DLSC 0.0819 0.0645 21.2
5 conventional 8.880 80 DLC 0.1773 0.1679 5.3
DLSC 0.1506 0.1256 16.6
6 large 8.880 80 DLC 0.1775 0.1626 8.4
DLSC 0.1474 0.1256 14.8
672 Chen Y K, et al. Sci China Tech Sci March (2013) Vol.56 No.3
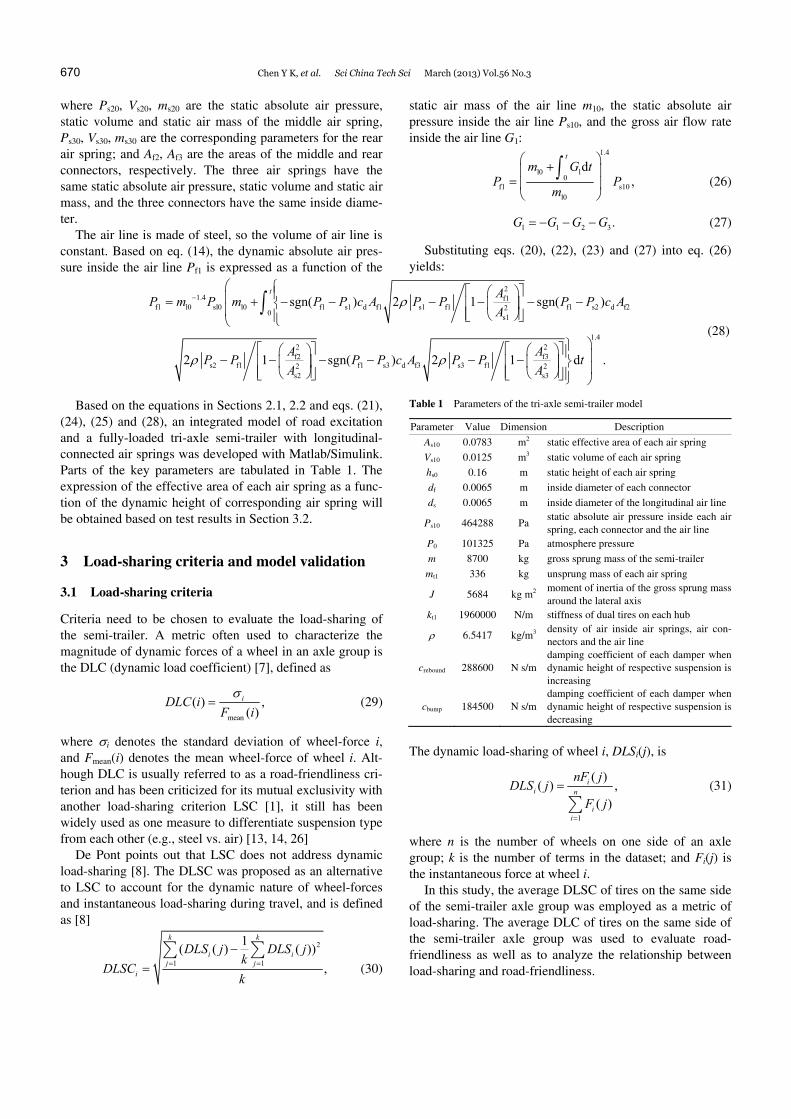
Figure 3 Comparison between test and simulation in terms of DLC and DLSC.
types of connection, under various road roughness condi-tions and vehicle speeds. The absolute error ratio of the DLC between each test and corresponding simulation is less than 10%; except for test/simulation 4, the absolute error ratios of the DLSC are less than 20%. It is also noted that all the simulation results are smaller than the corresponding test results, which is mainly due to wear of the suspensions of the test vehicle after a period of use and some simplifica-tions of the model of longitudinal-connected air suspen-sions.
It can be concluded from Table 2 that the simulation re-sults correlated well with the measurements. Therefore, the integrated model of vehicle and road excitation in this study can be employed for further analysis.
4 Effect of driving conditions on load-sharing
4.1 Effect of road roughness
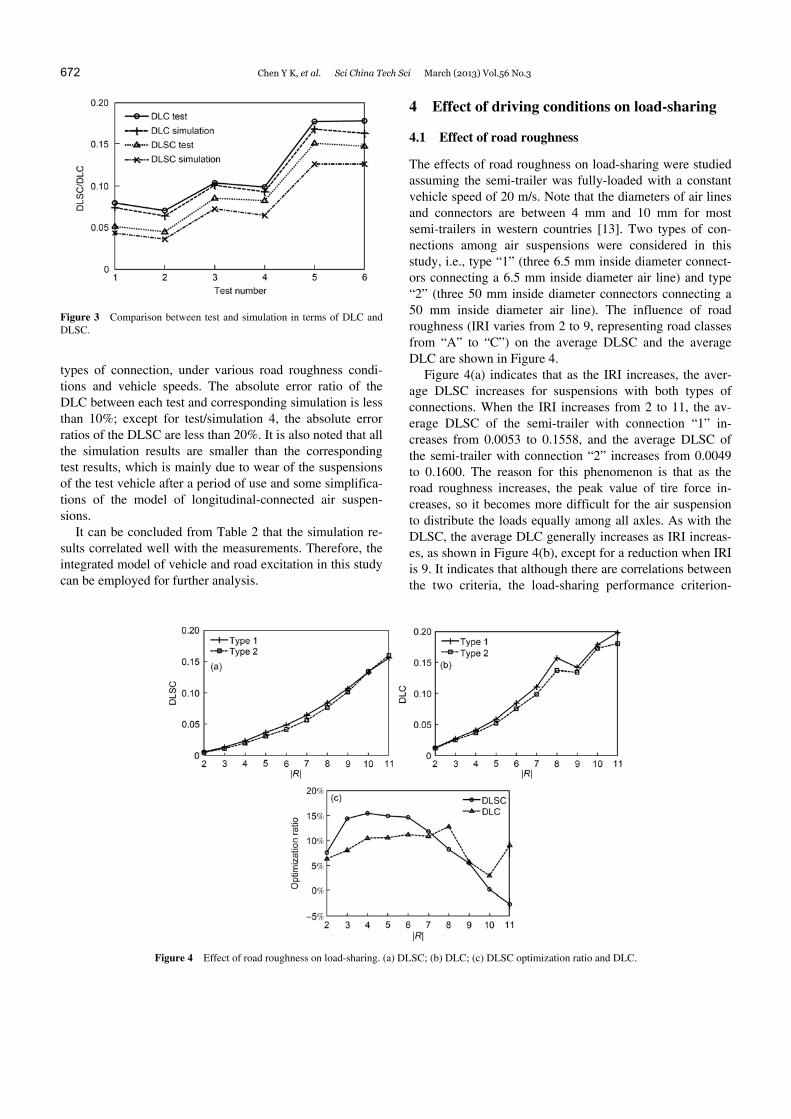
The effects of road roughness on load-sharing were studied assuming the semi-trailer was fully-loaded with a constant vehicle speed of 20 m/s. Note that the diameters of air lines and connectors are between 4 mm and 10 mm for most semi-trailers in western countries [13]. Two types of con-nections among air suspensions were considered in this study, i.e., type “1” (three 6.5 mm inside diameter connect-ors connecting a 6.5 mm inside diameter air line) and type “2” (three 50 mm inside diameter connectors connecting a 50 mm inside diameter air line). The influence of road roughness (IRI varies from 2 to 9, representing road classes from “A” to “C”) on the average DLSC and the average DLC are shown in Figure 4.
Figure 4(a) indicates that as the IRI increases, the aver-age DLSC increases for suspensions with both types of connections. When the IRI increases from 2 to 11, the av-erage DLSC of the semi-trailer with connection “1” in-creases from 0.0053 to 0.1558, and the average DLSC of the semi-trailer with connection “2” increases from 0.0049 to 0.1600. The reason for this phenomenon is that as the road roughness increases, the peak value of tire force in-creases, so it becomes more difficult for the air suspension to distribute the loads equally among all axles. As with the DLSC, the average DLC generally increases as IRI increas-es, as shown in Figure 4(b), except for a reduction when IRI is 9. It indicates that although there are correlations between the two criteria, the load-sharing performance criterion-
Figure 4 Effect of road roughness on load-sharing. (a) DLSC; (b) DLC; (c) DLSC optimization ratio and DLC.

Chen Y K, et al. Sci China Tech Sci March (2013) Vol.56 No.3 673
DLSC is not always in accordance with the road-friendli- ness performance criterion-DLC.
The effect of road roughness on optimization ratios for load-sharing is shown in Figure 4(c). It is evident that the optimization ratio for DLSC does not necessarily increase or decrease as the IRI increases. When the IRI increases from 2 to 4, and then to 11, the optimization ratio for DLSC increases from 7.5% to 15.4%, and then declines to 2.7%. This phenomenon is further complicated by the fact that the main frequencies of the road profile excitations change with the roughness. When the IRI is low, most undulations are relatively long and accordingly low frequency road excita-tions are prominent, and are even lower than the transmis-sion frequency of the air in connection “2”, so a low DLSC optimization ratio is observed at first. As the IRI increases, the lower cut-off frequency of road excitation increases and more excitations reach the air transmission frequency, thus DLSC optimization ratio climbs until it reaches a peak val-ue. As the dominant frequencies of road excitations contin-ue to increase, air transmission becomes not fast enough to distribute loads equally among axles under the high fre-quency road excitations, the optimization ratio thus begins to decline, and even reaches a negative value.
The DLC optimization ratio in Figure 4(c) fluctuates more than the DLSC optimization ratio, with the most ob-vious difference being that the DLC optimization ratio in-creases again when the IRI reaches 11.
4.2 Effect of vehicle speed
Vehicle speeds varying from 20 km/h to 90 km/h were con-sidered for simulations of the fully-loaded semi-trailer with
a standard “A” class road profile. The influence of vehicle speed on load-sharing is illus-
trated in Figure 5. As the speed increases from 20 km/h to 90 km/h, load-sharing of the semi-trailer with both types of air line deteriorates. The DLSC increases from 0.0040 to 0.0185 and 0.0028 to 0.0159 for the semi-trailer with con-nections “1” and “2”, respectively, while the DLC increases from 0.0049 to 0.0373 and 0.0038 to 0.0337 for the semi-trailer with connections “1” and “2”, respectively.
As shown in Figure 5(c), the DLSC optimization ratio fluctuates with vehicle speed. When vehicle speed increases from 20 km/h to 40 km/h, and then to 70 km/h, the DLSC optimization ratio decreases rapidly from 30.0% to 11.5% before it increases slowly to 15.2%. It then declines to 14.1% at 90 km/h. Similar changes in the DLC optimization ratio are found when speeds are less than 30 km/h, after that the DLC optimization ratio increases gradually.
A reasonable explanation for the variation patterns of DLSC and DLC optimization ratios is that the vehicle speed affects the product of the vehicle speed and the cutoff val-ues of the roughness spatial frequency, i.e., un1 and un2, which means a higher vehicle speed results in higher upper and lower cut-off frequencies, as well as a wider frequency band. These changes have a complex influence on the transmission response of air inside the air line and the dy-namic stiffness of each air spring.
4.3 Effect of vehicle load
The air springs of the semi-trailer are passive, which means the air springs do not deflate or inflate when the vehicle load changes. The load-sharing of the semi-trailer employ-
Figure 5 Effect of vehicle speed on load-sharing. (a) DLSC; (b) DLC; (c) DLSC optimization ratio and DLC.

674 Chen Y K, et al. Sci China Tech Sci March (2013) Vol.56 No.3
ing two connections with five different loads is plotted in Figure 6. The vehicle is driving at 20 m/s on a standard “B” class road.
Figures 6(a) and (b) show that as the gross sprung mass decreases from 8700 kg to 5100 kg, increases of up to 40.3%, 62.2% are found in DLSC of the semi-trailer with “A”, “B” connections respectively, and the DLC increases 21.4% and 33.4% for the semi-trailer with “A” and “B” connections, respectively. The variation pattern of DLC is consistent with previous studies [19, 29], and it is also con-cluded that as the vehicle load varies, the trend of DLSC follows the trend of DLC.
It is shown in Figure 6(c) that as the gross sprung mass decreases from 8700 kg to 5100 kg, the optimization ratio giving the relative advantage of connection “1” over con-nection “2” declines from 14.2% to 0.8%, and from 10.0% to 1.0%, for the DLSC and the DLC, respectively. In fact, as the vehicle load decreases, both hs10 and Vs10 increase, and the volume of air line/Vs10 decreases, such that the effect of employing the large air line and connectors becomes less prominent.
5 Effect of suspension parameters on load- sharing
5.1 Effect of static height and static pressure
The effect of the static height and static pressure of air springs for the fully-loaded semi-trailer are discussed in this section for a constant vehicle speed of 20 m/s and a stand-ard “B” class road profile. The influence of the static height (varying from 0.15 m to 0.22 m) and corresponding static
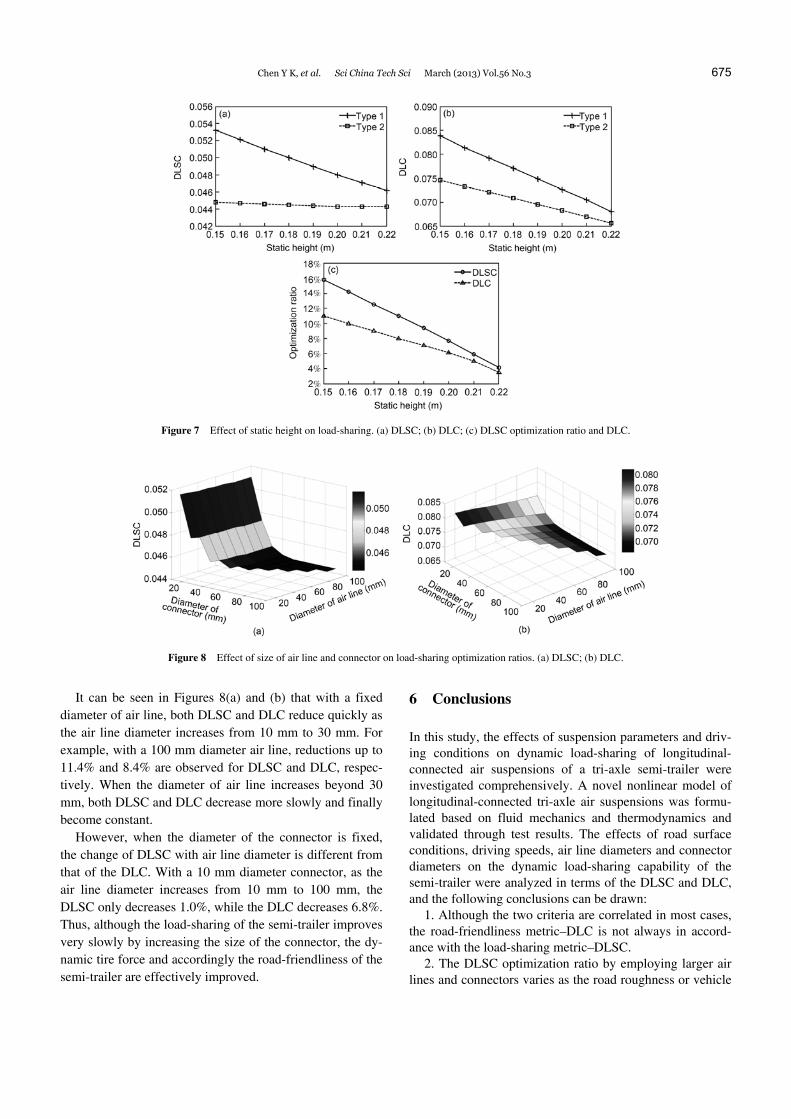
pressure (varying from 463431 Pa to 495204 Pa) on load-sharing are shown in Figure 7.
It can be seen in Figures 7(a) and (b) that both the DLSC and DLC reduce as the static height increases. In fact, when the static height increases, the absolute value of dAs10/dy increases and dVs10/dy decreases based on eqs. (32) and (33). These result in the reduction of dynamic stiffness of each air spring and accordingly the decline of DLSC and DLC.
Another finding is that compared with the DLC of the semi-trailer with connection “2”, which decreases at a rela-tively constant rate, the DLSC of the semi-trailer with con-nection “2” decreases more slowly and becomes constant when the static height exceeds 0.19 m. This indicates that when a large connection is employed, the load-sharing will not change much as the static height increases and the air pressure of air springs decreases, but the dynamic tire forces will continue to reduce.
The optimization ratios of both DLSC and DLSC decline as the static height increases, as shown in Figure 7(c). The reason for this phenomenon is similar to the explanation for the phenomenon seen in Figure 6(c). As the static height increases, Vs10 increases, and the volume of air line/Vs10 de-creases, and the effect of employing large air line and con-nectors becomes less prominent.
5.2 Effect of inside diameter of air line and connector
The effects of size of air line and connector (varying from 10 mm to 100 mm) on load-sharing are plotted in Figure 8, with a constant vehicle speed of 20 m/s for the fully-loaded semi-trailer and a standard “B” class road profile. The di-ameters of the connectors are always less than or equal to those of the air lines in all the simulations.
Figure 6 Effect of vehicle load. (a) DLSC; (b) DLC; (c) DLSC optimization ratio and DLC.
Chen Y K, et al. Sci China Tech Sci March (2013) Vol.56 No.3 675
Figure 7 Effect of static height on load-sharing. (a) DLSC; (b) DLC; (c) DLSC optimization ratio and DLC.
Figure 8 Effect of size of air line and connector on load-sharing optimization ratios. (a) DLSC; (b) DLC.
It can be seen in Figures 8(a) and (b) that with a fixed diameter of air line, both DLSC and DLC reduce quickly as the air line diameter increases from 10 mm to 30 mm. For example, with a 100 mm diameter air line, reductions up to 11.4% and 8.4% are observed for DLSC and DLC, respec-tively. When the diameter of air line increases beyond 30 mm, both DLSC and DLC decrease more slowly and finally become constant.
However, when the diameter of the connector is fixed, the change of DLSC with air line diameter is different from that of the DLC. With a 10 mm diameter connector, as the air line diameter increases from 10 mm to 100 mm, the DLSC only decreases 1.0%, while the DLC decreases 6.8%. Thus, although the load-sharing of the semi-trailer improves very slowly by increasing the size of the connector, the dy-namic tire force and accordingly the road-friendliness of the semi-trailer are effectively improved.
6 Conclusions
In this study, the effects of suspension parameters and driv-ing conditions on dynamic load-sharing of longitudinal- connected air suspensions of a tri-axle semi-trailer were investigated comprehensively. A novel nonlinear model of longitudinal-connected tri-axle air suspensions was formu-lated based on fluid mechanics and thermodynamics and validated through test results. The effects of road surface conditions, driving speeds, air line diameters and connector diameters on the dynamic load-sharing capability of the semi-trailer were analyzed in terms of the DLSC and DLC, and the following conclusions can be drawn:
1. Although the two criteria are correlated in most cases, the road-friendliness metric–DLC is not always in accord-ance with the load-sharing metric–DLSC.
2. The DLSC optimization ratio by employing larger air lines and connectors varies as the road roughness or vehicle
676 Chen Y K, et al. Sci China Tech Sci March (2013) Vol.56 No.3
speed changes. The lower and upper cut-off frequencies of road excitation change with the IRI and vehicle speed, which has a complicated impact on air transmission be-tween air bags and thus the damping of the each air bag.
3. When the vehicle load is reduced, or the static pressure is increased, the DLSC optimization ratio declines. The reason for this phenomenon is that the static height increas-es with lighter vehicle load or less static pressure, Vs10 in-creases, and the volume of air line/Vs10 decreases. Thus, the effect of employing a large air line and connectors becomes less prominent.
4. If the diameter of the air line is always larger than that of the connector, then the influence of the diameter of air line is more significant than that of the connector.
Based on the proposed model, investigation into the mechanism of load-sharing based on the nonlinear system dynamics and the control methods of the tri-axle air suspen-sion system with longitudinal air line will be undertaken in the future.
This work was supported by the National Natural Science Foundation of China (Grant Nos. 51078087, 51178158, and 51075112), the Natural Science Foundation of Anhui Province (Grant No. 11040606Q39), and the Fundamental Research Funds for the Central Universities (Grant Nos. 2012HGQC0015 and 2011HGBZ0945). The assistance of Dr Lloyd Davis from the Queensland Department of Transport and Main Roads is also greatly acknowledged.
1 Davis L E, Bunker M B. Load-sharing in heavy vehicle suspensions– New metrics for old. Queensland University of Technology, QUT Digital Repository, Brisbane, Australia, 2008
2 Potter T E C, Cebon D, Cole D J, et al. Road damage due to dynamic tyre forces, measured on a public road. Int J Heavy Veh Syst, 1996, 3: 346–362
3 Cebon D. Assessment of the dynamic wheel forces generated by heavy road vehicles. Symposium on Heavy Vehicle Suspension Characteristics, Canberra, Australia, 1987. 199–212
4 Cantieni R, Krebs W, Heywood R. Dynamic interaction between ve-hicles and infrastructure experiment (divine), Technical Report No. DSTI/DOT/RTR/IR6(98)1/FINAL. Organisation for Economic Co- operation and Development (OECD), Paris, France, 1998
5 Department of Transport and Regional Services, Australia. Vehicle Standards Bulletin VSB 11 Certification of road-friendly suspension systems. Australian Department of Infrastructure, Transport, Region-al Development and Local Government, Canberra, Australia, 2004
6 Costanzi M, Cebon D. An investigation of the effects of lorry sus-pension performance on road maintenance costs. P I Mech Eng C-J Mec, 2007, 221: 1265–1277
7 Sweatman P F. A study of dynamic wheel forces in axle group sus-pensions of heavy vehicles. Australian Road Research Board, Special report. Report No. SR27. Vermont South, Victoria, Australia
8 de Pont J. J. Assessing heavy vehicle suspensions for road wear. Re-
search report No. 95. Transfund New Zealand, Wellington, New Zealand, 1997
9 Potter T E C, Cebon D, Collop A C, et al. Road-damaging potential of measured dynamic tyre forces in mixed traffic. P I Mech Eng D-J Aut, 1996, 210: 215–225
10 OECD Scientific Expert Group. Dynamic loading of pavements: Road transport research. Organization for Economic, Paris, France, 1992
11 Estill & Associates Pty Ltd. Operational stability and performance of air suspension on various vehicle configurations. Australia: Depart-ment of Transport and Works, South Perth, WA, Australia, 2000
12 Roaduser Systems Pty Ltd. Stability and on-road performance of multi-combination vehicles with air suspension systems. Australia: National Road Transport Commission, Canberra, Australia, 2005
13 Davis L E. Heavy vehicle suspensions-testing and analysis. Disserta-tion for the Doctoral Degree. Brisbane: Queensland University of Technology, 2010
14 Davis L E, Bunker J M. Altering heavy vehicle air suspension dy-namic forces by modifying air lines. Int J Heavy Veh Syst, 2011, 18: 1–17
15 Roebuck R L, Cebon D, Dale S G. Optimal control of a semi-active tri-axle lorry suspension. Veh Syst D, 2006, 44: 892–903
16 Zhao W Z, Wang C Y. Mixed H2/H∞ road feel control of EPS based on genetic algorithm. Sci China Tech Sci, 2012, 55: 72–80
17 Lu Y J, Yang S P, Li S H. Research on dynamics of a class of heavy vehicle-tire-road coupling system. Sci China Tech Sci, 2011, 54: 2054–2063
18 Romero J A, Lozano A. Effect of truck suspension and tire properties on pavement damage spatial distribution.” Transport Res Rec, No. 1949, Transportation Research Board of the National Academies, Washington, D.C., 2006, 148–154
19 Shi X M, Cai C S. Simulation of dynamic effects of vehicles on pavement using a 3d interaction model. J Transp Eng-ASCE, 2009, 135: 736–744
20 ISO. Mechanical vibration—road surface profiles-reporting of meas-ured data. ISO 8068: 1995 (E), Geneva, 1995
21 Chen J P, Chen W W, Zhu H, et al. Modeling and simulation on sto-chastic road surface irregularity based on Matlab/Simulink. Trans Chin S Agr Mach, 2010, 41: 11–15
22 Prabakar R S, Sujatha C, Narayanan S. Optimal semi-active preview control response of a half car vehicle model with magnetorheological damper. J Sound Vib, 2009, 326: 400–420
23 Wang J S, Zhu S H. Linearized model for dynamic stiffness of air spring with auxiliary chamber. J Vib Shock, 2009, 28: 72–76
24 White F M. Fluid Mechanics. Columbus: McGraw-Hill, 2011 25 Chen S M. Hydraulic and Pneumatic Transmission. Beijing: China
Machine Press, 2011 26 Davis L E, Bunker J M. Suspension Testing of 3 Heavy Vehicles-
Dynamic Wheel Force Analysis–Report. Australia: Department of Main Roads-Queensland Government, Brisbane, Australia, 2009
27 Davis L E, Bunker J M. Heavy vehicle suspension testing and analy-sis-dynamic load sharing. Australia: Department of Main Roads- Queensland Government, Brisbane, Australia, 2009
28 Chen H X, He Z Y. A study on simulation of road roughness based on international roughness index. Highway, 2008, 11: 155–160
29 Lu Y J, Yang S P, Li S H, et al. Numerical and experimental investi-gation on stochastic dynamic load of a heavy duty vehicle. Appl Math M, 2010, 34: 2698–2710

![Lu Sun, Yong Zhang, Yu He, Hongwei Wang and Yikai Su ...otip.sjtu.edu.cn/publication/Journal/2020-NanoP-LuSun-Subwaveleng… · the Rytov’s formulas [20]: ⊥ =+ − =+ − 22 2](https://img.pdfslide.us/doc/110x75/6062f4159e52cc3fcc6ea897/lu-sun-yong-zhang-yu-he-hongwei-wang-and-yikai-su-otipsjtueducnpublicationjournal2020-nanop-lusun-subwaveleng.jpg)