Embed Size (px)
Citation preview
Article
Chemogenomics and orthology-based design ofantibiotic combination therapiesSriram Chandrasekaran1,2,3,*, Melike Cokol-Cakmak4, Nil Sahin4, Kaan Yilancioglu5, Hilal Kazan6,
James J Collins2,3,7,8,9 & Murat Cokol4,10,11,**
Abstract
Combination antibiotic therapies are being increasingly used inthe clinic to enhance potency and counter drug resistance.However, the large search space of candidate drugs and dosageregimes makes the identification of effective combinations highlychallenging. Here, we present a computational approach calledINDIGO, which uses chemogenomics data to predict antibioticcombinations that interact synergistically or antagonistically ininhibiting bacterial growth. INDIGO quantifies the influence ofindividual chemical–genetic interactions on synergy and antago-nism and significantly outperforms existing approaches based onexperimental evaluation of novel predictions in Escherichia coli.Our analysis revealed a core set of genes and pathways (e.g.central metabolism) that are predictive of antibiotic interactions.By identifying the interactions that are associated with ortholo-gous genes, we successfully estimated drug-interaction outcomesin the bacterial pathogens Mycobacterium tuberculosis and Staphy-lococcus aureus, using the E. coli INDIGO model. INDIGO thusenables the discovery of effective combination therapies in less-studied pathogens by leveraging chemogenomics data in modelorganisms.
Keywords chemogenomics; combination therapy; drug resistance;
Mycobacterium tuberculosis; Staphylococcus aureus
Subject Categories Genome-Scale & Integrative Biology; Methods &
Resources; Pharmacology & Drug Discovery
DOI 10.15252/msb.20156777 | Received 31 December 2015 | Revised 20 April
2016 | Accepted 21 April 2016
Mol Syst Biol. (2016) 12: 872
Introduction
Antimicrobial combination therapy is utilized clinically to reduce
treatment time, to prevent the emergence of resistance, and to
expand the spectrum of pathogens targeted (Dancey & Chen, 2006;
Hopkins, 2008; Fischbach & Walsh, 2009; Bush et al, 2011;
Worthington & Melander, 2013). However, individual drugs in
combination can enhance or interfere with other drugs’ actions lead-
ing to unexpected effects. Therefore, mapping antibiotic interactions
is essential for designing effective combination therapies (Dancey &
Chen, 2006; Nichols et al, 2011; Roemer & Boone, 2013;
Worthington & Melander, 2013). Systematic screens for drug
interactions require testing various ratios of the component drugs
(Hopkins, 2008), and the experimental identification of combina-
tions with robust effects across a broad dose range is resource- and
time-intensive, even for a small number of compounds (Zimmermann
et al, 2007). The large space of candidate drugs, their dosage and
chemical properties, and the nature of the target pathogen all affect
the choice of the drug combination, making it a challenging and
complex problem (Dancey & Chen, 2006; Hopkins, 2008). Because
the number of possible drug combinations is astronomically high,
new in silico methods are crucial for determining the most promis-
ing combinations (Hopkins, 2008; Lehar et al, 2008). This mandates
the integration of genomic and chemical data using a computational
framework. An integrated computational platform for predicting
antibiotic interactions could pave the way for the rapid assessment
of novel antimicrobial combinations before entry into clinical usage.
Here, we present an approach entitled INferring Drug Interactions
using chemo-Genomics and Orthology (INDIGO), which predicts
antibiotic combinations that interact synergistically or antagonisti-
cally in inhibiting bacterial growth based on the chemogenomic pro-
files of the individual antibiotics. Chemogenomic profiling measures
fitness of gene-knockout strains treated with bioactive compounds
1 Harvard Society of Fellows, Faculty of Arts and Sciences, Harvard University, Cambridge, MA, USA2 Broad Institute of MIT and Harvard, Cambridge, MA, USA3 Wyss Institute for Biologically Inspired Engineering, Harvard University, Cambridge, MA, USA4 Faculty of Engineering and Natural Sciences, Sabanci University, Istanbul, Turkey5 Department of Molecular Biology and Genetics, Uskudar University, Istanbul, Turkey6 Department of Computer Engineering, Antalya International University, Antalya, Turkey7 Department of Biological Engineering, Institute for Medical Engineering & Science, Massachusetts Institute of Technology, Cambridge, MA, USA8 Synthetic Biology Center, Massachusetts Institute of Technology, Cambridge, MA, USA9 Harvard-MIT Program in Health Sciences and Technology, Cambridge, MA, USA10 Department of Molecular Biology and Microbiology, Tufts University School of Medicine, Boston, MA, USA11 Laboratory of Systems Pharmacology, Harvard Medical School, Boston, MA, USA
*Corresponding author. Tel: +1 617 496 0048; E-mail: [email protected]**Corresponding author. Tel: +1 617 432 6164; E-mail: [email protected]
ª 2016 The Authors. Published under the terms of the CC BY 4.0 license Molecular Systems Biology 12: 872 | 2016 1
Published online: May 24, 2016
and provides unbiased insights into the mechanism of action of
drugs (Bredel & Jacoby, 2004; Lehar et al, 2008; Ho et al, 2009;
Nichols et al, 2011; Lee et al, 2014). We developed and utilized
INDIGO to analyze a large compendium of publicly available
chemogenomic data in Escherichia coli (Nichols et al, 2011) to iden-
tify predictive genetic features of antibiotic synergy and antagonism,
and subsequently infer novel drug interactions. By finding orthologs
of genes identified by INDIGO to be predictive of drug interactions
in E. coli, we successfully predicted drug synergy and antagonism in
the bacterial pathogens Mycobacterium tuberculosis and Staphylococ-
cus aureus. These two pathogens cause a significant mortality
worldwide and are frequently treated clinically using combinations
of antibiotics (Liu et al, 2011; Ramon-Garcia et al, 2011). INDIGO
greatly expands the capability of current drug-interaction prediction
approaches by estimating the interaction outcomes in pathogens
using chemogenomic data from model organisms.
Results
Experimental measurement of 105 interactions among 15 drugsas training data
To train INDIGO, 15 compounds with available chemogenomic
profiles were selected (Nichols et al, 2011) (Table 1). These
compounds, consisting of 14 antibiotics and a stress agent (hence-
forth referred to as drugs), covered a variety of classes including cell
wall, transcription, translation, and DNA metabolism inhibitors.
The interaction outcome of all pairwise combinations of these 15
drugs (105 pairs) was measured in duplicate. For each drug pair,
individual drugs were combined in a 4 × 4 2-dimensional checker-
board assay, with each drug’s dose linearly increasing from 0 to
near minimum inhibitory concentration (MIC) in each axis (Fig 1;
Table 1; Appendix Fig S1; Materials and Methods).
The Loewe additivity model was used to quantify the drug inter-
actions (Loewe, 1953). The Loewe additivity model defines a drug
as additive or noninteracting with itself. Antagonistic and synergis-
tic interactions are inferred based on the deviations from additivity.
Synergy implies that the same amount of growth inhibition is
achieved with a lower dose when both drugs are combined. For the
Loewe model, we used as input the growth of the bacteria at dif-
ferent dose combinations of the individual drugs to generate a quan-
titative interaction score (a score) between the drug pair, with low
scores (a < �0.5) corresponding to synergy and high scores (a > 1)
corresponding to antagonism (Fig 1; Dataset EV1; Materials and
Methods). This sensitive framework approximately corresponds to
a bliss interaction score of �0.3 for a < �0.5 and +0.3 for a > 1
and provides a robust measure of drug interaction across doses
(Appendix Fig S2). The measured interaction scores had strong
correlation between the two biological replicates (rank correlation
(R) = 0.81, P-value = 10�26) and were consistent with existing inter-
action data (Appendix Fig S3; Appendix Supplementary Methods).
Overall, among the 105 drug combinations, antagonistic drug inter-
actions were more common than synergistic interactions. Further,
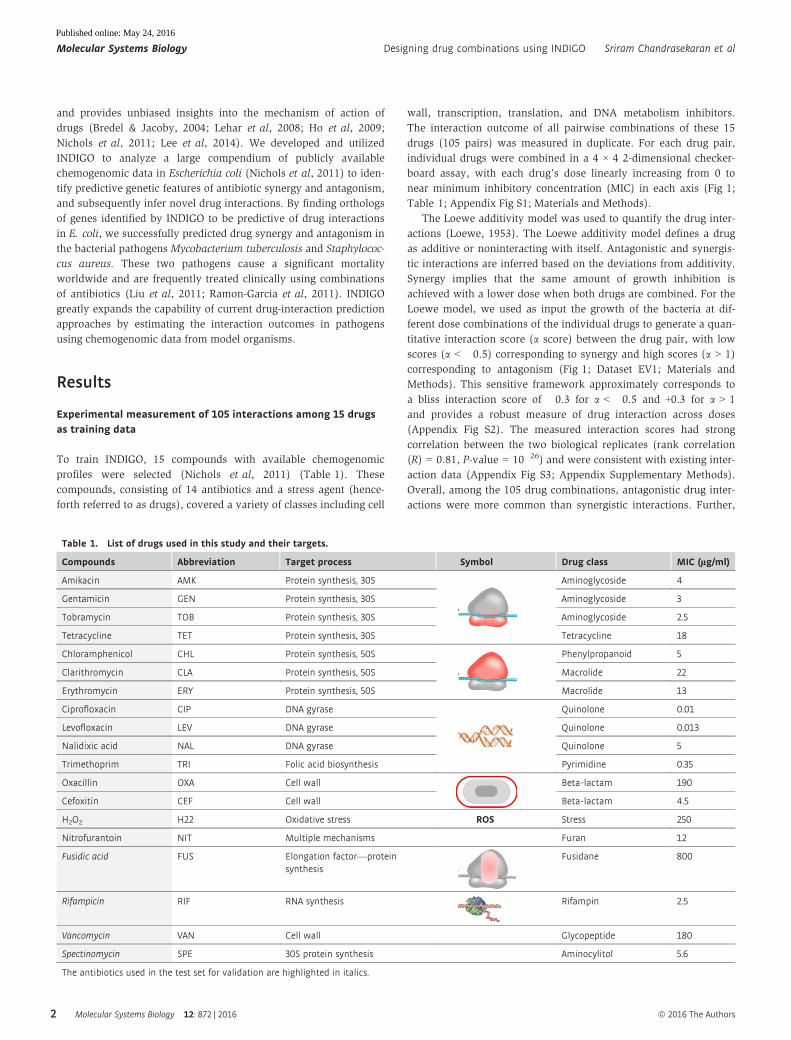
Table 1. List of drugs used in this study and their targets.
Compounds Abbreviation Target process Symbol Drug class MIC (lg/ml)
Amikacin AMK Protein synthesis, 30S Aminoglycoside 4
Gentamicin GEN Protein synthesis, 30S Aminoglycoside 3
Tobramycin TOB Protein synthesis, 30S Aminoglycoside 2.5
Tetracycline TET Protein synthesis, 30S Tetracycline 18
Chloramphenicol CHL Protein synthesis, 50S Phenylpropanoid 5
Clarithromycin CLA Protein synthesis, 50S Macrolide 22
Erythromycin ERY Protein synthesis, 50S Macrolide 13
Ciprofloxacin CIP DNA gyrase Quinolone 0.01
Levofloxacin LEV DNA gyrase Quinolone 0.013
Nalidixic acid NAL DNA gyrase Quinolone 5
Trimethoprim TRI Folic acid biosynthesis Pyrimidine 0.35
Oxacillin OXA Cell wall Beta-lactam 190
Cefoxitin CEF Cell wall Beta-lactam 4.5
H2O2 H22 Oxidative stress ROS Stress 250
Nitrofurantoin NIT Multiple mechanisms Furan 12
Fusidic acid FUS Elongation factor—proteinsynthesis
Fusidane 800
Rifampicin RIF RNA synthesis Rifampin 2.5
Vancomycin VAN Cell wall Glycopeptide 180
Spectinomycin SPE 30S protein synthesis Aminocylitol 5.6
The antibiotics used in the test set for validation are highlighted in italics.
Molecular Systems Biology 12: 872 | 2016 ª 2016 The Authors
Molecular Systems Biology Designing drug combinations using INDIGO Sriram Chandrasekaran et al
2
Published online: May 24, 2016
unsupervised clustering of interactions grouped the drugs based on
their mechanism of action, as well as their bacteriostatic and bacte-
ricidal properties, consistent with previous studies (Yeh et al, 2006;
Ocampo et al, 2014). In sum, these observations support the accu-
racy and robustness of the drug-interaction data used for training
INDIGO.
Framework for predicting drug–drug interactions usingchemogenomic profiles
The training data (input) for INDIGO consists of (i) chemogenomic
profiles of individual drugs of interest and (ii) experimental inter-
action scores for the combinations of drugs. A chemogenomic pro-
file of a drug is an array of fitness scores for gene-deletion strains
treated with the drug of interest compared to the wild-type strain.
We transformed the chemogenomic profile of a drug into a binary
sensitivity profile by identifying the deletion strains that are signifi-
cantly sensitive to a drug (Materials and Methods). The sensitivity
profiles of individual drugs in a drug combination are combined
by INDIGO using Boolean operations to create a joint profile. In
this framework, the union (sigma score) and intersection (delta
score) operations capture similarity and uniqueness in the mecha-
nism of action of the individual drugs. A machine learning
algorithm called random forests is then used to build a predictive
model that links the interaction outcome of drug combinations to
the joint chemogenomic profile of the drug pair (Materials and
Methods; Fig 2). The random forest algorithm builds an ensemble
of decision trees using the training dataset and outputs the mean
prediction of the individual trees; it also identifies genes in the
chemogenomics data that are most predictive of drug interactions.
INDIGO learns the mechanism of drug interactions from the
chemogenomics data in an unbiased fashion by using the random
forest algorithm.
INDIGO thus takes a systems approach to predict drug interac-
tions; the approach quantifies the contribution of individual genes
with a chemical–genetic interaction on the overall drug-interaction
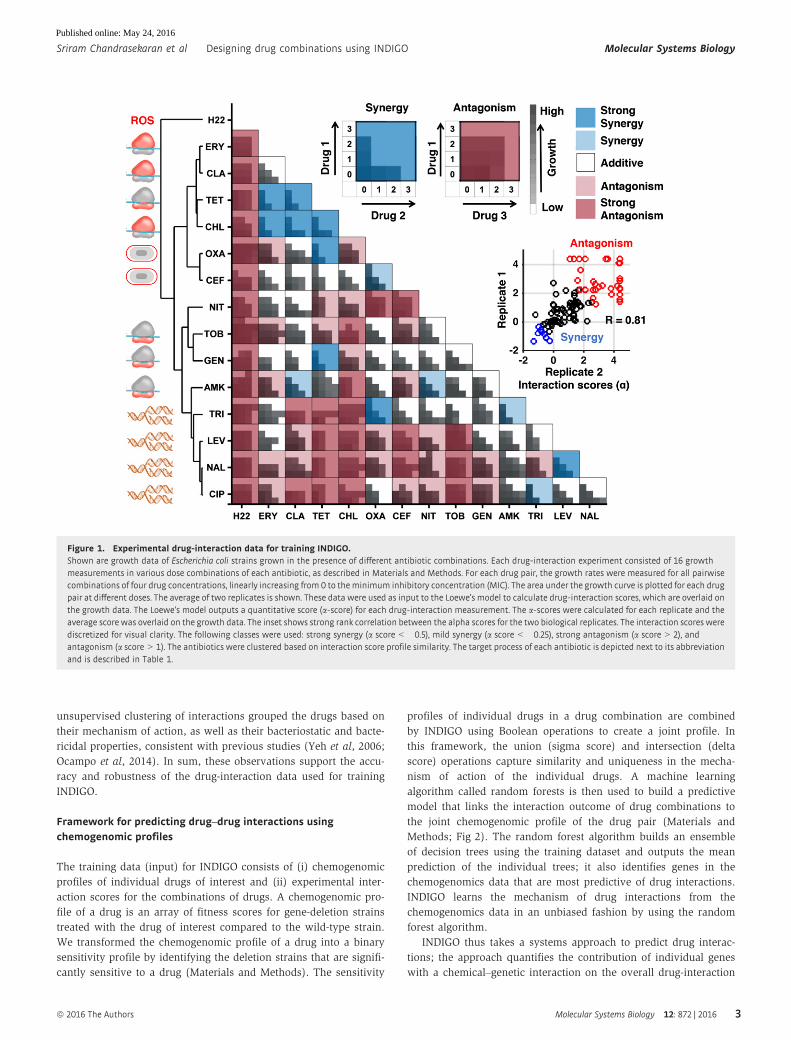
Figure 1. Experimental drug-interaction data for training INDIGO.Shown are growth data of Escherichia coli strains grown in the presence of different antibiotic combinations. Each drug-interaction experiment consisted of 16 growthmeasurements in various dose combinations of each antibiotic, as described in Materials and Methods. For each drug pair, the growth rates were measured for all pairwisecombinations of four drug concentrations, linearly increasing from 0 to the minimum inhibitory concentration (MIC). The area under the growth curve is plotted for each drugpair at different doses. The average of two replicates is shown. These data were used as input to the Loewe’s model to calculate drug-interaction scores, which are overlaid onthe growth data. The Loewe’s model outputs a quantitative score (a-score) for each drug-interaction measurement. The a-scores were calculated for each replicate and theaverage score was overlaid on the growth data. The inset shows strong rank correlation between the alpha scores for the two biological replicates. The interaction scores werediscretized for visual clarity. The following classes were used: strong synergy (a score < �0.5), mild synergy (a score < �0.25), strong antagonism (a score > 2), andantagonism (a score > 1). The antibiotics were clustered based on interaction score profile similarity. The target process of each antibiotic is depicted next to its abbreviationand is described in Table 1.
ª 2016 The Authors Molecular Systems Biology 12: 872 | 2016
Sriram Chandrasekaran et al Designing drug combinations using INDIGO Molecular Systems Biology
3
Published online: May 24, 2016
outcome (synergy or antagonism). Importantly, the contribution of
each gene in INDIGO is contextual; that is, it depends on the state of
other genes. We trained INDIGO using our experimental pairwise
drug–drug interaction data along with chemogenomic profiles for
these 15 drugs from Nichols et al (Nichols et al, 2011), which
screened 73 drugs and 53 stress agents against 3,979 nonessential
gene-deletion strains in E. coli. This trained INDIGO model can
predict the pairwise interactions of any two drugs with known
chemogenomics profiles.
Experimental validation of novel predictions for66 drug–drug interactions
In order to assess the predictive power of INDIGO, a test set of four
additional antibiotics whose chemogenomic profiles were reported
in Nichols et al were chosen. These antibiotics had distinct chemi-
cal properties and mechanisms of action compared to the antibi-
otics used in the training set. Specifically, we tested rifampicin
(which targets RNA polymerase), vancomycin (a glycopeptide that
targets the cell wall), fusidic acid (which targets the elongation
factor in protein synthesis), and spectinomycin (an aminocylitol
drug that targets the 30S ribosome subunit similar to aminogly-
coside antibiotics). Using INDIGO, interaction scores were predicted
for 66 drug pairs involving 15 drugs in the training set and these
four new antibiotics. We then experimentally measured interaction
scores for these pairs using the same experimental setup as the
training set.
Among the top ten synergistic and antagonistic predictions by
INDIGO, six synergistic and seven antagonistic predictions were
experimentally validated, respectively (Fig 3B; Appendix Table S1).
INDIGO correctly predicted two synergistic interactions comprising
antibiotics that were both not in the training set (fusidic acid–
rifampicin, fusidic acid–vancomycin). Figure 3C demonstrates the
significant correlation between the experimental and predicted drug-
interaction scores for all 66 drug pairs in the test set (R = 0.52,
P-value = 10�6). These results show that INDIGO can successfully
predict interactions among drugs with known chemogenomic
profiles.
To benchmark INDIGO, the predictions were compared to a
chemogenomics-based approach used to infer antifungal interac-
tions, which predicted synergy based on chemogenomic profile
similarity of the individual drugs (Jansen et al, 2009; Materials
and Methods). In this approach, the similarity of two drugs was
evaluated by measuring the Pearson’s correlation between the
individual drugs’ chemogenomic profile, or through the total over-
lap between the genes present in the chemogenomic profile of
individual drugs. These approaches performed poorly in predicting
experimental interaction scores compared to INDIGO (R = 0.14,
P-value = 0.25, Fig 3D–F; Appendix Fig S4). INDIGO also signifi-
cantly outperformed the O2M algorithm (Brown et al, 2014), which is
an extension of the Jansen et al’s overlap-based approach (Appendix
Fig S5).
Similarity and overlap-based approaches are less effective in
predicting interaction outcomes for new classes of drugs and lack
a model for antagonism. Thus, taking into account the identity of
the individual genes in the chemogenomic profile and accounting
for both similarity and dissimilarity increases the ability to predict
drug interactions by INDIGO. Our data show that drugs with
similar targets and chemogenomic profiles can have both syner-
gistic and antagonistic outcomes. For example, combinations of
tobramycin–spectinomycin, tobramycin–gentamicin, and fusidic acid–
clarithromycin share similar chemogenomic profiles and target
processes, yet have antagonistic, neutral, and synergistic outcomes,
respectively (Fig EV1).
Importantly, INDIGO quantitatively predicts drug interactions
and its predictive ability was not influenced by any specific thresh-
old for inferring synergy or antagonism (Appendix Fig S6), it was
robust to the choice of methods used to evaluate predictions (Mate-
rials and Methods; Appendix Fig S4), and its predictions were more
likely to be synergistic than a random screen (P < 10�19; t-test;
Appendix Fig S7). Further, the results were robust to the removal of
the outlier compound hydrogen peroxide that had promiscuous
antagonistic interactions (Appendix Fig S8), and led to similar accu-
racy based on cross-validation analysis (Appendix Figs S9, S10, S11
and S12). Cross-validation analysis also revealed that predictions
were consistently accurate across most drugs and identified
Figure 2. Overview of the INDIGO approach to study drug interactions.INDIGO takes in as input drug-interaction datameasuring synergistic and antagonistic interaction outcomes, and a compendium of chemogenomic profiles that identify genedeletions that enhance sensitivity to a compound of interest. INDIGO subsequently integrates the individual drug chemogenomic profiles using Boolean operations (sigmaand delta scores) that capture similarity and dissimilarity (only sigma scores are shown for simplicity). INDIGO identifies top genomic predictors of drug synergy andantagonism using a random forest algorithm. The inferred model is then used to predict interaction outcomes for combinations of drugs with known chemogenomic profiles.
Molecular Systems Biology 12: 872 | 2016 ª 2016 The Authors
Molecular Systems Biology Designing drug combinations using INDIGO Sriram Chandrasekaran et al
4
Published online: May 24, 2016
hydrogen peroxide as leading to the largest errors in predictions
(Appendix Figs S8 and S9). This suggests that the chemogenomic
profile of hydrogen peroxide may not accurately reflect its mecha-
nism of interaction. In sum, INDIGO successfully predicts novel
drug interactions as assessed by several metrics.
Global interaction landscape of compound combinations
To further strengthen our model, INDIGO was re-trained on the
entire experimental drug–drug interaction dataset, including
the test-set interactions (171 drug pairs). This model was then
applied to the entire compendium of 73 drugs and 53 stress-agent
chemogenomic profiles from Nichols et al. By mining this dataset
(2,628 drug–drug interactions and 3,869 drug–stress agent interac-
tions), we observed the well-known antagonistic drug interactions
between bactericidal antibiotics targeting DNA synthesis (such as
ciprofloxacin and other quinolones) and bacteriostatic antibiotics
targeting translation (such as tetracycline) (Ocampo et al, 2014;
Lobritz et al, 2015). Our interaction dataset also included nonantibi-
otic drugs that could be repurposed as antibiotic adjuvants (Gill
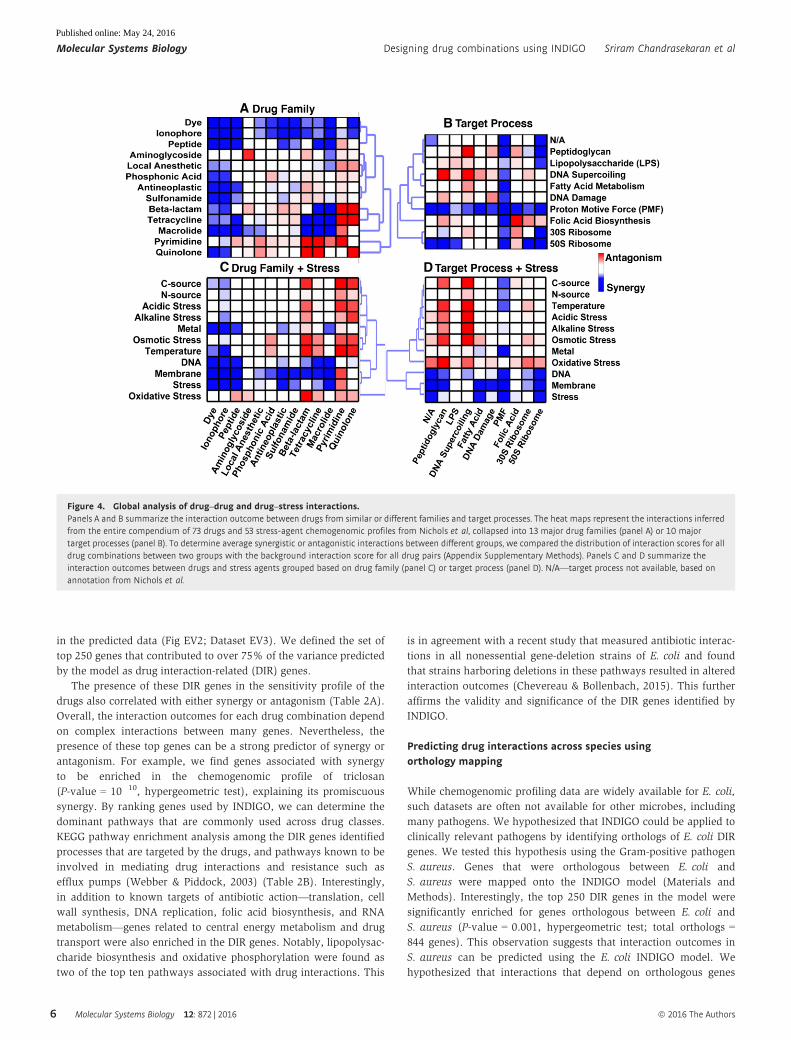
et al, 2015). Interestingly, membrane stress agents, such as the
detergents sodium dodecyl sulfate (SDS) and triclosan, were found
to be synergistic with a large number of antibiotics (Fig 4). These
predictions are consistent with a previous high-throughput drug
combination screen in E. coli (Farha & Brown, 2010).
INDIGO correctly predicted synergy between commonly used,
clinically validated antibiotic combinations. Vancomycin was syner-
gistic with beta-lactam antibiotics (ampicillin and aztreonam), as
was the combination of ampicillin and gentamicin, which has been
a mainstay combination treatment for intra-abdominal infections
(Solomkin et al, 2010; Liu et al, 2011). Rifampicin, which is
frequently used in combination with other antibiotics, particularly
in the case of biofilm-associated infections, is predicted to be syner-
gistic with oxacillin, macrolide, and tetracycline antibiotics,
affirming the clinical efficacy of this drug with other companion
antibiotics (Forrest & Tamura, 2010). Our approach thus consis-
tently and rapidly identifies synergy among antibiotic combinations
that required clinical validation over decades of study.
Genetic predictors of synergy and antagonism
Surprisingly, a small set of genes account for most of the predictive
ability of our model. Genes were assigned an importance score by
INDIGO proportional to their relative contribution in predicting drug
interactions. The top 81 genes accounted for 50%, the top 222
accounted for 75%, and the top 581 accounted for 95% of variance
A
C D E F
B
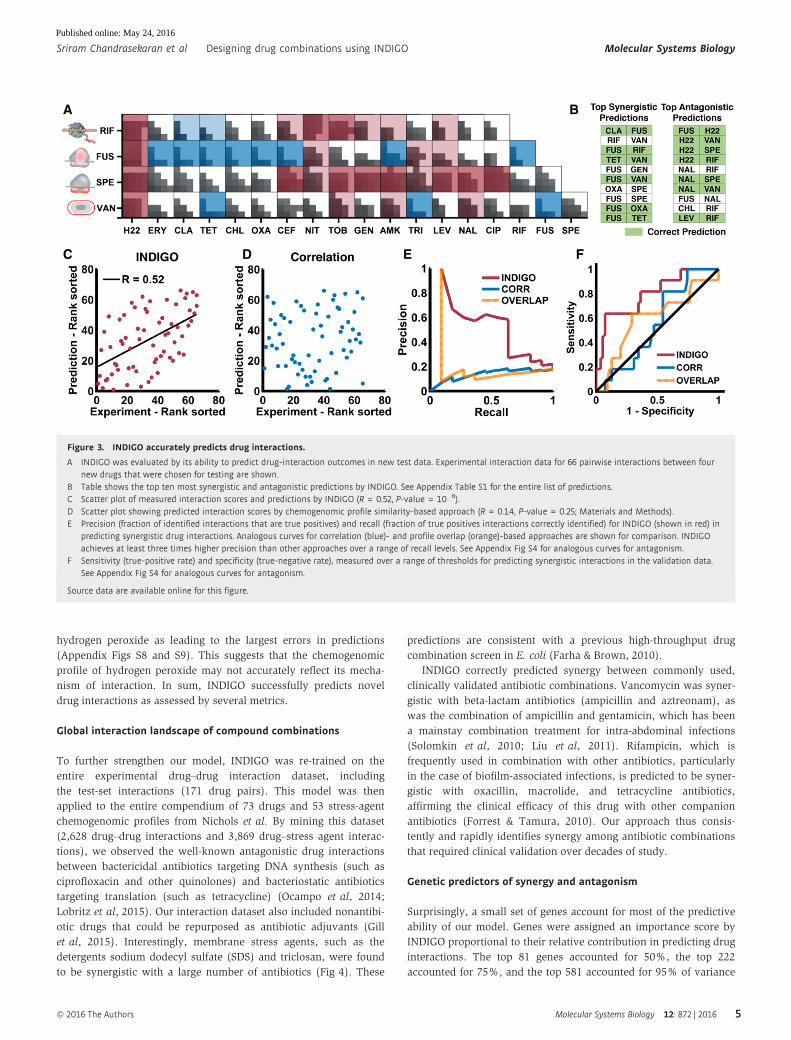
Figure 3. INDIGO accurately predicts drug interactions.
A INDIGO was evaluated by its ability to predict drug-interaction outcomes in new test data. Experimental interaction data for 66 pairwise interactions between fournew drugs that were chosen for testing are shown.
B Table shows the top ten most synergistic and antagonistic predictions by INDIGO. See Appendix Table S1 for the entire list of predictions.C Scatter plot of measured interaction scores and predictions by INDIGO (R = 0.52, P-value = 10�6).D Scatter plot showing predicted interaction scores by chemogenomic profile similarity-based approach (R = 0.14, P-value = 0.25; Materials and Methods).E Precision (fraction of identified interactions that are true positives) and recall (fraction of true positives interactions correctly identified) for INDIGO (shown in red) in
predicting synergistic drug interactions. Analogous curves for correlation (blue)- and profile overlap (orange)-based approaches are shown for comparison. INDIGOachieves at least three times higher precision than other approaches over a range of recall levels. See Appendix Fig S4 for analogous curves for antagonism.
F Sensitivity (true-positive rate) and specificity (true-negative rate), measured over a range of thresholds for predicting synergistic interactions in the validation data.See Appendix Fig S4 for analogous curves for antagonism.
Source data are available online for this figure.
ª 2016 The Authors Molecular Systems Biology 12: 872 | 2016
Sriram Chandrasekaran et al Designing drug combinations using INDIGO Molecular Systems Biology
5
Published online: May 24, 2016
in the predicted data (Fig EV2; Dataset EV3). We defined the set of
top 250 genes that contributed to over 75% of the variance predicted
by the model as drug interaction-related (DIR) genes.
The presence of these DIR genes in the sensitivity profile of the
drugs also correlated with either synergy or antagonism (Table 2A).
Overall, the interaction outcomes for each drug combination depend
on complex interactions between many genes. Nevertheless, the
presence of these top genes can be a strong predictor of synergy or
antagonism. For example, we find genes associated with synergy
to be enriched in the chemogenomic profile of triclosan
(P-value = 10�10, hypergeometric test), explaining its promiscuous
synergy. By ranking genes used by INDIGO, we can determine the
dominant pathways that are commonly used across drug classes.
KEGG pathway enrichment analysis among the DIR genes identified
processes that are targeted by the drugs, and pathways known to be
involved in mediating drug interactions and resistance such as
efflux pumps (Webber & Piddock, 2003) (Table 2B). Interestingly,
in addition to known targets of antibiotic action—translation, cell
wall synthesis, DNA replication, folic acid biosynthesis, and RNA
metabolism—genes related to central energy metabolism and drug
transport were also enriched in the DIR genes. Notably, lipopolysac-
charide biosynthesis and oxidative phosphorylation were found as
two of the top ten pathways associated with drug interactions. This
is in agreement with a recent study that measured antibiotic interac-
tions in all nonessential gene-deletion strains of E. coli and found
that strains harboring deletions in these pathways resulted in altered
interaction outcomes (Chevereau & Bollenbach, 2015). This further
affirms the validity and significance of the DIR genes identified by
INDIGO.
Predicting drug interactions across species usingorthology mapping
While chemogenomic profiling data are widely available for E. coli,
such datasets are often not available for other microbes, including
many pathogens. We hypothesized that INDIGO could be applied to
clinically relevant pathogens by identifying orthologs of E. coli DIR
genes. We tested this hypothesis using the Gram-positive pathogen
S. aureus. Genes that were orthologous between E. coli and
S. aureus were mapped onto the INDIGO model (Materials and
Methods). Interestingly, the top 250 DIR genes in the model were
significantly enriched for genes orthologous between E. coli and
S. aureus (P-value = 0.001, hypergeometric test; total orthologs =
844 genes). This observation suggests that interaction outcomes in
S. aureus can be predicted using the E. coli INDIGO model. We
hypothesized that interactions that depend on orthologous genes
AB
C D
Figure 4. Global analysis of drug–drug and drug–stress interactions.Panels A and B summarize the interaction outcome between drugs from similar or different families and target processes. The heat maps represent the interactions inferredfrom the entire compendium of 73 drugs and 53 stress-agent chemogenomic profiles from Nichols et al, collapsed into 13 major drug families (panel A) or 10 majortarget processes (panel B). To determine average synergistic or antagonistic interactions between different groups, we compared the distribution of interaction scores for alldrug combinations between two groups with the background interaction score for all drug pairs (Appendix Supplementary Methods). Panels C and D summarize theinteraction outcomes between drugs and stress agents grouped based on drug family (panel C) or target process (panel D). N/A—target process not available, based onannotation from Nichols et al.
Molecular Systems Biology 12: 872 | 2016 ª 2016 The Authors
Molecular Systems Biology Designing drug combinations using INDIGO Sriram Chandrasekaran et al
6
Published online: May 24, 2016
would be conserved between the two species, while those that are
predicted by INDIGO to depend on non-orthologous genes would
not be conserved. Therefore, we used the E. coli chemogenomic
profiles of the orthologous genes to predict drug-interaction scores
for S. aureus (Materials and Methods). To quantify the relative
contribution of non-orthologous genes on each drug-interaction
outcome, the chemogenomic scores of non-orthologous genes in the
E. coli INDIGO model were set to take minimal value (Materials and
Methods). This process corresponds to deleting these genes from
the E. coli INDIGO model. The predictions from this modified model
were then compared with the original E. coli model predictions. The
difference in scores for each interaction, called the deviation score,
allowed us to identify drug interactions most sensitive to the state of
the non-orthologous genes and therefore less likely to be conserved
between E. coli and S. aureus.
We predicted interaction and deviation scores for all 171 drug
combinations that were experimentally tested in E. coli using this
orthology framework. To experimentally validate the predictions in
S. aureus, 10 drugs from the E. coli dataset were chosen; these
drugs belong to different classes that were predicted by INDIGO to
have the greatest range of variation in their interactions between
E. coli and S. aureus (Materials and Methods; Fig 5, Appendix Fig
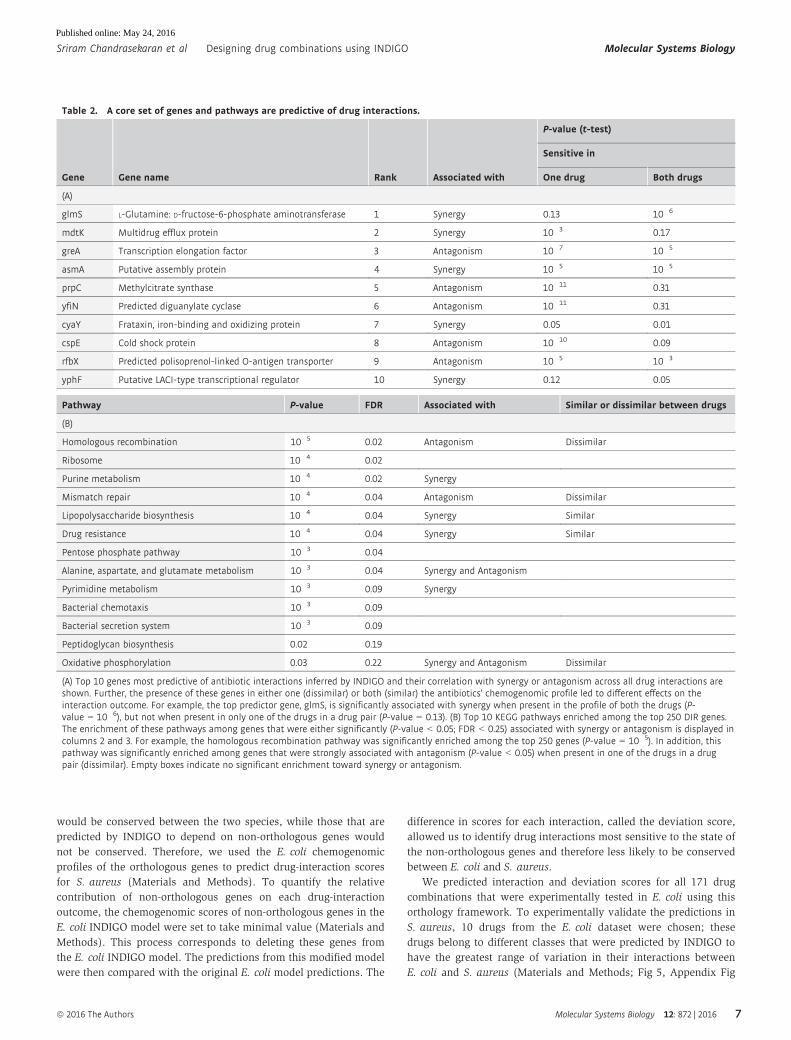
Table 2. A core set of genes and pathways are predictive of drug interactions.
Gene Gene name Rank Associated with
P-value (t-test)
Sensitive in
One drug Both drugs
(A)
glmS L-Glutamine: D-fructose-6-phosphate aminotransferase 1 Synergy 0.13 10�6
mdtK Multidrug efflux protein 2 Synergy 10�3 0.17
greA Transcription elongation factor 3 Antagonism 10�7 10�5
asmA Putative assembly protein 4 Synergy 10�5 10�5
prpC Methylcitrate synthase 5 Antagonism 10�11 0.31
yfiN Predicted diguanylate cyclase 6 Antagonism 10�11 0.31
cyaY Frataxin, iron-binding and oxidizing protein 7 Synergy 0.05 0.01
cspE Cold shock protein 8 Antagonism 10�10 0.09
rfbX Predicted polisoprenol-linked O-antigen transporter 9 Antagonism 10�5 10�3
yphF Putative LACI-type transcriptional regulator 10 Synergy 0.12 0.05
Pathway P-value FDR Associated with Similar or dissimilar between drugs
(B)
Homologous recombination 10�5 0.02 Antagonism Dissimilar
Ribosome 10�4 0.02
Purine metabolism 10�4 0.02 Synergy
Mismatch repair 10�4 0.04 Antagonism Dissimilar
Lipopolysaccharide biosynthesis 10�4 0.04 Synergy Similar
Drug resistance 10�4 0.04 Synergy Similar
Pentose phosphate pathway 10�3 0.04
Alanine, aspartate, and glutamate metabolism 10�3 0.04 Synergy and Antagonism
Pyrimidine metabolism 10�3 0.09 Synergy
Bacterial chemotaxis 10�3 0.09
Bacterial secretion system 10�3 0.09
Peptidoglycan biosynthesis 0.02 0.19
Oxidative phosphorylation 0.03 0.22 Synergy and Antagonism Dissimilar
(A) Top 10 genes most predictive of antibiotic interactions inferred by INDIGO and their correlation with synergy or antagonism across all drug interactions areshown. Further, the presence of these genes in either one (dissimilar) or both (similar) the antibiotics’ chemogenomic profile led to different effects on theinteraction outcome. For example, the top predictor gene, glmS, is significantly associated with synergy when present in the profile of both the drugs (P-value = 10�6), but not when present in only one of the drugs in a drug pair (P-value = 0.13). (B) Top 10 KEGG pathways enriched among the top 250 DIR genes.The enrichment of these pathways among genes that were either significantly (P-value < 0.05; FDR < 0.25) associated with synergy or antagonism is displayed incolumns 2 and 3. For example, the homologous recombination pathway was significantly enriched among the top 250 genes (P-value = 10�5). In addition, thispathway was significantly enriched among genes that were strongly associated with antagonism (P-value < 0.05) when present in one of the drugs in a drugpair (dissimilar). Empty boxes indicate no significant enrichment toward synergy or antagonism.
ª 2016 The Authors Molecular Systems Biology 12: 872 | 2016
Sriram Chandrasekaran et al Designing drug combinations using INDIGO Molecular Systems Biology
7
Published online: May 24, 2016
S13, and Appendix Tables S2 and S3). The interaction score for all
45 pairs of these antibiotics was then experimentally measured in
S. aureus using the same setup used for E. coli (Fig 5B). Overall, we
found that there is a small yet significant correlation between the
experimentally measured drug-interaction scores of the two species
(R = 0.39; P-value = 0.008, Appendix Fig S14). This is in agreement
with the observation that the top predictive genes are conserved
between the two species. Consistent with our hypothesis, interac-
tions that are associated with non-orthologous genes as quantified
by the deviation score have stronger differences in their interaction
outcome between the two species (R = 0.52; P-value = 10�4;
Appendix Table S4; Fig 5C). Our analysis indicates that although
some drug interactions are conserved between the two species,
there are many exceptions. These exceptions can be identified by
INDIGO based on the deviation score. By taking into account these
deviations, interaction outcomes in S. aureus can be directly esti-
mated using INDIGO (R = 0.47 between experimental and predicted
S. aureus interactions; P-value = 10�3; Figs 5D and EV3). For exam-
ple, INDIGO correctly discovered that the oxacillin–tetracycline
combination is synergistic in E. coli, but antagonistic in S. aureus.
These results are noteworthy given that S. aureus interaction data
were not used for training the model, and chemogenomics data from
a different species were used to predict interactions.
To further validate the applicability of our approach to other
organisms, INDIGO was applied to predict antibiotic interaction
outcomes in the pathogen Mycobacterium tuberculosis using E. coli
chemogenomics data; 909 genes in M. tuberculosis were ortholo-
gous with genes in our E. coli dataset. Again, these conserved genes
are enriched among the top 250 DIR genes (P-value = 10�4, hyper-
geometric test). Using the INDIGO M. tuberculosis model, interac-
tion outcomes were predicted for 24 antibiotic combinations
available in the literature with chemogenomic data in our compen-
dium (Bhusal et al, 2005; Ramon-Garcia et al, 2011; Singh et al,
2015). Similar to S. aureus predictions, we found strong correlation
between the predicted and experimentally observed interaction
outcomes in M. tuberculosis (R = 0.54; P-value = 0.006; Figs 5E and
EV3; Appendix Table S5). Many combinations that are synergistic in
E. coli are also predicted to be synergistic in M. tuberculosis. For
example, combinations of spectinomycin with clarithromycin or
azithromycin are synergistic in both species. Remarkably, 20 out of
the 24 antibiotic combinations for which predictions were made for
M. tuberculosis were not in our experimental dataset for E. coli and
A
B C D E
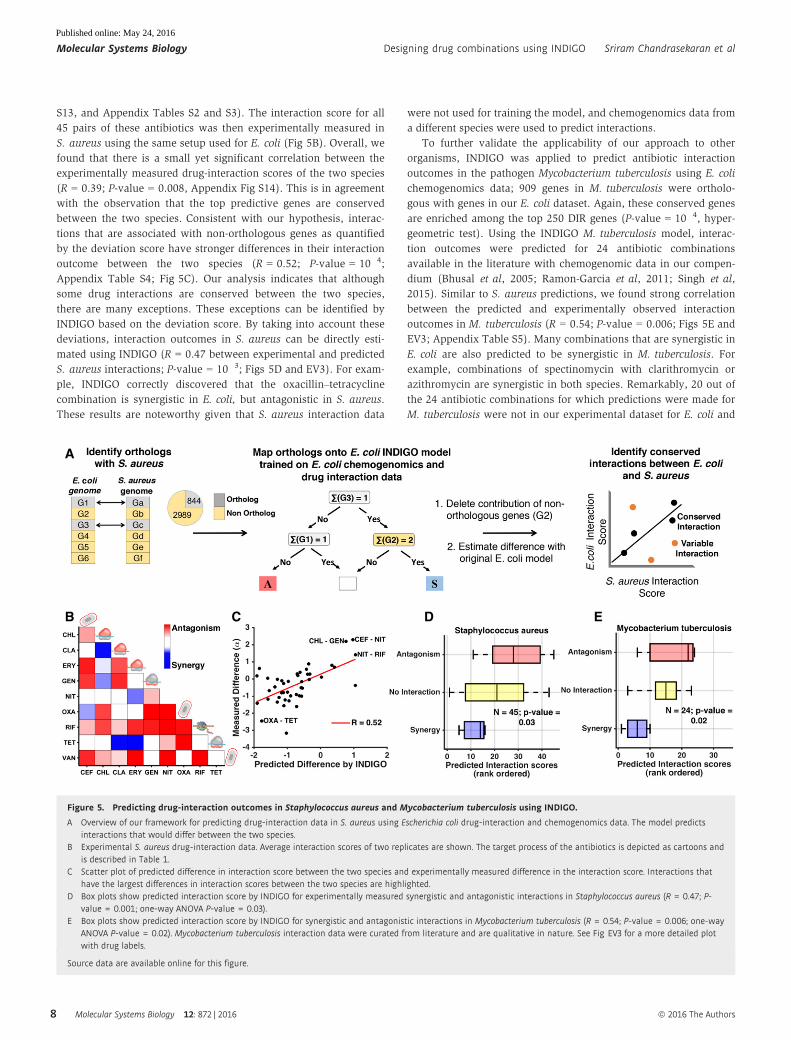
Figure 5. Predicting drug-interaction outcomes in Staphylococcus aureus and Mycobacterium tuberculosis using INDIGO.
A Overview of our framework for predicting drug-interaction data in S. aureus using Escherichia coli drug-interaction and chemogenomics data. The model predictsinteractions that would differ between the two species.
B Experimental S. aureus drug-interaction data. Average interaction scores of two replicates are shown. The target process of the antibiotics is depicted as cartoons andis described in Table 1.
C Scatter plot of predicted difference in interaction score between the two species and experimentally measured difference in the interaction score. Interactions thathave the largest differences in interaction scores between the two species are highlighted.
D Box plots show predicted interaction score by INDIGO for experimentally measured synergistic and antagonistic interactions in Staphylococcus aureus (R = 0.47; P-value = 0.001; one-way ANOVA P-value = 0.03).
E Box plots show predicted interaction score by INDIGO for synergistic and antagonistic interactions in Mycobacterium tuberculosis (R = 0.54; P-value = 0.006; one-wayANOVA P-value = 0.02). Mycobacterium tuberculosis interaction data were curated from literature and are qualitative in nature. See Fig EV3 for a more detailed plotwith drug labels.
Source data are available online for this figure.
Molecular Systems Biology 12: 872 | 2016 ª 2016 The Authors
Molecular Systems Biology Designing drug combinations using INDIGO Sriram Chandrasekaran et al
8
Published online: May 24, 2016
hence could not have been predicted from experimental data
directly.
We have thus established that we can reliably estimate drug-
interaction outcomes in E. coli, S. aureus, and M. tuberculosis. To
assess the organism-specific variability of interactions, the entire
compendium of interactions between 73 drugs and 53 stress agent
from Nichols et al was compared across the three species (Dataset
EV2). Combinations involving tetracyclines and quinolones were
found to be more likely to vary across species (Fig EV4). Consistent
with this observation, no significant enrichment was found for
orthologous genes among the DIR genes in the chemogenomic pro-
file of these antibiotics (P-value > 0.05, hypergeometric test).
Among all predictions, 3 and 5% were predicted to exhibit strong
broad-spectrum synergy and antagonism in all three species, respec-
tively. In contrast, only 1% of the drug pairs showed a mix of
synergy and antagonism in the three species.
Discussion
Despite an alarming rise in resistance, few new antibiotics have
been developed in the past decade, necessitating the increased use
of antibiotic combination therapies. In this study, we developed and
validated a computational framework that can successfully predict
synergistic and antagonistic drug interactions in three bacterial
species. In addition to the 171 drug pairs experimentally assessed in
E. coli, drug-interaction predictions were validated for 45 drug pairs
in S. aureus. In agreement with previous studies in bacteria and
yeast, antagonistic interactions were more prevalent than synergistic
interactions. This underscores the difficulty of selecting drug combi-
nations that do not adversely affect clinical outcomes.
An important finding from this study is that drug interactions can
be predicted based on chemogenomic profiles of individual drugs.
This suggests that cellular sensitivity to drug combinations can be
abstracted by a linear model of individual drug-sensitivity profiles
(Pritchard et al, 2013). This is consistent with the observation that
protein and transcriptional dynamics of cells treated with drug
combinations are a linear combination of the individual drug effects
(Geva-Zatorsky et al, 2010; Chevereau & Bollenbach, 2015). A large
resource of chemogenomic profiling is now available for E. coli,
S. cerevisiae, and human cancer cell lines; INDIGO can thus be
applied to a wide range of drugs across different systems (Flores
et al, 2005; Tamae et al, 2008; Girgis et al, 2009; Ho et al, 2009;
Muellner et al, 2011; Nichols et al, 2011; Lee et al, 2014).
INDIGO assesses the influence of hundreds of individual chemi-
cal–genetic interactions on drug–drug interaction outcomes. In
contrast, existing chemogenomics-based approaches determine
synergy based on a single aggregate metric of drug similarity. Our
gene-centric model has also enabled us to apply our E. coli drug-
interaction model to predict outcomes in other bacterial species.
Genes identified to be predictive of drug interactions by INDIGO
(DIR genes) were involved in the processes targeted by the drugs or
processes such as drug transport and bacterial metabolism that are
known to influence drug interactions (Chevereau & Bollenbach,
2015). DIR genes connected to energy metabolism might be neces-
sary for facilitated transport of the drugs (Allison et al, 2011) or
may be connected to cellular damage induced by antibiotic-related
redox changes (Kohanski et al, 2007, 2010; Dwyer et al, 2014;
Lobritz et al, 2015). Overall, we found that 15% of the E. coli
genome account for 95% of the predictive ability of our model, and
this core set is enriched for genes that are conserved across species.
Our study goes beyond existing drug combination discovery
approaches by leveraging chemogenomic data in E. coli to infer
antibiotic interactions in S. aureus and M. tuberculosis. Our
approach may be especially relevant for M. tuberculosis, where
combination therapy is critical and experimental screens are diffi-
cult, expensive, and time-consuming. Identifying synergistic combi-
nations can help reduce the duration of tuberculosis combination
therapy, which currently takes 6 months to 2 years (Ramon-Garcia
et al, 2011).
INDIGO identified combinations that are synergistic in E. coli,
but are surprisingly antagonistic in S. aureus. The discovery of such
combinations that are selectively synergistic (narrow-spectrum
synergy) could be used to improve specificity of antibiotic combina-
tion therapies to target pathogen strains without significantly
affecting beneficial microbes. Strong synergistic combinations in
model organisms that are predicted by INDIGO to be conserved in
pathogens could be prioritized for testing as “broad-spectrum syner-
gistic combinations”. Species-specific interaction outcomes have
also been observed for drug combinations against fungal pathogens,
similar to our observation in bacteria (Wildenhain et al, 2015).
While this capability to predict drug interactions by mapping
orthologous genes is a significant advance for this field and can be
extended to any organism with genome sequence information, a
limitation of this approach is that INDIGO cannot explicitly model
the contribution of pathogen DIR genes that are not present in
E. coli. Our interaction estimates for these systems could be further
improved with the availability of chemogenomics data for these
pathogens and by performing drug-interaction measurements
directly in pathogens as training data for INDIGO. Predictive accu-
racy of INDIGO can be enhanced in the future through new tech-
nologies for the accurate measurement of drug–drug and chemical–
genetic interactions, performing chemogenomic screens with essen-
tial genes (Cameron & Collins, 2014), and by harnessing drug
physicochemical properties (Yilancioglu et al, 2014) and chemical
structure (Wildenhain et al, 2015). INDIGO can complement
theoretical models for predicting multidrug interactions from
pairwise interactions (Wood et al, 2012), and kinetic modeling-
based approaches, which are currently restricted to small pathways
due to a lack of known kinetic parameters and drug targets (Singh
et al, 2015). By transforming drug responses and interactions into
the genomic space, our study provides a framework for genomics-
driven drug combinations discovery.
Materials and Methods
Drug-interaction assays
All drug-interaction experiments were conducted using a 4 × 4
checkerboard assay, where the concentration of each drug increases
linearly in each axis starting with 0 (no drug). Escherichia coli
MG1655 or S. aureus ATCC 29213 were grown in tryptic soy buffer
media in the presence of antibiotics. In E. coli experiments, optical
density (OD) measurements were done every 15 min for 12 h in a
TECAN Infinite F200 microplate reader. Growth rate was then
ª 2016 The Authors Molecular Systems Biology 12: 872 | 2016
Sriram Chandrasekaran et al Designing drug combinations using INDIGO Molecular Systems Biology
9
Published online: May 24, 2016
estimated based on the area under the growth curve. Since the
E. coli area under the growth curve was highly correlated with the
end-point readings, only end-point OD measurement after 12 h was
used for S. aureus to expedite experiments. For each drug-interac-
tion experiment, we ensured that for each individual drug, there
were > 50% inhibition at the highest dose used and < 50% inhibi-
tion at the lowest dose used as a quality control check. All drugs
were purchased from Sigma. MICs for each drug are provided in
Table 1 and Appendix Table S2.
Quantifying drug interactions
Interactions were quantified based on the isophenotypic growth
contour method described in Cokol et al (2011) based on the
Loewe’s additivity model (Loewe 1953). The growth contour (line
of constant growth) is linear for noninteracting drugs. Depending on
the concavity or convexity of the growth contour, interactions are
classified as synergistic or antagonistic. Our null hypothesis based
on the Loewe’s interaction model is that a drug is noninteracting
with itself. Deviations from this null model lead to either synergy or
antagonism. The advantage of this approach is that there is no
underlying assumption that the data should be normally distributed
with similar numbers of synergy and antagonism, or that neutral
interactions should be more common than synergy or antagonism.
INDIGO cross-validation and controls
Alternate metrics to evaluate the predictive ability
We assessed the overall accuracy of the predictions by measuring
the area under the receiver-operating characteristics (ROC) curve.
INDIGO quantitatively predicted drug interactions with high preci-
sion, significantly better than random, and with equal accuracy
for both synergy and antagonism (AUC for synergy = 0.79,
P-value = 10�16; AUC for antagonism = 0.8, P-value = 10�16). Both
the correlation-based and profile overlap-based approaches from
Jansen et al were significantly less accurate than INDIGO in predict-
ing drug interactions (AUC for synergy = 0.6; P-value = 0.003 for
profile correlation, and AUC synergy = 0.64; P-value = 10�5 for pro-
file overlap; Fig 3E and F). In addition to these metrics for evaluat-
ing accuracy, we also measured the probabilistic concordance
index, PCC (Bansal et al, 2014), which quantifies the concordance
between the ranking of drug pairs in the predicted and measured
data, accounting for variance in the experimental measurement of
the drug interactions. INDIGO’s predictions were significantly better
than predictions based on profile similarity and random permuta-
tion of the data (INDIGO PCC = 0.68, P-value < 10�6; profile simi-
larity PCC = 0.53; P-value = 0.15). We also tested our model in a
single-dose study involving 21 antibiotic pairs (Yeh et al, 2006) and
found that INDIGO outperformed similarity-based approaches in
predicting drug interactions [rank correlation R = 0.59, P-value
< 10�15 for INDIGO; no significant correlation for correlation and
profile overlap (Appendix Fig S15)].
Estimating robustness to training data
In addition to the test-set predictions, the model’s predictive ability
was also assessed through cross-validation. Two types of cross-vali-
dation analyses were performed. In tenfold cross-validation, 10% of
the interactions were randomly blinded and predicted by the model
based on information from the remaining 90% of the interactions
(Appendix Fig S10). This represents a scenario where new interac-
tions are inferred for drugs for which some interactions with other
drugs are already known. We also performed another kind of cross-
validation where each drug was removed from the network and its
interactions were inferred based on its chemogenomic profile and
interactions of the remaining drugs. This is a more stringent test
than tenfold cross-validation and represents the situation where
interactions are inferred for a new drug based on its chemogenomic
profile (Appendix Figs S9 and S10). Through these analyses, we
found that INDIGO could accurately predict interactions with
compounds that belong to novel chemical classes or with distinct
mechanisms of action. Nevertheless, we found that the prediction
accuracy could be further improved by choosing drugs representa-
tive of different classes in the training set. In addition, the presence
of a few known interactions about a drug of interest can greatly
increase predictive ability. Finally, INDIGO was able to predict
synergistic interactions with high accuracy in the test set, which had
significantly more synergistic interactions (13 synergies and 25
antagonisms) compared to the training data (14 synergies and 56
antagonisms), suggesting that it is robust to the biased distribution
of interactions in the training set.
Negative and positive controls for INDIGO
As a negative control, we shuffled the interaction scores for the
training data and found that it removed correlation and predictive
ability of the model. Swapping drug names, which results in switch-
ing the chemogenomic profiles of individual drugs, also led to a
significant decrease in correlation compared to a random model,
confirming that chemogenomic profiles provide unique drug-specific
information (Appendix Figs S11 and S12). To determine the role of
interaction network topology in influencing the interaction predic-
tions (“hub effect”), we also compared predictions with a simple
model that outputs for a query drug, the average interaction
score of the partner drug with other drugs in the network. This
model had a Pearson’s correlation of only 0.3 based on cross-
validation, ruling out the possibility that the predictions were
primarily influenced by few synergistic and antagonistic hubs in
the drug-interaction network. As a positive control, we found
that INDIGO correctly identified interactions between the same
drug at different doses to be linear (median score = 0 for self–
self interactions involving 73 drugs; Appendix Fig S16). This
indicates that INDIGO can differentiate chemogenomic profiles of
the same drug at different doses from other drugs. This is
significant given that the model was trained only on interactions
between different drugs.
Chemogenomic profile similarity-based approaches
For the correlation method, we measured the Pearson’s correlation
between the chemogenomic profiles of two drugs of interest. Inter-
actions were defined to be synergistic, antagonistic, or linear if the
correlation passed a specific threshold. The best threshold was
determined based on the training data using the random forest algo-
rithm. Similarly, profile overlap was defined as the overlap in the
number of sensitivity genes between the chemogenomic profiles of
two drugs of interest. We used a hypergeometric test to determine
whether the total overlap was significantly higher than that
Molecular Systems Biology 12: 872 | 2016 ª 2016 The Authors
Molecular Systems Biology Designing drug combinations using INDIGO Sriram Chandrasekaran et al
10
Published online: May 24, 2016
expected by random chance. The best P-value threshold for differen-
tiating different interaction types was determined based on the train-
ing data using the random forest algorithm.
Orthology mapping to S. aureus and M. tuberculosis
Orthologous genes in E. coli were obtained from OrtholugeDB
(Whiteside et al, 2013). The database uses the reciprocal-
best-BLAST hit (RBBH) procedure to generate the initial set of
ortholog predictions. Genes are declared orthologs if they are each
other’s top BLAST hit when each genome is BLASTed against the
other (Whiteside et al, 2013). This resulted in 844 and 909 genes
that were predicted to be orthologs of S. aureus and M. tuberculosis
among the E. coli genes in our model. Enrichment for orthologs
among the top predictors was done using the hypergeometric test in
MATLAB.
Predicting interactions that differ between E. coli andother organisms
To predict interactions that differ between the two species, we iden-
tified genes in the E. coli model that were not orthologous between
the two species. The sigma and delta scores for these genes were
then set to be at the minimum value (0). The resulting interaction
scores for all the drug-interaction pairs were recalculated using the
modified scores. Theoretically, there are millions of possible solu-
tions for changing the sigma score matrix to match S. aureus or
M. tuberculosis. To simplify the problem, we simulate the extreme
case and set the states of all non-orthologous genes to be zero.
Choosing either the maximal (2) or minimal (0) sigma score value
led to the same correlation with the predicted difference (R = 0.52).
Changing the sigma scores would allow us to identify drug interac-
tions most sensitive to the state of the non-orthologous genes. By
sequentially removing interactions that have large predicted devia-
tion scores, we found that we could predict S. aureus interactions
using INDIGO with a much higher correlation (R > 0.55) than exper-
imental E. coli data (Appendix Fig S14).
Algorithm and data availability
The following datasets are provided: (i) experimental drug-interac-
tion scores for all 171 combinations in E. coli (Dataset EV1); (ii)
interaction predictions for 2628 drug combinations of 73 drugs
(highest dose in chemogenomics data was chosen) in all three
species (E. coli, S. aureus, and M. tuberculosis) (Dataset EV2), and
(iii) ranked list of all genes used by INDIGO for predicting drug-
interaction outcomes (Dataset EV3). The MATLAB implementation
of INDIGO along with associated experimental data is provided as
Computer Code EV1 and is also freely available on Synapse, the
online portal for sharing computational biology data and software:
https://www.synapse.org/#!Synapse:syn3880435/wiki/.
Expanded View for this article is available online.
AcknowledgementsThis work was supported by grants from the Harvard Society of Fellows and the
Harvard William Milton Fund to SC, National Institute of Allergy and Infectious
Diseases of the National Institutes of Health under Award Number
U19AI111276, the Broad Institute Tuberculosis donor group and the Pershing
Square Foundation, and the Wyss Institute to JJC, Turkish Academy of Sciences
GEBIP Programme to MC. The content is solely the responsibility of the authors
and does not necessarily represent the official views of the National Institutes
of Health or other funding agencies. We thank Caroline Milne Porter and
Michael Lobritz for insightful discussions and critical reading of the manuscript.
Author contributionsSC conceived, designed, and implemented INDIGO and performed all the
computational analyses. MC designed and supervised all the experimental
analyses. MC-C, NS, KY, and MC performed experiments; HK reproduced all
the computational results and provided feedback; SC, JJC, and MC
contributed to the study design; SC wrote the manuscript with input from
JJC and MC.
Conflict of interestKY and MC are cofounders of SynVera, Inc., a start-up focused on drug combi-
nation therapy development. The other authors declare that they have no con-
flict of interest.
References
Allison KR, Brynildsen MP, Collins JJ (2011) Metabolite-enabled eradication of
bacterial persisters by aminoglycosides. Nature 473: 216 – 220
Bansal M, Yang J, Karan C, Menden MP, Costello JC, Tang H, Xiao G, Li Y,
Allen J, Zhong R, Chen B, Kim M, Wang T, Heiser LM, Realubit R, Mattioli
M, Alvarez MJ, Shen Y, Gallahan D, Singer D et al (2014) A community
computational challenge to predict the activity of pairs of compounds.
Nat Biotechnol 32: 1213 – 1222
Bhusal Y, Shiohira C, Yamane N (2005) Determination of in vitro synergy
when three antimicrobial agents are combined against Mycobacterium
tuberculosis. Int J Antimicrob Agents 26: 292 – 297
Bredel M, Jacoby E (2004) Chemogenomics: an emerging strategy for rapid
target and drug discovery. Nat Rev Genet 5: 262 – 275
Brown JC, Nelson J, VanderSluis B, Deshpande R, Butts A, Kagan S,
Polacheck I, Krysan DJ, Myers CL, Madhani HD (2014) Unraveling the
biology of a fungal meningitis pathogen using chemical genetics. Cell
159: 1168 – 1187
Bush K, Courvalin P, Dantas G, Davies J, Eisenstein B, Huovinen P, Jacoby GA,
Kishony R, Kreiswirth BN, Kutter E, Lerner SA, Levy S, Lewis K, Lomovskaya
O, Miller JH, Mobashery S, Piddock LJ, Projan S, Thomas CM, Tomasz A
et al (2011) Tackling antibiotic resistance. Nat Rev Microbiol 9: 894 – 896
Cameron DE, Collins JJ (2014) Tunable protein degradation in bacteria. Nat
Biotechnol 32: 1276 – 1281
Chevereau G, Bollenbach T (2015) Systematic discovery of drug interaction
mechanisms, Vol. 11.
Cokol M, Chua HN, Tasan M, Mutlu B, Weinstein ZB, Suzuki Y, Nergiz ME,
Costanzo M, Baryshnikova A, Giaever G, Nislow C, Myers CL, Andrews BJ,
Boone C, Roth FP (2011) Systematic exploration of synergistic drug pairs.
Mol Syst Biol 7: 544
Dancey JE, Chen HX (2006) Strategies for optimizing combinations of
molecularly targeted anticancer agents. Nat Rev Drug Discovery 5: 649 – 659
Dwyer DJ, Belenky PA, Yang JH, MacDonald IC, Martell JD, Takahashi N, Chan
CT, Lobritz MA, Braff D, Schwarz EG, Ye JD, Pati M, Vercruysse M, Ralifo
PS, Allison KR, Khalil AS, Ting AY, Walker GC, Collins JJ (2014) Antibiotics
induce redox-related physiological alterations as part of their lethality.
Proc Natl Acad Sci USA 111: E2100 – E2109
ª 2016 The Authors Molecular Systems Biology 12: 872 | 2016
Sriram Chandrasekaran et al Designing drug combinations using INDIGO Molecular Systems Biology
11
Published online: May 24, 2016
Farha MA, Brown ED (2010) Chemical probes of Escherichia coli uncovered
through chemical-chemical interaction profiling with compounds of
known biological activity. Chem Biol 17: 852 – 862
Fischbach MA, Walsh CT (2009) Antibiotics for emerging pathogens. Science
325: 1089 – 1093
Flores AR, Parsons LM, Pavelka MS Jr (2005) Characterization of novel
Mycobacterium tuberculosis and Mycobacterium smegmatis mutants
hypersusceptible to beta-lactam antibiotics. J Bacteriol 187: 1892 – 1900
Forrest GN, Tamura K (2010) Rifampin combination therapy for
nonmycobacterial infections. Clin Microbiol Rev 23: 14 – 34
Geva-Zatorsky N, Dekel E, Cohen AA, Danon T, Cohen L, Alon U (2010) Protein
dynamics in drug combinations: a linear superposition of individual-drug
responses. Cell 140: 643 – 651
Gill EE, Franco OL, Hancock RE (2015) Antibiotic adjuvants: diverse strategies
for controlling drug-resistant pathogens. Chem Biol Drug Des 85: 56 – 78
Girgis HS, Hottes AK, Tavazoie S (2009) Genetic architecture of intrinsic
antibiotic susceptibility. PLoS ONE 4: e5629
Ho CH, Magtanong L, Barker SL, Gresham D, Nishimura S, Natarajan P, Koh
JL, Porter J, Gray CA, Andersen RJ, Giaever G, Nislow C, Andrews B, Botstein
D, Graham TR, Yoshida M, Boone C (2009) A molecular barcoded yeast
ORF library enables mode-of-action analysis of bioactive compounds. Nat
Biotechnol 27: 369 – 377
Hopkins AL (2008) Network pharmacology: the next paradigm in drug
discovery. Nat Chem Biol 4: 682 – 690
Jansen G, Lee AY, Epp E, Fredette A, Surprenant J, Harcus D, Scott M, Tan E,
Nishimura T, Whiteway M, Hallett M, Thomas DY (2009) Chemogenomic
profiling predicts antifungal synergies. Mol Syst Biol 5: 338
Kohanski MA, Dwyer DJ, Hayete B, Lawrence CA, Collins JJ (2007) A common
mechanism of cellular death induced by bactericidal antibiotics. Cell 130:
797 – 810
Kohanski MA, DePristo MA, Collins JJ (2010) Sublethal antibiotic treatment
leads to multidrug resistance via radical-induced mutagenesis. Mol Cell 37:
311 – 320
Lee AY, St Onge RP, Proctor MJ, Wallace IM, Nile AH, Spagnuolo PA, Jitkova Y,
Gronda M, Wu Y, Kim MK, Cheung-Ong K, Torres NP, Spear ED, Han MK,
Schlecht U, Suresh S, Duby G, Heisler LE, Surendra A, Fung E et al (2014)
Mapping the cellular response to small molecules using chemogenomic
fitness signatures. Science 344: 208 – 211
Lehar J, Stockwell BR, Giaever G, Nislow C (2008) Combination chemical
genetics. Nat Chem Biol 4: 674 – 681
Liu C, Bayer A, Cosgrove SE, Daum RS, Fridkin SK, Gorwitz RJ, Kaplan SL,
Karchmer AW, Levine DP, Murray BE, J Rybak M, Talan DA, Chambers HF
(2011) Clinical practice guidelines by the infectious diseases society of
America for the treatment of methicillin-resistant Staphylococcus aureus
infections in adults and children: executive summary. Clin Infect Dis 52:
285 – 292
Lobritz MA, Belenky P, Porter CBM, Gutierrez A, Yang JH, Schwarz EG, Dwyer
DJ, Khalil AS, Collins JJ (2015) Antibiotic efficacy is linked to bacterial
cellular respiration. Proc Natl Acad Sci USA 112: 8173 – 8180
Loewe S (1953) The problem of synergism and antagonism of combined
drugs. Arzneimittelforschung 3: 285 – 290
Muellner MK, Uras IZ, Gapp BV, Kerzendorfer C, Smida M, Lechtermann H,
Craig-Mueller N, Colinge J, Duernberger G, Nijman SM (2011) A chemical-
genetic screen reveals a mechanism of resistance to PI3K inhibitors in
cancer. Nat Chem Biol 7: 787 – 793
Nichols RJ, Sen S, Choo YJ, Beltrao P, Zietek M, Chaba R, Lee S, Kazmierczak
KM, Lee KJ, Wong A, Shales M, Lovett S, Winkler ME, Krogan NJ, Typas A,
Gross CA (2011) Phenotypic landscape of a bacterial cell. Cell 144:
143 – 156
Ocampo PS, Lázár V, Papp B, Arnoldini M, Zur Wiesch PA, Busa-Fekete R,
Fekete G, Pál C, Ackermann M, Bonhoeffer S (2014) Antagonism between
bacteriostatic and bactericidal antibiotics is prevalent. Antimicrob Agents
Chemother 58: 4573 – 4582
Pritchard JR, Bruno PM, Gilbert LA, Capron KL, Lauffenburger DA, Hemann MT
(2013) Defining principles of combination drug mechanisms of action. Proc
Natl Acad Sci USA 110: E170 – E179
Ramon-Garcia S, Ng C, Anderson H, Chao JD, Zheng X, Pfeifer T, Av-Gay Y,
Roberge M, Thompson CJ (2011) Synergistic drug combinations for
tuberculosis therapy identified by a novel high-throughput screen.
Antimicrob Agents Chemother 55: 3861 – 3869
Roemer T, Boone C (2013) Systems-level antimicrobial drug and drug synergy
discovery. Nat Chem Biol 9: 222 – 231
Singh R, Ramachandran V, Shandil R, Sharma S, Khandelwal S, Karmarkar
M, Kumar N, Solapure S, Saralaya R, Nanduri R (2015) In silico-based
high-throughput screen for discovery of novel combinations
for tuberculosis treatment. Antimicrob Agents Chemother 59:
5664 – 5674
Solomkin JS, Mazuski JE, Bradley JS, Rodvold KA, Goldstein EJ, Baron EJ, O’Neill
PJ, Chow AW, Dellinger EP, Eachempati SR, Gorbach S, Hilfiker M, May AK,
Nathens AB, Sawyer RG, Bartlett JG (2010) Diagnosis and management of
complicated intra-abdominal infection in adults and children: guidelines
by the Surgical Infection Society and the Infectious Diseases Society of
America. Surg Infect 11: 79 – 109
Tamae C, Liu A, Kim K, Sitz D, Hong J, Becket E, Bui A, Solaimani P, Tran KP,
Yang H, Miller JH (2008) Determination of antibiotic hypersensitivity
among 4,000 single-gene-knockout mutants of Escherichia coli. J Bacteriol
190: 5981 – 5988
Webber MA, Piddock LJ (2003) The importance of efflux pumps in bacterial
antibiotic resistance. J Antimicrob Chemother 51: 9 – 11
Whiteside MD, Winsor GL, Laird MR, Brinkman FS (2013) OrtholugeDB: a
bacterial and archaeal orthology resource for improved comparative
genomic analysis. Nucleic Acids Res 41: D366 –D376
Wildenhain J, Spitzer M, Dolma S, Jarvik N, White R, Roy M, Griffiths E, Bellows
David S, Wright Gerard D, Tyers M (2015) Prediction of synergism from
chemical-genetic interactions by machine learning. Cell Syst 1: 383 – 395
Wood K, Nishida S, Sontag ED, Cluzel P (2012) Mechanism-independent
method for predicting response to multidrug combinations in bacteria.
Proc Natl Acad Sci USA 109: 12254 – 12259
Worthington RJ, Melander C (2013) Combination approaches to
combat multidrug-resistant bacteria. Trends Biotechnol 31: 177 – 184
Yeh P, Tschumi AI, Kishony R (2006) Functional classification of drugs
by properties of their pairwise interactions. Nat Genet 38: 489 – 494
Yilancioglu K, Weinstein ZB, Meydan C, Akhmetov A, Toprak I, Durmaz A, Iossifov
I, Kazan H, Roth FP, Cokol M (2014) Target-independent prediction of drug
synergies using only drug lipophilicity. J Chem Inf Model 54: 2286– 2293
Zimmermann GR, Lehar J, Keith CT (2007) Multi-target therapeutics: when
the whole is greater than the sum of the parts. Drug Discovery Today 12:
34 – 42
License: This is an open access article under the
terms of the Creative Commons Attribution 4.0
License, which permits use, distribution and reproduc-
tion in any medium, provided the original work is
properly cited.
Molecular Systems Biology 12: 872 | 2016 ª 2016 The Authors
Molecular Systems Biology Designing drug combinations using INDIGO Sriram Chandrasekaran et al
12
Published online: May 24, 2016

![Orthology & Paralogy Alignment & Assembly Alastair Kerr Ph.D. WTCCB Bioinformatics Core [many slides borrowed from various sources]](https://img.pdfslide.us/doc/110x75/5697bfaa1a28abf838c9a935/orthology-paralogy-alignment-assembly-alastair-kerr-phd-wtccb-bioinformatics.jpg)