Embed Size (px)
Citation preview

October 2007 Volume 8, Issue No 4 ISSN 1756-1108 Pages 362-402
Chemistry Education Research and Practice
Published quarterly by The Royal Society of Chemistry
Chemistry Education Research and Practice
October 2007 Volume 8, Issue no 4 ISSN 1756-1108 Pages 362-402 Contents Papers Learning about stoichiometry: from students’ preconceptions to the concept of limiting reactant.........................................................................................................................362-375 Laure Gauchon and Martine Méheut Mapping students’ knowledge structure in understanding density, mass percent, molar mass, molar volume and their application in calculations by the use of the knowledge space theory .................................................................................................................376-389 Zoltán Tóth Evaluation of student engagement with two learning supports in the teaching of 1st year undergraduate chemistry ...........................................................................................390-402 James Lovatt, Odilla E. Finlayson and Paraic James Announcement of the special issue for 2008.
Indexed/Abstracted in CHEMICAL ABSTRACTS (CA)
EDUCATIONAL RESEARCH ABSTRACTS ONLINE (ERA) http://www.tandf.co.uk/era

Chemistry Education Research and Practice The journals, University Chemistry Education, published by The Royal Society of Chemistry, (http://www.rsc.org/uchemed/uchemed.htm) and Chemistry Education Research and Practice, published from the University of Ioannina, (http://www.uoi.gr/cerp/) have merged with effect from January 1st 2005. The new, fully electronic journal is published by The Royal Society of Chemistry under the title: Chemistry Education Research and Practice, and it will continue to be available free of charge on the Internet. There are four issues per year. The new journal is edited by Georgios Tsaparlis ([email protected]) and Stephen Breuer ([email protected]) and intends to maintain the high standards set by its predecessors. Its editorial policy will be the following. ’Chemistry Education Research and Practice’ is the journal for teachers, researchers and other practitioners in chemical education. It is the place to publish papers on: ● research, and reviews of research in chemical education; ● effective practice in the teaching of chemistry; ● in depth analyses of issues of direct relevance to chemical education Contributions can take the form of full papers, preliminary communications, perspectives on methodological and other issues of research and/or practice, reviews, letters relating to articles published and other issues, and brief reports on new and original approaches to the teaching of a specific topic or concept. The new journal welcomes contributions of the type described above; these should be sent to [email protected].

Chemistry Education Research and Practice Editorial Board: Norman Reid (Chair, UK) George Bodner, (USA) Stephen Breuer (UK) Alain Dumon (France) Ingo Eilks (Germany) Odilla Finlayson (Ireland) Onno de Jong (Netherlands) Georgios Tsaparlis (Greece) International Advisory Panel Liberato Cardellini (Italy) Peter Childs (Eire) Jan van Driel (Netherlands) Michael Gagan (UK) Iwona Maciejowska (Poland) Peter Mahaffy (Canada) Mansoor Niaz (Venezuela) Arlene Russell (USA) Laszlo Szepes (Hungary) Keith Taber (UK) David Treagust (Australia) Uri Zoller (Israel)

Chemistry Education Research and Practice Guidelines for Authors Submission of contributions Chemistry Education Research and Practice (CERP) is the journal for teachers, researchers and other practitioners in chemical education. It is published free of charge, electronically, by The Royal Society of Chemistry, four times a year. It is the place to publish papers on:
● research, and reviews of research in chemical education;
● effective practice in the teaching of chemistry;
● in depth analyses of issues of direct relevance to chemical education
Contributions can take the form of full papers, preliminary communications, perspectives on methodological and other issues of research and/or practice, reviews, letters relating to articles published and other issues, and brief reports on new and original approaches to the teaching of a specific topic or concept.
1. The original contribution should be submitted electronically, preferably in Word for Windows format. Any associated diagrams should be attached in JPG or GIF format, if possible. Submissions should be made by e-mail as a file attachment to [email protected], or directly to the editors: Stephen Breuer at [email protected] or to Georgios Tsaparlis ([email protected]).
2. Submitted contributions are expected to fall into one of several categories (listed above).
Authors are invited to suggest the category into which the work should best fit, but the editors reserve the right to assign it to a different category if that seems appropriate.
A word count (excluding references, tables, legends etc) should be included at the end of
the document. 3. Presentation should be uniform throughout the article.
Text should be typed in 12pt Times New Roman (or similar), with 1"/ 2.5 cm margins, double-spaced, unjustified, ranged left and not hyphenated.
Always use an appropriate mix of upper and lower case letters: do not type words in
uppercase letters either in the text or in headings. Bold or italic text and not upper case letters should be used for emphasis.
All nomenclature and units should comply with IUPAC conventions.
Tables and figures should be numbered consecutively as they are referred to in the text (use a separate sequence of numbers for tables and for figures). Each should have an informative title and may have a legend.

Equations should be written into the text using the word processing program, either as
normal text or using the program’s equation facility. Structures should, wherever possible, be treated as a figure and not incorporated into text. References should be given by the name of the author (or the first author, if more than
one), followed by the year of publication. If an author has more than one reference from the same year, then it should be given as Smith 2001a, Smith 2001b, etc.
Footnotes should be generally avoided and important additional information may be
referenced and included in the reference list. 4. A title page must be provided, comprising:
• an informative title; • authors’ names and affiliation, full postal address and e-mail; (in the case of multi-
authored papers, use an asterisk to indicate one author for correspondence, and superscript a, b, etc. to indicate the associated addresses);
• an abstract of not more than 200 words; • keywords identifying the main topics covered in the paper
5. Wherever possible articles should be subsectioned with headings, subheadings and sub-
sub-headings. Do not go lower than sub-sub-headings. Sections should not be numbered. The introduction should set the context for the work to be described; include references
to previous related work, and outline the educational objectives. A concluding section (which need not be headed conclusion) will include an evaluation
of the extent to which educational objectives have been met. A subjective evaluation may be acceptable.
6. The formatting of references should follow the following practice: Books and Special Publications: Author A., (year), Title of the book italicized, Publisher, Place of publication, page no. if
applicable. Journal Articles: Author A., Author B. and Author C., (year), Title of the article in Roman type, Full
Name of the Journal Italicised, Volume no. in Bold, inclusive page numbers. For example: Osborne R. and Freyberg P., (1985), Learning in science: the implication of children’s
science, Heinemann, London. Jackman L.E. and Moellenberg W., (1987), Evaluation of three instructional methods for
teaching general chemistry, Journal of Chemical Education, 64, 794-96. 7. All contributions submitted will be refereed anonymously by two independent referees.
In case of a disagreement a third referee will be consulted. The decision of the Editors on

the acceptance of articles is final. 8. Authors grant CERP the exclusive right to publish articles. They undertake that their
article is their original work, and does not infringe the copyright of any other person, or otherwise break any obligation to, or interfere with the rights of such a person, and that it contains nothing defamatory.
9. Articles will be published on the Web in PDF format.
Educational research
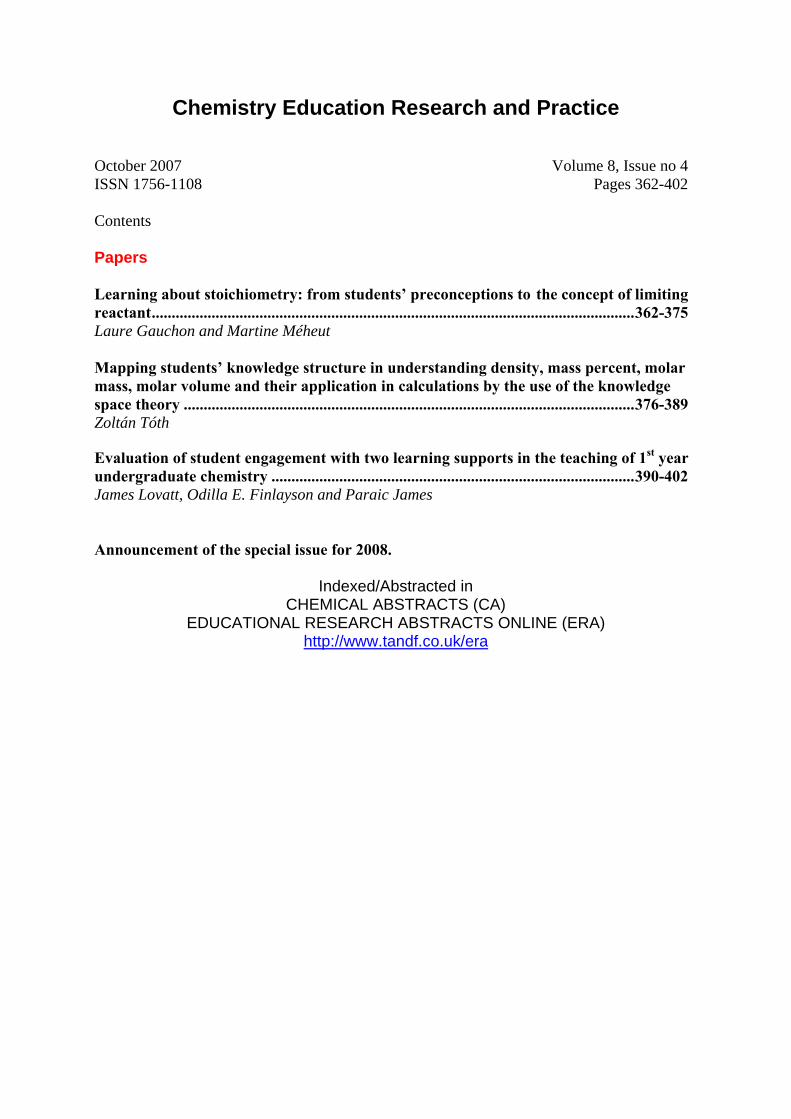
Learning about stoichiometry: from students’ preconceptions to
the concept of limiting reactant Laure Gauchona and Martine Méheutb* aLycée Ferdinand Buisson, Voiron, France, bIUFM de Créteil, France, LDSP, Paris 7 University, Case 7086, Campus Rive Gauche, 75205 Paris Cedex 13 e-mail: <[email protected]> Received 14 June 2007, accepted 15 September 2007 Abstract: We have studied students’ previous conceptions and the effects of the usual teaching
about the concept of limiting reactant. Previous work revealed two apparently contradictory conceptions held by students: both reactants are totally converted at the end of the transformation whatever the proportions, and only one reactant is converted whatever the proportions, with an active agent/passive object representation. We examined students’ explanations about various experimental problems to see whether one kind of problem leads preferentially to one conception or the other. We investigated grade 10 students at the beginning and at the end of the school year in order to study the impact of teaching stoichiometry on students’ conceptions. The results show that the conception both reactants are totally converted is quite strong in those problems where reactants are in the same physical state, and is more in competition with the conception: only one reactant is totally converted when the reactants are in a different physical state. It seems that teaching has little effect on wrong answers, but mainly leads to a shift from no answers to good answers. [Chem. Educ. Res. Pract., 2007, 8 (4), 362-375.]
Keywords: stoichiometry, chemical change, chemical reaction, limiting reactant, students’
conceptions, teaching effects. Introduction This paper deals with the construction of notions of stoichiometry. Many papers (Frazer
and Servant, 1986, 1987; Schmidt, 1990; Huddle and Pillay, 1996; Boujaoude and Barakat, 2000; Arasasingham et al., 2004) explored students’ difficulties in solving stoichiometric problems. Moreover, Stamovlasis et al. (2004, 2005) demonstrated that competence in algorithmic problem solving is independent of competence in conceptual questions. These results demonstrate the limits of usual teaching of stoichiometry through the use of formulas and algorithms.
According to the “Ingenierie Didactique” framework (Artigue 1988), in order to elaborate fruitful teaching strategies, different types of a priori analyses are needed, which include the analysis of students’ conceptions, their difficulties in understanding, and the analysis of the effect of the usual teaching on students’ conceptual development.
We can find similar preoccupations in the “Educational Reconstruction” framework (Duit, 2005). In this framework, great importance is given to the analysis of the referent scientific knowledge, and to the students’ conceptions in the process of educational reconstruction.
Understanding the notion of limiting reactant or surplus of reactant can be considered as a basic step in understanding stoichiometry. It is part of the meaning of the concept of
Chemistry Education Research and Practice, 2007, 8 (4), 362-375.
This journal is © The Royal Society of Chemistry

L. Gauchon and M. Méheut 363
chemical change and it is part of the distinction between chemical change and physical transformations, what research about conceptions demonstrates to be a significant step towards the understanding of chemical change (Méheut et al., 1985; Stavridou and Solomonidou, 1989; Andersson, 1990; Tsaparlis, 2003). In such a prospect, we are interested in studying students’ previous conceptions and the effect of the usual teaching about the notion of limiting reactant.
Students’ difficulties with stoichiometry Difficulties in learning about stoichiometry In an investigation involving French grade 10 students, Laugier and Dumon (2000)
analyzed students’ answers during a teaching sequence concerning reactions between two solutions: sodium hydroxide and copper sulphate. They reported that 88% of the students thought that there are neither copper ions nor hydroxide ions left at the end. For these students, all the ions have reacted; they didn’t envisage a possible surplus of a reactant in such a case. In a previous study using questionnaires about limiting reactants (Gauchon 2002), we found that 68% of the students (grade 10 or later) say that the reaction between chalk and hydrochloric acid solution stops when there is no more chalk, whatever the quantities of chalk and hydrochloric acid. So, it seems that when beginning to learn about chemical reactions, students explain and interpret the final state of a chemical change in different ways, depending on experimental situations.
Frazer and Servant’s study (1987) underlined another level of understanding among first year university students. They noted that students can be inclined to use a ratio equal to one between the amounts of matter of reactants whatever the transformations. It seems that these students have developed some idea of proportion between reactants but they can’t consider any other ratio but one. Is this only due to the incapacity to use another ratio or is this linked with previous conceptions about chemical changes?
These examples suggest different levels of understanding of stoichiometry. It seems that this notion needs to be built step by step, probably against strongly established conceptions.
Problems with reactant ratios Laugier and Dumon (2000) showed that when students feel the need to take into account
proportions in a chemical change, another difficulty may appear. Spontaneously, they think of ‘appropriate’ volumes or ‘appropriate’ masses. They have to understand that the quantities to be taken into account are amounts of matter that implies the use of the mole concept.
Frazer and Servant (1986, 1987) noted that even among first year university students, a lot of mistakes in problem solving are due to confusion between different chemical quantities. Concentration, mass or volume are often used instead of the amount of matter. Frazer and Servant’s observations are similar to some of Schmidt’s research results (1990); he found that many students failed to establish relationships between different variables (amount of substance, mass, molar mass …).
Stoichiometry and balancing equations In their study, Frazer and Servant (1986, 1987) noted that 27% of students succeeded in
solving stoichiometric problems, and 22% (of the total) interpreted and correctly used balanced equations, inferring that successfully writing a balanced equation and in interpreting correctly stoichiometric coefficients provides the basis of success in solving problems.
Other pieces of research reported difficulties in correctly interpreting a balanced equation. The different representational levels included in a balanced equation are very difficult to distinguish for students. For example, grade 10 students (Laugier and Dumon,
Chemistry Education Research and Practice, 2007, 8 (4), 362-375.
This journal is © The Royal Society of Chemistry
L. Gauchon and M. Méheut 364
2000) found it hard to understand that just one script, the balanced equation, can represent many experimental situations. Thus, at the end of a chemical change, students are surprised to find compounds that do not appear in the right hand side of the balanced equation.
The authors of the French chemistry curriculum for upper secondary schools also warned teachers that some students consider that chemical equations imply the use of stoichiometric quantities of reactants only (Ministère, 2000). Moreover, they stress that balanced equations may make students interpret chemical equation at a microscopic level only.
Limiting reactant and surplus of reactant According to research results, success in solving stoichiometry problems is very low
when reactants are mixed in any proportion. Identifying the limiting reactant appears to be a major obstacle. Thus, Arasasingham et al. (2004) demonstrated that the students have great difficulty determining the final state of a system from the initial composition using the chemical equation, whatever the proposed method: algorithmic or using symbolic representations. Boujaoude and Barakat (2000) reported that the students chose the limiting reactant randomly, without really justifying their choice. For example, they chose the one whose ‘amount of matter’ is given in the question, or the one whose mass is given, or from a comparison between the different molar masses.
Huddle and Pillay (1996) reported more systematic mistakes. A few students claimed that the limiting reactant is the compound with the smallest stoichiometric coefficient in the balanced equation. Other students decided that the limiting reactant is the one whose ‘amount of matter’ is the smallest. One student even wrote: “limiting reactant = least number of moles”. We suppose that these students generalize from the case of an equimolar reaction; such thinking can be reinforced by the teaching, when using an algorithmic approach to stoichiometry in particular cases such as equimolar reactions.
Context of the study Our research took place at the beginning of the teaching of chemical changes in French
secondary schools (grade 10). In the French chemistry curriculum, a chemical change is defined as the evolution of a chemical system from an initial state to a final state. At grade 10, only complete chemical changes are considered. In the final state one reactant at least is missing: the limiting reactant. In this approach, the chemical reaction is presented as a model, symbolized by a balanced equation. Using a general account of modelling, as presented for example by Tiberghien et al. (1995), or a more specific one, as presented by Kermen (2005), we can analyse this part of grade 10 French chemistry curriculum content as follows (Figure 1)
Chemistry Education Research and Practice, 2007, 8 (4), 362-375.
This journal is © The Royal Society of Chemistry
L. Gauchon and M. Méheut 365
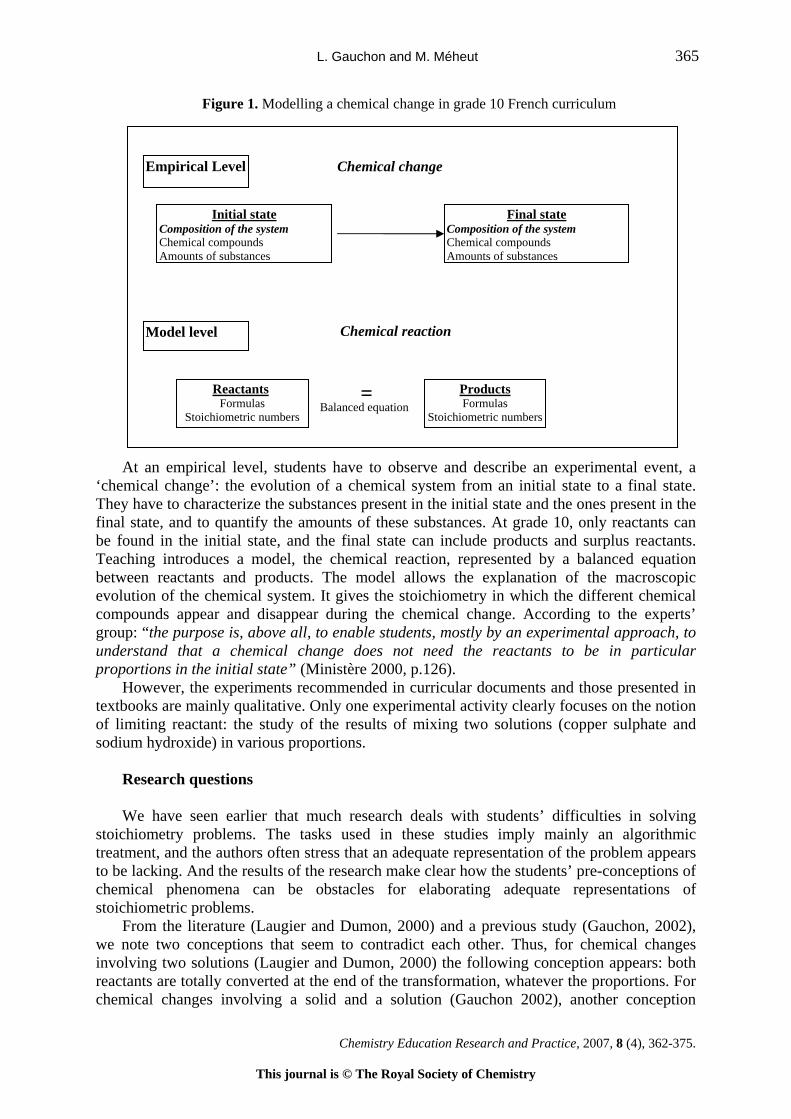
Figure 1. Modelling a chemical change in grade 10 French curriculum
Chemical changeEmpirical Level
Initial state Final state Composition of the system Composition of the system Chemical compounds
At an empirical level, students have to observe and describe an experimental event, a
‘chemical change’: the evolution of a chemical system from an initial state to a final state. They have to characterize the substances present in the initial state and the ones present in the final state, and to quantify the amounts of these substances. At grade 10, only reactants can be found in the initial state, and the final state can include products and surplus reactants. Teaching introduces a model, the chemical reaction, represented by a balanced equation between reactants and products. The model allows the explanation of the macroscopic evolution of the chemical system. It gives the stoichiometry in which the different chemical compounds appear and disappear during the chemical change. According to the experts’ group: “the purpose is, above all, to enable students, mostly by an experimental approach, to understand that a chemical change does not need the reactants to be in particular proportions in the initial state” (Ministère 2000, p.126).
However, the experiments recommended in curricular documents and those presented in textbooks are mainly qualitative. Only one experimental activity clearly focuses on the notion of limiting reactant: the study of the results of mixing two solutions (copper sulphate and sodium hydroxide) in various proportions.
Research questions We have seen earlier that much research deals with students’ difficulties in solving
stoichiometry problems. The tasks used in these studies imply mainly an algorithmic treatment, and the authors often stress that an adequate representation of the problem appears to be lacking. And the results of the research make clear how the students’ pre-conceptions of chemical phenomena can be obstacles for elaborating adequate representations of stoichiometric problems.
From the literature (Laugier and Dumon, 2000) and a previous study (Gauchon, 2002), we note two conceptions that seem to contradict each other. Thus, for chemical changes involving two solutions (Laugier and Dumon, 2000) the following conception appears: both reactants are totally converted at the end of the transformation, whatever the proportions. For chemical changes involving a solid and a solution (Gauchon 2002), another conception
Chemical reaction Model level
Amounts of substances Chemical compounds Amounts of substances
= Reactants Products Formulas Formulas Balanced equation
Stoichiometric numbers Stoichiometric numbers
Chemistry Education Research and Practice, 2007, 8 (4), 362-375.
This journal is © The Royal Society of Chemistry
L. Gauchon and M. Méheut 366
appears: only one reactant is totally converted, whatever the proportions, with an ‘active agent/passive object’ representation (Brosnan, 1990) and/or because of a physical transformation.
So we decided to examine student explanations of various situations: reactants in the same physical state, or reactants in different physical states. Further, we asked whether one kind of problem leads preferentially to one conception or the other. We investigated students at the beginning and at the end of grade 10 year in order to look at the impact of teaching on students’ conceptions.
Methodology Collecting data We used paper and pencil tests. We questioned students, before and after the teaching of
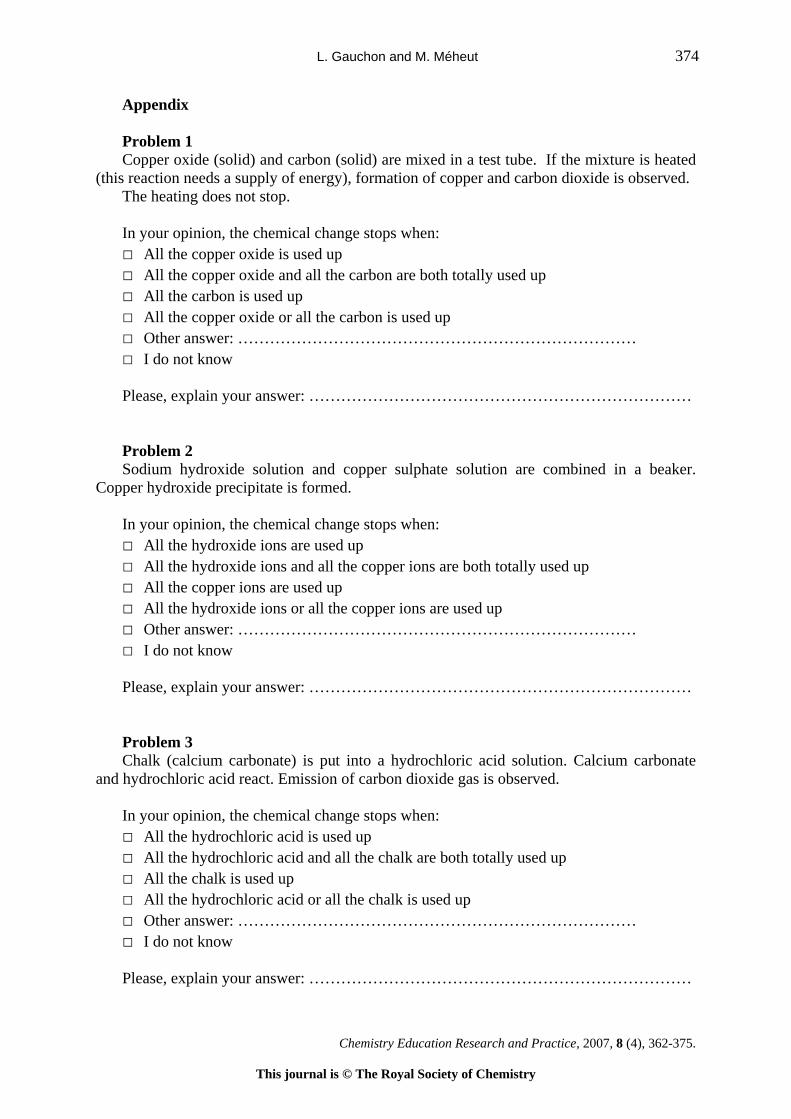
stoichiometry, about the composition of a chemical system at the end of a transformation in order to investigate the two conceptions described above. We investigated students’ understanding of four problems that are suggested in the French chemistry curriculum (grade 10).
Two problems involve reactants in the same physical state: Problem 1: copper oxide (solid) and carbon (solid); Problem 2: sodium hydroxide solution and copper sulphate solution. Two problems involve two reactants in different physical states: Problem 3: chalk (solid) and hydrochloric acid solution; Problem 4: iron (solid) and copper sulphate solution. The forms of the questions are given in the Appendix. The description of the situations reports observable events that students may note during
an experiment. A parallel work showed that giving more complete description of the experiments had no significant influence on the answers (Grisard, 2006).
The students had to answer multiple choice questions; the possible answers were devised from a previous enquiry with open questions (Gauchon 2002). We selected the most frequent answers; so the students had to choose from four options. Two answers favour one reactant; the third one mentions that both reactants are totally converted together; and the fourth one considers that one or the other reactant is totally converted at the end of the chemical change. A last heading called ‘other answer’ enables the students to develop their own answer if they wish. Moreover, the students had to justify their answers.
Samples We questioned 116 grade 10 students from four classes of a secondary school before they
have studied stoichiometry (58 about problems 1 and 3, 58 about problems 2 and 4). We questioned 177 grade 10 students, from six classes of another secondary school after they have studied stoichiometry (92 about problems 1 and 3, 85 about problems 2 and 4).
In each class, half of the students were questioned about problems 1 and 3 and half of them about problems 2 and 4. So there is no doubt about the equivalence of the populations when discussing the results. The conclusions about the effects of teaching will need to be treated with more caution. Both samples can be considered as reasonably representative of the average population of grade 10 French students, because they represent two similar ‘typical’ urban secondary schools in medium sized towns with catchment areas of similar socioeconomic status.
Chemistry Education Research and Practice, 2007, 8 (4), 362-375.
This journal is © The Royal Society of Chemistry
L. Gauchon and M. Méheut 367
Results
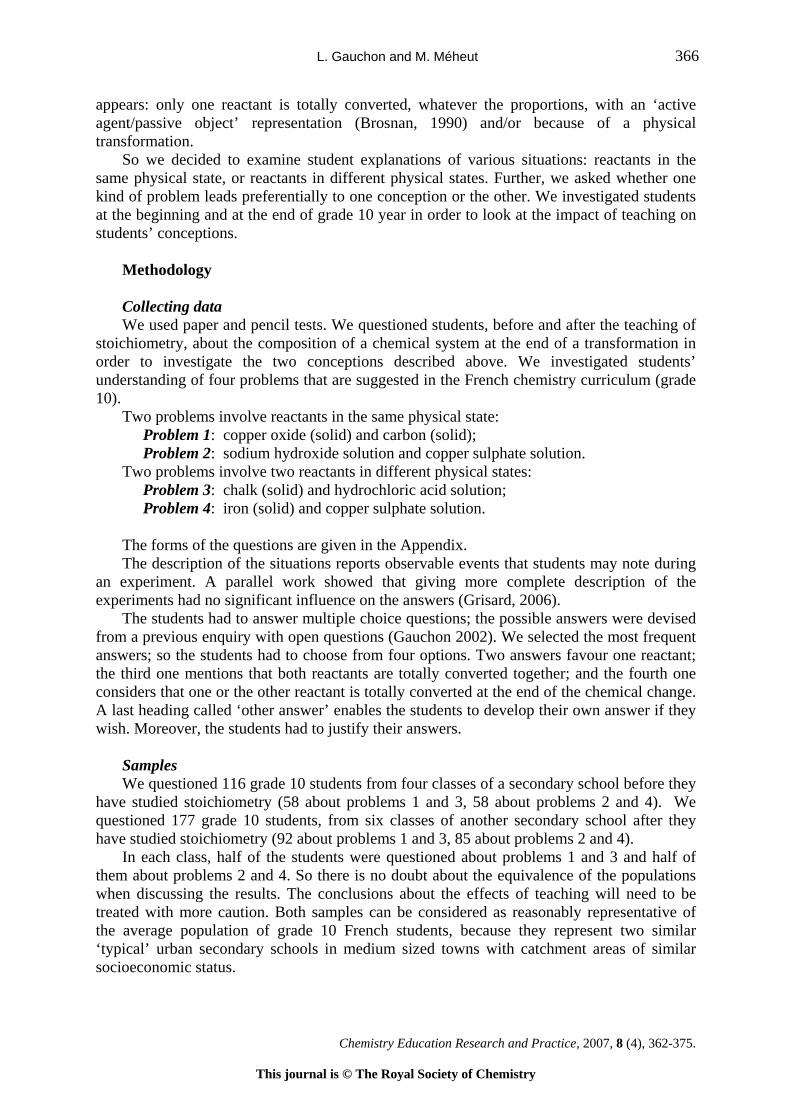
Table 1. Reactants in the same physical state: the distribution of answers.
Analysis of answers f
Type of answeronly one reactanboth reactants tlimiting reactanother answer do not know or nTotal
As Table 1 shows, beThe rates of good answernotion of limiting reactanobserve that the type of aselected and with similar reactant was converted” 20.5% (13.5% for copper
After teaching, the ra48% (problem 1) and 35%problems: 15% (8% for c11% for hydroxide ions) for the type “both reactathose problems in which t
As mentioned beforestudents (near half of tjustifications were muchanswer. Nonetheless, we
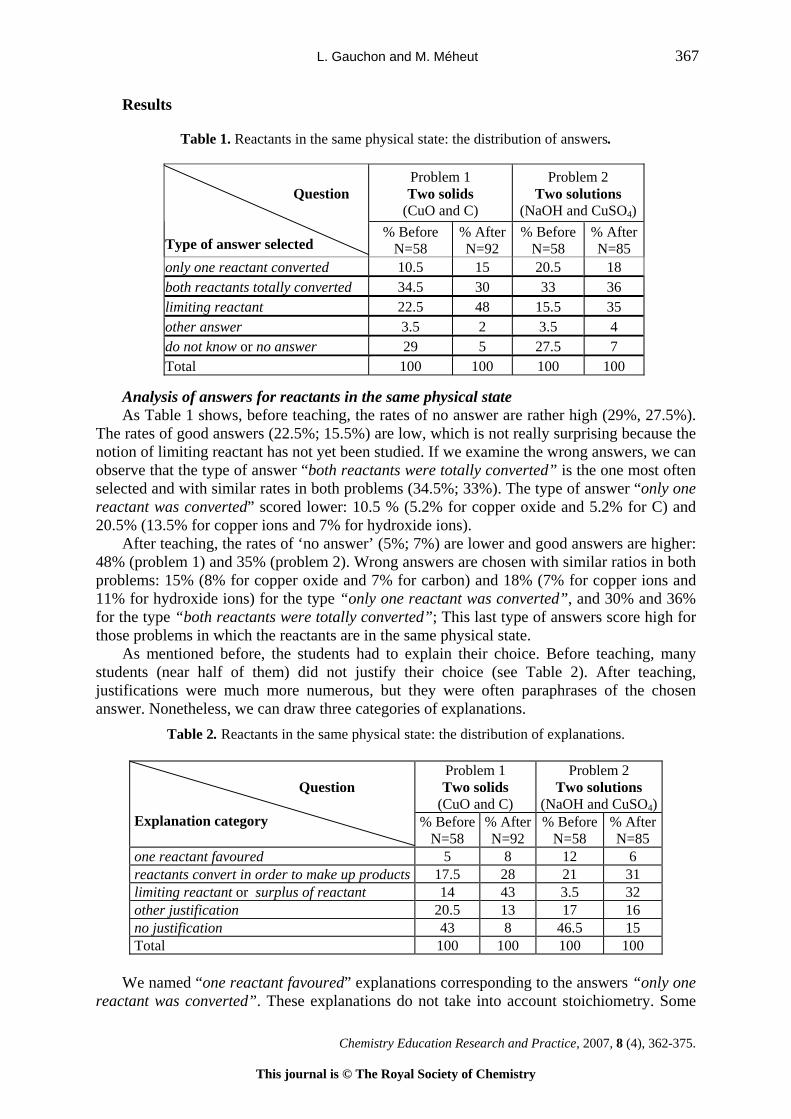
Table 2. Reacta
Explanation categor
one reactant favouredreactants convert in olimiting reactant or sother justification no justification Total
We named “one reac
reactant was converted”
T
Problem 1 Two solids
(CuO and C)
Problem 2 Two solutions
(NaOH and CuSO4)
Question
selected % Before
N=58 % AfterN=92
% Before N=58
% After N=85
t converted 10.5 15 20.5 18 otally converted 34.5 30 33 36 t 22.5 48 15.5 35
3.5 2 3.5 4 o answer 29 5 27.5 7
100 100 100 100
or reactants in the same physical state fore teaching, the rates of no answer are rather high (29%, 27.5%). s (22.5%; 15.5%) are low, which is not really surprising because the t has not yet been studied. If we examine the wrong answers, we can nswer “both reactants were totally converted” is the one most often rates in both problems (34.5%; 33%). The type of answer “only one scored lower: 10.5 % (5.2% for copper oxide and 5.2% for C) and ions and 7% for hydroxide ions). tes of ‘no answer’ (5%; 7%) are lower and good answers are higher: (problem 2). Wrong answers are chosen with similar ratios in both
opper oxide and 7% for carbon) and 18% (7% for copper ions and for the type “only one reactant was converted”, and 30% and 36% nts were totally converted”; This last type of answers score high for he reactants are in the same physical state. , the students had to explain their choice. Before teaching, many
hem) did not justify their choice (see Table 2). After teaching, more numerous, but they were often paraphrases of the chosen can draw three categories of explanations. nts in the same physical state: the distribution of explanations.
Problem 1 Two solids
(CuO and C)
Problem 2 Two solutions
(NaOH and CuSO4) Question
y % BeforeN=58
% AfterN=92
% Before N=58
% AfterN=85
5 8 12 6 rder to make up products 17.5 28 21 31 urplus of reactant 14 43 3.5 32
20.5 13 17 16 43 8 46.5 15 100 100 100 100
tant favoured” explanations corresponding to the answers “only one . These explanations do not take into account stoichiometry. Some
Chemistry Education Research and Practice, 2007, 8 (4), 362-375.
his journal is © The Royal Society of Chemistry
L. Gauchon and M. Méheut 368
imply a conception ‘passive object/active agent’, for example: “Because copper oxide transforms carbon”. Other explanations refer to physical changes or dissolution phenomena rather than chemical change: “Because copper sulphate dissolves in sodium hydroxide solution”
Kinds of explanations entitled “reactants change in order to generate products” are linked with answers “both reactants were totally converted”. Here are some examples of justifications: • “before the reaction stops , reactants need above all to generate products” • “[...]because both solids undergo a change”
Finally, the category of explanations limiting reactant or surplus of reactant is linked with answers limiting reactant. No reactant is favoured in these justifications. • “because there is obviously one limiting reactant and one in surplus.” • “a reaction stops when at least one of the reactants is missing”
Some of these justifications are quite comprehensive and mention the various possibilities • “If one compound is totally converted or if both compounds are converted together then
the reaction stops.” • “The reaction stops when one or both reactants disappear”
So the distribution of the explanations in the various categories fits well with the
distribution of the answers. We have also established that there is a strong coherence between answers and associated justifications.
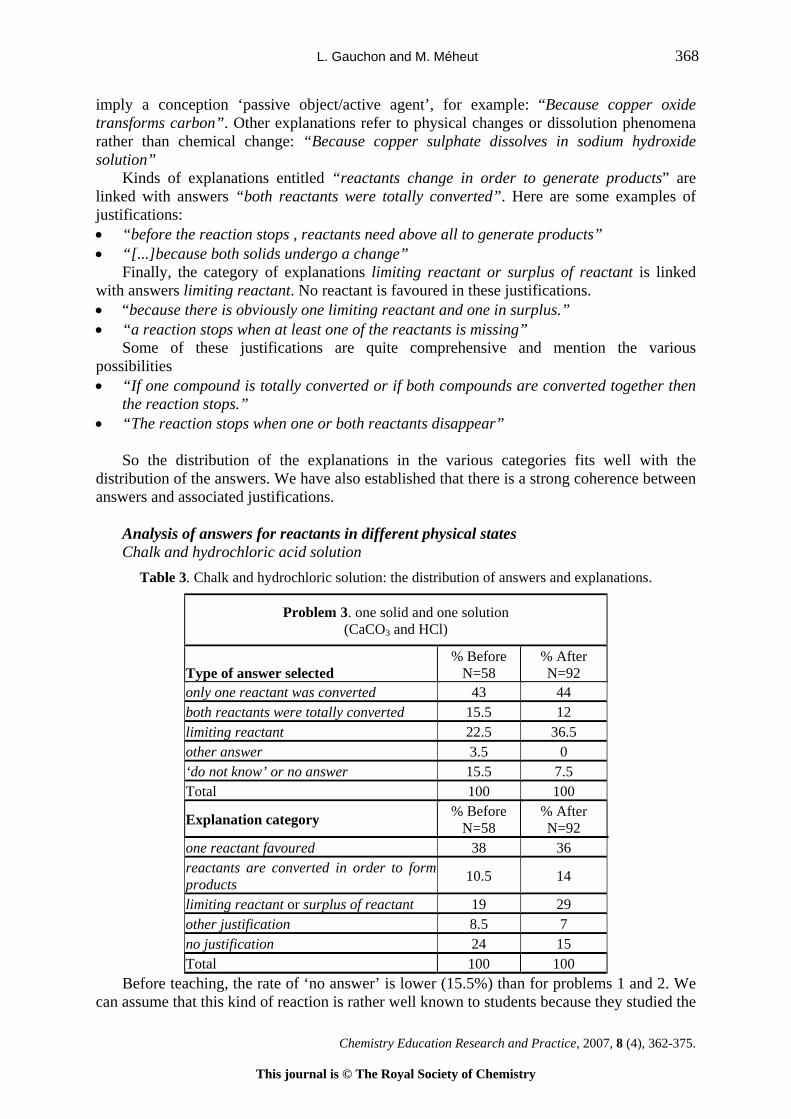
Analysis of answers for reactants in different physical states Chalk and hydrochloric acid solution
Table 3. Chalk and hydrochloric solution: the distribution of answers and explanations.
Problem 3. one solid and one solution (CaCO3 and HCl)
Type of answer selected
% Before N=58
% After N=92
only one reactant was converted 43 44 both reactants were totally converted 15.5 12 limiting reactant 22.5 36.5 other answer 3.5 0 ‘do not know’ or no answer 15.5 7.5 Total 100 100
Explanation category % Before N=58
% After N=92
one reactant favoured 38 36 reactants are converted in order to form products 10.5 14
limiting reactant or surplus of reactant 19 29 other justification 8.5 7 no justification 24 15 Total 100 100
Before teaching, the rate of ‘no answer’ is lower (15.5%) than for problems 1 and 2. We can assume that this kind of reaction is rather well known to students because they studied the
Chemistry Education Research and Practice, 2007, 8 (4), 362-375.
This journal is © The Royal Society of Chemistry

L. Gauchon and M. Méheut 369
reactions between hydrochloric solution and various materials in grade 9. But the score of good answers is low too (22.5%). If we have a look at the wrong answers, the type ‘only one reactant was converted’ represented 43% of the answers, of these 36% chose chalk and 7% chose hydrochloric acid.
After the teaching of stoichiometry the rate of good answers (36.5%) was higher than before. The type of answer “only one reactant was converted” was given by 44%, and chalk was named in 32.5% of the answers. Thus, in this case, many students identified the absence of the solid reactant in order to explain the end of the transformation. Their justifications often indicated an ‘active agent/passive object’ representation. For example: “hydrochloric acid solution eats away chalk”. We could also observe that a few students do not see the chemical system evolution as a chemical change but rather as a dissolving phenomenon or as a physical change: “[the reaction] stops when chalk disappears from its solid state”; “as we know, chalk melts”.
Iron and copper sulphate solution Before teaching, the rate of ‘no answer’ is important (19%) and good answers are low
(17.5%). If we have a look at wrong answers, the type “both reactants were totally converted” was predominant with 34.5%, unlike with problem 3. The type “only one reactant was converted” appeared with 24%, including 19% identifying iron. Table 4. Reactants in different physical states (iron and copper sulphate solution); the distribution of
answers and explanations.
Problem 4: Reaction between solid and solution (Fe and CuSO4)
Type of answer selected % Before N=58
% After N=85
only one reactant was converted 24 34 both reactants were totally converted 34.5 23.5 limiting reactant 17.5 38 other answers 5 0 ‘I do not know’ or no answer 19 4.5 Total 100 100
Explanation category % Before N=58
% After N=85
one reactant is favoured 12 27 reactants are converted in order to form products 15.5 17
limiting reactant or surplus of reactant 15.5 27 other justification 17.5 10 no justification 39.5 18 Total 100 100
After the teaching of stoichiometry, the rate of good answers (38%) was higher than
before. With regard to wrong answers, the category “only one reactant was converted” was predominant with 34%, preferentially iron (about 26%); In this case again, the lack of solid was favoured. The explanations were similar to those reported in the situation with chalk. For
Chemistry Education Research and Practice, 2007, 8 (4), 362-375.
This journal is © The Royal Society of Chemistry
L. Gauchon and M. Méheut 370
example, one student explained “a solid often dissolves in a liquid until it disappears”. The category “both reactants were totally converted” appears with 23.5%.
Discussion As argued previously, both samples (before and after teaching) can be considered as
representative of the average population of grade 10 French students. Moreover, teaching contents and activities are very precisely defined by curricular documents and school books, so differences between schools are small. That is why, in our opinion, differences between ‘before’ and ‘after’ results can be attributed to the effects of teaching. Nevertheless, these results should be considered as preliminary, to be confirmed by further investigations in France and in other countries; this would allow the assessment of their general value and to identify possible effects of different ways of teaching this subject.
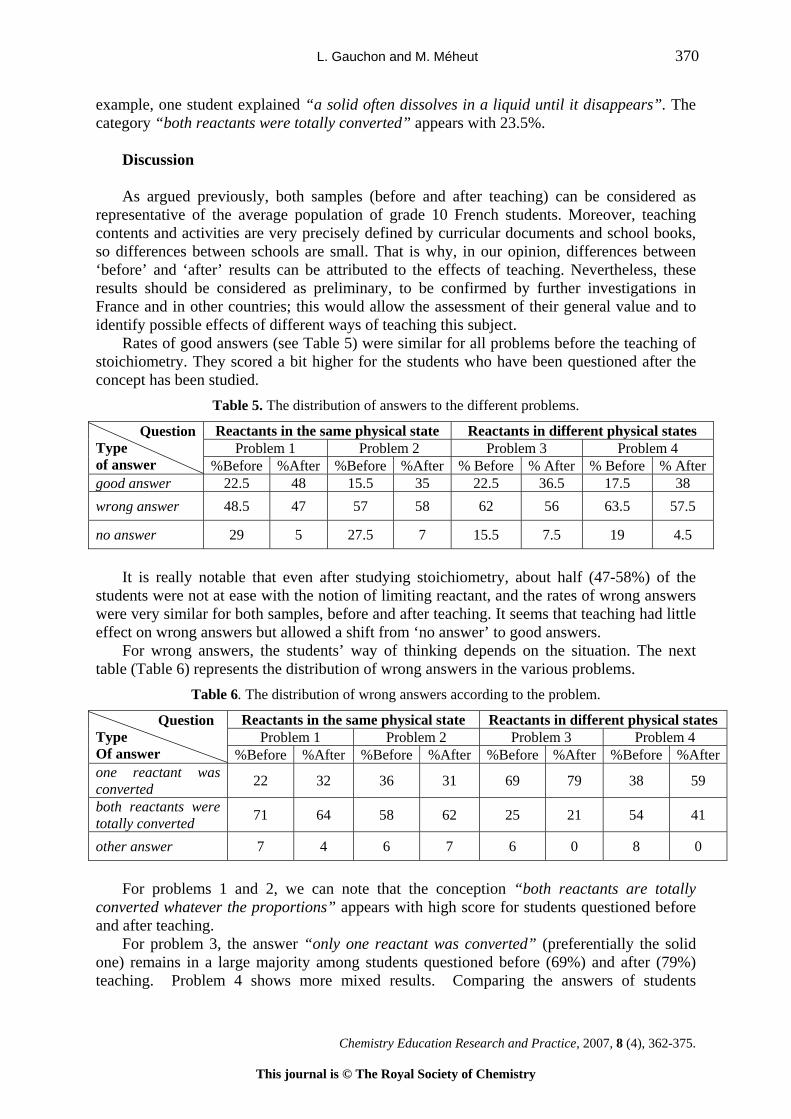
Rates of good answers (see Table 5) were similar for all problems before the teaching of stoichiometry. They scored a bit higher for the students who have been questioned after the concept has been studied.
Table 5. The distribution of answers to the different problems.
Reactants in the same physical state Reactants in different physical states Problem 1 Problem 2 Problem 3 Problem 4
Question Type of answer %Before %After %Before %After % Before % After % Before % Aftergood answer 22.5 48 15.5 35 22.5 36.5 17.5 38 wrong answer 48.5 47 57 58 62 56 63.5 57.5
no answer 29 5 27.5 7 15.5 7.5 19 4.5
It is really notable that even after studying stoichiometry, about half (47-58%) of the
students were not at ease with the notion of limiting reactant, and the rates of wrong answers were very similar for both samples, before and after teaching. It seems that teaching had little effect on wrong answers but allowed a shift from ‘no answer’ to good answers.
For wrong answers, the students’ way of thinking depends on the situation. The next table (Table 6) represents the distribution of wrong answers in the various problems.
Table 6. The distribution of wrong answers according to the problem. Reactants in the same physical state Reactants in different physical states
Problem 1 Problem 2 Problem 3 Problem 4 Question Type Of answer %Before %After %Before %After %Before %After %Before %Afterone reactant was converted 22 32 36 31 69 79 38 59
both reactants were totally converted 71 64 58 62 25 21 54 41
other answer 7 4 6 7 6 0 8 0
For problems 1 and 2, we can note that the conception “both reactants are totally
converted whatever the proportions” appears with high score for students questioned before and after teaching.
For problem 3, the answer “only one reactant was converted” (preferentially the solid one) remains in a large majority among students questioned before (69%) and after (79%) teaching. Problem 4 shows more mixed results. Comparing the answers of students
Chemistry Education Research and Practice, 2007, 8 (4), 362-375.
This journal is © The Royal Society of Chemistry
L. Gauchon and M. Méheut 371
questioned after and before teaching, we can see fewer answers of the type “both reactants are totally converted” and more of the type “only one reactant disappeared”.
For both reactions between the compounds in the same physical state, the conception “both reactants are totally converted” clearly emerges. From this point of view, we note some quite interesting sentences: “The end of the reaction is shown by the change of both reactants, indeed, two products already transformed can not transform again” “[...] because in the mixture, we mix copper sulphate with sodium hydroxide solution. Thus all the ions react because they are all reactants.”; “They (Cu2+ and OH–) are reactants then when they react together, they change into copper hydroxide”
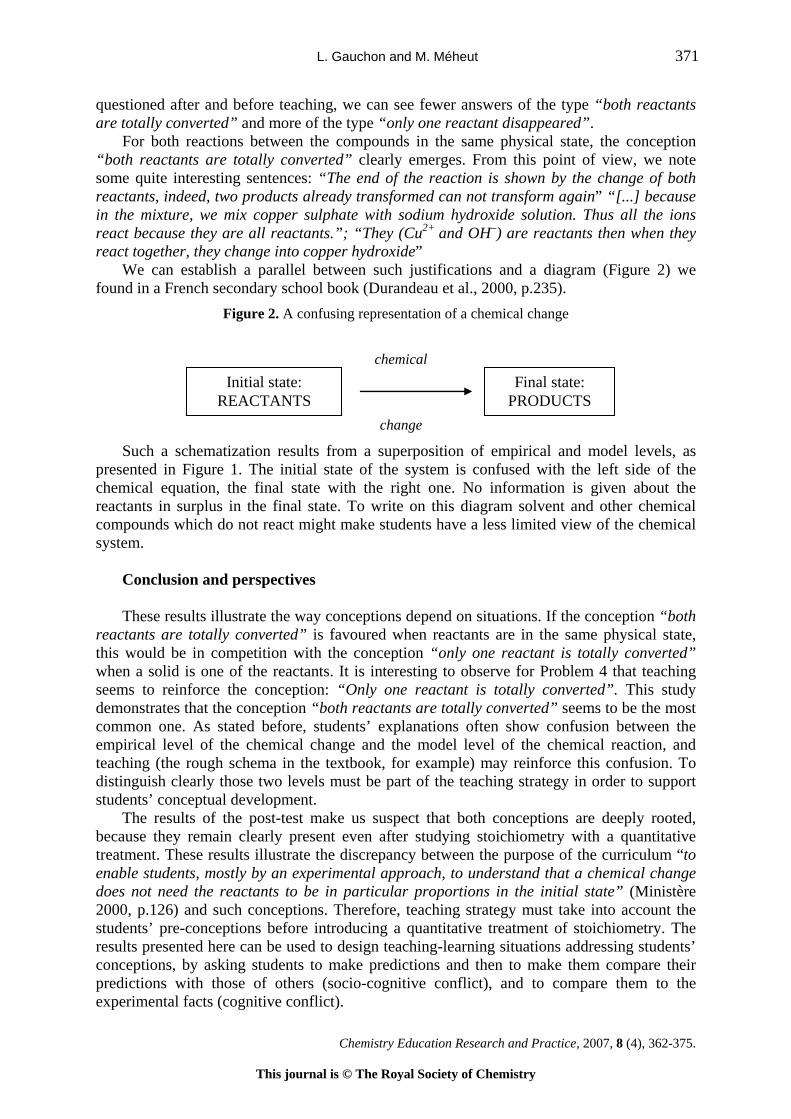
We can establish a parallel between such justifications and a diagram (Figure 2) we found in a French secondary school book (Durandeau et al., 2000, p.235).
Figure 2. A confusing representation of a chemical change
Such a schematization results from a superposition of empirical and model levels, as presented in Figure 1. The initial state of the system is confused with the left side of the chemical equation, the final state with the right one. No information is given about the reactants in surplus in the final state. To write on this diagram solvent and other chemical compounds which do not react might make students have a less limited view of the chemical system.
chemical Final state:
PRODUCTS Initial state:
REACTANTS
change
Conclusion and perspectives These results illustrate the way conceptions depend on situations. If the conception “both
reactants are totally converted” is favoured when reactants are in the same physical state, this would be in competition with the conception “only one reactant is totally converted” when a solid is one of the reactants. It is interesting to observe for Problem 4 that teaching seems to reinforce the conception: “Only one reactant is totally converted”. This study demonstrates that the conception “both reactants are totally converted” seems to be the most common one. As stated before, students’ explanations often show confusion between the empirical level of the chemical change and the model level of the chemical reaction, and teaching (the rough schema in the textbook, for example) may reinforce this confusion. To distinguish clearly those two levels must be part of the teaching strategy in order to support students’ conceptual development.
The results of the post-test make us suspect that both conceptions are deeply rooted, because they remain clearly present even after studying stoichiometry with a quantitative treatment. These results illustrate the discrepancy between the purpose of the curriculum “to enable students, mostly by an experimental approach, to understand that a chemical change does not need the reactants to be in particular proportions in the initial state” (Ministère 2000, p.126) and such conceptions. Therefore, teaching strategy must take into account the students’ pre-conceptions before introducing a quantitative treatment of stoichiometry. The results presented here can be used to design teaching-learning situations addressing students’ conceptions, by asking students to make predictions and then to make them compare their predictions with those of others (socio-cognitive conflict), and to compare them to the experimental facts (cognitive conflict).
Chemistry Education Research and Practice, 2007, 8 (4), 362-375.
This journal is © The Royal Society of Chemistry
L. Gauchon and M. Méheut 372
The results appear to show that teaching has little effect on wrong answers but mainly allows a shift from ‘no answer’ to good answers. Piaget’s theory proposes two kinds of situations favouring the evolution of cognitive structures: contradictions and gaps (Piaget 1975). Here, it seems that usual teaching doesn’t bring to the surface students’ conceptions, so these conceptions are not modified, but it does allow students who ‘didn’t know’ to adopt a correct conception. This hypothesis has to be confirmed by further studies.
References
Andersson B.R., (1990), Pupils’ conceptions of matter and its transformations (age 12-16) Studies in Science Education, 18, 53-85.
Arasasingham R.D., Taagepera M., Potter F. and Lonjers S., (2004), Using knowledge space theory to access student understanding of stoichiometry, Journal of Chemical Education, 81, 1517-1523.
Artigue M., (1988), Ingénierie didactique, Recherches en didactique des Mathématiques, 9, 281-308. Boujaoude S. and Barakat H., (2000), Secondary school students’ difficulties with stoichiometry,
School Science Review, 81 (296), 91-98. Brosnan T., (1990), Categorising macro and micro explanations of material change, in P.-L. Lijnse, P.
Licht, W. de Vos and A.-J. Waarlo (Eds), Relating macroscopic phenomena to microscopic particles, CDβ Press, Utrecht, 198-212.
Davous D., Feore M.C., Fort L., Lévêque T., Mauhourat M.B., Perchard J.P. and Jullien L., (1999), Transformation chimique d’un système, le modèle de la réaction chimique, Bulletin de l’Union des Physiciens, 93, 1-35.
Duit R., Gropengieβer H. and Kattmann U., (2005), Towards science education research that is relevant for improving practice: the model of educational reconstruction. In H.E. Fischer (Ed.) Developing standards in research on science education, pp. 1-10, Taylor and Francis, Leiden.
Durandeau J.P., Duruphty A., Bramand P., Duruphty O., Fanguet M., Fanguet R., Faye P., Giacino M., Jaubert A., Martegoutes R., Sahun R. and Thomassier G., (2000), Physique-Chimie 2nde, Hachette, Paris.
Frazer M.J. and Servant D., (1986), Aspects of stoichiometry titration calculations, Education in Chemistry, 23, 54-56.
Frazer M.J. and Servant D., (1987), Aspects of stoichiometry, where do students go wrong? Education in Chemistry, 24, 73-75.
Gauchon L., (2002), Etude des conceptions d’élèves à propos de la notion de réactif limitant, unpublished Master Dissertation, Université Paris 7.
Grisard E., (2006), Conceptions des transformations chimiques, unpublished Master Dissertation, Université Paris 7.
Huddle P.A. and Pillay A.E., (1996), An in-depth study of misconceptions in stoichiometry and chemical equilibrium at a South African university, Journal of Research in Science Teaching, 33, 65-77.
Kermen I., (2005), Investigating students’ and teachers’ reactions to a curriculum on the evolution of a chemical system, In H.E. Fischer (Ed.) Developing standards in research on science education, pp. 131-137,. Taylor and Francis, Leiden.
Laugier A. and Dumon A., (2000), Travaux pratiques en chimie et représentation de la réaction chimique par l’équation-bilan dans les registres macroscopique et microscopique : une étude en classe de seconde (15-16ans), Chemistry Education: Research and Practice, 1, 61-75.
Méheut M., Saltiel E. and Tiberghien A., (1985), Pupils’ (11-12 year olds) conceptions of combustion, European Journal of Science Education, 7, 83-93.
Ministère de l’Education Nationale, (2000), Accompagnement de programme, Chimie, Classe de seconde, CNDP, Paris.
Piaget J., (1975), L’équilibration des structures cognitives, PUF, Paris. Schmidt H.-J., (1990), Secondary school students’ strategies in stoichiometry, International Journal
of Science Education, 12, 457-471.
Chemistry Education Research and Practice, 2007, 8 (4), 362-375.
This journal is © The Royal Society of Chemistry

L. Gauchon and M. Méheut 373
Stamovlasis D., Tsaparlis G., Kamilatos C., Papaoikonomou D. and Zarotiadou E., (2004), Conceptual understanding versus algorithmic problem solving: a principal component analysis of a national examination, The Chemical Educator, 9, 398-405.
Stamovlasis D., Tsaparlis G., Kamilatos C., Papaoikonomou D. and Zarotiadou E., (2005), Conceptual understanding versus algorithmic problem solving: further evidence from a national chemistry examination, Chemistry Education Research and Practice, 6, 104-118.
Stavridou H. and Solomonidou C., (1989), Physical phenomena – chemical phenomena: do pupils make the distinction? International Journal of Science Education, 11, 83-92.
Tiberghien A., Psillos D. and Koumaras P., (1995), Physics instruction from epistemological and didactical basis, Instructional Science, 22, 423-444.
Tsaparlis G., (2003), Chemical phenomena versus chemical reactions: do students make the connection? Chemistry Education Research and Practice, 4, 31-43.
Chemistry Education Research and Practice, 2007, 8 (4), 362-375.
This journal is © The Royal Society of Chemistry
L. Gauchon and M. Méheut 374
Appendix Problem 1 Copper oxide (solid) and carbon (solid) are mixed in a test tube. If the mixture is heated
(this reaction needs a supply of energy), formation of copper and carbon dioxide is observed. The heating does not stop. In your opinion, the chemical change stops when: □ All the copper oxide is used up □ All the copper oxide and all the carbon are both totally used up □ All the carbon is used up □ All the copper oxide or all the carbon is used up □ Other answer: ………………………………………………………………… □ I do not know Please, explain your answer: ……………………………………………………………… Problem 2 Sodium hydroxide solution and copper sulphate solution are combined in a beaker.
Copper hydroxide precipitate is formed. In your opinion, the chemical change stops when: □ All the hydroxide ions are used up □ All the hydroxide ions and all the copper ions are both totally used up □ All the copper ions are used up □ All the hydroxide ions or all the copper ions are used up □ Other answer: ………………………………………………………………… □ I do not know Please, explain your answer: ……………………………………………………………… Problem 3 Chalk (calcium carbonate) is put into a hydrochloric acid solution. Calcium carbonate
and hydrochloric acid react. Emission of carbon dioxide gas is observed. In your opinion, the chemical change stops when: □ All the hydrochloric acid is used up □ All the hydrochloric acid and all the chalk are both totally used up □ All the chalk is used up □ All the hydrochloric acid or all the chalk is used up □ Other answer: ………………………………………………………………… □ I do not know Please, explain your answer: ………………………………………………………………
Chemistry Education Research and Practice, 2007, 8 (4), 362-375.
This journal is © The Royal Society of Chemistry
L. Gauchon and M. Méheut 375
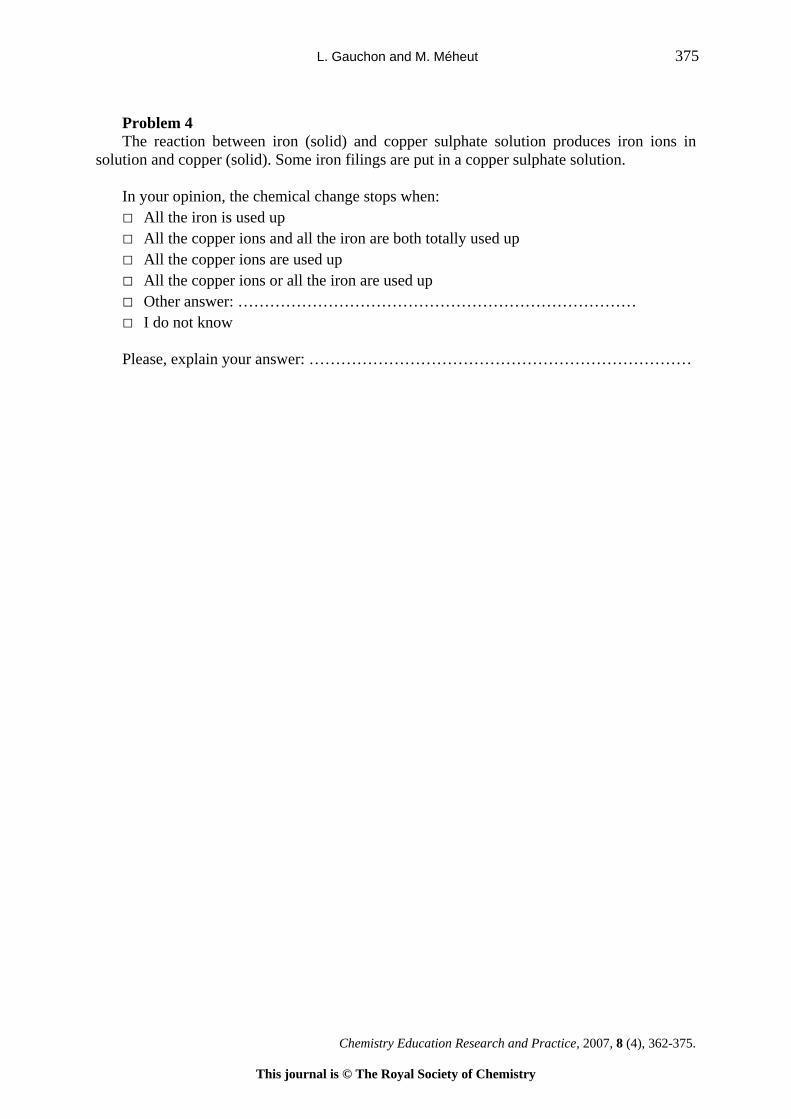
Problem 4 The reaction between iron (solid) and copper sulphate solution produces iron ions in
solution and copper (solid). Some iron filings are put in a copper sulphate solution. In your opinion, the chemical change stops when: □ All the iron is used up □ All the copper ions and all the iron are both totally used up □ All the copper ions are used up □ All the copper ions or all the iron are used up □ Other answer: ………………………………………………………………… □ I do not know Please, explain your answer: ………………………………………………………………
Chemistry Education Research and Practice, 2007, 8 (4), 362-375.
This journal is © The Royal Society of Chemistry

Educational research
Mapping students’ knowledge structure in understanding density, mass percent, molar mass, molar volume and their application in calculations by the use of the knowledge space theory†
Zoltán TóthChemical Methodology Group, University of Debrecen, Debrecen, Hungary e-mail: [email protected] Received 21 November 2006, accepted 19 July 2007 Abstract: Knowledge space theory was used for mapping students’ knowledge structures in calculating density, mass-percent, molar mass and molar volume. Data were collected among the 9-10th graders (age 15-16) at two different secondary grammar schools. Students’ responses were evaluated in a binary fashion and were used for determining knowledge structures with a systematic trial-and-error process using χ2 analysis. Based on the students’ knowledge structures, the critical learning pathways, the characteristic hierarchies of concepts and the critical concepts were identified and analysed. In students’ cognitive structure, molar volume is built on the concept of molar mass. With one group there is a strong connection between the concepts of density, molar mass, molar volume and the calculation of gas volume while with the other group there is no such connection. The reason for this disconnected cognitive structure is the difference in the learning method between the two groups. Students from the second school learned the concepts of density, molar mass, molar volume and mass percent by rote-learning using mnemotechnics. This is a good example that rote learning makes the finding of the connections between concepts hard and gives separated and non-mobilizable knowledge. [Chem. Educ. Res. Pract., 2007, 8 (4), 376-389.] Keywords: knowledge structure, knowledge space theory, density, mass percent, molar mass, molar volume, empirical study Introduction
In studying and modelling the cognitive organisation of knowledge we often use graphs
and networks. Concept maps can be used for exploring the knowledge structure of individuals, and knowledge space theory as a multidimensional model can be applied for studying the cognitive organisation of knowledge characteristic of a group of students.
Knowledge space theory (KST) was developed in 1982 by Doignon and Falmagne and is described in a book by the same authors (Doignon and Falmagne, 1999). Basic concepts of this theory are: ‘knowledge space’, ‘knowledge state’, ‘knowledge structure’, ‘surmise relation’ and ‘critical learning pathway’. Knowledge space defines the knowledge needed to understand a certain subject. In mathematics or science this is defined by a set of problems that a student needs to be able to solve; these problems involve a hierarchical ordering. According to the surmise relation if a student is capable of solving a given problem at higher level of the hierarchy, we can surmise that – in ideal conditions – this student can also solve other problems that are at lower level of the hierarchy. In real situations the disturbing effect of the lucky-guess and the careless-error has to be taken into consideration. Each student is
† This paper is based on work presented at the 8th ECRICE Conference, Budapest, 31 Aug - 1 Sep 2006.
Chemistry Education Research and Practice, 2007, 8 (4), 376-389.
This journal is © The Royal Society of Chemistry

Z. Tóth 377
characterised by a knowledge state, which is the summation of the problems the student has solved correctly (for example: [1,3,4] means that the student could solve the problems 1, 3 and 4). A representation of knowledge states for any group of students is called knowledge structure. The knowledge structure has to be well graded (e.g. each knowledge state must have a predecessor state and a successor state, except for the null state [0] and the final state with correct answers to all questions [Q]). There are several pathways through the knowledge structure between the null state [0] and the final state [Q]. The most common pathway is called critical learning pathway, which is the most probable order in learning concepts. Based on the knowledge structure one can determine the characteristic hierarchy of the knowledge, the most probable hierarchical connectivity of concepts, and the critical concept, the concept that most of the students are ready to learn. ‘Knowledge Spaces’ by Doignon and Falmagne (1999) presents the formal mathematical details of knowledge space theory.
The application of KST to science concepts has been demonstrated firstly by Taagepera et al. (1997). In their survey, for three concepts (pressure, density and conservation of matter) the same multiple-choice pre-test for all grade level (4th through 12th graders) was administered before the topics were formally taught, and the identical post-test was given afterwards. Using KST analysis they constructed the knowledge structures, and suggested tentative critical learning pathways for each concept. They found that KST is a valuable quantitative assessment method for evaluating student knowledge for two reasons: showing the effectiveness of the classroom teaching experience, and suggesting the most probable learning pathways actually taken by the students.
Later, Taagepera and Noori (2000) used KST to map students’ thinking patterns in learning organic chemistry. They defined a knowledge space in organic chemistry based on the electron density distribution as a fundamental organising principle. The comparison of the expert hypothetical critical learning pathway with the novice structure, the most common critical learning pathway deduced from student answers, showed that instead of understanding the structure-reactivity analysis on the basis of electron densities, the students mainly had algorithmic knowledge.
In their third paper Taagepera et al. (2002) used KST for following the development of the bonding concept. Their test consisted of 15 questions in a hierarchical order of difficulty as determined by experts using electron densities as the organising principle. They found that student critical learning pathways differed from the expert pathway in two major areas: the understanding that hydrogen atoms have different electron densities depending on whether they are bonded to oxygen or carbon, and their ability to visualise hydrogen-bonded systems at the sub-microscopic level. Furthermore, KST analysis indicated a weak logic structure in 6 of the 9 students groups. Most of the students seemed to have some disconnected information, which can be easily forgotten.
Arasasingham et al. (2004) used KST to assess student understanding of stoichiometry. They prepared a seven-item test and defined the hypothetical expert learning pathway. Their reasoning was that an understanding of the visual and symbolic representations of individual molecules was important for the understanding of the visual, symbolic, and graphical representations of chemical reactivity, and all these elements were essential in numerical problem solving, conceptualising, and in solving a limiting reagent problem. Comparison of the student critical learning pathways with the expert pathway showed that, contrary to the overall logical connections for the experts (from visualisation, to symbolic representations, to problem solving), students overall thinking patterns were from symbolic representations, to numerical problem solving, to visualisation. This means that acquisition of visualisation skills comes later in the novice knowledge structure, and students can solve numerical problems using memorised algorithms.
Chemistry Education Research and Practice, 2007, 8 (4), 376-389.
This journal is © The Royal Society of Chemistry

Z. Tóth 378
Arasasingham et al. (2005) used KST also to assess the effect of web-based learning tools on student understanding of stoichiometry. KST analysis of the pre- and post-tests showed that web-based learning tools improved their understanding, but the critical learning pathways were the same on the pre-tests and the post-tests. This means that in the overall thinking patterns of the students the overall logical connections remained from symbolic representations, to numerical problem solving, to visualisation.
Tóth and Kiss (2006) used KST to explore 13-17 year olds’ knowledge in identifying physical composition (pure substance, homogeneous mixture or heterogeneous mixture) and chemical composition (element or compound) of matter, as well as the state of matter (solid, liquid or gas) at the particulate level. Based on the student critical learning pathways, they could not detect long lasting changes in the students’ cognitive structure. Only slight and temporary changes could be observed in grade 9 (in identifying the state of matter), and in grade 8 (in identifying physical and chemical composition of matter).
In all these publications cited above authors used KST mainly for constructing and analysing the characteristic knowledge structure of the students’ group, suggesting, analysing and comparing students’ and experts’ critical learning pathways, and analysing the distribution of the students’ knowledge states. Besides these outcomes of KST analysis, Tóth et al. (2007) have recently demonstrated additional possibilities. We applied KST to interview data with 1st graders prior knowledge about water. Using a systematic trial-and-error approach, the most probable hierarchical connectivity of concepts, the characteristic hierarchy of the knowledge – fitted best to the original response structure – was found. Based on the expert hierarchy, we could determine the critical knowledge (concept) that most of the students are ready to learn.
This study shows how the KST analysis of the responses can be used for mapping and comparing students’ characteristic knowledge structures in understanding and applying basic physical and chemical quantities, e.g. in calculating density, mass percent, molar mass and molar volume, and in calculating density from molar mass and molar volume, as well as in calculating gas volume from mass percent, molar mass and molar volume.
The aim of the study
We used KST analysis to answer the following research questions: is there any similarity
or difference between the students’ groups from two different secondary schools in the cognitive organisation of the basic concepts, namely 1. in response structure; 2. in characteristic knowledge structure; 3. in the critical learning pathway as the most probable order in learning concepts; 4. in characteristic hierarchy as the most probable hierarchical connectivity of concepts; and 5. in critical concept as the concept that most of the students are ready to learn?
Research methodology
Instruments and subjects For this study we developed a questionnaire (Appendix) in which students were asked to
fill in the empty boxes. To answer the first question students have to know the meaning of density. In the second one, students have to use the relationship between mass percent, mass of solution and mass of solute to answer the question. The third question is connected with the concept of molar mass. The fourth calculation is related to the concept of molar volume. The correct solution of the fifth question needs the knowledge that density can be calculated not only from the mass and the volume, but also from the molar mass and the molar volume. As the relationship d = M / Vm is not usually taught directly, this question may be assigned as a
Chemistry Education Research and Practice, 2007, 8 (4), 376-389.
This journal is © The Royal Society of Chemistry
Z. Tóth 379
‘problem’ type item. In the sixth item students have to calculate the volume of a gas from the mass percent, the molar mass and the molar volume using a given network with empty cells. This question is an ‘algorithmic’ or ‘exercise’ type item.
The content validity of the test was checked by the chemistry teachers of the secondary schools (I) and (II). The reliability coefficients (Cronbach-alpha) were found 0.654 and 0.631 for the test in the case of students’ group (I) and (II), respectively. These are relatively low values, but one cannot expect better values because (a) the number of the items is small, and (b) this is not a classic homogeneous test, but contains items with differing complexity and difficulty.
Data were collected among the 9-10th graders (age 15-16) at two different Hungarian secondary high schools (I) and (II). The number of students involved this survey was 65 and 57, respectively.
Data analysis
For KST analysis responses were scored in a binary fashion, as they were right (1) or
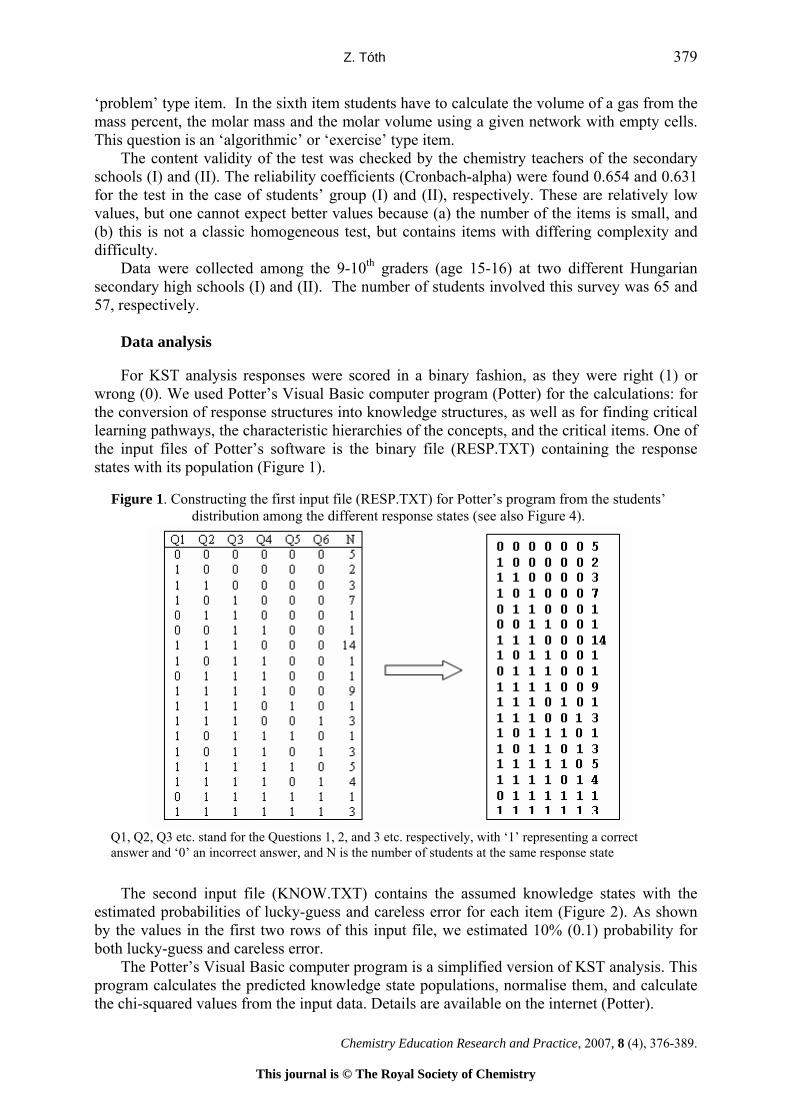
wrong (0). We used Potter’s Visual Basic computer program (Potter) for the calculations: for the conversion of response structures into knowledge structures, as well as for finding critical learning pathways, the characteristic hierarchies of the concepts, and the critical items. One of the input files of Potter’s software is the binary file (RESP.TXT) containing the response states with its population (Figure 1).
The second input file (KNOW.TXT) contains the assumed knowledge states with the
estimated probabilities of lucky-guess and careless error for each item (Figure 2). As shown by the values in the first two rows of this input file, we estimated 10% (0.1) probability for both lucky-guess and careless error.
The Potter’s Visual Basic computer program is a simplified version of KST analysis. This program calculates the predicted knowledge state populations, normalise them, and calculate the chi-squared values from the input data. Details are available on the internet (Potter).
Figure 1. Constructing the first input file (RESP.TXT) for Potter’s program from the students’ distribution among the different response states (see also Figure 4).
Q1, Q2, Q3 etc. stand for the Questions 1, 2, and 3 etc. respectively, with ‘1’ representing a correct answer and ‘0’ an incorrect answer, and N is the number of students at the same response state
Chemistry Education Research and Practice, 2007, 8 (4), 376-389.
This journal is © The Royal Society of Chemistry

Z. Tóth 380
Figure 2. Second input file (KNOW.TXT) in Potter’s program.
0.1 0.1 0.1 0.1 0.1 0.1 -10.1 0.1 0.1 0.1 0.1 0.1 -10 0 0 0 0 0 01 0 0 0 0 0 00 1 0 0 0 0 00 0 1 0 0 0 01 1 0 0 0 0 01 0 1 0 0 0 00 1 1 0 0 0 00 0 1 1 0 0 01 1 1 0 0 0 01 0 1 1 0 0 00 1 1 1 0 0 01 1 1 1 0 0 01 1 1 0 1 0 01 1 1 0 0 1 01 1 1 1 1 0 01 1 1 1 0 1 01 1 1 1 1 1 0
The 1st and 2nd rows contain the probabilities of lucky-guess and careless-error for each item (Q1-Q6). The other 17 rows show the knowledge states of the assumed knowledge structure (see also Figure 6) in binary fashion.
In the output file (Figure 3) we can see the knowledge states in the assumed knowledge structure, the calculated probabilities of these knowledge states (‘Prob’), the predicted populations (‘Pred Pop’), the original populations (‘Pop’) and the χ2 value (‘Chi Sq’) for each knowledge state, and finally the total χ2 (‘ChiSqT’). This total χ2 together with the degrees of freedom characterise the degree to which the assumed knowledge structure fits to the original response structure. The degrees of freedom (d. f.) can be calculated as follows: d. f. = the number of knowledge states in the knowledge structure + the number of estimated parameters (lucky-guess and careless error) – 1. The numbers appearing on the first column in the output file are the codes of the knowledge states in decimal system.
In the output file (Figure 3) we can see the knowledge states in the assumed knowledge structure, the calculated probabilities of these knowledge states (‘Prob’), the predicted populations (‘Pred Pop’), the original populations (‘Pop’) and the χ
2 value (‘Chi Sq’) for each knowledge state, and finally the total χ2 (‘ChiSqT’). This total χ2 together with the degrees of freedom characterise the degree to which the assumed knowledge structure fits to the original response structure. The degrees of freedom (d. f.) can be calculated as follows: d. f. = the number of knowledge states in the knowledge structure + the number of estimated parameters (lucky-guess and careless error) – 1. The numbers appearing on the first column in the output file are the codes of the knowledge states in decimal system.
Figure 3. Output file in Potter’s program. Figure 3. Output file in Potter’s program.
n=18 m=17 Population =65
Knol.st. Prob Pred Pop Pop Chi Sq 0 000000 0.05818 3.78155 5 0.39259 32 100000 0.04183 2.71923 2 0.19024 16 010000 0.01338 0.86948 0 0.86948 8 001000 0.01948 1.26642 0 1.26642 48 110000 0.05516 3.58530 3 0.09555 40 101000 0.09960 6.47404 7 0.04273 24 011000 0.03282 2.13333 1 0.60208 12 001100 0.01704 1.10774 1 0.01048 56 111000 0.18165 11.80719 14 0.40724 44 101100 0.03964 2.57690 1 0.96496 28 011100 0.02768 1.79916 1 0.35497 60 111100 0.13012 8.45779 9 0.03476 58 111010 0.03729 2.42391 1 0.83647 57 111001 0.05767 3.74863 3 0.14951 62 111110 0.07376 4.79426 5 0.00883 61 111101 0.06784 4.40966 4 0.03806 63 111111 0.04685 3.04539 3 0.00068ChisqT(17)= 6.265
n: number of initial response states (see also Figure 4); n: number of initial response states (see also Figure 4); m: number of knowledge states in the assumed knowledge structure (see also Figure 6); m: number of knowledge states in the assumed knowledge structure (see also Figure 6); 1st column: code of the knowledge state in decimal system; 12nd column: code of the knowledge state in binary system; 2
st column: code of the knowledge state in decimal system;
3rd column (‘Prob’): the probability of the population in the given response state; 3nd column: code of the knowledge state in binary system;
4th column (‘Pred Pop’): the predicted (calculated) population in the given response state; 4rd column (‘Prob’): the probability of the population in the given response state;
5th column (‘Pop’): the (initial) population in the given response state; 5th column (‘Pred Pop’): the predicted (calculated) population in the given response state;
6th column (‘Chi Sq’): χ2 calculated from the ‘Pop’ and ‘Pred Pop’ values; 6
th column (‘Pop’): the (initial) population in the given response state;
ChisqT(17): the total value of χ2 in case of 17 assumed knowledge states. ChisqT(17): the total value of χ
th column (‘Chi Sq’): χ2 calculated from the ‘Pop’ and ‘Pred Pop’ values; 2 in case of 17 assumed knowledge states.
Chemistry Education Research and Practice, 2007, 8 (4), 376-389.
This journal is © The Royal Society of Chemistry
Z. Tóth 381
The finding of the knowledge structure that fitted best to the response structure was a systematic trial-and-error process. We started with the most populated response states, then added and subtracted response states to minimise the χ2 values while forming an interconnected network where each state (except of 0 and Q) had a preceding state and a succeeding state (i.e. the structure was well graded).
In determining the critical learning pathways we also used the Hexagon Data Analysis (hDA) from the lloydesign software developed the University of California at Irvine research group recently (Lloyd). In this method the original input data (response states) are converted into the empirical knowledge structure having all the possible response states with different predicted population. Starting from this empirical knowledge structure hDA gives the proposed knowledge structure and the top four pathways in a few minutes.
Results and discussion
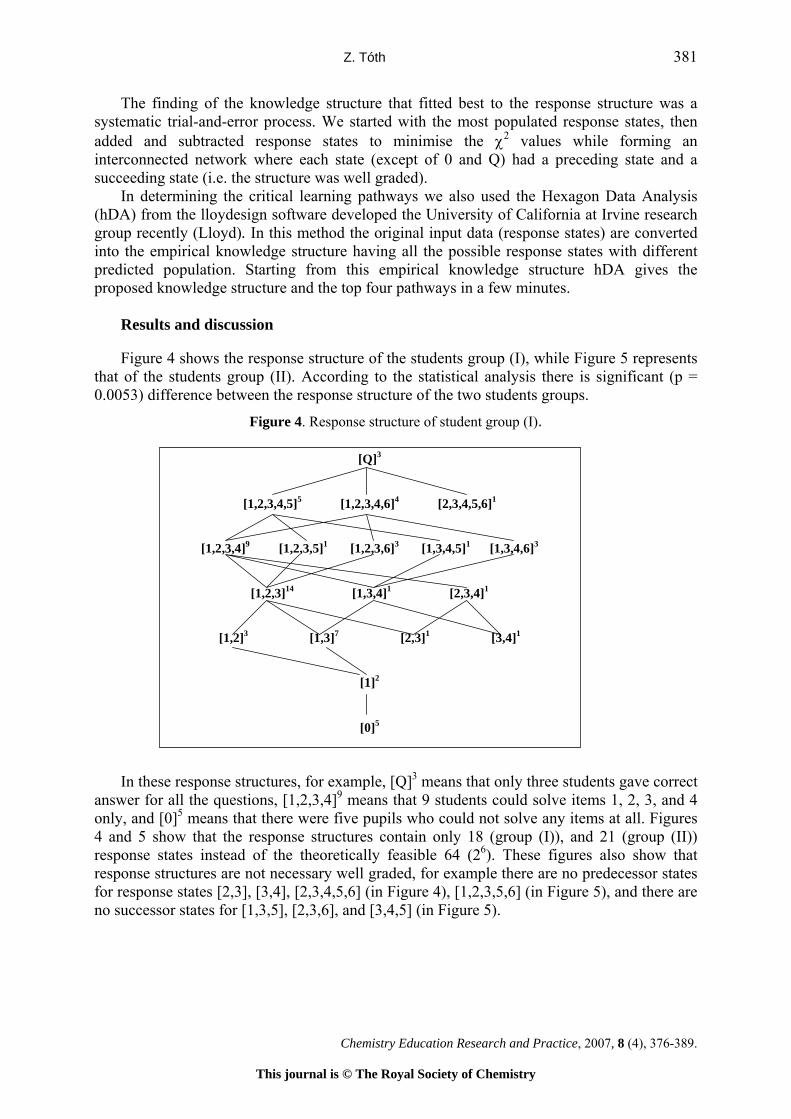
Figure 4 shows the response structure of the students group (I), while Figure 5 represents
that of the students group (II). According to the statistical analysis there is significant (p = 0.0053) difference between the response structure of the two students groups.
Figure 4. Response structure of student group (I).
[Q]3
In th
answer fonly, and4 and 5 responseresponsefor respono succe
[1,2,3,4,5]5 [1,2,3,4,6]4 [2,3,4,5,6]1
[1,2,3,4]9 [1,2,3,5]1 [1,2,3,6]3 [1,3,4,5]1 [1,3,4,6]3
[1,2,3]14 [1,3,4]1 [2,3,4]1
[1,2]3 [1,3]7 [2,3]1 [3,4]1
[1]2
[0]5
ese response structures, for example, [Q]3 means that only three students gave correct or all the questions, [1,2,3,4]9 means that 9 students could solve items 1, 2, 3, and 4 [0]5 means that there were five pupils who could not solve any items at all. Figures show that the response structures contain only 18 (group (I)), and 21 (group (II)) states instead of the theoretically feasible 64 (26). These figures also show that structures are not necessary well graded, for example there are no predecessor states nse states [2,3], [3,4], [2,3,4,5,6] (in Figure 4), [1,2,3,5,6] (in Figure 5), and there are ssor states for [1,3,5], [2,3,6], and [3,4,5] (in Figure 5).
Chemistry Education Research and Practice, 2007, 8 (4), 376-389.
This journal is © The Royal Society of Chemistry

Z. Tóth 382
Figure 5. Response structure of student group (II).
[Q] 7
[ 1 , 2 , 3 , 4 , 5 ] 1 [ 1 , 2 , 3 , 4 , 6 ] 7 [ 1 , 2 , 3 , 5 , 6 ] 1 [ 1 , 3 , 4 , 5 , 6 ] 2
[ 1 , 2 , 3 , 4 ] 4 [ 1 , 3 , 4 , 6 ] 2
[ 1 , 2 , 3 ] 1 [ 1 , 3 , 4 ] 8 [ 1 , 3 , 5 ] 1 [ 1 , 3 , 6 ] 1 [ 2 , 3 , 4 ] 1 [ 2 , 3 , 6 ] 1 [ 3 , 4 , 5 ] 1
[ 1 , 3 ] 10 [ 2 , 3 ] 1 [ 3 , 4 ] 3 [ 3 , 5 ] 2
[ 3 ] 1 [ 5 ] 1
[0] 1
Starting from these response structures, we recognised a subset of response states (the so-
called knowledge structure) fitted to the original response structure with at least p = 0.05 level of significance. To find the knowledge structure we used Potter’s software (Potter), and in fitting process we kept the following in view: (i) Lucky-guess and careless-error parameters (0.1 as usual) for each item were estimated. (ii) The knowledge structure has to be well graded (e. g. each knowledge state must have a predecessor state and a successor state except of the null state [0] and the final state with correct answers to all questions [Q]). The knowledge structures shown in Figures 6 and 7 fitted very well (>99.9%, p < 0.001) to the initial response structures. (The calculated ‘predicted population’ is signed as superscript next to the knowledge states, e. g. [2,3,4]1.799.) It is seen from these pictures that the knowledge
Figure 6. Knowledge structure of students group (I) (χ2 = 6,265; df = 28; p<0.001; >99.9%). Critical learning pathway is shown by bold lines.
[Q]3..045
[1,2,3,4,5]4.794 [1,2,3,4,6]4.410
[1,2,3,4]8.458 [1,2,3,5]2.424 [1,2,3,6]3.749
[1,2,3]11.81 [1,3,4]2.577 [2,3,4]1.799
[1,2]3.585 [1,3]6.474 [2,3]2.133 [3,4]1.108
[1]2.719 [2]0.8695 [3]1.266
[0]3.782
Chemistry Education Research and Practice, 2007, 8 (4), 376-389.
This journal is © The Royal Society of Chemistry

Z. Tóth 383
structure of the students in group (II) contains 28 knowledge states (Figure 7) and is more complicated than that of the students group (I) containing only 17 knowledge states (Figure 6). This difference in the number of knowledge states in knowledge structure indicates that knowledge is less organised in case of the students of group (II) than that of the students of group (I).
Figure 7. Knowledge structure of student group (II) (χ2 =13.34; df = 39; p <0.001; >99.9%).
Critical learning pathway is shown by bold lines.
5.892
Am
pathwawas idused ocriticalthe respathwaproducpercentdifferenpercentmass pprecedefrom eapathwaapplyinfrom th‘problegroup (
[Q]
[1,2,3,4,5]1.784 [1,2,3,4,6]6.135 [2,3,4,5,6]0.6865
[1,2,3,4]4.459 [1,2,3,5]0.5477 [1,3,4,5]1.281 [2,3,4,5]0.4085 [2,3,4,6]0.8740
[1,2,3]2.096 [1,2,5]0.07045 [1,3,4]7.313 [1,3,5]1.820 [2,3,4]1.535 [2,3,5]0.3411 [3,4,5]1.258
[1,2]0.2425 [1,3]8.157 [1,5]0.2886 [2,3]1.219 [2,5]0.1243 [3,4]3.181 [3,5]1.880
[1]0..9927 [2]0.2219 [3]2.185 [5]0.9862
[0]1.020
ong the pathways from the null state [0] to the final state [Q] the most probable y (pathway containing knowledge states with the highest product of the populations) entified as the critical learning pathway characteristic of the students group. Note we ther three methods, too, for determining the critical learning pathway. Among the learning pathways obtained from the different methods we selected the one that was ult of three or four of the methods used. Figure 8 shows these critical learning ys and the learning pathway suggested by the teaching sequence of these concepts and ed by the chemistry teachers. This expert’s (teachers’) pathway is: density → mass → molar mass → molar volume → ‘exercise’ → ‘problem’. It is seen that main ces between these critical learning pathways are in the position of item 2 (mass ) and item 3 (molar mass). Students learn molar mass after mastering in calculation of ercent (see expert’s pathway). However in the mind of 9th-10th graders molar mass s mass percent, and in the case of student group (II) these concepts are situated far ch other in the hierarchy. The inverse position of items 5 and 6 in the critical learning ys suggests that the students of the secondary school (I) are more familiar with g density when solving item 5 (‘problem’) than students from group (II). Students e school (II) were able to solve the ‘exercise’ type item more successfully than the m’ type item, just as the teachers, (experts) expected. It means that students in the II) tend to be algorithmic problem solvers in contrast to students from school (I).
Chemistry Education Research and Practice, 2007, 8 (4), 376-389.
This journal is © The Royal Society of Chemistry

Z. Tóth 384
Using a systematic trial and error process and χ2 analysis, we determined the hierarchy of the concepts (items) characteristic of the cognitive organisation of the students’ knowledge (Figures 9 and 10). We used Hasse diagrams (see for example: Albert and Held, 1994) for the representation of this hierarchy. Accordingly, hierarchy in Figure 9 means, for example, that the knowledge needed to answer item 3 correctly is essential knowledge for items 4, 5, and 6. Knowledge for item 6 is built on the knowledge needed to answer correctly items 2, 3 and 4, but it is independent of the knowledge for items 1 and 5. To solve item 5 students have to have knowledge required for items 1, 3 and 4.
Figure 8. Critical learning pathways for experts and for student groups (I) and (II).
Experts
(1) → (2) → (3) → (4) → (6) → (5)
I)
(1) → (3) → (2) → (4) → (5) → (6)
II)
(3) → (1) → (4) → (2) → (6) → (5)
Figure 9. The best model for the organisation of knowledge in students’ minds in student group (I) (χ2 =6.423; df = 28; p <0.001; >99.9%).
(6) (5)
(4)
(2) (3) (1)
Figure 10. The best model for the organisation of knowledge in students’ minds in student group (II) (χ2 =13.34; df = 39; p <0.001; >99.9%).
(6)
(4)
(2) (3) (1) (5)
Figure 9 shows the model for describing the organisation of knowledge of the students’ of group (I). This model matches the experts’ model, and presents clear and logical connections between items.
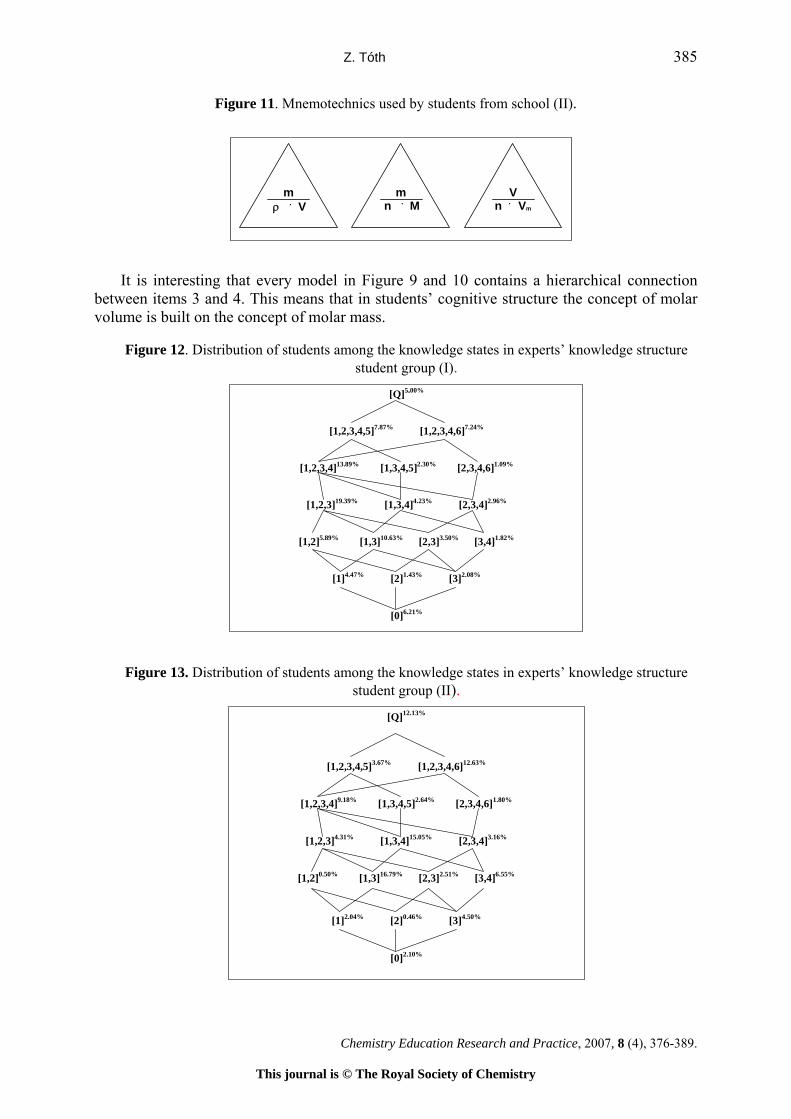
In contrast, the model obtained for the students’ of group (II) (Figure 10) shows a disconnected cognitive structure. In this model item 1 (density with mass and volume) and item 5 (density with molar mass and molar volume) are totally separated from each other, and item 5 is also separated from item 3 (molar mass) and item 4 (molar volume). The probable interpretation is – as seen from the written responses – that students of school (II) learned the concept density, molar mass, molar volume and mass percent mainly by rote, using mnemotechnics presented in Figure 11. However, they did not learn how density could be calculated from the molar mass and molar volume. Rote learning made it difficult for the students to find the connections between the concepts and to apply the learned concepts in solving a new problem.
Chemistry Education Research and Practice, 2007, 8 (4), 376-389.
This journal is © The Royal Society of Chemistry
Z. Tóth 385
Figure 11. Mnemotechnics used by students from school (II).
m
ρ . V
m n . M
V n . V m
It is interesting that every model in Figure 9 and 10 contains a hierarchical connection
between items 3 and 4. This means that in students’ cognitive structure the concept of molar volume is built on the concept of molar mass.
Figure 12. Distribution of students among the knowledge states in experts’ knowledge structure student group (I).
[Q]5..00%
[1,2,3,4,5]7.87% [1,2,3,4,6]7.24%
[1,2,3,4]13.89% [1,3,4,5]2.30% [2,3,4,6]1.09%
[1,2,3]19.39% [1,3,4]4.23% [2,3,4]2.96%
[1,2]5.89% [1,3]10.63% [2,3]3.50% [3,4]1.82%
[1]4.47% [2]1.43% [3]2.08%
[0]6..21%
Figure 13. Distribution of students among the knowledge states in experts’ knowledge structure student group (II).
[Q]12.13%
[1,2,3,4,5]3.67% [1,2,3,4,6]12.63%
[1,2,3,4]9.18% [1,3,4,5]2.64% [2,3,4,6]1.80%
[1,2,3]4.31% [1,3,4]15.05% [2,3,4]3.16%
[1,2]0.50% [1,3]16.79% [2,3]2.51% [3,4]6.55%
[1]2.04% [2]0.46% [3]4.50%
[0]2.10%
Chemistry Education Research and Practice, 2007, 8 (4), 376-389.
This journal is © The Royal Society of Chemistry

Z. Tóth 386
Knowledge space theory can be applied not only for studying the knowledge structure of students groups, but also we can use it to optimise the teaching process. If we assume the hypothetical expert hierarchy of items is that shown in Figure 9, we can derive the hypothetical knowledge structure indicating the connections between the possible knowledge states (Figures 12 and 13).
Based on the probabilities of the knowledge states in the hypothetical knowledge structure for each student group we can calculate what percentage of students (Table 1) are ready to learn the concept(s) regarding the given item. It is seen that the fitting of the hypothetical knowledge structure to the response structure is very good for each group. This analysis shows that most of the students (35.6%) in group (I) are ready to learn the concept of molar volume (item 4), while most of them (49.7%) in group (II) are ready to learn mass percent (item 2). This means that for students group (I) the molar volume, and for students group (II) the mass percent is the critical concept. Therefore instruction will be the most effective if the teachers discuss molar volume (with group I) and mass percent (with group II), at an early stage. Table 1. Fitting of experts’ knowledge structure to the response structure and percentages of students ready to learn the concepts linked to the given item.
Students’ group Fitting Item 1 Item 2 Item 3 Item 4 Item 5 Item 6 (I) 99.9% 19.1 % 31.7 % 18.0 % 35.6 % 25.4 % 24.7 % (II) 99.3% 21.1 % 49.7 % 5.1 % 28.1 % 36.9 % 19.4 %
Conclusions
The results and conclusions of our study can be summarised as follows.
1. We found significant difference in the characteristic knowledge structures of the student groups from different secondary high schools. The knowledge structure of the students of group (II) is more complex than that of the students of group (I), indicating a less organised knowledge in group (II).
2. There are also differences between the two student groups and between experts and novices (students) in the critical learning pathway as the most probable order in learning concepts. Although Hungarian students learn molar mass after learning mass percent, in the students’ minds molar mass precedes mass percent. The reason for this change may be that Hungarian 9th and 10th graders use molar mass more frequently in chemical calculations than mass percent. The inverse position of ‘exercise’ and ‘problem’ type items suggests that students from secondary school (II) are more typically algorithmic problem solvers than students from secondary school (I).
3. We could identify the characteristic hierarchies as the most probable models of knowledge structure. We found that in the model best fitted to the response structure of the students of group (II), density and the ‘problem’ type items are separated from each other and from the molar mass and molar volume. Only the connectivity between mass percent, molar mass, molar volume and ‘exercise’ type item exists according to the solution network given in item 6. Explanation of this cognitive structure containing separate concepts is given by the written responses of the students. Students from secondary school (II) learned density, molar mass, molar volume and mass percent mainly by rote-learning using mnemotechnics. Therefore, they were not able to apply these concepts in solving a ‘problem’ type question (item 5), but could use them in solving an ‘algorithmic’ type question (item 6).
4. Alongside these differences, we could find some similarities between the two groups, as well. Models show that in students’ minds the concept of molar volume is built on the concept of molar mass. It is understandable, because molar mass is the first molar
Chemistry Education Research and Practice, 2007, 8 (4), 376-389.
This journal is © The Royal Society of Chemistry
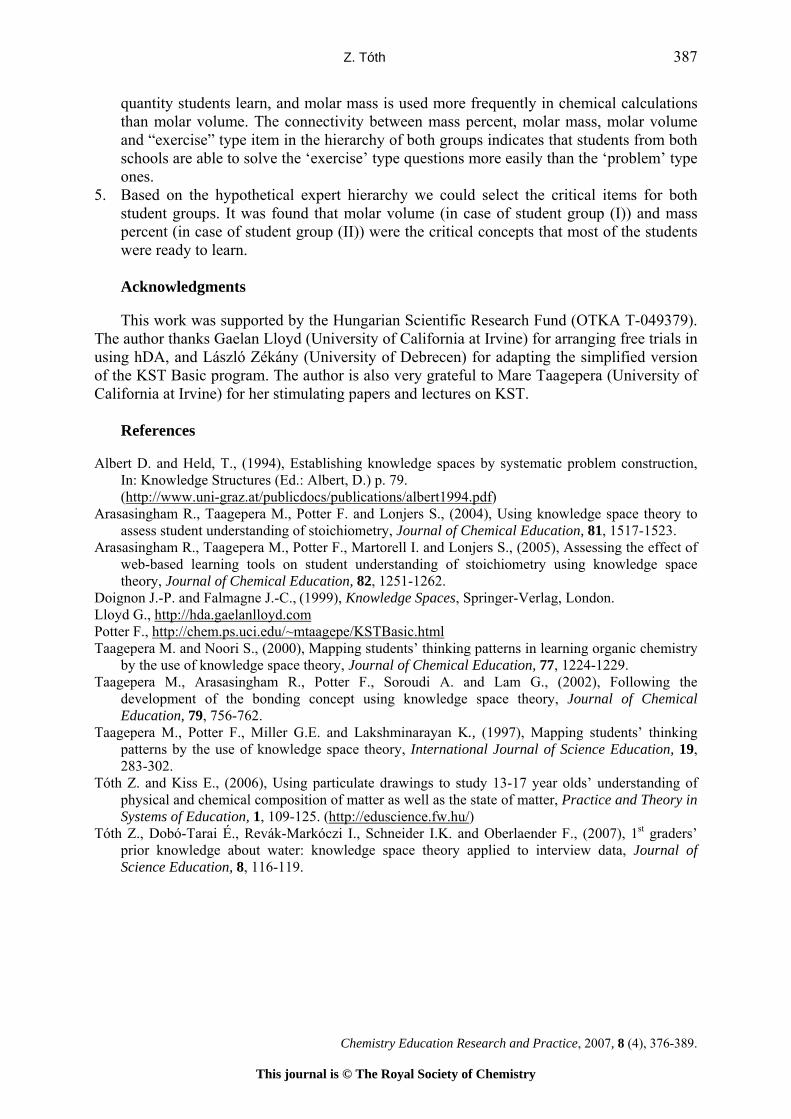
Z. Tóth 387
quantity students learn, and molar mass is used more frequently in chemical calculations than molar volume. The connectivity between mass percent, molar mass, molar volume and “exercise” type item in the hierarchy of both groups indicates that students from both schools are able to solve the ‘exercise’ type questions more easily than the ‘problem’ type ones.
5. Based on the hypothetical expert hierarchy we could select the critical items for both student groups. It was found that molar volume (in case of student group (I)) and mass percent (in case of student group (II)) were the critical concepts that most of the students were ready to learn. Acknowledgments
This work was supported by the Hungarian Scientific Research Fund (OTKA T-049379).
The author thanks Gaelan Lloyd (University of California at Irvine) for arranging free trials in using hDA, and László Zékány (University of Debrecen) for adapting the simplified version of the KST Basic program. The author is also very grateful to Mare Taagepera (University of California at Irvine) for her stimulating papers and lectures on KST.
References
Albert D. and Held, T., (1994), Establishing knowledge spaces by systematic problem construction,
In: Knowledge Structures (Ed.: Albert, D.) p. 79. (http://www.uni-graz.at/publicdocs/publications/albert1994.pdf)
Arasasingham R., Taagepera M., Potter F. and Lonjers S., (2004), Using knowledge space theory to assess student understanding of stoichiometry, Journal of Chemical Education, 81, 1517-1523.
Arasasingham R., Taagepera M., Potter F., Martorell I. and Lonjers S., (2005), Assessing the effect of web-based learning tools on student understanding of stoichiometry using knowledge space theory, Journal of Chemical Education, 82, 1251-1262.
Doignon J.-P. and Falmagne J.-C., (1999), Knowledge Spaces, Springer-Verlag, London. Lloyd G., http://hda.gaelanlloyd.com Potter F., http://chem.ps.uci.edu/~mtaagepe/KSTBasic.html Taagepera M. and Noori S., (2000), Mapping students’ thinking patterns in learning organic chemistry
by the use of knowledge space theory, Journal of Chemical Education, 77, 1224-1229. Taagepera M., Arasasingham R., Potter F., Soroudi A. and Lam G., (2002), Following the
development of the bonding concept using knowledge space theory, Journal of Chemical Education, 79, 756-762.
Taagepera M., Potter F., Miller G.E. and Lakshminarayan K., (1997), Mapping students’ thinking patterns by the use of knowledge space theory, International Journal of Science Education, 19, 283-302.
Tóth Z. and Kiss E., (2006), Using particulate drawings to study 13-17 year olds’ understanding of physical and chemical composition of matter as well as the state of matter, Practice and Theory in Systems of Education, 1, 109-125. (http://eduscience.fw.hu/)
Tóth Z., Dobó-Tarai É., Revák-Markóczi I., Schneider I.K. and Oberlaender F., (2007), 1st graders’ prior knowledge about water: knowledge space theory applied to interview data, Journal of Science Education, 8, 116-119.
Chemistry Education Research and Practice, 2007, 8 (4), 376-389.
This journal is © The Royal Society of Chemistry
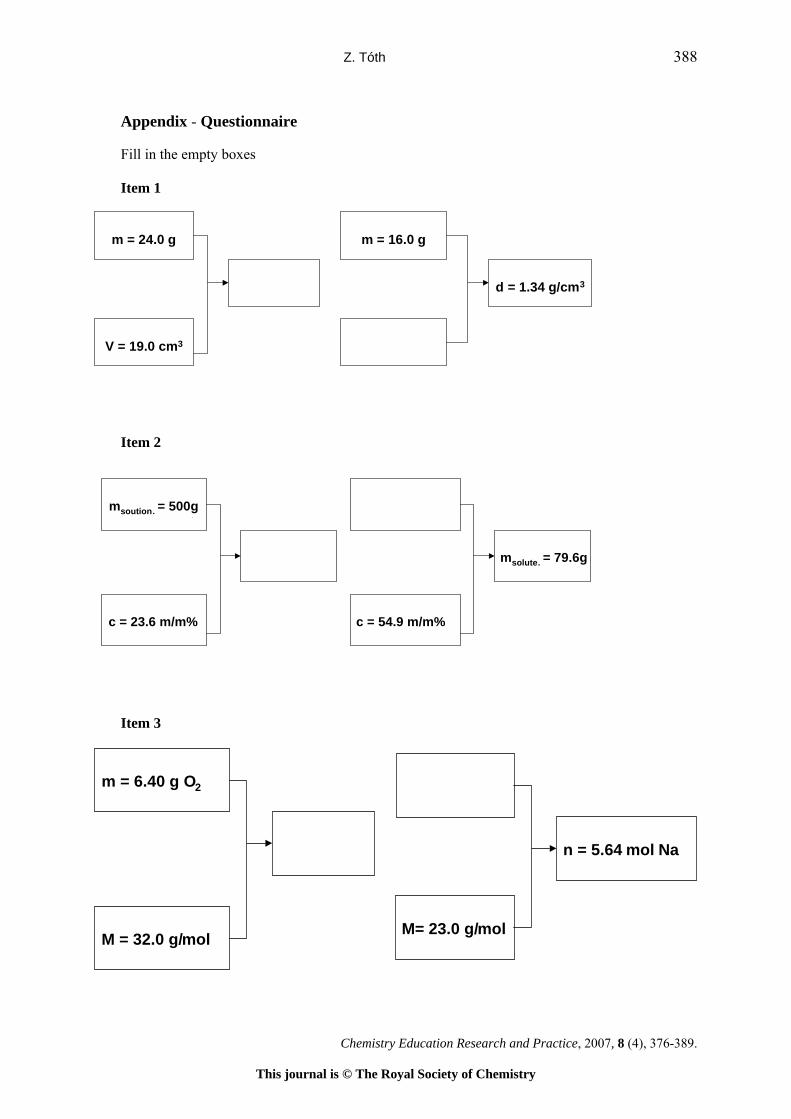
Z. Tóth 388
Appendix - Questionnaire Fill in the empty boxes Item 1
m = 24.0 g
V = 19.0 cm3
m = 16.0 g
d = 1.34 g/cm3
Item 2
m soution . = 500g
c = 23.6 m/m% c = 54.9 m/m%
m solute. = 79.6g
Item 3
m = 6.40 g O2
M = 32.0 g/mol M= 23.0 g/mol
n = 5.64 mol Na
Chemistry Education Research and Practice, 2007, 8 (4), 376-389.
This journal is © The Royal Society of Chemistry
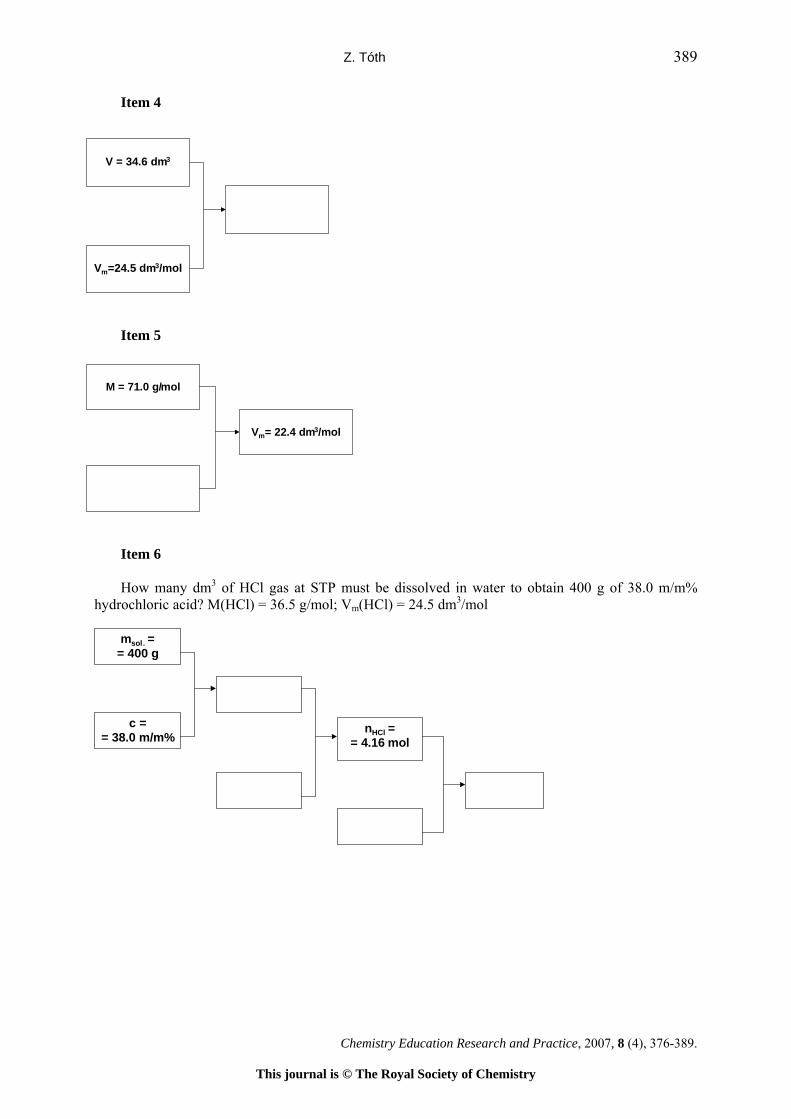
Z. Tóth 389
Item 4
V = 34.6 dm3
Vm=24.5 dm3/mol
Item 5
M = 71.0 g/mol
Vm= 22.4 dm3/mol
Item 6 How many dm3 of HCl gas at STP must be dissolved in water to obtain 400 g of 38.0 m/m%
hydrochloric acid? M(HCl) = 36.5 g/mol; Vm(HCl) = 24.5 dm3/mol
msol. == 400 g
c == 38.0 m/m%
nHCl == 4.16 mol
Chemistry Education Research and Practice, 2007, 8 (4), 376-389.
This journal is © The Royal Society of Chemistry

Practice
Evaluation of student engagement with two learning supports in
the teaching of 1st year undergraduate chemistry† James Lovatt, Odilla E. Finlayson* and Paraic James CASTeL, School of Chemical Sciences, Dublin City University, Glasnevin, Dublin 9
e-mail: [email protected]
Received 31 December 2006, accepted 20 September 2007 Abstract: This paper attempts to draw together students’ interaction with an organic chemistry module on Virtual Learning Environment (VLE) (Moodle), their interaction with another learning support (Drop-in Science Clinic), the approach they have adopted to their learning of chemistry and their performance in the terminal end of year chemistry examination. It discusses student trends of usage of the VLE and relates this to their examination success. Their performance in the organic section of the examination is compared to that of the physical chemistry section in which the students’ did not have VLE support materials. Students’ usage patterns for accessing resources on Moodle were analysed. Interesting patterns of first access are shown. In general, those who interacted with the resources on Moodle did better in their terminal examinations, showing that students who were conscientious in their studies did better in their examinations. [Chem. Educ. Res. Pract., 2007, 8 (4), 390-402.] Keywords: Introductory undergraduate chemistry, students’ approaches to learning, learning
supports, virtual learning environments (VLE), Drop-in-science-clinic (DISC) Background It is internationally recognised that the physical sciences are facing problems of student
disengagement (Fensham, 2004). Fensham has discussed possible causes, such as a curricular focus on attainment of scientific knowledge without attention to motivational aspects of science. He has noted the importance of scientific literacy and technology in encouraging an interest in science. Computers have been prevalent for many years in the physical sciences in that they are used in instrumentation and in data analysis within undergraduate programmes, and students have become adept in their usage. In Ireland, higher education reform has proposed the development of new ICT pedagogy for the improvement of teaching within higher education (HEA, 2004). This reform has been stimulated by industry’s call for a technically skilled workforce, and indeed, to address the needs of a changing society.
There is a plethora of ICT resources and products available for use within the physical sciences. These resources include online lecture notes and tutorials, interactive software programmes, Virtual Learning Environments (VLEs e.g. webCT, blackboard, Moodle) and simulations.
VLEs are in widespread use. In the UK, a University Colleges and Information Systems Association (UCISA) survey by Browne and Jenkins (2003) noted that 86% of their respondents are using a VLE in their institutes. Recommendations on the implementation and evaluation of VLE have been discussed (Bell et al., 2002, Boyle et al., 2003, Sharpe et al., † This paper is based on work presented at the 8th ECRICE Conference, Budapest, 31 Aug - 1 Sep 2006.
Chemistry Education Research and Practice, 2007, 8 (4), 390-402.
This journal is © The Royal Society of Chemistry

J. Lovatt, O.E. Finlayson and P. James 391
2006). While anecdotal evidence seems to suggest that students like access to lecture notes and tutorial questions through VLEs, there has been little evaluation on the effectiveness of these supports in teaching and learning. Indeed, Rogers (2004) noted that while there are gains in using learning technology, the claim that it can ‘make the difference’ to deeper learning requires much more research before further investment should be considered.
The VLE used in this study was Moodle. It is a web based Course Management System that allows the user to develop a VLE. It is open source software that can be freely downloaded from the web. There is an on-line Moodle community with over 200,000 registered users of the host site moodle.org. It is easily used and internationally accessible. It allows the educator to develop a course with multiple functions, including file hosting, quizzes, assignments, chats, discussion forums, glossaries and questionnaires. It is similar to the commercially produced VLE blackboard.com.
Another aspect that should be considered when looking at student engagement is the approach that students adopt to their learning. Approaches to learning examine how students relate and interact with a task and their intention in relation to a task; they are indicative of the quality of learning that takes place (Ramsden, 1992).
Ramsden distinguishes between learning for real understanding (i.e. adopting a deep approach) and imitation (i.e. adopting a surface approach). A deep approach refers to active engagement with a task in order to obtain meaning, i.e. when students intend to relate with a task in a manner that will allow them to understand the facts of a task in relation to the real world concepts (Marton and Saljo, 1992). A surface approach, on the other hand, refers to students obtaining information in a random pattern for short-term recall. A third approach to learning is known as the strategic approach. This is an approach “in which the intention is to achieve the highest possible grades by using organised study methods and good time management” (Entwhistle, 2000). The two most recognised inventories in the literature to measure student approaches to learning are those of Biggs (Study Process Questionnaire (Biggs, 1979)) and Entwistle (ASSIST- Approaches to Study Skills Inventory for Students (Entwhistle, 2000)). In this research, the ASSIST inventory was used.
Figure 1: ASSIST inventory, approaches to learning (Entwistle, 2000).
Deep Strategic Surface
In the ASSIST inventory, approaches are broken down into 13 different subscales as
shown in Figure 1. The deep approach is broken down into four subscales, namely, seeking
Approach Approach Approach
• Seeking Meaning
• Relating Ideas
• Use of Evidence
• Interest in Ideas
• Organised Study
• Time Management
• Alertness to assessment demands
• Achieving
• Monitoring effectiveness
• Lack of Purpose
• Unrelated Memorising
• Syllabus-boundness
• Fear of Failure
Approaches
13 Subscales
52 Question Inventory
Chemistry Education Research and Practice, 2007, 8 (4), 390-402.
This journal is © The Royal Society of Chemistry

J. Lovatt, O.E. Finlayson and P. James 392
meaning, relating ideas, use of evidence and interest in ideas. The strategic approach is broken into five subscales and the surface approach is split into four sub-scales. Each of the subscales is assessed by four statements on the inventory to which students have to respond. A 1-5 Likert-scale is used where 5 refers to agreement and 1 indicates disagreement with the statement. Thus in total there are 52 statements that students have to respond to, four of which corresponds to a subscale, which in turn combine to one of the three student approaches.
Student engagement may also be influenced by prior knowledge in the sense that a student may become demotivated due to lack of basic knowledge that can often be assumed in a lecture course. To tackle this issue, a Drop-in Science Clinic (DISC) was made available, where students could ‘drop-in’ at a time that suited them, to obtain help in any of the science subjects.
This study attempts to obtain answers to the following question: When learning supports (such as VLE and DISC) are made available, do the students use
them, in what manner are they used, and can these supports be used to encourage deeper learning or even more independent learners?
The study builds on previous work (Lovatt et al., 2005), and also on a study of the effect of gender difference on students’ approach to learning (Kelly et al., 2005). We attempt to draw together students’ interaction with an organic chemistry module on VLE (Moodle), their interaction with the DISC, the approach they have adopted to their learning of chemistry, and their performance in the terminal end of year chemistry examination. Also we will discuss student trends of usage of the VLE, and relate this to their examination success.
Methodology A chemistry module for first year students was selected for study. This module is taken
by all first year students taking chemistry as part of their programme (approximately 200 students). The students taking this module have different backgrounds in terms of university entry points, programme of choice and prior knowledge of chemistry. Half of the module was organic chemistry and the other half was physical chemistry. Two learning supports were provided: the Moodle VLE and the DISC.
Learning supports The VLE was only made available for the organic section of the module, thus all analysis
relating to the provision of the VLE learning support is in relation to the organic part of the module (see Figure 2 for time line). All students had previous experience of Moodle in a biology module in the first semester, accessing lecture notes, online tutorials and sample exam problems and answers. The material provided on Moodle for organic chemistry consisted of weekly self-test quizzes, lecture notes, tutorial questions, discussion forums and links to relevant sites.
A DISC, modelled on Maths Learning Centre (Byers, 2006), was made available to all first year science students. This was open for 3 hours per week during the last 6 weeks of the semester and then 3 hours per day during the two week exam study break. The DISC was staffed by post-graduate students (tutors) in chemistry, physics and biology. Students were able to go to the clinic and ask questions relating to their course material. Students were expected to come with specific questions to the clinic, thereby encouraging them to go through their course work and seek answers to difficulties as they arose. The DISC had a very informal atmosphere, and if large numbers of students were present at the same time, group work and peer teaching was encouraged.
Chemistry Education Research and Practice, 2007, 8 (4), 390-402.
This journal is © The Royal Society of Chemistry
J. Lovatt, O.E. Finlayson and P. James 393
Evaluation methodology Moodle logs were used to access patterns of usage of each resource by the students.
Student surveys (pre module and post module) and informal discussions with the students generated data on students’ opinions of the resources provided. Approximately 60% of the registered students completed the pre module survey (Pre102) and 48% of students completed the post module survey (Pst102). It is noted that the surveys were completed by those students who attended lectures on a particular day, and thus the data may not be completely representative of the whole sample cohort.
The evaluation of the DISC is based on attendance records, subject areas requested and feedback from the tutors involved.
Students’ approaches to their learning of chemistry were determined, using ASSIST, at the start of their first year and in their final week of their first year. Evaluation of the ASSIST data was carried out in SPSS following the guidelines for use of the inventory. The Cronbach’s alpha value was recorded for the validation of the internal consistency of the three approaches to learning with the student cohort. All the approaches have an alpha value >0.7, which indicates good internal consistency (see Table 1).
Table 1. Cronbach’s alpha values for internal consistency for approaches to learning subscales.
Cohort Deep Strategic Surface 04/05 0.84 0.87 0.77
A time line of provision of learning supports, examination time and collection of ASSIST
data is shown in Figure 2. Figure 2: Provision of learning supports and collection of ASSIST data.
ASSIST (beginning of the year) ASSIST
(at the end of the year)
DISC
Exam Week
(Wk 9)
Study Weeks
(Wks 7-8)
Moodle Support
Organic Chemistry Lectures (Wk1-6)
Physical Chemistry Lectures (1-6)
Results and discussion The evaluation of student usage of Moodle was examined through the following
questions: a. Will students use the extra support available through Moodle, and if so, which supports
do they favour? b. Do students who access the support material do better in examinations?
Will students use the extra support available through Moodle and if so, which supports
do they favour? Of the 199 students registered for the module, only twelve students did not log on to
Moodle at all. There were 12,179 student log hits on the site associated with the 187 Moodle users.
Chemistry Education Research and Practice, 2007, 8 (4), 390-402.
This journal is © The Royal Society of Chemistry
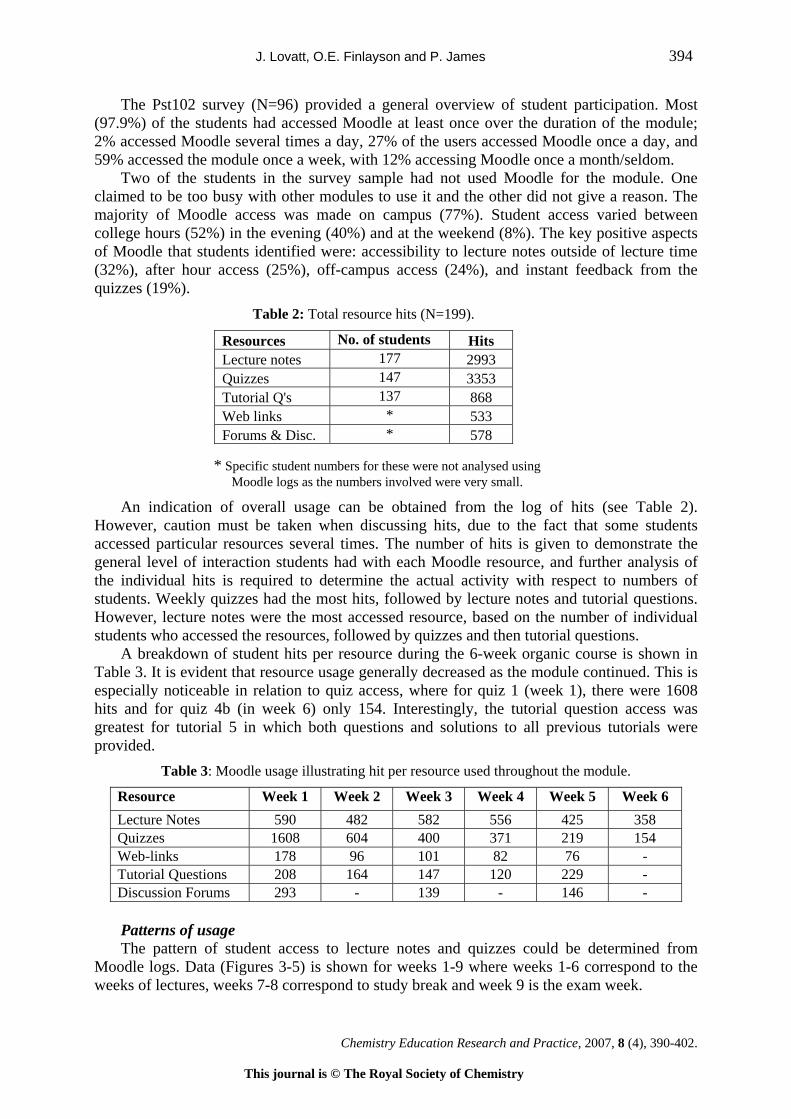
J. Lovatt, O.E. Finlayson and P. James 394
The Pst102 survey (N=96) provided a general overview of student participation. Most (97.9%) of the students had accessed Moodle at least once over the duration of the module; 2% accessed Moodle several times a day, 27% of the users accessed Moodle once a day, and 59% accessed the module once a week, with 12% accessing Moodle once a month/seldom.
Two of the students in the survey sample had not used Moodle for the module. One claimed to be too busy with other modules to use it and the other did not give a reason. The majority of Moodle access was made on campus (77%). Student access varied between college hours (52%) in the evening (40%) and at the weekend (8%). The key positive aspects of Moodle that students identified were: accessibility to lecture notes outside of lecture time (32%), after hour access (25%), off-campus access (24%), and instant feedback from the quizzes (19%).
* SpeMo
An indication of oHowever, caution musaccessed particular resogeneral level of interacthe individual hits is rstudents. Weekly quizzHowever, lecture notesstudents who accessed t
A breakdown of stuTable 3. It is evident thespecially noticeable inhits and for quiz 4b (igreatest for tutorial 5 provided.
ResLecQuiTutoWebForu
Table 3: Mood
Resource Lecture Notes Quizzes Web-links Tutorial Questions Discussion Forums Patterns of usage The pattern of stu
Moodle logs. Data (Figweeks of lectures, week
Table 2: Total resource hits (N=199).
ources No. of students Hits ture notes 177 2993 zzes 147 3353 rial Q's 137 868 links * 533 ms & Disc. * 578
cific student numbers for these were not analysed using odle logs as the numbers involved were very small.
verall usage can be obtained from the log of hits (see Table 2). t be taken when discussing hits, due to the fact that some students urces several times. The number of hits is given to demonstrate the tion students had with each Moodle resource, and further analysis of equired to determine the actual activity with respect to numbers of es had the most hits, followed by lecture notes and tutorial questions. were the most accessed resource, based on the number of individual he resources, followed by quizzes and then tutorial questions. dent hits per resource during the 6-week organic course is shown in
at resource usage generally decreased as the module continued. This is relation to quiz access, where for quiz 1 (week 1), there were 1608 n week 6) only 154. Interestingly, the tutorial question access was in which both questions and solutions to all previous tutorials were
le usage illustrating hit per resource used throughout the module.
Week 1 Week 2 Week 3 Week 4 Week 5 Week 6 590 482 582 556 425 358
1608 604 400 371 219 154 178 96 101 82 76 - 208 164 147 120 229 - 293 - 139 - 146 -
dent access to lecture notes and quizzes could be determined from ures 3-5) is shown for weeks 1-9 where weeks 1-6 correspond to the s 7-8 correspond to study break and week 9 is the exam week.
Chemistry Education Research and Practice, 2007, 8 (4), 390-402.
This journal is © The Royal Society of Chemistry
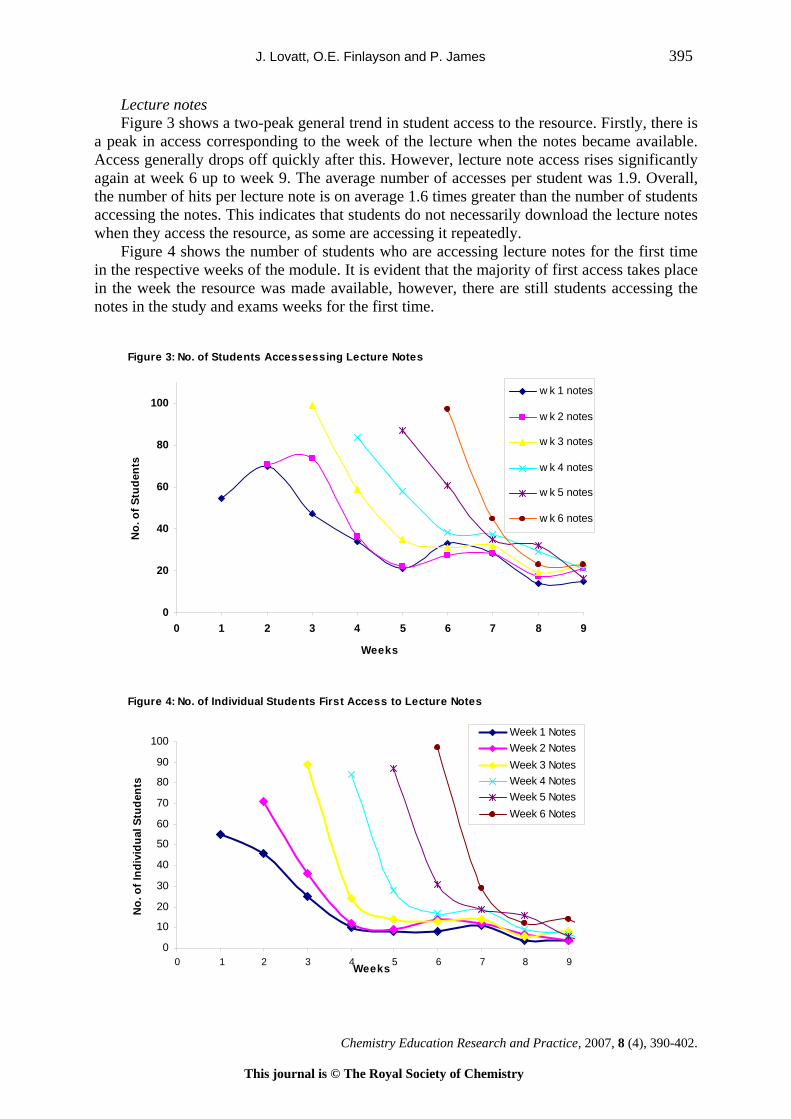
J. Lovatt, O.E. Finlayson and P. James 395
Lecture notes Figure 3 shows a two-peak general trend in student access to the resource. Firstly, there is
a peak in access corresponding to the week of the lecture when the notes became available. Access generally drops off quickly after this. However, lecture note access rises significantly again at week 6 up to week 9. The average number of accesses per student was 1.9. Overall, the number of hits per lecture note is on average 1.6 times greater than the number of students accessing the notes. This indicates that students do not necessarily download the lecture notes when they access the resource, as some are accessing it repeatedly.
Figure 4 shows the number of students who are accessing lecture notes for the first time in the respective weeks of the module. It is evident that the majority of first access takes place in the week the resource was made available, however, there are still students accessing the notes in the study and exams weeks for the first time.
Figure 3: No. of Students Accessessing Lecture Notes
0
20
40
60
80
100
0 1 2 3 4 5 6 7 8 9
Weeks
No.
of S
tude
nts
w k 1 notes
w k 2 notes
w k 3 notes
w k 4 notes
w k 5 notes
w k 6 notes
Figure 4: No. of Individual Students First Access to Lecture Notes
0
10
20
30
40
50
60
70
80
90
100
0 1 2 3 4 5 6 7 8 9Weeks
No.
of I
ndiv
idua
l Stu
dent
s
Week 1 NotesWeek 2 NotesWeek 3 NotesWeek 4 NotesWeek 5 NotesWeek 6 Notes
Chemistry Education Research and Practice, 2007, 8 (4), 390-402.
This journal is © The Royal Society of Chemistry
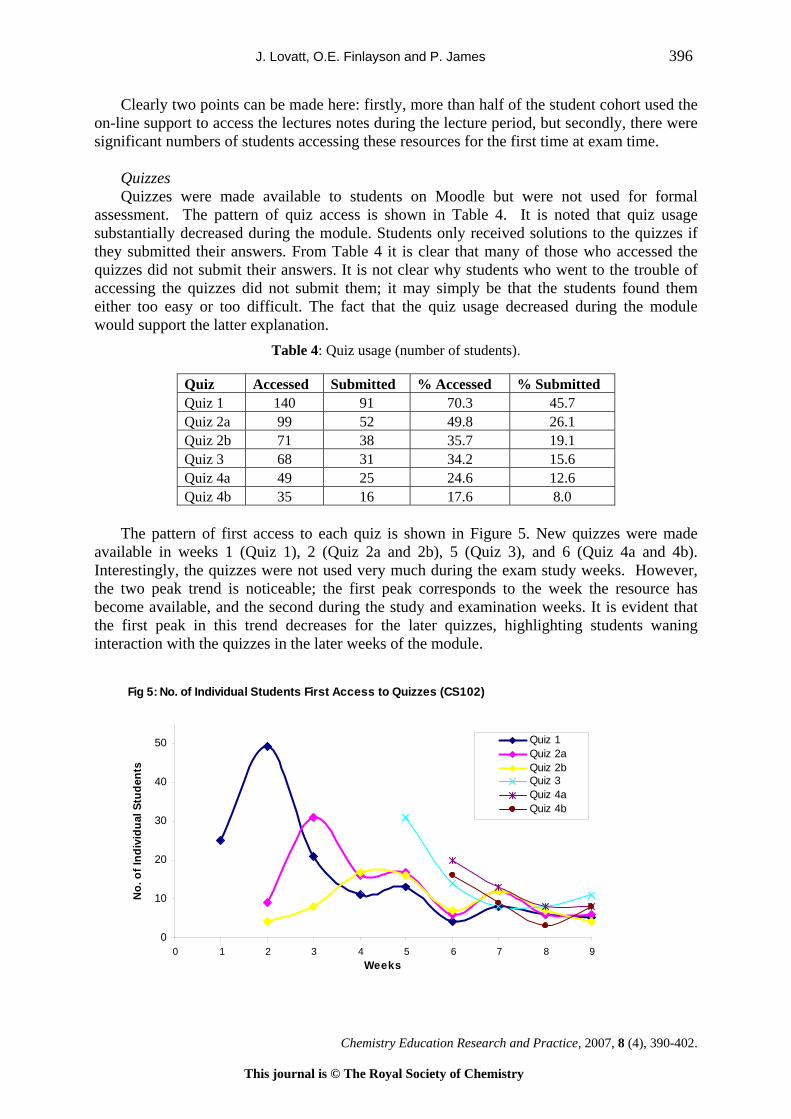
J. Lovatt, O.E. Finlayson and P. James 396
Clearly two points can be made here: firstly, more than half of the student cohort used the on-line support to access the lectures notes during the lecture period, but secondly, there were significant numbers of students accessing these resources for the first time at exam time.
Quizzes Quizzes were made available to students on Moodle but were not used for formal
assessment. The pattern of quiz access is shown in Table 4. It is noted that quiz usage substantially decreased during the module. Students only received solutions to the quizzes if they submitted their answers. From Table 4 it is clear that many of those who accessed the quizzes did not submit their answers. It is not clear why students who went to the trouble of accessing the quizzes did not submit them; it may simply be that the students found them either too easy or too difficult. The fact that the quiz usage decreased during the module would support the latter explanation.
Table 4: Quiz usage (number of students).
Quiz Accessed Submitted % Accessed % Submitted Quiz 1 140 91 70.3 45.7 Quiz 2a 99 52 49.8 26.1 Quiz 2b 71 38 35.7 19.1 Quiz 3 68 31 34.2 15.6 Quiz 4a 49 25 24.6 12.6 Quiz 4b 35 16 17.6 8.0
The pattern of first access to each quiz is shown in Figure 5. New quizzes were made
available in weeks 1 (Quiz 1), 2 (Quiz 2a and 2b), 5 (Quiz 3), and 6 (Quiz 4a and 4b). Interestingly, the quizzes were not used very much during the exam study weeks. However, the two peak trend is noticeable; the first peak corresponds to the week the resource has become available, and the second during the study and examination weeks. It is evident that the first peak in this trend decreases for the later quizzes, highlighting students waning interaction with the quizzes in the later weeks of the module.
Fig 5: No. of Individual Students First Access to Quizzes (CS102)
0
10
20
30
40
50
0 1 2 3 4 5 6 7 8 9Weeks
No.
of I
ndiv
idua
l Stu
dent
s
Quiz 1Quiz 2aQuiz 2bQuiz 3Quiz 4aQuiz 4b
Chemistry Education Research and Practice, 2007, 8 (4), 390-402.
This journal is © The Royal Society of Chemistry
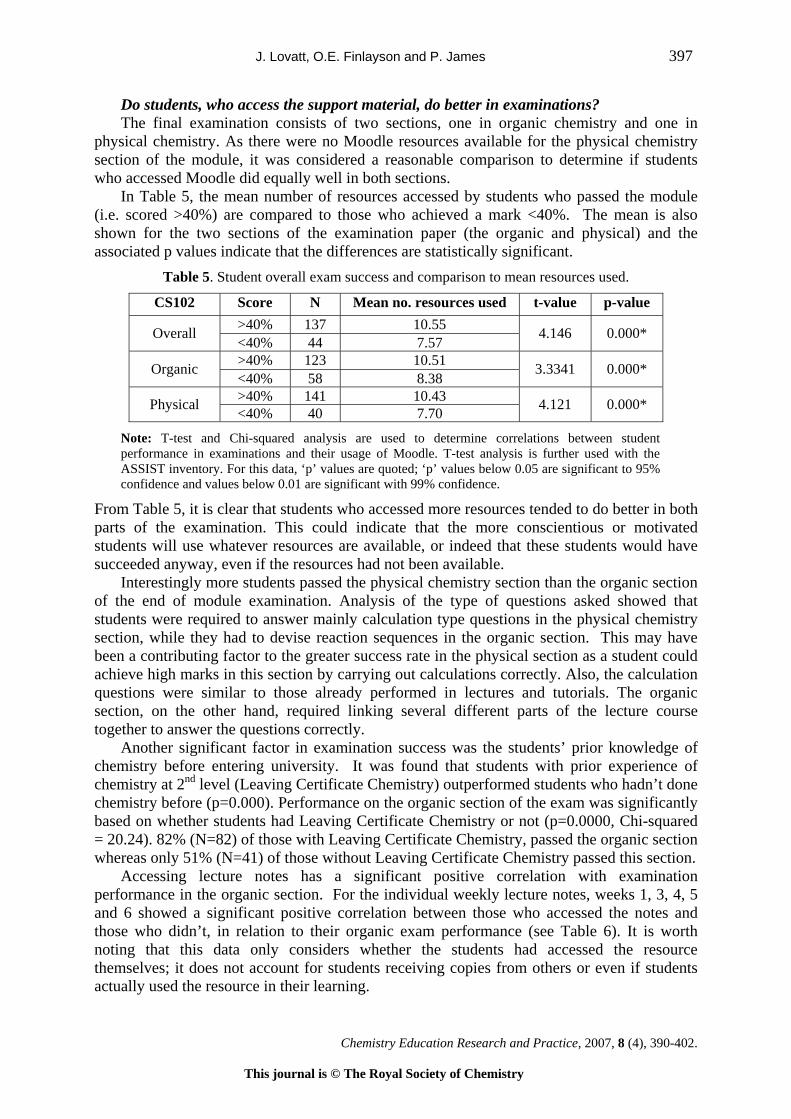
J. Lovatt, O.E. Finlayson and P. James 397
Do students, who access the support material, do better in examinations? The final examination consists of two sections, one in organic chemistry and one in
physical chemistry. As there were no Moodle resources available for the physical chemistry section of the module, it was considered a reasonable comparison to determine if students who accessed Moodle did equally well in both sections.
In Table 5, the mean number of resources accessed by students who passed the module (i.e. scored >40%) are compared to those who achieved a mark <40%. The mean is also shown for the two sections of the examination paper (the organic and physical) and the associated p values indicate that the differences are statistically significant.
Table 5. Student overall exam success and comparison to mean resources used.
CS102 Score N Mean no. resources used t-value p-value >40% 137 10.55 Overall <40% 44 7.57 4.146 0.000*
>40% 123 10.51 Organic <40% 58 8.38 3.3341 0.000*
>40% 141 10.43 Physical <40% 40 7.70 4.121 0.000*
Note: T-test and Chi-squared analysis are used to determine correlations between student performance in examinations and their usage of Moodle. T-test analysis is further used with the ASSIST inventory. For this data, ‘p’ values are quoted; ‘p’ values below 0.05 are significant to 95% confidence and values below 0.01 are significant with 99% confidence.
From Table 5, it is clear that students who accessed more resources tended to do better in both parts of the examination. This could indicate that the more conscientious or motivated students will use whatever resources are available, or indeed that these students would have succeeded anyway, even if the resources had not been available.
Interestingly more students passed the physical chemistry section than the organic section of the end of module examination. Analysis of the type of questions asked showed that students were required to answer mainly calculation type questions in the physical chemistry section, while they had to devise reaction sequences in the organic section. This may have been a contributing factor to the greater success rate in the physical section as a student could achieve high marks in this section by carrying out calculations correctly. Also, the calculation questions were similar to those already performed in lectures and tutorials. The organic section, on the other hand, required linking several different parts of the lecture course together to answer the questions correctly.
Another significant factor in examination success was the students’ prior knowledge of chemistry before entering university. It was found that students with prior experience of chemistry at 2nd level (Leaving Certificate Chemistry) outperformed students who hadn’t done chemistry before (p=0.000). Performance on the organic section of the exam was significantly based on whether students had Leaving Certificate Chemistry or not (p=0.0000, Chi-squared = 20.24). 82% (N=82) of those with Leaving Certificate Chemistry, passed the organic section whereas only 51% (N=41) of those without Leaving Certificate Chemistry passed this section.
Accessing lecture notes has a significant positive correlation with examination performance in the organic section. For the individual weekly lecture notes, weeks 1, 3, 4, 5 and 6 showed a significant positive correlation between those who accessed the notes and those who didn’t, in relation to their organic exam performance (see Table 6). It is worth noting that this data only considers whether the students had accessed the resource themselves; it does not account for students receiving copies from others or even if students actually used the resource in their learning.
Chemistry Education Research and Practice, 2007, 8 (4), 390-402.
This journal is © The Royal Society of Chemistry

J. Lovatt, O.E. Finlayson and P. James 398
Table 6. Performance in organic chemistry in relation to lecture note access.
Proportion of students who passed the organic chemistry exam b
Chi-squared values p values Resource
Accessed Not Accessed Wk1 notes 70% (N=167) 43% (N= 14) 4.39 0.036 Wk3 notes 70% (N=164) 41% (N= 17) 6.18 0.013 Wk4 notes 70% (N=162) 43% (N= 19) 4.59 0.036 Wk5 notes 73% (N=156) 36% (N= 25) 13.60 0.000 Wk6 notes 71% (N=150) 52% (N= 31) 4.59 0.032
b % value in table refers to % of N value (e.g. 70% of the 167 students who accessed week 1 notes passed the organic section of the examination paper while only 43% of the 14 students
who did not access the same notes passed).
Likewise, quiz access was significant in terms of organic examination success (Chi-square = 10.35, p=0.008). 74% of those who accessed the quizzes passed the exam (N=144) and 54% of those who didn’t access any of the quizzes scored below 40% (N=37). The students who passed the exam accessed an average of 2.8 quizzes, and those who scored below 40% in the exam accessed an average of 2.0 quizzes.
Quiz attempts versus exam performance was further examined with respect to students’ prior knowledge of chemistry. Students with higher level Leaving Certificate Chemistry who attempted Quiz 1 did significantly better in their module exam (p=0.038) than those who didn’t attempt the quiz. There was no other significance for the remaining quizzes for this cohort. Students without Leaving Certificate Chemistry who attempted quiz 1 and 2a did significantly better in their module exam than those who didn’t (Table 7). These differences were also observed for the remaining quizzes but the magnitudes of the differences were not statistically significant.
Table 7. Non Chemistry Leaving Certificate students’ exam performance in relation to quiz access.
Quiz Usage a N Mean % overall exam
Mean % Organic
Mean % Physical
CS102 Sig
Organic Sig
Phys Sig
Didn’t 42 39.2 36.0 42.5 0.015* 0.050* 0.016* Quiz 1 Did 36 49.5 46.1 52.9 Didn’t 60 40.8 37.0 44.5 0.005* 0.010* 0.017* Quiz 2a Did 18 54.6 56.6 56.7
a Did/ Didn’t refers to quiz access
Drop-in-Science Clinic (DISC) DISC was available to the first year students during the last six weeks of the semester and
for the two week study break before the examination. Only eighteen students attended during the semester, averaging two visits per student (actual number of visits varied from one to four). During the study break 32% of the first year students attended. Interestingly these students were from all levels in the class – first class honours students as well as those who had failed first semester examinations. Only 26% of the attendees had failed the first semester examination. Therefore, it had a broad range of appeal.
While 17% of the students who visited the clinics did so on at least five occasions during the study break, and many stayed for several hours, 37% visited only once. These students, who visited only once, arrived with specific problems and generally left confident that they had resolved their issues. The areas where student questions arose were 61% chemistry, 28% physics and 11% biology.
Chemistry Education Research and Practice, 2007, 8 (4), 390-402.
This journal is © The Royal Society of Chemistry
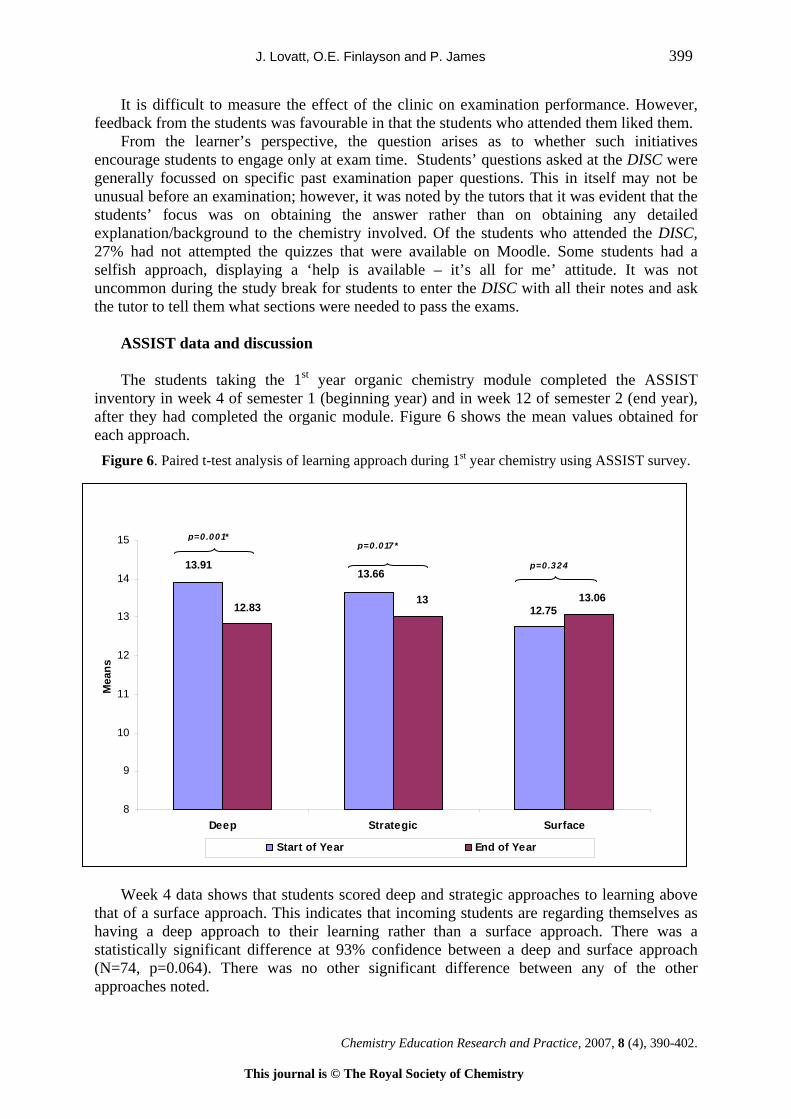
J. Lovatt, O.E. Finlayson and P. James 399
It is difficult to measure the effect of the clinic on examination performance. However, feedback from the students was favourable in that the students who attended them liked them.
From the learner’s perspective, the question arises as to whether such initiatives encourage students to engage only at exam time. Students’ questions asked at the DISC were generally focussed on specific past examination paper questions. This in itself may not be unusual before an examination; however, it was noted by the tutors that it was evident that the students’ focus was on obtaining the answer rather than on obtaining any detailed explanation/background to the chemistry involved. Of the students who attended the DISC, 27% had not attempted the quizzes that were available on Moodle. Some students had a selfish approach, displaying a ‘help is available – it’s all for me’ attitude. It was not uncommon during the study break for students to enter the DISC with all their notes and ask the tutor to tell them what sections were needed to pass the exams.
ASSIST data and discussion The students taking the 1st year organic chemistry module completed the ASSIST
inventory in week 4 of semester 1 (beginning year) and in week 12 of semester 2 (end year), after they had completed the organic module. Figure 6 shows the mean values obtained for each approach. Figure 6. Paired t-test analysis of learning approach during 1st year chemistry using ASSIST survey.
13.6613.91
12.7512.8313 13.06
8
9
10
11
12
13
14
15
Deep Strategic Surface
Mea
ns
Start of Year End of Year
p=0.001*
p=0.324
p=0.017*
Week 4 data shows that students scored deep and strategic approaches to learning above that of a surface approach. This indicates that incoming students are regarding themselves as having a deep approach to their learning rather than a surface approach. There was a statistically significant difference at 93% confidence between a deep and surface approach (N=74, p=0.064). There was no other significant difference between any of the other approaches noted.
Chemistry Education Research and Practice, 2007, 8 (4), 390-402.
This journal is © The Royal Society of Chemistry
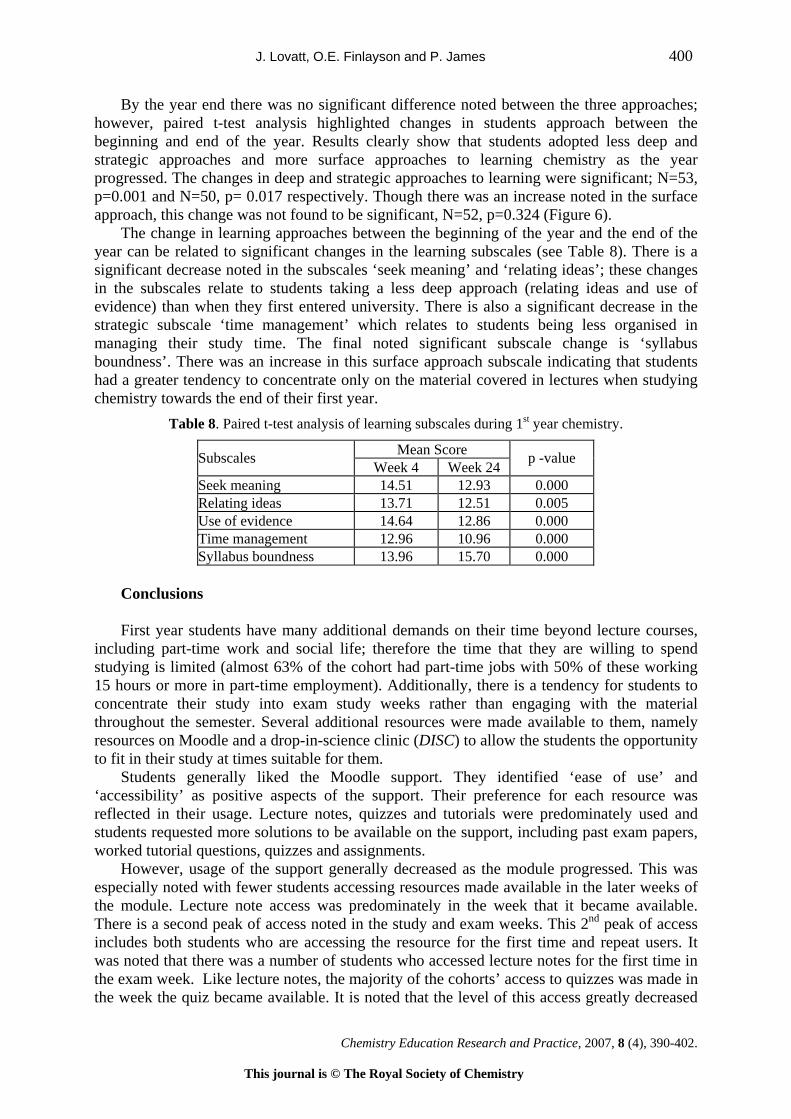
J. Lovatt, O.E. Finlayson and P. James 400
By the year end there was no significant difference noted between the three approaches; however, paired t-test analysis highlighted changes in students approach between the beginning and end of the year. Results clearly show that students adopted less deep and strategic approaches and more surface approaches to learning chemistry as the year progressed. The changes in deep and strategic approaches to learning were significant; N=53, p=0.001 and N=50, p= 0.017 respectively. Though there was an increase noted in the surface approach, this change was not found to be significant, N=52, p=0.324 (Figure 6).
The change in learning approaches between the beginning of the year and the end of the year can be related to significant changes in the learning subscales (see Table 8). There is a significant decrease noted in the subscales ‘seek meaning’ and ‘relating ideas’; these changes in the subscales relate to students taking a less deep approach (relating ideas and use of evidence) than when they first entered university. There is also a significant decrease in the strategic subscale ‘time management’ which relates to students being less organised in managing their study time. The final noted significant subscale change is ‘syllabus boundness’. There was an increase in this surface approach subscale indicating that students had a greater tendency to concentrate only on the material covered in lectures when studying chemistry towards the end of their first year.
Table 8. Paired t-test analysis of learning subscales during 1st year chemistry.
Mean Score Subscales Week 4 Week 24 p -value
Seek meaning 14.51 12.93 0.000 Relating ideas 13.71 12.51 0.005 Use of evidence 14.64 12.86 0.000 Time management 12.96 10.96 0.000 Syllabus boundness 13.96 15.70 0.000
Conclusions First year students have many additional demands on their time beyond lecture courses,
including part-time work and social life; therefore the time that they are willing to spend studying is limited (almost 63% of the cohort had part-time jobs with 50% of these working 15 hours or more in part-time employment). Additionally, there is a tendency for students to concentrate their study into exam study weeks rather than engaging with the material throughout the semester. Several additional resources were made available to them, namely resources on Moodle and a drop-in-science clinic (DISC) to allow the students the opportunity to fit in their study at times suitable for them.
Students generally liked the Moodle support. They identified ‘ease of use’ and ‘accessibility’ as positive aspects of the support. Their preference for each resource was reflected in their usage. Lecture notes, quizzes and tutorials were predominately used and students requested more solutions to be available on the support, including past exam papers, worked tutorial questions, quizzes and assignments.
However, usage of the support generally decreased as the module progressed. This was especially noted with fewer students accessing resources made available in the later weeks of the module. Lecture note access was predominately in the week that it became available. There is a second peak of access noted in the study and exam weeks. This 2nd peak of access includes both students who are accessing the resource for the first time and repeat users. It was noted that there was a number of students who accessed lecture notes for the first time in the exam week. Like lecture notes, the majority of the cohorts’ access to quizzes was made in the week the quiz became available. It is noted that the level of this access greatly decreased
Chemistry Education Research and Practice, 2007, 8 (4), 390-402.
This journal is © The Royal Society of Chemistry

J. Lovatt, O.E. Finlayson and P. James 401
with respect to the later resources. Quiz 1 was accessed 140 times, but the final quiz, Quiz 4b, was only accessed 35 times.
Students who interacted with the module supports did better in their exams. However, it is not suggested that it is as a direct result of the provision of the support. It is merely an indication that students who were motivated/interested in using all available help in their studies did better in their examinations. It was observed that in particular, the effect of interacting with the on-line quizzes was more pronounced for students without Leaving Certificate Chemistry than for those with Leaving Certificate Chemistry. A Virtual Learning Environment (VLE) provides an additional source of course material and is accessible; these are the features that students like and they have now come to expect to be available to them. The experience of the Drop-in-Science Clinic (DISC) supports the belief that students do wish to succeed in the examinations. However, the fact that significant numbers access material for the first time only during exam weeks, that they don’t interact with supports available until exam weeks, shows that we must use the VLE and other supports in a way that is much more beneficial and encouraging to the student. Many like the idea of lecture notes being available on VLE – so that there is security in knowing they are accessible at any time. Coupled with the changing approach that is adopted over the year, it appears that this is not the way to encourage independent learning in students.
The implication of this work is that efforts must be made to encourage more student interaction with their respective courses in conjunction with encouraging students to adopt a deep approach to their learning. It is suggested that this may be achieved through tutorials, interesting and lecture-linked laboratory sessions and through continuous and suitable assessment methods. The VLE initiative is currently being developed for use as a continuous assessment tool as well as a support for student learning. At present, links between student approaches and individual patterns of access to Moodle are being investigated and will be reported on in the future.
References
Bell M., Bush D., Nicholson P., O’Brien D. and Tran T., (2002), A survey of online education and
services in Australia, [online: https://www.ucisa.ac.uk/groups/tlig/vle/vle2003.pdf] (last accessed June 2007)
Biggs J., (1979), Individual differences in study processes and the quality of learning outcomes, Higher Education, 8, 381-394
Boyle T., Bradley C., Chalk P., Jones R. and Pickard, P., (2003), Using blended learning to improve student success rates in learning to program, Learning Media and Technology, 28, 165-178
Browne T. and Jenkins M., (2003), VLE surveys: A longitudinal perspective between March 2001 and March 2003 for Higher Education in the United Kingdom, [online: https://www.ucisa.ac.uk/groups/tlig/vle/vle2003.pdf] (last access March 2007)
Byers, B. (2006) Developing independent learners in chemistry, Report from ECTN Working party, [online:http://www.cpe.fr/ectn-assoc/archives/lib/2006/N03/200603_DILC_FinalRep2006.pdf]
(last accessed June 2007) Entwistle N., (2000), Promoting deep learning through teaching and assessing conceptual frameworks
and educational contexts [online: http://www.ed.ac.uk/etl/docs/entwistle2000.pdf] Fensham P., (2004), Engagement with science: an international issue that goes beyond knowledge,
Paper presented at SMEC 2004, Dublin [online: http://www.dcu.ie/smec/plenary/Fensham,%20Peter.pdf]
Higher Education Authority, (2004), Creating Ireland’s knowledge society: proposals for higher education reform, HEA, Dublin
Kelly O., Finlayson O.E. and Wilson, A., (2005), Investigation into gender differences in approach to learning of undergraduate science students, In R. Pinto and D. Couso, (Eds.), Proceedings of the
Chemistry Education Research and Practice, 2007, 8 (4), 390-402.
This journal is © The Royal Society of Chemistry

J. Lovatt, O.E. Finlayson and P. James 402
Fifth International ESERA Conference on Contributions of research to enhancing students’ interest in learning science, Barcelona, Spain.
Lovatt J., Finlayson O.E. and James P., (2005), Development and evaluation of approaches to student teaching and learning of chemistry at tertiary level using a VLE platform, In R. Pinto and D. Couso, (Eds.), Proceedings of the Fifth International ESERA Conference on Contributions of research to enhancing students’ interest in learning science, Barcelona, Spain.
Marton F. and Saljo R., in Ramsden, P., (1992), Learning to teach in higher education, p. 45, Routledge..
Ramsden P., (1992), Learning to teach in higher education, p. 42, Routledge. Rogers, G., (2004), History, learning technology and student achievement. Making the difference,
Active Learning in Higher Education, 5, 232-247 Sharpe R., Benfield G. and Francis R., (2006), Implementing a university e-learning strategy: levers
for change within academic schools, ALT-J, Research in Learning Technology, 14, 135-151
Chemistry Education Research and Practice, 2007, 8 (4), 390-402.
This journal is © The Royal Society of Chemistry
Themed Issue on Research and Practice in Chemical Education in Advanced Courses Scheduled for publication in April 2008 Guest Editors: George M. Bodner and Gabriela C. Weaver, Purdue University, Department of Chemistry, West Lafayette, IN 47907 CALL FOR PAPERS Contributions are invited for a themed, peer-reviewed issue of CERP on Research and Practice in Chemical Education in Advanced Courses The contributions will be of two kinds: (a) research-based papers; (b) papers on effective practice*. Possible subjects for contributions include:
• Learning chemistry in analytical, biochemistry, inorganic, organic, or physical chemistry courses for undergraduate chemistry majors, engineering majors, or students from other sciences.
• Learning chemistry in graduate-level courses in analytical, biochemistry, inorganic, organic, or physical chemistry.
• Students’ attitudes toward and interest in advanced-level chemistry courses. • Students’ perceptions of the learning environment in advanced-level chemistry
courses. • Assessing students’ performance, progress and achievement using non-
traditional modes of assessment in advanced-level courses. • Incorporating non-traditional modes of instruction and inquiry-based instruction in
upper-level chemistry courses. • Incorporating molecular visualization and/or simulations into upper-level
chemistry courses for undergraduates or graduate students. • The training of teaching assistants and other forms of professional development
as part of graduate education. • Non-traditional models of laboratory instruction or research about laboratory
instruction in advanced-level chemistry courses. Papers can refer to one or more of the advanced or upper-level courses taught at the college or university level to undergraduates or graduate students. The list is intended to suggest the scope of possible contributions, but it is not exclusive. ________________________ * Please note that papers that describe innovative approaches to teaching chemistry in advanced courses that do not provide some evidence about their actual effectiveness on learning and/or student motivation and interest, which is what is meant by ”effective practice”, will not be given consideration.
_____________________ • Submissions of manuscripts (in the format required by the journal - see guidelines
on the journal homepage at http://www.rsc.org/Education/CERP/guidelines.asp ) or enquiries concerning the suitability of possible contributions should be sent directly by e-mail to: George Bodner, Department of Chemistry, Purdue University, West Lafayette, IN, 47907 (USA), [email protected]. Please copy your correspondence also to [email protected].
• IMPORTANT DATES: Submission of manuscripts by: October 31, 2007. Potential
contributions will be subject to the journal’s usual peer-review process. Where revisions are required, these must be submitted by February 15, 2008.