Embed Size (px)
Citation preview
CHEMISTRY AND PHARMACOLOGY OF KINKÉLIBA (COMBRETUM
MICRANTHUM), A WEST AFRICAN MEDICINAL PLANT
By
CARA RENAE WELCH
A Dissertation submitted to the
Graduate School-New Brunswick
Rutgers, The State University of New Jersey
in partial fulfillment of the requirements
for the degree of
Doctor of Philosophy
Graduate Program in Medicinal Chemistry
written under the direction of
Dr. James E. Simon
and approved by
______________________________
______________________________
______________________________
______________________________
New Brunswick, New Jersey
January, 2010
ii
ABSTRACT OF THE DISSERTATION
Chemistry and Pharmacology of Kinkéliba (Combretum micranthum), a West African
Medicinal Plant
by CARA RENAE WELCH
Dissertation Director: James E. Simon
Kinkéliba (Combretum micranthum, Fam. Combretaceae) is an undomesticated shrub
species of western Africa and is one of the most popular traditional bush teas of Senegal.
The herbal beverage is traditionally used for weight loss, digestion, as a diuretic and mild
antibiotic, and to relieve pain. The fresh leaves are used to treat malarial fever. Leaf
extracts, the most biologically active plant tissue relative to stem, bark and roots, were
screened for antioxidant capacity, measuring the removal of a radical by UV/VIS
spectrophotometry, anti-inflammatory activity, measuring inducible nitric oxide synthase
(iNOS) in RAW 264.7 macrophage cells, and glucose-lowering activity, measuring
phosphoenolpyruvate carboxykinase (PEPCK) mRNA expression in an H4IIE rat
hepatoma cell line. Radical oxygen scavenging activity, or antioxidant capacity, was
utilized for initially directing the fractionation; highlighted subfractions and isolated
compounds were subsequently tested for anti-inflammatory and glucose-lowering
activities. The ethyl acetate and n-butanol fractions of the crude leaf extract were
fractionated leading to the isolation and identification of a number of polyphenolic
iii
compounds. Some of these compounds, the catechins and glycosylflavones, were
previously reported in kinkéliba. Other compounds, the flavans and galloylated C-
glycosylflavone derivatives, are being reported for the first time in this species and
family. Finally, a group of major constituents in the kinkéliba leaves were discovered to
be a series of compounds with a new skeleton, a flavan-piperidine alkaloid. The four
kinkéloids, as they are named here first, were isolated and structurally elucidated by 1-
and 2-D NMR spectroscopy and HRMS spectrometry. The catechins and flavans were
the active compounds by antioxidant capacity and epicatechin was identified as a
glucose-lowering compound by PEPCK inhibition. The positive glucose-lowering
activities led to an animal study that tested the activity of the crude extract and ethyl
acetate and n-butanol fractions in mice fed a high-fat diet, resulting in the development of
a diabetic model. After six weeks of daily treatments, the treated groups showed lowered
baseline blood glucose levels as well as decreased PEPCK levels in the liver, strongly
suggesting that kinkéliba constituents may be beneficial in the treatment of Type 2
diabetes.
iv
Dedication
to my husband, Joel
v
Acknowledgements
I would like to begin by thanking Dr. James Simon and Dr. Qing-Li Wu for their
direction, assistance and encouragement throughout this research project. They had a
vision 5 years ago of what this project could become and without their support, it would
not have materialized. Additionally, I owe many other scientists my gratitude for helping
throughout my graduate school career. Dr. Emmanuel Bassene, of the Université Cheikh
Anta Diop, Dakar, Senegal, for sharing his extensive knowledge of kinkéliba throughout
the project. Dr. Babou Diouf and Dr. Malainy Diatta, of ASNAPP-Senegal, for their
assistance with kinkéliba collections and taxonomical authentication. Here at Rutgers, I
thank all the NUANPP lab group members, specifically Drs. H. Rodolfo Juliani and
Adolfina Koroch, for their support, both in and out of the lab. Dr. Diandian Shen, thank
you for paving the road ahead of me and being an excellent office mate; Julia Coppin and
Yanping Xu, thank you both for coming behind me to give the extra push when I was
stranded and entertaining me during the long days in the lab. I owe huge thanks to Dr.
Slavko Komarnytsky (and Dr. Ilya Raskin) for joining the project at the perfect time to
provide the technical expertise in the application of cell culture assays and animal studies.
He helped steer my project to completion, gave it a promising future, and did all with a
good sense of humor.
This work was conducted in part by the Partnership for Food and Industry in Natural
Products (PFID/NP) project and ASNAPP with funds from the Office of Economic
Growth, Agriculture and Trade of the USAID (Leader Contract Award No. AEG-A-00-
04-00012-00) and an Associate Award (Associate Cooperative Agreement No. 690-A-00-
06-00126-00) from the USAID-Regional Center for Southern Africa. I thank Jerry
vi
Brown, Carol Brown, Larry Paulson, and Bob Hedlund, USAID Cognizant Technical
Officers for their active involvement, support and encouragement to begin examining the
potential development of kinkéliba as a bush tea with funding from the USAID (Contract
Award No. HFM-O-00-01-00116). This research was also conducted in support of the
National Botanical Center for Age-Related Diseases (NIH grant OD-00-004) in searching
for alternative sources of anti-inflammatory products. Funds and support were also
provided by the NUANPP, the New Jersey Agriculture Experiment Station and the
School of Environmental and Biological Sciences. And, of course, my gratitude is
extended to those Senegalese communities and African small farmers who were gracious
to provide the kinkéliba plant materials to ASNAPP-Senegal, who have always opened
their doors to us and for whom it is our hope that this research may benefit and expand
their economic opportunities by increasing the market interest in this natural product.
There are so many people outside of my research who encouraged me, it’s too many to
mention. But I thank Dr. James Gloer for advising me at the beginning of my graduate
career and helping to foster a love of natural products. The Gloer group members,
specifically Dr. Stephen Deyrup and Dr. Ani Jordan, who graciously invited me to Gloer
group functions long after I left Iowa, I thank you. Chad and Rachel Bareither, Dean and
Kathleen Macke and Charlie and Olivia Florek, I thank you all for giving me nonstop
encouragement, allowing me to escape from the lab and, most of all, making my life in
New Jersey wonderful. I love you all so much. Finally and most importantly, I must
thank my family. To my Welch family, you have welcomed me into your arms and I
thank you for offering your endless encouragement. You’ve done this before and still,
you managed to stand by another child through the trials of graduate school. I thank my
vii
parents, who deserve the credit for whatever I’ve accomplished. Dad, you’ve taught me a
great deal inside of school and even more outside. Mom, you’re an inspiration for me to
be a strong woman. Rachel, you are the most amazing (real!) doctor I know and the best
sister I could have hoped for. Steve and Angie, thank you for your support and the gift of
the best nephews and niece a girl could ask for; Skyler, Isaac, and Josie, I love you all so
much. And finally Joel, I dedicated this work to you because I couldn’t have done it
without you. You’ve supported me in too many ways to count. You’ve forged the way
before me but hang back to pull me along...you complete me. I love you and I thank you!
viii
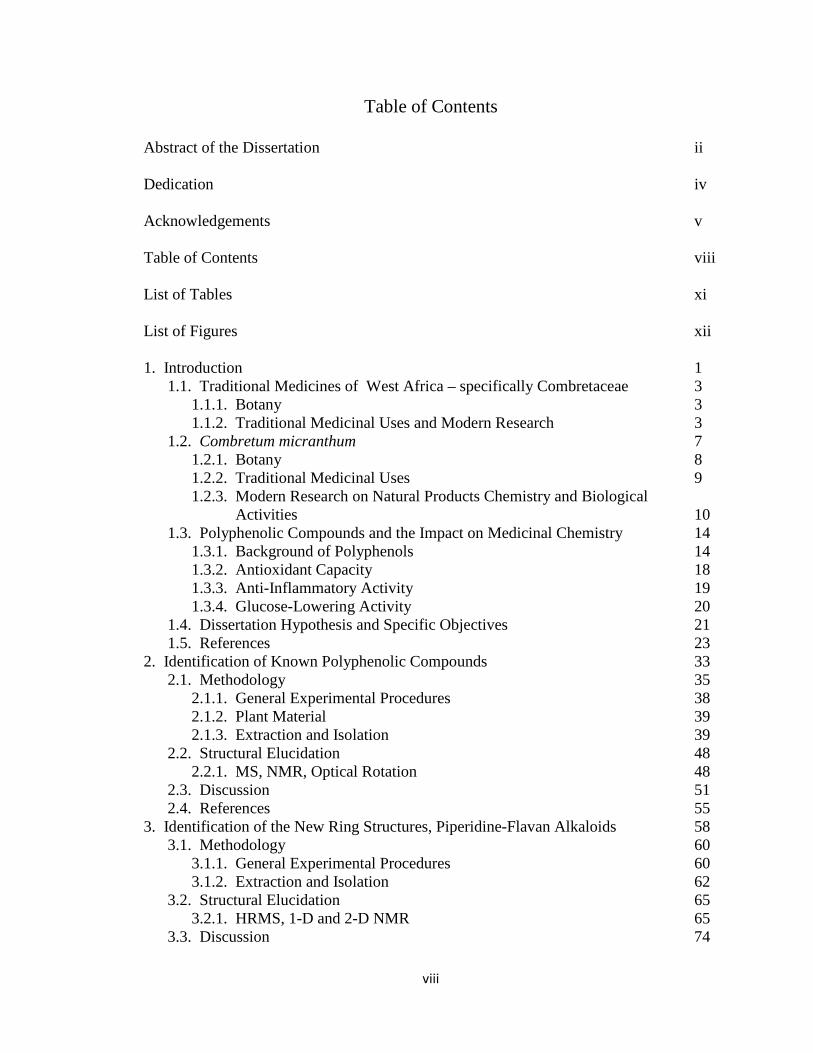
Table of Contents
Abstract of the Dissertation ii
Dedication iv
Acknowledgements v
Table of Contents viii
List of Tables xi
List of Figures xii
1. Introduction 1 1.1. Traditional Medicines of West Africa – specifically Combretaceae 3
1.1.1. Botany 3 1.1.2. Traditional Medicinal Uses and Modern Research 3
1.2. Combretum micranthum 7 1.2.1. Botany 8 1.2.2. Traditional Medicinal Uses 9 1.2.3. Modern Research on Natural Products Chemistry and Biological Activities 10
1.3. Polyphenolic Compounds and the Impact on Medicinal Chemistry 14 1.3.1. Background of Polyphenols 14 1.3.2. Antioxidant Capacity 18 1.3.3. Anti-Inflammatory Activity 19 1.3.4. Glucose-Lowering Activity 20
1.4. Dissertation Hypothesis and Specific Objectives 21 1.5. References 23
2. Identification of Known Polyphenolic Compounds 33 2.1. Methodology 35
2.1.1. General Experimental Procedures 38 2.1.2. Plant Material 39 2.1.3. Extraction and Isolation 39
2.2. Structural Elucidation 48 2.2.1. MS, NMR, Optical Rotation 48
2.3. Discussion 51 2.4. References 55
3. Identification of the New Ring Structures, Piperidine-Flavan Alkaloids 58 3.1. Methodology 60
3.1.1. General Experimental Procedures 60 3.1.2. Extraction and Isolation 62
3.2. Structural Elucidation 65 3.2.1. HRMS, 1-D and 2-D NMR 65
3.3. Discussion 74
ix
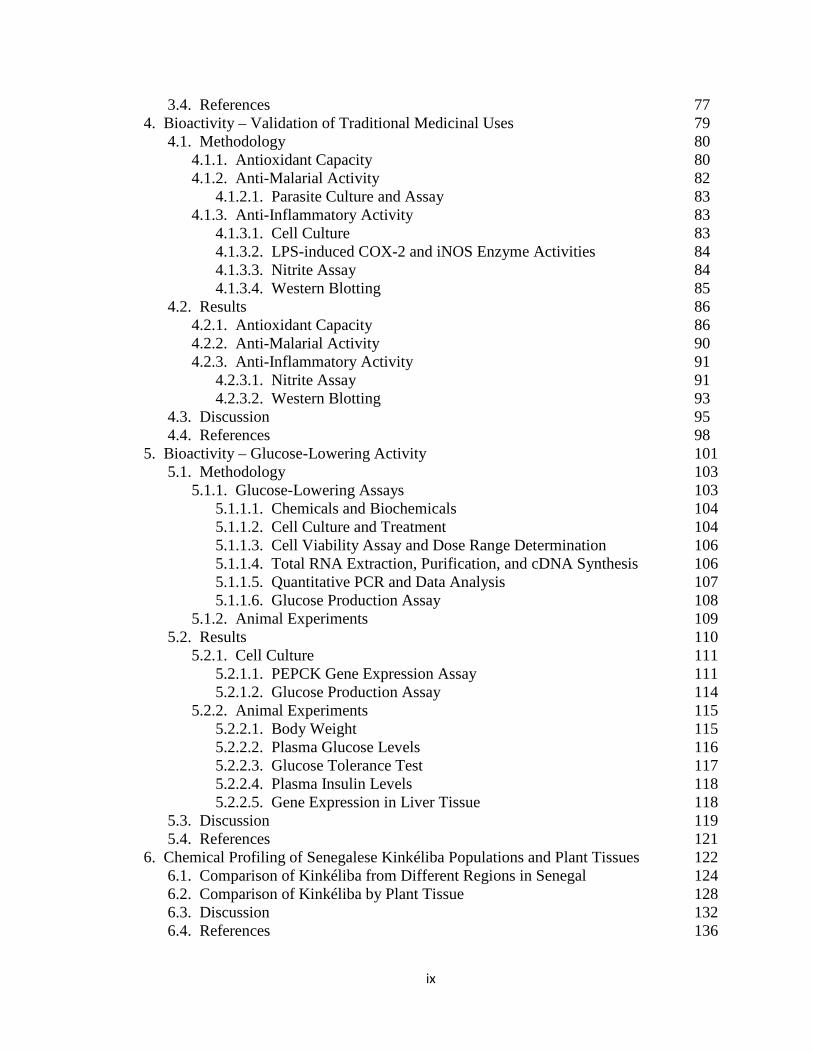
3.4. References 77 4. Bioactivity – Validation of Traditional Medicinal Uses 79
4.1. Methodology 80 4.1.1. Antioxidant Capacity 80 4.1.2. Anti-Malarial Activity 82
4.1.2.1. Parasite Culture and Assay 83 4.1.3. Anti-Inflammatory Activity 83
4.1.3.1. Cell Culture 83 4.1.3.2. LPS-induced COX-2 and iNOS Enzyme Activities 84 4.1.3.3. Nitrite Assay 84 4.1.3.4. Western Blotting 85
4.2. Results 86 4.2.1. Antioxidant Capacity 86 4.2.2. Anti-Malarial Activity 90 4.2.3. Anti-Inflammatory Activity 91
4.2.3.1. Nitrite Assay 91 4.2.3.2. Western Blotting 93
4.3. Discussion 95 4.4. References 98
5. Bioactivity – Glucose-Lowering Activity 101 5.1. Methodology 103
5.1.1. Glucose-Lowering Assays 103 5.1.1.1. Chemicals and Biochemicals 104 5.1.1.2. Cell Culture and Treatment 104 5.1.1.3. Cell Viability Assay and Dose Range Determination 106 5.1.1.4. Total RNA Extraction, Purification, and cDNA Synthesis 106 5.1.1.5. Quantitative PCR and Data Analysis 107 5.1.1.6. Glucose Production Assay 108
5.1.2. Animal Experiments 109 5.2. Results 110
5.2.1. Cell Culture 111 5.2.1.1. PEPCK Gene Expression Assay 111 5.2.1.2. Glucose Production Assay 114
5.2.2. Animal Experiments 115 5.2.2.1. Body Weight 115 5.2.2.2. Plasma Glucose Levels 116 5.2.2.3. Glucose Tolerance Test 117 5.2.2.4. Plasma Insulin Levels 118 5.2.2.5. Gene Expression in Liver Tissue 118
5.3. Discussion 119 5.4. References 121
6. Chemical Profiling of Senegalese Kinkéliba Populations and Plant Tissues 122 6.1. Comparison of Kinkéliba from Different Regions in Senegal 124 6.2. Comparison of Kinkéliba by Plant Tissue 128 6.3. Discussion 132 6.4. References 136
x
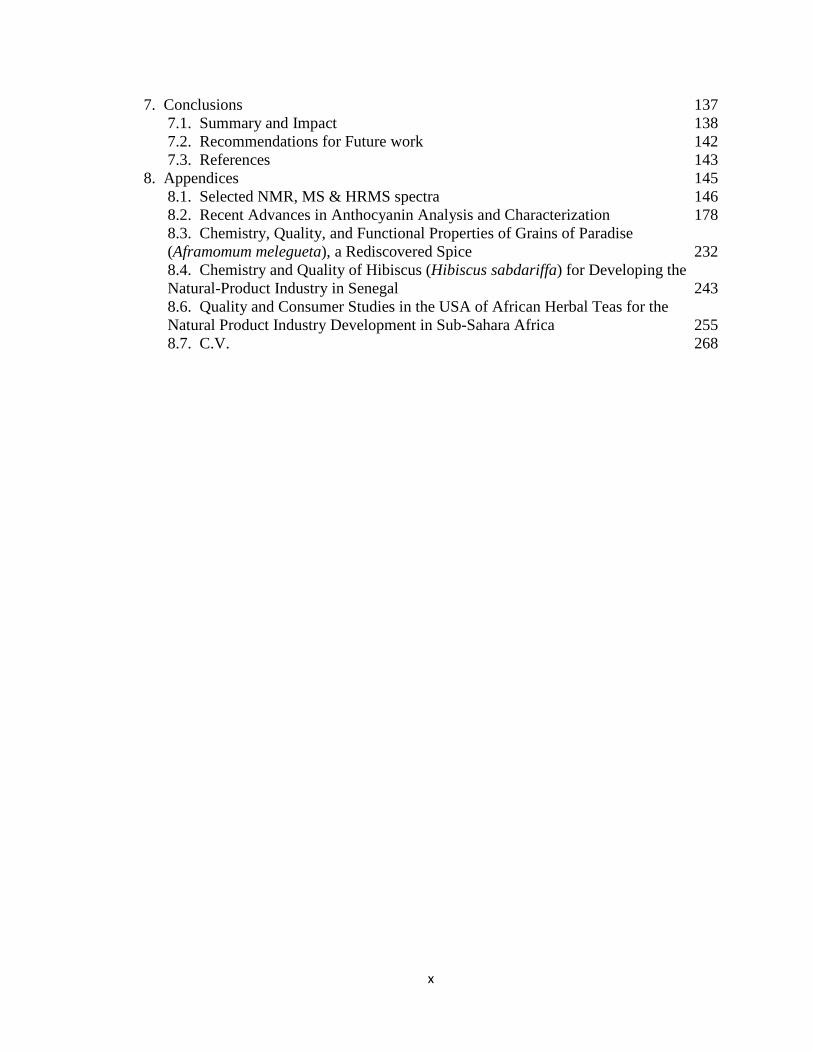
7. Conclusions 137 7.1. Summary and Impact 138 7.2. Recommendations for Future work 142 7.3. References 143
8. Appendices 145 8.1. Selected NMR, MS & HRMS spectra 146 8.2. Recent Advances in Anthocyanin Analysis and Characterization 178 8.3. Chemistry, Quality, and Functional Properties of Grains of Paradise (Aframomum melegueta), a Rediscovered Spice 232 8.4. Chemistry and Quality of Hibiscus (Hibiscus sabdariffa) for Developing the Natural-Product Industry in Senegal 243 8.6. Quality and Consumer Studies in the USA of African Herbal Teas for the Natural Product Industry Development in Sub-Sahara Africa 255 8.7. C.V. 268
xi
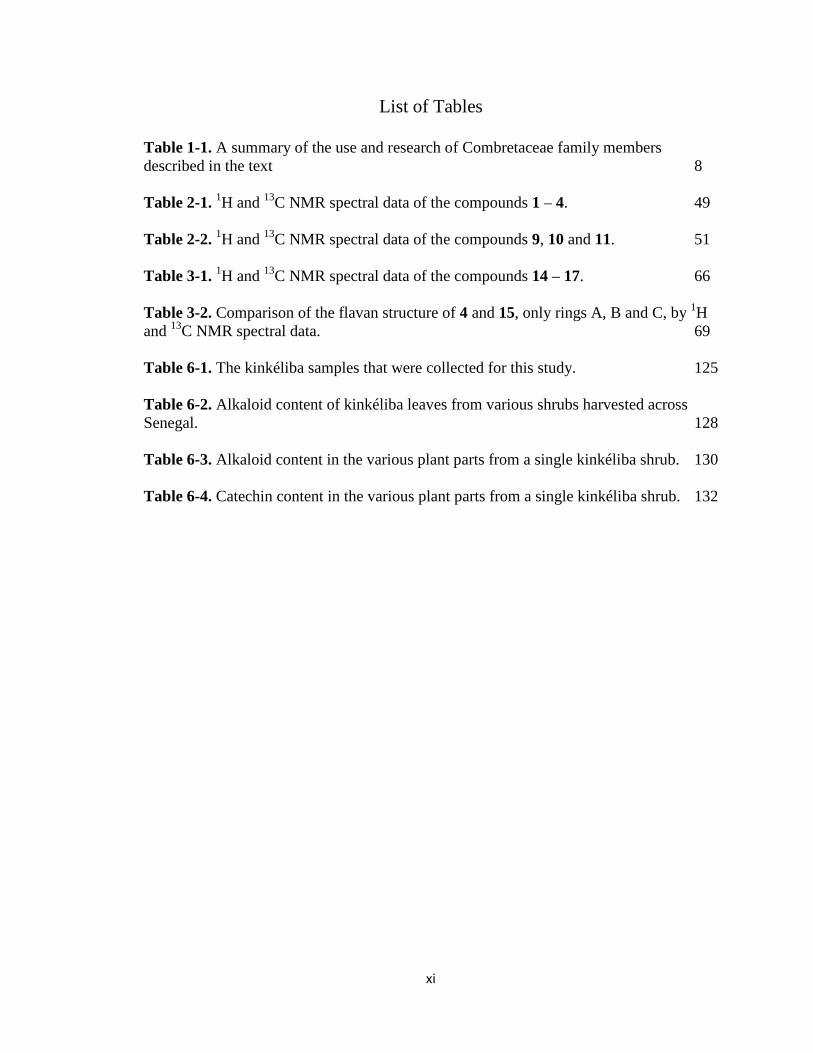
List of Tables
Table 1-1. A summary of the use and research of Combretaceae family members described in the text 8 Table 2-1. 1H and 13C NMR spectral data of the compounds 1 – 4. 49 Table 2-2. 1H and 13C NMR spectral data of the compounds 9, 10 and 11. 51 Table 3-1. 1H and 13C NMR spectral data of the compounds 14 – 17. 66 Table 3-2. Comparison of the flavan structure of 4 and 15, only rings A, B and C, by 1H and 13C NMR spectral data. 69 Table 6-1. The kinkéliba samples that were collected for this study. 125 Table 6-2. Alkaloid content of kinkéliba leaves from various shrubs harvested across Senegal. 128 Table 6-3. Alkaloid content in the various plant parts from a single kinkéliba shrub. 130 Table 6-4. Catechin content in the various plant parts from a single kinkéliba shrub. 132
xii
List of Figures Figure 1-1. Structures of the isolated compounds from other Combretaceae species. 6 Figure 1-2. The previously identified compounds from the modern chemical analyses of kinkéliba. 12 Figure 1-3. Examples of the four classes of polyphenols: phenolic acids, lignans, flavonoids and stilbenes. 15 Figure 1-4. Examples of the eight classes of flavonoids. 16 Figure 2-1. The isolated compounds from the EtOAc extract of the kinkéliba leaf crude extract. 36 Figure 2-2. Flowchart for the isolation of compounds from the EtOAc extract of the kinkéliba leaf crude extract. 37 Figure 2-3. Comparison of the UV chromatograms, 254 nm, of LE-5-6 and isolated compounds (1 – 4). 42 Figure 2-4. Comparison of the UV chromatograms, 254 nm, of LE-10 and the isolated compounds (5 – 13). 46 Figure 2-5. Comparison of the UV chromatograms, 254 nm, to confirm the stereoisomers. 49 Figure 2-6. Comparison of the UV chromatograms, 254 nm, to confirm the presence of vitexin. 50 Figure 3-1. Structures of the piperidine-flavan alkaloids. 60 Figure 3-2. Flowchart for the isolation of the new piperidine-flavan alkaloids from the nBuOH fraction of the kinkéliba leaf crude extract. 61 Figure 3-3. Comparison of the UV chromatograms, 270 nm, of LB and the four flavan alkaloids (14 – 17). 64 Figure 3-4. MS spectra of the four flavan alkaloids. 67 Figure 3-5. High-resolution ESI-MS spectrum of kinkéloid B (15). 70 Figure 3-6. Proposed RDA mass spectrometric fragmentation of kinkéloid B (15). 71 Figure 3-7. HMBC correlations of kinkéloid B (15). 71
xiii
Figure 3-8. Total ion chromatogram comparison of the kinkéloid B samples utilized for HMBC spectra. 72 Figure 3-9. Description of rotation around the bond to form the C-6 and C-8 piperidine attachment of kinkéloid B (15). 74 Figure 3-10. The structures of similar flavonoid alkaloids. 76 Figure 4-1. The reaction of the spectrophotometric antioxidant capacity assay. 81 Figure 4-2. The structures of the standards for the in vitro assays. 82 Figure 4-3. Antioxidant capacity of kinkéliba plant parts, leaf, root and stem bark, by TEAC spectrophotometric assay. 87 Figure 4-4. Antioxidant capacity of the kinkéliba fractionation covering the LE subfractions and isolated compounds. 88 Figure 4-5. Antioxidant capacity of the kinkéliba fractionation covering the LB subfractions. 89 Figure 4-6. Initial anti-malarial activity. 90 Figure 4-7. Anti-inflammatory activity of the plant parts and leaf fractionation. 91 Figure 4-8. Western blotting of kinkéliba on iNOS and COX-2 protein expression. 94 Figure 5-1. The fractionation of LB for additional PEPCK testing. 105 Figure 5-2. Initial cell viability testing. 111 Figure 5-3. Initial PEPCK testing. 112 Figure 5-4. Glucose production and PEPCK inhibition of the LE and LB fractionation. 113 Figure 5-5. PEPCK inhibition of the LB silica column subfractions. 114 Figure 5-6. Animal study results. 115 Figure 5-7. Acute glucose experiments. 117 Figure 5-8. Glucose tolerance test. 118 Figure 5-9. PEPCK levels in the liver. 119
xiv
Figure 6-1. The compounds that were chemically profiled across populations of Senegalese kinkéliba as well as in different plant tissues of a single shrub. 124 Figure 6-2. Locations of the kinkéliba populations marked on a map. 126 Figure 6-3. Five representative chromatograms (TIC) of the kinkéliba plant extracts collected across Senegal. 129 Figure 6-4. Comparison of the chromatograms (TIC) of the four kinkéliba plant tissue extracts. 131 Figure 6-5. Comparison of the chromatograms (SIM) of the four kinkéliba plant tissue extracts and the catechin standards. 133 Figure App-1. 1H spectrum of kinkéloid B (15), LB-34-19c+15d. 146 Figure App-2. 1H spectrum of kinkéloid B (15), zoomed in to show 4.5 – 9 ppm. 147 Figure App-3. 1H spectrum of kinkéloid B (15), zoomed in to show 1.5 – 5 ppm. 148 Figure App-4. 13C spectrum of kinkéloid B (15), LB-34-19c+15d. 149 Figure App-5. 13C spectrum of kinkéloid B (15), zoomed in to show 90 – 160 ppm. 150 Figure App-6. 13C spectrum of kinkéloid B (15), zoomed in to show 10 – 90 ppm. 151 Figure App-7. COSY spectrum of kinkéloid B (15), LB-34-19c+15d. 152 Figure App-8. COSY spectrum of kinkéloid B (15), zoomed in to show 1.5 – 5 ppm. 153 Figure App-9. HSQC spectrum of kinkéloid B (15), LB-34-19c+15d. 154 Figure App-10. HMBC spectrum of kinkéloid B1 (15), LB-34-19c+15d. 155 Figure App-11. HMBC spectrum of kinkéloid B1 (15), zoomed in to show 4.5 – 7.5 ppm. 156 Figure App-12. HMBC spectrum of kinkéloid B1 (15), zoomed in to show 1.5 – 4 ppm. 157 Figure App-13. HMBC spectrum of kinkéloid B1:B2 (15), LB-34-44c. 158 Figure App-14. HMBC spectrum of kinkéloid B1:B2 (15), zoomed in to show 5.5 – 7.5 ppm. 159 Figure App-15. 1H spectrum of kinkéloid A (14), LB-31-1-1. 160
xv
Figure App-16. 1H spectrum of kinkéloid A (14), zoomed in to show 4 – 9 ppm. 161 Figure App-17. 1H spectrum of kinkéloid A (14), zoomed in to show 1 – 4 ppm. 162 Figure App-18. 13C spectrum of kinkéloid A (14), LB-31-1-1. 163 Figure App-19. 13C spectrum of kinkéloid A (14), zoomed in to show 90 – 160 ppm. 164 Figure App-20. 13C spectrum of kinkéloid A (14), zoomed in to show 10 – 90 ppm. 165 Figure App-21. 1H spectrum of kinkéloid C (16), LB-64-8-25a. 166 Figure App-22. 1H spectrum of kinkéloid C (16), zoomed in to show 4.5 – 9 ppm. 167 Figure App-23. 1H spectrum of kinkéloid C (16), zoomed in to show 1 – 4.5 ppm. 168 Figure App-24. 13C spectrum of kinkéloid C (16), LB-64-8-25a. 169 Figure App-25. 13C spectrum of kinkéloid C (16), zoomed in to show 90 – 160 ppm. 170 Figure App-26. 13C spectrum of kinkéloid C (16), zoomed in to show 15 – 85 ppm. 171 Figure App-27. 1H spectrum of kinkéloid D (17), LB-91-7-43a. 172 Figure App-28. 1H spectrum of kinkéloid D (17), zoomed in to show 4.5 – 9 ppm. 173 Figure App-29. 1H spectrum of kinkéloid D (17), zoomed in to show 1 – 4.5 ppm. 174 Figure App-30. 13C spectrum of kinkéloid D (17), LB-91-7-43a. 175 Figure App-31. 13C spectrum of kinkéloid D (17), zoomed in to show 90 – 160 ppm. 176 Figure App-32. 13C spectrum of kinkéloid D (17), zoomed in to show 15 – 85 ppm. 177
1
Chapter 1. Introduction
2
Traditional plant-based medicines that have been historically used in different parts of the
world or different cultural systems are considered in western medicine as “alternative
medicine”. Since these plants, used singly and/or in combination with other botanicals
and ingredients, have been part of that which cultures pharmacopeia and primary health
care may provide new leads for modern medicine and new chemical entities. In many
regions of the world, such as Africa and Asia, the plants that have been traditionally used
for health care and medicine are still as important today as they have been historically
been both because they represent in many cases the only affordable health care options
and because they are believed to be effective (1-3). Many of these medications have been
shown to be beneficial against a variety of diseases and are popular or even ‘mainstream’
in other countries; yet most have not been validated by modern western science. Several
traditional medicines have been shown to be scientifically effective and a number have
even provided novel mechanisms of therapeutic action against diseases such as cancer,
inflammation, auto-immune, Alzheimer’s, Parkinson’s, malaria and cardiovascular
disease (1, 2, 4-11). Some areas of pharmaceutical therapy depend quite heavily on
natural products, natural product derivatives and natural product mimics, specifically
antibacterials, antiinfectives and antihypertensives (12, 13). Additionally, almost half of
the small molecule anti-cancer drugs approved internationally, from the 1940s to 2006,
were either natural products or directly derived therefrom (14). Natural products
chemistry, a small but successful branch of chemistry, has delivered an impressive
number of antimicrobial, anticancer and antiviral agents that have progressed into
commonly prescribed medications (1, 2, 5, 11-14).
3
1.1. Traditional Medicines of West Africa – specifically Combretaceae
1.1.1. Botany
The Combretaceae family consists of as many as 600 species of trees, shrubs and lianas
in 18 – 20 genera, depending on reports, and is found in tropical and sub-tropical regions,
mostly of Africa and India (15-17). Five genera are commonly found in southern and
western Africa, four of which are tree species and the two largest of which are
Combretum and Terminalia (18). The other genera are Anogeissus, Buchenavia, Bucida,
Calopyxis, Calycopteris, Conocarpus, Dansiea, Guiera, Laguncularia, Lumnitzera,
Macropteranthes, Melostemon, Pteleopsis, Quisqualis, Strephonema, Terminaliopsis and
Thiloa (18). The most commonly occurring genus, Combretum, includes almost 400
species found all across Africa, many of which are widely used in African traditional
medicine (19, 20). The leaves are entire, opposite, oval and without stipules. The flowers
are usually unremarkable, diminutive, light-colored and clustered in axillary heads or
spikes. The ovary is inferior, lengthened and easily mistaken for the flower stalk while
the fruits of Combretum are characteristically 4 – 5-winged (19).
1.1.2. Traditional Medicinal Uses and Modern Research
With more than 80% of people in developing countries dependant on plants for medicinal
treatments, the traditions of collecting, processing and applying plant-based medicines is
a vital skill in many African societies (17). The Combretaceae family of plants has been
widely used as traditional medicines. Many species in Terminalia and Combretum genera
have well-known uses and have been further studied with modern research techniques for
4
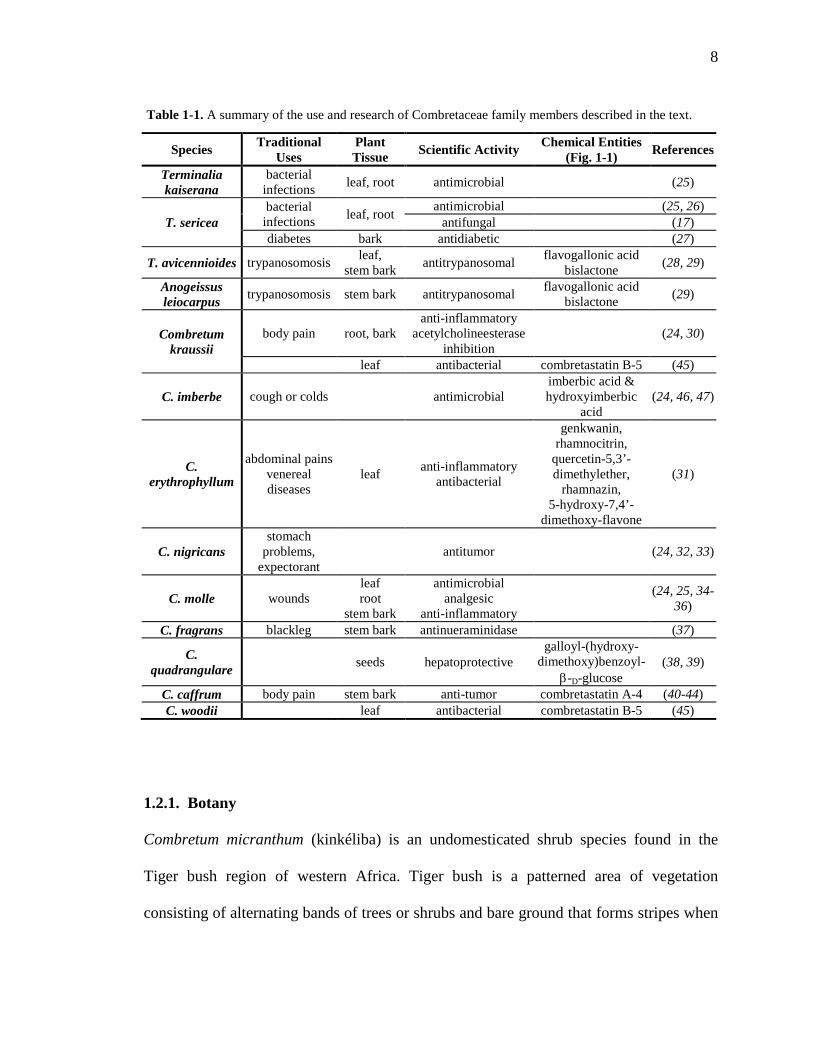
justifying the traditional uses (21). Some plants are described below as well as in Table 1-
1, with many more not mentioned here (19-24).
Terminalia kaiserana and T. sericea have traditionally been used for treating bacterial
infections and Fyhrquist et al. reported the leaf and root extracts of each showed activity
against Staphylococcus aureus, S. epidermidis, Enterobacter aerogenes, Bacillus subtilis
and Micrococcus luteus (25, 26). Additionally, T. sericea showed excellent antifungal
activity against five microorganisms, Candida albicans, Cryptococcus neoformans,
Aspergillus fumigates, Sporothrix schenckii and Microsporum canis (17). The bark of T.
sericea is worked into a porridge for use against diabetes (27). The aqueous extract of T.
avicennioides leaves, from Mali, was shown to reduce parasitemia in mice infected with
Trypanosoma brucei brucei which corresponds to the traditional use of treating
trypanosomoses in both humans and animals (28). Also, the methanol extracts of the stem
bark of T. avicennioides and Anogeissus leiocarpus inhibited four species of
Trypanosoma (T.b. brucei, T.b. gambiense, T.b. rhodesiense and T. evansi) and the
activity could be attributed to a number of isolated compounds including flavogallonic
acid bislactone (29), as seen in Fig. 1-1.
A number of Combretum species have been examined, in relation to their traditional uses,
and some are included below. The South African tree, Combretum kraussii, was
conventionally used for body pain by bathing in the root powder decoction (24). The
ethyl acetate fraction of the leaves demonstrated significant activity against
cyclooxygenase-1 (COX-1), COX-2 and the ethanol extract of the bark gave impressive
5
inhibition of acetylcholineesterase enzyme activity (30). The leaves of C. imberbe were
commonly used for treatment of cough or colds by drinking the brewed tea or inhaling
the burnt leaves (24). Modern research demonstrated excellent antimicrobial activity
(against Mycobacterium fortuitum, Staphylococcus aureus, and Escherichia coli) which
led to further examination and the isolation and identification of a number of triterpenes,
including imberbic acid and hydroxyimberbic acid (Fig. 1-1) as well as glycosidic
derivatives of each (31, 32). The leaves of C. erythrophyllum, traditionally used in
southern Africa for treatment of abdominal pains and venereal diseases, gave high anti-
inflammatory and antibacterial results that were traced to flavonoids such as genkwanin,
rhamnocitrin, quercetin-5,3’-dimethylether, rhamnazin and 5-hydroxy-7,4’-dimethoxy-
flavone, Fig. 1-1 (31). A Central African tree, C. nigricans, was used for the treatment of
stomach problems and as an expectorant (24); the methanolic extract of the fresh leaves
inhibited the growth of human tumor cell lines, such as glioblastoma, colon, non-small
cell lung and bladder cancer models (32, 33). Traditional uses of the stem bark, roots and
leaves of C. molle include treatment of open wounds (24), research has shown
antimicrobial properties against a number of microorganisms such as Bacillus subtilis, B.
Cereus, Enterobacter aerogenes, Mycobacterium smegmatis, Micrococcus luteus,
Neisseria gonorrhea, Staphylococcus aureus and S. epidermidis (25, 34, 35). Additional
evidence of analgesic and anti-inflammatory activity in the C. molle leaves (36) serves to
establish the traditional uses of this plant as a treatment for open wounds (24). The stem
bark of C. fragrans was shown to inhibit Clostridium chauvoei neuraminidase which is
beneficial for the treatment of blackleg, a disease affecting cattle, sheep, and other
ruminants (37). The methanol extract of C. quadrangulare seeds produced various new
6
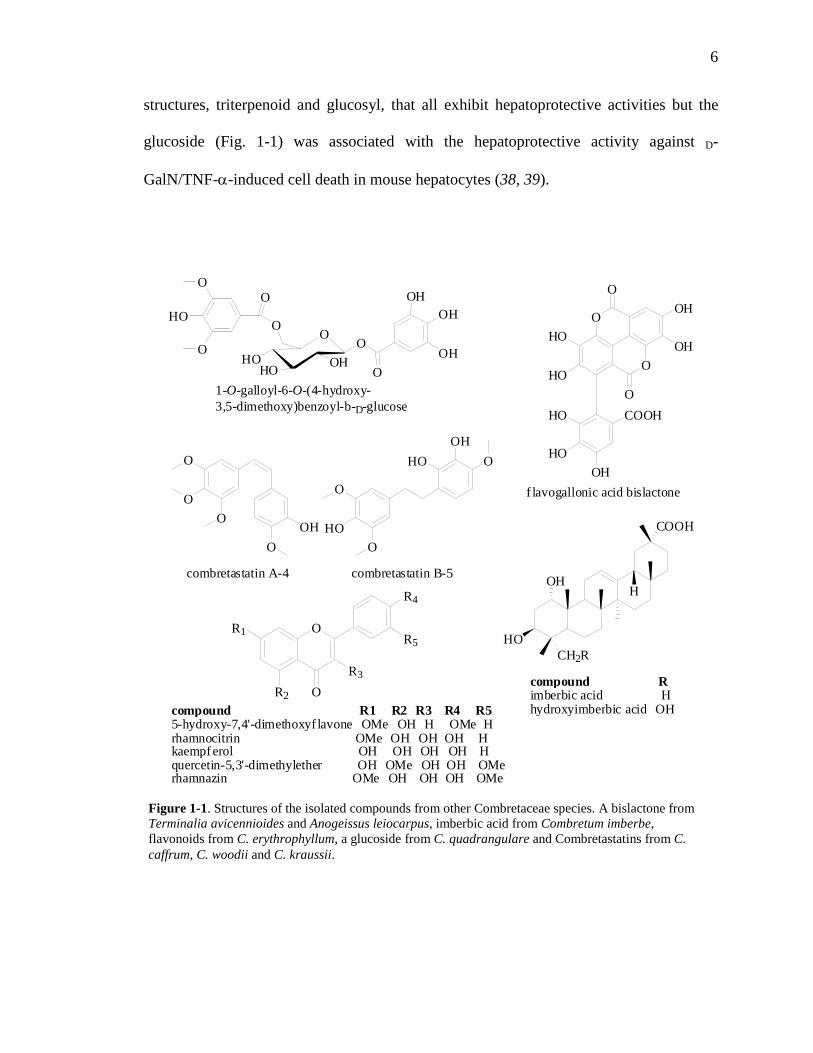
structures, triterpenoid and glucosyl, that all exhibit hepatoprotective activities but the
glucoside (Fig. 1-1) was associated with the hepatoprotective activity against D-
GalN/TNF-α-induced cell death in mouse hepatocytes (38, 39).
Figure 1-1. Structures of the isolated compounds from other Combretaceae species. A bislactone from Terminalia avicennioides and Anogeissus leiocarpus, imberbic acid from Combretum imberbe, flavonoids from C. erythrophyllum, a glucoside from C. quadrangulare and Combretastatins from C. caffrum, C. woodii and C. kraussii.
H
H O
C O O H
C H 2 R
O H
O H O
O O
O H O O H
O
O
H O O
c o m b r e t a s t a t i n A - 4 c o m b r e t a s t a t i n B - 5
O
O
R 4
R 5
R 3 R 2
R 1
O
H O O H O
O
O
O O H O H
O H
O
H O
O H O
1 - O - g a l l o y l - 6 - O - ( 4 - h y d r o x y - 3 , 5 - d i m e t h o x y ) b e n z o y l - b - D - g l u c o s e
O
O
O
O
O H
O H H O
H O
O H H O
H O C O O H
f l a v o g a l l o n i c a c i d b i s l a c t o n e
c o m p o u n d R i m b e r b i c a c i d H h y d r o x y i m b e r b i c a c i d O H c o m p o u n d R 1 R 2 R 3 R 4 R 5
5 - h y d r o x y - 7 , 4 ' - d i m e t h o x y f l a v o n e O M e O H H O M e H r h a m n o c i t r i n O M e O H O H O H H k a e m p f e r o l O H O H O H O H H q u e r c e t i n - 5 , 3 ' - d i m e t h y l e t h e r O H O M e O H O H O M e r h a m n a z i n O M e O H O H O H O M e
7
Finally, a South African tree, C. caffrum, traditionally used for body pain (24), has
produced the combretastatins, a group of anti-tumor compounds that are in the midst of
Phase II clinical trials (40). Combrestatin A-4 (Fig. 1-1) is a small biaryl compound
isolated from the bark of the Bush Willow tree (C. caffrum) and has potent cytotoxic
activity. Its phosphate pro-drug analog has progressed through to Phase II clinical trials
as an anti-tumor agent by targeting tumor vasculature and inducing mitotic cell death (40-
44). Another combretastatin isolated from both C. kraussii and C. woodii was elucidated
as combretastatin B-5 (Fig. 1-1) and reported to have antimicrobial activity against S.
aureus, Pseudomonas aeruginosa, Enterococcus faecalis and E. coli (45).
1.2. Combretum micranthum
Burkhill (22) has listed many traditional uses of the West African species found in
Combretaceae including, but not limited to, anthelminthic, colitis, constipation, diuretic,
expectorant, gingivitis, guinea worm, parasites, malaria, nausea, purgative, thrush,
tuberculosis and yellow fever. It is clear, from this list, that Combretaceae species play an
important part in Africa’s traditional medicines. Combretum micranthum, specifically,
was so widely used in West Africa as a general panacea that the name kinkéliba
has become a word synonymous with “medicine” in some languages (18). Additionally,
C. micranthum was selected as one of the 50 most important African medicinal plants by
the Association for African Medicinal Plant Standards (www.aamps.org). The traditional
uses of kinkéliba has extended beyond western Africa; once expatriates discovered the
value of this species, C. micranthum was exported throughout Europe, specifically France
and Russia (18).
8
Species Traditional Uses
Plant Tissue Scientific Activity Chemical Entities
(Fig. 1-1) References
Terminalia kaiserana
bacterial infections leaf, root antimicrobial (25)
T. sericea bacterial
infections leaf, root antimicrobial (25, 26) antifungal (17)
diabetes bark antidiabetic (27)
T. avicennioides trypanosomosis leaf, stem bark antitrypanosomal flavogallonic acid
bislactone (28, 29)
Anogeissus leiocarpus trypanosomosis stem bark antitrypanosomal flavogallonic acid
bislactone (29)
Combretum kraussii
body pain root, bark anti-inflammatory
acetylcholineesterase inhibition
(24, 30)
leaf antibacterial combretastatin B-5 (45)
C. imberbe cough or colds antimicrobial imberbic acid & hydroxyimberbic
acid (24, 46, 47)
C. erythrophyllum
abdominal pains venereal diseases
leaf anti-inflammatory antibacterial
genkwanin, rhamnocitrin,
quercetin-5,3’-dimethylether,
rhamnazin, 5-hydroxy-7,4’-
dimethoxy-flavone
(31)
C. nigricans stomach
problems, expectorant
antitumor (24, 32, 33)
C. molle wounds leaf root
stem bark
antimicrobial analgesic
anti-inflammatory (24, 25, 34-
36)
C. fragrans blackleg stem bark antinueraminidase (37)
C. quadrangulare seeds hepatoprotective
galloyl-(hydroxy- dimethoxy)benzoyl-
β-D-glucose (38, 39)
C. caffrum body pain stem bark anti-tumor combretastatin A-4 (40-44) C. woodii leaf antibacterial combretastatin B-5 (45)
1.2.1. Botany
Combretum micranthum (kinkéliba) is an undomesticated shrub species found in the
Tiger bush region of western Africa. Tiger bush is a patterned area of vegetation
consisting of alternating bands of trees or shrubs and bare ground that forms stripes when
Table 1-1. A summary of the use and research of Combretaceae family members described in the text.
9
viewed from above. The patterns follow lines of equal elevation and occur on low slopes
in arid and semi-arid regions, such as sub-Saharan, or Sahelian, West Africa (48).
Kinkéliba is a bushy shrub or creeper that can reach up to 20 m in height. The leaves are
opposite and the flowers are born as axillary cluster on scaly stalks, with a whitish corolla
and ferruginous scales covering the calyces. The flowers typically produce nectar and
attract insects, birds, and small mammals (49). C. micranthum is common on cultivated
and fallow ground, throughout the continent, but it appears to be dominant in sub-
Saharan Africa, from Sudan to Nigeria, from Gambia to Congo, with higher
concentrations in Senegal, Mali, and Burkina Faso (49).
1.2.2. Traditional Medicinal Uses
Kinkéliba tea was brought to our attention by our international development program,
Agribusiness of Sustainable Natural African Plant Products (ASNAPP) program
(www.asnapp.org) which is working in concert with the University of Dakar Pharmacy
department and the Association of Health Education (AES), a health focused non-
governmental organization (NGO) in Senegal. The leaf of C. micranthum is used as a
popular herbal infusion or tea and is an ethnomedicinal plant widely used in West Africa
to treat many diseases. In traditional medicine, kinkéliba is used for the treatment of
bruises and sprains by rubbing in root powder with shea butter or palm oil (23, 24). The
roots are also used, in a decoction that is either drank as a treatment for guinea worm
infestations, or as a wash in the treatment for open wounds (24). The most common use
of kinkéliba is for diuretic and digestion purposes, including gastrointestinal problems,
colic, and vomiting, in which a beverage is brewed from the dried leaves (24, 49-52).
10
The leaves have reported diuretic and colagogic properties and several components have
been identified, including flavonoids, catechins, and organic acids. In the fresh form, the
leaves are used to reduce fevers, especially those induced by malaria (50, 51, 53, 54).
Additionally, C. micranthum is also one of the main ingredients of an indigenous
Nigerian antiviral remedy called “ Seven Keys to Power”, that is used to treat small pox,
chicken pox, measles (55). Outside of medicinal uses, kinkéliba branches are popular in
local handicrafts and are an important material for building stools, beds, tool handles, etc.
(56).
A tea, made from steeping the leaves in boiling water, is a traditional drink in tropical
savannah countries such as Senegal, Mali and Burkina Faso and is believed to aid weight
control and act as a general panacea. Kinkéliba tea is Senegal’s traditional bush tea and
has a pleasant flavor, light to dark green-brown color. It is now being introduced, in the
tea form, to other African countries, Europe and the US market (57). While its
therapeutic traits are known and valued in African savannah culture, the chemistry and
validation of its therapeutic use behind these health benefits remains poorly understood.
To date, there have not been any safety or toxicity issues reported in the use and
consumption of this national ‘bush tea’ (18). By studying kinkéliba leaves and extending
the investigation to the bark, roots and branches of the plant, the mode of therapeutic
action that is utilized in the tea can be elucidated, developed, and ultimately employed in
foods, beverages and, if therapeutically valid, modern health care or medicine.
1.2.3. Modern Research on Natural Products Chemistry and Biological Activities
11
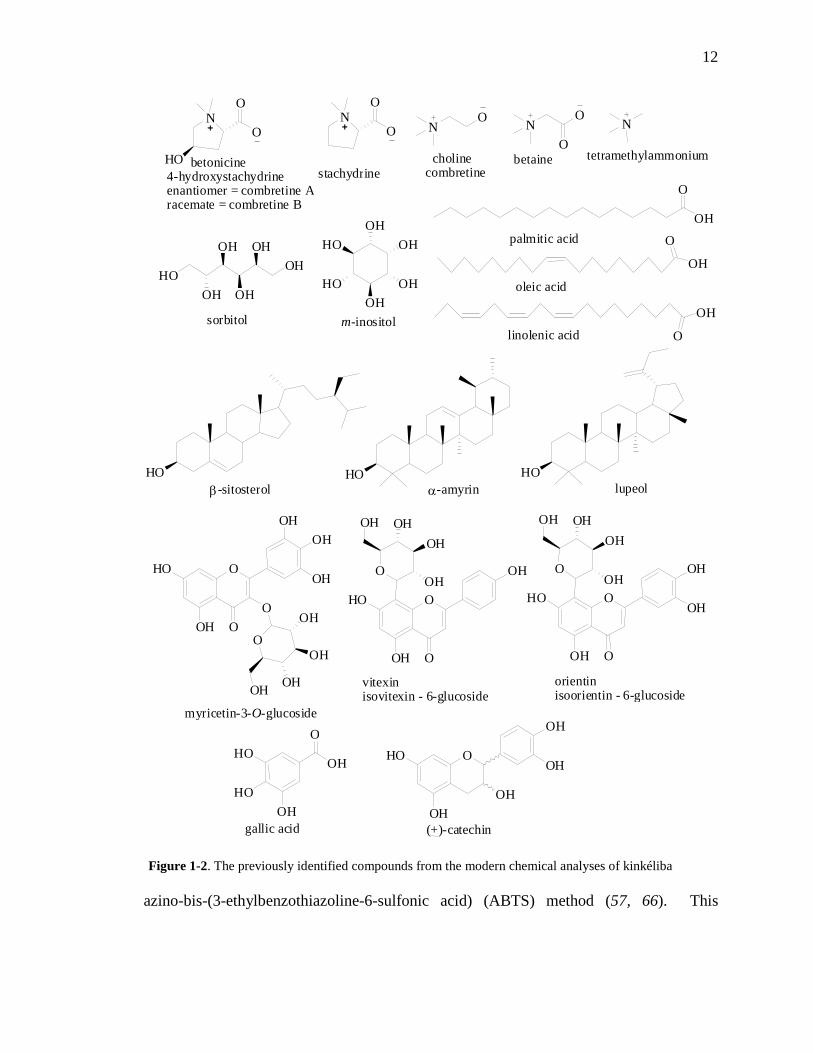
Due to its widespread use in traditional African medicines, C. micranthum has undergone
a number of modern chemical analyses; the previously identified compounds from
kinkéliba are illustrated in Figure 1-2. Paris et al. (58) worked with the fresh leaf extract
and tentatively identified a catechin (Fig. 1-2) and a tannin but, due to lack of material,
they could not be specified. Jentzsch et al. (59) investigated the dried leaves and
identified a number of small acids, such as gallic acid and malic acid, as well as the
alkaloids, betaine and choline, or combretine, and two C-glycosylflavones, vitexin and
isovitexin (Fig. 1-2). Bassene et al. (60, 61) conducted and reported a number of studies
on C. micranthum in which they isolated four C-glycosylflavones, vitexin, isovitexin,
orientin, and homoorientin (Fig. 1-2), as well as four other C-glycosylflavone derivatives
that were in too small of concentration to be identified. The four flavone derivatives in
too low of concentration to be identified are most likely the galloylated C-
glycosylflavones identified in chapter 2. Bassene (62) also confirmed the presence of
stachydrine and choline, while refuting the presence of betaine; the acids identified by
Jentzsch et al. (59) were also confirmed by Bassene (63) as well as sugar alcohols, m-
inositol and sorbitol (64), a sterol, and a couple triterpene alcohols (65) (Fig. 1-2). Later
analyses by D’Agostino et al. (52) using the extracts of C. micranthum, showed the
presence of flavonoids, such as the previously identified vitexin and orientin as well as
myricetin-3-O-glucoside (Fig. 1-2) and myricetin-3-O-rutinoside.
Kinkéliba leaves exhibit a high amount of total phenols (13-14%), using the Folin-
Ciocalteu’s method, and can be considered a potent antioxidant (20-26%, reported as g
Trolox, a water-soluble vitamin E derivative, per 100 g dry plant material) using the 2,2’-
12
azino-bis-(3-ethylbenzothiazoline-6-sulfonic acid) (ABTS) method (57, 66). This
Figure 1-2. The previously identified compounds from the modern chemical analyses of kinkéliba
N O
O
H O b e t o n i c i n e 4 - h y d r o x y s t a c h y d r i n e e n a n t i o m e r = c o m b r e t i n e A r a c e m a t e = c o m b r e t i n e B
N O
O
s t a c h y d r i n e
N O
c h o l i n e c o m b r e t i n e
N
t e t r a m e t h y l a m m o n i u m
N O
O b e t a i n e
O H
O
p a l m i t i c a c i d
o l e i c a c i d O H
O l i n o l e n i c a c i d
O H O
H O O H O H
O H
O H
O H s o r b i t o l m - i n o s i t o l
H O α - a m y r i n l u p e o l
H O β - s i t o s t e r o l
O
O O H
H O
O H
v i t e x i n i s o v i t e x i n - 6 - g l u c o s i d e
O
O H O H O H
O H O
O O H
H O
O H
O H
o r i e n t i n i s o o r i e n t i n - 6 - g l u c o s i d e
O
O H O H O H
O H O
O O H
H O
O H
O H
O
O O H
O H
O H
O H
O
O H
H O
O H
O H
O H
O H O H
O H H O
H O
O H
H O
O H
m y r i c e t i n - 3 - O - g l u c o s i d e O
O H H O
H O O H
g a l l i c a c i d ( + ) - c a t e c h i n
13
activity can be preliminarily attributed to the polyphenols previously identified in the
leaves by a number of scientists (52, 58-62). Karou et al. (66) studied the antimicrobial
activity of kinkéliba leaves against pathogenic bacteria, attempting to illustrate a link
between antioxidant capacity and antimicrobial activity. Kinkéliba leaf extracts
demonstrated microbicide activity against Shigella dysenteriae, Salmonella parathyphi B.
and Staphylococcus aureus and microbiostatic activity against Shigella flexneri, Shigella
boydii, Salmonella thyphi, Klebsiella ozenae and K. pneumoniae. Benoit et al. (67)
confirmed the traditional use of kinkéliba stems and leaves in the treatment of malaria by
inhibition of in vitro growth of both chloroquine-sensitive and chloroquine-resistant
strain of Plasmodium falciparum as well as decreased parasitemia after 30 hrs of contact,
indicating activity of the extract on the reinvasion process of the parasite. Ancolio et al.
(68) and Karou et al. (69) both confirmed the kinkéliba leaf extract had moderate
antiplasmodial activity. Olajide et al. (50, 51) validated the traditional use of kinkéliba
leaves for malarial fever and to treat wounds by investigating the anti-inflammatory
activity of aqueous extracts of the leaves. The extract significantly inhibited carrageenan-
induced rat paw edema as well as inhibited acetic acid-induced vascular permeability in
mice. The kinkéliba extract also inhibited granuloma formation in rats indicating an
effect on cellular-type inflammation (54). Di Carlo et al. (70) reported kinkéliba to
possess immunostimulant activity for the reticuloendothelial system. Ferrea et al. (55, 71)
demonstrated the in vitro antiviral activity of a methanolic extract of kinkéliba leaves
against herpes simplex virus types 1 and 2 was present only in those extracts dissolved 7
days before the assay but not in the freshly prepared extracts. This result was attributed to
the presence of inactive precursors in the fresh extracts, which undergo alkaline auto-
14
oxidation to form the active antiviral catechinic acid. This species showed no significant
antiviral activity against the lentiviral vector, in response to its use in the “Seven Keys to
Power” and as a traditional treatment for AIDS patients (55).
1.3. Polyphenolic Compounds and the Impact on Medicinal Chemistry
1.3.1 Background of Polyphenols
Some of the compounds previously identified in C. micranthum as well as the compounds
initially focused on during the phytochemical investigation below are polyphenolic in
nature. Polyphenols comprise a large class of compounds including all molecules with
more than one hydroxyl group on an aromatic ring. Typical polyphenols are phenolic
acids, stilbenes, lignans and flavonoids (Fig 1-3). Phenolic acids generally consist of two
types of molecules: derivatives of benzoic acid and derivatives of cinnamic acid.
Phenolic acids, as well as other polyphenols, can act as antioxidants by a number of
pathways, in which the most significant is free-radical scavenging (72, 73). The lignans
are diphenolic compounds that contain 2 phenylpropane units linked by a four-carbon
bridge that is formed by the dimerization of two cinnamic acid residues. Several lignans,
such as secoisolariciresinol, are considered to be phytoestrogens and are converted into
enterolactone and enterodiol which can act as estrogen-like compounds in the body and
may lead to the prevention of some cancers, such as breast cancer, that depend on
estrogen (72-74). Stilbenes contain two phenyl moieties connected by a two-carbon
methylene bridge and often act as antifungal phytoalexins, which are synthesized in
response to infection or injury (73). Resveratrol, an example of a phytoalexin, is
produced in grapes and peanuts and was recognized as a biologically active compound as
15
early as 1992 (75). Since then, it has been shown to have a variety of pharmacological
properties, such as anti-inflammatory, estrogen receptor agonist, and effect on cell
signaling pathways, cell proliferation, and apoptosis (76, 77).
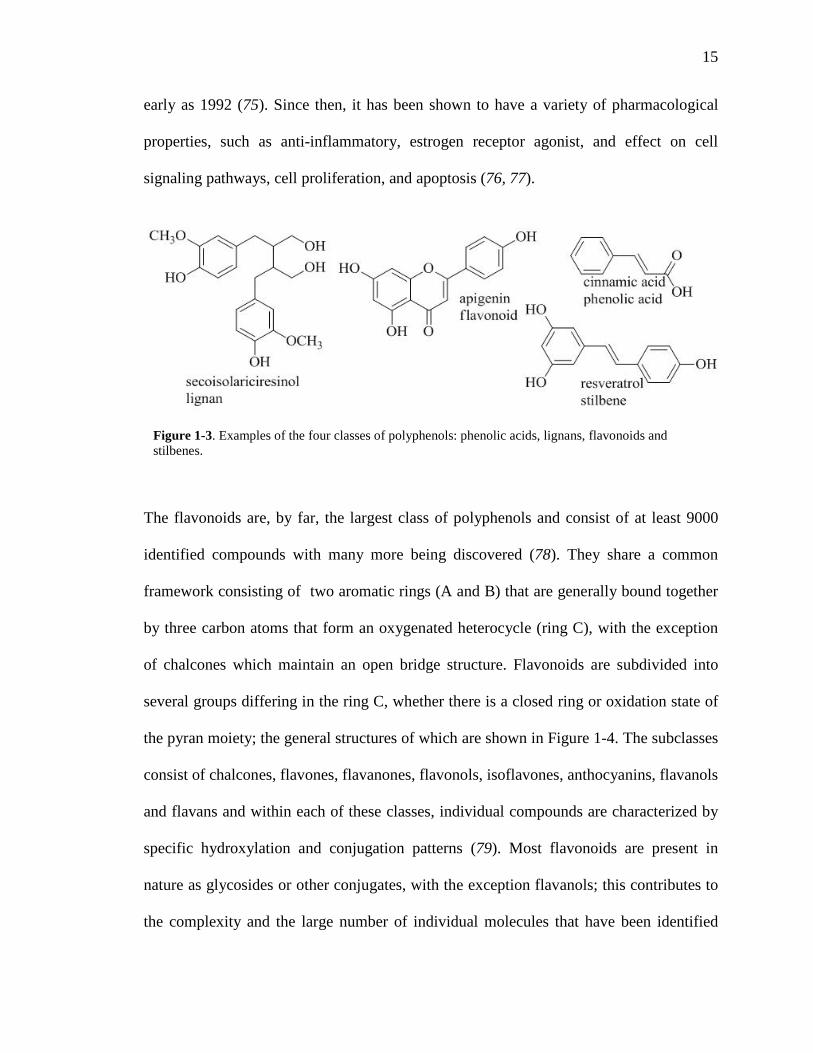
The flavonoids are, by far, the largest class of polyphenols and consist of at least 9000
identified compounds with many more being discovered (78). They share a common
framework consisting of two aromatic rings (A and B) that are generally bound together
by three carbon atoms that form an oxygenated heterocycle (ring C), with the exception
of chalcones which maintain an open bridge structure. Flavonoids are subdivided into
several groups differing in the ring C, whether there is a closed ring or oxidation state of
the pyran moiety; the general structures of which are shown in Figure 1-4. The subclasses
consist of chalcones, flavones, flavanones, flavonols, isoflavones, anthocyanins, flavanols
and flavans and within each of these classes, individual compounds are characterized by
specific hydroxylation and conjugation patterns (79). Most flavonoids are present in
nature as glycosides or other conjugates, with the exception flavanols; this contributes to
the complexity and the large number of individual molecules that have been identified
Figure 1-3. Examples of the four classes of polyphenols: phenolic acids, lignans, flavonoids and stilbenes.
16
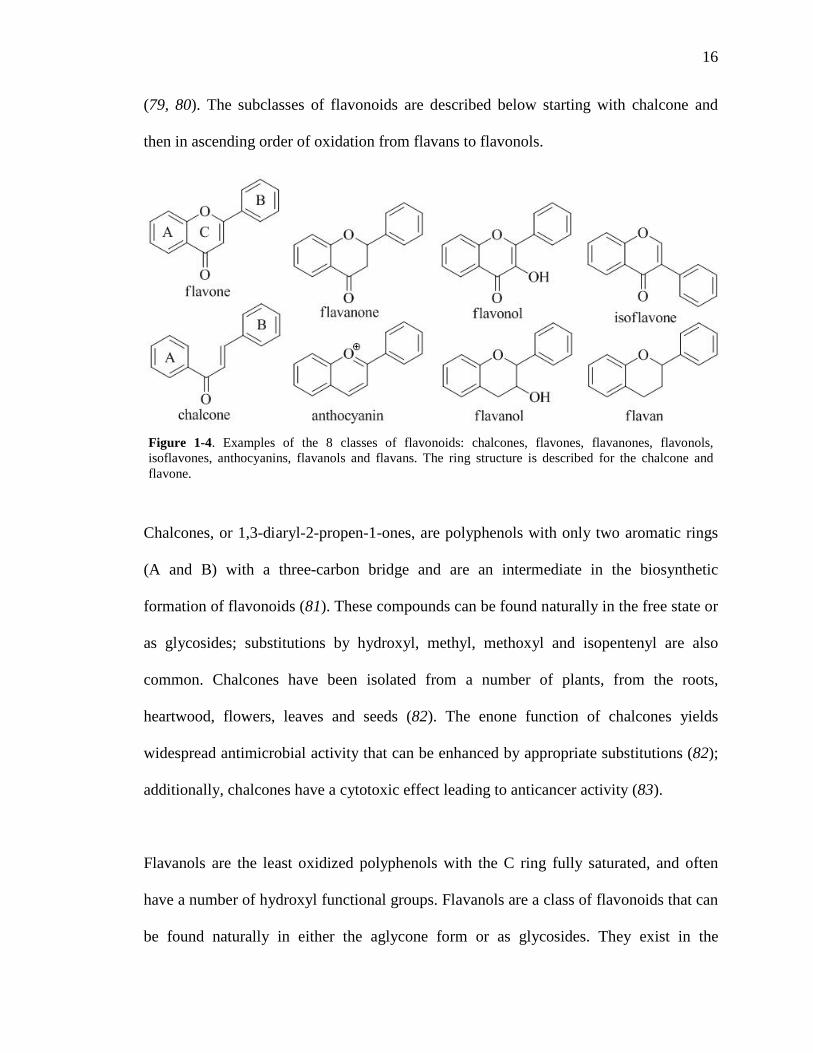
(79, 80). The subclasses of flavonoids are described below starting with chalcone and
then in ascending order of oxidation from flavans to flavonols.
Chalcones, or 1,3-diaryl-2-propen-1-ones, are polyphenols with only two aromatic rings
(A and B) with a three-carbon bridge and are an intermediate in the biosynthetic
formation of flavonoids (81). These compounds can be found naturally in the free state or
as glycosides; substitutions by hydroxyl, methyl, methoxyl and isopentenyl are also
common. Chalcones have been isolated from a number of plants, from the roots,
heartwood, flowers, leaves and seeds (82). The enone function of chalcones yields
widespread antimicrobial activity that can be enhanced by appropriate substitutions (82);
additionally, chalcones have a cytotoxic effect leading to anticancer activity (83).
Flavanols are the least oxidized polyphenols with the C ring fully saturated, and often
have a number of hydroxyl functional groups. Flavanols are a class of flavonoids that can
be found naturally in either the aglycone form or as glycosides. They exist in the
Figure 1-4. Examples of the 8 classes of flavonoids: chalcones, flavones, flavanones, flavonols, isoflavones, anthocyanins, flavanols and flavans. The ring structure is described for the chalcone and flavone.
17
monomer form, as catechins, and the polymer form, as proanthocyanidins, which often
finds the polymeric bond between the 4, 6, and 8 positions. These proanthocyanidins,
also referred to as tannins, are responsible for the astringency of fruits and beverages and
for the bitterness of chocolate (84). When proanthocyanidins are heated in acid, they
separate to form anthocyanidins, the aglycone form of anthocyanins. Catechins are also
found in many types of fruit as well as red wine, but green tea and chocolate are the
richest sources, by far (72, 79).
Flavanones, like flavanols, have a fully saturated C ring; however, they also include a
ketone at position 4 which increases the oxidation state. They are found in high
concentrations in citrus fruits, such as grapefruit, oranges, and lemons, as well as some
aromatic herbs such as mint. Studies show that while flavanones are found in nature as
glycosides but when ingested, they are absorbed as aglycones in the colon (72, 79, 85).
Flavanones are also found in nature as prenylated derivatives, specifically in hops and
beer, and have been characterized as a potent phytoestrogens and have been shown to
have anti-cancer activity (86).
Flavones have the same ketone at position 4, but also include an unsaturation between the
2 and 3 position of ring C. The compounds are commonly found in parsley, celery,
capsicum pepper, millet and wheat (72). Isoflavones differ in structure to flavones only
by the connection of the B ring, at position 3 as opposed to position 2 for all other
flavonoids. These compounds are almost exclusively found in leguminous plants, such as
soy products, in the inactive glycosidic form (72). However, they are metabolized in the
18
digestive tract to their corresponding aglycones and can, only then, be absorbed (72, 79,
86).
Flavonols are the most widespread flavonoids in foods, mostly in the form of quercetin
and kaempferol; the richest sources are onions, dark greens, berries, red wine and tea
(72). They are often found naturally as glycosides with glucose or rhamnose moieties.
These compounds accumulate in the skin and leaves because their biosynthesis is
stimulated by light. Because of this, concentration of flavonols can differ between pieces
of fruit on the same branch, depending on exposure to sunlight. Structurally, flavonols are
not very different from flavones but with the addition of a hydroxyl at position 3 to
increase the oxidation state (72, 79).
Anthocyanins are flavonoids with the highest oxidation state and are pigments often
found in the epidermal tissue of fruits and flowers, giving them red, blue or purple
coloring (81, 87). Their color depends on pH, red color in acidic conditions progressing
to blue as pH moves higher. They are easily degraded by light, pH, and oxygen in the
aglycone form but are stabilized as glycosides or other complexations (72, 81).
Anthocyanins can be found in grains, root vegetables, fruits and flowers but the highest
concentration is found in berries and their subsequent juices (72, 79).
1.3.2. Antioxidant Capacity
Polyphenolic compounds function as effective antioxidants by quenching the free radicals
of biological systems with their phenolic ring and multiple hydroxyl moieties; phenolic
19
activity covers a wide range of reactive oxygen, nitrogen, and chlorine species such as
superoxide, hydroxyl radical, peroxyl radicals, hypochlorous acid, and peroxynitrous
acid. Polyphenols can also chelate metal ions leading to a decrease in metal ion
prooxidant activity (88-91). Free radicals cause oxidative damage to nucleic acids,
proteins, and lipids and this oxidation of biological macromolecules has now been
strongly associated with the development of many physiological diseases: Alzheimer’s,
Parkinson’s, diabetes, atherosclerosis, and carcinogenesis (74, 92, 93). The attack of free
radicals against the body is known as oxidative stress and while the human body does
generate its own enzymatic antioxidants, such as superoxide dismutase, catalase, and
peroxidase, it does not provide enough protection against oxidative stress. Many studies
have shown that consuming proper quantities of antioxidants can slow oxidative stress
and subsequently prevent the diseases that may develop from the excessive oxidation (94-
104).
1.3.3. Anti-Inflammatory Activity
Many medicinal plants containing polyphenolic compounds with antioxidant activity tend
to exhibit high anti-inflammatory activity in cell screen assays, such as herbal teas high in
catechins or berries with high concentrations of anthocyanins (105-107). Inflammation is
important in the pathophysiology of numerous human disorders. Accumulating evidence
demonstrates that atherosclerosis is an inflammatory disease not necessarily augmented
by cholesterol but rather inflammatory mechanisms (108). Rheumatoid arthritis is another
inflammatory disorder that affects approximately 1.0% of the population; in the past,
treatment for rheumatoid arthritis consisted of only treating the symptoms but now
20
includes anti-inflammatory medications to achieve partial or even total remission (109).
Chronic inflammation leads to the development and progression of several cancers such
as gastric and colon cancer largely due to the pro-growth environment generated by
activated inflammatory cells (110). Green tea polyphenols, as an example, were found to
have chemopreventive activities in numerous studies utilizing an anti-inflammatory
mechanism (105, 111). In fact, the efficacy of anti-inflammatory drugs in
chemoprevention argues for anti-inflammatory therapies at the earliest stages of cancer
progression (112).
1.3.4. Glucose-Lowering Activity
Polyphenolic compounds have effects on any number of diseases but one that is of
growing interest is the treatment of diabetes mellitus, a disease that affects as many as
180 million worldwide; this number is expected to double by the year 2030 (113, 114).
Diabetes is caused by higher than normal levels of blood glucose because the body
cannot produce enough insulin or effectively use the insulin it does produce; there are
three types of diabetes, type 1 or juvenile diabetes, type 2 (the most common form) and
gestational diabetes (114). Due to the prevalence of this disease in low and middle-
income countries, which account for 80% of diabetes deaths (114), traditional medicines
are essential for the treatment of diabetes worldwide, but these herbal formulas often
have mechanisms of action that are complex or even contradictory (115). Diabetes is
associated with oxidative stress due to hyperglycemia and hyperlipidemia and the
depletion of antioxidant concentration in the plasma is well documented. Therefore,
increasing antioxidants in the diet, of which polyphenols form a considerable part, may
21
reduce the risk of contracting diabetes or ameliorating the negative side effects once the
disease has developed (113). Resveratrol, anthocyanins and other condensed tannins have
all demonstrated antihyperglycemic activity, whether by reducing obesity or other
proposed mechanisms (116-118). Three theaflavins, from black tea or fermented
Camellia sinensis, as well as two more flavonoids from Artemisia dranunculus L., exhibit
glucose-lowering activity via downregulation of hepatic gluconeogenesis (119, 120). This
is assayed by decreased mRNA expression of phosphoenolpyruvate carboxykinase
(PEPCK) which is a key enzyme in hepatic gluconeogenesis and its activity is closely
correlated with hepatic glucose output (121). The role of polyphenols in the treatment of
diabetes is important and beginning to garner more interest when investigating the full
phytochemical potential of traditional medicines.
1.4. Dissertation Hypothesis and Specific Objectives
The Combretaceae family of plants and specifically the Combretum species play such an
important role in traditional, or alternative, medicines of Western Africa. C. micranthum
is well-known for its medicinal properties but there are a limited number of studies into
the chemistry of the kinkéliba leaf and the bioactivity of the extracts. This study provides
an updated and comprehensive look at the major chemical components of the kinkéliba
leaves following a bioactivity-guided fractionation. The investigation into kinkéliba
isolated catechins, flavans, O-glucosylflavones, C-glucosylflavones and O-galloyl-C-
glucosylflavones, all of which have been previously reported from natural sources but
only some reported constituents of Combretum. This study also covers the isolation and
identification of four novel structures, a series of flavan alkaloid compounds constituting

22
the major compounds of kinkéliba. Finally, the bioactivity potential of the kinkéliba leaf
is described regarding antioxidant capacity, anti-inflammatory activity and glucose-
lowering activity.
23
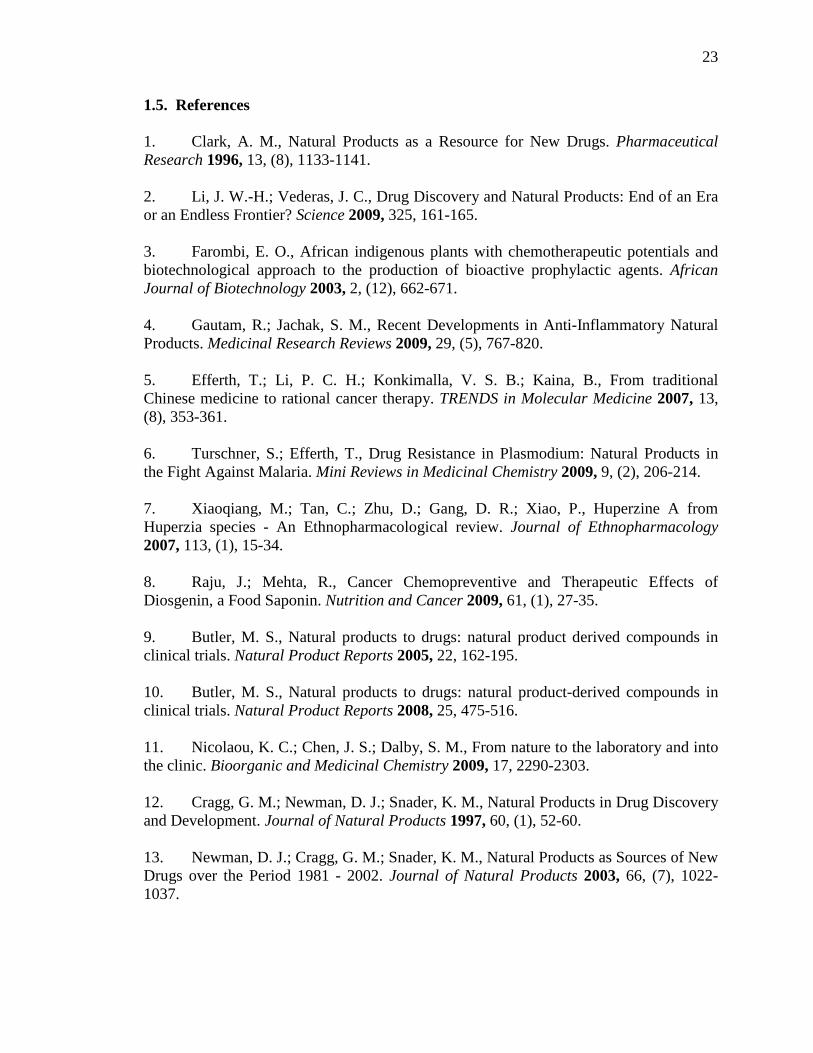
1.5. References
1. Clark, A. M., Natural Products as a Resource for New Drugs. Pharmaceutical Research 1996, 13, (8), 1133-1141. 2. Li, J. W.-H.; Vederas, J. C., Drug Discovery and Natural Products: End of an Era or an Endless Frontier? Science 2009, 325, 161-165. 3. Farombi, E. O., African indigenous plants with chemotherapeutic potentials and biotechnological approach to the production of bioactive prophylactic agents. African Journal of Biotechnology 2003, 2, (12), 662-671. 4. Gautam, R.; Jachak, S. M., Recent Developments in Anti-Inflammatory Natural Products. Medicinal Research Reviews 2009, 29, (5), 767-820. 5. Efferth, T.; Li, P. C. H.; Konkimalla, V. S. B.; Kaina, B., From traditional Chinese medicine to rational cancer therapy. TRENDS in Molecular Medicine 2007, 13, (8), 353-361. 6. Turschner, S.; Efferth, T., Drug Resistance in Plasmodium: Natural Products in the Fight Against Malaria. Mini Reviews in Medicinal Chemistry 2009, 9, (2), 206-214. 7. Xiaoqiang, M.; Tan, C.; Zhu, D.; Gang, D. R.; Xiao, P., Huperzine A from Huperzia species - An Ethnopharmacological review. Journal of Ethnopharmacology 2007, 113, (1), 15-34. 8. Raju, J.; Mehta, R., Cancer Chemopreventive and Therapeutic Effects of Diosgenin, a Food Saponin. Nutrition and Cancer 2009, 61, (1), 27-35. 9. Butler, M. S., Natural products to drugs: natural product derived compounds in clinical trials. Natural Product Reports 2005, 22, 162-195. 10. Butler, M. S., Natural products to drugs: natural product-derived compounds in clinical trials. Natural Product Reports 2008, 25, 475-516. 11. Nicolaou, K. C.; Chen, J. S.; Dalby, S. M., From nature to the laboratory and into the clinic. Bioorganic and Medicinal Chemistry 2009, 17, 2290-2303. 12. Cragg, G. M.; Newman, D. J.; Snader, K. M., Natural Products in Drug Discovery and Development. Journal of Natural Products 1997, 60, (1), 52-60. 13. Newman, D. J.; Cragg, G. M.; Snader, K. M., Natural Products as Sources of New Drugs over the Period 1981 - 2002. Journal of Natural Products 2003, 66, (7), 1022-1037.
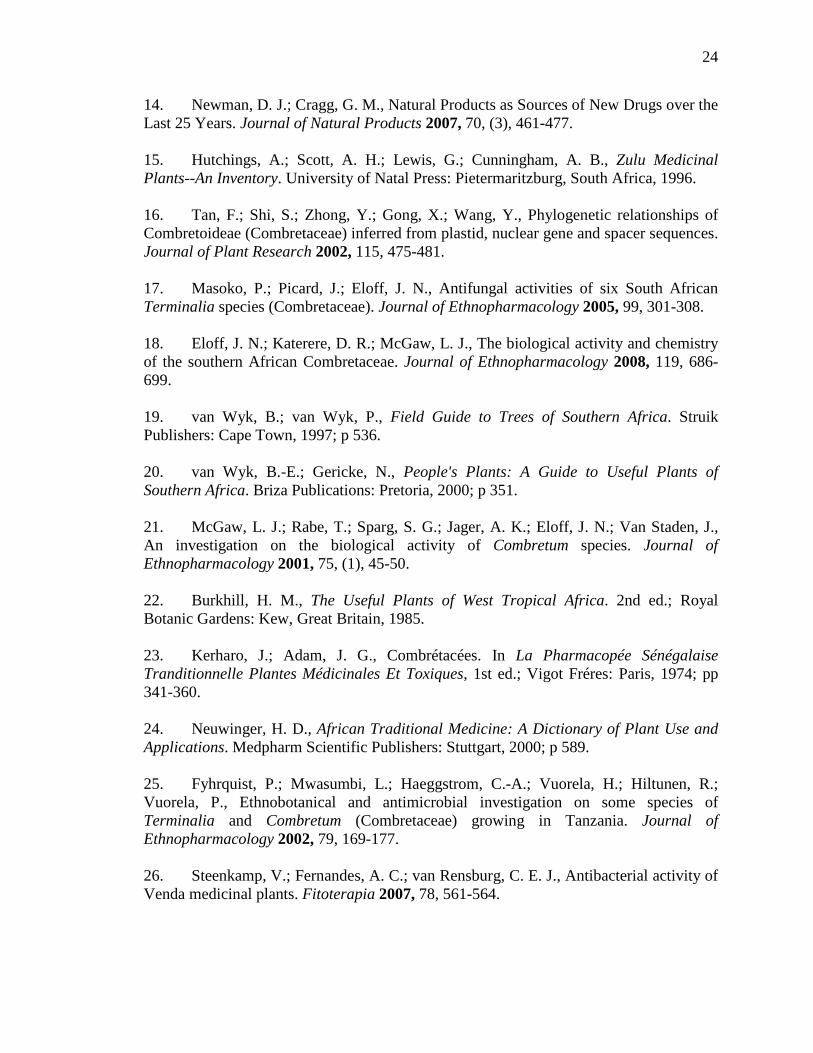
24
14. Newman, D. J.; Cragg, G. M., Natural Products as Sources of New Drugs over the Last 25 Years. Journal of Natural Products 2007, 70, (3), 461-477. 15. Hutchings, A.; Scott, A. H.; Lewis, G.; Cunningham, A. B., Zulu Medicinal Plants--An Inventory. University of Natal Press: Pietermaritzburg, South Africa, 1996. 16. Tan, F.; Shi, S.; Zhong, Y.; Gong, X.; Wang, Y., Phylogenetic relationships of Combretoideae (Combretaceae) inferred from plastid, nuclear gene and spacer sequences. Journal of Plant Research 2002, 115, 475-481. 17. Masoko, P.; Picard, J.; Eloff, J. N., Antifungal activities of six South African Terminalia species (Combretaceae). Journal of Ethnopharmacology 2005, 99, 301-308. 18. Eloff, J. N.; Katerere, D. R.; McGaw, L. J., The biological activity and chemistry of the southern African Combretaceae. Journal of Ethnopharmacology 2008, 119, 686-699. 19. van Wyk, B.; van Wyk, P., Field Guide to Trees of Southern Africa. Struik Publishers: Cape Town, 1997; p 536. 20. van Wyk, B.-E.; Gericke, N., People's Plants: A Guide to Useful Plants of Southern Africa. Briza Publications: Pretoria, 2000; p 351. 21. McGaw, L. J.; Rabe, T.; Sparg, S. G.; Jager, A. K.; Eloff, J. N.; Van Staden, J., An investigation on the biological activity of Combretum species. Journal of Ethnopharmacology 2001, 75, (1), 45-50. 22. Burkhill, H. M., The Useful Plants of West Tropical Africa. 2nd ed.; Royal Botanic Gardens: Kew, Great Britain, 1985. 23. Kerharo, J.; Adam, J. G., Combrétacées. In La Pharmacopée Sénégalaise Tranditionnelle Plantes Médicinales Et Toxiques, 1st ed.; Vigot Fréres: Paris, 1974; pp 341-360. 24. Neuwinger, H. D., African Traditional Medicine: A Dictionary of Plant Use and Applications. Medpharm Scientific Publishers: Stuttgart, 2000; p 589. 25. Fyhrquist, P.; Mwasumbi, L.; Haeggstrom, C.-A.; Vuorela, H.; Hiltunen, R.; Vuorela, P., Ethnobotanical and antimicrobial investigation on some species of Terminalia and Combretum (Combretaceae) growing in Tanzania. Journal of Ethnopharmacology 2002, 79, 169-177. 26. Steenkamp, V.; Fernandes, A. C.; van Rensburg, C. E. J., Antibacterial activity of Venda medicinal plants. Fitoterapia 2007, 78, 561-564.
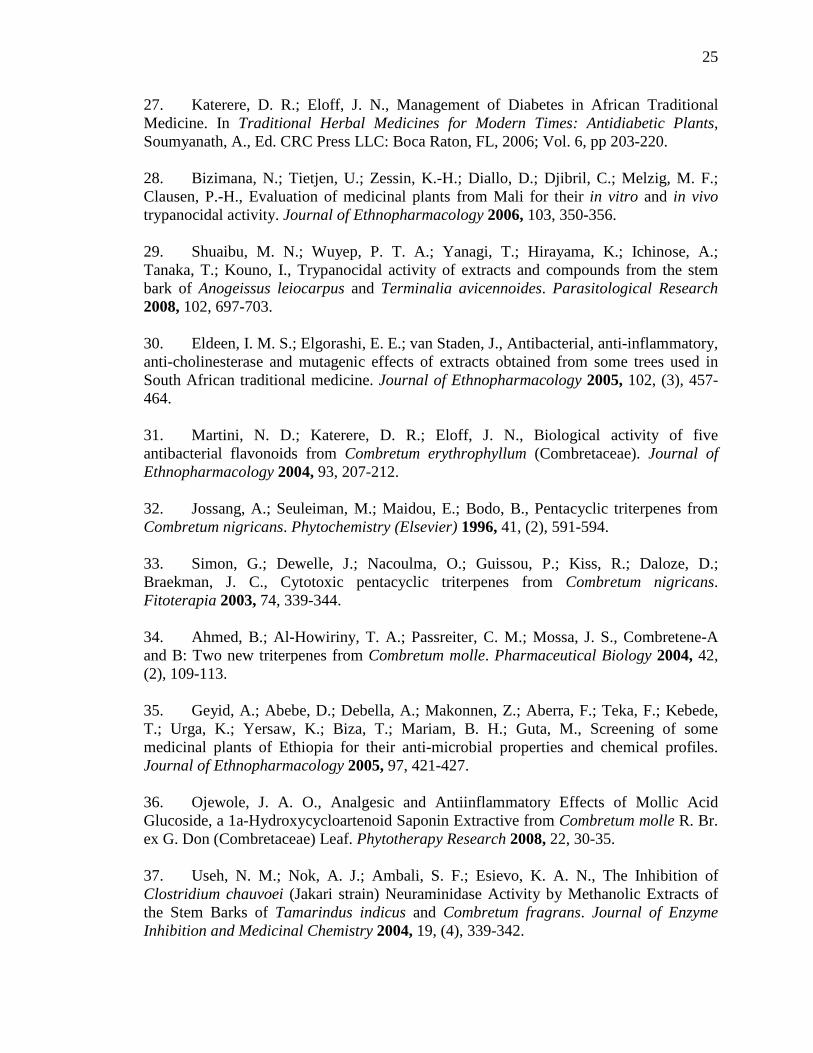
25
27. Katerere, D. R.; Eloff, J. N., Management of Diabetes in African Traditional Medicine. In Traditional Herbal Medicines for Modern Times: Antidiabetic Plants, Soumyanath, A., Ed. CRC Press LLC: Boca Raton, FL, 2006; Vol. 6, pp 203-220. 28. Bizimana, N.; Tietjen, U.; Zessin, K.-H.; Diallo, D.; Djibril, C.; Melzig, M. F.; Clausen, P.-H., Evaluation of medicinal plants from Mali for their in vitro and in vivo trypanocidal activity. Journal of Ethnopharmacology 2006, 103, 350-356. 29. Shuaibu, M. N.; Wuyep, P. T. A.; Yanagi, T.; Hirayama, K.; Ichinose, A.; Tanaka, T.; Kouno, I., Trypanocidal activity of extracts and compounds from the stem bark of Anogeissus leiocarpus and Terminalia avicennoides. Parasitological Research 2008, 102, 697-703. 30. Eldeen, I. M. S.; Elgorashi, E. E.; van Staden, J., Antibacterial, anti-inflammatory, anti-cholinesterase and mutagenic effects of extracts obtained from some trees used in South African traditional medicine. Journal of Ethnopharmacology 2005, 102, (3), 457-464. 31. Martini, N. D.; Katerere, D. R.; Eloff, J. N., Biological activity of five antibacterial flavonoids from Combretum erythrophyllum (Combretaceae). Journal of Ethnopharmacology 2004, 93, 207-212. 32. Jossang, A.; Seuleiman, M.; Maidou, E.; Bodo, B., Pentacyclic triterpenes from Combretum nigricans. Phytochemistry (Elsevier) 1996, 41, (2), 591-594. 33. Simon, G.; Dewelle, J.; Nacoulma, O.; Guissou, P.; Kiss, R.; Daloze, D.; Braekman, J. C., Cytotoxic pentacyclic triterpenes from Combretum nigricans. Fitoterapia 2003, 74, 339-344. 34. Ahmed, B.; Al-Howiriny, T. A.; Passreiter, C. M.; Mossa, J. S., Combretene-A and B: Two new triterpenes from Combretum molle. Pharmaceutical Biology 2004, 42, (2), 109-113. 35. Geyid, A.; Abebe, D.; Debella, A.; Makonnen, Z.; Aberra, F.; Teka, F.; Kebede, T.; Urga, K.; Yersaw, K.; Biza, T.; Mariam, B. H.; Guta, M., Screening of some medicinal plants of Ethiopia for their anti-microbial properties and chemical profiles. Journal of Ethnopharmacology 2005, 97, 421-427. 36. Ojewole, J. A. O., Analgesic and Antiinflammatory Effects of Mollic Acid Glucoside, a 1a-Hydroxycycloartenoid Saponin Extractive from Combretum molle R. Br. ex G. Don (Combretaceae) Leaf. Phytotherapy Research 2008, 22, 30-35. 37. Useh, N. M.; Nok, A. J.; Ambali, S. F.; Esievo, K. A. N., The Inhibition of Clostridium chauvoei (Jakari strain) Neuraminidase Activity by Methanolic Extracts of the Stem Barks of Tamarindus indicus and Combretum fragrans. Journal of Enzyme Inhibition and Medicinal Chemistry 2004, 19, (4), 339-342.
26
38. Adnyana, I. K.; Tezuka, Y.; Awale, S.; Banskota, A. H.; Tran, K. Q.; Kadota, S., 1-O-Galloyl-6-O-(4-hydroxy-3,5-dimethoxy)benzoyl-β-D-glucose, a new hepatoprotective constituent from Combretum quadrangulare. Planta Medica 2001, 67, 370-371. 39. Adnyana, I. K.; Tezuka, Y.; Banskota, A. H.; Tran, K. Q.; Kadota, S., Three new triterpenes from the seeds of Combretum quadrangulare and their hepatoprotective activity. Journal of Natural Products 2001, 64, 360-363. 40. Cirla, A.; Mann, J., Combretastatins: from natural products to drug discovery. Natural Product Reports 2003, 20, 558-564. 41. Galbraith, S. M.; Maxwell, R. J.; Lodge, M. A.; Tozer, G.; Wilson, J.; Taylor, N. J.; Stirling, J. J.; Sena, L.; Padhani, A. R.; Rustin, G. J. S., Combretastatin A4 Phosphate Has Tumor Antivascular Activity in Rat and Man as Demonstrated by Dynamic Magnetic Resonance Imaging. Journal of Clinical Oncology 2003, 21, (15), 2831-2842. 42. Griggs, J.; Metcalfe, J. C.; Hesketh, R., Targeting tumour vasculature: the development of combretastatin A4. The Lancet Oncology 2001, 2, 82-87. 43. Kanthou, C.; Greco, O.; Stratford, A.; Cook, I.; Knight, R.; Benzakour, O.; Tozer, G., The Tubulin-Binding Agent Combretastatin A-4-Phosphate Arrests Endothelial Cells in Mitosis and Induces Mitotic Cell Death. American Journal of Pathology 2004, 165, (4), 1401-1411. 44. Thompson, M., Combretastatin - Molecule of the Month. In 2006. 45. Eloff, J. N.; Famakin, J. O.; Katerere, D. R., Isolation of an antibacterial stilbene from Combretum woodii (Combretaceae) leaves. African Journal of Biotechnology 2005, 4, (10), 1167-1171. 46. Katerere, D. R.; Gray, A. I.; Nash, R. J.; Waigh, R. D., Antimicrobial activity of pentacyclic triterpenes isolated from African Combretaceae. Phytochemistry (Elsevier) 2003, 63, 81-88. 47. Angeh, J. E.; Huang, X.; Sattler, I.; Swan, G. E.; Dahse, H.; Hartl, A.; Eloff, J. N., Antimicrobial and anti-inflammatory activity of four known and one new triterpenoid from Combretum imberbe (Combretaceae). Journal of Ethnopharmacology 2007, 110, 56-60. 48. Le Fever, R.; Le Jeune, O., On the Origin of Tiger Bush. Bulletin of Mathematical Biology 1997, 59, (2), 263-294. 49. Iwu, M. M., Handbook of African Medicinal Plants. CRC Press, Inc.: Florida, 1993; p 464.
27
50. Le Grand, A., Les Phytotherapies Anti-infectieuses de la Foret-savane, Senegal (Afrique occidentale) III: Un Resume des Substances Phytochimiques et l' Activite Antimicrobienne de 43 Species. Journal of Ethnopharmacology 1989, 25, 315-338. 51. Le Grand, A.; Wondergem, P. A., Les Phytotherapies Anti-infectieuses de la Foret-savane, Senegal (Afrique occidentale) I: Un Inventaire. Journal of Ethnopharmacology 1987, 21, 109-125. 52. D' Agostino, M.; Biagi, C.; De Feo, V.; Zollo, F.; Pizza, C., Flavonoids of Combretum micranthum. Fitoterapia 1990, LXI, (5), 477. 53. Tignokpa, M.; Laurens, A.; Mboup, S.; Sylla, O., Plantes medicinales populaires des marches de Dakar (Senegal). International Journal of Crude Drug Research 1986, 24, 75-80. 54. Olajide, O.; Makinde, J. M.; Okpako, D. T., Evaluation of the anti-inflammatory property of the extract of Combretum micranthum G. Don. (Combretaceae). Inflammopharmacology 2003, 11, (3), 293-298. 55. Esimone, C. O.; Grunwald, T.; Wildner, O.; Nchinda, G.; Tippler, B.; Proksch, P.; Uberla, K., In vitro pharmacodynamic evaluation of antiviral medicinal plants using a vector-based assay technique. Journal of Applied Microbiology 2005, 99, (6), 1346-1355. 56. Gustad, G.; Dhillion, S. S.; Sidibe, D., Local use and cultural and economic value of products from trees in the parklands of the municipality of Cinzana, Mali. Economic Botany 2004, 58, (4), 578-587. 57. Juliani, H. R.; Koelliker, Y.; Bucuk, M.; Welch, C. R.; Tepper, B. J.; Jefthas, E.; Simon, J. E., Quality and Consumer Studies in the USA of African Herbal Teas for the Natural Product Industry Development in Sub-Sahara Africa. In African Natural Plant Products: Discoveries and Challenges in Quality Control. American Chemical Society Symposium Series 1021, American Chemical Society: Washington, D.C., 2009. 58. Paris, R., Sur une Combretacee africaine, le "kinkeliba" (Combretum micranthum G. Don.). Bulletin des Sciences Pharmacologiques 1942, 10-11-12, 181-186. 59. Jentzsch, V. K.; Spiegl, P.; Fuchs, L., Untersuchungen uber die inhaltsstoffe der blatter von Combretum micranthum G. Don. Planta Medica 1962, 10, 6-8. 60. Bassene, E.; Laurance, A.; Olschwang, D.; Pousset, J.-L., Plantes medicinales africaines XIX: Dosage de la vitexine par chromatographie liquide haute performance dans un extrait brut de Combretum micranthum G. Don. Journal of Chromatography 1985, 346, 428-430.
28
61. Bassene, E.; Olschwang, D.; Pousset, J.-L., Plantes medicinales africaines XXIII: Flavonoides du Combretum micranthum, G. Don (Kinkeliba). Plantes medicinales et phytotherapie 1987, XXI, (2), 173-176. 62. Bassene, E.; Olschwang, D.; Pousset, J.-L., Plantes medicinales africaines. Les alcaloides du Combretum micranthum G. Don (Kinkeliba). Annales Pharmaceutiques Francaises 1986, 44, (3), 191-196. 63. Bassene, E.; Olschwang, D.; Miralles, J.; Pousset, J.-L., Plantes medicinales africaines XX: Acides gras des feuilles de Combretum micranthum G. Don (Kinkeliba). Herba Hungarica 1986, 25, (2), 7-14. 64. Bassene, E.; Olschwang, D.; Pousset, J.-L., Plantes medicinales africaines I: Caracterisation de l'inositol et du sorbitol, principes actifs probables du Kinkeliba ("Combretum micranthum" G. Don.). Dakar Medical 1981, 26, (2), 219-225. 65. Bassene, E.; Olschwang, D.; Pousset, J.-L., Etude de l'insaponifiable de l'extrait lipidique des feuilles de Combretum micranthum G. Don (Kinkeliba). Herba Hungarica 1989, 28, (1-2), 75-79. 66. Karou, D.; Dicko, M. H.; Simpore, J.; Traore, A. S., Antioxidant and antibacterial activities of polyphenols from ethnomedicinal plants of Burkina Faso. African Journal of Biotechnology 2005, 4, (8), 823-828. 67. Benoit, F.; Valentin, A.; Pelissier, Y.; Diafouka, F.; Marion, C.; Kone-Bamba, D.; Kone, M.; Mallie, M.; Yapo, A.; Bastide, J.-M., In Vitro Antimalarial Activity of Vegetal Extracts Used in West African Traditional Medicine. American Journal of Tropical Medicine and Hygiene 1996, 54, (1), 67-71. 68. Ancolio, C.; Azas, N.; Mahiou, V.; Ollivier, E.; Di Giorgio, C.; Keita, A.; Toimon-David, P.; Balansard, G., Antimalarial activity of extracts and alkaloids isolated from six plants used in traditional medicine in Mali and Sao Tome. Phytotherapy Research 2002, 16, (7), 646-649. 69. Karou, D.; Dicko, M. H.; Sanon, S.; Simpore, J.; Traore, A. S., Antimalarial activity of Sida acuta Burm. f. (Malvaceae) and Pterocarpus erinaceus Poir. (Fabaceae). Journal of Ethnopharmacology 2003, 89, 291-294. 70. Di Carlo, F. J.; Haynes, L. J.; Sliver, N. J.; Phillips, G. E., Reticuloendothelial System Stimulants of Botanical Origin. Journal of the Reticuloendothelial Society 1964, 64, 224-232. 71. Ferrea, G.; Canessa, A.; Sampietro, F.; Cruciani, M.; Romussi, G.; Bassetti, D., In vitro activity of a Combretum micranthum extract against herpes simplex virus types 1 and 2. Antiviral Research 1996, 21, 317-325.
29
72. Manach, C.; Scalbert, A.; Morand, C.; Rémésy, C.; Jiménez, L., Polyphenols: food sources and bioavailability. American Journal of Clinical Nutrition 2004, 79, 727-747. 73. Kondratyuk, T. P.; Pezzuto, J. M., Natural Product Polyphenols of Relevance to Human Health. Pharmaceutical Biology 2004, 42S, 46-63. 74. Kitts, D. D.; Yuan, Y. V.; Wijewickreme, A. N.; Thompson, L. U., Antioxidant activity of the flaxseed lignan secoisolariciresinol diglycoside and its mammalian lignan metabolites enterodiol and enterolactone. Molecular Cell Biochemistry 1999, 202, 91-100. 75. Siemann, E. H.; Creasy, L. L., Concentration of the phytoalexin resveratrol in wine. American Journal of Enology and Viticulture 1992, 43, 49-52. 76. Gehm, B. D.; McAndrew, J. M.; Chien, P. Y.; Jameson, J. L., Resveratrol, a polyphenolic compound found in grapes and wine, is an agonist for the estrogen receptor. Proceedings for the National Academy of Science USA 1997, 9, 14138-14143. 77. Stewart, J. R.; Ward, N. E.; Ioannides, C. G.; O'Brian, C. A., Resveratrol preferentially inhibits protein kinase C-catalyzed phosphorylation of a cofactor-independent, arginine-rich protein substrate by a novel mechanism. Biochemistry 1999, 38, 13244-13251. 78. Williams, C. A.; Grayer, R. J., Anthocyanins and other flavonoids. Natural Product Report 2004, 21, 539-573. 79. Beecher, G. R., Overview of dietary flavonoids: nomenclature, occurence and intake. Journal of Nutrition 2003, 133, 3248S-3254S. 80. Harborne, J. B.; Williams, C. A., Advances in flavonoid research since 1992. Phytochemistry (Elsevier) 2000, 55, 481-504. 81. Welch, C. R.; Wu, Q.; Simon, J. E., Recent Advances in Anthocyanin Analysis and Characterization. Current Analytical Chemistry 2008, 4, (2), 75-101. 82. Dhar, D. N., The Chemistry of Chalcones and Related Compounds. Wiley - Interscience: New York, 1981. 83. Dimmock, J. R.; Elias, D. W.; Beazely, M. A.; Kandepu, N. M., Bioactivities of Chalcones. Current Medicinal Chemistry 1999, 6, 1125-1149. 84. Santos-Buelga, C.; Scalbert, A., Proanthocyanidins and tannin-like compounds: nature, occurence, dietary intake and effects on nutrition and health. Journal of the Science of Food and Agriculture 2000, 80, 1094-1117.
30
85. Manach, C.; Morand, C.; Gil-Izquierdo, A.; Bouteloup-Demange, C.; Remesy, C., Bioavailability in humans of the flavanones hespiridin and narirutin after the ingestion of two doses of orange juice. European Journal of Clinical Nutrition 2003, 57, 235-242. 86. Cos, P.; De Bruyne, T.; Apers, S.; Vanden Berghe, D.; Pieters, L.; Vlietinck, A. J., Phytoestrogens: Recent Developments. Planta Medica 2003, 69, (589-599). 87. Mazza, G.; Miniati, E., Anthocyanins in fruits, vegetables and grains. CRC Press, Inc: Boca Raton, FL, 1993. 88. Boersma, B. J.; Patel, R. P.; Kirk, M.; Jackson, P. L.; Muccio, D.; Darley-Usmar, V. M.; Barnes, S., Chlorination and nitration of soy isoflavones. Archives Biochemistry and Biophysics 1999, 368, (265-275). 89. Ketsawatsakul, U.; Whiteman, M.; Halliwell, B., A re-evaluation of the peroxynitrite scavenging activity of some dietary phenolics. Biochemical and Biophysical Research Communications 2000, 279, 692-699. 90. Mira, L.; Fernandez, M. T.; Santos, M.; Rocha, R.; Florencio, M. H.; Jennings, K. R., Interactions of flavonoids with iron and copper ions: a mechanism for their antioxidant activity. Free Radical Research 2002, 36, 1199-1208. 91. Paya, M.; Halliwell, B.; Hoult, J. R. S., Interaction of a series of coumarins with reactive oxygen species: scavenging of superoxide, hypochlorous acid and hydroxyl radicals. Biochemical Pharmacology 1992, 44, 205-214. 92. Halliwell, B.; Rafter, J.; Jenner, A., Health promotion by flavonoids, tocopherols, tocotrienols, and other phenols: direct or indirect effets? Antioxidant or not? American Journal of Clinical Nutrition 2005, 81, 268S-276S. 93. Vattem, D. A.; Shetty, K., Biological Functionality of Ellagic Acid. Journal of Food Biochemistry 2005, 29, 234-266. 94. Scalbert, A.; Manach, C.; Morand, C.; Remesy, C., Dietary Polyphenols and the Prevention of Diseases. Critical Reviews in Food Science and Nutrition 2005, 45, (4), 287-306. 95. Bawa, S. e., The significance of polyphenols in the prevention of neurodegenerative diseases. Agro Food Industry Hi-Tech 2009, 20, (1), 42-46. 96. Bayani, U.; Singh, A. V.; Zamboni, P.; Mahajan, R. T., Oxidative stress and neurodegenerative diseases: a review of upstream and downstream antioxidant therapeutic options. Current Neuropharmacology 2009, 7, (1), 65-74. 97. Butt, M. S.; Sultan, M. T., Green Tea: Nature's Defense against Malignancies. Critical Reviews in Food Science and Nutrition 2009, 49, (5), 463-473.
31
98. Ichiyanagi, T.; Hatano, Y.; Matsugo, S.; Konishi, T., Reactivity of anthocyanin toward reactive oxygen and reactive nitrogen species. CRC Press LLC: Niigata, Japan, 2006; Vol. 21(Molecular Interventions in Lifestyle-Related Diseases), p 339-345. 99. Katsiki, N.; Manes, C., Is there a role for supplemented antioxidants in the prevention of atherosclerosis? Clinical Nutrition 2009, 28, (1), 3-9. 100. Pham-Huy, L. A.; He, H.; Pham-Huy, C., Free radicals, antioxidants in disease and health. International Journal of Biomedical Science 2008, 4, (2), 89-96. 101. Prakash, D.; Gupta, K. R., The antioxidant phytochemicals of nutraceutical importance. Open Nutraceuticals Journal 2009, 2, 20-35. 102. Seifried, H. E.; Milner, J. A., Antioxidants in health and disease. 2nd ed.; Elsevier Inc.: Burlington, MA, 2008. 103. Soory, M., Relevance of nutritional antioxidants in metabolic syndrome, ageing and cancer: potential for therapeutic targeting. Infectious Disorders: Drug Targets 2009, 9, (4), 400-414. 104. Terao, J., Dietary flavonoids as antioxidants. Forum of Nutrition 2009, 61, 87-94. 105. Surh, Y.-J.; Chun, K.-S.; Cha, H.-H.; Han, S. S.; Keum, Y.-S.; Park, K.-K.; Lee, S. S., Molecular mechanisms underlying chemopreventive activities of anti-inflammatory phytochemicals: down-regulation of COX-2 and iNOS through suppression of NF-kappa B activation. Mutation Research 2001, 480-481, 243-268. 106. Pretorius, E., Anti-inflammatory medicinal plants: new insights and research techniques. In Recent Progress in Medicinal Plants, Singh, V. K., Ed. Studium Press, LLC: Houston, TX, 2008; pp 205-226. 107. Singh Bora, K.; Sharma, A., Phytoconstituents and therapeutic potential of Allium cepa Linn. - a review. Pharmacognosy Reviews 2009, 3, (5), 159-169. 108. Meng, C. Q., Atherosclerosis is an inflammatory disorder after all. Current Topics in Medicinal Chemistry 2006, 6, (2), 93-102. 109. Ruderman, E. M., Current and future pharmaceutical therapy for rheumatoid arthritis. Current Pharmaceutical Design 2005, 11, (5), 671-684. 110. Coussens, L. M.; Werb, Z., Inflammation and cancer. Nature 2002, 420, 860-867. 111. Lin, J.-K., Catechins and inhibitory activity against carcinogenesis. Nutrition and Cancer Prevention 2006, 351-367.
32
112. van Kempen, L. C. L.; de Visser, K. E.; Coussens, L. M., Inflammation, proteases and cancer. European Journal of Cancer 2006, 42, 728-734. 113. Dembinska-Kiec, A.; Mykkanen, O.; Kiec-Wilk, B.; Mykkanen, H., Antioxidant phytochemicals against type 2 diabetes. The British Journal of Nutrition 2008, 99, ES109-ES117. 114. WHO, Diabetes Fact Sheet. In 2008. 115. Hui, H.; Tang, G.; Go, V. L. W., Hypoglycemic herbs and their action mechanisms. Chinese Medicine 2009, 4, 11-21. 116. Chi, T.-C.; Chen, W.-P.; Chi, T.-L.; Kuo, T.-F.; Lee, S.-S.; Cheng, J.-T.; Su, M.-J., Phosphatidylinositol-3-kinase is involved in the antihyperglycemic effect induced by resveratrol in streptozotocin-induced diabetic rats. Life Sciencess 2007, 80, 1713-1720. 117. Thompson, L. U.; Yoon, J. H.; Jenkins, D. J.; Wolever, T. M.; Jenkins, A. L., Relationship between polyphenol intake and blood glucose response of normal and diabetic individuals. American Journal of Clinical Nutrition 1984, 39, (5), 745-751. 118. Tsuda, T.; Horio, F.; Uchida, K.; Aoki, H.; Osawa, T., Dietary cyanidin 3-O-beta-D-glucoside-rich purple corn color prevents obesity and ameliorates hyperglycemia in mice. Journal of Nutrition 2003, 133, (7), 2125-2130. 119. Cameron, A. R.; Anton, S.; Melville, L.; Houston, N. P.; Dayal, S.; McDougall, G. J.; Stewart, D.; Rena, G., Black tea polyphenols mimic insulin/insulin-like growth factor-1 signalling to the longevity factor FOXO1a. Aging Cell 2008, 7, 69-77. 120. Govorko, D.; Logendra, S.; Wang, Y.; Esposito, D.; Komarnytsky, S.; Ribnicky, D.; Poulev, A.; Wang, Z.; Cefalu, W. T.; Raskin, I., Polyphenolic compounds from Artemisia dranunculus L. inhibit PEPCK gene expression and gluconeogenesis in an H4IIE hepatoma cell line. American Journal of Physiology - Endocrinology and Metabolism 2007, 293, E1503-E1510. 121. Hanson, R. W.; Reshef, L., Regulation of phosphoenolpyruvate carboxykinase (GTP) gene expression. Annual Review of Biochemistry 1997, 66, 581-611.
33
Chapter 2. Identification of Known Polyphenolic Compounds
34
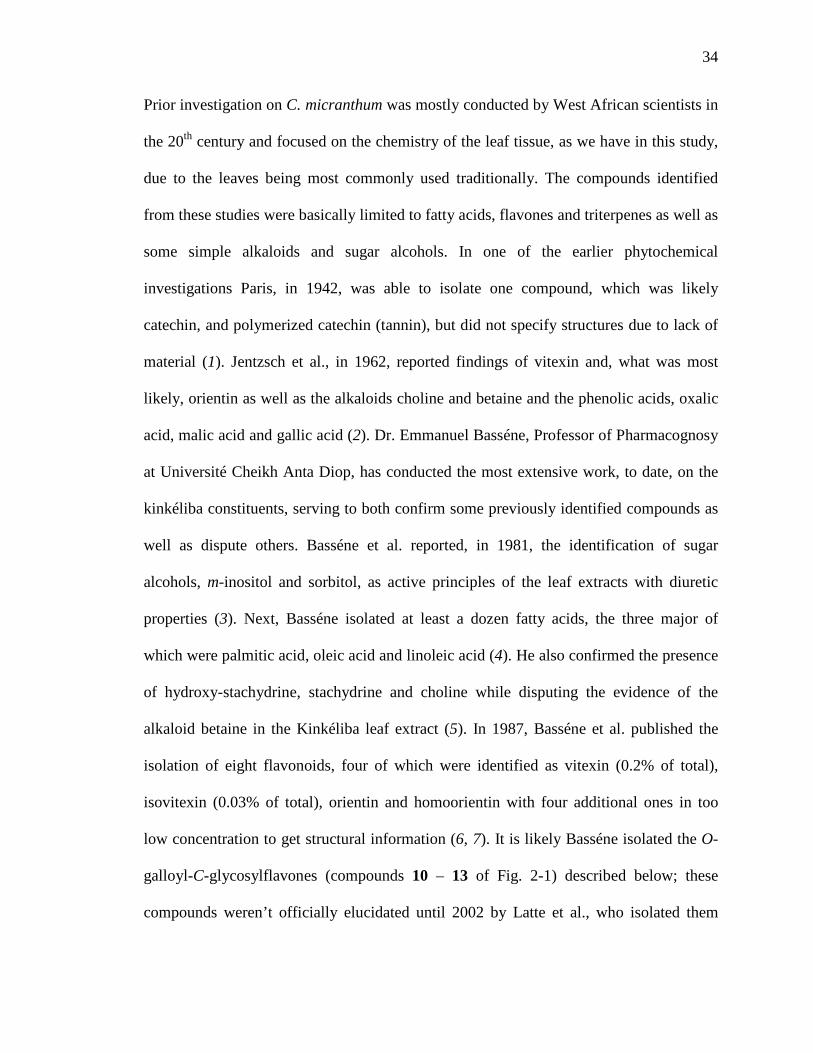
Prior investigation on C. micranthum was mostly conducted by West African scientists in
the 20th century and focused on the chemistry of the leaf tissue, as we have in this study,
due to the leaves being most commonly used traditionally. The compounds identified
from these studies were basically limited to fatty acids, flavones and triterpenes as well as
some simple alkaloids and sugar alcohols. In one of the earlier phytochemical
investigations Paris, in 1942, was able to isolate one compound, which was likely
catechin, and polymerized catechin (tannin), but did not specify structures due to lack of
material (1). Jentzsch et al., in 1962, reported findings of vitexin and, what was most
likely, orientin as well as the alkaloids choline and betaine and the phenolic acids, oxalic
acid, malic acid and gallic acid (2). Dr. Emmanuel Basséne, Professor of Pharmacognosy
at Université Cheikh Anta Diop, has conducted the most extensive work, to date, on the
kinkéliba constituents, serving to both confirm some previously identified compounds as
well as dispute others. Basséne et al. reported, in 1981, the identification of sugar
alcohols, m-inositol and sorbitol, as active principles of the leaf extracts with diuretic
properties (3). Next, Basséne isolated at least a dozen fatty acids, the three major of
which were palmitic acid, oleic acid and linoleic acid (4). He also confirmed the presence
of hydroxy-stachydrine, stachydrine and choline while disputing the evidence of the
alkaloid betaine in the Kinkéliba leaf extract (5). In 1987, Basséne et al. published the
isolation of eight flavonoids, four of which were identified as vitexin (0.2% of total),
isovitexin (0.03% of total), orientin and homoorientin with four additional ones in too
low concentration to get structural information (6, 7). It is likely Basséne isolated the O-
galloyl-C-glycosylflavones (compounds 10 – 13 of Fig. 2-1) described below; these
compounds weren’t officially elucidated until 2002 by Latte et al., who isolated them
35
from Pelargonium reniforme (8). Basséne ended his exploration of Kinkéliba with the
identification of several aliphatic alcohols (C16, C18, C26, C28 and C30), two types of
triterpene alcohols (α-amyrine and lupeol) and a sterol (β-sitosterol) (9). Finally,
D’Agostino et al. confirmed the presence of alkaloids, phenolic acids, sugar alcohols and
flavone-C-glycosides as well as identifying and quantitating two new flavonol
glycosides, myricetin-3-O-glucoside and myricetin-3-O-rutinoside (10).
The present study of kinkéliba leaves was initiated to identify the medicinally active
compounds utilizing a bioactivity-guided fractionation led by in vitro assays, such as
antioxidant capacity, anti-inflammatory activity and glucose-lowering activity, which are
all described in Chapters 5 and 6. The following phytochemical research, under bioactive
guidance, focuses on the ethyl acetate fraction of the crude alcohol extract, and led to the
detection of 13 compounds, Fig. 2-1, all of which have been previously reported in the
literature. Some of the identified compounds, catechins, O-glycosylflavones and C-
glycosylflavones, have been identified from C. micranthum, but the isolated flavans and
O-galloyl-C-glycosylflavone derivatives are new to the Combretaceae family. A flow
diagram detailing the bioactivity-guided fractionation, regarding antioxidant capacity, is
presented in Fig. 2-2 with the results presented and discussed in the later chapters.
2.1. Methodology
Dried and powdered leaves were extracted with aqueous ethanol (EtOH) and the filtrate
was dried and resuspended in water for partitioning with hexane, chloroform (CHCl3),
ethyl acetate (EtOAc) and n-butanol (nBuOH). The EtOAc fraction was rotovapped and
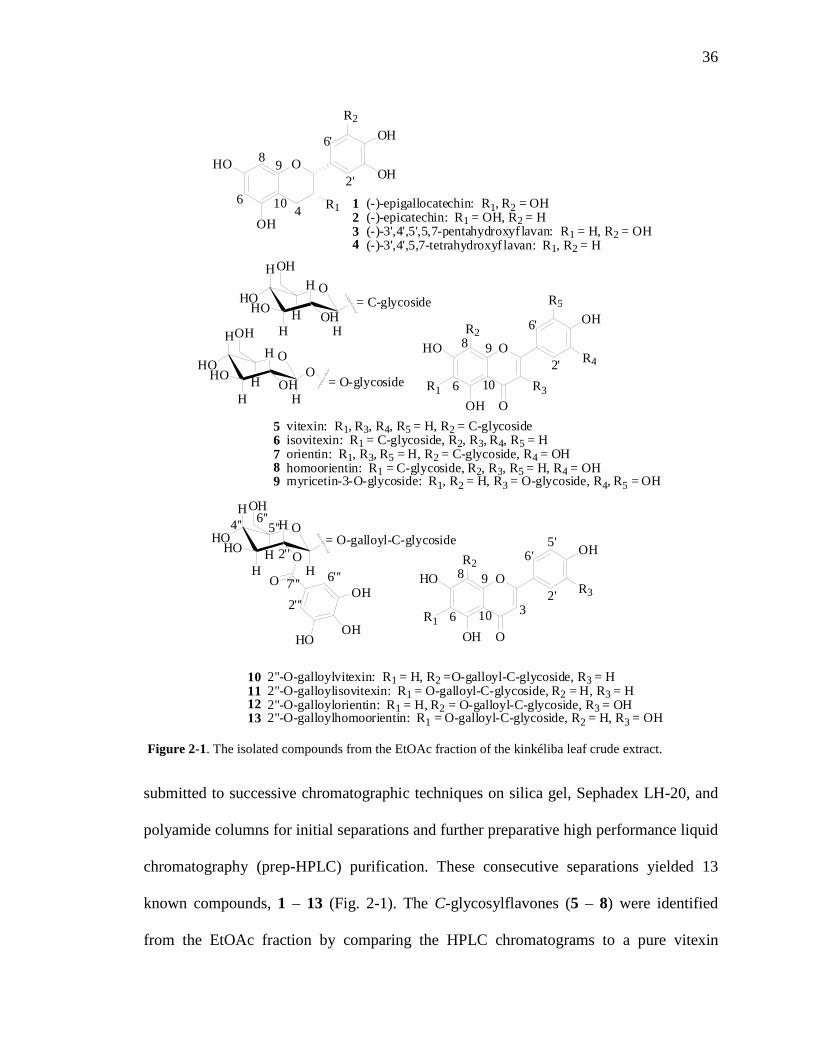
36
submitted to successive chromatographic techniques on silica gel, Sephadex LH-20, and
polyamide columns for initial separations and further preparative high performance liquid
chromatography (prep-HPLC) purification. These consecutive separations yielded 13
known compounds, 1 – 13 (Fig. 2-1). The C-glycosylflavones (5 – 8) were identified
from the EtOAc fraction by comparing the HPLC chromatograms to a pure vitexin
Figure 2-1. The isolated compounds from the EtOAc fraction of the kinkéliba leaf crude extract.
O H O
O H
O H
R 1 O H
R 2
4 6
8 9
1 0 2 '
6 '
O
O O H
H O
O H
3 6
8 9
1 0 2 '
6 ' 5 '
5 ' ' 4 ' '
2 ' '
7 ' ' ' 6 ' ' '
2 ' ' '
6 ' '
1 ( - ) - e p i g a l l o c a t e c h i n : R 1 , R 2 = O H 2 ( - ) - e p i c a t e c h i n : R 1 = O H , R 2 = H 3 ( - ) - 3 ' , 4 ' , 5 ' , 5 , 7 - p e n t a h y d r o x y f l a v a n : R 1 = H , R 2 = O H 4 ( - ) - 3 ' , 4 ' , 5 , 7 - t e t r a h y d r o x y f l a v a n : R 1 , R 2 = H
O H
H O
H H O
H
H O H
O H
O O H
O H H O
R 2
R 1
1 0 2 " - O - g a l l o y l v i t e x i n : R 1 = H , R 2 = O - g a l l o y l - C - g l y c o s i d e , R 3 = H 1 1 2 " - O - g a l l o y l i s o v i t e x i n : R 1 = O - g a l l o y l - C - g l y c o s i d e , R 2 = H , R 3 = H 1 2 2 " - O - g a l l o y l o r i e n t i n : R 1 = H , R 2 = O - g a l l o y l - C - g l y c o s i d e , R 3 = O H 1 3 2 " - O - g a l l o y l h o m o o r i e n t i n : R 1 = O - g a l l o y l - C - g l y c o s i d e , R 2 = H , R 3 = O H
= O - g a l l o y l - C - g l y c o s i d e
R 3
O
O O H
H O
O H
6
8 9
1 0 2 '
6 ' R 2
R 1
R 4 O H
H O
H H O
H
H O H H
O H
O = O - g l y c o s i d e
5 v i t e x i n : R 1 , R 3 , R 4 , R 5 = H , R 2 = C - g l y c o s i d e 6 i s o v i t e x i n : R 1 = C - g l y c o s i d e , R 2 , R 3 , R 4 , R 5 = H 7 o r i e n t i n : R 1 , R 3 , R 5 = H , R 2 = C - g l y c o s i d e , R 4 = O H 8 h o m o o r i e n t i n : R 1 = C - g l y c o s i d e , R 2 , R 3 , R 5 = H , R 4 = O H 9 m y r i c e t i n - 3 - O - g l y c o s i d e : R 1 , R 2 = H , R 3 = O - g l y c o s i d e , R 4 , R 5 = O H
O H
H O
H H O
H
H O H H
O H
= C - g l y c o s i d e
R 3
R 5
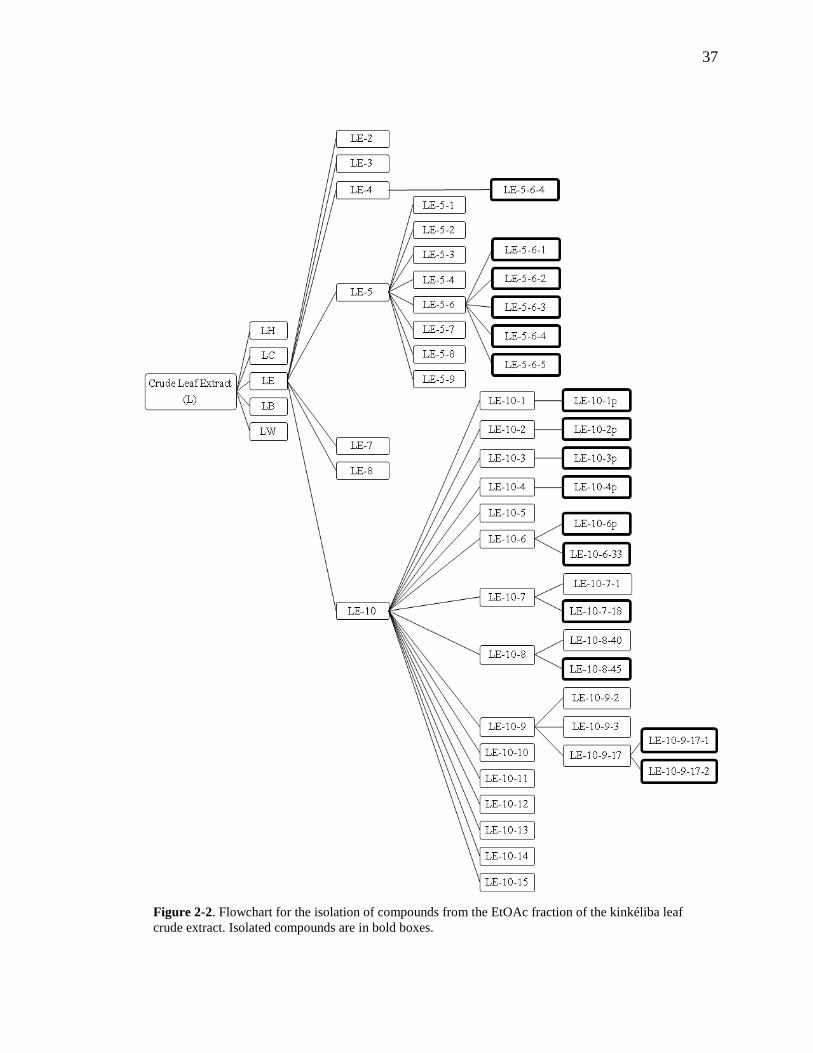
37
Figure 2-2. Flowchart for the isolation of compounds from the EtOAc fraction of the kinkéliba leaf crude extract. Isolated compounds are in bold boxes.
38
standard and analyzing the MS data with the components previously reported in kinkéliba
(2, 6, 7, 10). The other flavonoid compounds in this fraction (1 – 4 and 9 – 13) were
focused on for phytochemical isolation due to promising bioactivity results.
2.1.1. General Experimental Procedures
Optical rotations were measured with a Linos polarimeter (Linos Photonics, Göttingen
Germany). Nuclear magnetic resonance (NMR) spectra were recorded on a Varian 200
MHz spectrometer (Palo Alto, CA) and a Bruker Avance 400 MHz spectrometer
(Billerica, MA). Unless otherwise specified, chemical shifts (δ) are expressed in ppm
with reference to the trimethylsilyl (TMS) signal. All solvents used for chromatographic
separation and isolation were HPLC-grade (Fisher Scientific, Springfield, NJ); HPLC-
grade water was prepared using a Millipore Milli-Q purification system (Millipore Corp.,
Bedford, MA) and used for all experimental procedures. Column chromatography was
performed using silica gel (230 – 400 mesh; Selecto Scientific, Suwanee, GA), Sephadex
LH-20 (25 – 100 µ, Sigma-Aldich, St. Louis, MO), and Polyamide CC 6 (50 – 160 µm,
Sorbent Technologies, Atlanta, GA). Preparative HPLC was performed on a Waters
600/2487 instrument with UV detector (Varian Microsorb C18 column, 10 µm, 41.4 x 300
mm). Analytical HPLC-diode array detector (DAD) was performed on either a Waters
2695/2996 or Waters 2695/996 instrument, HPLC-UV was performed on a Waters
2795/2487 instrument (Milford, MA) and HPLC-DAD-electrospray ionization/mass
spectrometry (ESI/MS) was performed on an Agilent 1100 series instrument (Santa
Clara, CA).
39
2.1.2. Plant Material
The sample of kinkéliba (C. micranthum) utilized for this study was collected from a
single shrub in Leen, Pout, of central Senegal. The leaves and branches that were
collected were first air dried under shade under ambient conditions. Once dried, the
leaves were manually separated from the branches and cleaned. The sample was
taxonomically authenticated by Dr. Malainy Diatta, Agribusiness in Sustainable Natural
African Plant Products (ASNAPP) – Senegal (Dakar, Senegal) and brought back to
Rutgers during a collection trip by Dr. Simon (Rutgers).
2.1.3. Extraction and Isolation
The dried leaves were shipped to Rutgers University accompanied by a USDA Plant
Import Permit and ground to a fine powder with a Perten Laboratory Mill 3100 (Perten
Instruments AB, Kungens Kurva, Sweden) before extraction. The kinkéliba leaf powder
(1.04 kg) was extracted twice with 100% ethanol and a third time with 80% ethanol (v/v)
by maceration for 24 hours; the filtrates were combined and concentrated using a rotary
evaporator (Rotavapor R-200, Büchi, Switzerland). The extract was split in two parts, La
(135.3 g) and Lb (117.0 g), giving a final weight of 252.3 g, a yield of 24.3%. Each half
of the extract was dissolved in water with enough ethanol to completely dissolve (not
more than 5% by volume) and partitioned between hexane (3 x 1.8 L) labeled LH, CHCl3
(3 x 1.8 L) LC, EtOAc (3 x 2 L) LE, and nBuOH (3 x 1.5 L) LB, with the remaining
water fraction as LW. The samples were analyzed by HPLC-DAD-ESI/MS (LC-MS) by
dissolving a small amount in acetone or methanol and filtering through a 0.45 um PTFE
filter. The EtOAc fraction (LE) was chosen to be explored first due to the presence of a
40
number of nicely separated polyphenolic compounds as well as the highest activity by
antioxidant capacity.
The EtOAc fraction, LE 14.4 g, was prepared for silica gel column separation by
dissolving in methanol and adhering to the dry silica, the sample was rotovapped to a dry
powder. The silica gel column was eluted with a gradient starting at 5% methanol in
methylene chloride with 0.1% acetic acid and progressing to 25% methanol before
washing with 100% methanol. Thin-layer chromatography (TLC) plates were used to
monitor the eluted fractions and 14 initial fractions were obtained. LE-1 – 14, giving a
final weight of 91.5% of the starting material, were compared in detail by LC-MS and
resulted in 8 final fractions. A method for HPLC analysis of these EtOAc fractions was
carried on a Microsorb C18 column (Varian, 5 µm, 4.6 x 250 mm) at 1.0 mL/min using
the mobile phase of 0.1% formic acid in water (A) and in acetonitrile (B) at a gradient of
10% B at 0 min and 30% B at 30 min, holding at 30% B until 40 min.
The fifth silica gel column fraction, LE-5 (3.67 g), with the highest anti-inflammatory
activity, was further separated by a Sephadex LH-20 column, hydrated and eluted in
100% methanol (MeOH). HPLC-DAD was utilized to analyze and combine the eluted
fractions into 9 final fractions labeled as LE-5-1 – 9. These LH-20 fractions were then
analyzed by LC-MS to determine specific peaks of interest
The fourth fraction, LE-5-4 with two major peaks, was chosen for initial separation by
preparative TLC (prep-TLC). The fraction (67.9 mg) was dissolved in the smallest
41
amount of MeOH and loaded onto a prep-TLC plate, silica at 250 µm thickness, and
eluted with 20% MeOH in CHCl3 plus 1.0% acetic acid. Five bands were observed and
recovered with MeOH before analysis by HPLC; however, analysis revealed the isolation
of the two major peaks was not successful and the fractions were recombined into 1
fraction.
The sixth Sephadex fraction, LE-5-6, was chosen for separation by prep-HPLC with a
Microsorb C18 column (Varian, 10 µm, 41.4 x 300 mm). The mobile phase was 0.1%
formic acid in water (A) and in acetonitrile (B) at a gradient of 10% B at 0 min, 20% B at
60 min, 40% B at 120 min and 60% at 150 min. The flow rate was set to 15 mL/min and
the fractions were collected at 1 min/tube from 20 to 140 min following injection. The
fraction (700.9 mg) was dissolved in 5 mL MeOH and 1.5 mL was filtered through a 0.45
µm PTFE filter and injected, the remainder was injected under the same conditions once
the separation was deemed appropriate. The eluted fractions from both injections were
analyzed by LC-MS, with the microsorb column and same gradient, and the appropriate
tubes were combined and dried to give compounds 1 – 4. The fractions, shown in Fig. 2-3
compared to the original fraction, were elucidated by NMR spectroscopy and mass
spectrometry as well as compared to standard compounds (Fig. 2-5) for identification.
The seventh fraction, LE-5-7 (310.6 mg), was dissolved in 2 mL MeOH and filtered
through a 0.45 µm filter before separation by prep-HPLC under the same conditions as
LE-5-6 and fractions were collected at 1 min/tube from 20 – 140 min. The eluted
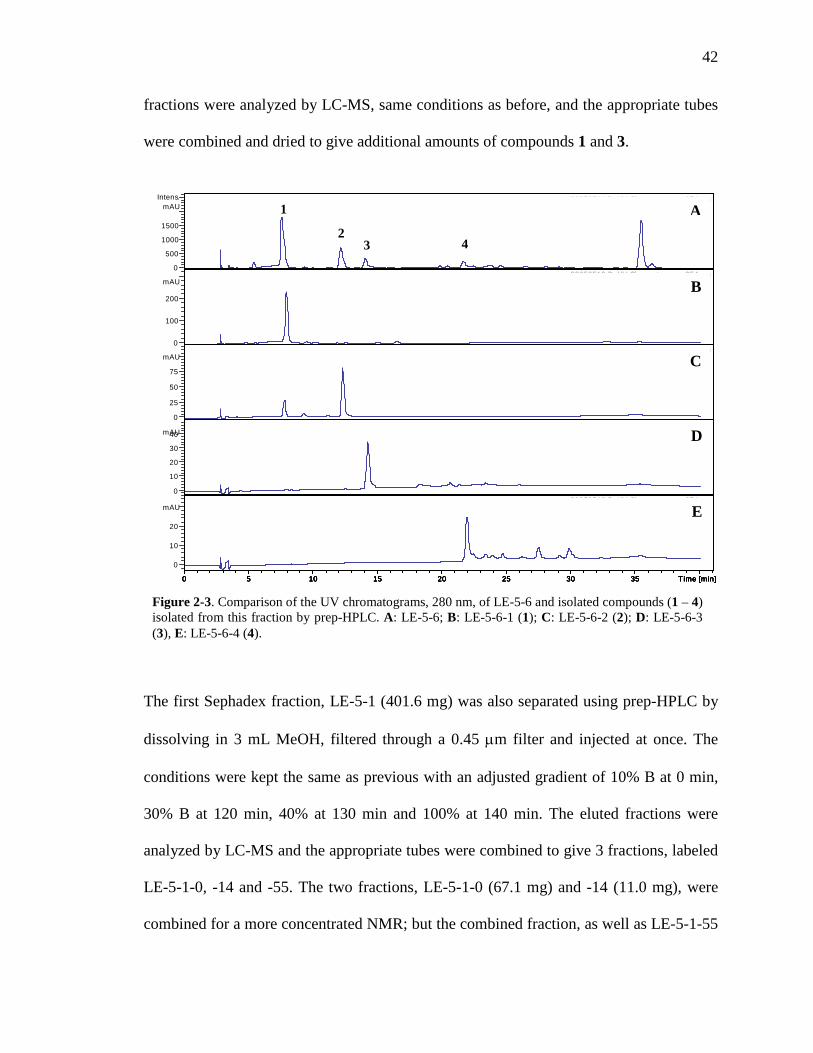
42
fractions were analyzed by LC-MS, same conditions as before, and the appropriate tubes
were combined and dried to give additional amounts of compounds 1 and 3.
The first Sephadex fraction, LE-5-1 (401.6 mg) was also separated using prep-HPLC by
dissolving in 3 mL MeOH, filtered through a 0.45 µm filter and injected at once. The
conditions were kept the same as previous with an adjusted gradient of 10% B at 0 min,
30% B at 120 min, 40% at 130 min and 100% at 140 min. The eluted fractions were
analyzed by LC-MS and the appropriate tubes were combined to give 3 fractions, labeled
LE-5-1-0, -14 and -55. The two fractions, LE-5-1-0 (67.1 mg) and -14 (11.0 mg), were
combined for a more concentrated NMR; but the combined fraction, as well as LE-5-1-55
08050511.D: UV Chromatogram, 254 nm
0
500
1000
1500
Intens.mAU
0 5 10 15 20 25 30 35 Time [min]
08050512.D: UV Chromatogram, 254 nm
0
100
200
mAU
0 5 10 15 20 25 30 35 Time [min]
08050513.D: UV Chromatogram, 254 nm
0
25
50
75
mAU
0 5 10 15 20 25 30 35 Time [min]
08050517.D: UV Chromatogram, 254 nm
0
10
20
30
40mAU
0 5 10 15 20 25 30 35 Time [min]
08050519.D: UV Chromatogram, 254 nm
0
10
20
mAU
0 5 10 15 20 25 30 35 Time [min]
1
Figure 2-3. Comparison of the UV chromatograms, 280 nm, of LE-5-6 and isolated compounds (1 – 4) isolated from this fraction by prep-HPLC. A: LE-5-6; B: LE-5-6-1 (1); C: LE-5-6-2 (2); D: LE-5-6-3 (3), E: LE-5-6-4 (4).
B
C
D
E
A 2
3 4
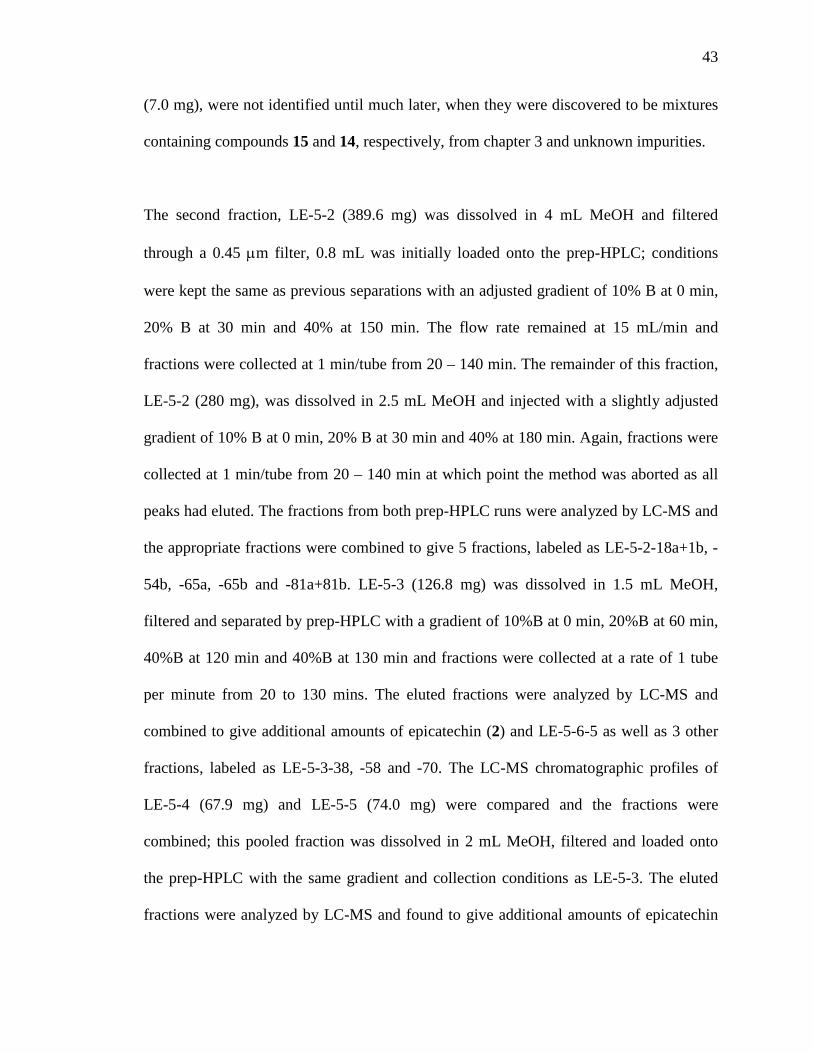
43
(7.0 mg), were not identified until much later, when they were discovered to be mixtures
containing compounds 15 and 14, respectively, from chapter 3 and unknown impurities.
The second fraction, LE-5-2 (389.6 mg) was dissolved in 4 mL MeOH and filtered
through a 0.45 µm filter, 0.8 mL was initially loaded onto the prep-HPLC; conditions
were kept the same as previous separations with an adjusted gradient of 10% B at 0 min,
20% B at 30 min and 40% at 150 min. The flow rate remained at 15 mL/min and
fractions were collected at 1 min/tube from 20 – 140 min. The remainder of this fraction,
LE-5-2 (280 mg), was dissolved in 2.5 mL MeOH and injected with a slightly adjusted
gradient of 10% B at 0 min, 20% B at 30 min and 40% at 180 min. Again, fractions were
collected at 1 min/tube from 20 – 140 min at which point the method was aborted as all
peaks had eluted. The fractions from both prep-HPLC runs were analyzed by LC-MS and
the appropriate fractions were combined to give 5 fractions, labeled as LE-5-2-18a+1b, -
54b, -65a, -65b and -81a+81b. LE-5-3 (126.8 mg) was dissolved in 1.5 mL MeOH,
filtered and separated by prep-HPLC with a gradient of 10%B at 0 min, 20%B at 60 min,
40%B at 120 min and 40%B at 130 min and fractions were collected at a rate of 1 tube
per minute from 20 to 130 mins. The eluted fractions were analyzed by LC-MS and
combined to give additional amounts of epicatechin (2) and LE-5-6-5 as well as 3 other
fractions, labeled as LE-5-3-38, -58 and -70. The LC-MS chromatographic profiles of
LE-5-4 (67.9 mg) and LE-5-5 (74.0 mg) were compared and the fractions were
combined; this pooled fraction was dissolved in 2 mL MeOH, filtered and loaded onto
the prep-HPLC with the same gradient and collection conditions as LE-5-3. The eluted
fractions were analyzed by LC-MS and found to give additional amounts of epicatechin
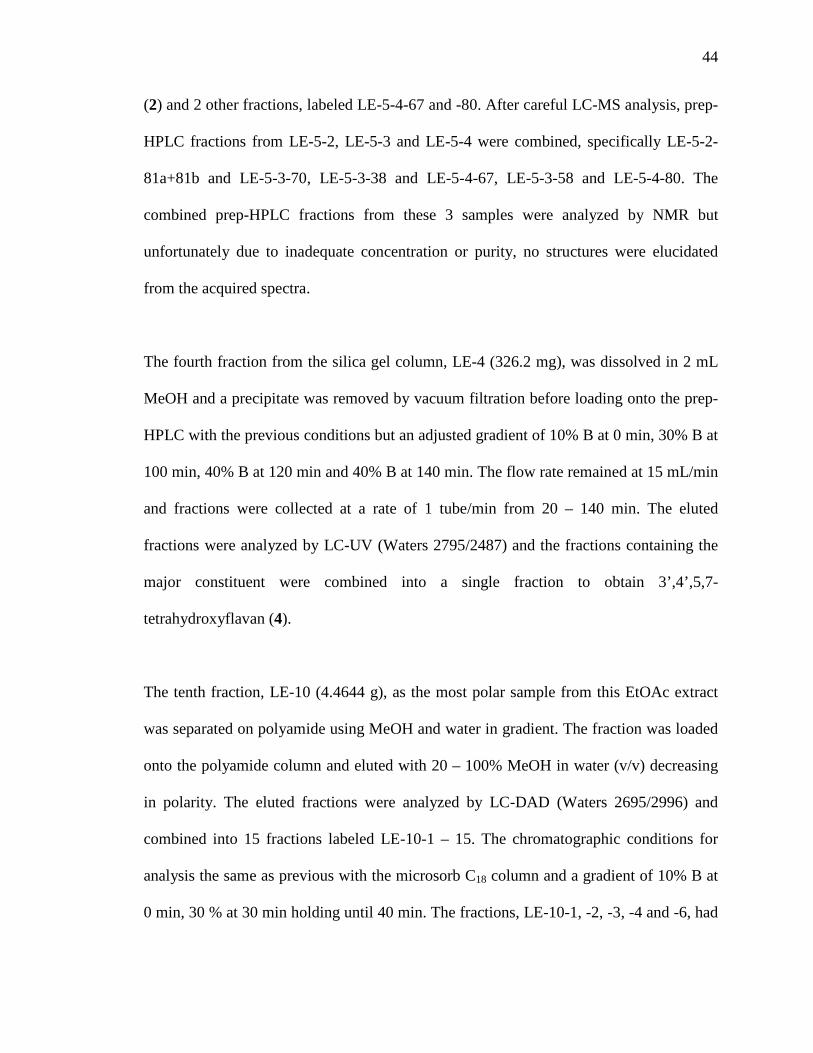
44
(2) and 2 other fractions, labeled LE-5-4-67 and -80. After careful LC-MS analysis, prep-
HPLC fractions from LE-5-2, LE-5-3 and LE-5-4 were combined, specifically LE-5-2-
81a+81b and LE-5-3-70, LE-5-3-38 and LE-5-4-67, LE-5-3-58 and LE-5-4-80. The
combined prep-HPLC fractions from these 3 samples were analyzed by NMR but
unfortunately due to inadequate concentration or purity, no structures were elucidated
from the acquired spectra.
The fourth fraction from the silica gel column, LE-4 (326.2 mg), was dissolved in 2 mL
MeOH and a precipitate was removed by vacuum filtration before loading onto the prep-
HPLC with the previous conditions but an adjusted gradient of 10% B at 0 min, 30% B at
100 min, 40% B at 120 min and 40% B at 140 min. The flow rate remained at 15 mL/min
and fractions were collected at a rate of 1 tube/min from 20 – 140 min. The eluted
fractions were analyzed by LC-UV (Waters 2795/2487) and the fractions containing the
major constituent were combined into a single fraction to obtain 3’,4’,5,7-
tetrahydroxyflavan (4).
The tenth fraction, LE-10 (4.4644 g), as the most polar sample from this EtOAc extract
was separated on polyamide using MeOH and water in gradient. The fraction was loaded
onto the polyamide column and eluted with 20 – 100% MeOH in water (v/v) decreasing
in polarity. The eluted fractions were analyzed by LC-DAD (Waters 2695/2996) and
combined into 15 fractions labeled LE-10-1 – 15. The chromatographic conditions for
analysis the same as previous with the microsorb C18 column and a gradient of 10% B at
0 min, 30 % at 30 min holding until 40 min. The fractions, LE-10-1, -2, -3, -4 and -6, had
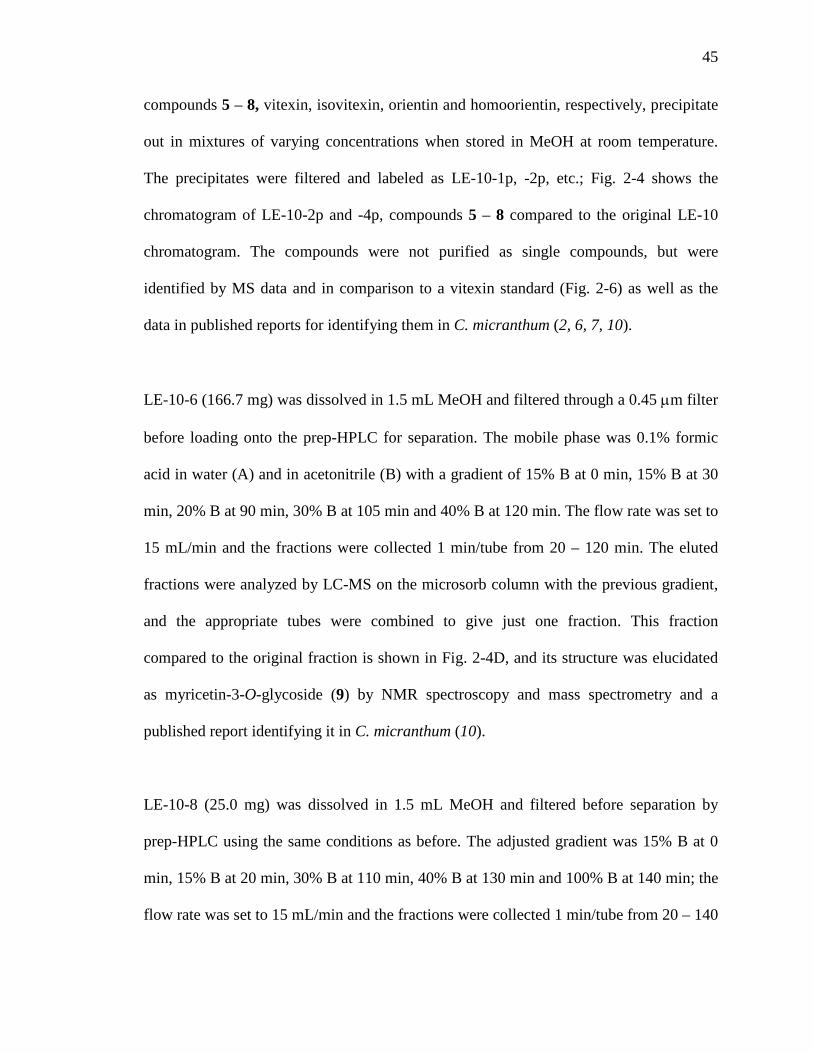
45
compounds 5 – 8, vitexin, isovitexin, orientin and homoorientin, respectively, precipitate
out in mixtures of varying concentrations when stored in MeOH at room temperature.
The precipitates were filtered and labeled as LE-10-1p, -2p, etc.; Fig. 2-4 shows the
chromatogram of LE-10-2p and -4p, compounds 5 – 8 compared to the original LE-10
chromatogram. The compounds were not purified as single compounds, but were
identified by MS data and in comparison to a vitexin standard (Fig. 2-6) as well as the
data in published reports for identifying them in C. micranthum (2, 6, 7, 10).
LE-10-6 (166.7 mg) was dissolved in 1.5 mL MeOH and filtered through a 0.45 µm filter
before loading onto the prep-HPLC for separation. The mobile phase was 0.1% formic
acid in water (A) and in acetonitrile (B) with a gradient of 15% B at 0 min, 15% B at 30
min, 20% B at 90 min, 30% B at 105 min and 40% B at 120 min. The flow rate was set to
15 mL/min and the fractions were collected 1 min/tube from 20 – 120 min. The eluted
fractions were analyzed by LC-MS on the microsorb column with the previous gradient,
and the appropriate tubes were combined to give just one fraction. This fraction
compared to the original fraction is shown in Fig. 2-4D, and its structure was elucidated
as myricetin-3-O-glycoside (9) by NMR spectroscopy and mass spectrometry and a
published report identifying it in C. micranthum (10).
LE-10-8 (25.0 mg) was dissolved in 1.5 mL MeOH and filtered before separation by
prep-HPLC using the same conditions as before. The adjusted gradient was 15% B at 0
min, 15% B at 20 min, 30% B at 110 min, 40% B at 130 min and 100% B at 140 min; the
flow rate was set to 15 mL/min and the fractions were collected 1 min/tube from 20 – 140
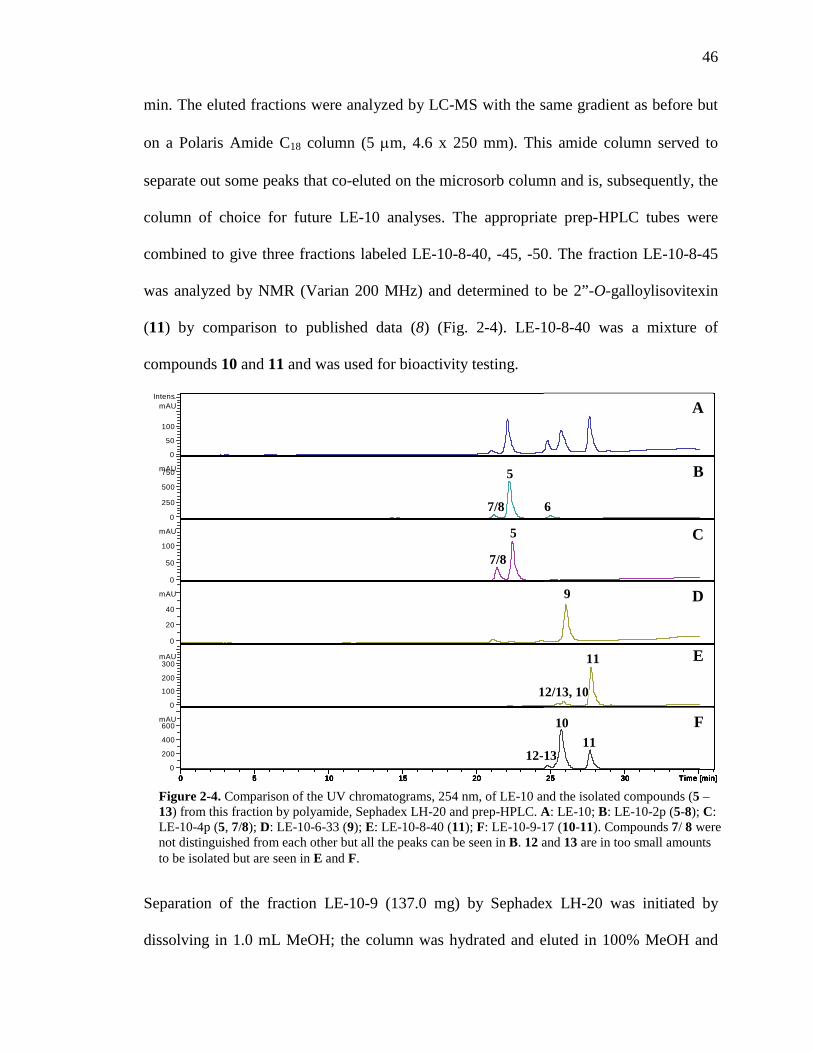
46
min. The eluted fractions were analyzed by LC-MS with the same gradient as before but
on a Polaris Amide C18 column (5 µm, 4.6 x 250 mm). This amide column served to
separate out some peaks that co-eluted on the microsorb column and is, subsequently, the
column of choice for future LE-10 analyses. The appropriate prep-HPLC tubes were
combined to give three fractions labeled LE-10-8-40, -45, -50. The fraction LE-10-8-45
was analyzed by NMR (Varian 200 MHz) and determined to be 2”-O-galloylisovitexin
(11) by comparison to published data (8) (Fig. 2-4). LE-10-8-40 was a mixture of
compounds 10 and 11 and was used for bioactivity testing.
Separation of the fraction LE-10-9 (137.0 mg) by Sephadex LH-20 was initiated by
dissolving in 1.0 mL MeOH; the column was hydrated and eluted in 100% MeOH and
09090902.D: UV Chromatogram, 254 nm
0
50
100
Intens.mAU
0 5 10 15 20 25 30 Time [min]
09090904.D: UV Chromatogram, 254 nm
0
250
500
750mAU
0 5 10 15 20 25 30 Time [min]
09090907.D: UV Chromatogram, 254 nm
0
50
100
mAU
0 5 10 15 20 25 30 Time [min]
09090916.D: UV Chromatogram, 254 nm
0
20
40
mAU
0 5 10 15 20 25 30 Time [min]
09090912.D: UV Chromatogram, 254 nm
0
100
200
300mAU
0 5 10 15 20 25 30 Time [min]
09090913.D: UV Chromatogram, 254 nm
0
200
400
600mAU
0 5 10 15 20 25 30 Time [min]
A
B
C
D
E
F
Figure 2-4. Comparison of the UV chromatograms, 254 nm, of LE-10 and the isolated compounds (5 – 13) from this fraction by polyamide, Sephadex LH-20 and prep-HPLC. A: LE-10; B: LE-10-2p (5-8); C: LE-10-4p (5, 7/8); D: LE-10-6-33 (9); E: LE-10-8-40 (11); F: LE-10-9-17 (10-11). Compounds 7/ 8 were not distinguished from each other but all the peaks can be seen in B. 12 and 13 are in too small amounts to be isolated but are seen in E and F.
11
10
9
12-13 11
12/13, 10
7/8
5
6
5
7/8
47
the fraction was separated into compounds that are visible at UV254 and those that are
transparent. The eluted fractions were combined into 3 fractions labeled LE-10-9-2, -3
and -17. The subfraction LE-10-9-17 (77 mg), containing compounds visible at UV254,
was further separated by analytical LC (Waters 2695/996), dissolving in 1 mL MeOH and
filtering through a 0.45 µm PTFE filter. The separation utilized 20 µL injections on the
Amide C18 column with an isocratic solvent system of 45% B for 25 min, where the
mobile phase is 0.1% formic acid in water (A) and in MeOH (B). For each injection, 2
peaks were collected and analyzed by LC-DAD (Waters 2695/996) before combination
with like fractions; the separation afforded 12.0 mg of LE-10-9-17-1 and 6.0 mg of -2
(Fig. 2-4). Both compounds were analyzed by NMR (Bruker 400 MHz) and determined
to be 2”-O-galloylvitexin (10) and 2”-O-galloylisovitexin (11), respectively, when
compared to published data (8). Compounds 12 and 13, the galloylated orientin
derivatives, could be confidently identified by MS; however, the mixture of these
compounds was not further separated.
LE-10-7 (76.1 mg) and LE-10-10 (66.7 mg) were each also separated by Sephadex LH-
20. These fractions were also fractionated into the UV254nm transparent compounds and
visible compounds, giving three fractions for each labeled LE-10-7-11, -13, -18 and LE-
10-10-0, -2, -18. One of these sephadex fractions, LE-10-7-18, was a fairly clean sample
of 2”-O-galloylisovitexin (11), but needed to be cleaned up for a better NMR analysis.
The sample (23.8 mg) was dissolved in 1 mL MeOH and separated by analytical LC-UV
(Waters 2795/2487) on the Amide C18 column with the previous gradient; multiple
48
injections provided three fractions, one of which was LE-10-7-18-3 and provided
confirmation of the structure by NMR.
2.2. Structural Elucidation
2.2.1. MS, NMR, Optical Rotation
The isolated compounds 1 – 4 were dissolved in 0.75 mL deuterated MeOH (d-MeOH),
analyzed by NMR (Varian 200 MHz) and identified as epigallocatechin, epicatechin,
3’,4’,5’,5,7-pentahydroxyflavan and 3’,4’,5,7-tetrahydroxyflavan, respectively, by
comparing their 1H and 13C NMR assignments with published reports (11-14). Tabulated
chemical shifts for these known compounds can be seen in Table 2-1. The catechins were
indisputably identified as (-)-epigallocatechin and (-)-epicatechin by both optical rotation,
[α]23D -19.05° (c 0.01575, MeOH) and [α]23
D -102.88° (c 0.000972, MeOH),
respectively, and by HPLC-DAD comparison to standards (Fig. 2-5). Optical rotation in
MeOH established the flavans to be (-)-3’,4’,5’,5,7-pentahydroxyflavan, [α]23D -33.56° (c
0.00298, MeOH), and (-)-3’,4’,5,7-tetrahydroxyflavan, [α]23D -108.11° (c 0.0037,
MeOH).
Compounds 5 – 8, from fractions LE-10-1p, -2p, -3p, -4p and -6p, were determined to be
mixtures of vitexin, isovitexin, orientin and homoorientin in varying concentrations. The
compounds were not further separated as single compounds, but were identified by MS
and comparison to the vitexin standard (Fig. 2-6) as well as published reports (2, 6, 7,
10).
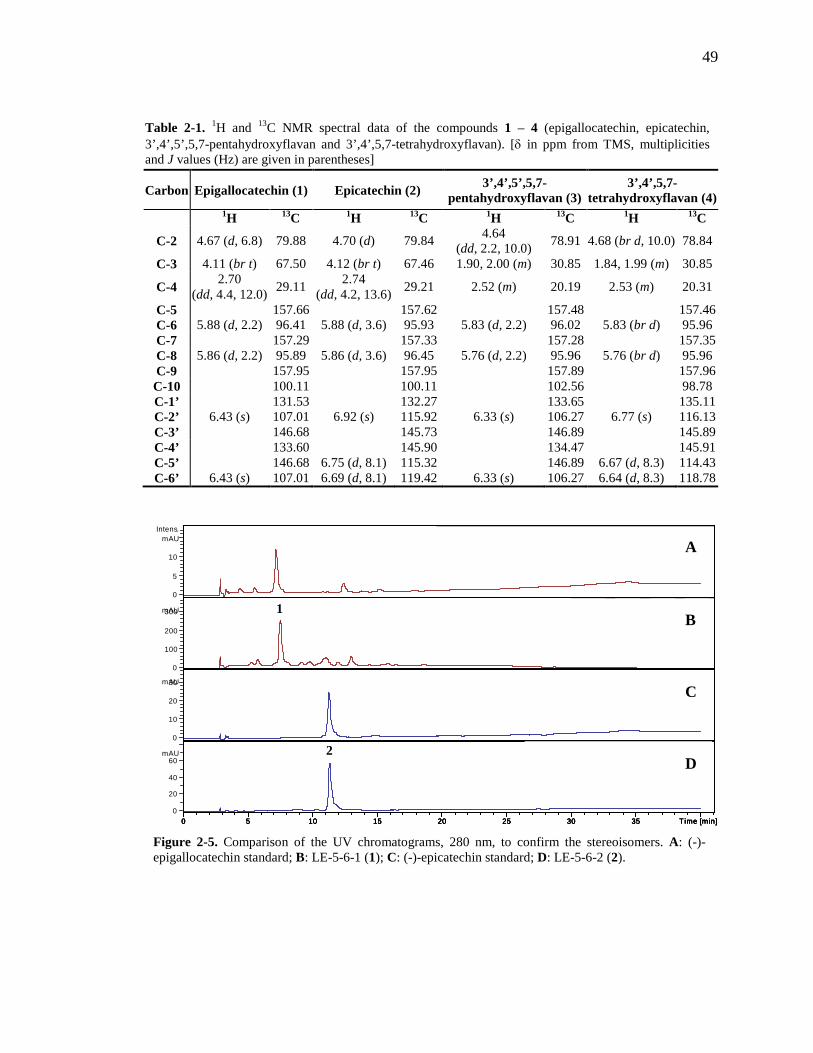
49
Carbon Epigallocatechin (1) Epicatechin (2) 3’,4’,5’,5,7-pentahydroxyflavan (3)
3’,4’,5,7-tetrahydroxyflavan (4)
1H 13C 1H 13C 1H 13C 1H 13C
C-2 4.67 (d, 6.8) 79.88 4.70 (d) 79.84 4.64 (dd, 2.2, 10.0) 78.91 4.68 (br d, 10.0) 78.84
C-3 4.11 (br t) 67.50 4.12 (br t) 67.46 1.90, 2.00 (m) 30.85 1.84, 1.99 (m) 30.85
C-4 2.70 (dd, 4.4, 12.0) 29.11 2.74
(dd, 4.2, 13.6) 29.21 2.52 (m) 20.19 2.53 (m) 20.31
C-5 157.66 157.62 157.48 157.46 C-6 5.88 (d, 2.2) 96.41 5.88 (d, 3.6) 95.93 5.83 (d, 2.2) 96.02 5.83 (br d) 95.96 C-7 157.29 157.33 157.28 157.35 C-8 5.86 (d, 2.2) 95.89 5.86 (d, 3.6) 96.45 5.76 (d, 2.2) 95.96 5.76 (br d) 95.96 C-9 157.95 157.95 157.89 157.96 C-10 100.11 100.11 102.56 98.78 C-1’ 131.53 132.27 133.65 135.11 C-2’ 6.43 (s) 107.01 6.92 (s) 115.92 6.33 (s) 106.27 6.77 (s) 116.13 C-3’ 146.68 145.73 146.89 145.89 C-4’ 133.60 145.90 134.47 145.91 C-5’ 146.68 6.75 (d, 8.1) 115.32 146.89 6.67 (d, 8.3) 114.43 C-6’ 6.43 (s) 107.01 6.69 (d, 8.1) 119.42 6.33 (s) 106.27 6.64 (d, 8.3) 118.78
08080511.D: UV Chromatogram, 254 nm
0
5
10
Intens.mAU
0 5 10 15 20 25 30 35 Time [min]
08080502.D: UV Chromatogram, 254 nm
0
100
200
300mAU
0 5 10 15 20 25 30 35 Time [min]
08080503.D: UV Chromatogram, 254 nm
0
10
20
30mAU
0 5 10 15 20 25 30 35 Time [min]
08080504.D: UV Chromatogram, 254 nm
0
20
40
60mAU
0 5 10 15 20 25 30 35 Time [min]
Figure 2-5. Comparison of the UV chromatograms, 280 nm, to confirm the stereoisomers. A: (-)-epigallocatechin standard; B: LE-5-6-1 (1); C: (-)-epicatechin standard; D: LE-5-6-2 (2).
A
B
C
D
Table 2-1. 1H and 13C NMR spectral data of the compounds 1 – 4 (epigallocatechin, epicatechin, 3’,4’,5’,5,7-pentahydroxyflavan and 3’,4’,5,7-tetrahydroxyflavan). [δ in ppm from TMS, multiplicities and J values (Hz) are given in parentheses]
1
2
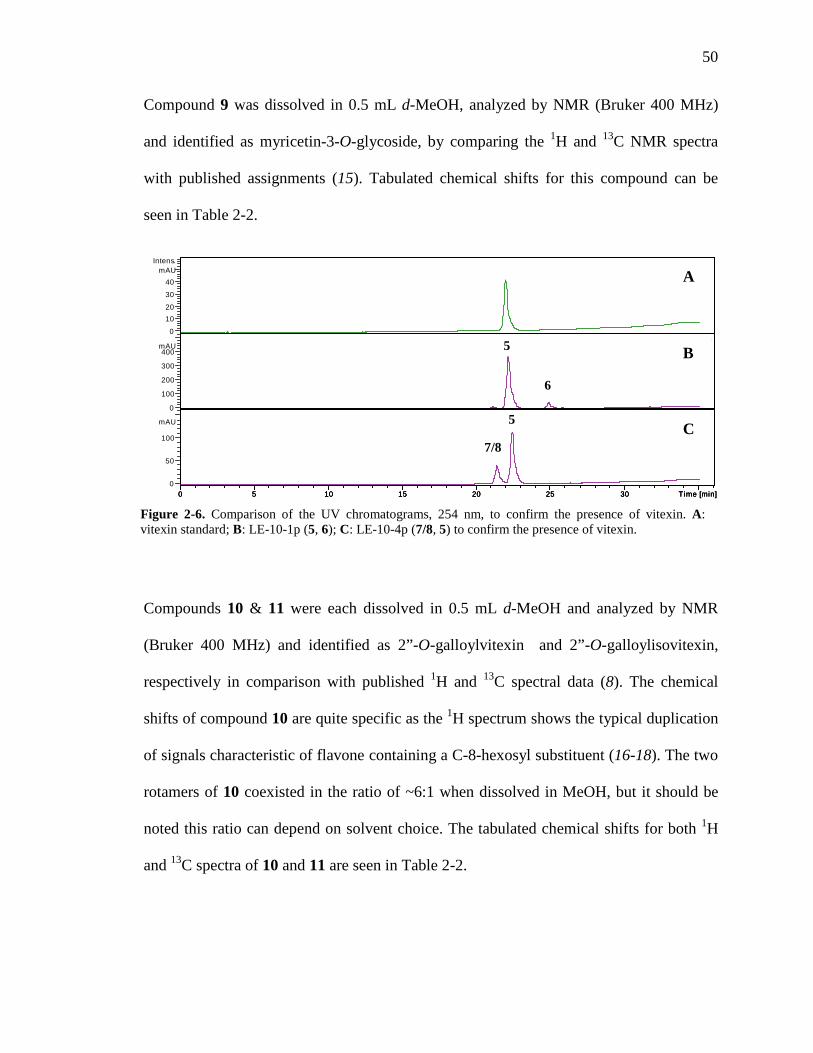
50
Compound 9 was dissolved in 0.5 mL d-MeOH, analyzed by NMR (Bruker 400 MHz)
and identified as myricetin-3-O-glycoside, by comparing the 1H and 13C NMR spectra
with published assignments (15). Tabulated chemical shifts for this compound can be
seen in Table 2-2.
Compounds 10 & 11 were each dissolved in 0.5 mL d-MeOH and analyzed by NMR
(Bruker 400 MHz) and identified as 2”-O-galloylvitexin and 2”-O-galloylisovitexin,
respectively in comparison with published 1H and 13C spectral data (8). The chemical
shifts of compound 10 are quite specific as the 1H spectrum shows the typical duplication
of signals characteristic of flavone containing a C-8-hexosyl substituent (16-18). The two
rotamers of 10 coexisted in the ratio of ~6:1 when dissolved in MeOH, but it should be
noted this ratio can depend on solvent choice. The tabulated chemical shifts for both 1H
and 13C spectra of 10 and 11 are seen in Table 2-2.
09090915.D: UV Chromatogram, 254 nm
0
1020
30
40
Intens.mAU
0 5 10 15 20 25 30 Time [min]
09090903.D: UV Chromatogram, 254 nm
0
100
200
300
400mAU
0 5 10 15 20 25 30 Time [min]
09090907.D: UV Chromatogram, 254 nm
0
50
100
mAU
0 5 10 15 20 25 30 Time [min]
Figure 2-6. Comparison of the UV chromatograms, 254 nm, to confirm the presence of vitexin. A: vitexin standard; B: LE-10-1p (5, 6); C: LE-10-4p (7/8, 5) to confirm the presence of vitexin.
A
B
C
5
6
5
7/8
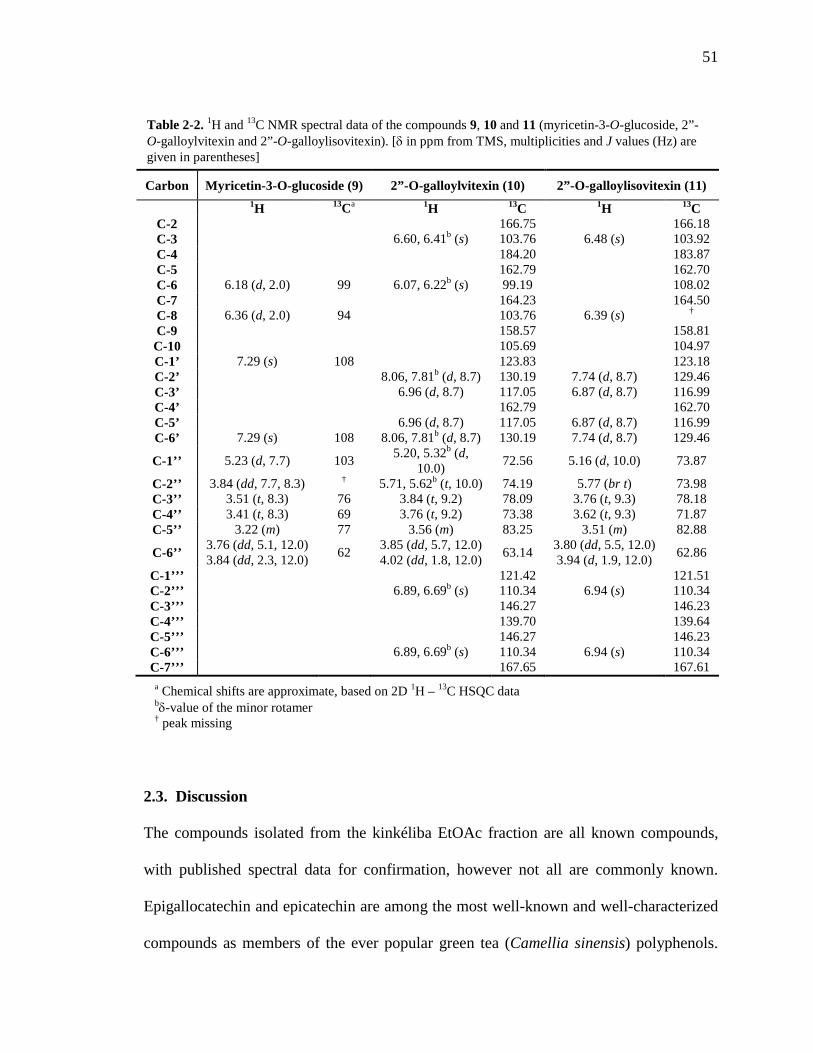
51
Carbon Myricetin-3-O-glucoside (9) 2”-O-galloylvitexin (10) 2”-O-galloylisovitexin (11)
1H 13Ca 1H 13C 1H 13C C-2 166.75 166.18 C-3 6.60, 6.41b (s) 103.76 6.48 (s) 103.92 C-4 184.20 183.87 C-5 162.79 162.70 C-6 6.18 (d, 2.0) 99 6.07, 6.22b (s) 99.19 108.02 C-7 164.23 164.50 C-8 6.36 (d, 2.0) 94 103.76 6.39 (s) † C-9 158.57 158.81 C-10 105.69 104.97 C-1’ 7.29 (s) 108 123.83 123.18 C-2’ 8.06, 7.81b (d, 8.7) 130.19 7.74 (d, 8.7) 129.46 C-3’ 6.96 (d, 8.7) 117.05 6.87 (d, 8.7) 116.99 C-4’ 162.79 162.70 C-5’ 6.96 (d, 8.7) 117.05 6.87 (d, 8.7) 116.99 C-6’ 7.29 (s) 108 8.06, 7.81b (d, 8.7) 130.19 7.74 (d, 8.7) 129.46
C-1’’ 5.23 (d, 7.7) 103 5.20, 5.32b (d, 10.0) 72.56 5.16 (d, 10.0) 73.87
C-2’’ 3.84 (dd, 7.7, 8.3) † 5.71, 5.62b (t, 10.0) 74.19 5.77 (br t) 73.98 C-3’’ 3.51 (t, 8.3) 76 3.84 (t, 9.2) 78.09 3.76 (t, 9.3) 78.18 C-4’’ 3.41 (t, 8.3) 69 3.76 (t, 9.2) 73.38 3.62 (t, 9.3) 71.87 C-5’’ 3.22 (m) 77 3.56 (m) 83.25 3.51 (m) 82.88
C-6’’ 3.76 (dd, 5.1, 12.0) 3.84 (dd, 2.3, 12.0) 62 3.85 (dd, 5.7, 12.0)
4.02 (dd, 1.8, 12.0) 63.14 3.80 (dd, 5.5, 12.0) 3.94 (d, 1.9, 12.0) 62.86
C-1’’’ 121.42 121.51 C-2’’’ 6.89, 6.69b (s) 110.34 6.94 (s) 110.34 C-3’’’ 146.27 146.23 C-4’’’ 139.70 139.64 C-5’’’ 146.27 146.23 C-6’’’ 6.89, 6.69b (s) 110.34 6.94 (s) 110.34 C-7’’’ 167.65 167.61
2.3. Discussion
The compounds isolated from the kinkéliba EtOAc fraction are all known compounds,
with published spectral data for confirmation, however not all are commonly known.
Epigallocatechin and epicatechin are among the most well-known and well-characterized
compounds as members of the ever popular green tea (Camellia sinensis) polyphenols.
Table 2-2. 1H and 13C NMR spectral data of the compounds 9, 10 and 11 (myricetin-3-O-glucoside, 2”-O-galloylvitexin and 2”-O-galloylisovitexin). [δ in ppm from TMS, multiplicities and J values (Hz) are given in parentheses]
a Chemical shifts are approximate, based on 2D 1H – 13C HSQC data bδ-value of the minor rotamer † peak missing
52
The composition of polyphenols in dried green tea leaves is epigallocatechin gallate
(EGCG) at more than 80 mg/g, epicatechin gallate (ECG) at approximately 20 mg/g,
epigallocatechin (EGC) just under 40 mg/g and epicatechin (EC) around 10 mg/g (19).
These compounds have been extensively studied for a variety of bioactive and medicinal
uses, mostly focusing on the entire group of green tea polyphenols. Green tea
polyphenols are probably most well known for their antioxidant capacity; this activity is
not only present in in vitro assays but is well-documented in animal studies as well.
Additionally, however, these compounds hold properties for antimutagenic, antidiabetic,
antihypertensive, anti-inflammatory, antiviral and antibacterial effects (19, 20). Green tea
polyphenols have also shown the ability to lower risk of cardiovascular disease and many
types of cancer including, but not limited to, breast, ovarian, prostate, gastro-intestinal
and lung cancer (20). These beneficial effects of green tea polyphenols are most often
attributed to EGCG, which has high activity and is in the highest concentration, but the
bioavailability of the polyphenols does vary quite a bit with EGCG being the least
available (limited by its instability), EGC is slightly higher, ECG is higher yet, and EC,
as a fairly stable compound, has the highest bioavailability (21). So while
epigallocatechin and epicatechin are considered lower constituents of green tea
polyphenols, the effects of green tea is very likely a fortunate combination of all four
green tea polyphenols. Catechins are not found just in tea, however, but have been
identified in fruits, legumes, chocolate, red wine, and a number of other sources, and the
resultant bioactive effect has also been identified in these sources (22-24). Similarly,
epigallocatechin and epicatechin identified in kinkéliba should be explored with interest
regarding the medicinal effects and health properties of the brewed tea.
53
The flavans identified from this EtOAc fraction are quite close, structurally, to the
catechins just discussed; however, these compounds are far less common to be isolated
from natural plant products. At present, 3’,4’,5,7-tetrahydroxyflavan can be easily formed
from enzymatic action on other naturally occurring flavonoids (25, 26) but has only been
isolated from the dried leaves of Phacellaria compressa Benth (14). Similarly,
3’,4’,5’,5,7-pentahydroxyflavan has only been isolated from the twigs and leaves of
Pithecellobium clypearia by Guo et al. (13). With the small chance of finding these
compounds in nature, it is not surprising this is the initial introduction of these flavans to
the Combretaceae family. Additionally, there are not a lot of well-documented bioactive
properties associated with these compounds; however, Bao et al. have recently
demonstrated a moderate inhibition of histamine release from rat peritoneal mast cells in
vitro when induced by compound 48/80 and treated with 3’,4’,5’,5,7-pentahydroxyflavan,
describing an effective anti-inflammatory or anti-allergic agent (27). Besides these two
identified flavans, 4’,5,7-trihydroxyflavan, isolated from Faramea guianensis in the
Amazonian forest, has demonstrated leishmanicidal activity in vitro (28). The observed
activity of this trihydroxyflavan can be evidence for exploration of antimicrobial activity
in the kinkéliba flavans.
The C-glycosylflavones have been published numerous times as C. micranthum
constituents, but the bioactivity of these compounds has not been fully explored, most
likely due to their low bioavailability as a result of the carbon-linkage between flavone
and sugar (29). The O-galloyl-C-glycosylflavones, on the other hand, were remarkably
54
more effective antioxidants than their C-glycosylflavone counterparts and helping to
explain the effectiveness of Pelargonium reniforme in the treatment of liver disorders
(30). Additionally, 2”-O-galloylisovitexin showed moderate antiprotozoal activity against
W2, a Plasmodium falciparum strain (chloroquine-resistant), while isovitexin and vitexin,
also isolated from Clidemia sericea, showed no activity (31).
All of the compounds isolated and identified from the EtOAc fraction of Kinkéliba are
known structures, but this study is the first to classify many of these compounds as from
the Combretum species; in contrast, other chemical constituents have been known for
years, such as the C-glycosylflavones. Due to the widespread use of Combretaceae for
medicinal purposes, knowledge of the major constituents for each species is important
when scientifically justifying the bioactive potential; identification of these constituents,
both previously reported and currently identified, help to validate the medicinal uses of
C. micranthum. What these compounds do have in common is the potential for
widespread bioactive properties, according to the discussion above as well as antioxidant
and anti-inflammatory studies in the following chapters.
55
2.4. References
1. Paris, R., Sur une Combretacee africaine, le "kinkeliba" (Combretum micranthum G. Don.). Bulletin des Sciences Pharmacologiques 1942, 10-11-12, 181-186. 2. Jentzsch, V. K.; Spiegl, P.; Fuchs, L., Untersuchungen uber die inhaltsstoffe der blatter von Combretum micranthum G. Don. Planta Medica 1962, 10, 6-8. 3. Bassene, E.; Olschwang, D.; Pousset, J.-L., Plantes medicinales africaines I: Caracterisation de l'inositol et du sorbitol, principes actifs probables du Kinkeliba ("Combretum micranthum" G. Don.). Dakar Medical 1981, 26, (2), 219-225. 4. Bassene, E.; Olschwang, D.; Miralles, J.; Pousset, J.-L., Plantes medicinales africaines XX: Acides gras des feuilles de Combretum micranthum G. Don (Kinkeliba). Herba Hungarica 1986, 25, (2), 7-14. 5. Bassene, E.; Olschwang, D.; Pousset, J.-L., Plantes medicinales africaines. Les alcaloides du Combretum micranthum G. Don (Kinkeliba). Annales Pharmaceutiques Francaises 1986, 44, (3), 191-196. 6. Bassene, E.; Olschwang, D.; Pousset, J.-L., Plantes medicinales africaines XXIII: Flavonoides du Combretum micranthum, G. Don (Kinkeliba). Plantes medicinales et phytotherapie 1987, XXI, (2), 173-176. 7. Bassene, E.; Laurance, A.; Olschwang, D.; Pousset, J.-L., Plantes medicinales africaines XIX: Dosage de la vitexine par chromatographie liquide haute performance dans un extrait brut de Combretum micranthum G. Don. Journal of Chromatography 1985, 346, 428-430. 8. Latte, K. P.; Ferreira, D.; Venkatraman, M. S.; Kolodziej, H., O-Galloyl-C-glycosylflavones from Pelargonium reniforme. Phytochemistry 2002, 59, 419-424. 9. Bassene, E.; Olschwang, D.; Pousset, J.-L., Etude de l'insaponifiable de l'extrait lipidique des feuilles de Combretum micranthum G. Don (Kinkeliba). Herba Hungarica 1989, 28, (1-2), 75-79. 10. D' Agostino, M.; Biagi, C.; De Feo, V.; Zollo, F.; Pizza, C., Flavonoids of Combretum micranthum. Fitoterapia 1990, LXI, (5), 477. 11. Kumar, N. S., Rajapaksha, Maheshinie, Separation of catechin constituents from five tea cultivars using high-speed counter-current chromatography. Journal of Chromatography A 2005, 1083, 223-228. 12. Mendoza-Wilson, A. M.; Glossman-Mitnik, D., Theoretical study of the molecular properties and chemical reactivity of (+)-catechin and (-)-epicatechin related to
56
their antioxidant ability. Journal of Molecular Structure: THEOCHEM 2006, 761, 97-106. 13. Li, Y.-l.; Ke-ming, L.; Miao-xian, S.; Kan-tong, L.; Yu-wu, C.; Yong-wen, Z., Studies on antiviral constituents in stems and leaves of Pithecellibium clypearia. China Journal of Chinese materia medica 2006, 31, (5), 397-400. 14. Zhang, X.-Y.; Li, B.-G.; Zhou, M.; Yuan, X.-H.; Zhang, G.-L., Chemical constituents of Phacellaria compressa Benth. Journal of Integrative Plant Biology 2006, 48, (2), 236-240. 15. Kazuma, K.; Noda, N.; Suzuki, M., Malonylated flavonol glycosides from the petals of Clitoria ternatea. Phytochemistry (Elsevier) 2003, 62, 229-237. 16. Bezuidenhoudt, B. C. B.; Brandt, E. V.; Ferreira, D., Flavonoid analogues from Pterocarpus species. Phytochemistry (Elsevier) 1987, 26, 531-535. 17. Markham, K. R.; Mues, R.; Stoll, M.; Zinsmeister, H. D., NMR spectra of flavone di-C-glycosides from Apometzgeria pubescens and the detection of rotational isomerism in 8-C-hexosylflavones. Zeitschrift fur Naturforschung 1987, 42c, 1039-1042. 18. Rabe, C.; Steenkamp, J. A.; Joubert, E.; Burger, J. F. W.; Ferreira, D., Phenolic metabolites from rooibos tea (Aspalathus linearis). Phytochemistry (Elsevier) 1994, 35, 1559-1565. 19. Cabrera, C.; Gimenez, R.; Lopez, M. C., Determination of tea components with antioxidant activity. Journal of Agricultural and Food Chemistry 2003, 51, 4427-4435. 20. Cabrera, C.; Artacho, R.; Gimenez, R., Beneficial effects of green tea--A review. Journal of the American College of Nutrition 2006, 25, 89-99. 21. Henning, S. M.; Choo, J. J.; Heber, D., Nongallated compared with gallated flavan-3-ols in green and black tea are more bioavailable. The Journal of Nutrition 2008, 138, 1529s-1534s. 22. Scalbert, A.; Manach, C.; Morand, C.; Remesy, C., Dietary Polyphenols and the Prevention of Diseases. Critical Reviews in Food Science and Nutrition 2005, 45, (4), 287-306. 23. Scalbert, A.; Williamson, G., Dietary Intake and Bioavailability of Polyphenols. Journal of Nutrition 2000, 130, (8), 2073S-2085S. 24. Merken, H. M.; Beecher, G. R., Measurement of food flavonoids by high-performance liquid chromatography: a review. Journal of Agricultural and Food Chemistry 2000, 48, (3), 577-599.
57
25. Roemmelt, S.; Zimmermann, N.; Rademacher, W.; Treutter, D., Formation of novel flavonoids in apple (Malus x domestica) treated with the 2-oxoglutarate-dependent dioxygenase inhibitor prohexadione-Ca. Phytochemistry 2003, 64, 709-716. 26. Punyasiri, P. A. N.; Abeysinghe, I. S. B.; Kumar, V.; Treutter, D.; Duy, D.; Gosch, C.; Martens, S.; Forkmann, G.; Fischer, T. C., Flavonoid biosynthesis in the tea plant Camellia sinensis: properties of enzymes of the prominent epicatechin and catechin pathways. Archives Biochemistry and Biophysics 2004, 431, 22-30. 27. Bao, L.; Yao, X.-S.; Xu, J.; Guo, X.-Y.; Liu, H.; Kurihara, H., Effects of Pithecellobium clypearia Benth extract and its main components on inflammation and allergy. Fitoterapia 2009, 80, 349-353. 28. Sauvain, M.; Dedet, J.-P.; Kunesch, N.; Poisson, J., Isolations of flavans from the amazonian shrub Faramea guianensis. Journal of Natural Products 1994, 57, (3), 403-406. 29. Joubert, E.; Gelderblom, W. C.; De Beer, D., Phenolic contribution of South African herbal teas to a healthy diet. Natural Product Communications 2009, 4, (5), 701-718. 30. Latte, K. P.; Kolodziej, H., Antioxidant properties of phenolic compounds from Pelargonium reniforme. Journal of Agricultural and Food Chemistry 2004, 52, 4899-4902. 31. Montenegro, H.; Gonzalez, J.; Ortega-Barria, E.; Cubilla-Rios, L., Antiprotozoal activity of flavonoid glycosides isolated from Clidemia sericea and Mosquitoxylon jamaicense. Pharmaceutical Biology 2007, 45, (5), 376-380.
58
Chapter 3. Identification of the New Ring Structures, Piperidine-
Flavan Alkaloids
59
The modern phytochemical studies of C. micranthum have led to the determination of a
number of small, quaternary ammonium alkaloids such as betaine, choline, and
stachydrine (1, 2). In this study, however, the initial LC-MS analyses of the crude
kinkéliba extracts indicated other alkaloids as major constituents that were not previously
reported. These alkaloids were a series of compounds differing by a hydroxyl with the
molecular weights of m/z 341, 357, 373 and 389 and were ultimately identified as a new
skeleton of piperidine-flavan alkaloids (14 – 17 in Fig. 3-1). The nBuOH fraction of the
crude extract, LB, consisted mostly of these alkaloids and was subsequently separated to
identify these novel compounds. The entire fraction was initially separated by a silica gel
column with a MeOH and CHCl3 solvent system in gradient. LC-MS analysis of the
eluted fractions demonstrated the alkaloids to be concentrated in the middle 7 fractions
overlapping with each other as they are separated by polarity. The isolation of these
compounds is presented as a flow diagram in Fig. 3-2. The alkaloid-containing fractions
underwent successive chromatographic separation techniques including Sephadex LH-20,
prep-TLC, prep-HPLC, and analytical HPLC.
Ultimately, the kinkéloids, as they were named here first, were separated into groups of
alkaloids, of the same molecular weight, without distinguishing between the structural
isomers (A1, A2, B1, B2, etc. of Fig. 3-1) or stereo/optical isomers. Kinkéloid B (15), the
alkaloid found naturally in the highest concentration, required just prep-HPLC to obtain a
relatively clean sample for structure elucidation. Kinkéloids C and D (16 and 17) were
separated by successive Sephadex LH-20 and prep-HPLC methods. Finally, kinkéloid A
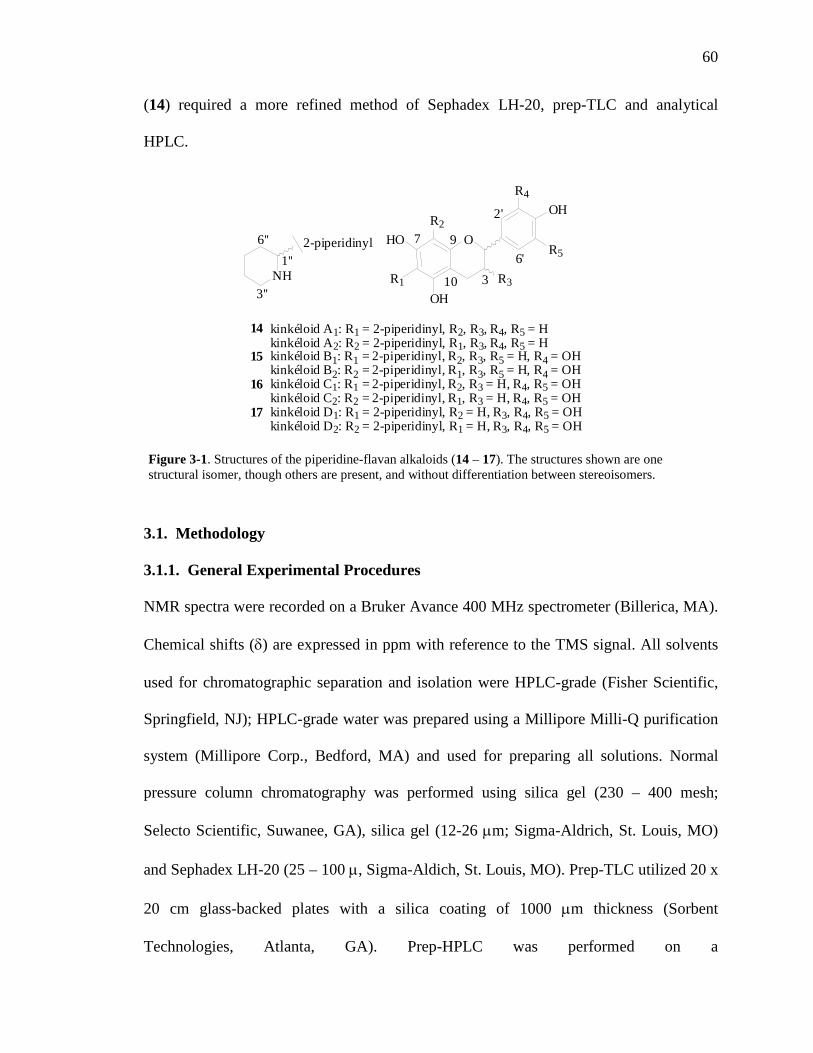
60
(14) required a more refined method of Sephadex LH-20, prep-TLC and analytical
HPLC.
3.1. Methodology
3.1.1. General Experimental Procedures
NMR spectra were recorded on a Bruker Avance 400 MHz spectrometer (Billerica, MA).
Chemical shifts (δ) are expressed in ppm with reference to the TMS signal. All solvents
used for chromatographic separation and isolation were HPLC-grade (Fisher Scientific,
Springfield, NJ); HPLC-grade water was prepared using a Millipore Milli-Q purification
system (Millipore Corp., Bedford, MA) and used for preparing all solutions. Normal
pressure column chromatography was performed using silica gel (230 – 400 mesh;
Selecto Scientific, Suwanee, GA), silica gel (12-26 µm; Sigma-Aldrich, St. Louis, MO)
and Sephadex LH-20 (25 – 100 µ, Sigma-Aldich, St. Louis, MO). Prep-TLC utilized 20 x
20 cm glass-backed plates with a silica coating of 1000 µm thickness (Sorbent
Technologies, Atlanta, GA). Prep-HPLC was performed on a
Figure 3-1. Structures of the piperidine-flavan alkaloids (14 – 17). The structures shown are one structural isomer, though others are present, and without differentiation between stereoisomers.
3 1 0
9 2 '
6 '
1 4 k i n k é l o i d A 1 : R 1 = 2 - p i p e r i d i n y l , R 2 , R 3 , R 4 , R 5 = H k i n k é l o i d A 2 : R 2 = 2 - p i p e r i d i n y l , R 1 , R 3 , R 4 , R 5 = H
1 5 k i n k é l o i d B 1 : R 1 = 2 - p i p e r i d i n y l , R 2 , R 3 , R 5 = H , R 4 = O H k i n k é l o i d B 2 : R 2 = 2 - p i p e r i d i n y l , R 1 , R 3 , R 5 = H , R 4 = O H
1 6 k i n k é l o i d C 1 : R 1 = 2 - p i p e r i d i n y l , R 2 , R 3 = H , R 4 , R 5 = O H k i n k é l o i d C 2 : R 2 = 2 - p i p e r i d i n y l , R 1 , R 3 = H , R 4 , R 5 = O H
1 7 k i n k é l o i d D 1 : R 1 = 2 - p i p e r i d i n y l , R 2 = H , R 3 , R 4 , R 5 = O H k i n k é l o i d D 2 : R 2 = 2 - p i p e r i d i n y l , R 1 = H , R 3 , R 4 , R 5 = O H
O H O
O H
R 5
O H N H R 3
R 4
6 ' '
3 ' '
7 1 ' '
2 - p i p e r i d i n y l
R 1
R 2
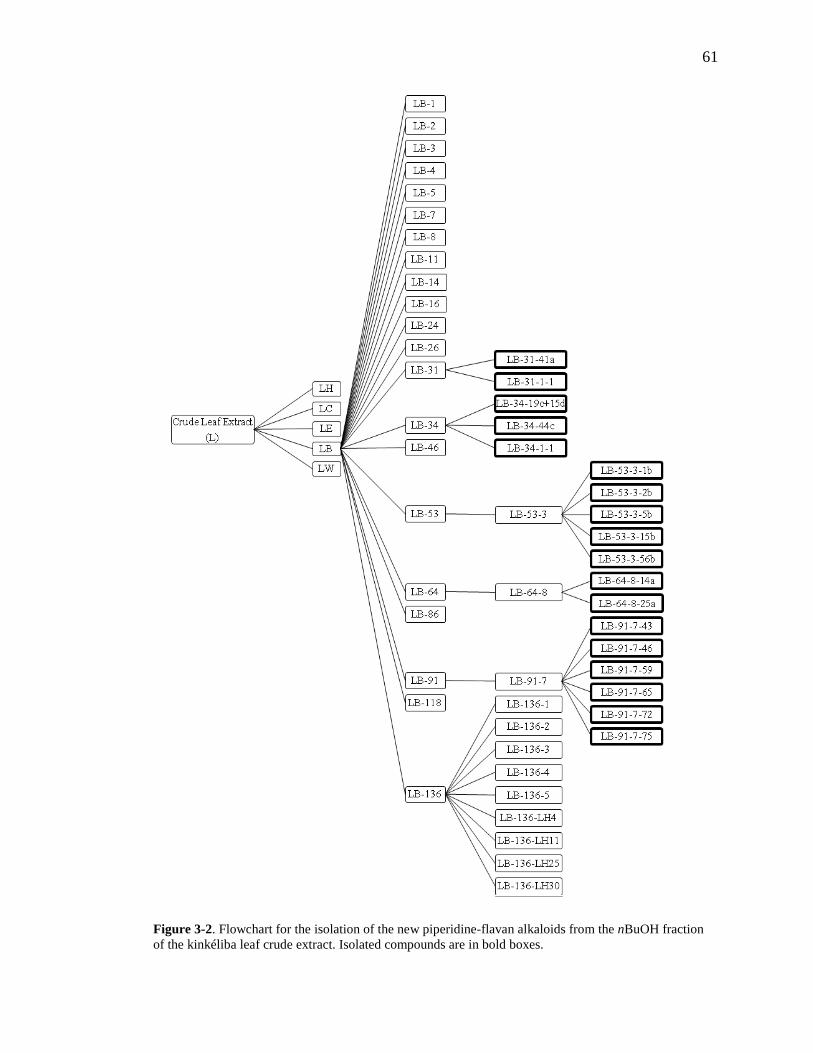
61
Figure 3-2. Flowchart for the isolation of the new piperidine-flavan alkaloids from the nBuOH fraction of the kinkéliba leaf crude extract. Isolated compounds are in bold boxes.
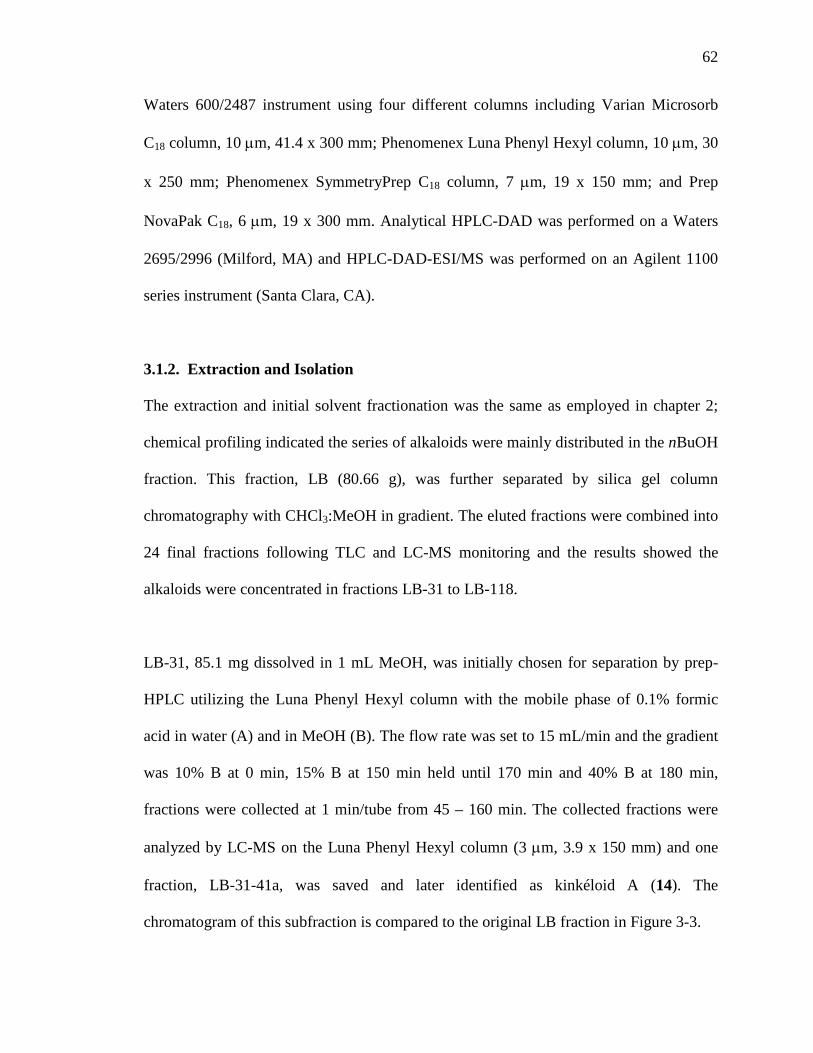
62
Waters 600/2487 instrument using four different columns including Varian Microsorb
C18 column, 10 µm, 41.4 x 300 mm; Phenomenex Luna Phenyl Hexyl column, 10 µm, 30
x 250 mm; Phenomenex SymmetryPrep C18 column, 7 µm, 19 x 150 mm; and Prep
NovaPak C18, 6 µm, 19 x 300 mm. Analytical HPLC-DAD was performed on a Waters
2695/2996 (Milford, MA) and HPLC-DAD-ESI/MS was performed on an Agilent 1100
series instrument (Santa Clara, CA).
3.1.2. Extraction and Isolation
The extraction and initial solvent fractionation was the same as employed in chapter 2;
chemical profiling indicated the series of alkaloids were mainly distributed in the nBuOH
fraction. This fraction, LB (80.66 g), was further separated by silica gel column
chromatography with CHCl3:MeOH in gradient. The eluted fractions were combined into
24 final fractions following TLC and LC-MS monitoring and the results showed the
alkaloids were concentrated in fractions LB-31 to LB-118.
LB-31, 85.1 mg dissolved in 1 mL MeOH, was initially chosen for separation by prep-
HPLC utilizing the Luna Phenyl Hexyl column with the mobile phase of 0.1% formic
acid in water (A) and in MeOH (B). The flow rate was set to 15 mL/min and the gradient
was 10% B at 0 min, 15% B at 150 min held until 170 min and 40% B at 180 min,
fractions were collected at 1 min/tube from 45 – 160 min. The collected fractions were
analyzed by LC-MS on the Luna Phenyl Hexyl column (3 µm, 3.9 x 150 mm) and one
fraction, LB-31-41a, was saved and later identified as kinkéloid A (14). The
chromatogram of this subfraction is compared to the original LB fraction in Figure 3-3.
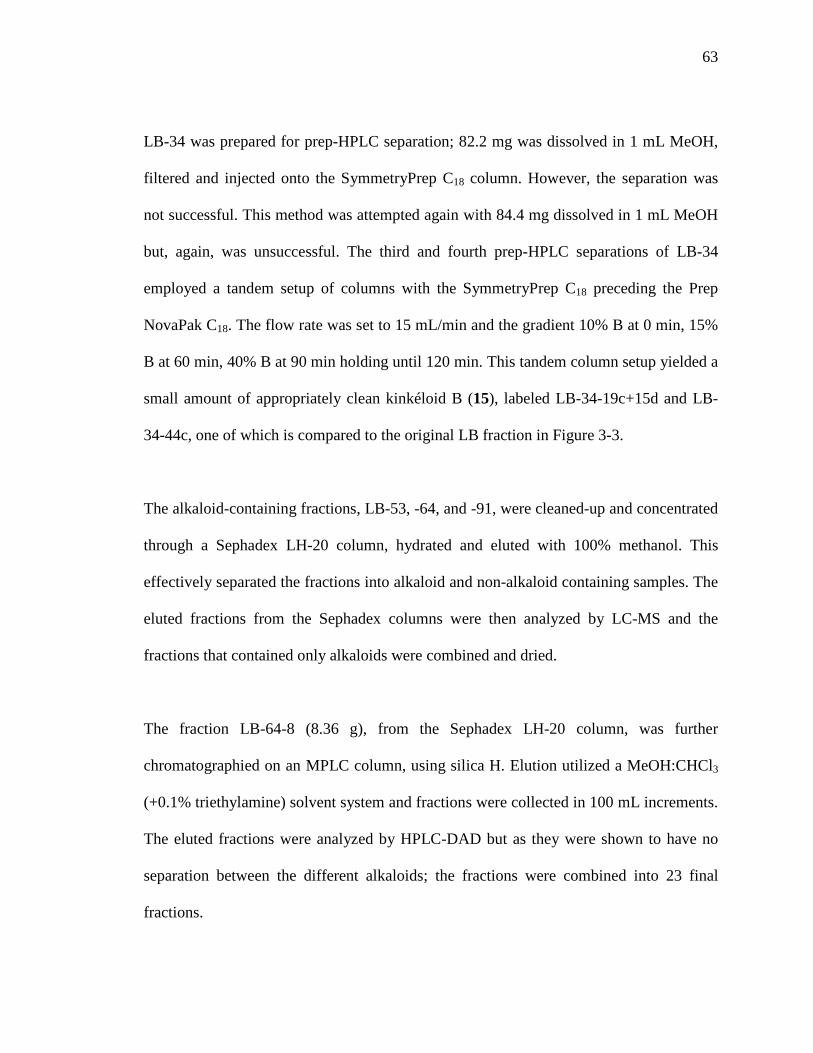
63
LB-34 was prepared for prep-HPLC separation; 82.2 mg was dissolved in 1 mL MeOH,
filtered and injected onto the SymmetryPrep C18 column. However, the separation was
not successful. This method was attempted again with 84.4 mg dissolved in 1 mL MeOH
but, again, was unsuccessful. The third and fourth prep-HPLC separations of LB-34
employed a tandem setup of columns with the SymmetryPrep C18 preceding the Prep
NovaPak C18. The flow rate was set to 15 mL/min and the gradient 10% B at 0 min, 15%
B at 60 min, 40% B at 90 min holding until 120 min. This tandem column setup yielded a
small amount of appropriately clean kinkéloid B (15), labeled LB-34-19c+15d and LB-
34-44c, one of which is compared to the original LB fraction in Figure 3-3.
The alkaloid-containing fractions, LB-53, -64, and -91, were cleaned-up and concentrated
through a Sephadex LH-20 column, hydrated and eluted with 100% methanol. This
effectively separated the fractions into alkaloid and non-alkaloid containing samples. The
eluted fractions from the Sephadex columns were then analyzed by LC-MS and the
fractions that contained only alkaloids were combined and dried.
The fraction LB-64-8 (8.36 g), from the Sephadex LH-20 column, was further
chromatographied on an MPLC column, using silica H. Elution utilized a MeOH:CHCl3
(+0.1% triethylamine) solvent system and fractions were collected in 100 mL increments.
The eluted fractions were analyzed by HPLC-DAD but as they were shown to have no
separation between the different alkaloids; the fractions were combined into 23 final
fractions.
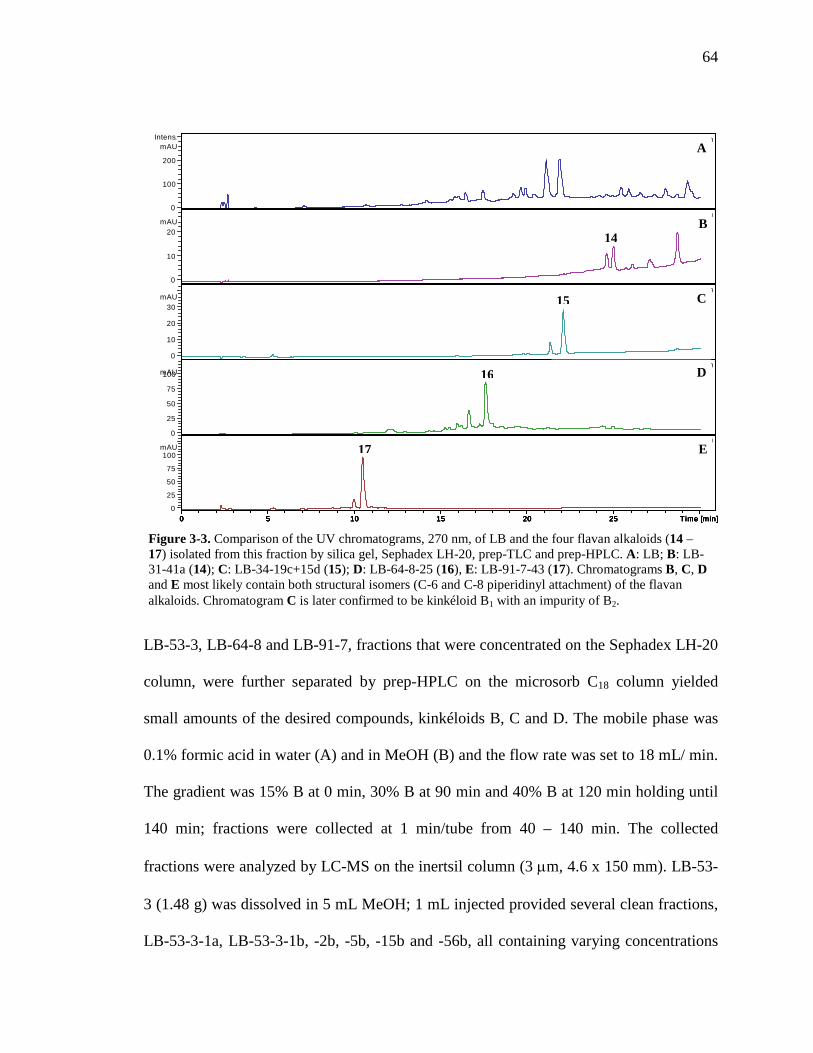
64
LB-53-3, LB-64-8 and LB-91-7, fractions that were concentrated on the Sephadex LH-20
column, were further separated by prep-HPLC on the microsorb C18 column yielded
small amounts of the desired compounds, kinkéloids B, C and D. The mobile phase was
0.1% formic acid in water (A) and in MeOH (B) and the flow rate was set to 18 mL/ min.
The gradient was 15% B at 0 min, 30% B at 90 min and 40% B at 120 min holding until
140 min; fractions were collected at 1 min/tube from 40 – 140 min. The collected
fractions were analyzed by LC-MS on the inertsil column (3 µm, 4.6 x 150 mm). LB-53-
3 (1.48 g) was dissolved in 5 mL MeOH; 1 mL injected provided several clean fractions,
LB-53-3-1a, LB-53-3-1b, -2b, -5b, -15b and -56b, all containing varying concentrations
09102003.D: UV Chromatogram, 271 nm
0
100
200
Intens.mAU
0 5 10 15 20 25 Time [min]
09102004.D: UV Chromatogram, 271 nm
0
10
20mAU
0 5 10 15 20 25 Time [min]
09102005.D: UV Chromatogram, 271 nm
0
10
20
30mAU
0 5 10 15 20 25 Time [min]
09102007.D: UV Chromatogram, 271 nm
0
25
50
75
100mAU
0 5 10 15 20 25 Time [min]
09102008.D: UV Chromatogram, 271 nm
0
25
50
75
100mAU
0 5 10 15 20 25 Time [min]
E
14
17
16 D
C
B
A
Figure 3-3. Comparison of the UV chromatograms, 270 nm, of LB and the four flavan alkaloids (14 – 17) isolated from this fraction by silica gel, Sephadex LH-20, prep-TLC and prep-HPLC. A: LB; B: LB-31-41a (14); C: LB-34-19c+15d (15); D: LB-64-8-25 (16), E: LB-91-7-43 (17). Chromatograms B, C, D and E most likely contain both structural isomers (C-6 and C-8 piperidinyl attachment) of the flavan alkaloids. Chromatogram C is later confirmed to be kinkéloid B1 with an impurity of B2.
15
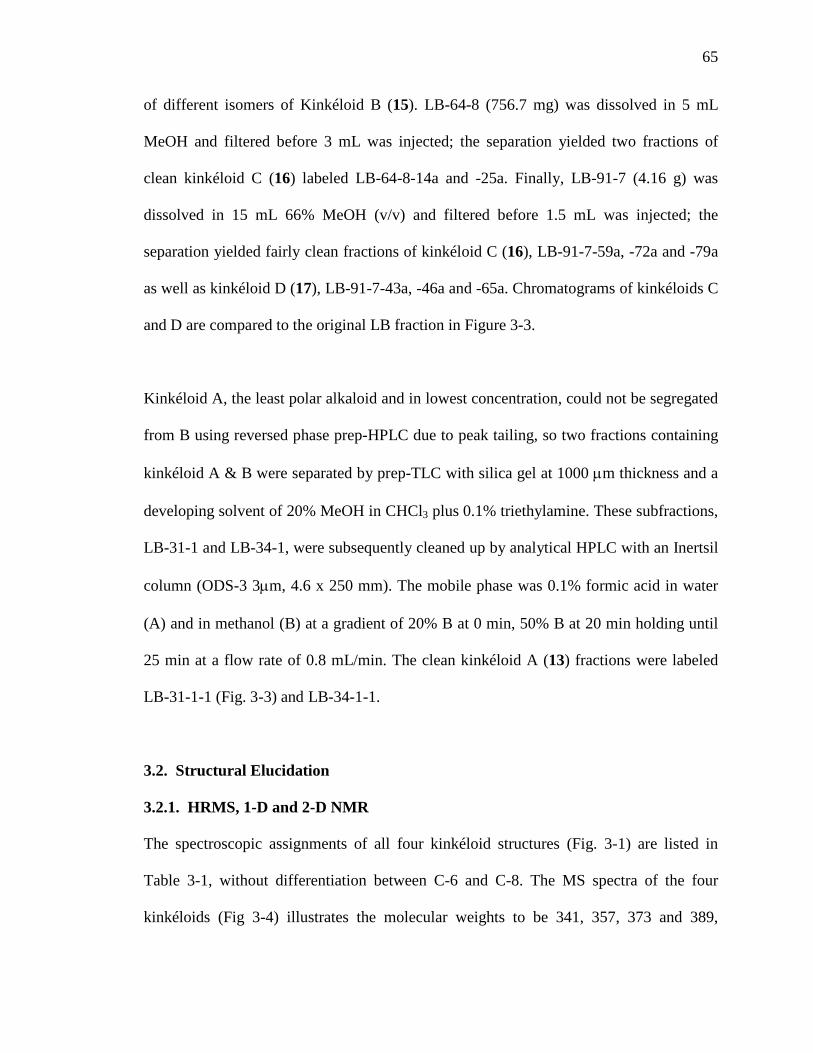
65
of different isomers of Kinkéloid B (15). LB-64-8 (756.7 mg) was dissolved in 5 mL
MeOH and filtered before 3 mL was injected; the separation yielded two fractions of
clean kinkéloid C (16) labeled LB-64-8-14a and -25a. Finally, LB-91-7 (4.16 g) was
dissolved in 15 mL 66% MeOH (v/v) and filtered before 1.5 mL was injected; the
separation yielded fairly clean fractions of kinkéloid C (16), LB-91-7-59a, -72a and -79a
as well as kinkéloid D (17), LB-91-7-43a, -46a and -65a. Chromatograms of kinkéloids C
and D are compared to the original LB fraction in Figure 3-3.
Kinkéloid A, the least polar alkaloid and in lowest concentration, could not be segregated
from B using reversed phase prep-HPLC due to peak tailing, so two fractions containing
kinkéloid A & B were separated by prep-TLC with silica gel at 1000 µm thickness and a
developing solvent of 20% MeOH in CHCl3 plus 0.1% triethylamine. These subfractions,
LB-31-1 and LB-34-1, were subsequently cleaned up by analytical HPLC with an Inertsil
column (ODS-3 3µm, 4.6 x 250 mm). The mobile phase was 0.1% formic acid in water
(A) and in methanol (B) at a gradient of 20% B at 0 min, 50% B at 20 min holding until
25 min at a flow rate of 0.8 mL/min. The clean kinkéloid A (13) fractions were labeled
LB-31-1-1 (Fig. 3-3) and LB-34-1-1.
3.2. Structural Elucidation
3.2.1. HRMS, 1-D and 2-D NMR
The spectroscopic assignments of all four kinkéloid structures (Fig. 3-1) are listed in
Table 3-1, without differentiation between C-6 and C-8. The MS spectra of the four
kinkéloids (Fig 3-4) illustrates the molecular weights to be 341, 357, 373 and 389,
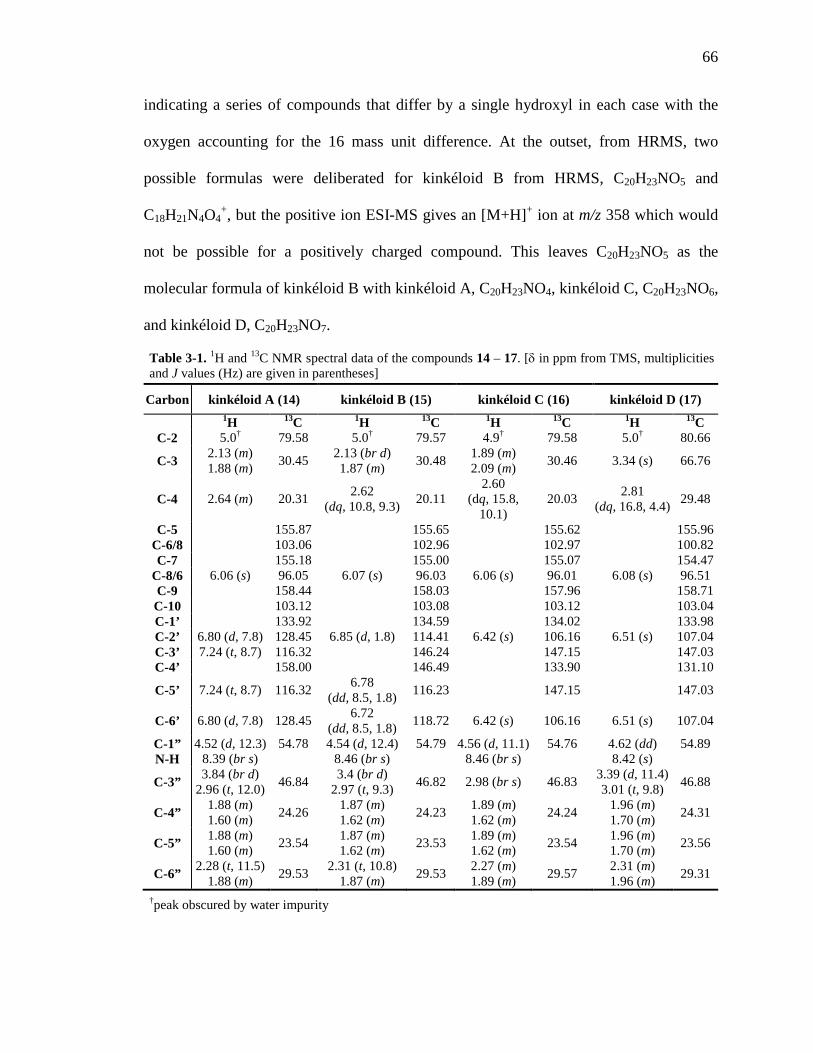
66
indicating a series of compounds that differ by a single hydroxyl in each case with the
oxygen accounting for the 16 mass unit difference. At the outset, from HRMS, two
possible formulas were deliberated for kinkéloid B from HRMS, C20H23NO5 and
C18H21N4O4+, but the positive ion ESI-MS gives an [M+H]+ ion at m/z 358 which would
not be possible for a positively charged compound. This leaves C20H23NO5 as the
molecular formula of kinkéloid B with kinkéloid A, C20H23NO4, kinkéloid C, C20H23NO6,
and kinkéloid D, C20H23NO7.
Carbon kinkéloid A (14) kinkéloid B (15) kinkéloid C (16) kinkéloid D (17)
1H 13C 1H 13C 1H 13C 1H 13C C-2 5.0† 79.58 5.0† 79.57 4.9† 79.58 5.0† 80.66
C-3 2.13 (m) 1.88 (m) 30.45 2.13 (br d)
1.87 (m) 30.48 1.89 (m) 2.09 (m) 30.46 3.34 (s) 66.76
C-4 2.64 (m) 20.31 2.62 (dq, 10.8, 9.3) 20.11
2.60 (dq, 15.8,
10.1) 20.03 2.81
(dq, 16.8, 4.4) 29.48
C-5 155.87 155.65 155.62 155.96 C-6/8 103.06 102.96 102.97 100.82 C-7 155.18 155.00 155.07 154.47
C-8/6 6.06 (s) 96.05 6.07 (s) 96.03 6.06 (s) 96.01 6.08 (s) 96.51 C-9 158.44 158.03 157.96 158.71 C-10 103.12 103.08 103.12 103.04 C-1’ 133.92 134.59 134.02 133.98 C-2’ 6.80 (d, 7.8) 128.45 6.85 (d, 1.8) 114.41 6.42 (s) 106.16 6.51 (s) 107.04 C-3’ 7.24 (t, 8.7) 116.32 146.24 147.15 147.03 C-4’ 158.00 146.49 133.90 131.10
C-5’ 7.24 (t, 8.7) 116.32 6.78 (dd, 8.5, 1.8) 116.23 147.15 147.03
C-6’ 6.80 (d, 7.8) 128.45 6.72 (dd, 8.5, 1.8) 118.72 6.42 (s) 106.16 6.51 (s) 107.04
C-1” 4.52 (d, 12.3) 54.78 4.54 (d, 12.4) 54.79 4.56 (d, 11.1) 54.76 4.62 (dd) 54.89 N-H 8.39 (br s) 8.46 (br s) 8.46 (br s) 8.42 (s)
C-3” 3.84 (br d) 2.96 (t, 12.0) 46.84 3.4 (br d)
2.97 (t, 9.3) 46.82 2.98 (br s) 46.83 3.39 (d, 11.4) 3.01 (t, 9.8) 46.88
C-4” 1.88 (m) 1.60 (m) 24.26 1.87 (m)
1.62 (m) 24.23 1.89 (m) 1.62 (m) 24.24 1.96 (m)
1.70 (m) 24.31
C-5” 1.88 (m) 1.60 (m) 23.54 1.87 (m)
1.62 (m) 23.53 1.89 (m) 1.62 (m) 23.54 1.96 (m)
1.70 (m) 23.56
C-6” 2.28 (t, 11.5) 1.88 (m) 29.53 2.31 (t, 10.8)
1.87 (m) 29.53 2.27 (m) 1.89 (m) 29.57 2.31 (m)
1.96 (m) 29.31
†peak obscured by water impurity
Table 3-1. 1H and 13C NMR spectral data of the compounds 14 – 17. [δ in ppm from TMS, multiplicities and J values (Hz) are given in parentheses]
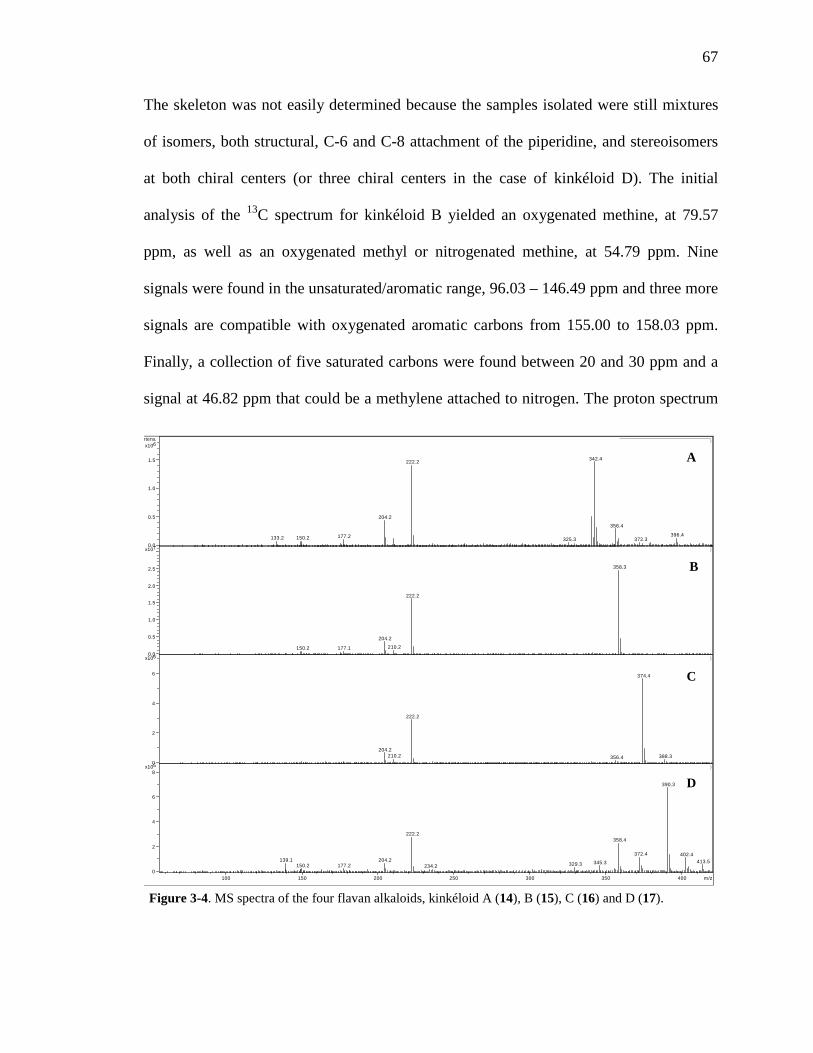
67
The skeleton was not easily determined because the samples isolated were still mixtures
of isomers, both structural, C-6 and C-8 attachment of the piperidine, and stereoisomers
at both chiral centers (or three chiral centers in the case of kinkéloid D). The initial
analysis of the 13C spectrum for kinkéloid B yielded an oxygenated methine, at 79.57
ppm, as well as an oxygenated methyl or nitrogenated methine, at 54.79 ppm. Nine
signals were found in the unsaturated/aromatic range, 96.03 – 146.49 ppm and three more
signals are compatible with oxygenated aromatic carbons from 155.00 to 158.03 ppm.
Finally, a collection of five saturated carbons were found between 20 and 30 ppm and a
signal at 46.82 ppm that could be a methylene attached to nitrogen. The proton spectrum
133.2 150.2 177.2
204.2
222.2
325.3
342.4
356.4
372.3396.4
+MS, 21.6-21.7min (#1167-#1177)
150.2 177.1
204.2
210.2
222.2
358.3
+MS, 18.4-18.5min (#987-#994)
204.2210.2
222.2
356.4
374.4
388.3
+MS, 13.9-14.0min (#734-#741)
139.1150.2 177.2
204.2
222.2
234.2 329.3 345.3
358.4
372.4
390.3
402.4413.5
+MS, 7.4-7.6min (#376-#387)
0.0
0.5
1.0
1.5
6x10ntens.
0.0
0.5
1.0
1.5
2.0
2.5
7x10
0
2
4
6
6x10
0
2
4
6
85x10
100 150 200 250 300 350 400 m/z
Figure 3-4. MS spectra of the four flavan alkaloids, kinkéloid A (14), B (15), C (16) and D (17).
A
B
C
D
68
showed a collection of messy signals, integrating to 12 H, in the range of 1.5 – 4.0 ppm, a
doublet at 4.54 ppm, 1H, a singlet at 6.07 ppm, 1H, a pair of doublets of doublets at 6.75
ppm, 2H, and a doublet at 6.85 ppm, 1 H.
The assistance of 2-D spectra, HSQC, COSY and HMBC, was required to connect the
flavan skeleton and piperidine substituent in a manner reasonable to fit the data.
According to the HSQC spectrum, the three protons (dd at 6.72 and 6.78 ppm and d at
6.85 ppm) correlated to the three aromatic carbons from 114 to 118 ppm. This, with the
splitting pattern in the proton spectrum, indicated a 3,4-dihydroxy phenyl substituent. In
keeping with the molecular formula C20H23NO5, a dihydroxy phenyl ring leaves three
oxygens not yet accounted for as well as six more aromatic carbons and the structure is
now comparable to 3’,4’,5,7-tetrahydroxyflavan (4 in Fig. 2-1), which was already
isolated and identified from kinkéliba. The 1H and 13C spectra of kinkéloid B was
compared to compound 4 in Table 3-2, specifically C-2 – C-10 & C1’ – C6’, which
correspond to rings A, B and C of the flavan structure. The carbon signals of these rings
match up and confirm the flavan structure of the kinkéloids. Due to the different chemical
environment between C-6 and C-8 of the flavan and alkaloid NMR signals seen in Table
3-2, a flavan structure with a nitrogen-containing substituent attached to ring A was
explored. The COSY spectrum shows the saturated carbons between 20 and 30 ppm all
seem to coordinate with each other but a closer look, combined with HSQC assignments,
separates the three saturated carbons of the flavan from the five saturated carbons of the
piperidine. The protons at 1.87 and 2.13 ppm (C-3) correlate to the protons at 2.62 ppm
(C-4) as well as the proton at 5.0 ppm (C-2). Conversely, the protons of C-6”, 1.87 and
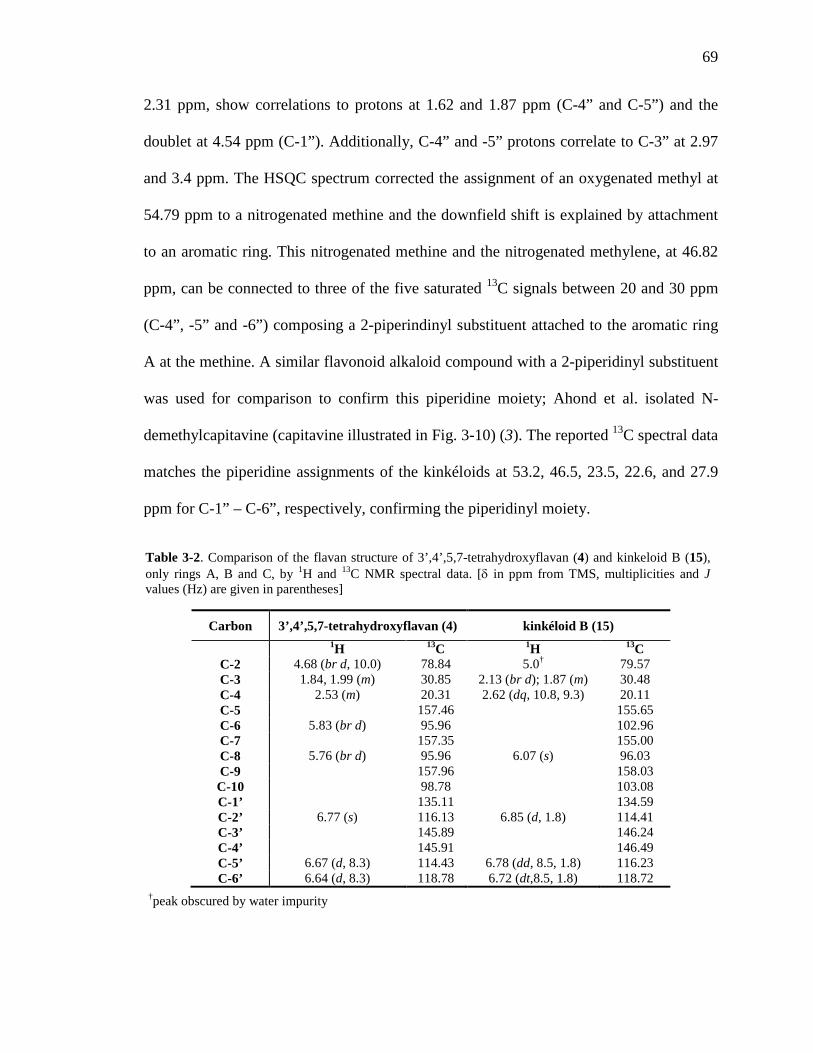
69
2.31 ppm, show correlations to protons at 1.62 and 1.87 ppm (C-4” and C-5”) and the
doublet at 4.54 ppm (C-1”). Additionally, C-4” and -5” protons correlate to C-3” at 2.97
and 3.4 ppm. The HSQC spectrum corrected the assignment of an oxygenated methyl at
54.79 ppm to a nitrogenated methine and the downfield shift is explained by attachment
to an aromatic ring. This nitrogenated methine and the nitrogenated methylene, at 46.82
ppm, can be connected to three of the five saturated 13C signals between 20 and 30 ppm
(C-4”, -5” and -6”) composing a 2-piperindinyl substituent attached to the aromatic ring
A at the methine. A similar flavonoid alkaloid compound with a 2-piperidinyl substituent
was used for comparison to confirm this piperidine moiety; Ahond et al. isolated N-
demethylcapitavine (capitavine illustrated in Fig. 3-10) (3). The reported 13C spectral data
matches the piperidine assignments of the kinkéloids at 53.2, 46.5, 23.5, 22.6, and 27.9
ppm for C-1” – C-6”, respectively, confirming the piperidinyl moiety.
Carbon 3’,4’,5,7-tetrahydroxyflavan (4) kinkéloid B (15)
1H 13C 1H 13C C-2 4.68 (br d, 10.0) 78.84 5.0† 79.57 C-3 1.84, 1.99 (m) 30.85 2.13 (br d); 1.87 (m) 30.48 C-4 2.53 (m) 20.31 2.62 (dq, 10.8, 9.3) 20.11 C-5 157.46 155.65 C-6 5.83 (br d) 95.96 102.96 C-7 157.35 155.00 C-8 5.76 (br d) 95.96 6.07 (s) 96.03 C-9 157.96 158.03 C-10 98.78 103.08 C-1’ 135.11 134.59 C-2’ 6.77 (s) 116.13 6.85 (d, 1.8) 114.41 C-3’ 145.89 146.24 C-4’ 145.91 146.49 C-5’ 6.67 (d, 8.3) 114.43 6.78 (dd, 8.5, 1.8) 116.23 C-6’ 6.64 (d, 8.3) 118.78 6.72 (dt,8.5, 1.8) 118.72
Table 3-2. Comparison of the flavan structure of 3’,4’,5,7-tetrahydroxyflavan (4) and kinkeloid B (15), only rings A, B and C, by 1H and 13C NMR spectral data. [δ in ppm from TMS, multiplicities and J values (Hz) are given in parentheses]
†peak obscured by water impurity
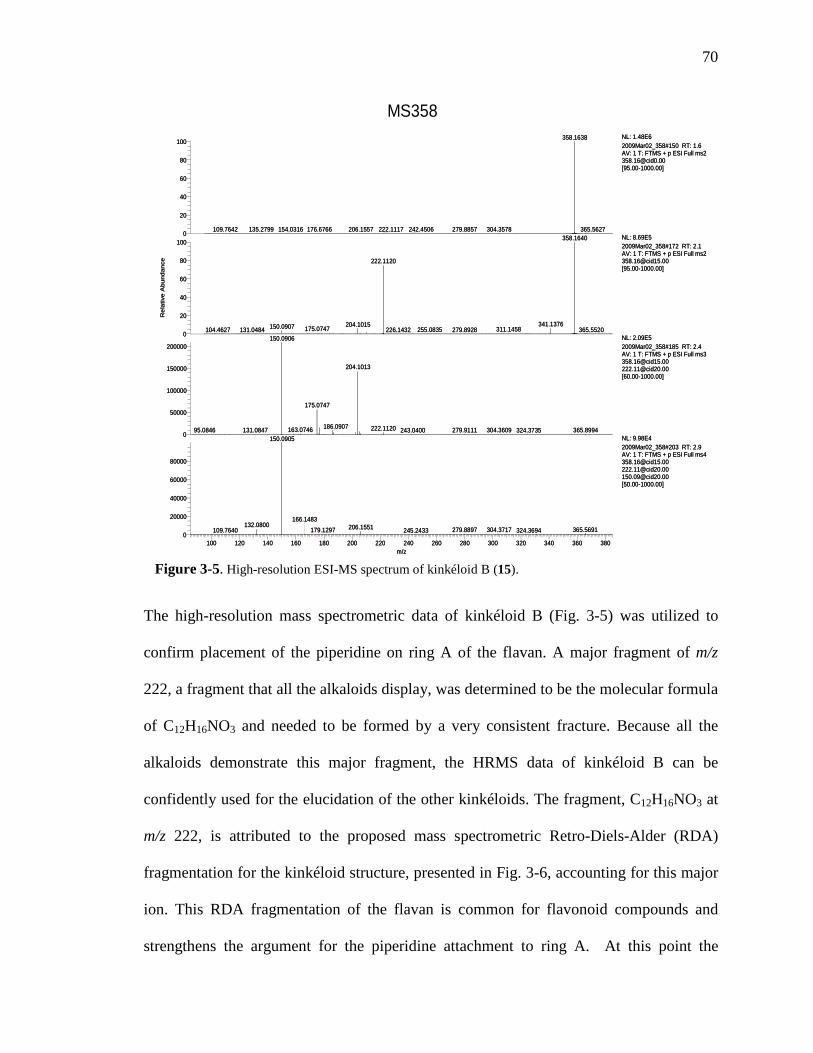
70
The high-resolution mass spectrometric data of kinkéloid B (Fig. 3-5) was utilized to
confirm placement of the piperidine on ring A of the flavan. A major fragment of m/z
222, a fragment that all the alkaloids display, was determined to be the molecular formula
of C12H16NO3 and needed to be formed by a very consistent fracture. Because all the
alkaloids demonstrate this major fragment, the HRMS data of kinkéloid B can be
confidently used for the elucidation of the other kinkéloids. The fragment, C12H16NO3 at
m/z 222, is attributed to the proposed mass spectrometric Retro-Diels-Alder (RDA)
fragmentation for the kinkéloid structure, presented in Fig. 3-6, accounting for this major
ion. This RDA fragmentation of the flavan is common for flavonoid compounds and
strengthens the argument for the piperidine attachment to ring A. At this point the
100 120 140 160 180 200 220 240 260 280 300 320 340 360 380m/z
0
20000
40000
60000
80000
0
50000
100000
150000
200000
0
20
40
60
80
100
Rel
ativ
e A
bund
ance
0
20
40
60
80
100 358.1638
206.1557 365.5627304.3578222.1117 279.8857109.7642 176.6766135.2799 242.4506154.0316358.1640
222.1120
341.1376204.1015150.0907 175.0747 311.1458255.0835 365.5520226.1432131.0484 279.8928104.4627150.0906
204.1013
175.0747
186.0907 222.1120163.0746 304.3609 365.8994131.084795.0846 279.9111 324.3735243.0400150.0905
132.0800 206.1551 365.5691304.3717279.8897179.1297109.7640 324.3694245.2433
166.1483
NL: 1.48E62009Mar02_358#150 RT: 1.6 AV: 1 T: FTMS + p ESI Full ms2 [email protected] [95.00-1000.00]
NL: 8.69E52009Mar02_358#172 RT: 2.1 AV: 1 T: FTMS + p ESI Full ms2 [email protected] [95.00-1000.00]
NL: 2.09E52009Mar02_358#185 RT: 2.4 AV: 1 T: FTMS + p ESI Full ms3 [email protected] [email protected] [60.00-1000.00]
NL: 9.98E42009Mar02_358#203 RT: 2.9 AV: 1 T: FTMS + p ESI Full ms4 [email protected] [email protected] [email protected] [50.00-1000.00]
MS358
Figure 3-5. High-resolution ESI-MS spectrum of kinkéloid B (15).
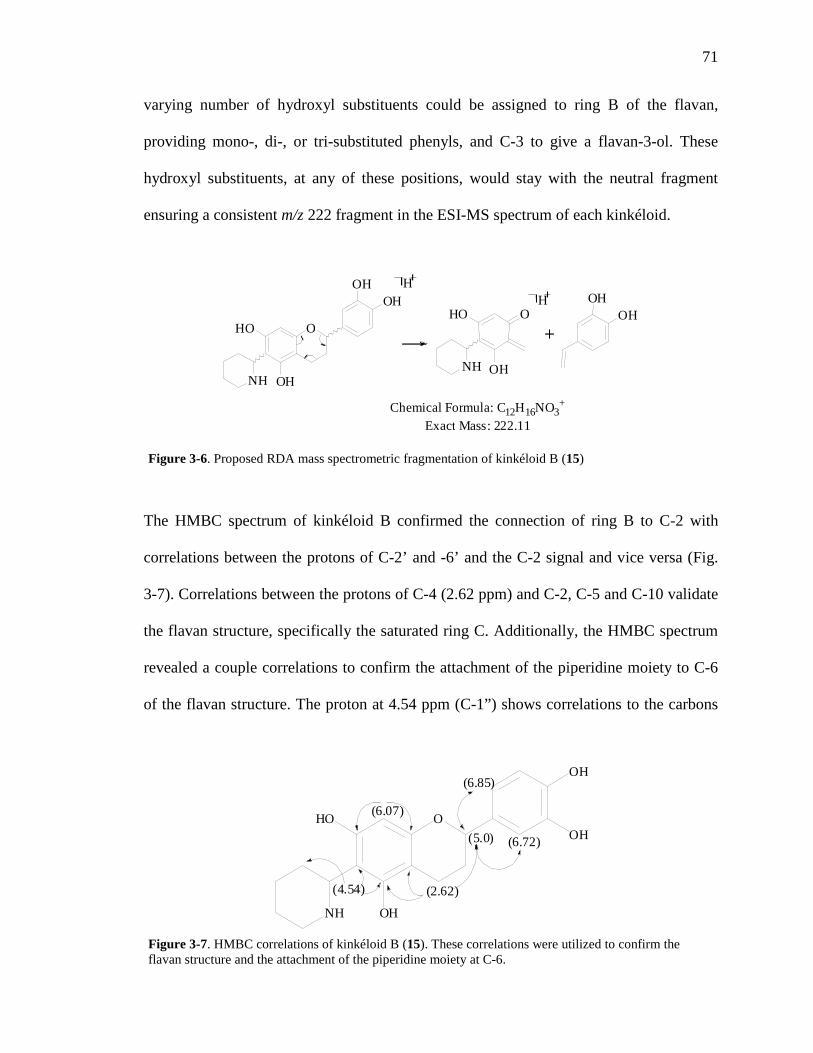
71
varying number of hydroxyl substituents could be assigned to ring B of the flavan,
providing mono-, di-, or tri-substituted phenyls, and C-3 to give a flavan-3-ol. These
hydroxyl substituents, at any of these positions, would stay with the neutral fragment
ensuring a consistent m/z 222 fragment in the ESI-MS spectrum of each kinkéloid.
The HMBC spectrum of kinkéloid B confirmed the connection of ring B to C-2 with
correlations between the protons of C-2’ and -6’ and the C-2 signal and vice versa (Fig.
3-7). Correlations between the protons of C-4 (2.62 ppm) and C-2, C-5 and C-10 validate
the flavan structure, specifically the saturated ring C. Additionally, the HMBC spectrum
revealed a couple correlations to confirm the attachment of the piperidine moiety to C-6
of the flavan structure. The proton at 4.54 ppm (C-1”) shows correlations to the carbons
Figure 3-6. Proposed RDA mass spectrometric fragmentation of kinkéloid B (15)
O H O H O
O H
O H N H
O H O H
H
O H O
N H
C h e m i c a l F o r m u l a : C 1 2 H 1 6 N O 3 + E x a c t M a s s : 2 2 2 . 1 1
O H
H
Figure 3-7. HMBC correlations of kinkéloid B (15). These correlations were utilized to confirm the flavan structure and the attachment of the piperidine moiety at C-6.
O
N H
O H
O H
O H
H O
( 6 . 8 5 )
( 6 . 7 2 )
( 6 . 0 7 )
( 5 . 0 )
( 4 . 5 4 ) ( 2 . 6 2 )
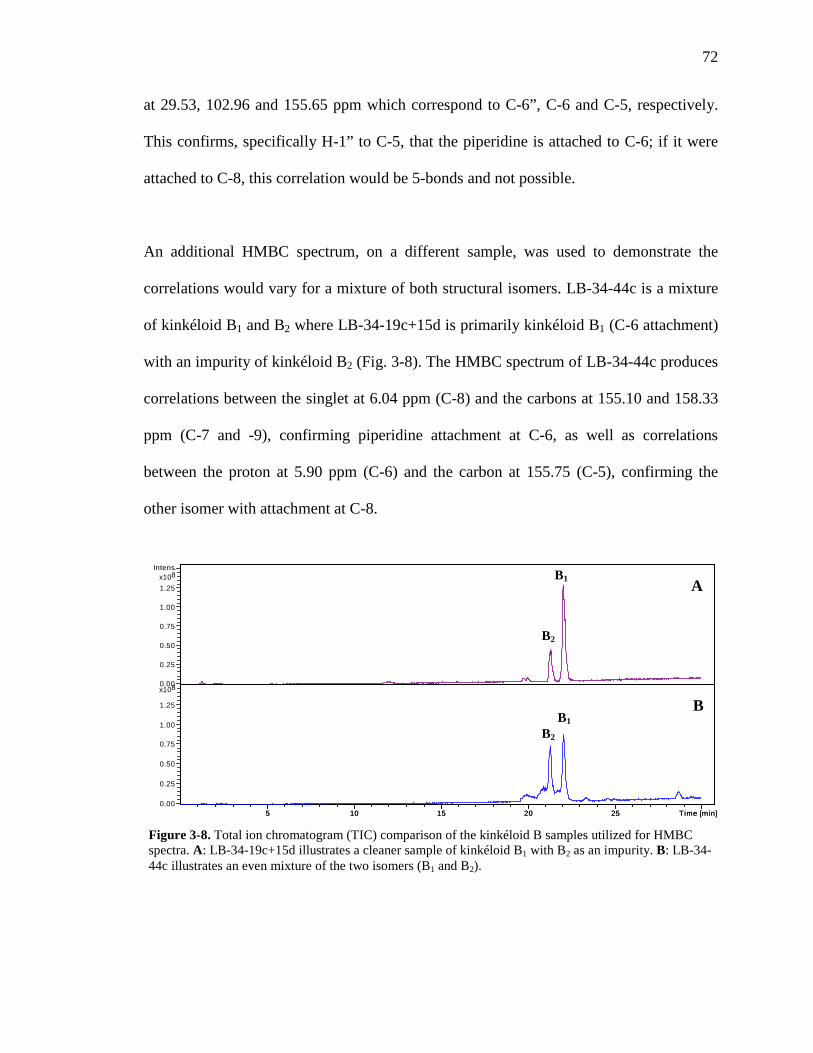
72
at 29.53, 102.96 and 155.65 ppm which correspond to C-6”, C-6 and C-5, respectively.
This confirms, specifically H-1” to C-5, that the piperidine is attached to C-6; if it were
attached to C-8, this correlation would be 5-bonds and not possible.
An additional HMBC spectrum, on a different sample, was used to demonstrate the
correlations would vary for a mixture of both structural isomers. LB-34-44c is a mixture
of kinkéloid B1 and B2 where LB-34-19c+15d is primarily kinkéloid B1 (C-6 attachment)
with an impurity of kinkéloid B2 (Fig. 3-8). The HMBC spectrum of LB-34-44c produces
correlations between the singlet at 6.04 ppm (C-8) and the carbons at 155.10 and 158.33
ppm (C-7 and -9), confirming piperidine attachment at C-6, as well as correlations
between the proton at 5.90 ppm (C-6) and the carbon at 155.75 (C-5), confirming the
other isomer with attachment at C-8.
09102005.D: TIC ±All
0.00
0.25
0.50
0.75
1.00
1.25
8x10Intens.
5 10 15 20 25 Time [min]
09102006.D: TIC ±All
0.00
0.25
0.50
0.75
1.00
1.25
8x10
5 10 15 20 25 Time [min]
Figure 3-8. Total ion chromatogram (TIC) comparison of the kinkéloid B samples utilized for HMBC spectra. A: LB-34-19c+15d illustrates a cleaner sample of kinkéloid B1 with B2 as an impurity. B: LB-34-44c illustrates an even mixture of the two isomers (B1 and B2).
A
B
B1
B2
B1 B2
73
At this point, the skeleton of these alkaloid compounds is confirmed as a flavan
compounds with a 2-piperidine moiety attached at C-6 and C-8. Kinkéloid B is
established as a 3’,4’,5’7-tetrahydroxyflavan with a 2-piperidinyl substituent at C-6.
Kinkeloid C, C20H23NO6, is the 3’,4’,5’,5,7-pentahydroxyflavan structure; the aromatic
region of ring B was simplified compared to kinkéloid B because of the identical
environment for the ring B carbons and protons. The three oxygenated aromatic carbons
at 147.15 (C-3- and -5’) and 133.90 ppm (C-4’) and the upfield aromatic carbons at
106.16 (C-2’ and -6’) confirm a trihydroxy phenyl ring B.
Kinkéloid A, C20H23NO4, is the 4’,5,7-trihydroxyflavan kinkéloid; the 1H and 13C spectral
shifts and observed splitting confirms this structure. The carbon signals for ring B show
overlapping signals at 128.45 ppm for C-2’ and -6’ and 116.32 ppm for C-3’ and -5’ and
the oxygenated aromatic carbon is at 158.00 ppm. The corresponding proton signals are a
doublet for C-2’ and -6’ with an expected J-value of 7.8 Hz for ortho splitting and a
triplet of 8.7 Hz for C-3’ and-5’ which can be attributed to the ortho and meta splitting.
Finally, kinkéloid D is the 3’,4’,5’,5,7-pentahydroxyflavan-3-ol kinkéloid. This was
confirmed by the 13C spectrum displaying one less aliphatic carbon at ~20 ppm which
was replaced with a carbon at ~66 ppm in the oxygenated carbon region; additionally, the
aliphatic region of the 1H spectrum was somewhat simplified, due to the oxygenation of
C-3 and subsequent reduced splitting. A singlet at 3.34 ppm corresponded to the
oxygenated proton at C-3, this then adjusts the proton and carbon signals for C-4.
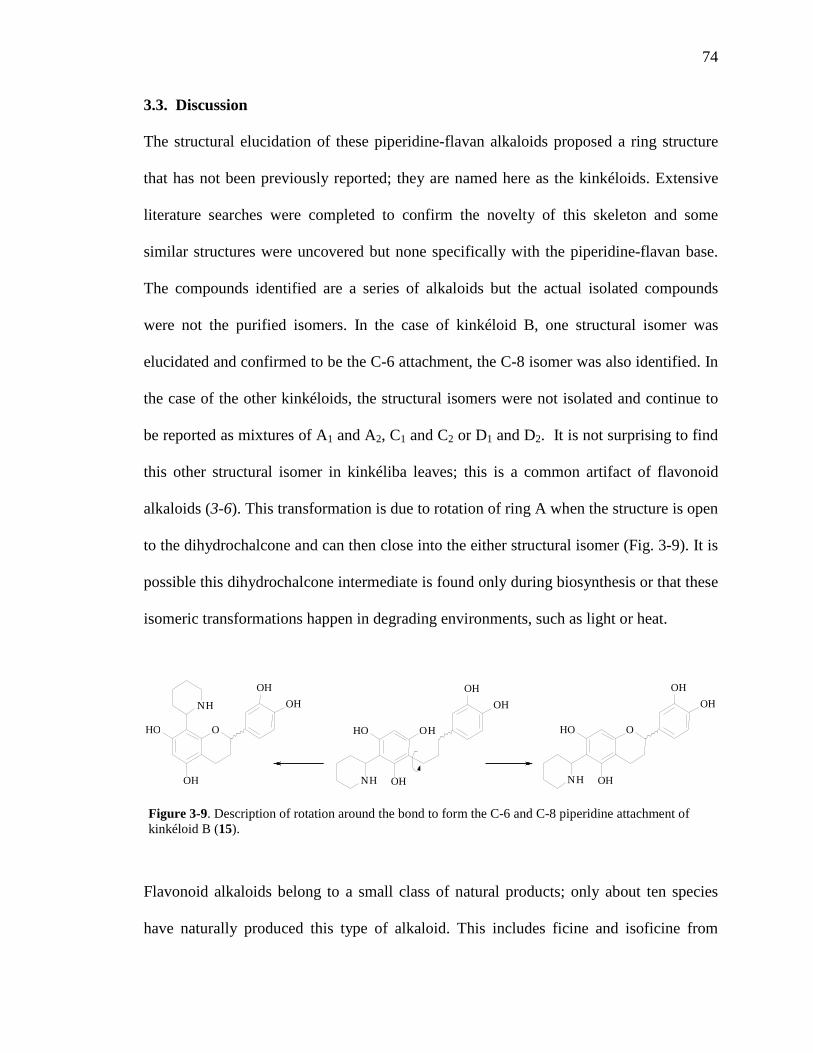
74
3.3. Discussion
The structural elucidation of these piperidine-flavan alkaloids proposed a ring structure
that has not been previously reported; they are named here as the kinkéloids. Extensive
literature searches were completed to confirm the novelty of this skeleton and some
similar structures were uncovered but none specifically with the piperidine-flavan base.
The compounds identified are a series of alkaloids but the actual isolated compounds
were not the purified isomers. In the case of kinkéloid B, one structural isomer was
elucidated and confirmed to be the C-6 attachment, the C-8 isomer was also identified. In
the case of the other kinkéloids, the structural isomers were not isolated and continue to
be reported as mixtures of A1 and A2, C1 and C2 or D1 and D2. It is not surprising to find
this other structural isomer in kinkéliba leaves; this is a common artifact of flavonoid
alkaloids (3-6). This transformation is due to rotation of ring A when the structure is open
to the dihydrochalcone and can then close into the either structural isomer (Fig. 3-9). It is
possible this dihydrochalcone intermediate is found only during biosynthesis or that these
isomeric transformations happen in degrading environments, such as light or heat.
Flavonoid alkaloids belong to a small class of natural products; only about ten species
have naturally produced this type of alkaloid. This includes ficine and isoficine from
Figure 3-9. Description of rotation around the bond to form the C-6 and C-8 piperidine attachment of kinkéloid B (15).
H O O H
O H N H
O H H O O H
O H N H
O H O O H
O H
O N H
O H O H O H
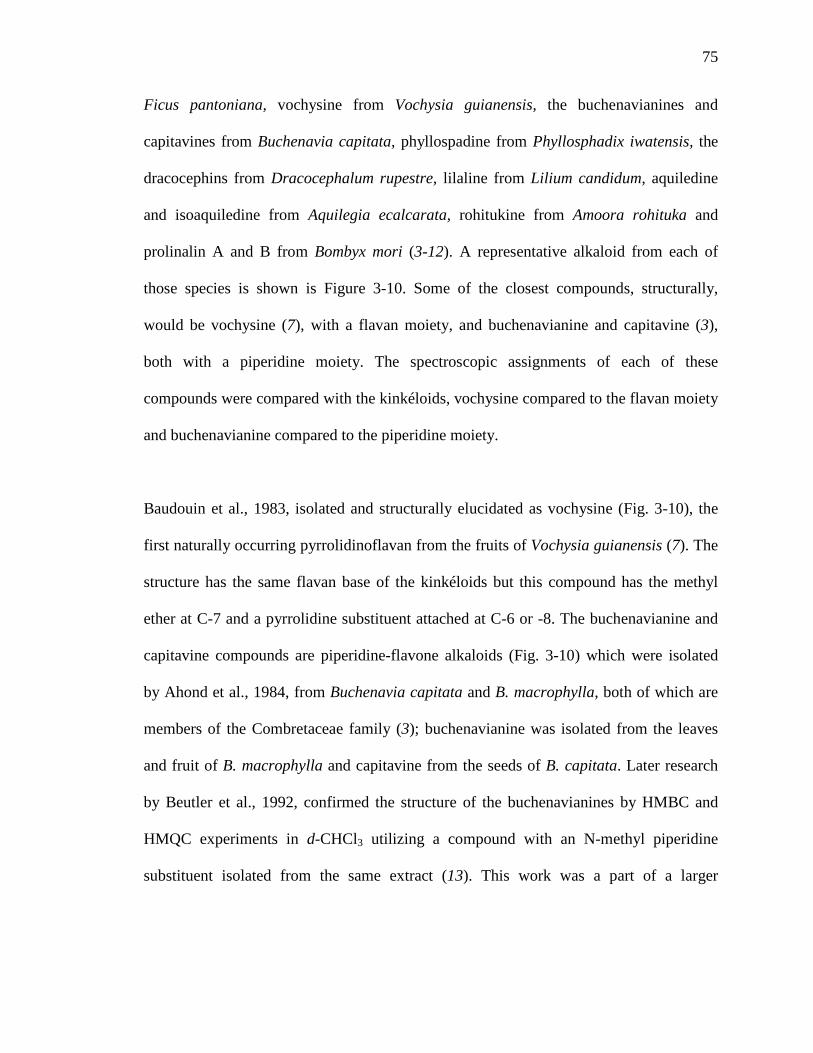
75
Ficus pantoniana, vochysine from Vochysia guianensis, the buchenavianines and
capitavines from Buchenavia capitata, phyllospadine from Phyllosphadix iwatensis, the
dracocephins from Dracocephalum rupestre, lilaline from Lilium candidum, aquiledine
and isoaquiledine from Aquilegia ecalcarata, rohitukine from Amoora rohituka and
prolinalin A and B from Bombyx mori (3-12). A representative alkaloid from each of
those species is shown is Figure 3-10. Some of the closest compounds, structurally,
would be vochysine (7), with a flavan moiety, and buchenavianine and capitavine (3),
both with a piperidine moiety. The spectroscopic assignments of each of these
compounds were compared with the kinkéloids, vochysine compared to the flavan moiety
and buchenavianine compared to the piperidine moiety.
Baudouin et al., 1983, isolated and structurally elucidated as vochysine (Fig. 3-10), the
first naturally occurring pyrrolidinoflavan from the fruits of Vochysia guianensis (7). The
structure has the same flavan base of the kinkéloids but this compound has the methyl
ether at C-7 and a pyrrolidine substituent attached at C-6 or -8. The buchenavianine and
capitavine compounds are piperidine-flavone alkaloids (Fig. 3-10) which were isolated
by Ahond et al., 1984, from Buchenavia capitata and B. macrophylla, both of which are
members of the Combretaceae family (3); buchenavianine was isolated from the leaves
and fruit of B. macrophylla and capitavine from the seeds of B. capitata. Later research
by Beutler et al., 1992, confirmed the structure of the buchenavianines by HMBC and
HMQC experiments in d-CHCl3 utilizing a compound with an N-methyl piperidine
substituent isolated from the same extract (13). This work was a part of a larger
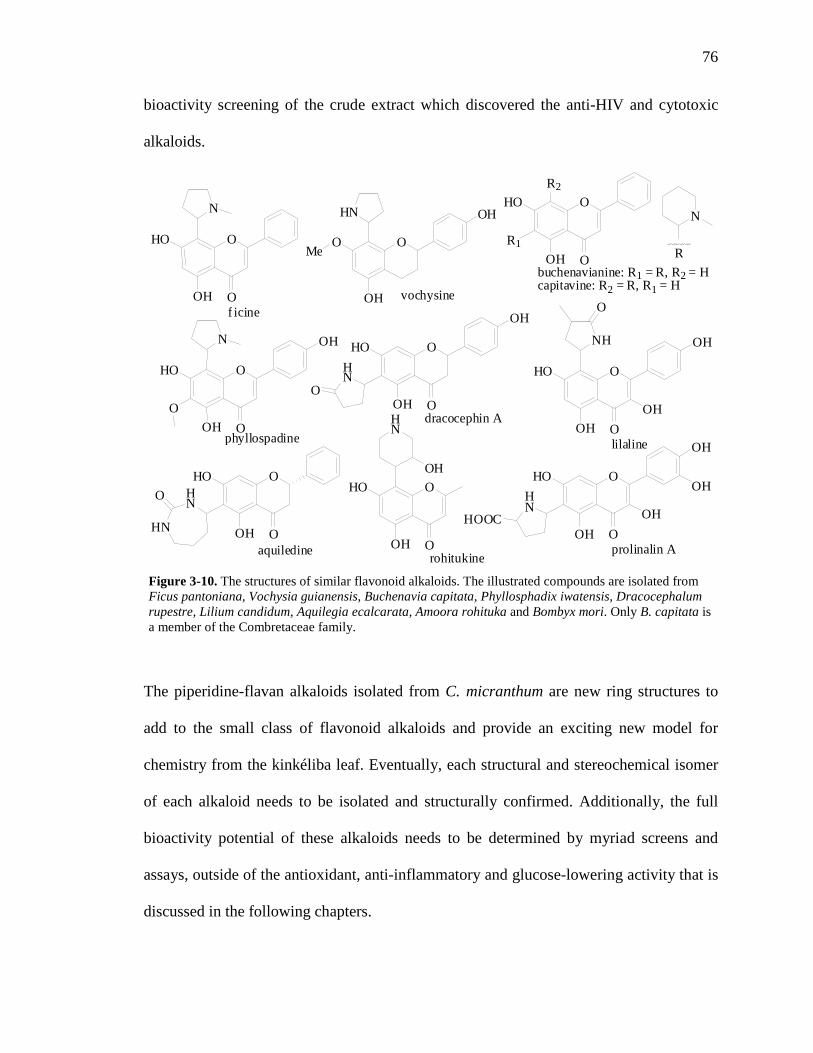
76
bioactivity screening of the crude extract which discovered the anti-HIV and cytotoxic
alkaloids.
The piperidine-flavan alkaloids isolated from C. micranthum are new ring structures to
add to the small class of flavonoid alkaloids and provide an exciting new model for
chemistry from the kinkéliba leaf. Eventually, each structural and stereochemical isomer
of each alkaloid needs to be isolated and structurally confirmed. Additionally, the full
bioactivity potential of these alkaloids needs to be determined by myriad screens and
assays, outside of the antioxidant, anti-inflammatory and glucose-lowering activity that is
discussed in the following chapters.
Figure 3-10. The structures of similar flavonoid alkaloids. The illustrated compounds are isolated from Ficus pantoniana, Vochysia guianensis, Buchenavia capitata, Phyllosphadix iwatensis, Dracocephalum rupestre, Lilium candidum, Aquilegia ecalcarata, Amoora rohituka and Bombyx mori. Only B. capitata is a member of the Combretaceae family.
O
H N O H
O
O H
M e
O
O H
H O R 2
R 1
b u c h e n a v i a n i n e : R 1 = R , R 2 = H c a p i t a v i n e : R 2 = R , R 1 = H
N
v o c h y s i n e
O
O
O H
H O
O O
O H N
p h y l l o s p a d i n e
O
O H
H O
O
O H N H
O H
O
l i l a l i n e
O
O H
H O
O
N
f i c i n e
O
O H
H O
O
O H
d r a c o c e p h i n A
H N
O
O
O H
H O
O
O H
H N
H O O C O H
O H
p r o l i n a l i n A
O
O H
H O
O
H N
O H
r o h i t u k i n e
O
O H
H O H N
H N
O
O a q u i l e d i n e
R
77
3.4. References
1. Jentzsch, V. K.; Spiegl, P.; Fuchs, L., Untersuchungen uber die inhaltsstoffe der blatter von Combretum micranthum G. Don. Planta Medica 1962, 10, 6-8. 2. Bassene, E.; Olschwang, D.; Pousset, J.-L., Plantes medicinales africaines. Les alcaloides du Combretum micranthum G. Don (Kinkeliba). Annales Pharmaceutiques Francaises 1986, 44, (3), 191-196. 3. Ahond, A.; Fournet, A.; Moretti, C.; Philogene, E.; Poupat, C.; Thoison, O.; Potier, P., Premiers alcaloides vrais isoles de Combretacees, Buchenavia macrophylla Eichl. et Buchenavia capitata Eichl. Bulletin de la Societe Chimique de France 1984, 1-2, (2), 41-45. 4. Chen, S.-B.; Gao, G.-Y.; Leung, H.-W.; Yeung, H.-W.; Yang, J.-S.; Xiao, P.-G., Aquiledine and Isoaquiledine, Novel Flavonoids Alkaloids from Aquilegia ecalcarata. Journal of Natural Products 2001, 64, 85-87. 5. Johns, S. R.; Russel, J. H., Ficine, a novel flavonoidal alkaloid. Tetrahedron Letters 1965, 6, (24), 1987-1991. 6. Ren, D.-M.; Guo, H.-F.; Yu, W.-T.; Wang, S.-Q.; Ji, M.; Lou, H.-X., Stereochemistry of flavonoidal alkaloids from Dracocephalum rupestre. Phytochemistry (Elsevier) 2008, 69, 1425-1433. 7. Baudouin, G.; Tillequin, F.; Koch, M.; Vuilhorgne, M.; Lallemand, J.-Y.; Jacquemin, H., Isolement, structure et synthese de la vochysine, pyrrolidinoflavanne de Vochysia guianensis. Journal of Natural Products 1983, 46, (5), 681-687. 8. Harmon, A. D.; Weiss, U., The structure of rohitukine, the main alkaloid of Amoora rohituka (syn. Aphanamixis polystachya) (Meliaceae). Tetrahedron Letters 1979, 20, (8), 721-724. 9. Hirayama, C.; Ono, H.; Tamura, Y.; Nakamura, M., C-prolinylquercetins from the yellow cocoon shell of the silkworm, Bombyx mori. Phytochemistry (Elsevier) 2006, 67, 579-583. 10. Kanchanapoom, T.; Kasai, R.; Chumsri, P.; Kraisintu, K.; Yamasaki, K., Lotthanongine, an unprecedented flavonoidal indole alkaloid from the roots of Thai medicinal plant, Trigonostemon reidioides. Tetrahedron Letters 2002, 43, 2941-2943. 11. Masterova, I.; Uhrin, D.; Tomko, J., Lilaline - A flavonoid alkaloid from Lilium candidum. Phytochemistry (Elsevier) 1987, 26, (6), 1844-1845.
78
12. Takagi, M.; Funahashi, S.; Ohta, K.; Nakabayashi, T., Phyllospadine, a new flavonoidal alkaloid from the sea-grass Phyllosphadix iwatensis. Agricultural Biology and Chemistry 1980, 44, (12), 3019-3020. 13. Beutler, J. A.; Cardellina II, J. H.; McMahon, J. B.; Boyd, M. R., Anti-HIV and Cytotoxic alkaloids from Buchenavia capitata. Journal of Natural Products 1992, 55, (2), 207-213.
79
Chapter 4. Bioactivity – Validation of Traditional Medicinal Uses
80
Kinkéliba has been traditionally used in the treatment of bruises and sprains, guinea
worm infestations, open wounds, digestion, including gastrointestinal problems, colic,
vomiting, as a diuretic, for weight loss and to reduce fevers, especially malarial fever (1-
8). The dried leaves are used to brew a beverage is regularly drunk by the Senegalese
people as a general panacea and, therefore, probably has more of a long-lasting and
preventative nature of action. The roots of kinkéliba are also medicinally used,
specifically for the treatment of bruises and sprains by rubbing in with shea butter or
palm oil (3, 4) or in a decoction that is either drank as a treatment for guinea worm
infestations, or as a wash in the treatment for open wounds (4). The panacea nature of
kinkéliba tea may be related to the presence of polyphenolic compounds that we, in
Chapters 2 and 3, and others have identified (1, 9-16). For example, the polyphenolic
compounds in the kinkéliba leaves can behave as antioxidants by quenching the free
radicals of biological systems with their phenolic ring and multiple hydroxyl moieties.
The compounds which exhibit such antioxidant activity may also exhibit anti-
inflammatory activity and subsequently activity against many other diseases (17-25). The
in vitro assays utilized to evaluate samples from this phytochemical exploration, from the
crude extracts to fractionated parts to isolated compounds, are antioxidant capacity, anti-
inflammatory activity and anti-malarial activity; all employed to confirm published
reports of C. micranthum medicinal activity (5-8, 26-28).
4.1. Methodology
4.1.1. Antioxidant Capacity
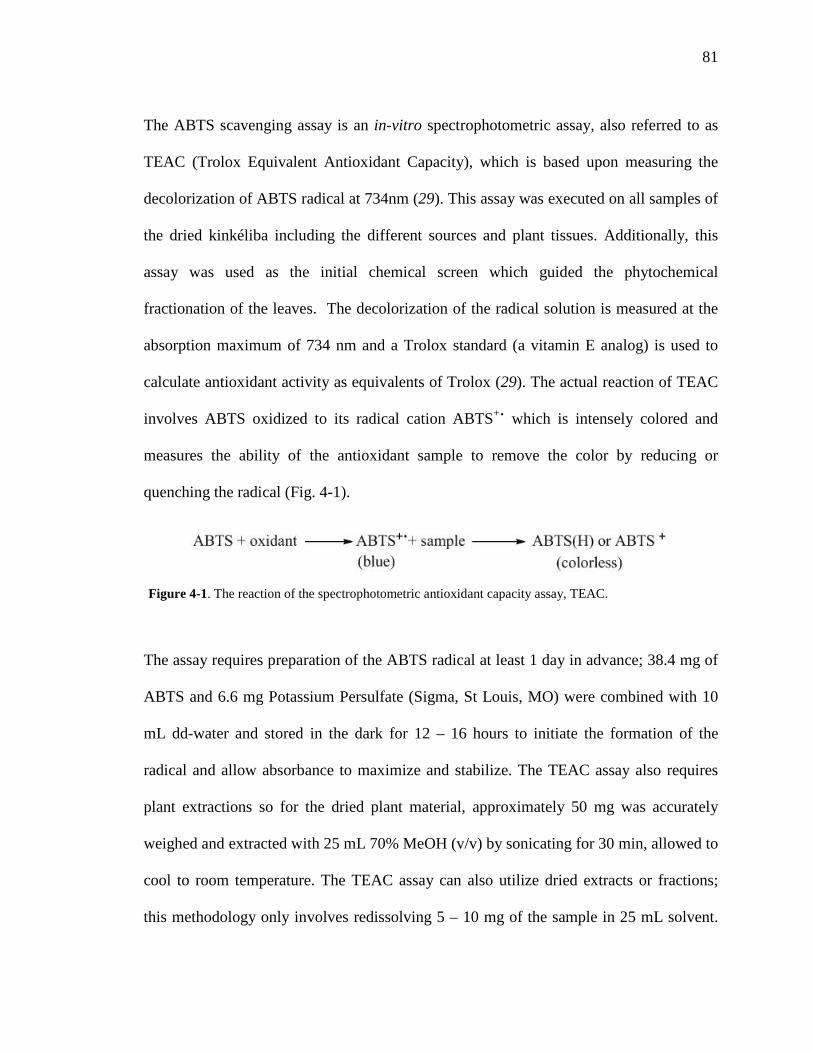
81
The ABTS scavenging assay is an in-vitro spectrophotometric assay, also referred to as
TEAC (Trolox Equivalent Antioxidant Capacity), which is based upon measuring the
decolorization of ABTS radical at 734nm (29). This assay was executed on all samples of
the dried kinkéliba including the different sources and plant tissues. Additionally, this
assay was used as the initial chemical screen which guided the phytochemical
fractionation of the leaves. The decolorization of the radical solution is measured at the
absorption maximum of 734 nm and a Trolox standard (a vitamin E analog) is used to
calculate antioxidant activity as equivalents of Trolox (29). The actual reaction of TEAC
involves ABTS oxidized to its radical cation ABTS+˙ which is intensely colored and
measures the ability of the antioxidant sample to remove the color by reducing or
quenching the radical (Fig. 4-1).
The assay requires preparation of the ABTS radical at least 1 day in advance; 38.4 mg of
ABTS and 6.6 mg Potassium Persulfate (Sigma, St Louis, MO) were combined with 10
mL dd-water and stored in the dark for 12 – 16 hours to initiate the formation of the
radical and allow absorbance to maximize and stabilize. The TEAC assay also requires
plant extractions so for the dried plant material, approximately 50 mg was accurately
weighed and extracted with 25 mL 70% MeOH (v/v) by sonicating for 30 min, allowed to
cool to room temperature. The TEAC assay can also utilize dried extracts or fractions;
this methodology only involves redissolving 5 – 10 mg of the sample in 25 mL solvent.
Figure 4-1. The reaction of the spectrophotometric antioxidant capacity assay, TEAC.

82
The concentrated ABTS+˙ solution was diluted with EtOH to an absorbance of 0.70 (±
0.02) at 734 nm and maintaining this absorbance after equilibration at 30 °C for 20 min.
At this point, 990 µL of the ABTS+˙ solution was combined with 10 µL of extract in a
plastic microcentrifuge vial and allowed to develop for 20 min. The decolorization of the
radical solution, indicating higher antioxidant capacity, was then measured
spectrophotometrically at 734 nm when measured against a blank (10 µL EtOH instead of
plant extract). Trolox, a water-soluble analog of vitamin E (Fig. 4-2) was utilized for a
standard calibration curve in calculation of antioxidant capacity. 15.5 mg Trolox (Fluka,
St Louis, MO) dissolved in 25 mL EtOH and diluted serially to give a six-point
calibration curve; the Trolox solutions were then treated in the assay as the plant extracts
and measured at 734 nm.
4.1.2. Anti-Malarial Activity
The dried kinkéliba plant tissues were assayed for anti-malarial activity using a parasite
lactate dehydrogenase assay for determining antiplasmodial activity. The assay described
below was conducted in collaboration with the research lab of Dr. Peter Smith,
Department of Pharmacology, University of Cape Town, Cape Town, South Africa.
Figure 4-2. The structures of the standards for the in vitro assays, from left to right, of antioxidant capacity (Trolox), anti-malarial activity (Chloroquine) and anti-inflammatory activity (Carnosol).
83
4.1.2.1. Parasite Culture and Assay
The test compounds were tested in triplicate on one or two occasions against chloroquine
sensitive (CQS) strain of Plasmodium falciparum (D10). Continuous in vitro cultures of
asexual erythrocyte stages of P. falciparum were maintained using a modified method of
Trager and Jensen (30). Quantitative assessment of antiplasmodial activity in vitro was
determined via the parasite lactate dehydrogenase assay using a modified method
described by Makler (31).
The samples were prepared to a 2 mg/mL stock solution in 10% DMSO and sonicated to
enhance solubility. Samples were tested as a suspension, if not completely dissolved.
Stock solutions were stored at -20 °C. Further dilutions were prepared on the day of the
experiment. Chloroquine (CQ) was used as the reference drug in all experiments (Fig. 4-
2). Test samples were tested at two concentrations (20 µg/mL and 10 µg/mL). CQ was
tested at three concentrations (30 ng/mL, 15 ng/mL and 7.5 ng/mL).
4.1.3. Anti-inflammatory Activity
The phytochemical separation utilized a lipopolysaccharide (LPS)-induced nitrite assay
for bioactivity-guided fractionation. The bioassays described below were conducted in
collaboration with the research lab of Dr. Min-Hsiung Pan, National Kaohsiung Marine
University, Kaohsiung, Taiwan.
4.1.3.1. Cell Culture
84
RAW 264.7 cells, derived from murine macrophages, were acquired from the American
Type Culture Collection (Rockville, MD) and were cultured in RPMI-1640, without
phenol red, supplemented with 10% endotoxin-free, heat-inactivated fetal calf serum
(GIBCO, Grand Island, NY), 100 units/mL penicillin and 100 µg/mL streptomycin. Once
the cells reached a density of 2 – 3 x 10⁶ cells/mL, they were activated by incubation in
medium containing E. coli LPS at 100 ng/mL. Cell treatments consist of LPS alone,
varying concentrations of test compounds, including Carnosol for comparison (32),
dissolved in DMSO added to LPS or 0.05% DMSO as a vehicle control (33).
4.1.3.2. LPS-induced COX-2 and iNOS Enzyme Activities
The cells were cultured in 100 mm tissue culture dishes and incubated with LPS (50
ng/mL) for 12 hrs before harvest and plating in a 24- well plate and treatment with the
compounds for another 12 hrs. The supernatents were removed and assayed for nitrite as
described below.
4.1.3.3. Nitrite Assay
For the iNOS (induced Nitric Oxide Synthase) assay, the nitrite concentration in the
culture medium was used as an indicator of NO synthesis by utilizing the Griess reaction.
After centrifugation at 1000 g for 20 min, 100 µL of each supernatant medium was mixed
with the same volumn of Griess reagent (1% sulphanilamide in 5% phosphoric acid and
0.1% naphthylethylenediamine dihydrochloride in water). Absorbance of the mixture at
550 nm was measured with an enzyme-linked immunosorbent assay (ELISA) plate reader
(Dynatech MR-7000; Dynatech Labs, Chantilly, VA) (33).
85
4.1.3.4. Western Blotting
The stimulated murine macrophage cell line, RAW 264.7 cells, were washed with
phosphate buffered saline (PBS) and lysed in an ice-cold lysis buffer [10% glycerol, 1%
Triton X-100, 1 mM Na3VO4, 1 mM EGTA, 10 mM NaF, 1 mM Na4P2O7, 20 mM Tris
buffer (pH 7.9), 100 µM β-glycerophosphate, 137 mM NaCl, 5 mM EDTA, and 1
Protease Inhibitor Cocktail Tablet (Roche, Indianapolis, IN)] on ice for 1 hr, followed by
centrifugation at 175,000 g for 30 min at 4 °C. Protein concentrations were determined
by Bio-Rad protein assay (Bio-Rad Laboratories, Inc. Hercules, CA). An equal amount of
total cellular protein (50 µg) was resolved by sodium dodecyl sulfate (SDS)-
polyacrylamide minigels and transferred onto Immobilon polyvinylidene difluoride
membranes (Millipore, Bedford, MA). The membrane was then blocked at room
temperature for 1 hr with blocking solution (20 mM Tris-HCl pH 7.4, 125 mM NaCl,
0.2% Tween-20, 1% bovine serum albumin, and 0.1% sodium azide) followed by
incubation with the primary antibody at 4 °C overnight. The membrane was then washed
with 0.2% TPBS (0.2% Tween-20/PBS) and subsequently probed with anti-mouse or
anti-rabbit antibody conjugated with horseradish peroxidase (Transduction Laboratories,
Lexington, KY) and visualized using enhanced chemiluminescence (ECL, Amersham
Biosciences, Buckinghamshire, UK). Primary antibodies of specific protein were
purchased from various locations as listed: for anti-COX-2 and anti-iNOS, Transduction
Laboratories (Lexington, KY), for β-actin, Sigma Chemical Co. (St. Louis, MO). The
resultant band densities were quantitated using a computer densitometer (AlphaImagerTM
2200 System) (33).
86
4.2. Results
In this phytochemical investigation, antioxidant capacity results were used throughout the
study as a tool to determine which fractions to move forward with, in addition to
chemical interest and novel structures. The fractions giving the highest antioxidant
capacity were further investigated, indicated in Figs. 4-4 and 4-5, by testing for anti-
inflammatory activity as well as glucose-lowering activity (as is discussed in Chapter 5).
These activities were followed through to the identification of pure compounds that were
isolated from C. micranthum (Chapter 2).
4.2.1. Antioxidant Capacity
Initial bioactivity testing of C. micranthum focused on the leaf extract against the roots
and stem bark extracts by preparing crude ethanol extracts of each plant tissue and testing
antioxidant capacity of solutions at approximately 10 mg/25 mL (Fig. 4-3). The
antioxidant capacity is calculated as a percentage (mg Trolox/100 mg plant extract) and
at 68.77%, the leaf extract exhibited the highest activity, above that found in the root and
stem bark extracts which were at 48.52% and 62.53%, respectively. While the leaves
have the highest antioxidant capacity, this assay does show all three tissues are active.
The crude leaf extract was separated by solvent polarity into five fractions, hexane (LH),
chloroform (LC), EtOAc (LE), nBuOH (LB), and water (LW). The results indicated that
the most active were LE at 126.91% and LB at 88.24% (Fig. 4-4A). These two fractions
were chosen for subsequent fractionation because of the observed antioxidant capacity.
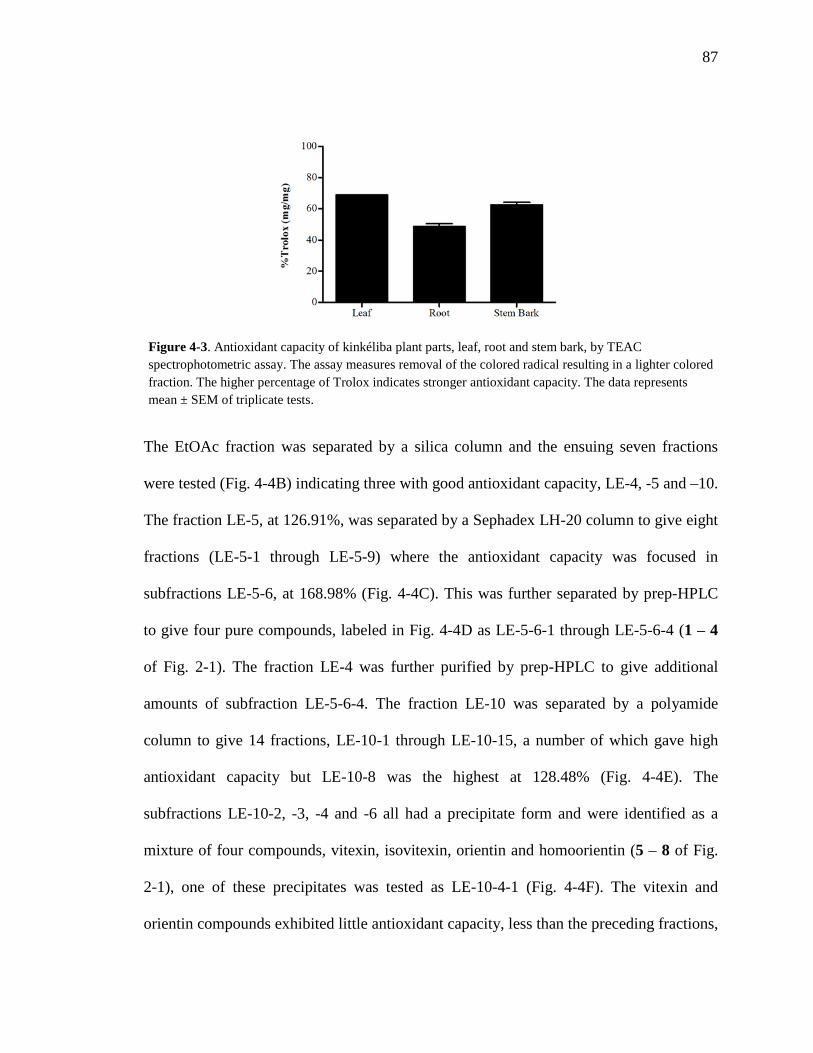
87
The EtOAc fraction was separated by a silica column and the ensuing seven fractions
were tested (Fig. 4-4B) indicating three with good antioxidant capacity, LE-4, -5 and –10.
The fraction LE-5, at 126.91%, was separated by a Sephadex LH-20 column to give eight
fractions (LE-5-1 through LE-5-9) where the antioxidant capacity was focused in
subfractions LE-5-6, at 168.98% (Fig. 4-4C). This was further separated by prep-HPLC
to give four pure compounds, labeled in Fig. 4-4D as LE-5-6-1 through LE-5-6-4 (1 – 4
of Fig. 2-1). The fraction LE-4 was further purified by prep-HPLC to give additional
amounts of subfraction LE-5-6-4. The fraction LE-10 was separated by a polyamide
column to give 14 fractions, LE-10-1 through LE-10-15, a number of which gave high
antioxidant capacity but LE-10-8 was the highest at 128.48% (Fig. 4-4E). The
subfractions LE-10-2, -3, -4 and -6 all had a precipitate form and were identified as a
mixture of four compounds, vitexin, isovitexin, orientin and homoorientin (5 – 8 of Fig.
2-1), one of these precipitates was tested as LE-10-4-1 (Fig. 4-4F). The vitexin and
orientin compounds exhibited little antioxidant capacity, less than the preceding fractions,
Figure 4-3. Antioxidant capacity of kinkéliba plant parts, leaf, root and stem bark, by TEAC spectrophotometric assay. The assay measures removal of the colored radical resulting in a lighter colored fraction. The higher percentage of Trolox indicates stronger antioxidant capacity. The data represents mean ± SEM of triplicate tests.
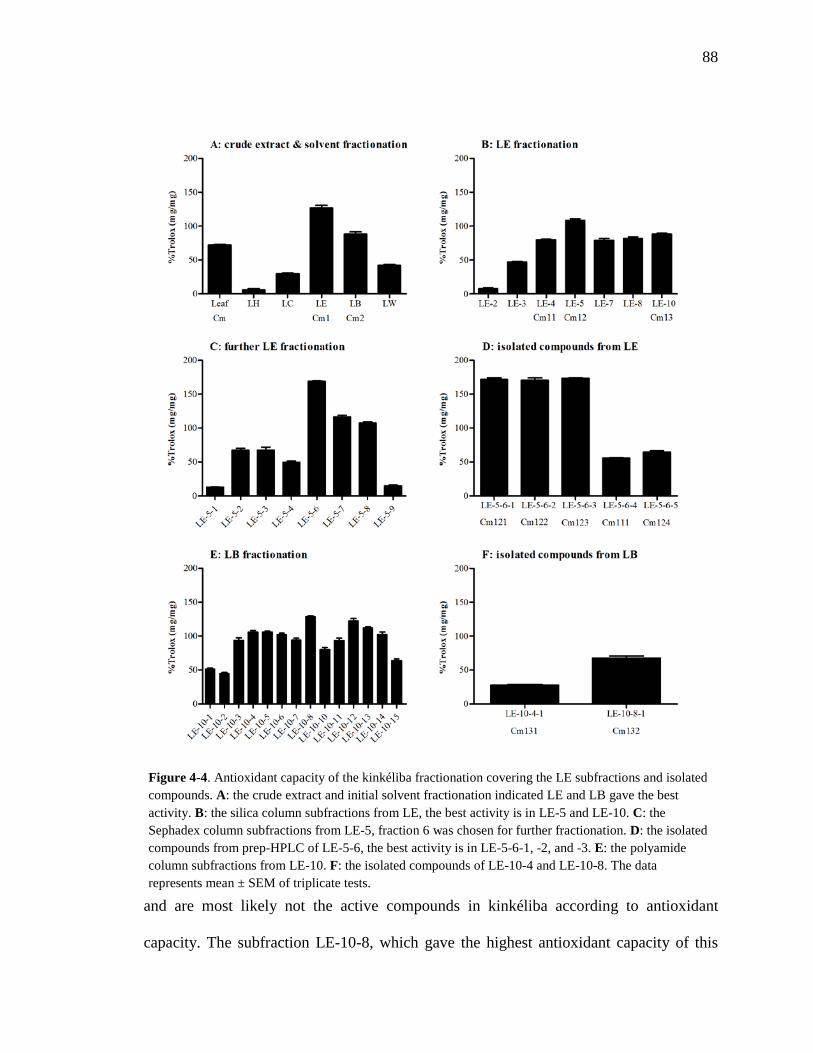
88
and are most likely not the active compounds in kinkéliba according to antioxidant
capacity. The subfraction LE-10-8, which gave the highest antioxidant capacity of this
Figure 4-4. Antioxidant capacity of the kinkéliba fractionation covering the LE subfractions and isolated compounds. A: the crude extract and initial solvent fractionation indicated LE and LB gave the best activity. B: the silica column subfractions from LE, the best activity is in LE-5 and LE-10. C: the Sephadex column subfractions from LE-5, fraction 6 was chosen for further fractionation. D: the isolated compounds from prep-HPLC of LE-5-6, the best activity is in LE-5-6-1, -2, and -3. E: the polyamide column subfractions from LE-10. F: the isolated compounds of LE-10-4 and LE-10-8. The data represents mean ± SEM of triplicate tests.
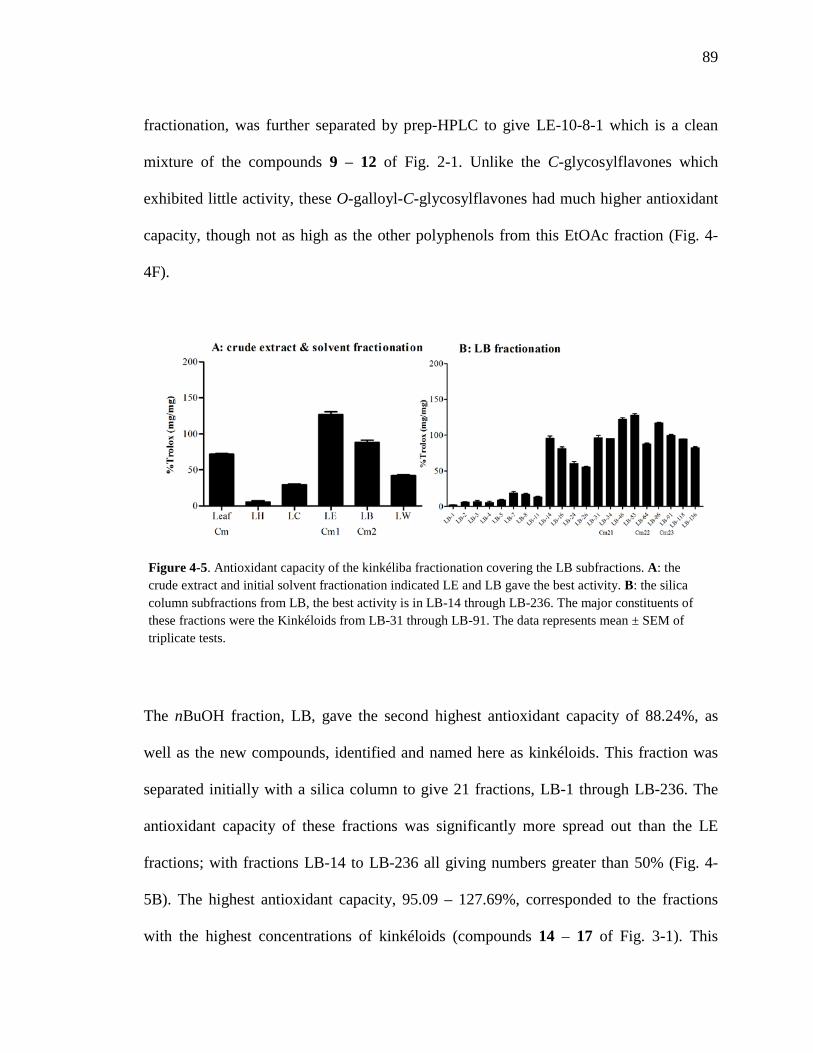
89
fractionation, was further separated by prep-HPLC to give LE-10-8-1 which is a clean
mixture of the compounds 9 – 12 of Fig. 2-1. Unlike the C-glycosylflavones which
exhibited little activity, these O-galloyl-C-glycosylflavones had much higher antioxidant
capacity, though not as high as the other polyphenols from this EtOAc fraction (Fig. 4-
4F).
The nBuOH fraction, LB, gave the second highest antioxidant capacity of 88.24%, as
well as the new compounds, identified and named here as kinkéloids. This fraction was
separated initially with a silica column to give 21 fractions, LB-1 through LB-236. The
antioxidant capacity of these fractions was significantly more spread out than the LE
fractions; with fractions LB-14 to LB-236 all giving numbers greater than 50% (Fig. 4-
5B). The highest antioxidant capacity, 95.09 – 127.69%, corresponded to the fractions
with the highest concentrations of kinkéloids (compounds 14 – 17 of Fig. 3-1). This
Figure 4-5. Antioxidant capacity of the kinkéliba fractionation covering the LB subfractions. A: the crude extract and initial solvent fractionation indicated LE and LB gave the best activity. B: the silica column subfractions from LB, the best activity is in LB-14 through LB-236. The major constituents of these fractions were the Kinkéloids from LB-31 through LB-91. The data represents mean ± SEM of triplicate tests.
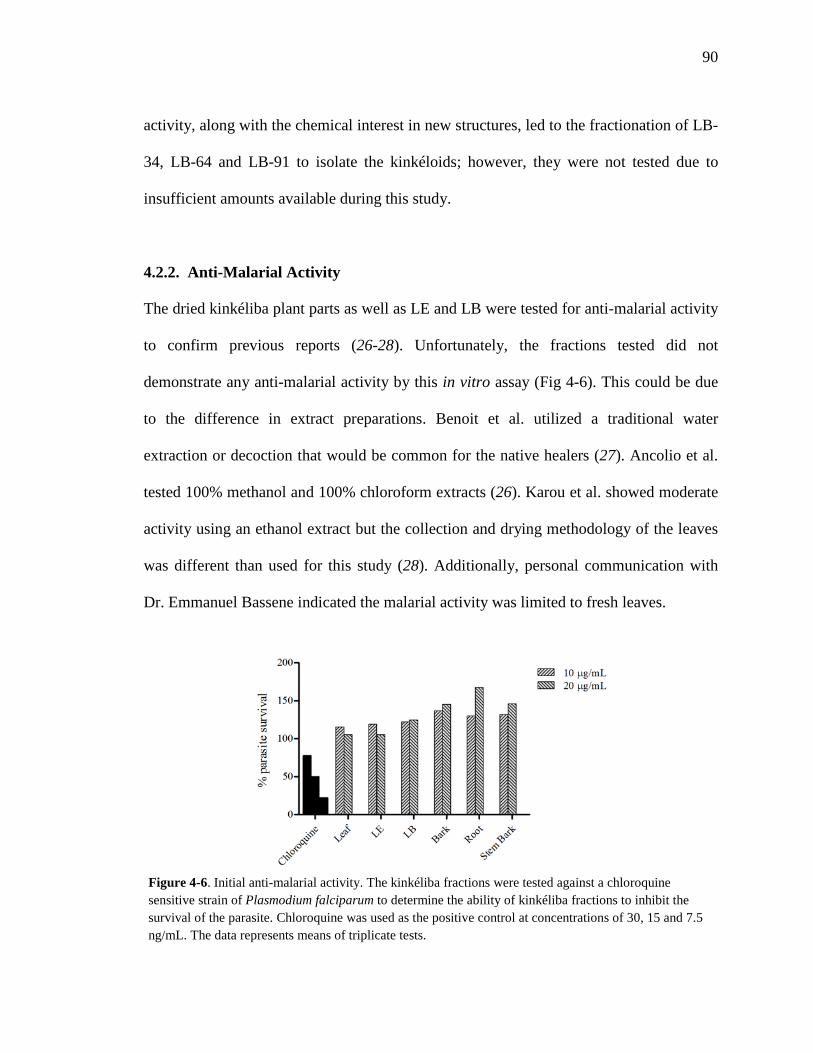
90
activity, along with the chemical interest in new structures, led to the fractionation of LB-
34, LB-64 and LB-91 to isolate the kinkéloids; however, they were not tested due to
insufficient amounts available during this study.
4.2.2. Anti-Malarial Activity
The dried kinkéliba plant parts as well as LE and LB were tested for anti-malarial activity
to confirm previous reports (26-28). Unfortunately, the fractions tested did not
demonstrate any anti-malarial activity by this in vitro assay (Fig 4-6). This could be due
to the difference in extract preparations. Benoit et al. utilized a traditional water
extraction or decoction that would be common for the native healers (27). Ancolio et al.
tested 100% methanol and 100% chloroform extracts (26). Karou et al. showed moderate
activity using an ethanol extract but the collection and drying methodology of the leaves
was different than used for this study (28). Additionally, personal communication with
Dr. Emmanuel Bassene indicated the malarial activity was limited to fresh leaves.
Figure 4-6. Initial anti-malarial activity. The kinkéliba fractions were tested against a chloroquine sensitive strain of Plasmodium falciparum to determine the ability of kinkéliba fractions to inhibit the survival of the parasite. Chloroquine was used as the positive control at concentrations of 30, 15 and 7.5 ng/mL. The data represents means of triplicate tests.
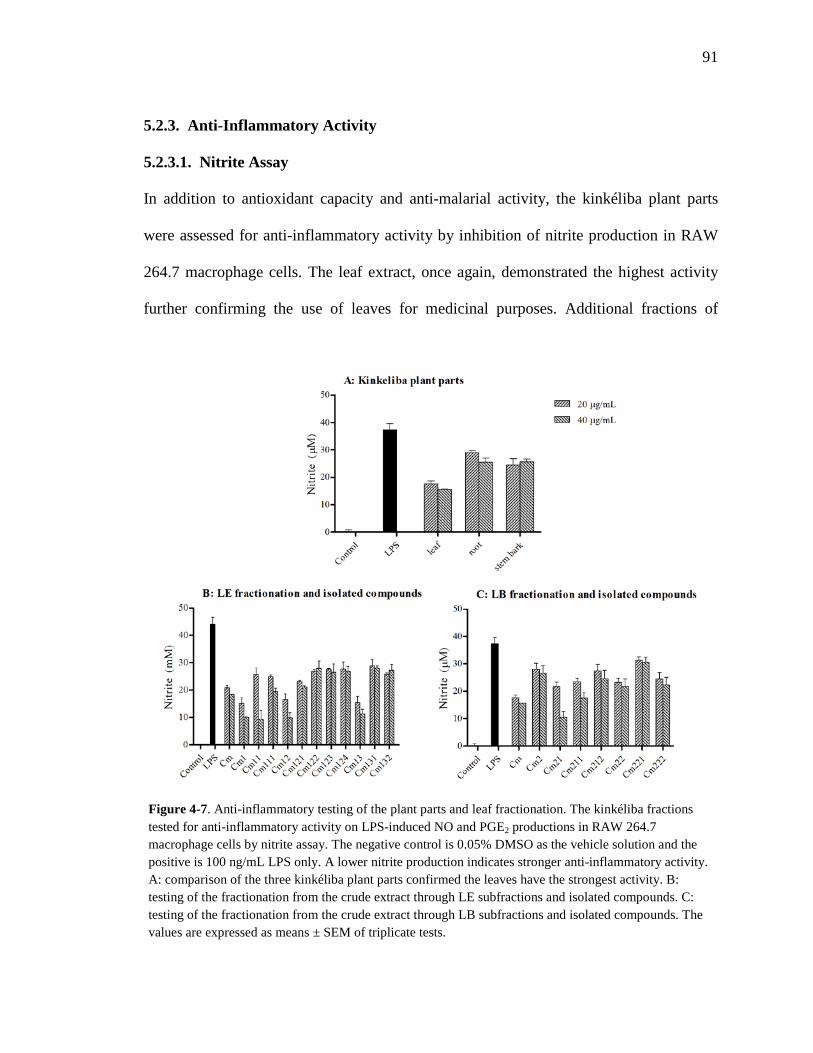
91
5.2.3. Anti-Inflammatory Activity
5.2.3.1. Nitrite Assay
In addition to antioxidant capacity and anti-malarial activity, the kinkéliba plant parts
were assessed for anti-inflammatory activity by inhibition of nitrite production in RAW
264.7 macrophage cells. The leaf extract, once again, demonstrated the highest activity
further confirming the use of leaves for medicinal purposes. Additional fractions of
Figure 4-7. Anti-inflammatory testing of the plant parts and leaf fractionation. The kinkéliba fractions tested for anti-inflammatory activity on LPS-induced NO and PGE2 productions in RAW 264.7 macrophage cells by nitrite assay. The negative control is 0.05% DMSO as the vehicle solution and the positive is 100 ng/mL LPS only. A lower nitrite production indicates stronger anti-inflammatory activity. A: comparison of the three kinkéliba plant parts confirmed the leaves have the strongest activity. B: testing of the fractionation from the crude extract through LE subfractions and isolated compounds. C: testing of the fractionation from the crude extract through LB subfractions and isolated compounds. The values are expressed as means ± SEM of triplicate tests.
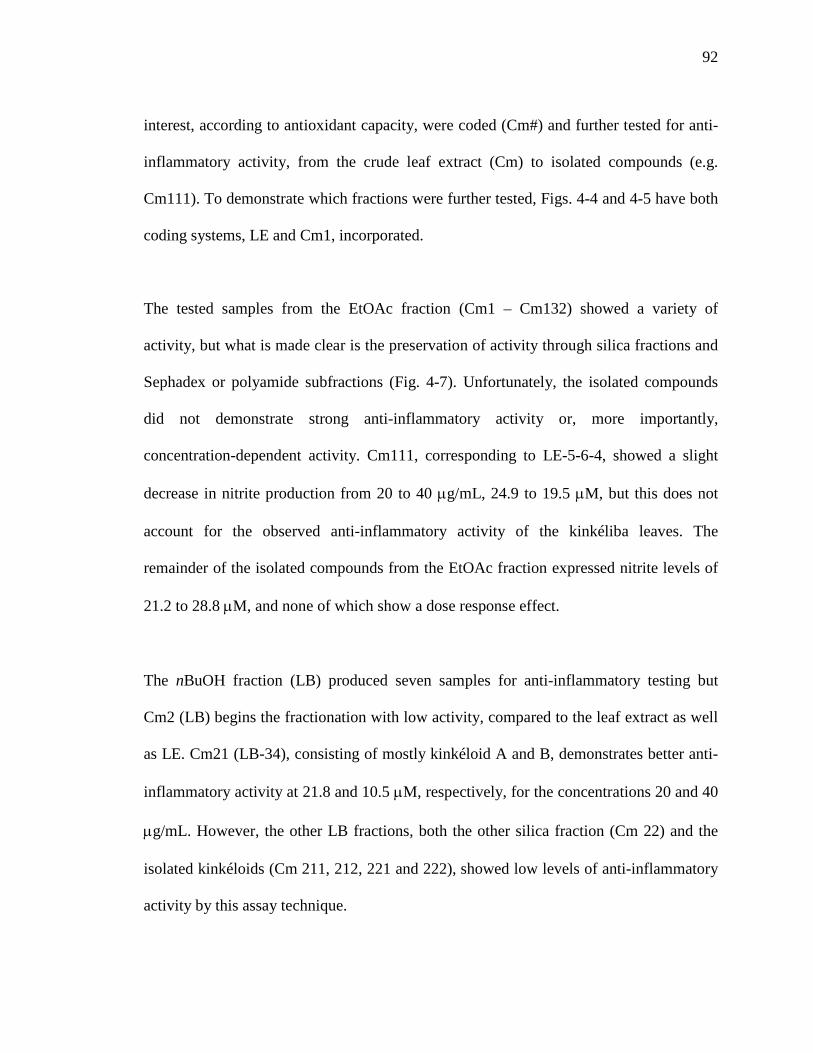
92
interest, according to antioxidant capacity, were coded (Cm#) and further tested for anti-
inflammatory activity, from the crude leaf extract (Cm) to isolated compounds (e.g.
Cm111). To demonstrate which fractions were further tested, Figs. 4-4 and 4-5 have both
coding systems, LE and Cm1, incorporated.
The tested samples from the EtOAc fraction (Cm1 – Cm132) showed a variety of
activity, but what is made clear is the preservation of activity through silica fractions and
Sephadex or polyamide subfractions (Fig. 4-7). Unfortunately, the isolated compounds
did not demonstrate strong anti-inflammatory activity or, more importantly,
concentration-dependent activity. Cm111, corresponding to LE-5-6-4, showed a slight
decrease in nitrite production from 20 to 40 µg/mL, 24.9 to 19.5 µM, but this does not
account for the observed anti-inflammatory activity of the kinkéliba leaves. The
remainder of the isolated compounds from the EtOAc fraction expressed nitrite levels of
21.2 to 28.8 µM, and none of which show a dose response effect.
The nBuOH fraction (LB) produced seven samples for anti-inflammatory testing but
Cm2 (LB) begins the fractionation with low activity, compared to the leaf extract as well
as LE. Cm21 (LB-34), consisting of mostly kinkéloid A and B, demonstrates better anti-
inflammatory activity at 21.8 and 10.5 µM, respectively, for the concentrations 20 and 40
µg/mL. However, the other LB fractions, both the other silica fraction (Cm 22) and the
isolated kinkéloids (Cm 211, 212, 221 and 222), showed low levels of anti-inflammatory
activity by this assay technique.
93
4.2.3.2. Western Blotting
The western blotting results agree with nitrite assay and antioxidant capacity that the
leaves are more active than the other kinkéliba plant parts. The leaves (Cm) were
significantly more active than the bark (Cm3), roots (Cm4) and stem bark (Cm5) as seen
in Fig. 4-8A and 4-8D.
All the LE fractions tested showed activity against iNOS protein expression, with the
exception of Cm132. Cm11 and Cm12 (LE-4 and LE-5, respectively) demonstrated the
best activity against iNOS, comparable to Carnosol at 10 µM, and were also active
against COX-2. It is important to recognize that the strongest anti-inflammatory activity
is seen in LE-4 and LE-5 but not as strong in the isolated compounds, suggesting that
either additional compounds are responsible for this activity and/or that the compounds
already identified may work best in conjunction with each other. An experiment to
confirm this would be to simulate the concentrations of these isolated compounds that are
found naturally in the plant extract and test again, specifically the concentrations of the
catechins (Cm121 and 122) and the flavans (Cm111 and Cm123) since they have the
highest activity (Fig. 4-8A and 4-8B).
The LB fractions tested in western blotting showed less anti-inflammatory activity, not
surprising given the results for the nitrite assay. The highest activity against iNOS protein
expression was achieved with Cm21 (LB-34) while the isolated compounds, Cm212
(kinkéloid B) and Cm221 (kinkeloid C), induced activity but less than Cm21 (Fig. 5-8C).
The observed activity of Cm212 and 221 is promising for the LB fraction since the
94
Figure 4-8. Western blotting of kinkéliba on iNOS and COX-2 protein expression. The effects of kinkéliba extracts, subfractions and isolated compounds on LPS-induced iNOS and COX-2 protein expression in RAW 264.7 macrophage cells. The cells were treated with 0.05% DMSO as vehicle solutions for negative control, LPS only for positive control and β-actin as a loading control. The treated cells were at concentrations of 40 µg/mL (Carnosol at 10 µM). The levels of iNOS or COX-2 in lysates were analyzed by western blotting, band densities were measured with a densitometer. Lower levels of protein indicate a stronger anti-inflammatory activity. A: kinkéliba leaf extract and LE subfractions with band densities in E. B: additional LE subfractions and isolated compounds, band densities in F. C: LB subfractions and isolated compounds, with band densities in G. D: kinkéliba plant parts, bark (Cm3), root (Cm4) and stem bark (Cm5), compared to Carnosol with band densities in H. The values represented at means ± SEM of triplicate tests.
95
concentration of kinkeloid B and C is the highest of the flavan alkaloids. Because this
iNOS activity decreases with isolation of the compounds, this is most likely, again, a
combination effect. There is no inhibition of COX-2 activity throughout these fractions.
The kinkéliba leaf extract revealed a good starting point for anti-inflammatory activity-
guided fractionation but, from the subsequent fractions down to isolated compounds, the
activity was lost. Western blotting of the iNOS protein expression demonstrates the anti-
inflammatory potential of the kinkéliba polyphenolic compounds. The strongest activity,
comparable to Carnosol (32), was observed with LE-4 and LE-5, fractions consisting of
catechin and flavan polyphenols. While this activity diminishes with the isolation of the
compounds, there is still excellent inhibition observed. The full anti-inflammatory
potential of kinkéliba most likely resides in the EtOAc fraction, specifically with the
catechins and flavans, but is a combination effect as opposed to dependent upon a single
compound.
4.3. Discussion
The kinkéliba fractions, throughout the bioactivity-guided fractionation, demonstrate
excellent antioxidant capacity. This indicates the kinkéliba fractions have the potential for
a number of medicinal uses, including, but not limited to, anti-inflammatory activity and
anti-malarial activity. The assay for antioxidant capacity was utilized for directing the
fractionation started with testing the various plant parts. All three plants tested were
active but the leaves demonstrated the highest activity. From this testing we cannot
determine whether the popularity of the kinkéliba leaf in traditional uses was in any way
96
related to healers recognizing that the leaves were highest in antioxidant capacity and/or
other attributes among the different plant tissues, or whether it is coincidental and that the
use of leaves is more due to the ease of gathering and preservation of the shrub.
Subsequent testing of the leaf crude extract and fractions by antioxidant capacity
highlighted a number of subfractions and isolated compounds with excellent activity.
Specifically, of the EtOAc fraction, LE-5 and the subsequently isolated epigallocatechin,
epicatechin, and 3’,4’,5’,5,7-pentahydroxyflavan (1 – 3 of Fig. 2-1). Additional active
compounds include tetrahydroxyflavan and the O-galloyl-C-glycosylflavones (4, 10 – 13
of Fig. 2-1). Antioxidant capacity of the LB fraction was focused in the fractions
containing the kinkéloids, though the isolated compounds were not tested at this time.
The highlighted subfractions and compounds, by antioxidant capacity, were further tested
for anti-malarial activity against P. falciparum but no appreciable difference was seen
from the crude extract and solvent fractionation so the remaining fractions were not
tested. Further anti-malarial testing should concentrate first on the fresh leaves, as
communicated to us by Dr. Bassene.
The fractions were also tested for anti-inflammatory activity against both iNOS (nitrite
production and western blotting) and COX-2 (western blotting only). The iNOS anti-
inflammatory activity was strong in the LE subfractions but the isolated compounds
yielded a slightly lower activity. This could indicate a synergistic effect of the isolates in
the subfractions that requires the compounds to work together for the observed effect or
97
the presence of additional compounds that have not been isolated yet. The activity of this
fractionation needs to be investigated in further detail to explain the initial observed
results. The LB fractionation, of which the major constituents are the kinkéloids,
demonstrated no COX-2 anti-inflammatory activity but the subfractions showed
promising iNOS activity by the nitrite assay and western blotting. Again, the isolated
compounds did not seem responsible for the anti-inflammatory activity on their own but
this could be another example of the compounds working in concert with each other for
the full effect.
Additional testing of the LB fraction and, specifically, the kinkéloids as well as an in
depth synergistic experiment of the EtOAc isolates are necessary to fully describe the
anti-inflammatory potential of kinkéliba. However, the results presented here portray the
kinkéliba leaf extract to be an excellent source of antioxidant compounds as well as a
foundation for anti-inflammatory activity.
98
4.4. References
1. D' Agostino, M.; Biagi, C.; De Feo, V.; Zollo, F.; Pizza, C., Flavonoids of Combretum micranthum. Fitoterapia 1990, LXI, (5), 477. 2. Iwu, M. M., Handbook of African Medicinal Plants. CRC Press, Inc.: Florida, 1993; p 464. 3. Kerharo, J.; Adam, J. G., Combrétacées. In La Pharmacopée Sénégalaise Tranditionnelle Plantes Médicinales Et Toxiques, 1st ed.; Vigot Fréres: Paris, 1974; pp 341-360. 4. Neuwinger, H. D., African Traditional Medicine: A Dictionary of Plant Use and Applications. Medpharm Scientific Publishers: Stuttgart, 2000; p 589. 5. Olajide, O.; Makinde, J. M.; Okpako, D. T., Evaluation of the anti-inflammatory property of the extract of Combretum micranthum G. Don. (Combretaceae). Inflammopharmacology 2003, 11, (3), 293-298. 6. Le Grand, A., Les Phytotherapies Anti-infectieuses de la Foret-savane, Senegal (Afrique occidentale) III: Un Resume des Substances Phytochimiques et l' Activite Antimicrobienne de 43 Species. Journal of Ethnopharmacology 1989, 25, 315-338. 7. Le Grand, A.; Wondergem, P. A., Les Phytotherapies Anti-infectieuses de la Foret-savane, Senegal (Afrique occidentale) I: Un Inventaire. Journal of Ethnopharmacology 1987, 21, 109-125. 8. Tignokpa, M.; Laurens, A.; Mboup, S.; Sylla, O., Plantes medicinales populaires des marches de Dakar (Senegal). International Journal of Crude Drug Research 1986, 24, 75-80. 9. Bassene, E.; Laurance, A.; Olschwang, D.; Pousset, J.-L., Plantes medicinales africaines XIX: Dosage de la vitexine par chromatographie liquide haute performance dans un extrait brut de Combretum micranthum G. Don. Journal of Chromatography 1985, 346, 428-430. 10. Bassene, E.; Olschwang, D.; Miralles, J.; Pousset, J.-L., Plantes medicinales africaines XX: Acides gras des feuilles de Combretum micranthum G. Don (Kinkeliba). Herba Hungarica 1986, 25, (2), 7-14. 11. Bassene, E.; Olschwang, D.; Pousset, J.-L., Plantes medicinales africaines I: Caracterisation de l'inositol et du sorbitol, principes actifs probables du Kinkeliba ("Combretum micranthum" G. Don.). Dakar Medical 1981, 26, (2), 219-225.
99
12. Bassene, E.; Olschwang, D.; Pousset, J.-L., Plantes medicinales africaines. Les alcaloides du Combretum micranthum G. Don (Kinkeliba). Annales Pharmaceutiques Francaises 1986, 44, (3), 191-196. 13. Bassene, E.; Olschwang, D.; Pousset, J.-L., Plantes medicinales africaines XXIII: Flavonoides du Combretum micranthum, G. Don (Kinkeliba). Plantes medicinales et phytotherapie 1987, XXI, (2), 173-176. 14. Bassene, E.; Olschwang, D.; Pousset, J.-L., Etude de l'insaponifiable de l'extrait lipidique des feuilles de Combretum micranthum G. Don (Kinkeliba). Herba Hungarica 1989, 28, (1-2), 75-79. 15. Jentzsch, V. K.; Spiegl, P.; Fuchs, L., Untersuchungen uber die inhaltsstoffe der blatter von Combretum micranthum G. Don. Planta Medica 1962, 10, 6-8. 16. Paris, R., Sur une Combretacee africaine, le "kinkeliba" (Combretum micranthum G. Don.). Bulletin des Sciences Pharmacologiques 1942, 10-11-12, 181-186. 17. Lin, J.-K., Catechins and inhibitory activity against carcinogenesis. Nutrition and Cancer Prevention 2006, 351-367. 18. Surh, Y.-J.; Chun, K.-S.; Cha, H.-H.; Han, S. S.; Keum, Y.-S.; Park, K.-K.; Lee, S. S., Molecular mechanisms underlying chemopreventive activities of anti-inflammatory phytochemicals: down-regulation of COX-2 and iNOS through suppression of NF-kappa B activation. Mutation Research 2001, 480-481, 243-268. 19. Pretorius, E., Anti-inflammatory medicinal plants: new insights and research techniques. In Recent Progress in Medicinal Plants, Singh, V. K., Ed. Studium Press, LLC: Houston, TX, 2008; pp 205-226. 20. Singh Bora, K.; Sharma, A., Phytoconstituents and therapeutic potential of Allium cepa Linn. - a review. Pharmacognosy Reviews 2009, 3, (5), 159-169. 21. Meng, C. Q., Atherosclerosis is an inflammatory disorder after all. Current Topics in Medicinal Chemistry 2006, 6, (2), 93-102. 22. Ruderman, E. M., Current and future pharmaceutical therapy for rheumatoid arthritis. Current Pharmaceutical Design 2005, 11, (5), 671-684. 23. Yeo, M.; Han, S. U.; Nam, K. T.; Kim, D. Y.; Cho, S. W.; Hahm, K.-B., Association of chronic inflammation with carcinogenesis: implications of anti-inflammatory strategies for cancer prevention. Oxidative Stress and Disease 2005, 18, 369-387. 24. Coussens, L. M.; Werb, Z., Inflammation and cancer. Nature 2002, 420, 860-867.
100
25. van Kempen, L. C. L.; de Visser, K. E.; Coussens, L. M., Inflammation, proteases and cancer. European Journal of Cancer 2006, 42, 728-734. 26. Ancolio, C.; Azas, N.; Mahiou, V.; Ollivier, E.; Di Giorgio, C.; Keita, A.; Toimon-David, P.; Balansard, G., Antimalarial activity of extracts and alkaloids isolated from six plants used in traditional medicine in Mali and Sao Tome. Phytotherapy Research 2002, 16, (7), 646-649. 27. Benoit, F.; Valentin, A.; Pelissier, Y.; Diafouka, F.; Marion, C.; Kone-Bamba, D.; Kone, M.; Mallie, M.; Yapo, A.; Bastide, J.-M., In Vitro Antimalarial Activity of Vegetal Extracts Used in West African Traditional Medicine. American Journal of Tropical Medicine and Hygiene 1996, 54, (1), 67-71. 28. Karou, D.; Dicko, M. H.; Sanon, S.; Simpore, J.; Traore, A. S., Antimalarial activity of Sida acuta Burm. f. (Malvaceae) and Pterocarpus erinaceus Poir. (Fabaceae). Journal of Ethnopharmacology 2003, 89, 291-294. 29. Re, R.; Pellegrini, N.; Proteggente, A.; Pannala, A.; Yang, M.; Rice-Evens, C., Antioxidant activity applying an improved ABTS radical cation decolorization assay. Free Radical Biology & Medicine 1999, 26, (9/10), 1231-1237. 30. Trager, W.; Jensen, J. B., Human malaria parasite in continuous culture. Science 1976, 193, (4254), 673-675. 31. Makler, M. T.; Ries, J. M.; Williams, J. A.; Bancroft, J. E.; Piper, R. C.; Gibbins, B. L.; Hinrichs, D. J., Parasite lactate dehydrogenase as an assay for Plasmodium falciparum drug sensitivity. The American Society of Tropical Medicine and Hygiene 1993, 48, 739-741. 32. Lo, A.-H.; Liang, Y.-C.; Lin-Shiau, S.-Y.; Ho, C.-T.; Lin, J.-K., Carnosol, an antioxidant in rosemary, suppresses inducible nitric oxide synthase through down-regulating nuclear factor-κB in mouse macrophages. Carcinogenesis 2002, 23, (6), 983-991. 33. Pan, M.-H.; Lai, C.-S.; Wang, Y.-J.; Ho, C.-T., Acacetin suppressed LPS-induced up-expression of iNOS and COX-2 in murine macrophages and TPA-induced tumor promotion in mice. Biochemical Pharmacology 2006, 72, (10), 1293-1303.
101
Chapter 5. Bioactivity – Glucose-lowering Activity
102
The traditional use of kinkéliba and the brewed beverage, from the leaves, includes a
purported belief (personal communication between Dr. Simon and Dr. Bassene,
University of Dakar, Senegal) that it may be good for weight loss and the treatment of
diabetes, though neither of these is previously reported. While many plants and their
respective extracts have been noted to be “good for weight loss”, few have been shown to
be scientifically validated. Weight loss indicators from plants usually take the form of (i)
inducing a state of satiation whereby the person perceives they are full and subsequently
reduce their food intake; (ii) chemically affecting the metabolic processes of the body.
While this effect is certainly exciting and worth further exploration, the mechanism of
weight loss action in kinkéliba tea is not known or even hypothesized which makes
choosing an appropriate in vitro assay quite difficult. The treatment of diabetes is also an
interesting effect of kinkéliba tea and, interestingly, could be a result of weight loss or
result in weight loss. Because of this possible combination effect, glucose-lowering
activity was explored as an indication of antihyperglycemia or treatment of diabetes.
Diabetes mellitus is a chronic disease that affects 180 million people worldwide, a
number that is expected to double in the next 20 years (1). Type 2 diabetes, comprising
approximately 90% of the cases worldwide, often develops from excess body weight and
physical inactivity resulting in the body’s ineffective use of insulin which creates
hyperglycemia (1, 2). The enzyme phosphoenolpyruvate carboxykinase (PEPCK)
catalyzes the first committed step in hepatic gluconeogenesis and is normally regulated
by insulin or glucagon to maintain proper blood glucose levels (3, 4). In the case of Type
2 diabetes, insulin does not effectively inhibit PEPCK expression contributing to
103
increased blood glucose or hyperglycemia (5). Additionally, a more generic assay is to
test for inhibition of glucose production, outside of a specific mechanism of action. In
this investigation, the in vitro assays chosen for the bioactivity-guided fractionation of
kinkéliba regarding glucose-lowering activity is measuring the percent decrease of
glucose production and the down-regulation of PEPCK mRNA in rat hepatoma cells
(H4IIE), the latter of which is indicative of lowering gluconeogenesis in the liver (6).
To understand the body weight loss or antihyperglycemic effect of kinkéliba, it is
important to have an appropriate animal model; the model chosen here is the diet-induced
obesity (DIO) C57BL/6J mouse. This model is a particularly good example of the human
metabolic disorder because it develops a syndrome of obesity, accompanied by hyper-
insulinemia and hyperglycemia (indicators of Type 2 diabetes), when allowed unfettered
access to a high-fat diet. The development of insulin resistance, hyperglycemia and
obesity, in fact, closely parallel the progression of Type 2 diabetes in humans (7). The
weight loss effect of kinkéliba extracts, if any, should also be observed during a study by
following the body weights of the animals. Therefore, the C57BL/6J mouse model was
chosen to demonstrate the full in vivo effects of kinkéliba.
5.1. Methodology
5.1.1. Glucose-Lowering Assays
The phytochemical separation utilized a PEPCK mRNA assay with all the fractions that
gave strong antioxidant capacity in order to first demonstrate a glucose lowering activity
and secondly to identify the fractions and ultimately the compounds responsible for the
104
antihyperglycemic activity throughout the fractionation of the leaves. All the
appropriately coded samples from the EtOAc fraction (LE) were tested, but the LB
fractions underwent more strenuous testing for glucose-lowering activity following the
excellent results of LB in the animal model (Fig. 5-1). The more generic glucose
production assay was utilized to demonstrate nonspecific glucose-lowering activity. The
bioassays described below were conducted in collaboration with the research lab of Dr.
Slavko Komarnytsky and Dr. Ilya Raskin, Rutgers University, New Brunswick, NJ.
5.1.1.1. Chemicals and Biochemicals
8-(4-Chlorophenylthio)-cAMP (8-CPT-cAMP), 5-aminoimidazole-4-carboxamide-1-β-D-
ribofuranoside, PI3K inhibitor LY-294002, sodium lactate, sodium pyruvate, and 3-(4,5-
dimethylthiazol-2-yl)-2,5-diphenyl tetrazolium bromide (MTT) were purchased from
Sigma Chemicals (St. Louis, MO). Human insulin (Humulin R) was purchased from Eli
Lilly (Indianapolis, IN). All other chemicals, including cell culture media, were obtained
from Invitrogen (Carlsbad, CA). Reagents used in RT-PCR, including enzymes, were
supplied by Stratagene (La Jolla, CA). The H4IIE cell line (ATCC CRL-1548) was
provided by American Type Culture Collection (Manassas, VA).
5.1.1.2. Cell Culture and Treatment
The H4IIE hepatoma cells (ATCC CRL-1600) were plated in 24-well tissue culture plates
(Greiner Bio One, Monroe, NC) and were grown to near confluence in Dulbecco’s
modified Eagle’s medium containing 2.5% (v/v) newborn calf serum and 2.5% (v/v) fetal
calf serum. Cells were treated with 500 nM dexamethasone and 0.1 mM 8-CTP-
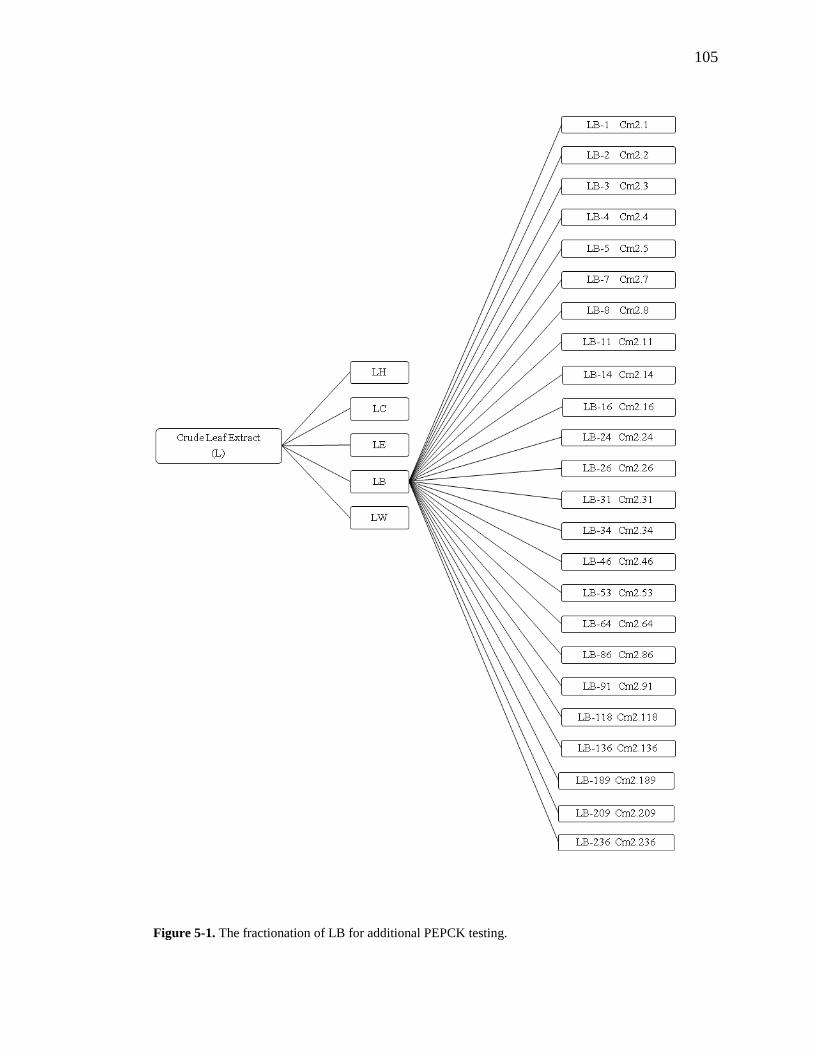
105
Figure 5-1. The fractionation of LB for additional PEPCK testing.
106
cAMP (Dex-cAMP) for 8 hrs to induce PEPCK gene expression together with plant
extract, subfractions, isolated compounds or 10 nM insulin. The fractions were tested at
100 µg/mL medium and the isolated compounds were tested at 20 µΜ. Each treatment
was performed in triplicate with a negative control of untreated cells. For inhibitory
assays, cells were pretreated with 20 µM LY-294002 for 30 min, washed with phosphate-
buffered saline, and incubated with Dex-cAMP for an additional 7 hrs together with the
plant extracts, subfractions, isolated compounds or 10 nM insulin (6).
5.1.1.3. Cell Viability Assay and Dose Range Determination
Cell viability was measured by the MTT assay. The MTT tetrazolium dye assay was
performed to measure cell survival in culture after incubation with treatments. MTT (100
µg/mL) was added to the medium in each well and plates were incubated for 5 hrs in the
cell growth chamber. Medium was then removed and DMSO (150 µL) was added to each
well to solubilize the purple formazan crystals created by mitochondrial dehydrogenase
reduction of MTT. After 5 min of additional incubation, absorbance was read at 550 nm
on a microplate reader spectrophotometer (Molecular Devices, Sunnyvale, CA). The
concentrations of test reagents that showed significant cell viability compared with that of
the control (DMSO, 0.1%) were further selected for in vitro gene expression assays. All
treatments were performed in duplicate (6, 8).
5.1.1.4. Total RNA Extraction, Purification, and cDNA Synthesis
Total RNA was extracted from H4IIE cells using Trizol reagent (Invitrogen), following
the manufacturer’s instructions. RNA was quantitated spectrophotometrically by
107
absorbance measurements at 260 and 280 nm using the NanoDrop system (NanoDrop
Technologies). Quality of RNA was assessed by separation in gel electrophoresis. RNA
was then treated with DnaseI (Invitrogen), following the manufacturer’s guidelines, to
remove any traces of DNA contamination. The cDNAs were synthesized with 2.5 µg of
RNA for each sample, using Stratascript reverse transcriptase (Stratagene), following the
manufacturer’s protocol (6).
5.1.1.5. Quantitative PCR and Data Analysis
The synthesized cDNAs were diluted four-fold and five microliters of each diluted
sample was used for PCR reactions of 25 µL final volume. The other components of the
PCR reactions were 0.5 µL of 6 µM gene-specific primers (synthesized by IDT,
Coralville, IA) and 12.5 µL of Brilliant SYBR Green PCR master mix (2X; Stratagene)
containing green jump-start Taq ready mix. ROX (Stratagene) was used as a reference
dye. The primers were selected using the Primer Express software (Applied Systems, v.
2.0, Foster City, CA) as follows: β-actin: forward primer 5’-GGG AAA TCG TGC GTG
ACA TT-3’, reverse primer 5’-GCG GCA GTG GCC ATC TC-3’; PEPCK: forward
primer 5’-GCA GAG CAT AAG GGC AAG GT-3’, reverse primer 5’-TTG CCG AAG
TTG TAG CCA AA-3’.
β-actin primers were selected from the RefSeq sequence with the accession no.
NM_031144. Both primers reside on exon 4 of the rat β-actin gene (Rat Genomic
Sequence Consortium, assembly v. 3.4). These primers generated a 76-bp product from
108
β-actin mRNA. PEPCK primers were selected from the RefSeq sequence with the
accession no. NM_198780. The intron-spanning forward primer was selected to cover the
exon 9 – 10 boundary. The reverse primer was selected from exon 10. The oligos were
synthesized by IDT. These primers generated a 74-bp product from PEPCK mRNA and a
207-bp product from genomic DNA.
Quantitative PCR amplifications were performed on MX3000p system (Stratagene) using
one cycle at 50 °C for 2 min and one cycle of 95 °C for 10 min, followed by 40 cycles of
15 sec at 95 °C and 1 min at 60 °C. The dissociation curve was completed with one cycle
of 1 min at 95 °C, 30 sec of 55 °C and 30 sec of 95 °C. Non-RT control and no-template
control were included in each experiment as quality control steps.
PEPCK mRNA expressions were analyzed using the ∆∆CT method and normalized with
respect to the expression of the β-actin housekeeping gene. The ∆∆CT values obtained
from these analyses directly reflect the relative mRNA quantities for a specific gene in
response to a treatment as relative to a calibrator. The Dex-cAMP treatment (positive
control) served as the calibrator sample in this study. The PEPCK gene expression of the
calibrator sample was assigned to a value of 1.0. A value of <1.0 indicates transcriptional
downregulation (inhibition of gene expression) relative to the calibrator. Amplification of
specific transcripts was further confirmed by obtaining melting curve profiles. All
samples were run in duplicate (6).
5.1.1.6. Glucose Production Assay
109
H4IIE rat hepatoma cells were treated with Dex-cAMP in the presence or absence of 10
nM insulin (Sigma) or plant extracts, subfractions and isolated compounds for 5 hrs at 37
°C. Cells were incubated for an additional 3 hrs in glucose production buffer (glucose-
free Dulbecco’s modified essential medium, pH 7.4, containing 20 mM sodium lactate
and 2 nM sodium pyruvate without phenol red) with dexamethasone and 0.1 mM 8-CPT-
cAMP in the presence or absence of 10 nM insulin or test compounds at 100 µg/mL or 20
µM. At the end of this incubation, 0.5 mL of medium was taken to measure the glucose
concentration of the culture medium using the Amplex Red glucose assay kit
(Invitrogen). Corrections for cell number were made on the basis of the protein
concentration measured by the Bradford method.
5.1.2. Animal Experiments
All animal experiments were performed according to procedures approved by the Rutgers
Institutional Animal Care and Use Committee (protocol #04-023). Ten-week-old male
C57BL/6J mice were purchased from the Jackson Laboratory (Bar Harbor, ME) and
maintained on a high-fat diet containing 60% fat-derived calories (D12492, Research
Diets, New Brunswick, NJ) with 12 hr light and dark cycles. The animals were
randomized into 4 groups of 10 animals each. The control group was gavaged daily with
the vehicle solution alone (5% DMSO) and three treatment groups were gavaged with
200 mg/kg of the appropriate treatment: crude extract, EtOAc fraction, and nBuOH
fraction. To monitor body weight, the animals were weighed weekly for the duration of
the experiment, week 0 through week 7. Plasma glucose levels were measured at week 0
and 4 in sub-mandibular vein blood samples using a glucometer (Accu-Chek Advantage,

110
Roche Diagnostics, Indianapolis, IN). A six hr fast was necessary to allow blood glucose
concentrations to arrive at the basal level, plasma glucose concentrations were measured
immediately before and 3 and 6 hr following the treatments of metformin, L, LE or LB
fractions. This fasting glucose level was repeated at week 6 for each group to measure the
full effect of the kinkéliba treatment on basal glucose levels. At week 7, an oral glucose
tolerance test (OGTT) was performed. For OGTT, the mice were fasted overnight (16
hrs) and gavaged with 2 g/kg glucose solution. Glucose levels were measured using a
glucometer at 0, 40, 80, and 130 min after glucose administration.
At the end of the study, mice were dosed with treatment solutions four hours before they
were euthanized. Liver and visceral fats were removed and weighed. The adipose tissue
weights were normalized to final body weight as g/100g body weight. A section of the
liver was collected and stored at -80 °C until used; total RNA was extracted from the
livers using Trizol reagent (Invitrogen), following the manufacturer’s instructions. The
RNA was treated with DnaseI (Invitrogen), following the manufacturer’s guidelines, to
remove any traces of DNA contamination. The cDNAs were synthesized with 2.5 µg of
RNA for each sample, using Stratascript reverse transcriptase (Stratagene), following the
manufacturer’s protocol. The synthesized cDNAs were treated as samples from the cell
culture for quantitative PCR to determine the expression of PEPCK in the treated animals
versus the control.
5.2. Results
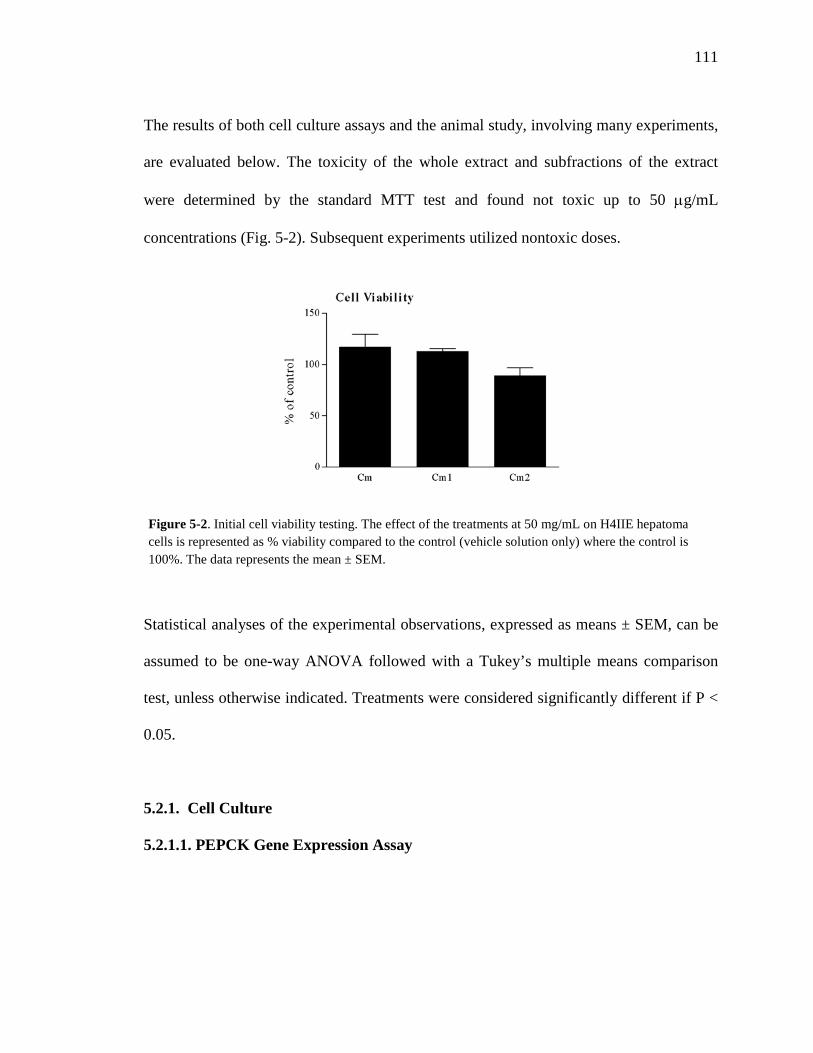
111
The results of both cell culture assays and the animal study, involving many experiments,
are evaluated below. The toxicity of the whole extract and subfractions of the extract
were determined by the standard MTT test and found not toxic up to 50 µg/mL
concentrations (Fig. 5-2). Subsequent experiments utilized nontoxic doses.
Statistical analyses of the experimental observations, expressed as means ± SEM, can be
assumed to be one-way ANOVA followed with a Tukey’s multiple means comparison
test, unless otherwise indicated. Treatments were considered significantly different if P <
0.05.
5.2.1. Cell Culture
5.2.1.1. PEPCK Gene Expression Assay
Figure 5-2. Initial cell viability testing. The effect of the treatments at 50 mg/mL on H4IIE hepatoma cells is represented as % viability compared to the control (vehicle solution only) where the control is 100%. The data represents the mean ± SEM.
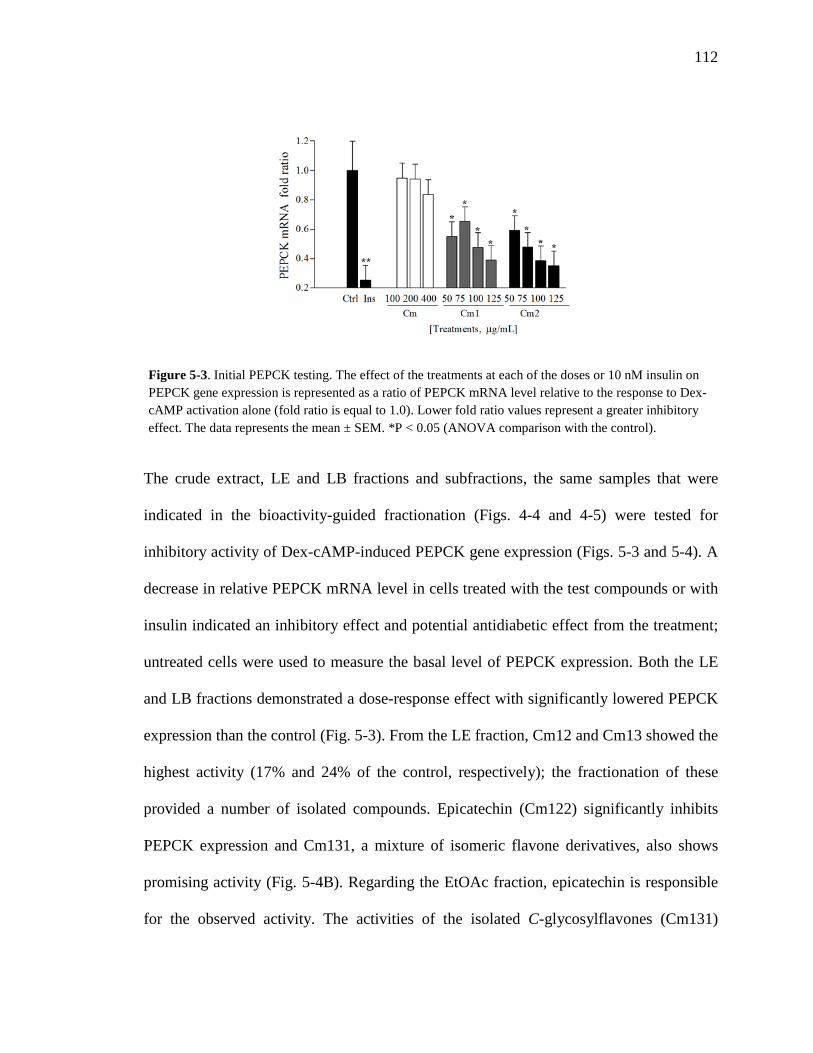
112
The crude extract, LE and LB fractions and subfractions, the same samples that were
indicated in the bioactivity-guided fractionation (Figs. 4-4 and 4-5) were tested for
inhibitory activity of Dex-cAMP-induced PEPCK gene expression (Figs. 5-3 and 5-4). A
decrease in relative PEPCK mRNA level in cells treated with the test compounds or with
insulin indicated an inhibitory effect and potential antidiabetic effect from the treatment;
untreated cells were used to measure the basal level of PEPCK expression. Both the LE
and LB fractions demonstrated a dose-response effect with significantly lowered PEPCK
expression than the control (Fig. 5-3). From the LE fraction, Cm12 and Cm13 showed the
highest activity (17% and 24% of the control, respectively); the fractionation of these
provided a number of isolated compounds. Epicatechin (Cm122) significantly inhibits
PEPCK expression and Cm131, a mixture of isomeric flavone derivatives, also shows
promising activity (Fig. 5-4B). Regarding the EtOAc fraction, epicatechin is responsible
for the observed activity. The activities of the isolated C-glycosylflavones (Cm131)
Figure 5-3. Initial PEPCK testing. The effect of the treatments at each of the doses or 10 nM insulin on PEPCK gene expression is represented as a ratio of PEPCK mRNA level relative to the response to Dex-cAMP activation alone (fold ratio is equal to 1.0). Lower fold ratio values represent a greater inhibitory effect. The data represents the mean ± SEM. *P < 0.05 (ANOVA comparison with the control).
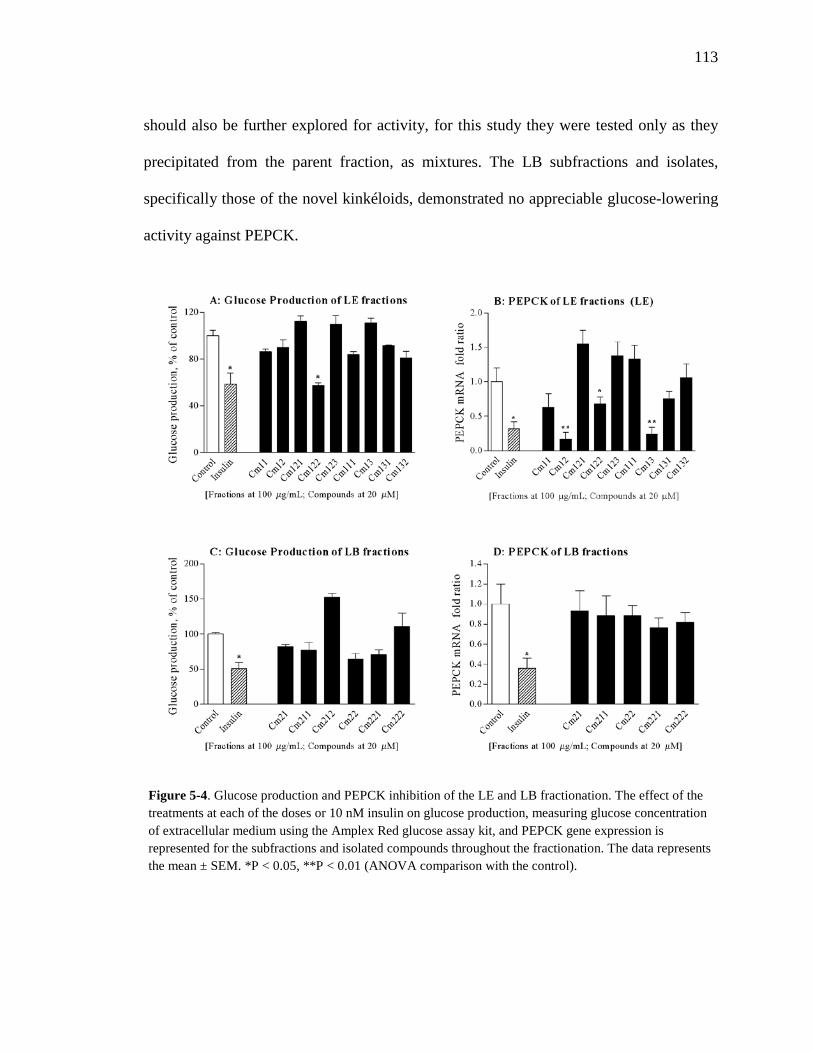
113
should also be further explored for activity, for this study they were tested only as they
precipitated from the parent fraction, as mixtures. The LB subfractions and isolates,
specifically those of the novel kinkéloids, demonstrated no appreciable glucose-lowering
activity against PEPCK.
Figure 5-4. Glucose production and PEPCK inhibition of the LE and LB fractionation. The effect of the treatments at each of the doses or 10 nM insulin on glucose production, measuring glucose concentration of extracellular medium using the Amplex Red glucose assay kit, and PEPCK gene expression is represented for the subfractions and isolated compounds throughout the fractionation. The data represents the mean ± SEM. *P < 0.05, **P < 0.01 (ANOVA comparison with the control).
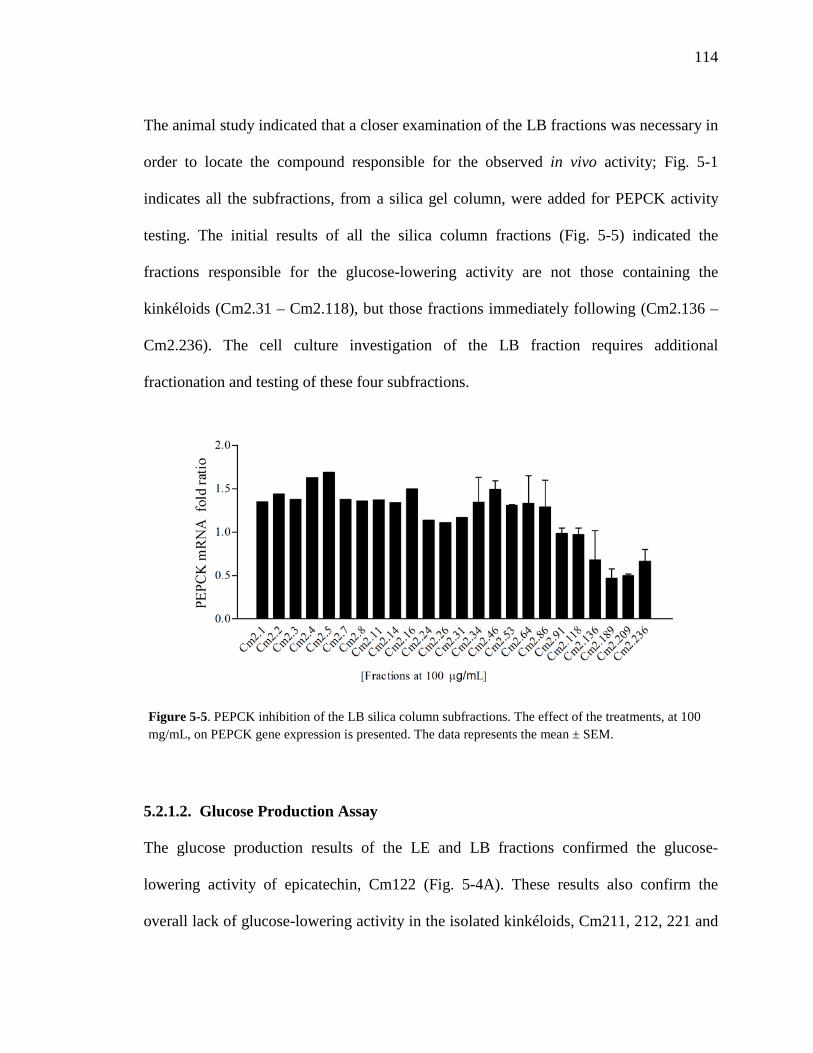
114
The animal study indicated that a closer examination of the LB fractions was necessary in
order to locate the compound responsible for the observed in vivo activity; Fig. 5-1
indicates all the subfractions, from a silica gel column, were added for PEPCK activity
testing. The initial results of all the silica column fractions (Fig. 5-5) indicated the
fractions responsible for the glucose-lowering activity are not those containing the
kinkéloids (Cm2.31 – Cm2.118), but those fractions immediately following (Cm2.136 –
Cm2.236). The cell culture investigation of the LB fraction requires additional
fractionation and testing of these four subfractions.
5.2.1.2. Glucose Production Assay
The glucose production results of the LE and LB fractions confirmed the glucose-
lowering activity of epicatechin, Cm122 (Fig. 5-4A). These results also confirm the
overall lack of glucose-lowering activity in the isolated kinkéloids, Cm211, 212, 221 and
Figure 5-5. PEPCK inhibition of the LB silica column subfractions. The effect of the treatments, at 100 mg/mL, on PEPCK gene expression is presented. The data represents the mean ± SEM.
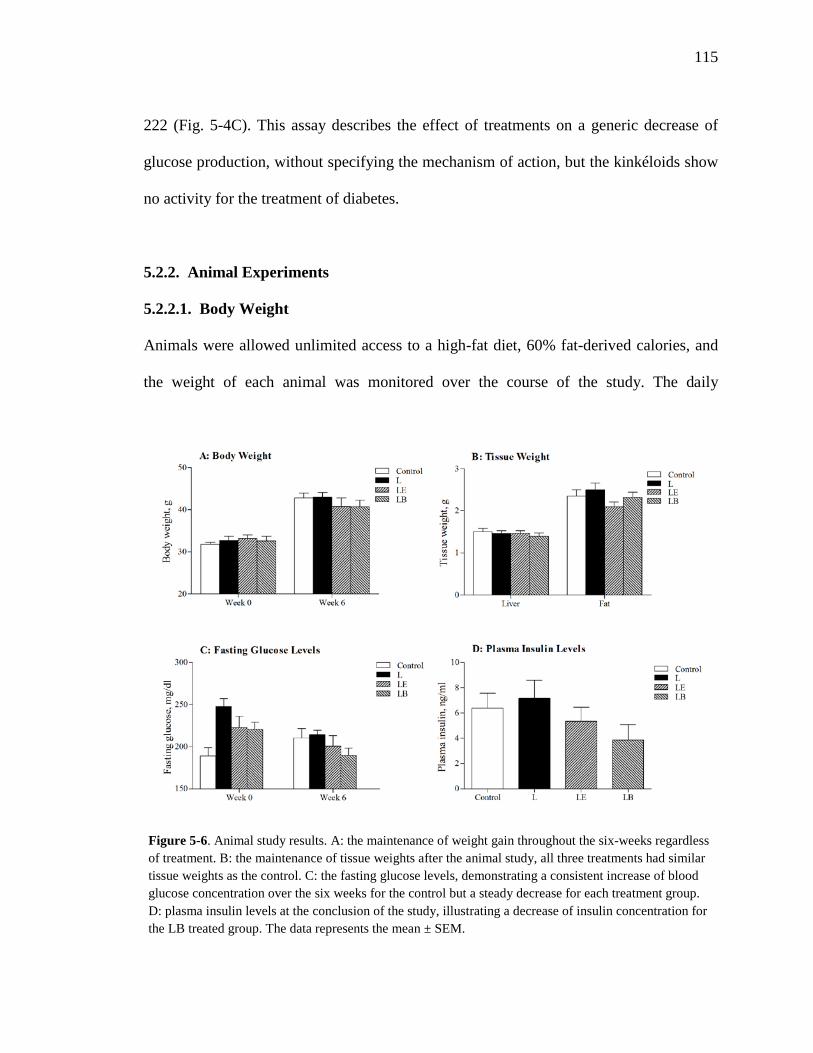
115
222 (Fig. 5-4C). This assay describes the effect of treatments on a generic decrease of
glucose production, without specifying the mechanism of action, but the kinkéloids show
no activity for the treatment of diabetes.
5.2.2. Animal Experiments
5.2.2.1. Body Weight
Animals were allowed unlimited access to a high-fat diet, 60% fat-derived calories, and
the weight of each animal was monitored over the course of the study. The daily
Figure 5-6. Animal study results. A: the maintenance of weight gain throughout the six-weeks regardless of treatment. B: the maintenance of tissue weights after the animal study, all three treatments had similar tissue weights as the control. C: the fasting glucose levels, demonstrating a consistent increase of blood glucose concentration over the six weeks for the control but a steady decrease for each treatment group. D: plasma insulin levels at the conclusion of the study, illustrating a decrease of insulin concentration for the LB treated group. The data represents the mean ± SEM.
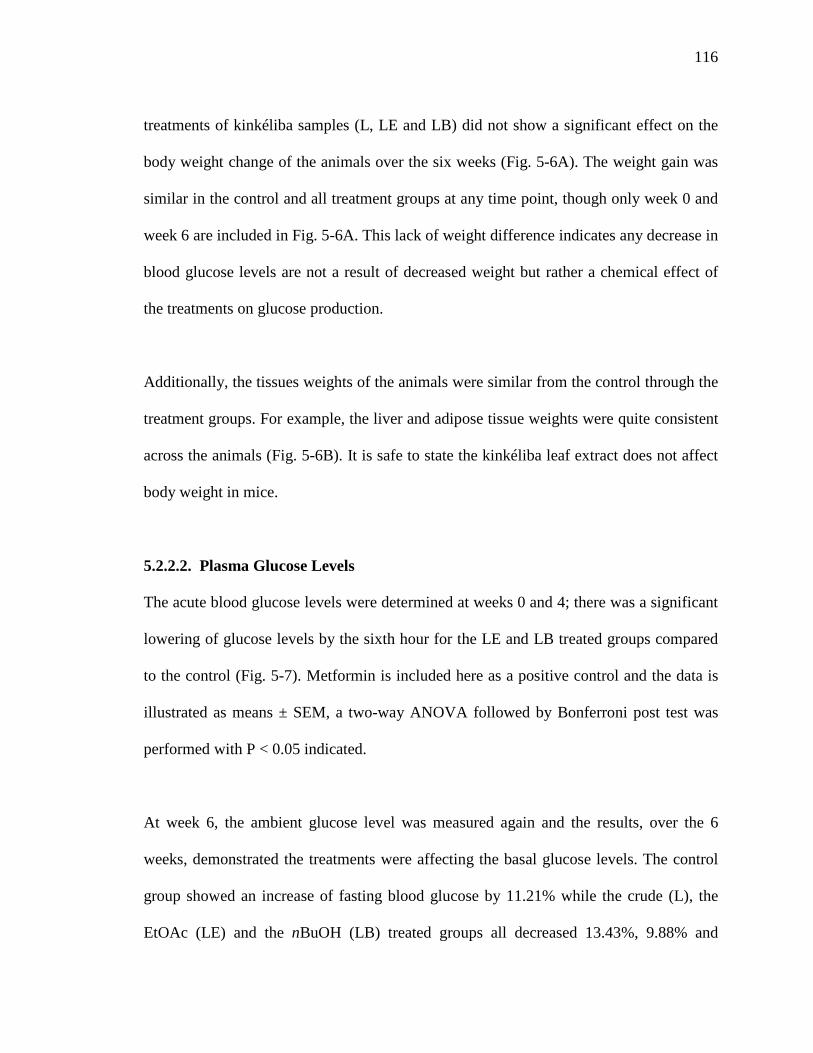
116
treatments of kinkéliba samples (L, LE and LB) did not show a significant effect on the
body weight change of the animals over the six weeks (Fig. 5-6A). The weight gain was
similar in the control and all treatment groups at any time point, though only week 0 and
week 6 are included in Fig. 5-6A. This lack of weight difference indicates any decrease in
blood glucose levels are not a result of decreased weight but rather a chemical effect of
the treatments on glucose production.
Additionally, the tissues weights of the animals were similar from the control through the
treatment groups. For example, the liver and adipose tissue weights were quite consistent
across the animals (Fig. 5-6B). It is safe to state the kinkéliba leaf extract does not affect
body weight in mice.
5.2.2.2. Plasma Glucose Levels
The acute blood glucose levels were determined at weeks 0 and 4; there was a significant
lowering of glucose levels by the sixth hour for the LE and LB treated groups compared
to the control (Fig. 5-7). Metformin is included here as a positive control and the data is
illustrated as means ± SEM, a two-way ANOVA followed by Bonferroni post test was
performed with P < 0.05 indicated.
At week 6, the ambient glucose level was measured again and the results, over the 6
weeks, demonstrated the treatments were affecting the basal glucose levels. The control
group showed an increase of fasting blood glucose by 11.21% while the crude (L), the
EtOAc (LE) and the nBuOH (LB) treated groups all decreased 13.43%, 9.88% and
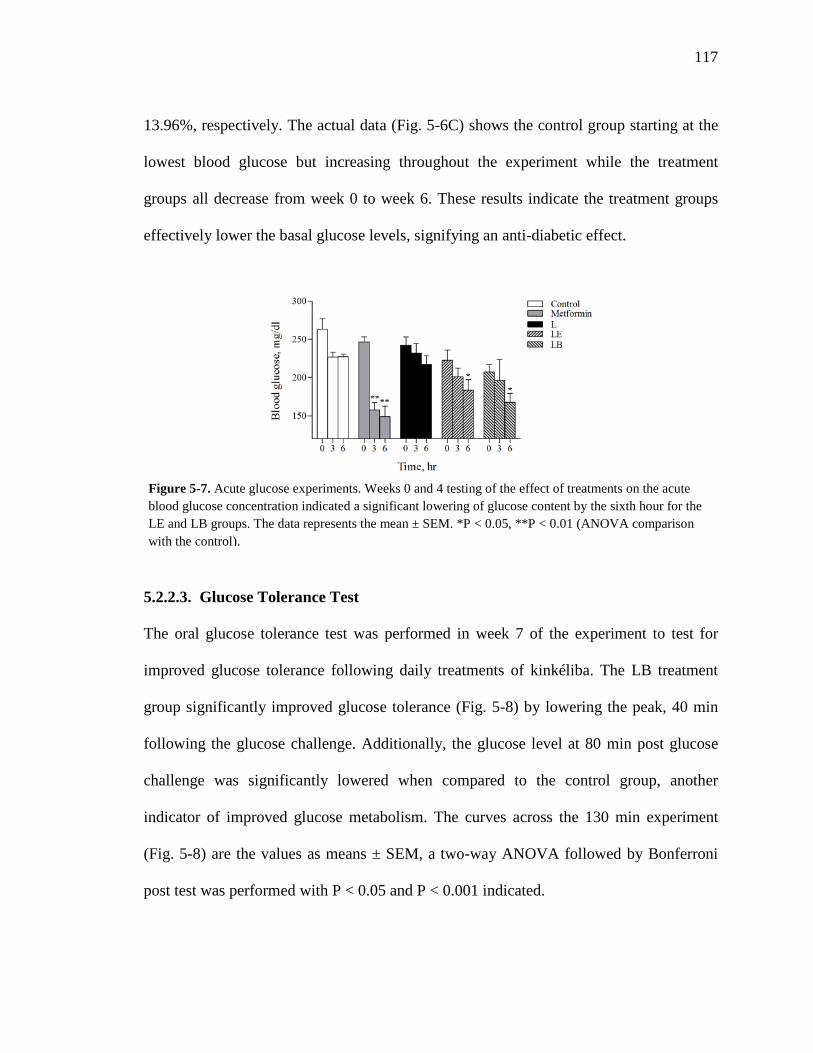
117
13.96%, respectively. The actual data (Fig. 5-6C) shows the control group starting at the
lowest blood glucose but increasing throughout the experiment while the treatment
groups all decrease from week 0 to week 6. These results indicate the treatment groups
effectively lower the basal glucose levels, signifying an anti-diabetic effect.
5.2.2.3. Glucose Tolerance Test
The oral glucose tolerance test was performed in week 7 of the experiment to test for
improved glucose tolerance following daily treatments of kinkéliba. The LB treatment
group significantly improved glucose tolerance (Fig. 5-8) by lowering the peak, 40 min
following the glucose challenge. Additionally, the glucose level at 80 min post glucose
challenge was significantly lowered when compared to the control group, another
indicator of improved glucose metabolism. The curves across the 130 min experiment
(Fig. 5-8) are the values as means ± SEM, a two-way ANOVA followed by Bonferroni
post test was performed with P < 0.05 and P < 0.001 indicated.
Figure 5-7. Acute glucose experiments. Weeks 0 and 4 testing of the effect of treatments on the acute blood glucose concentration indicated a significant lowering of glucose content by the sixth hour for the LE and LB groups. The data represents the mean ± SEM. *P < 0.05, **P < 0.01 (ANOVA comparison with the control).
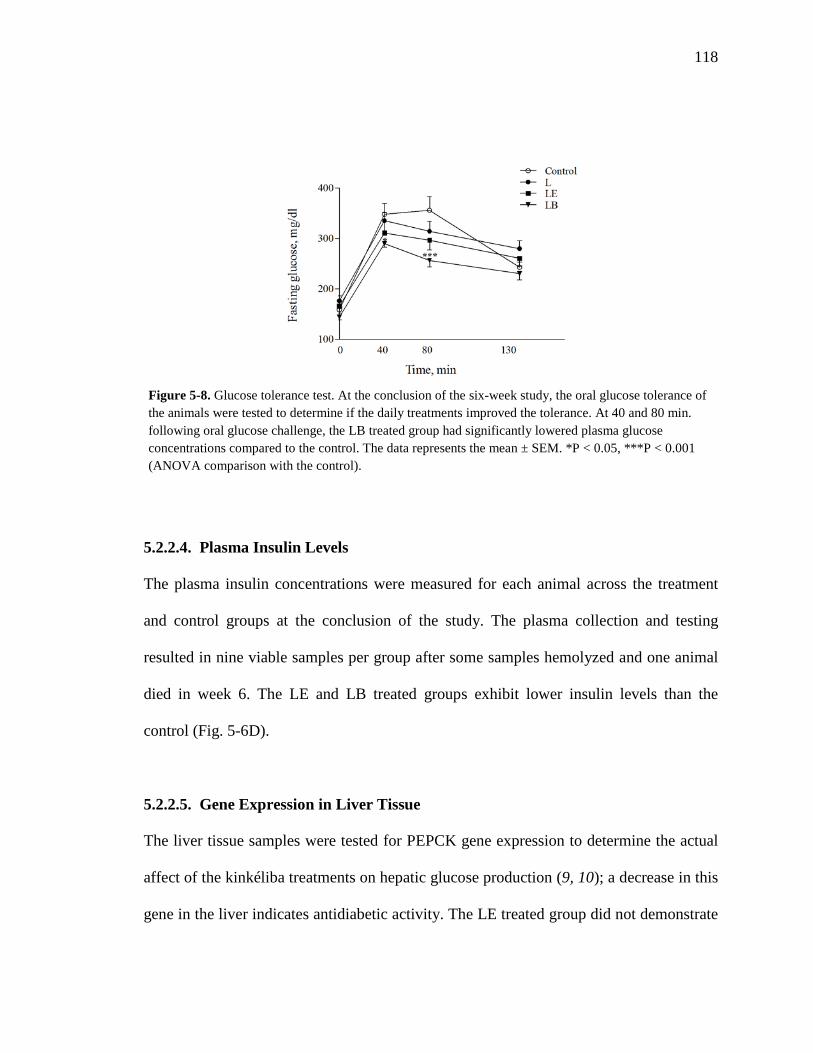
118
5.2.2.4. Plasma Insulin Levels
The plasma insulin concentrations were measured for each animal across the treatment
and control groups at the conclusion of the study. The plasma collection and testing
resulted in nine viable samples per group after some samples hemolyzed and one animal
died in week 6. The LE and LB treated groups exhibit lower insulin levels than the
control (Fig. 5-6D).
5.2.2.5. Gene Expression in Liver Tissue
The liver tissue samples were tested for PEPCK gene expression to determine the actual
affect of the kinkéliba treatments on hepatic glucose production (9, 10); a decrease in this
gene in the liver indicates antidiabetic activity. The LE treated group did not demonstrate
Figure 5-8. Glucose tolerance test. At the conclusion of the six-week study, the oral glucose tolerance of the animals were tested to determine if the daily treatments improved the tolerance. At 40 and 80 min. following oral glucose challenge, the LB treated group had significantly lowered plasma glucose concentrations compared to the control. The data represents the mean ± SEM. *P < 0.05, ***P < 0.001 (ANOVA comparison with the control).
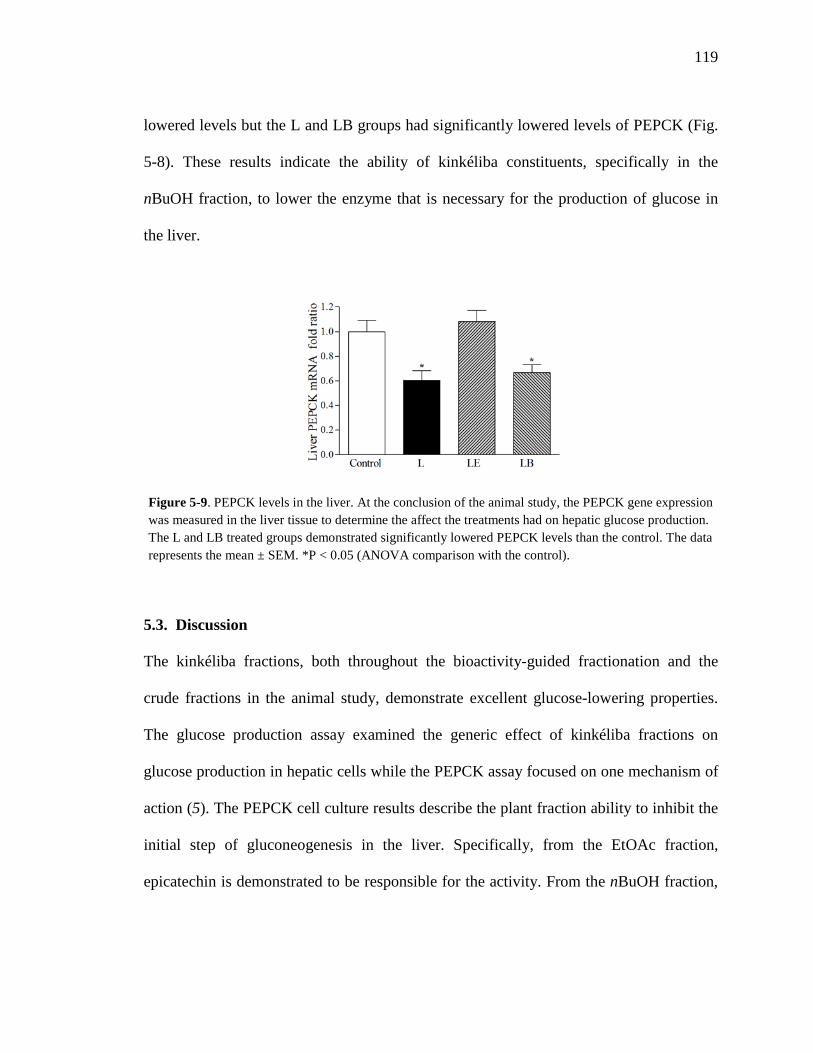
119
lowered levels but the L and LB groups had significantly lowered levels of PEPCK (Fig.
5-8). These results indicate the ability of kinkéliba constituents, specifically in the
nBuOH fraction, to lower the enzyme that is necessary for the production of glucose in
the liver.
5.3. Discussion
The kinkéliba fractions, both throughout the bioactivity-guided fractionation and the
crude fractions in the animal study, demonstrate excellent glucose-lowering properties.
The glucose production assay examined the generic effect of kinkéliba fractions on
glucose production in hepatic cells while the PEPCK assay focused on one mechanism of
action (5). The PEPCK cell culture results describe the plant fraction ability to inhibit the
initial step of gluconeogenesis in the liver. Specifically, from the EtOAc fraction,
epicatechin is demonstrated to be responsible for the activity. From the nBuOH fraction,
Figure 5-9. PEPCK levels in the liver. At the conclusion of the animal study, the PEPCK gene expression was measured in the liver tissue to determine the affect the treatments had on hepatic glucose production. The L and LB treated groups demonstrated significantly lowered PEPCK levels than the control. The data represents the mean ± SEM. *P < 0.05 (ANOVA comparison with the control).
120
the compound(s) responsible for the activity have not yet been determined, but the newly
discovered kinkéloids are not responsible.
The animal study, most convincingly, illustrated the effect the kinkéliba leaf extract had
on glucose and insulin levels in the animals. While not affecting the body weight, the six-
week study demonstrated the crude kinkéliba extract and subsequent LE and LB fractions
lower the fasting blood glucose levels, increase the glucose tolerance, lower the plasma
insulin levels and lower the PEPCK gene expression in the liver tissue. All these results
point to noteworthy in vivo anti-diabetic activity. This is the first report of glucose-
lowering activity by C. micranthum and should be explored in further detail.
121
5.4. References
1. WHO, Diabetes Fact Sheet. In 2008. 2. Dembinska-Kiec, A.; Mykkanen, O.; Kiec-Wilk, B.; Mykkanen, H., Antioxidant phytochemicals against type 2 diabetes. The British Journal of Nutrition 2008, 99, ES109-ES117. 3. Sutherland, C.; O'Brien, R. M.; Granner, D. K., New connections in the regulation of PEPCK gene expression by insulin. Philosophical Transactions of the Royal Society of London. Series B: Biological Sciences 1996, 351, (1336), 191-199. 4. Hanson, R. W.; Reshef, L., Regulation of phosphoenolpyruvate carboxykinase (GTP) gene expression. Annual Review of Biochemistry 1997, 66, 581-611. 5. Quinn, P. G.; Yeagley, D., Insulin regulation of PEPCK gene expression: a model for rapid and reversible modulation. Current Drug Targets - Immune, Endocrine & Metabolic Disorders 2005, 5, (4), 423-437. 6. Govorko, D.; Logendra, S.; Wang, Y.; Esposito, D.; Komarnytsky, S.; Ribnicky, D.; Poulev, A.; Wang, Z.; Cefalu, W. T.; Raskin, I., Polyphenolic compounds from Artemisia dranunculus L. inhibit PEPCK gene expression and gluconeogenesis in an H4IIE hepatoma cell line. American Journal of Physiology - Endocrinology and Metabolism 2007, 293, E1503-E1510. 7. Collins, S.; Martin, T. L.; Surwit, R. S.; Robidoux, J., Genetic vulnerability to diet-induced obesity in the C57BL/6J mouse: physiological and molecular characteristics. Physiology & Behavior 2004, 81, 243-248. 8. Favari, E.; Bernardini, E.; Bernini, F.; Mazza, P.; Zani, F., Cellular toxicity of N-substituted 2,2'-dicarboxamidodiphenyldisulphides with high antimicrobial activity. Pharmacological Research 1999, 40, (5), 429-434. 9. Ramadoss, P.; Unger-Smith, N. E.; Lam, F. S.; Hollenberg, A. N., STAT3 targets the regulatory regions of gluconeogenic genes in vivo. Molecular Endocrinology 2009, 23, (6), 827-837. 10. Kim, J. H.; Bachmann, R. A.; Chen, J., Interleukin-6 and insulin resistance. Vitamins and Hormones 2009, 80, 613-633.
122
Chapter 6. Chemical Profiling of Senegalese Kinkéliba Populations and
Plant Tissues
123
As a member of the Combretaceae family, kinkéliba (Combretum micranthum) is found
throughout sub-Saharan Africa as an undomesticated shrub species, specifically in the
Tiger Bush regions of Senegal, Mali, and Burkina Faso. Kinkéliba is used in most parts
of Senegal and surrounding regions such as Gambia, Mali and Burkina Faso for
medicinal uses (1-3). Additionally, kinkéliba is used as a local ‘bush tea’ in which the
leaves are collected from the wild, dried and used year round as a stimulating beverage
(5). As an herbal tea or ‘infusion’, the different populations of this Senegalese plant and
of this species (C. micranthum) are known to vary in their degree of bitterness and thus
palatability (personal communication between Dr. Simon and Dr. Bassene). As we
hypothesized the presence of alkaloids were at least partially responsible for the
bitterness, we collected different populations to ascertain the phytochemical differences
between the different collection areas. Initial chromatographic profiling of the alkaloids
showed differentiation between locations of the shrub even within Senegal. Different
sources (or populations/collections) of this species (Table 6-1) were compared for the
concentration of the flavan alkaloids (14 – 17 from Fig 6-1), because these natural
products are among the major secondary plant products found in kinkéliba leaves.
Alkaloids often impart a bitter taste; therefore, the varying concentration of alkaloids will
most likely have an effect on the overall taste or likeability of the brewed tea.
Additionally, it is known that in most species, including other Combretum spp., other
plant tissues may contain the same or different bioactives. Thus, for this foundational
work, we sought to examine other plant tissues of this species for the content of
kinkéloids as well as epigallocatechin and epicatechin (1 and 2 from Fig. 6-1) because
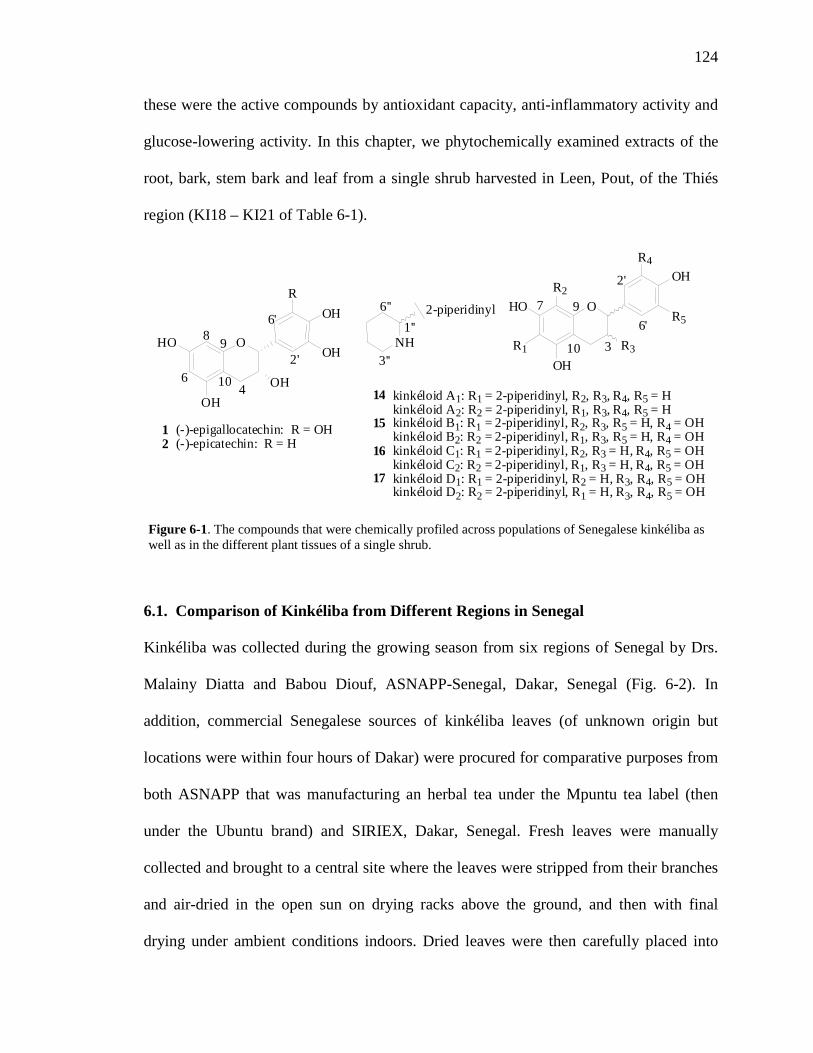
124
these were the active compounds by antioxidant capacity, anti-inflammatory activity and
glucose-lowering activity. In this chapter, we phytochemically examined extracts of the
root, bark, stem bark and leaf from a single shrub harvested in Leen, Pout, of the Thiés
region (KI18 – KI21 of Table 6-1).
6.1. Comparison of Kinkéliba from Different Regions in Senegal
Kinkéliba was collected during the growing season from six regions of Senegal by Drs.
Malainy Diatta and Babou Diouf, ASNAPP-Senegal, Dakar, Senegal (Fig. 6-2). In
addition, commercial Senegalese sources of kinkéliba leaves (of unknown origin but
locations were within four hours of Dakar) were procured for comparative purposes from
both ASNAPP that was manufacturing an herbal tea under the Mpuntu tea label (then
under the Ubuntu brand) and SIRIEX, Dakar, Senegal. Fresh leaves were manually
collected and brought to a central site where the leaves were stripped from their branches
and air-dried in the open sun on drying racks above the ground, and then with final
drying under ambient conditions indoors. Dried leaves were then carefully placed into
Figure 6-1. The compounds that were chemically profiled across populations of Senegalese kinkéliba as well as in the different plant tissues of a single shrub.
O H O
O H
O H
O H O H
R
4 6
8 9
1 0 2 '
6 '
1 ( - ) - e p i g a l l o c a t e c h i n : R = O H 2 ( - ) - e p i c a t e c h i n : R = H
3 1 0
9 2 '
6 '
1 4 k i n k é l o i d A 1 : R 1 = 2 - p i p e r i d i n y l , R 2 , R 3 , R 4 , R 5 = H k i n k é l o i d A 2 : R 2 = 2 - p i p e r i d i n y l , R 1 , R 3 , R 4 , R 5 = H
1 5 k i n k é l o i d B 1 : R 1 = 2 - p i p e r i d i n y l , R 2 , R 3 , R 5 = H , R 4 = O H k i n k é l o i d B 2 : R 2 = 2 - p i p e r i d i n y l , R 1 , R 3 , R 5 = H , R 4 = O H
1 6 k i n k é l o i d C 1 : R 1 = 2 - p i p e r i d i n y l , R 2 , R 3 = H , R 4 , R 5 = O H k i n k é l o i d C 2 : R 2 = 2 - p i p e r i d i n y l , R 1 , R 3 = H , R 4 , R 5 = O H
1 7 k i n k é l o i d D 1 : R 1 = 2 - p i p e r i d i n y l , R 2 = H , R 3 , R 4 , R 5 = O H k i n k é l o i d D 2 : R 2 = 2 - p i p e r i d i n y l , R 1 = H , R 3 , R 4 , R 5 = O H
O H O
O H
R 5
O H N H R 3
R 4
6 ' '
3 ' '
7 1 ' '
2 - p i p e r i d i n y l
R 1
R 2
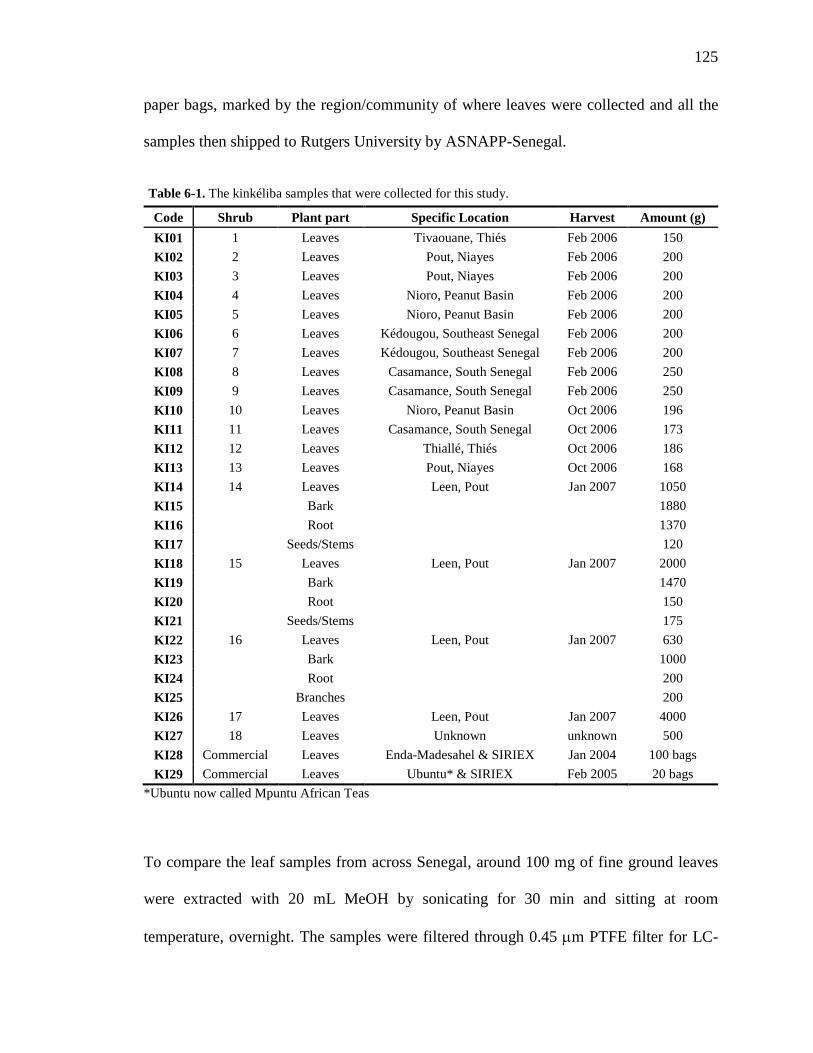
125
paper bags, marked by the region/community of where leaves were collected and all the
samples then shipped to Rutgers University by ASNAPP-Senegal.
Code Shrub Plant part Specific Location Harvest Amount (g) KI01 1 Leaves Tivaouane, Thiés Feb 2006 150 KI02 2 Leaves Pout, Niayes Feb 2006 200 KI03 3 Leaves Pout, Niayes Feb 2006 200 KI04 4 Leaves Nioro, Peanut Basin Feb 2006 200 KI05 5 Leaves Nioro, Peanut Basin Feb 2006 200 KI06 6 Leaves Kédougou, Southeast Senegal Feb 2006 200 KI07 7 Leaves Kédougou, Southeast Senegal Feb 2006 200 KI08 8 Leaves Casamance, South Senegal Feb 2006 250 KI09 9 Leaves Casamance, South Senegal Feb 2006 250 KI10 10 Leaves Nioro, Peanut Basin Oct 2006 196 KI11 11 Leaves Casamance, South Senegal Oct 2006 173 KI12 12 Leaves Thiallé, Thiés Oct 2006 186 KI13 13 Leaves Pout, Niayes Oct 2006 168 KI14 14 Leaves Leen, Pout Jan 2007 1050 KI15 Bark 1880 KI16 Root 1370 KI17 Seeds/Stems 120 KI18 15 Leaves Leen, Pout Jan 2007 2000 KI19 Bark 1470 KI20 Root 150 KI21 Seeds/Stems 175 KI22 16 Leaves Leen, Pout Jan 2007 630 KI23 Bark 1000 KI24 Root 200 KI25 Branches 200 KI26 17 Leaves Leen, Pout Jan 2007 4000 KI27 18 Leaves Unknown unknown 500 KI28 Commercial Leaves Enda-Madesahel & SIRIEX Jan 2004 100 bags KI29 Commercial Leaves Ubuntu* & SIRIEX Feb 2005 20 bags
*Ubuntu now called Mpuntu African Teas
To compare the leaf samples from across Senegal, around 100 mg of fine ground leaves
were extracted with 20 mL MeOH by sonicating for 30 min and sitting at room
temperature, overnight. The samples were filtered through 0.45 µm PTFE filter for LC-
Table 6-1. The kinkéliba samples that were collected for this study.
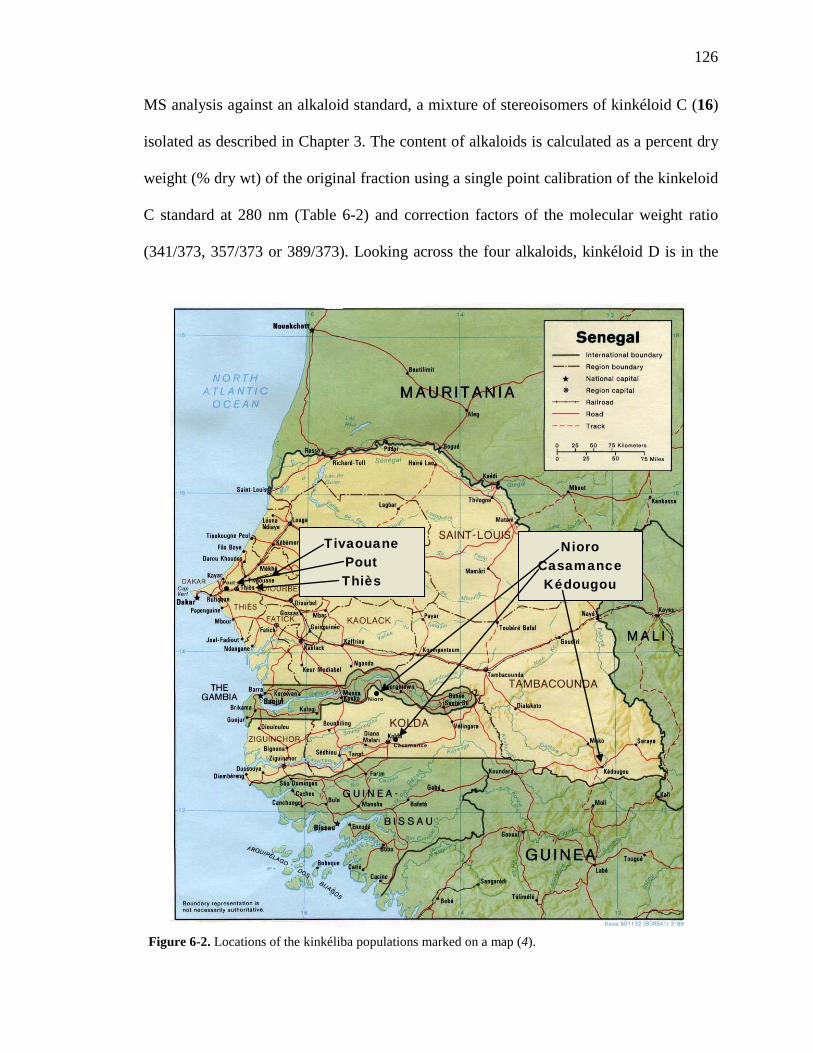
126
MS analysis against an alkaloid standard, a mixture of stereoisomers of kinkéloid C (16)
isolated as described in Chapter 3. The content of alkaloids is calculated as a percent dry
weight (% dry wt) of the original fraction using a single point calibration of the kinkeloid
C standard at 280 nm (Table 6-2) and correction factors of the molecular weight ratio
(341/373, 357/373 or 389/373). Looking across the four alkaloids, kinkéloid D is in the
Pout
Nioro
Casamance
Tivaouane Pout Thiès
Nioro Casamance Kédougou
Figure 6-2. Locations of the kinkéliba populations marked on a map (4).
127
lowest content at an average of 0.14%, next is A at 0.19%, C at 0.49%, and B, the
alkaloid in highest content, at 2.14% dry wt of the leaves. The variation of alkaloid
content seems fairly consistent at approximately 8% to 16% relative standard error across
the 20 leaf samples. Additionally, the total percent alkaloids (by dry plant weight) for
each collection were compared according to the regions the leaves were collected. The
total amount of alkaloids averaged around 2.96% dry wt with a variation of 7.45%. The
alkaloid content among the populations collected appeared highest in the most southern
regions of Senegal, with the three collections from Casamance giving totals of 5.48%,
4.17%, and 3.81% dry wt. The Peanut Basin area also gave total alkaloid contents above
average at 3.40 to 4.12% dry wt. In contrast, the collections that gave the lowest
concentration of alkaloids were from Kédougou, Tivaouane, and some collections from
the Leen, Pout area that gave concentrations below 2.7% dry wt.
The leaf extracts all gave similar chromatographic profiles and the total ion
chromatograms (TIC) for five representative samples, KI01, KI06, KI11, KI18 and KI28,
can be seen in Fig 6-3. These chromatograms were chosen simply as representative
samples. The scale is the same for the five samples and demonstrates the slightly higher
concentration of alkaloids in KI11. The alkaloids elute between 9.5 and 28.5 min and are
indicated in the chromatograms.
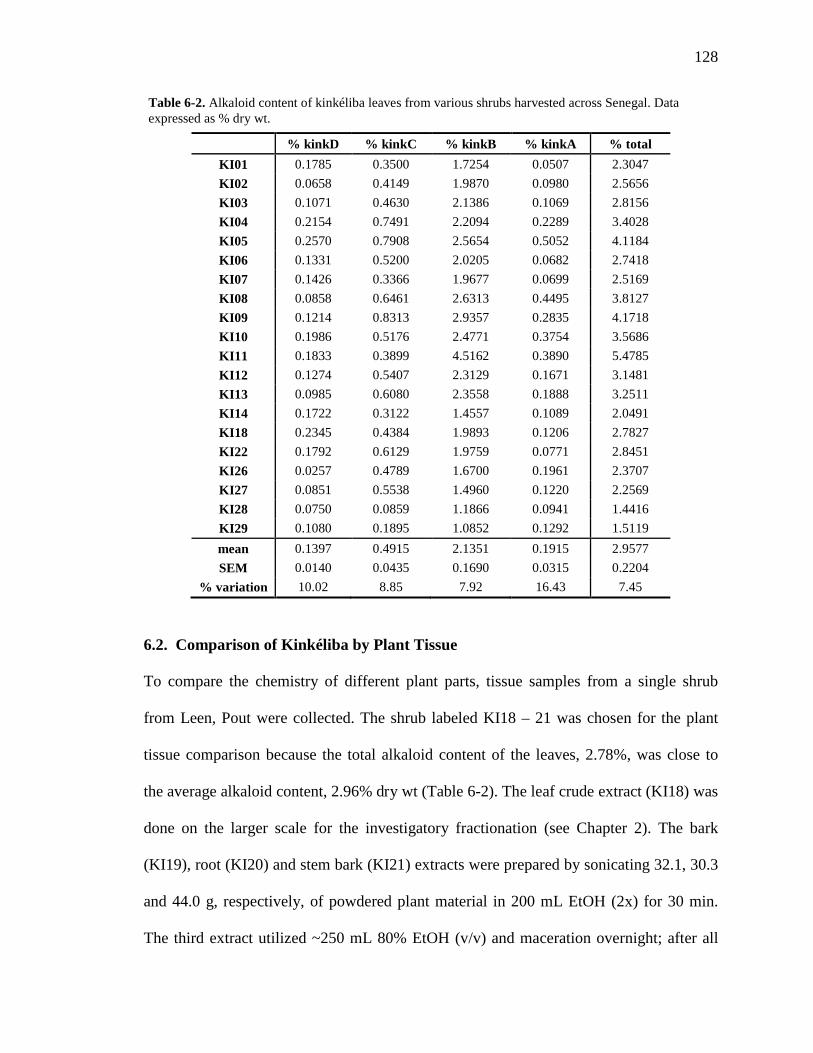
128
% kinkD % kinkC % kinkB % kinkA % total KI01 0.1785 0.3500 1.7254 0.0507 2.3047 KI02 0.0658 0.4149 1.9870 0.0980 2.5656 KI03 0.1071 0.4630 2.1386 0.1069 2.8156 KI04 0.2154 0.7491 2.2094 0.2289 3.4028 KI05 0.2570 0.7908 2.5654 0.5052 4.1184 KI06 0.1331 0.5200 2.0205 0.0682 2.7418 KI07 0.1426 0.3366 1.9677 0.0699 2.5169 KI08 0.0858 0.6461 2.6313 0.4495 3.8127 KI09 0.1214 0.8313 2.9357 0.2835 4.1718 KI10 0.1986 0.5176 2.4771 0.3754 3.5686 KI11 0.1833 0.3899 4.5162 0.3890 5.4785 KI12 0.1274 0.5407 2.3129 0.1671 3.1481 KI13 0.0985 0.6080 2.3558 0.1888 3.2511 KI14 0.1722 0.3122 1.4557 0.1089 2.0491 KI18 0.2345 0.4384 1.9893 0.1206 2.7827 KI22 0.1792 0.6129 1.9759 0.0771 2.8451 KI26 0.0257 0.4789 1.6700 0.1961 2.3707 KI27 0.0851 0.5538 1.4960 0.1220 2.2569 KI28 0.0750 0.0859 1.1866 0.0941 1.4416 KI29 0.1080 0.1895 1.0852 0.1292 1.5119 mean 0.1397 0.4915 2.1351 0.1915 2.9577 SEM 0.0140 0.0435 0.1690 0.0315 0.2204
% variation 10.02 8.85 7.92 16.43 7.45
6.2. Comparison of Kinkéliba by Plant Tissue
To compare the chemistry of different plant parts, tissue samples from a single shrub
from Leen, Pout were collected. The shrub labeled KI18 – 21 was chosen for the plant
tissue comparison because the total alkaloid content of the leaves, 2.78%, was close to
the average alkaloid content, 2.96% dry wt (Table 6-2). The leaf crude extract (KI18) was
done on the larger scale for the investigatory fractionation (see Chapter 2). The bark
(KI19), root (KI20) and stem bark (KI21) extracts were prepared by sonicating 32.1, 30.3
and 44.0 g, respectively, of powdered plant material in 200 mL EtOH (2x) for 30 min.
The third extract utilized ~250 mL 80% EtOH (v/v) and maceration overnight; after all
Table 6-2. Alkaloid content of kinkéliba leaves from various shrubs harvested across Senegal. Data expressed as % dry wt.
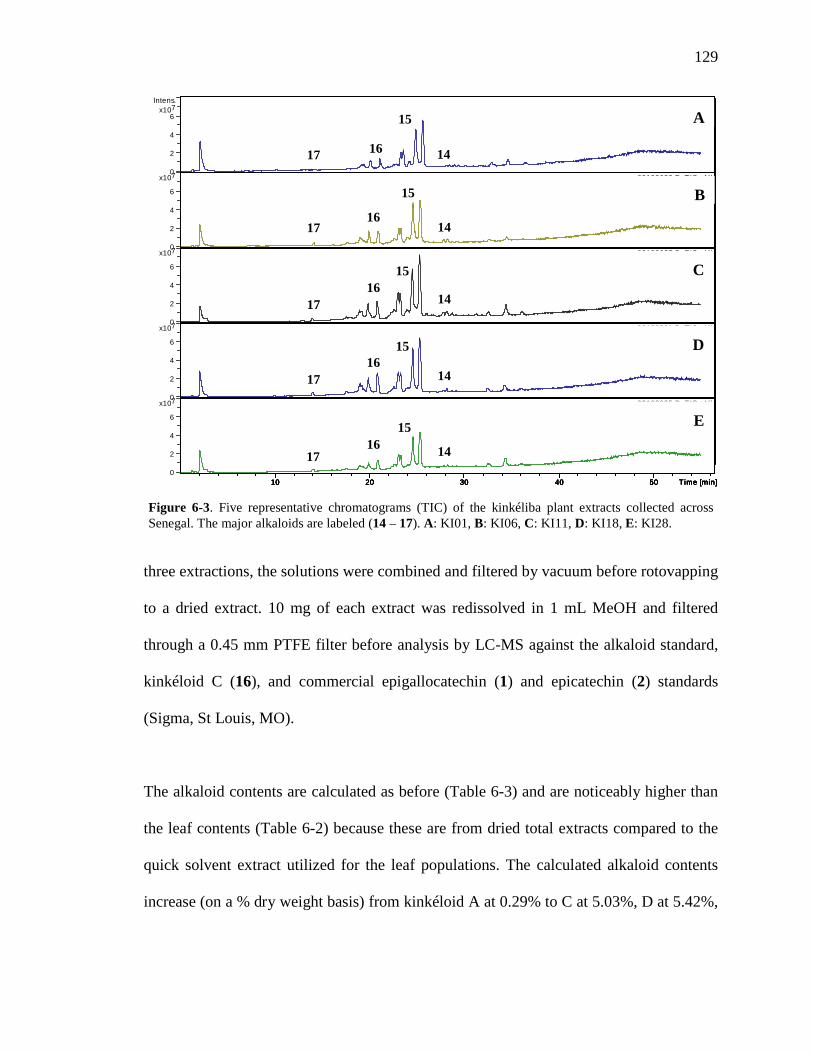
129
three extractions, the solutions were combined and filtered by vacuum before rotovapping
to a dried extract. 10 mg of each extract was redissolved in 1 mL MeOH and filtered
through a 0.45 mm PTFE filter before analysis by LC-MS against the alkaloid standard,
kinkéloid C (16), and commercial epigallocatechin (1) and epicatechin (2) standards
(Sigma, St Louis, MO).
The alkaloid contents are calculated as before (Table 6-3) and are noticeably higher than
the leaf contents (Table 6-2) because these are from dried total extracts compared to the
quick solvent extract utilized for the leaf populations. The calculated alkaloid contents
increase (on a % dry weight basis) from kinkéloid A at 0.29% to C at 5.03%, D at 5.42%,
09102617.D: TIC ±All
0
2
4
67x10
Intens.
10 20 30 40 50 Time [min]
09102622.D: TIC ±All
0
2
4
6
7x10
10 20 30 40 50 Time [min]
09102627.D: TIC ±All
0
2
4
6
7x10
10 20 30 40 50 Time [min]
09102631.D: TIC ±All
0
2
4
6
7x10
10 20 30 40 50 Time [min]
09102635.D: TIC ±All
0
2
4
6
7x10
10 20 30 40 50 Time [min]
Figure 6-3. Five representative chromatograms (TIC) of the kinkéliba plant extracts collected across Senegal. The major alkaloids are labeled (14 – 17). A: KI01, B: KI06, C: KI11, D: KI18, E: KI28.
A
B
C
D
E
14
14
14
14
14
15
15
15
15
15
16
16
16
16
16 17
17
17
17
17
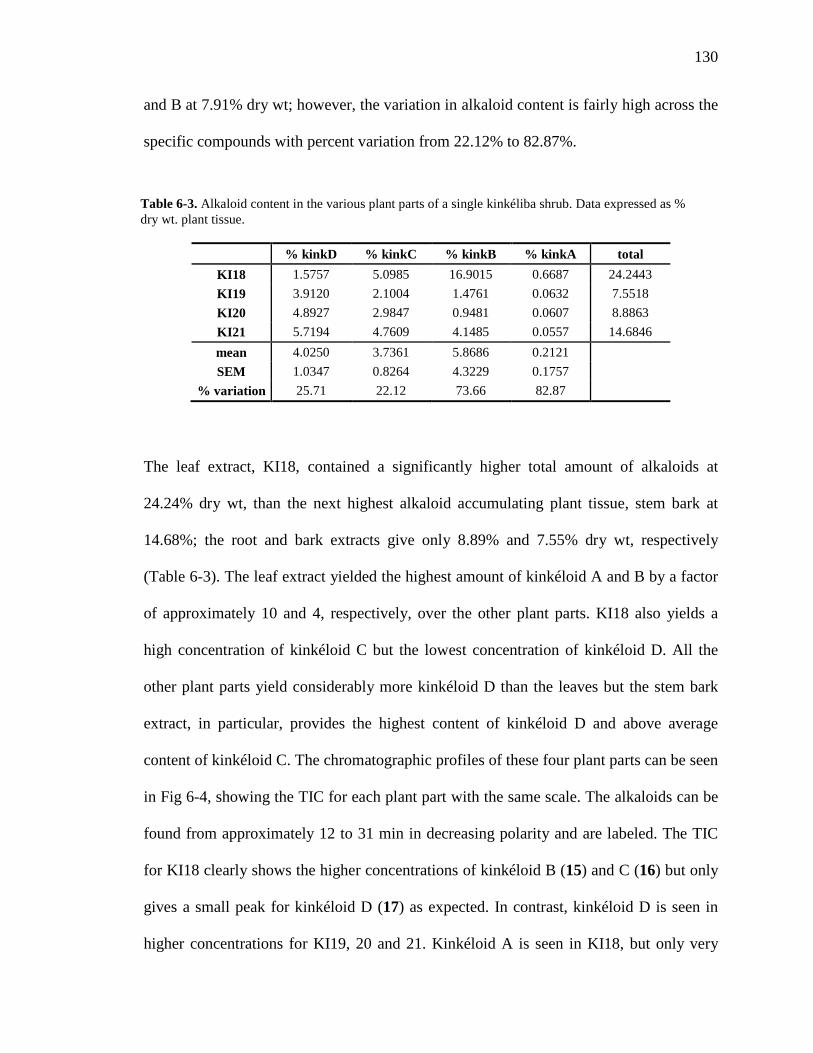
130
and B at 7.91% dry wt; however, the variation in alkaloid content is fairly high across the
specific compounds with percent variation from 22.12% to 82.87%.
% kinkD % kinkC % kinkB % kinkA total KI18 1.5757 5.0985 16.9015 0.6687 24.2443 KI19 3.9120 2.1004 1.4761 0.0632 7.5518 KI20 4.8927 2.9847 0.9481 0.0607 8.8863 KI21 5.7194 4.7609 4.1485 0.0557 14.6846 mean 4.0250 3.7361 5.8686 0.2121 SEM 1.0347 0.8264 4.3229 0.1757
% variation 25.71 22.12 73.66 82.87
The leaf extract, KI18, contained a significantly higher total amount of alkaloids at
24.24% dry wt, than the next highest alkaloid accumulating plant tissue, stem bark at
14.68%; the root and bark extracts give only 8.89% and 7.55% dry wt, respectively
(Table 6-3). The leaf extract yielded the highest amount of kinkéloid A and B by a factor
of approximately 10 and 4, respectively, over the other plant parts. KI18 also yields a
high concentration of kinkéloid C but the lowest concentration of kinkéloid D. All the
other plant parts yield considerably more kinkéloid D than the leaves but the stem bark
extract, in particular, provides the highest content of kinkéloid D and above average
content of kinkéloid C. The chromatographic profiles of these four plant parts can be seen
in Fig 6-4, showing the TIC for each plant part with the same scale. The alkaloids can be
found from approximately 12 to 31 min in decreasing polarity and are labeled. The TIC
for KI18 clearly shows the higher concentrations of kinkéloid B (15) and C (16) but only
gives a small peak for kinkéloid D (17) as expected. In contrast, kinkéloid D is seen in
higher concentrations for KI19, 20 and 21. Kinkéloid A is seen in KI18, but only very
Table 6-3. Alkaloid content in the various plant parts of a single kinkéliba shrub. Data expressed as % dry wt. plant tissue.
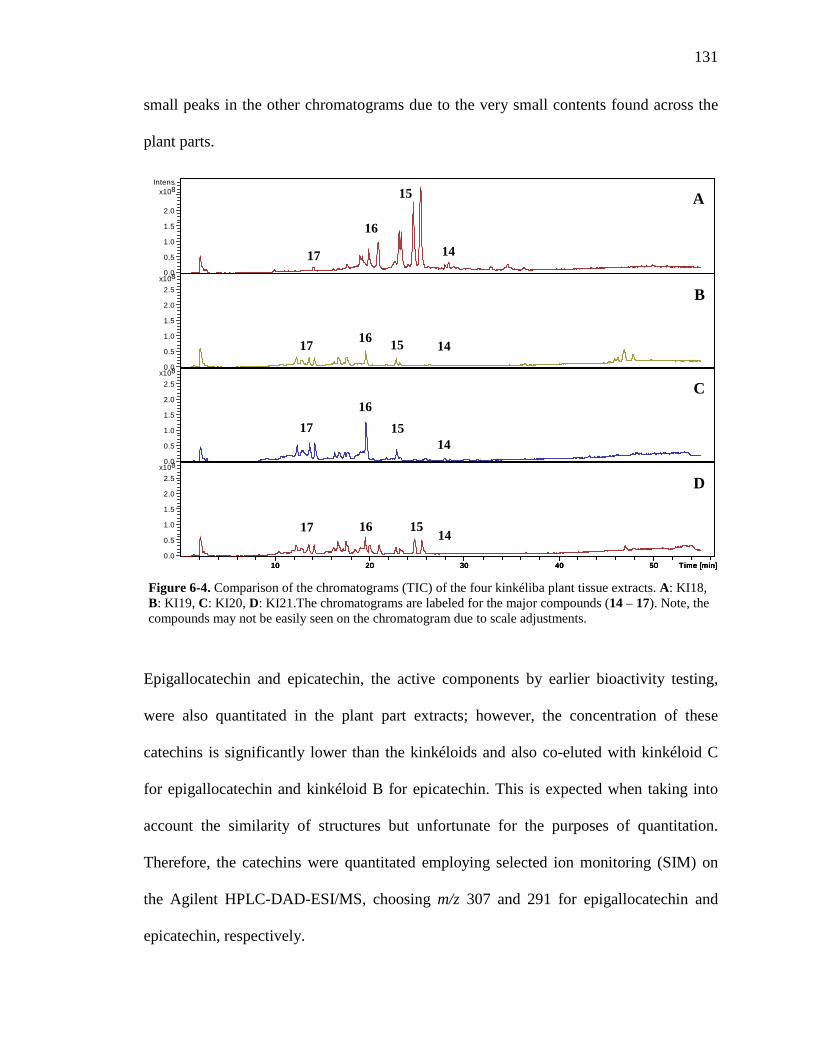
131
small peaks in the other chromatograms due to the very small contents found across the
plant parts.
Epigallocatechin and epicatechin, the active components by earlier bioactivity testing,
were also quantitated in the plant part extracts; however, the concentration of these
catechins is significantly lower than the kinkéloids and also co-eluted with kinkéloid C
for epigallocatechin and kinkéloid B for epicatechin. This is expected when taking into
account the similarity of structures but unfortunate for the purposes of quantitation.
Therefore, the catechins were quantitated employing selected ion monitoring (SIM) on
the Agilent HPLC-DAD-ESI/MS, choosing m/z 307 and 291 for epigallocatechin and
epicatechin, respectively.
Figure 6-4. Comparison of the chromatograms (TIC) of the four kinkéliba plant tissue extracts. A: KI18, B: KI19, C: KI20, D: KI21.The chromatograms are labeled for the major compounds (14 – 17). Note, the compounds may not be easily seen on the chromatogram due to scale adjustments.
09102602.D: TIC ±All
0.0
0.5
1.0
1.5
2.0
8x10Intens.
10 20 30 40 50 Time [min]
09102604.D: TIC ±All
0.0
0.5
1.0
1.5
2.0
2.5
8x10
10 20 30 40 50 Time [min]
09102605.D: TIC ±All
0.0
0.5
1.0
1.5
2.0
2.5
8x10
10 20 30 40 50 Time [min]
09102606.D: TIC ±All
0.0
0.5
1.0
1.5
2.0
2.5
8x10
10 20 30 40 50 Time [min]
A
B
C
D
14
15
16
17
15 16 17
17 16
15
15 16 17
14
14
14
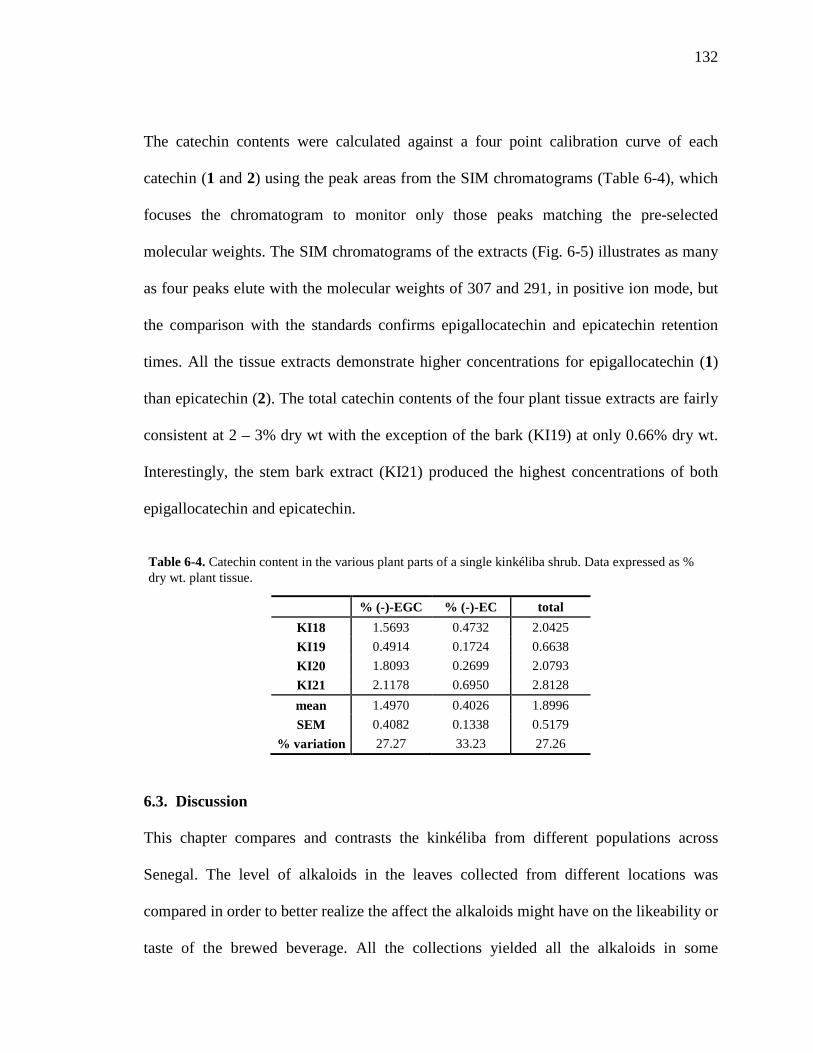
132
The catechin contents were calculated against a four point calibration curve of each
catechin (1 and 2) using the peak areas from the SIM chromatograms (Table 6-4), which
focuses the chromatogram to monitor only those peaks matching the pre-selected
molecular weights. The SIM chromatograms of the extracts (Fig. 6-5) illustrates as many
as four peaks elute with the molecular weights of 307 and 291, in positive ion mode, but
the comparison with the standards confirms epigallocatechin and epicatechin retention
times. All the tissue extracts demonstrate higher concentrations for epigallocatechin (1)
than epicatechin (2). The total catechin contents of the four plant tissue extracts are fairly
consistent at 2 – 3% dry wt with the exception of the bark (KI19) at only 0.66% dry wt.
Interestingly, the stem bark extract (KI21) produced the highest concentrations of both
epigallocatechin and epicatechin.
% (-)-EGC % (-)-EC total KI18 1.5693 0.4732 2.0425 KI19 0.4914 0.1724 0.6638 KI20 1.8093 0.2699 2.0793 KI21 2.1178 0.6950 2.8128 mean 1.4970 0.4026 1.8996 SEM 0.4082 0.1338 0.5179
% variation 27.27 33.23 27.26
6.3. Discussion
This chapter compares and contrasts the kinkéliba from different populations across
Senegal. The level of alkaloids in the leaves collected from different locations was
compared in order to better realize the affect the alkaloids might have on the likeability or
taste of the brewed beverage. All the collections yielded all the alkaloids in some
Table 6-4. Catechin content in the various plant parts of a single kinkéliba shrub. Data expressed as % dry wt. plant tissue.
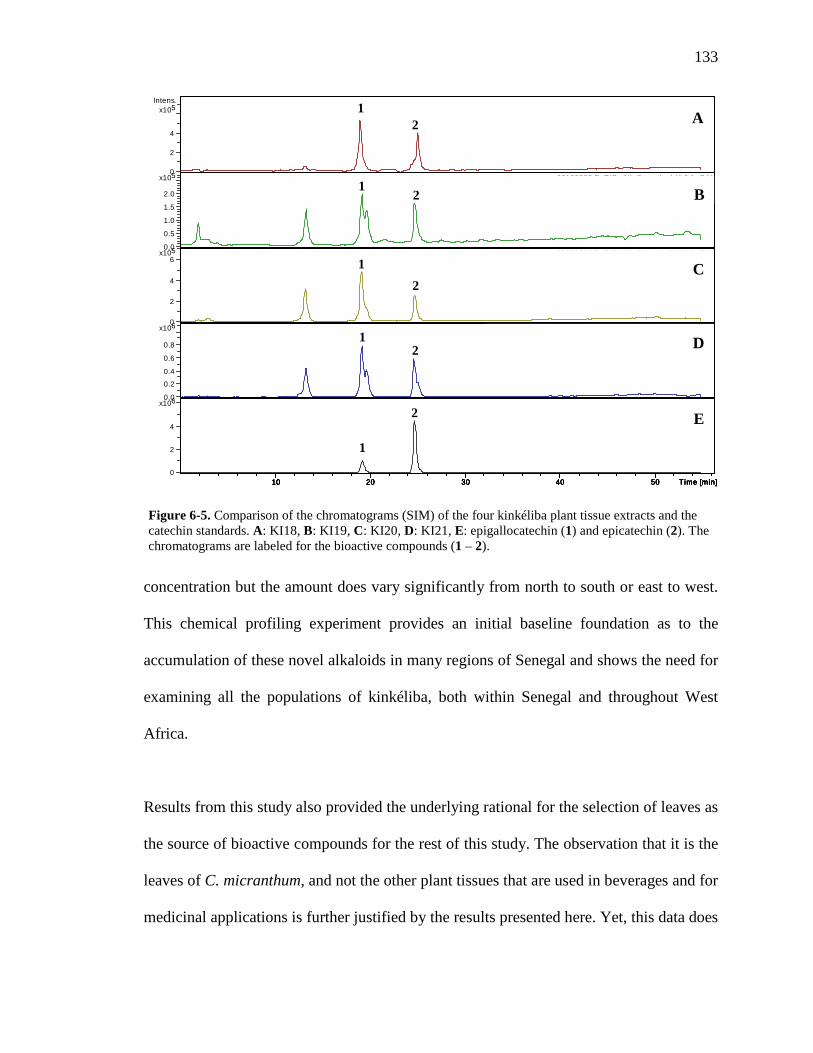
133
concentration but the amount does vary significantly from north to south or east to west.
This chemical profiling experiment provides an initial baseline foundation as to the
accumulation of these novel alkaloids in many regions of Senegal and shows the need for
examining all the populations of kinkéliba, both within Senegal and throughout West
Africa.
Results from this study also provided the underlying rational for the selection of leaves as
the source of bioactive compounds for the rest of this study. The observation that it is the
leaves of C. micranthum, and not the other plant tissues that are used in beverages and for
medicinal applications is further justified by the results presented here. Yet, this data does
09102902.D: TIC ±All, Smoothed (4.6,1, GA)
0
2
4
5x10Intens.
10 20 30 40 50 Time [min]
09102903.D: TIC ±All, Smoothed (4.6,1, GA)
0.0
0.5
1.0
1.5
2.0
5x10
10 20 30 40 50 Time [min]
09102904.D: TIC ±All, Smoothed (4.6,1, GA)
0
2
4
65x10
10 20 30 40 50 Time [min]
09102905.D: TIC ±All, Smoothed (4.5,1, GA)
0.0
0.2
0.4
0.6
0.8
6x10
10 20 30 40 50 Time [min]
09102908.D: TIC ±All, Smoothed (4.5,1, GA)
0
2
4
6x10
10 20 30 40 50 Time [min]
Figure 6-5. Comparison of the chromatograms (SIM) of the four kinkéliba plant tissue extracts and the catechin standards. A: KI18, B: KI19, C: KI20, D: KI21, E: epigallocatechin (1) and epicatechin (2). The chromatograms are labeled for the bioactive compounds (1 – 2).
A
B
C
D
E
1
2
1
1
1
1
2
2
2
2
134
not show or even examine whether it is the alkaloids that are responsible for any
particular medical application. In traditional medicine, it is the leaves of kinkéliba that
are most commonly used for diuretic and digestion purposes, The leaves have reported
diuretic and cholagogic properties, including gastrointestinal problems, colic, and
vomiting, and in the fresh form, the leaves are used to treat malarial fevers (1, 3, 6-10). A
tea, made from steeping the leaves in boiling water, is a traditional drink in tropical
savannah countries such as Senegal, Mali and Burkina Faso and is believed to aid weight
control and act as a general panacea (5). However, the roots of kinkéliba are also used for
the treatment of bruises and sprains by rubbing in with shea butter or palm oil (2, 3), for a
treatment of guinea worm infestations by drinking a decoction, or for the treatment of
open wounds using the decoction as a wash (3). When the bioactivity of the alkaloids is
determined, this chemical profiling will be imperative for establishing the active plant
parts and populations.
The quantitation of known bioactive compounds, epigallocatechin and epicatechin, was
performed for the four plant tissue extracts using SIM to illustrate the catechin peak areas
despite co-elution with the kinkéloids. The total catechin content was fairly consistent for
the leaf, root and stem bark extracts, but revealed the bark to have very low contents of
both bioactives. The stem bark extract displayed the highest content of catechins, more so
than the leaves. This plant tissue was initially tested for antioxidant capacity and had
comparable activity to the leaves; however, it yielded only moderate anti-inflammatory
activity and was not further examined. The stem bark could be identified here as another
bioactive tissue of kinkéliba and should be further examined for glucose-lowering
135
potential with the higher contents of epigallocatechin and epicatechin. The root extract
demonstrates comparable catechin content to the leaves but is significantly lower in
kinkéloid content; which can be important information in weighing the bioactive
potentials of the catechins versus the kinkéloids.
Future work with kinkéliba, specifically commercializing the tea leaves, should consider
the bioactivity of the alkaloids versus the bitter taste they most likely confer to the
beverage. A good balance of the two factors should allow for the maintenance of the
active components without losing the pleasant herbal flavor for which the tea is known.
With this initial profiling completed, the future work of kinkéliba can focus on
collections of kinkéliba that have either the highest concentrations of alkaloids or
catechins, the active compounds by glucose-lowering activity.
136
6.4. References
1. Iwu, M. M., Handbook of African Medicinal Plants. CRC Press, Inc.: Florida, 1993; p 464. 2. Kerharo, J.; Adam, J. G., Combrétacées. In La Pharmacopée Sénégalaise Tranditionnelle Plantes Médicinales Et Toxiques, 1st ed.; Vigot Fréres: Paris, 1974; pp 341-360. 3. Neuwinger, H. D., African Traditional Medicine: A Dictionary of Plant Use and Applications. Medpharm Scientific Publishers: Stuttgart, 2000; p 589. 4. Institute for Security Studies, T. Senegal - Geographic Map. http://www.iss.co.za/Af/profiles/Senegal/GenInfo.html 5. Eloff, J. N.; Katerere, D. R.; McGaw, L. J., The biological activity and chemistry of the southern African Combretaceae. Journal of Ethnopharmacology 2008, 119, 686-699. 6. Le Grand, A., Les Phytotherapies Anti-infectieuses de la Foret-savane, Senegal (Afrique occidentale) III: Un Resume des Substances Phytochimiques et l' Activite Antimicrobienne de 43 Species. Journal of Ethnopharmacology 1989, 25, 315-338. 7. Le Grand, A.; Wondergem, P. A., Les Phytotherapies Anti-infectieuses de la Foret-savane, Senegal (Afrique occidentale) I: Un Inventaire. Journal of Ethnopharmacology 1987, 21, 109-125. 8. D' Agostino, M.; Biagi, C.; De Feo, V.; Zollo, F.; Pizza, C., Flavonoids of Combretum micranthum. Fitoterapia 1990, LXI, (5), 477. 9. Tignokpa, M.; Laurens, A.; Mboup, S.; Sylla, O., Plantes medicinales populaires des marches de Dakar (Senegal). International Journal of Crude Drug Research 1986, 24, 75-80. 10. Olajide, O.; Makinde, J. M.; Okpako, D. T., Evaluation of the anti-inflammatory property of the extract of Combretum micranthum G. Don. (Combretaceae). Inflammopharmacology 2003, 11, (3), 293-298.
137
Chapter 7. Conclusions
138
7.1. Summary and Impact
Under bioactivity-guided fractionation, the phytochemical investigation of the Kinkéliba
leaves has led to the isolation and identification of 17 compounds, all polyphenolic
structures. While some of these natural plant products have been previously reported in
this species, some are new to the Combretaceae family and some are reported here for the
first time as new compounds with novel skeleton. This study confirmed the presence of
vitexin and orientin, C-glycosylflavones (1-3), as well as myricetin-3-O-glucoside, an O-
glycosylflavone (4) in the kinkéliba leaves. Epicatechin and epigallocatechin, previously
identified from other Combretaceae species (5, 6), were isolated from the ethyl acetate
fraction. Other compounds from this fraction, 3’,4’,5’,5,7-pentahydroxyflavan (7, 8) and
3’,4’,5,7-tetrahydroxyflavan (9, 10), are previously reported structures, though associated
with Combretaceae species for the first time here. Additionally, the galloyl vitexins and
galloyl orientins are previously reported from Pelargonium reniforme (11), but this is the
first reported occurrence in any Combretum species. Finally, from the n-butanol fraction
of the leaf extract, we have isolated a series of new flavan alkaloids. The kinkéloids, as
we have named them here in honor of this plant species, are a series of piperidine-flavan
alkaloids with increasing number of hydroxyls to differentiate. The alkaloid structure was
structurally elucidated by MS, HRMS and 1D- and 2D-NMR spectroscopic techniques.
These piperidine-flavan alkaloids join a small class of flavonoid alkaloids, only about ten
other species have produced such alkaloids, and provide an exciting new model for
chemistry from the kinkéliba leaf.
139
The fractionation described above was directed by a UV/VIS spectrophotometric
antioxidant capacity assay measuring the disappearance of a radical solution (12).
Antioxidant capacity directed fractionation from the leaf extract, to the ethyl acetate and
n-butanol fractions, to the specific silica, polyamide, and Sephadex column subfractions,
and, and finally, to the isolation of these compounds. The assay for antioxidant capacity
was utilized for directing the fractionation and highlighted a number of subfractions and
isolated compounds with excellent activity. Specifically, of the ethyl acetate fraction, the
isolated epigallocatechin, epicatechin, and 3’,4’,5’,5,7-pentahydroxyflavan were highly
active and 3’,4’,5,7-tetrahydroxyflavan and the O-galloyl-C-glycosylflavones also
exhibited promising antioxidant capacity. The highest antioxidant capacity of the LB
fraction was focused in the kinkéloid-containing subfractions, though the isolated
compounds were not tested at this time for this activity.
The highlighted subfractions and isolated compounds, by antioxidant capacity, were
tested for anti-inflammatory activity. Anti-inflammatory testing utilized a RAW 264.7
macrophage cell line measuring the decrease of iNOS as well as iNOS and COX-2
western blotting (13). The iNOS anti-inflammatory activity was strong in the LE
subfractions but the isolated compounds yielded a slightly lower activity. This could
indicate a synergistic effect of the isolates in the subfractions that requires the compounds
to work together for the observed effect or the presence of additional compounds that
have not yet been isolated. The LB fractionation, of which the major constituents are the
kinkéloids, demonstrated no COX-2 anti-inflammatory activity but the subfractions
showed promising iNOS activity by the nitrite assay and western blotting. Again, the
140
isolated compounds do not appear solely responsible for the observed anti-inflammatory
activity on their own but it is possible that these compounds may be active in concert
with each other or the other active compounds in the extract. These results demonstrate
that the kinkéliba leaf extract is an excellent source of antioxidant compounds as well as
a foundation for anti-inflammatory activity.
The initial crude extract and solvent fractions were tested for anti-malarial activity
against P. falciparum but no appreciable difference was seen from the crude extract and
solvent fractionation so the remaining fractions were not tested. This is not surprising as
personal communication with Dr. Bassene suggested anti-malarial activity of kinkéliba
was primarily seen in fresh leaves as opposed to the dried leaves used here.
Kinkéliba was also found to have significant glucose-lowering activity as demonstrated
via the biological assays which employed a H4IIE hepatoma cell line measuring
decreased glucose production and PEPCK mRNA expression. This activity was
maintained in the initial LE subfractions and ultimately accountable to the epicatechin (2)
isolated from LE-5. This is not the first incidence of glucose-lowering activity by a
catechin (14) or even against PEPCK, specifically, (15, 16) but the other studies mostly
attribute the activity to either green tea constituents, not specifying which catechin, or
EGCG. This study correlates a decrease of PEPCK to epicatechin. From the n-butanol
fraction, the compound(s) responsible for the activity have not yet been determined, but
the newly discovered kinkéloids are not responsible. The animal study, most
convincingly, further supported and demonstrated the powerful and significant effect that
141
kinkéliba leaf extract had on lowering glucose and insulin levels in the animals. While
not affecting the body weight, the six-week study demonstrated the crude kinkéliba
extract and subsequent LE and LB fractions lower the fasting blood glucose levels,
increase the glucose tolerance, lower the plasma insulin levels and lower the PEPCK
gene expression in the liver tissue. All these results indicate noteworthy in vivo anti-
diabetic activity.
Finally, the level of alkaloids in the leaves collected from different locations was
compared in order to better realize the affect the alkaloids might have on the likeability or
taste of the brewed beverage. All the collections yielded all the alkaloids in some
concentration but the amount does vary significantly from north to south or east to west.
Additionally, the content levels of kinkéloids and known bioactive compounds,
epigallocatechin and epicatechin, were compared for the four plant tissues. The leaves
demonstrated the highest kinkéloid content with the stem bark at moderate levels and
bark and root extract with comparatively low levels. The total catechin content was fairly
consistent for the leaf, root and stem bark extracts, but revealed the bark to have very low
contents of both bioactives. This study confirms the leaves yield high contents of both the
bioactive catechins and novel kinkéloids. The stem bark is identified here as another
bioactive tissue of kinkéliba with the highest contents of epigallocatechin and
epicatechin. And the root extract demonstrates comparable catechin content to the leaves
but is significantly lower in kinkéloid content; which can be important information in
weighing the bioactive potentials of the catechins versus the kinkéloids.
142
7.2 Recommendations for Future Work
The next step of recommended research should be to complete the phytochemical work
on the kinkéloids. In depth LC-MS profiling indicates several minor isomers (both
structural and stereo) are available for each kinkéloid. Each isomer of each alkaloid needs
to be isolated and structurally confirmed. This new skeleton presents the opportunity for
new chemistry from the kinkéliba plant and the potential for a robust bioactive effect, due
to the high concentrations of kinkéloids in the leaves, the most commonly used plant part.
The bioactivity of the kinkéloids needs to be further investigated for the full
ethnomedicinal potential.
The anti-inflammatory effect of the crude leaf extract and initial subfractions needs to be
explained by either further testing of the isolates in combination or continued
fractionation to isolate the active compound. Additionally, the observed glucose-lowering
effects of the LB fraction, specifically from the animal study, needs to be further studied
to discover the compounds responsible.
Future work with commercializing the kinkéliba tea should consider the bioactivity of the
catechins versus the bitter taste the alkaloids most likely confer to the beverage. A good
balance of the two factors should allow for the maintenance of the active components
without losing the pleasant herbal flavor for which the tea is known.
143
7.3. References
1. Bassene, E.; Laurance, A.; Olschwang, D.; Pousset, J.-L., Plantes medicinales africaines XIX: Dosage de la vitexine par chromatographie liquide haute performance dans un extrait brut de Combretum micranthum G. Don. Journal of Chromatography 1985, 346, 428-430. 2. Jentzsch, V. K.; Spiegl, P.; Fuchs, L., Untersuchungen uber die inhaltsstoffe der blatter von Combretum micranthum G. Don. Planta Medica 1962, 10, 6-8. 3. Paris, R., Sur une Combretacee africaine, le "kinkeliba" (Combretum micranthum G. Don.). Bulletin des Sciences Pharmacologiques 1942, 10-11-12, 181-186. 4. D' Agostino, M.; Biagi, C.; De Feo, V.; Zollo, F.; Pizza, C., Flavonoids of Combretum micranthum. Fitoterapia 1990, LXI, (5), 477. 5. Adnyana, I. K.; Tezuka, Y.; Awale, S.; Banskota, A. H.; Tran, K. Q.; Kadota, S., Quadranosides VI-XI, six new triterpene glucosides from the seeds of Combretum quadrangulare. Chemical and Pharmaceutical Bulletin 2000, 48, (8), 1114-1120. 6. Bouchet, N.; Barrier, L.; Fauconneau, B., Radical scavenging activity and antioxidant properties of tannins from Guera senegalensis (Combretaceae). Phytotherapy Research 1998, 12, (3), 159-162. 7. Guo, X.-Y.; Wang, N.-L.; Bo, L.; Li, Y.-H.; Xu, Q.; Yao, X.-S., Chemical constituents from Pithecellobium clypearia and their effects on T lymphocytes proliferation. Journal of Chinese Pharmaceutical Sciences 2007, 16, (3), 208-213. 8. Li, Y.-l.; Ke-ming, L.; Miao-xian, S.; Kan-tong, L.; Yu-wu, C.; Yong-wen, Z., Studies on antiviral constituents in stems and leaves of Pithecellibium clypearia. China Journal of Chinese materia medica 2006, 31, (5), 397-400. 9. Li, L. Q.; Li, M. R.; Feng, W. T., Studies on the chemical constituents of Libanjisheng (Helixanthera parasitica). Chinese Traditional and Herbal Drugs 1994, 25, (283-284), 287. 10. Zhang, X.-Y.; Li, B.-G.; Zhou, M.; Yuan, X.-H.; Zhang, G.-L., Chemical constituents of Phacellaria compressa Benth. Journal of Integrative Plant Biology 2006, 48, (2), 236-240. 11. Latte, K. P.; Ferreira, D.; Venkatraman, M. S.; Kolodziej, H., O-Galloyl-C-glycosylflavones from Pelargonium reniforme. Phytochemistry 2002, 59, 419-424.
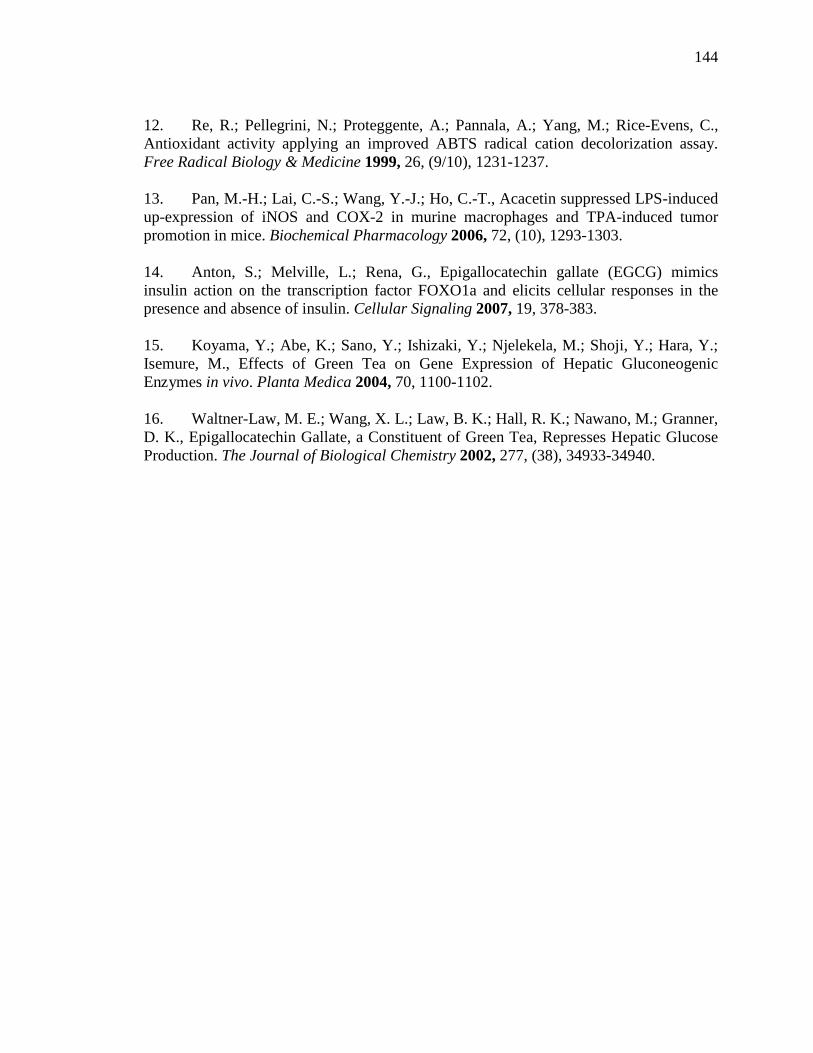
144
12. Re, R.; Pellegrini, N.; Proteggente, A.; Pannala, A.; Yang, M.; Rice-Evens, C., Antioxidant activity applying an improved ABTS radical cation decolorization assay. Free Radical Biology & Medicine 1999, 26, (9/10), 1231-1237. 13. Pan, M.-H.; Lai, C.-S.; Wang, Y.-J.; Ho, C.-T., Acacetin suppressed LPS-induced up-expression of iNOS and COX-2 in murine macrophages and TPA-induced tumor promotion in mice. Biochemical Pharmacology 2006, 72, (10), 1293-1303. 14. Anton, S.; Melville, L.; Rena, G., Epigallocatechin gallate (EGCG) mimics insulin action on the transcription factor FOXO1a and elicits cellular responses in the presence and absence of insulin. Cellular Signaling 2007, 19, 378-383. 15. Koyama, Y.; Abe, K.; Sano, Y.; Ishizaki, Y.; Njelekela, M.; Shoji, Y.; Hara, Y.; Isemure, M., Effects of Green Tea on Gene Expression of Hepatic Gluconeogenic Enzymes in vivo. Planta Medica 2004, 70, 1100-1102. 16. Waltner-Law, M. E.; Wang, X. L.; Law, B. K.; Hall, R. K.; Nawano, M.; Granner, D. K., Epigallocatechin Gallate, a Constituent of Green Tea, Represses Hepatic Glucose Production. The Journal of Biological Chemistry 2002, 277, (38), 34933-34940.
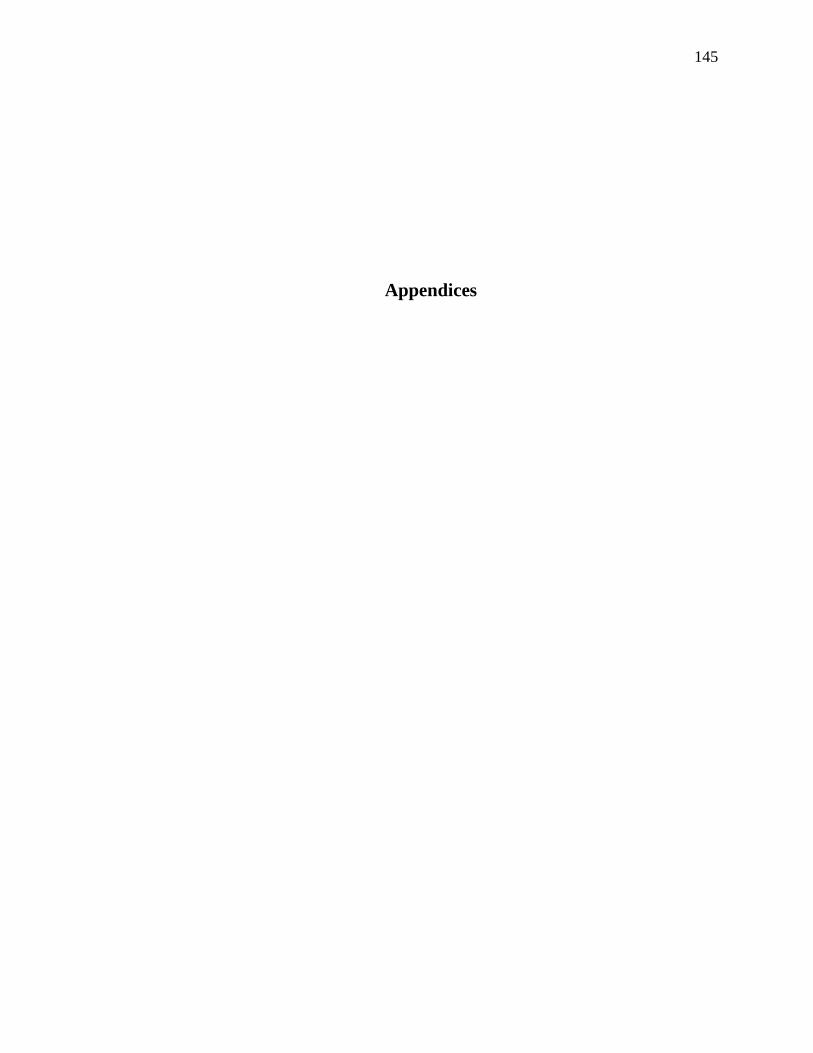
145
Appendices
146
2’
5’,6
’ 8/6
2 1”
3”
3”
4 6”
3
3, 6
” 5”
,4” 5”
,4”
Figu
re A
pp-1
. 1 H sp
ectru
m o
f kin
kélo
id B
(15)
, LB
-34-
19c+
15d.
OH
,NH
147
Figu
re A
pp-2
. 1 H sp
ectru
m o
f kin
kélo
id B
(15)
, zoo
med
in to
show
4.5
– 9
ppm
.
8/6
1”
2 5’
,6’
2’
OH
, NH
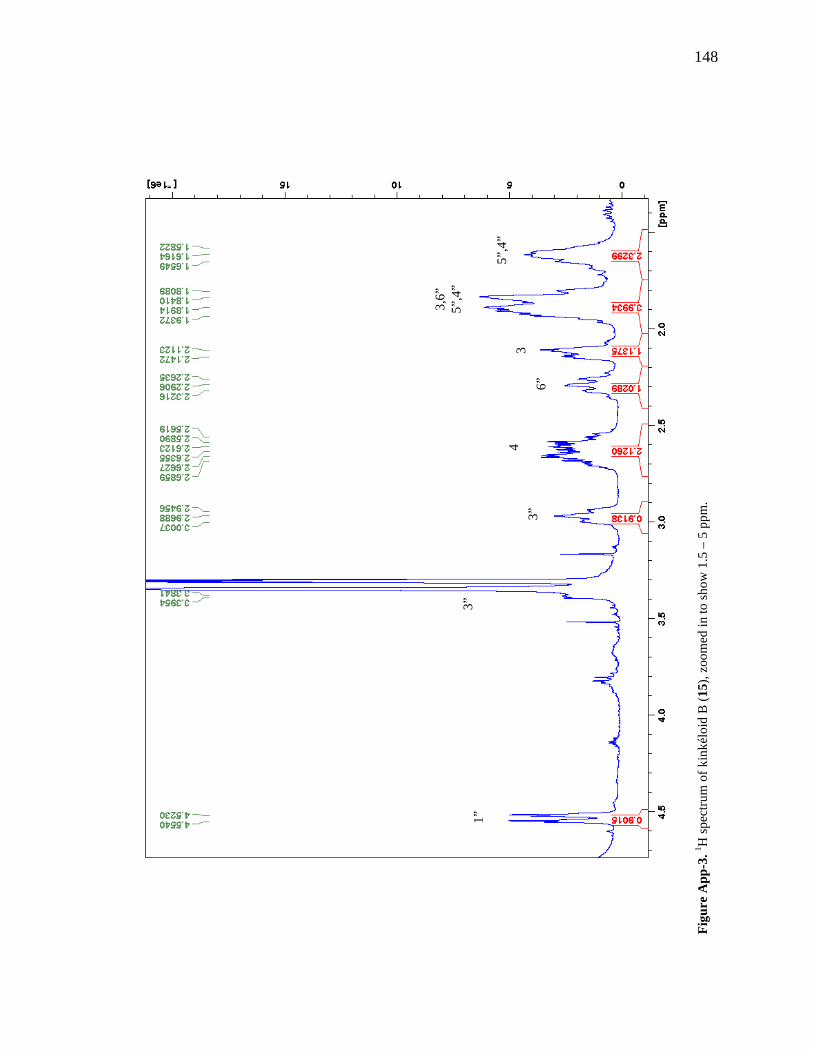
148
1”
Figu
re A
pp-3
. 1 H sp
ectru
m o
f kin
kélo
id B
(15)
, zoo
med
in to
show
1.5
– 5
ppm
.
1”
3”
3”
4 3
6”
3,6”
5”
,4”
5”,4
”
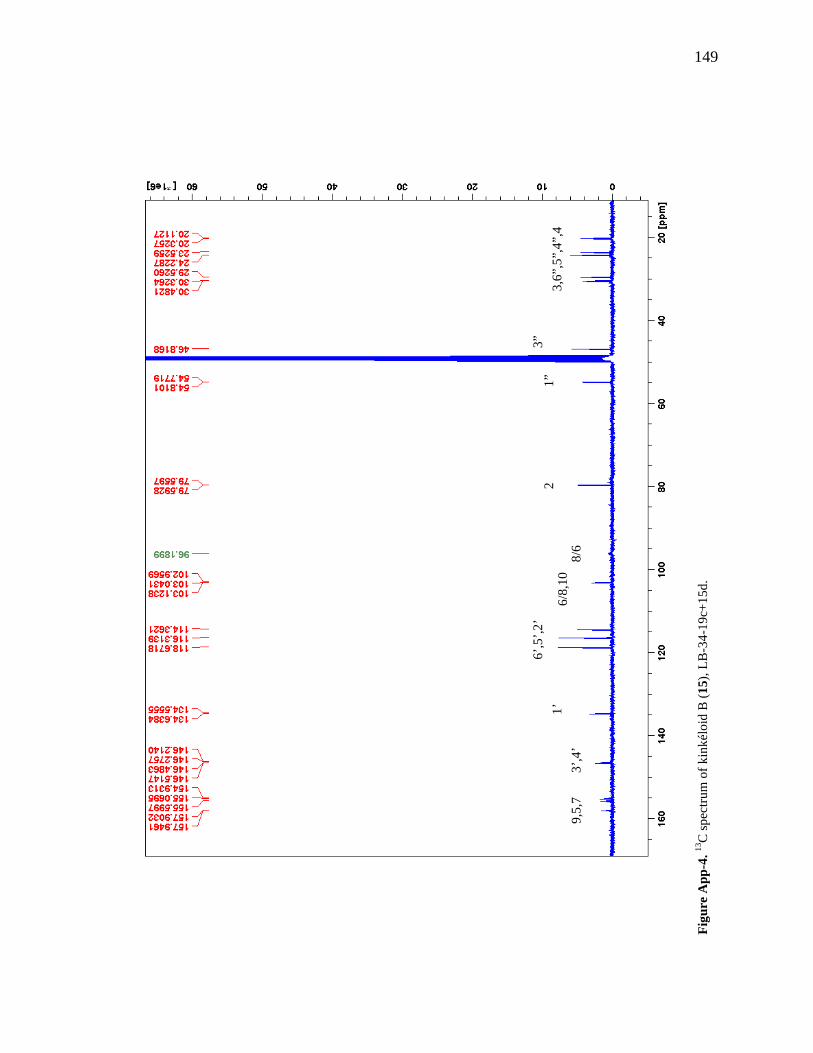
149
Figu
re A
pp-4
. 13C
spec
trum
of k
inké
loid
B (1
5), L
B-3
4-19
c+15
d.
9,5,
7 1’
6’
,5’,2
’
6/8,
10
8/6
2 1”
3”
3,
6”,5
”,4”
,4
3’,4
’
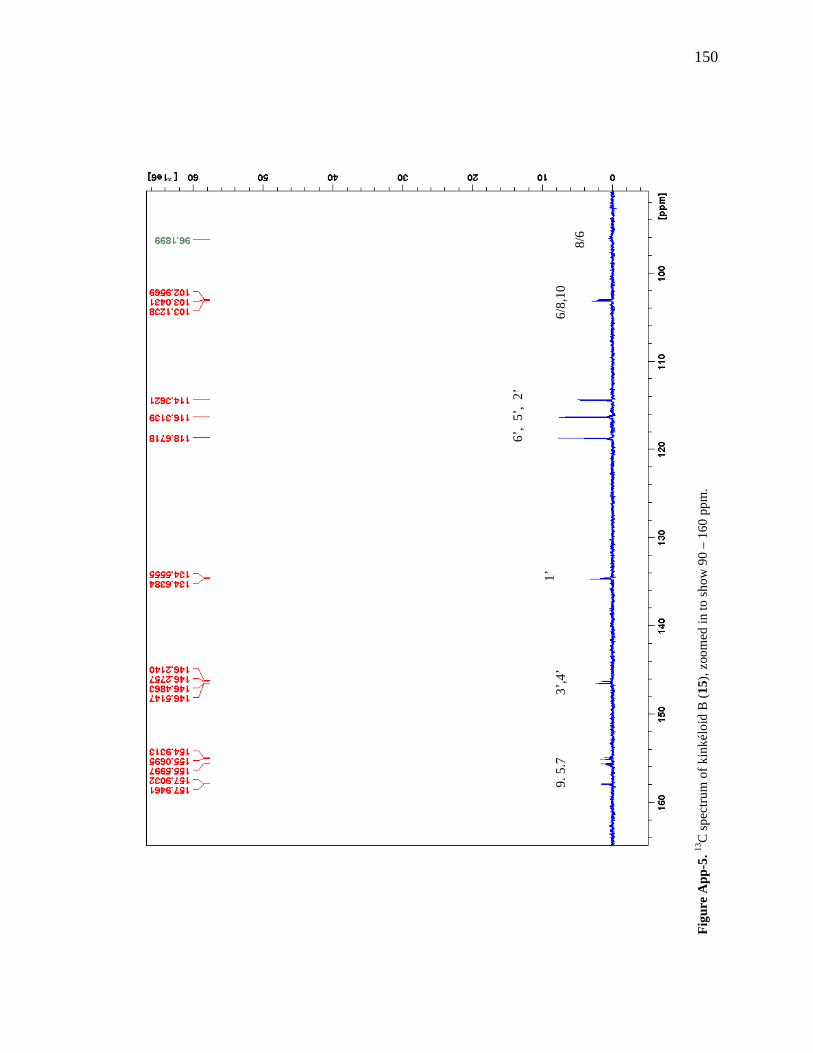
150
3’,4
’
Figu
re A
pp-5
. 13C
spec
trum
of k
inké
loid
B (1
5), z
oom
ed in
to sh
ow 9
0 –
160
ppm
.
6’,
5’,
2’
9. 5
.7
1’
6/8,
10
8/6
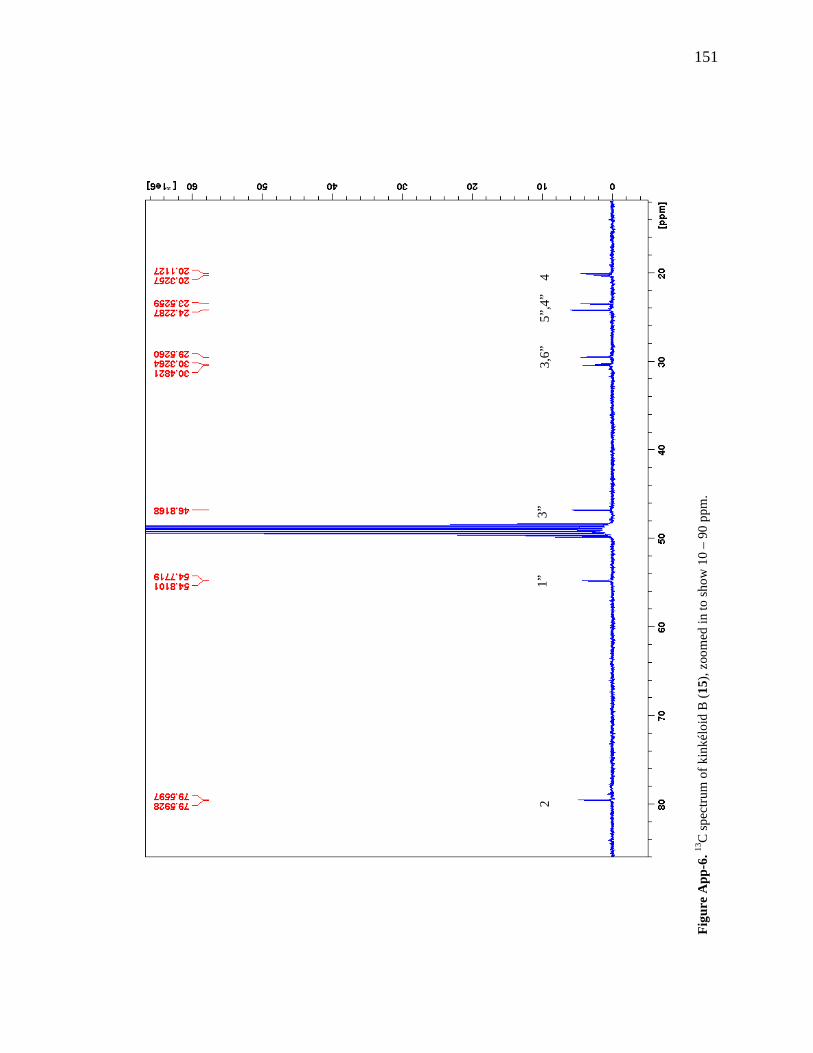
151
Figu
re A
pp-6
. 13C
spec
trum
of k
inké
loid
B (1
5), z
oom
ed in
to sh
ow 1
0 –
90 p
pm.
3,6”
5”,
4”
4
1”
3”
2
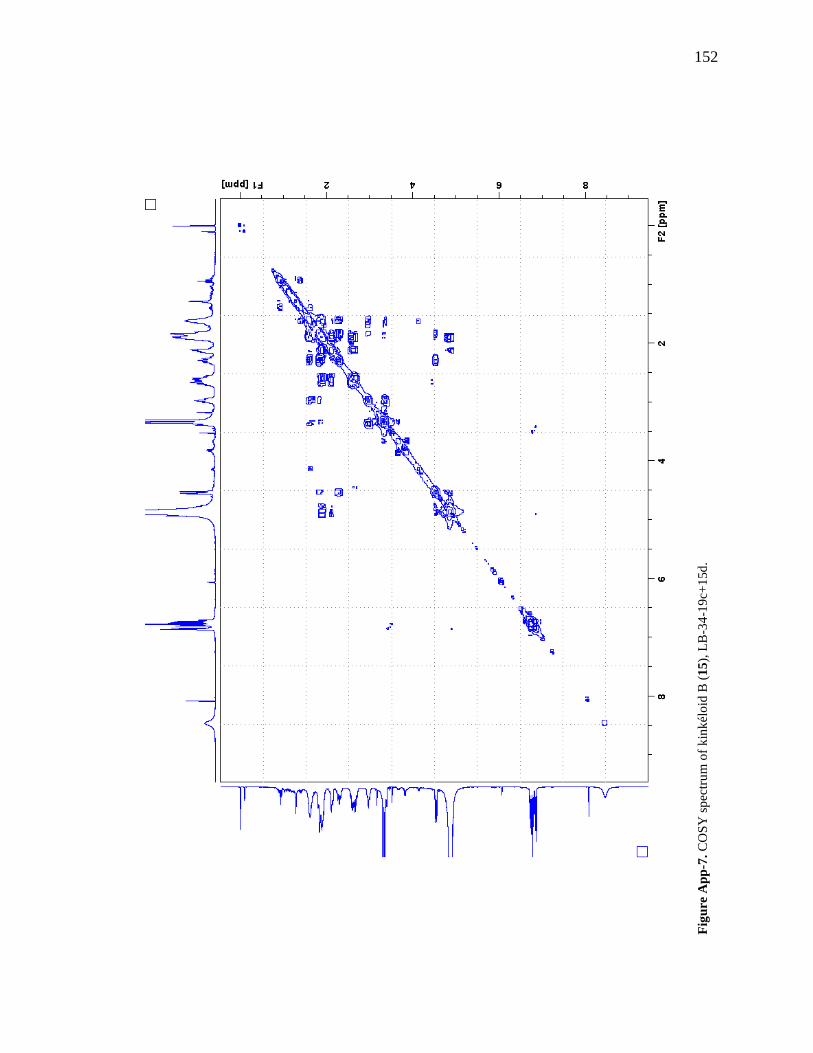
152
Figu
re A
pp-7
. CO
SY sp
ectru
m o
f kin
kélo
id B
(15)
, LB
-34-
19c+
15d.
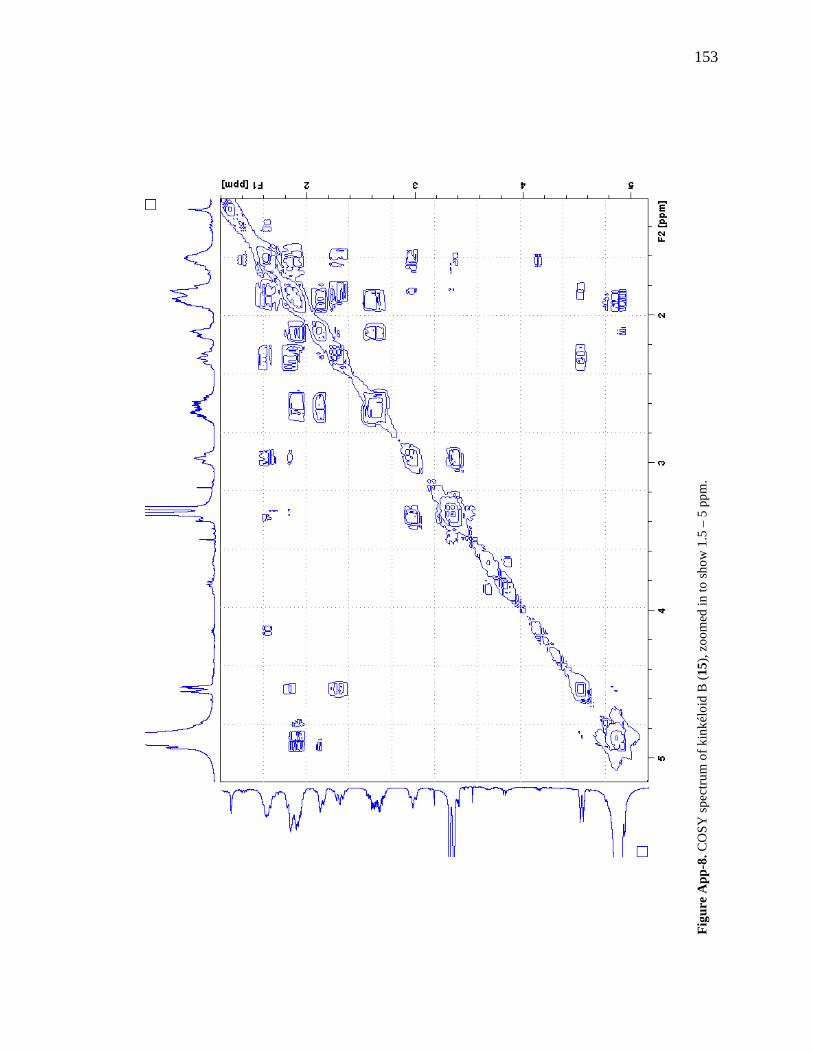
153
Figu
re A
pp-8
. CO
SY sp
ectru
m o
f kin
kélo
id B
(15)
, zoo
med
in to
show
1.5
– 5
ppm
.
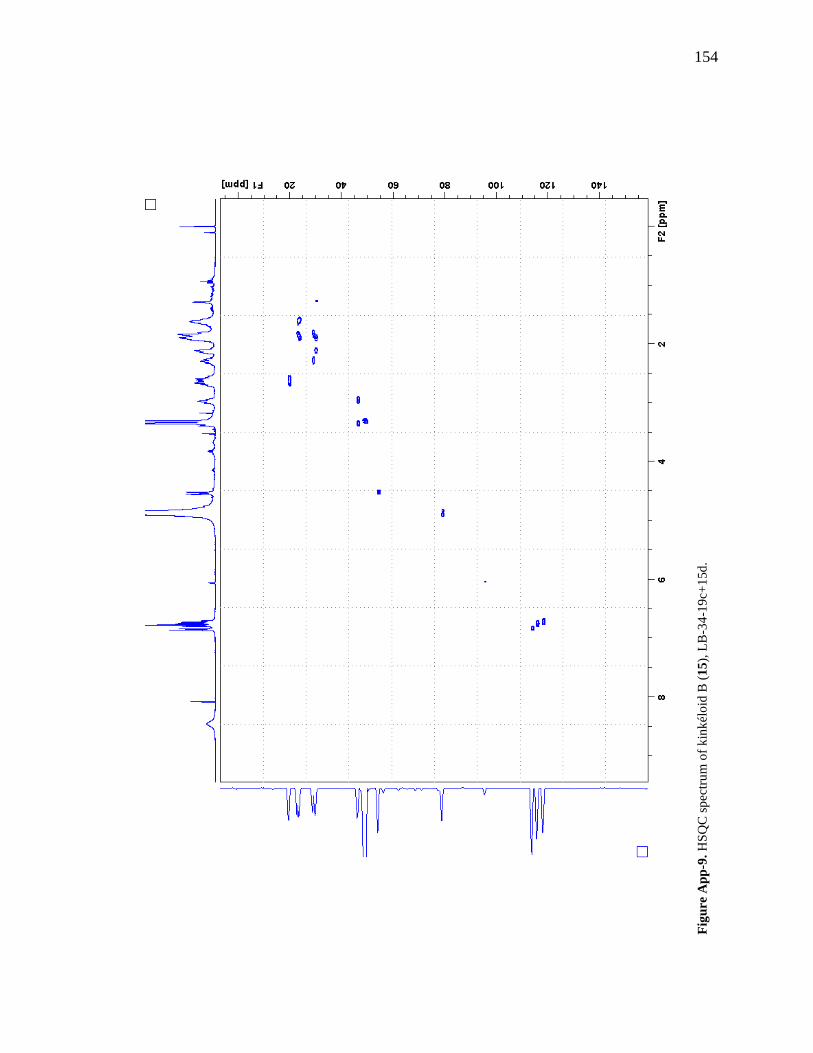
154
Figu
re A
pp-9
. HSQ
C sp
ectru
m o
f kin
kélo
id B
(15)
, LB
-34-
19c+
15d.
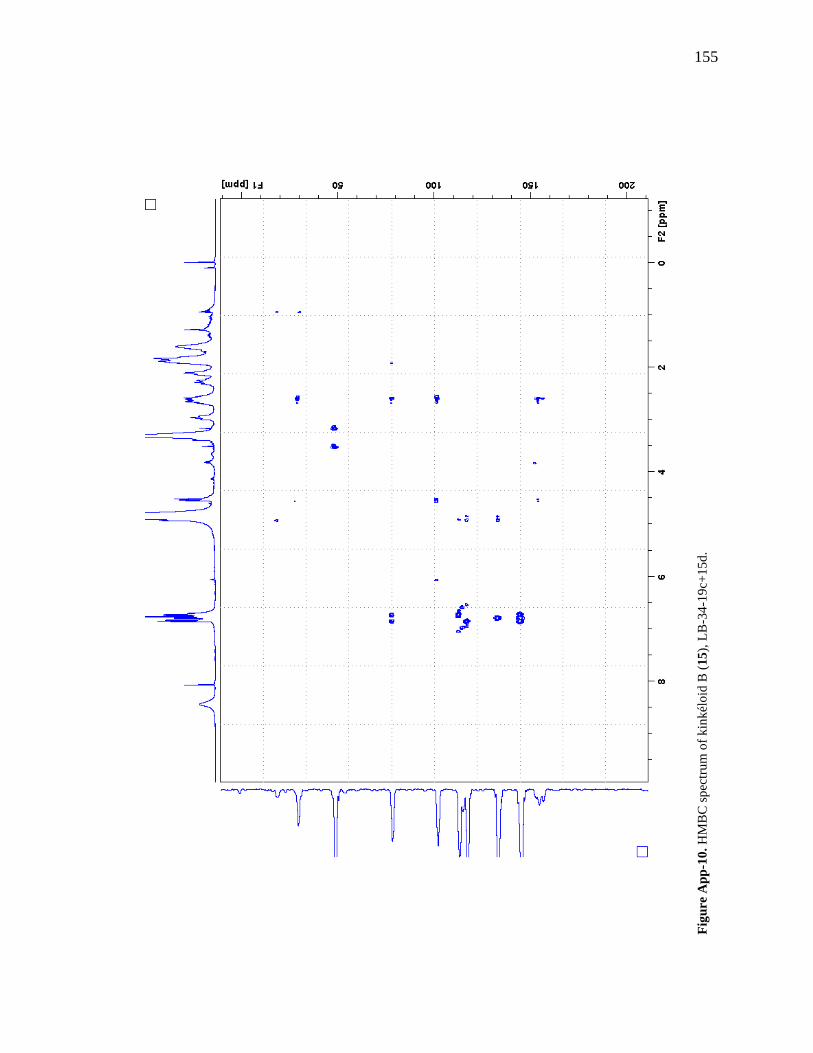
155
Figu
re A
pp-1
0. H
MB
C sp
ectru
m o
f kin
kélo
id B
(15)
, LB
-34-
19c+
15d.
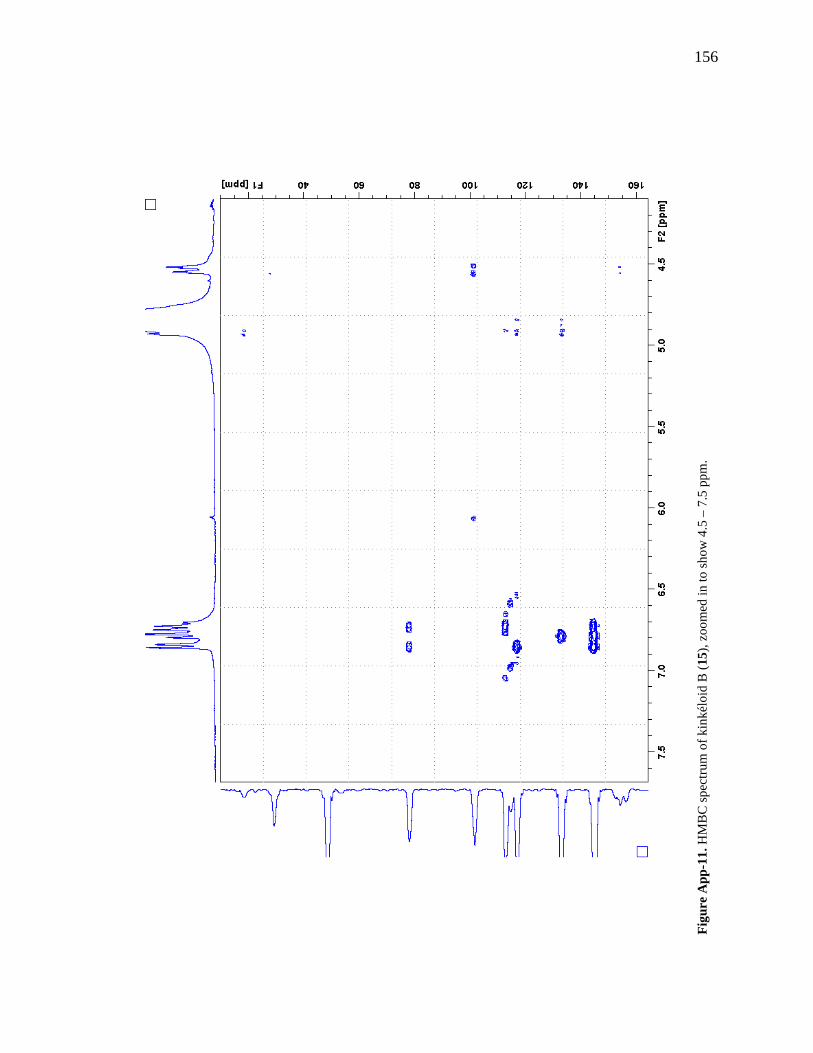
156
Figu
re A
pp-1
1. H
MB
C sp
ectru
m o
f kin
kélo
id B
(15)
, zoo
med
in to
show
4.5
– 7
.5 p
pm.
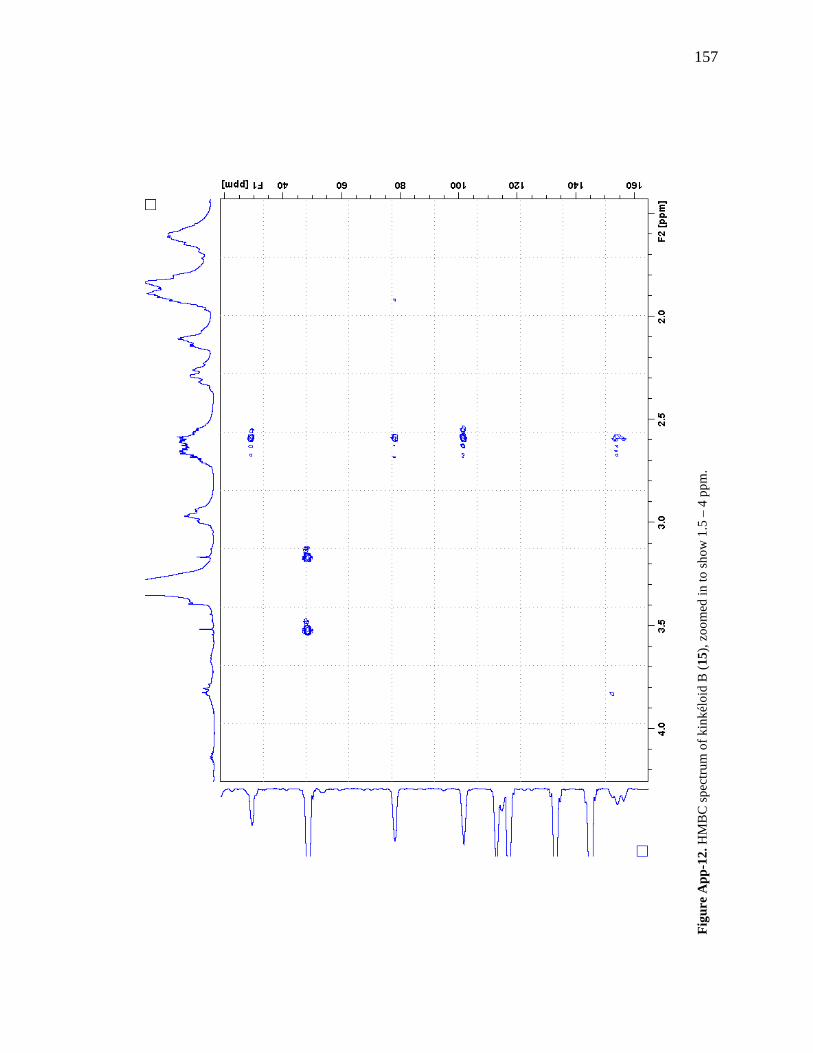
157
Figu
re A
pp-1
2. H
MB
C sp
ectru
m o
f kin
kélo
id B
(15)
, zoo
med
in to
show
1.5
– 4
ppm
.
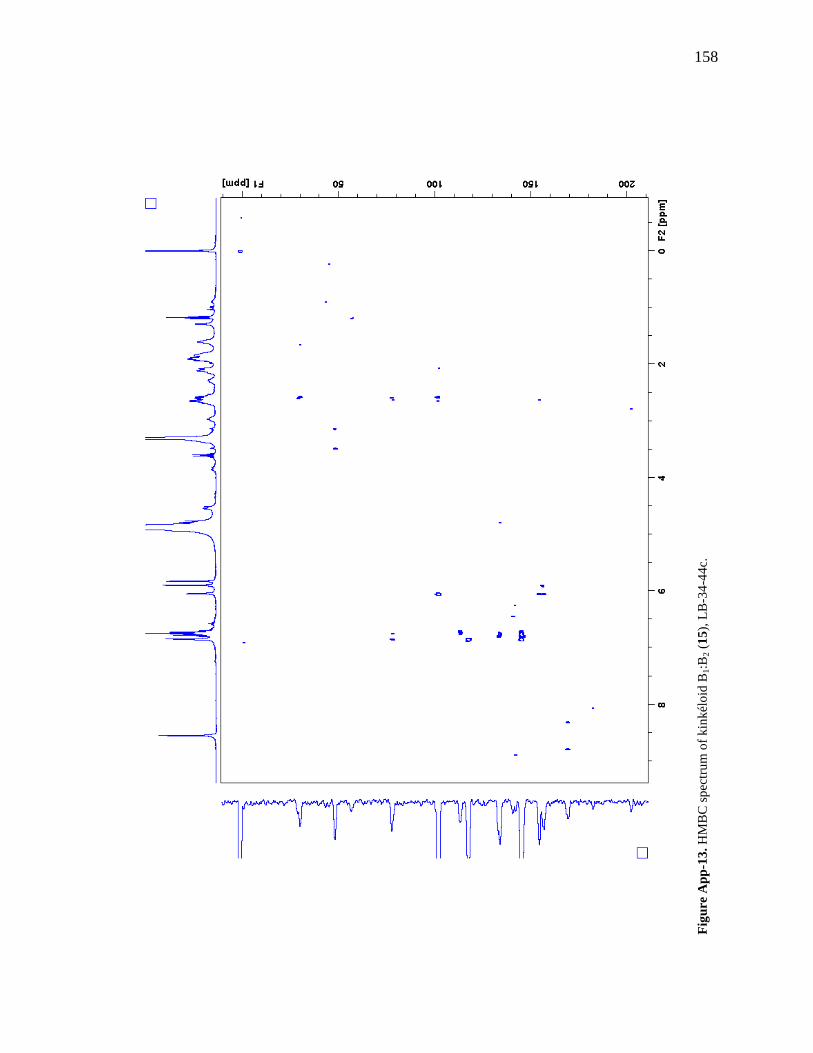
158
Figu
re A
pp-1
3. H
MB
C sp
ectru
m o
f kin
kélo
id B
1:B2 (
15),
LB-3
4-44
c.
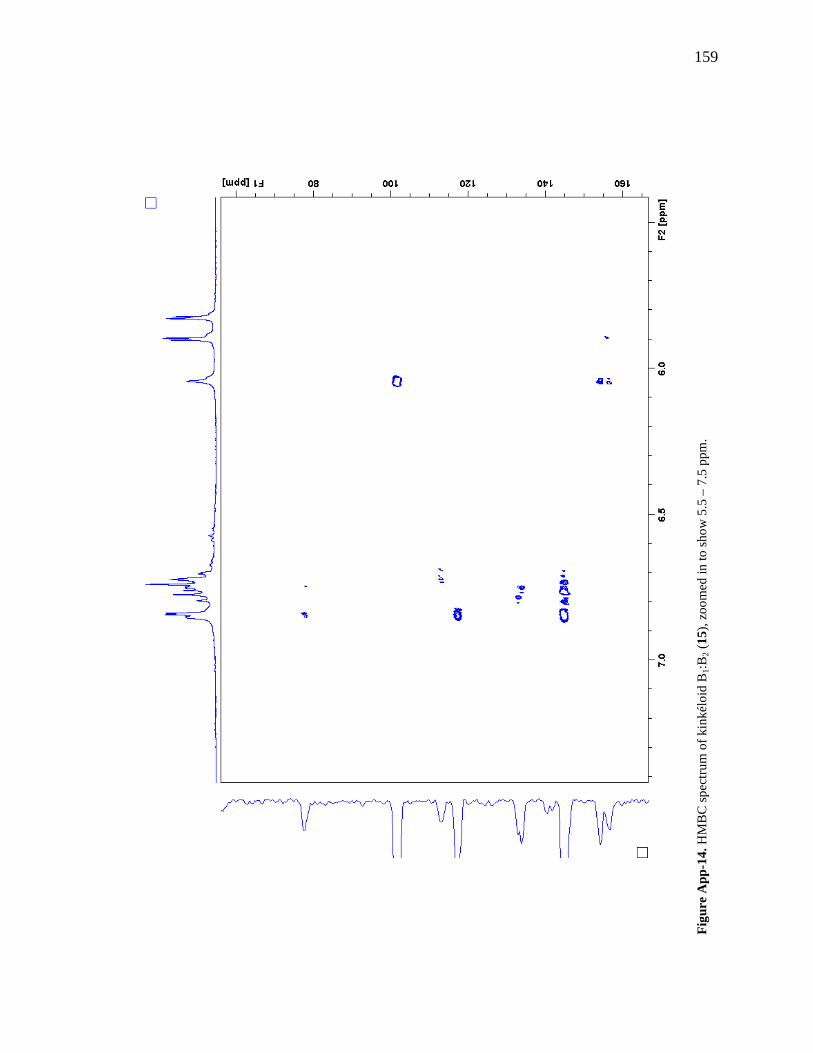
159
Figu
re A
pp-1
4. H
MB
C sp
ectru
m o
f kin
kélo
id B
1:B2 (
15),
zoom
ed in
to sh
ow 5
.5 –
7.5
ppm
.
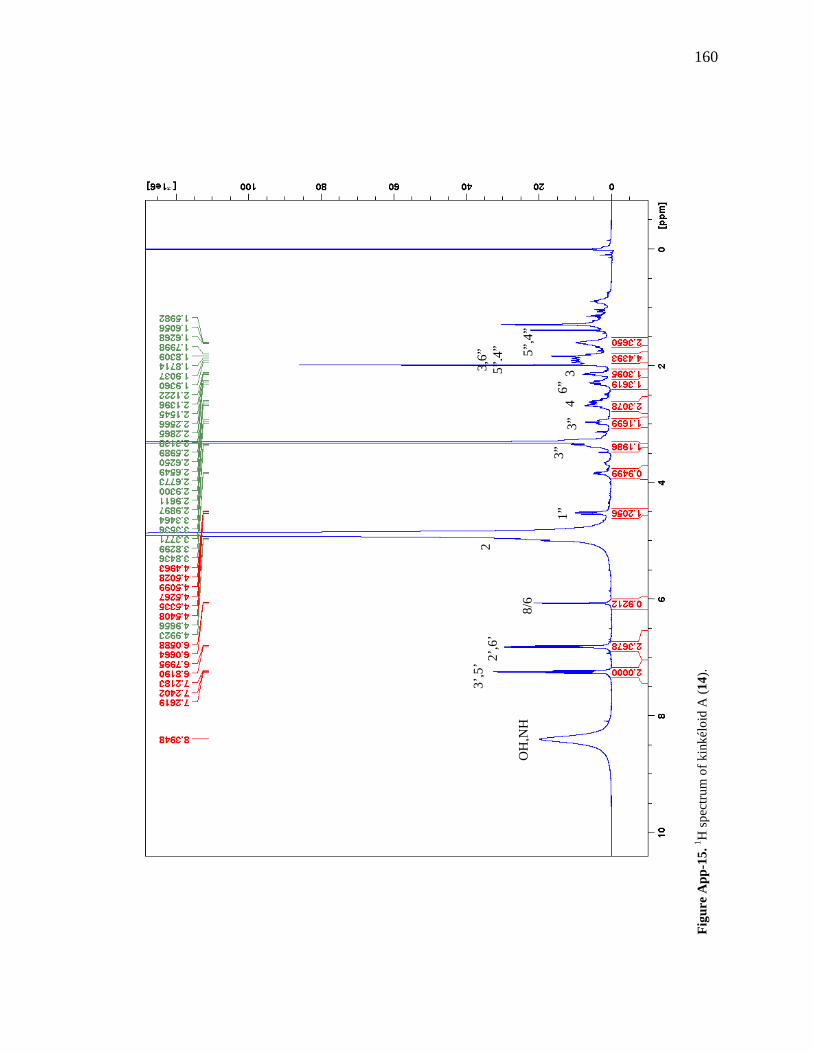
160
Figu
re A
pp-1
5. 1 H
spec
trum
of k
inké
loid
A (1
4).
3’,5
’ 2’,6
’
8/6
2
1”
3”
3”
4 6”
3 3,6”
5”
,4” 5”
,4”
OH
,NH
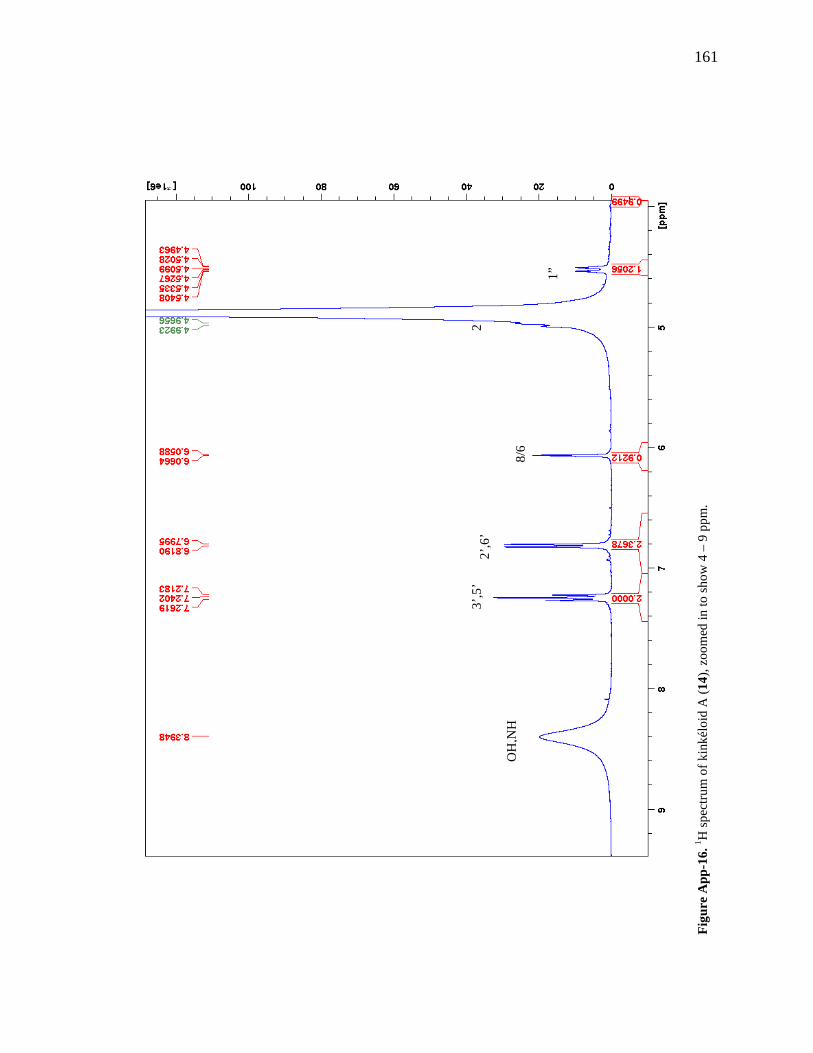
161
Figu
re A
pp-1
6. 1 H
spec
trum
of k
inké
loid
A (1
4), z
oom
ed in
to sh
ow 4
– 9
ppm
.
OH
,NH
3’,5
’ 2’
,6’
8/6
2
1”
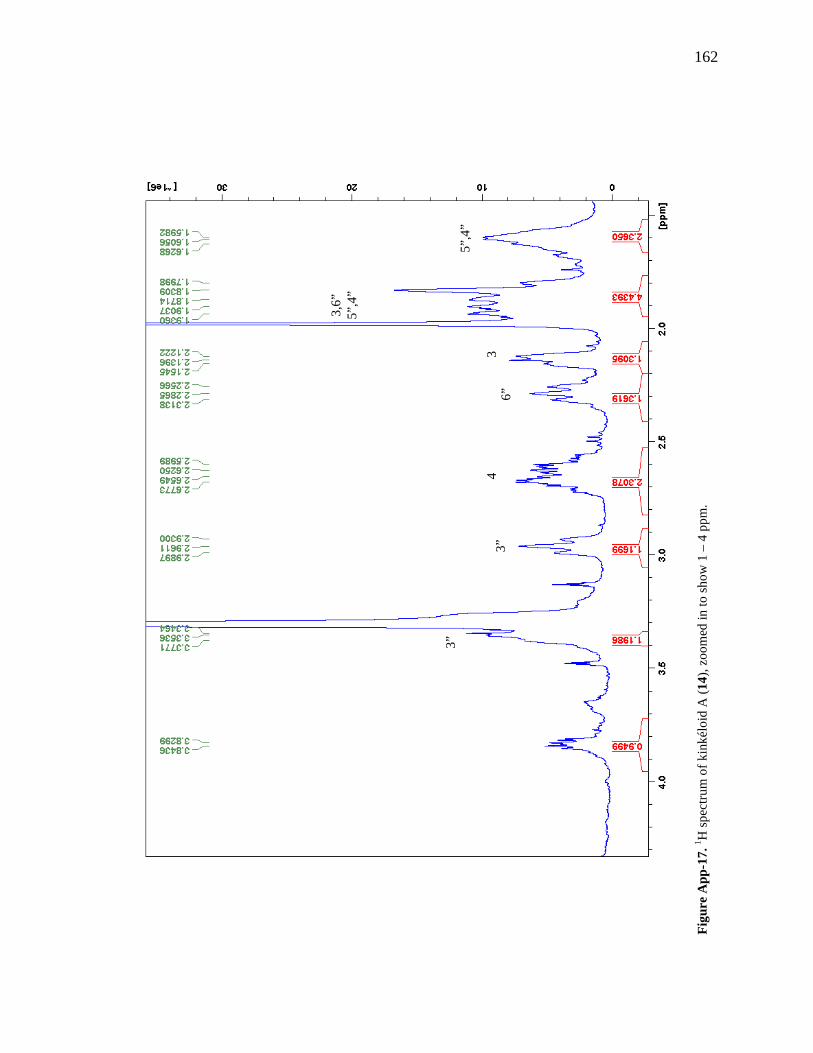
162
Figu
re A
pp-1
7. 1 H
spec
trum
of k
inké
loid
A (1
4), z
oom
ed in
to sh
ow 1
– 4
ppm
.
5”,4
”
3,6”
5”
,4”
3 6”
4
3”
3”
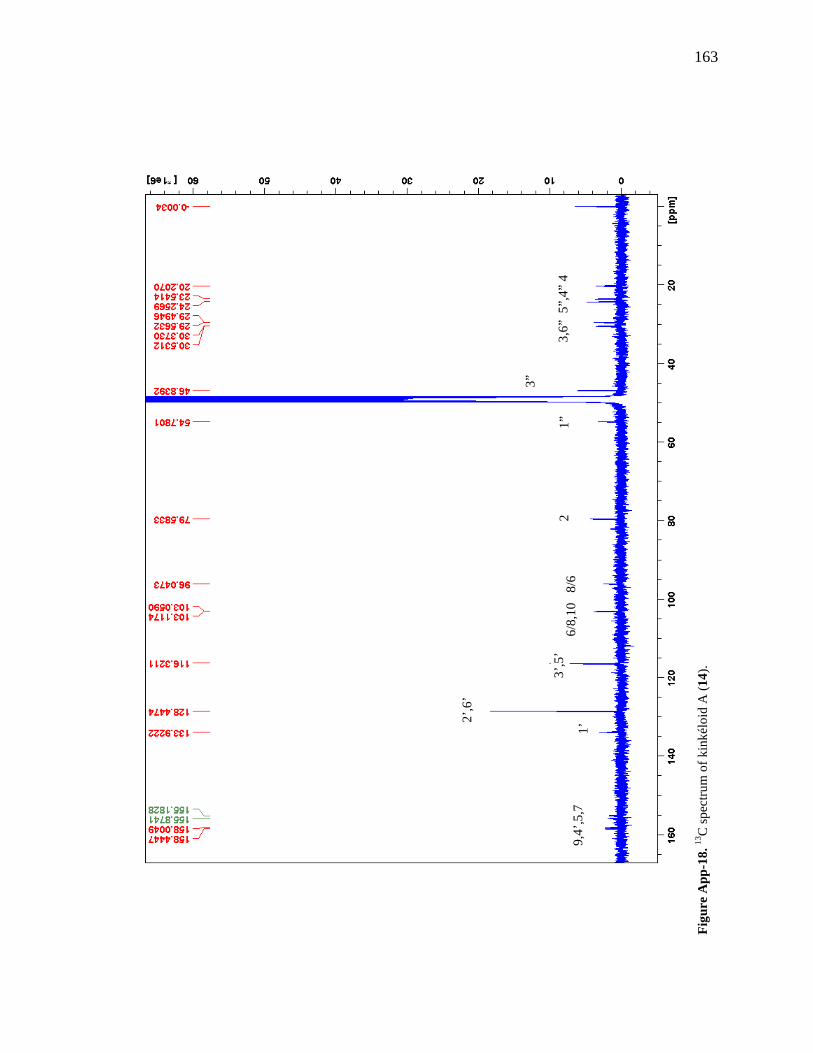
163
Figu
re A
pp-1
8. 13
C sp
ectru
m o
f kin
kélo
id A
(14)
.
9,4’
,5,7
2’,6
’
3’,5
’
1’
6/8,
10
8/6
2 1”
3”
3,6
” 5
”,4”
4
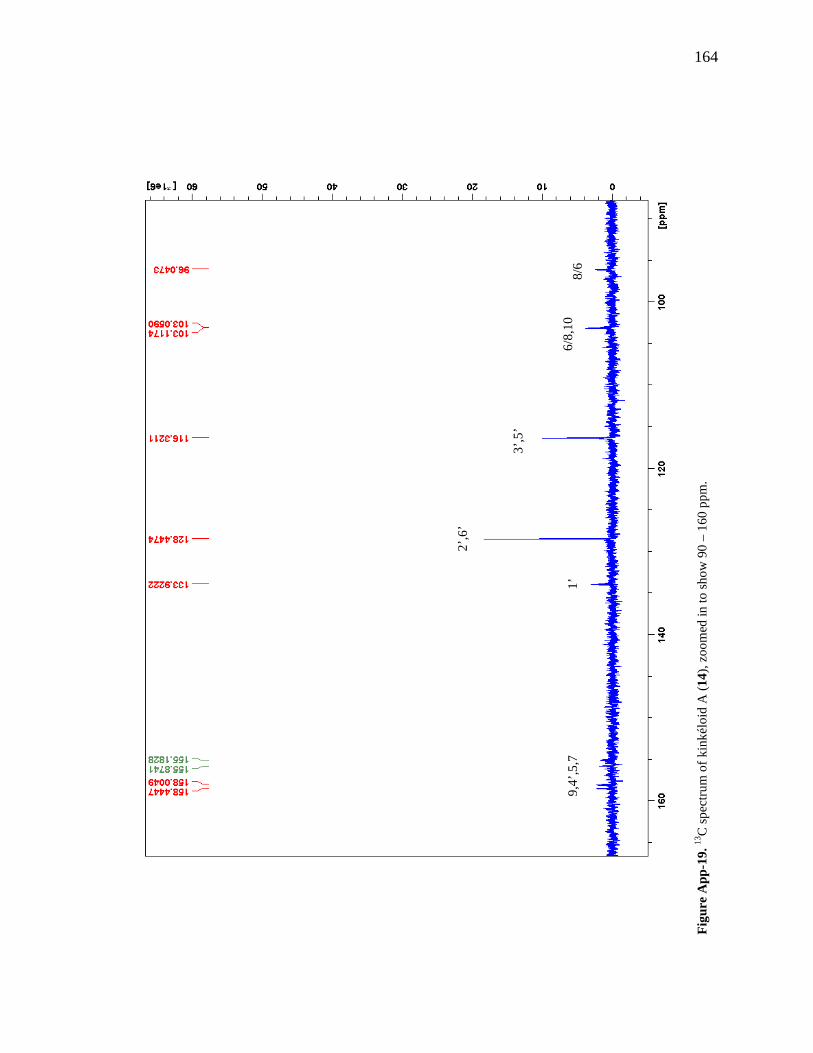
164
Figu
re A
pp-1
9. 13
C sp
ectru
m o
f kin
kélo
id A
(14)
, zoo
med
in to
show
90
– 16
0 pp
m.
9,4’
,5,7
2’,6
’
1’
3’,5
’
6/8,
10
8/6
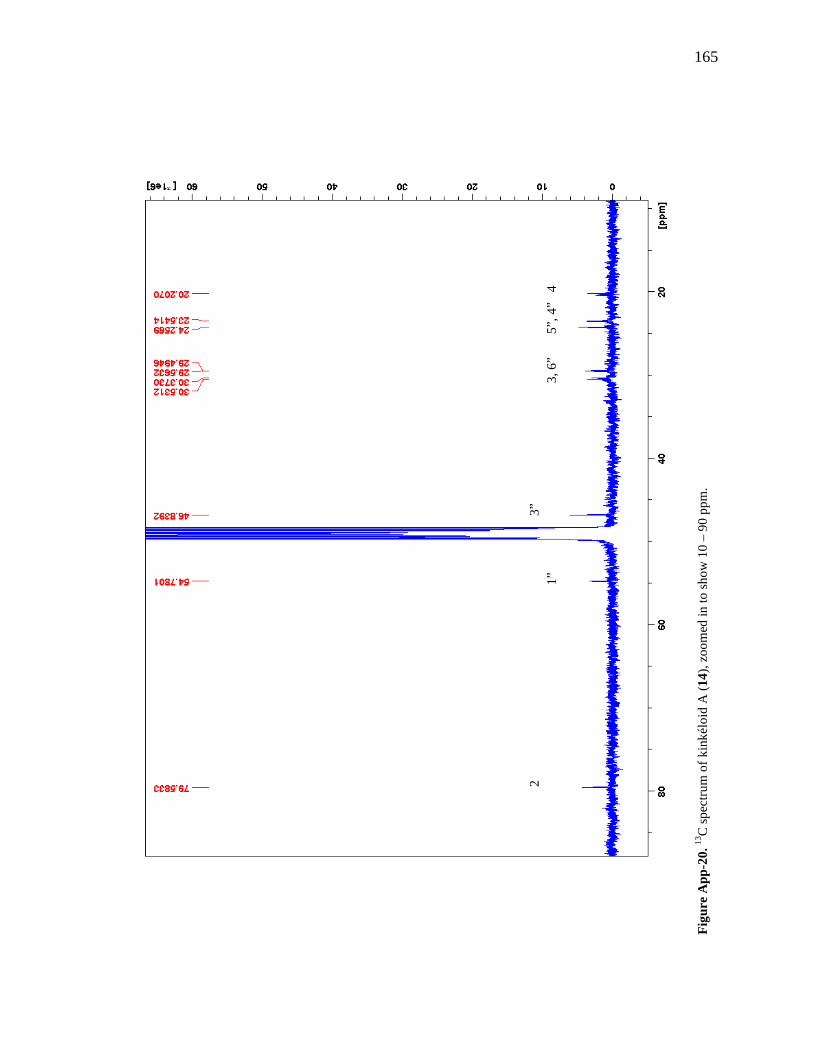
165
Figu
re A
pp-2
0. 13
C sp
ectru
m o
f kin
kélo
id A
(14)
, zoo
med
in to
show
10
– 90
ppm
.
3, 6
”
5”
, 4”
4
2 1”
3”
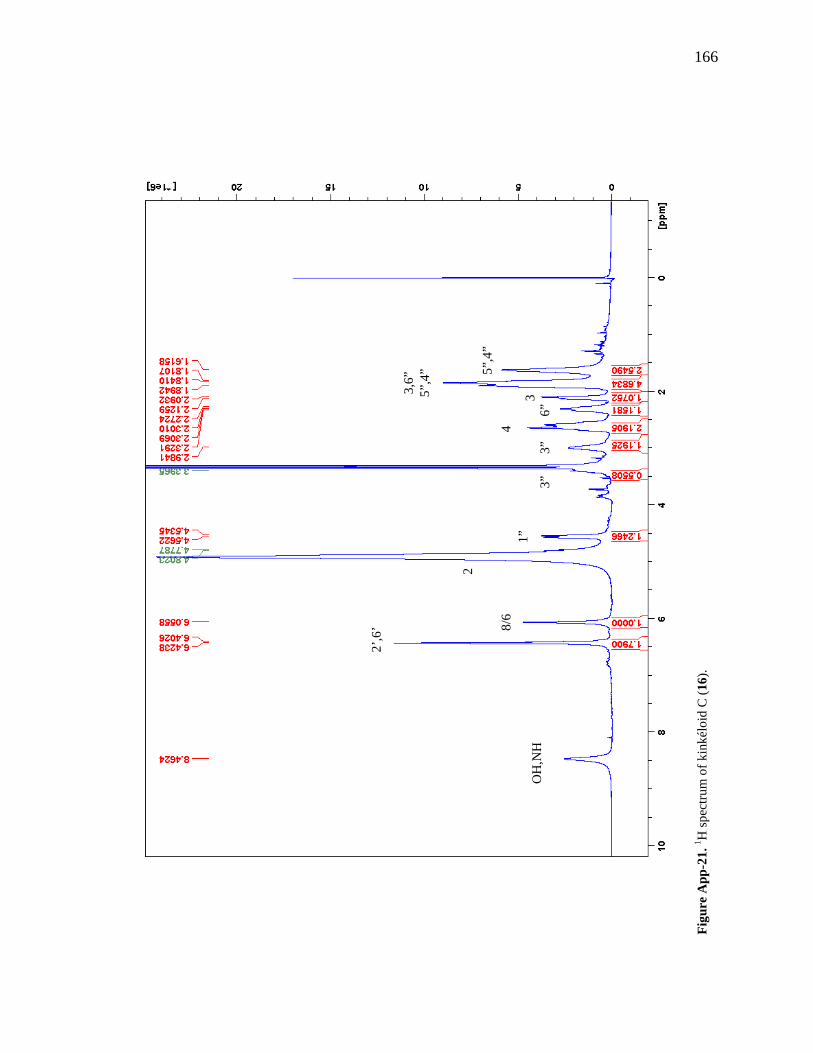
166
Figu
re A
pp-2
1. 1 H
spec
trum
of k
inké
loid
C (1
6).
2’,6
’ 8/6
2
1”
3”
3”
4
6” 3 3,
6”
5”,4
” 5”,4
”
OH
,NH
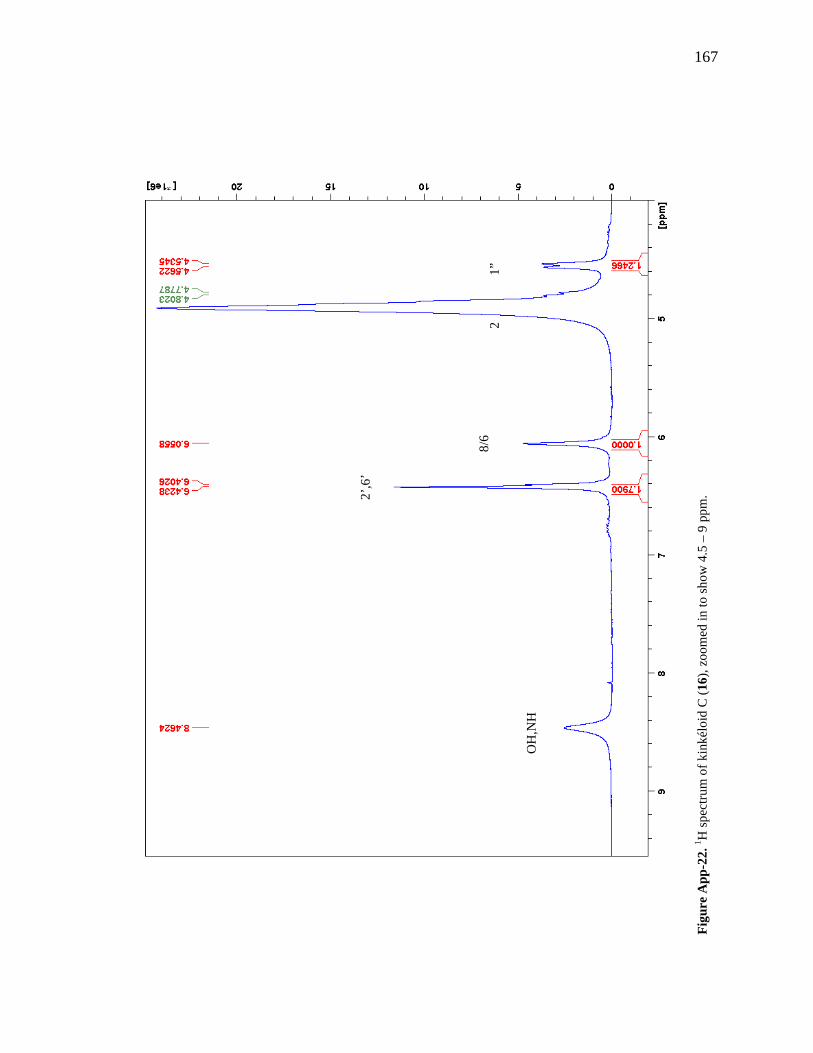
167
Figu
re A
pp-2
2. 1 H
spec
trum
of k
inké
loid
C (1
6), z
oom
ed in
to sh
ow 4
.5 –
9 p
pm. 2’
,6’
8/6
2
1
”
OH
,NH
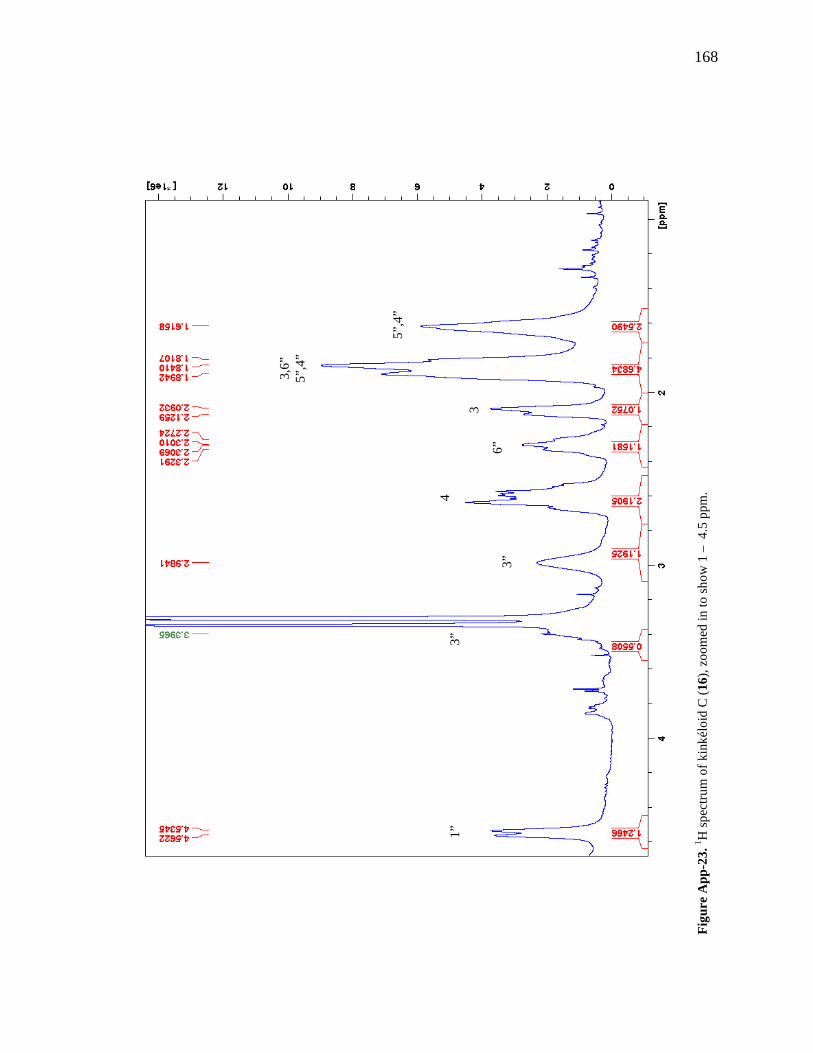
168
Figu
re A
pp-2
3. 1 H
spec
trum
of k
inké
loid
C (1
6), z
oom
ed in
to sh
ow 1
– 4
.5 p
pm.
1”
3”
3”
4
6”
3
3,6”
5”
,4”
5”,4
”
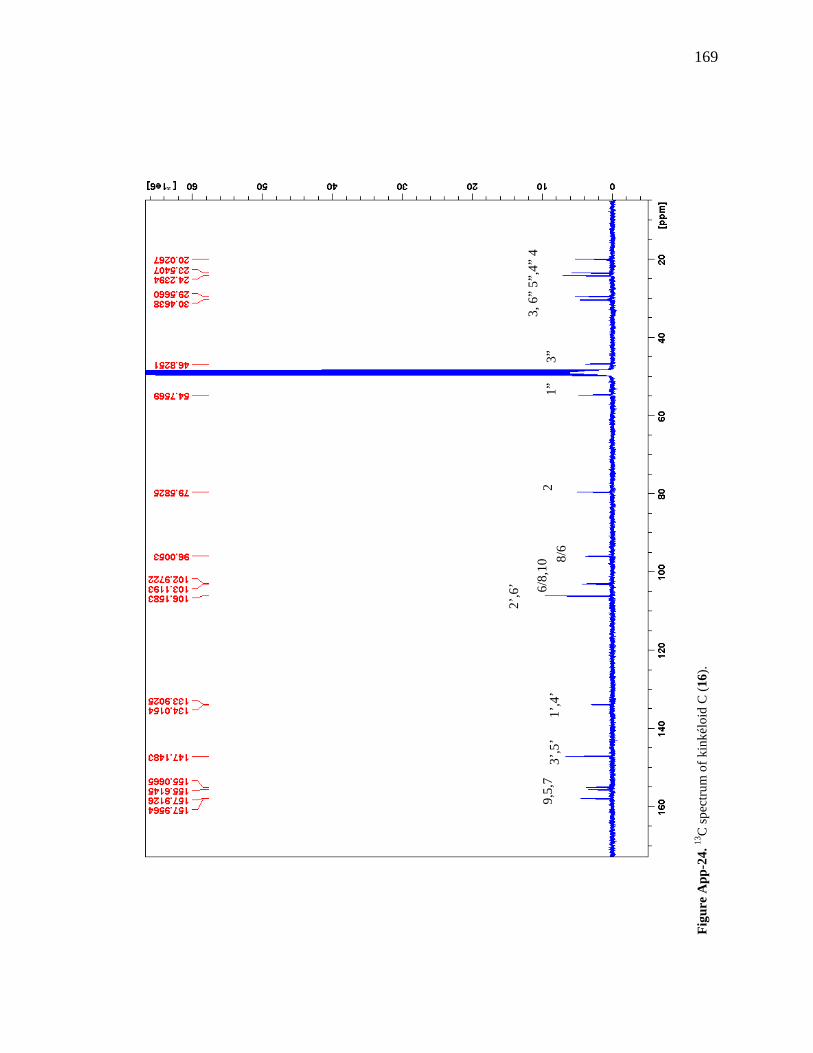
169
Figu
re A
pp-2
4. 13
C sp
ectru
m o
f kin
kélo
id C
(16)
.
9,5,
7
2’,6
’
1’,4
’ 3’
,5’
6/8,
10 8/
6 2
1”
3”
3
, 6”
5”,4
” 4
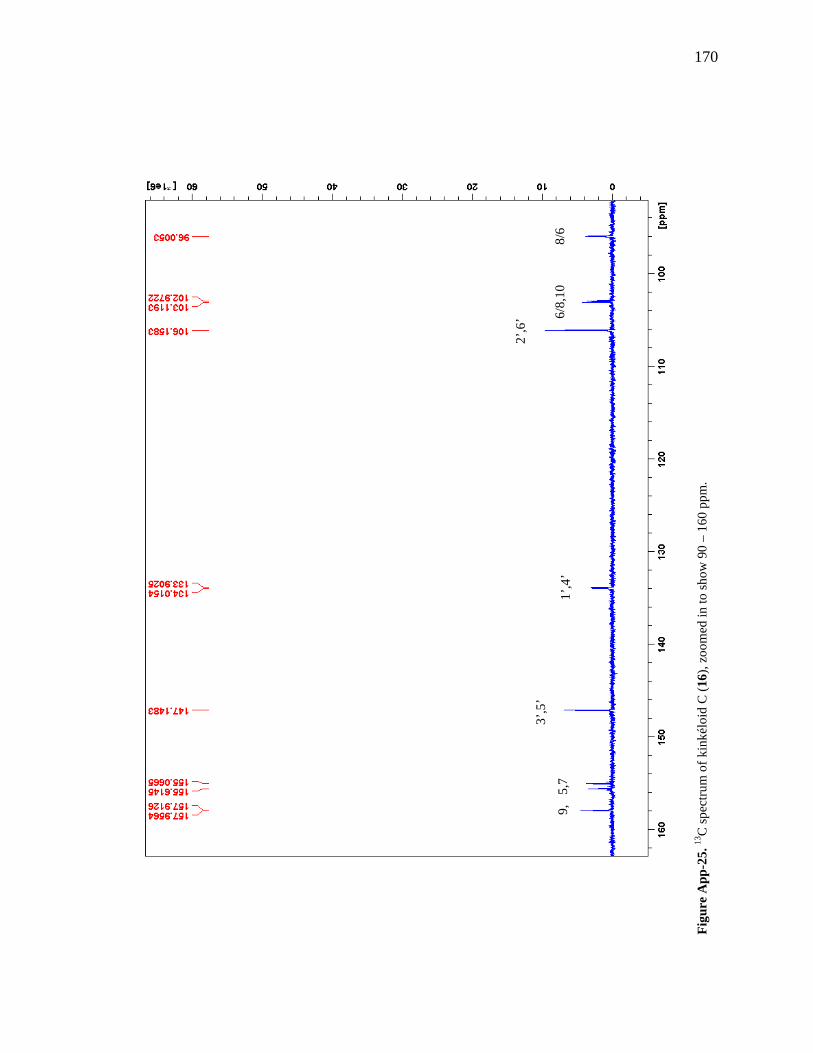
170
Figu
re A
pp-2
5. 13
C sp
ectru
m o
f kin
kélo
id C
(16)
, zoo
med
in to
show
90
– 16
0 pp
m.
9,
5,7
2’,6
’
1’,4
’
3’,5
’ 6/
8,10
8/
6
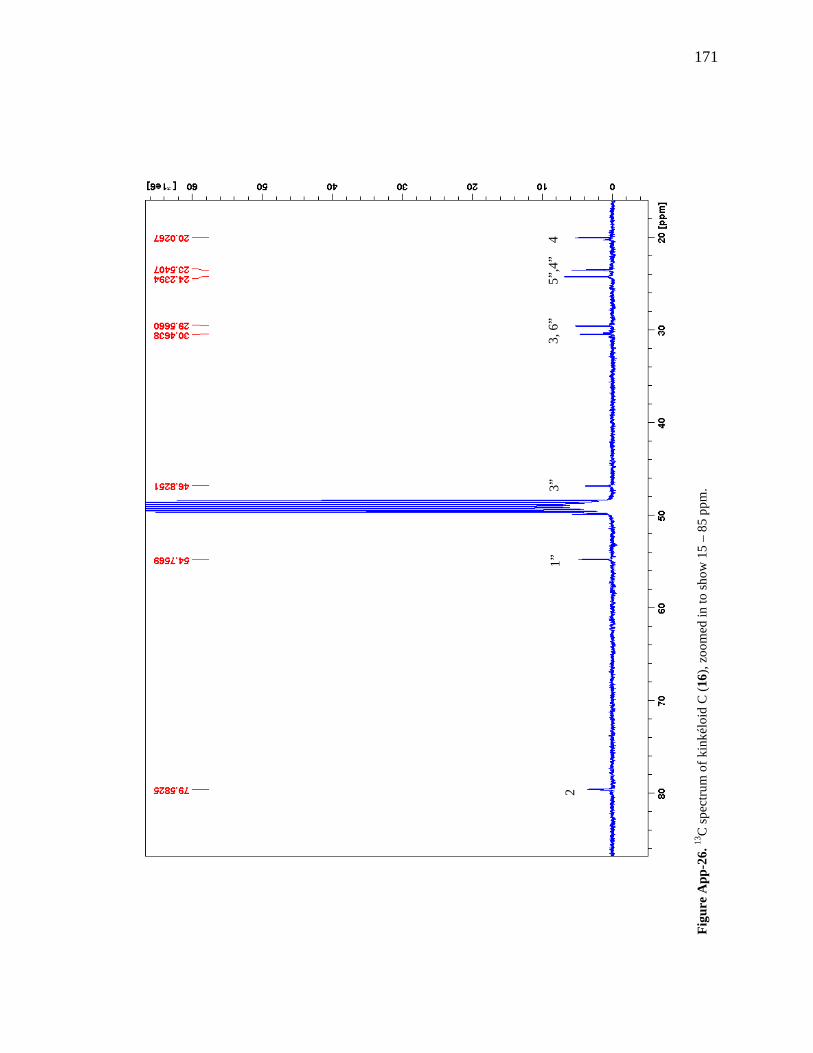
171
Figu
re A
pp-2
6. 13
C sp
ectru
m o
f kin
kélo
id C
(16)
, zoo
med
in to
show
15
– 85
ppm
.
3, 6
”
5”,4
”
4 2
1”
3”
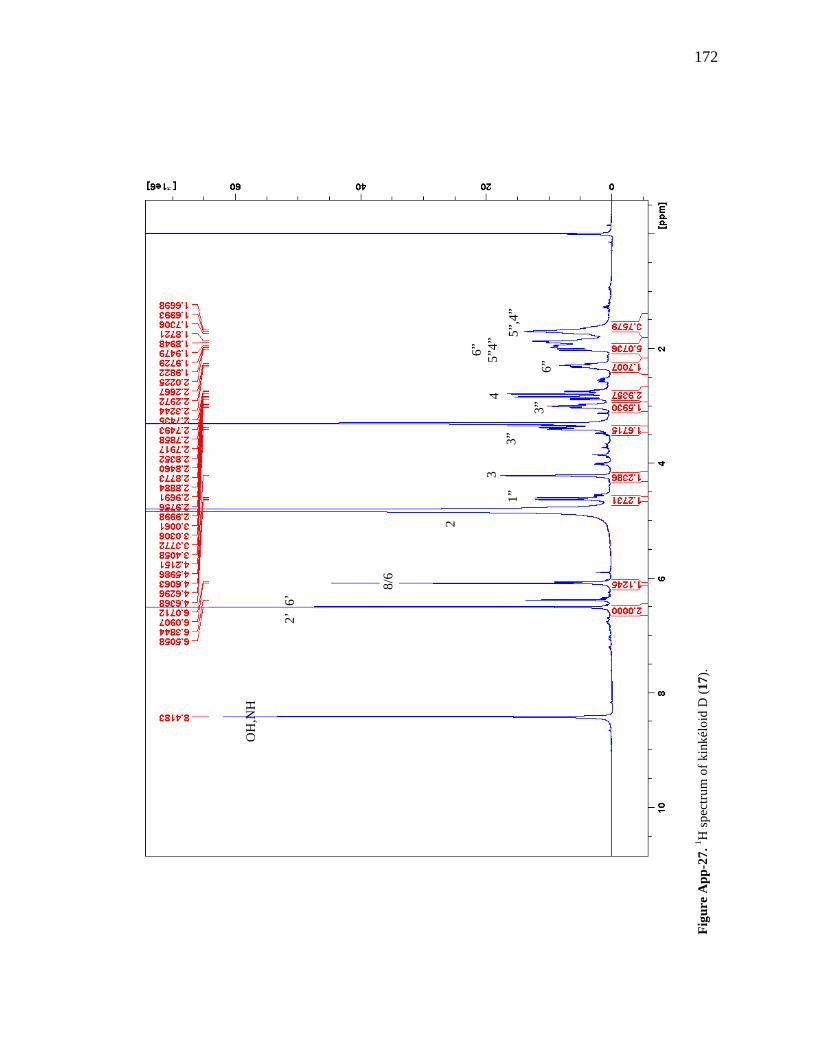
172
Figu
re A
pp-2
7. 1 H
spec
trum
of k
inké
loid
D (1
7).
2’ 6
’
8/6
2
1”
3”
3” 4
6”
3 6
” 5”
4” 5”
,4”
OH
,NH
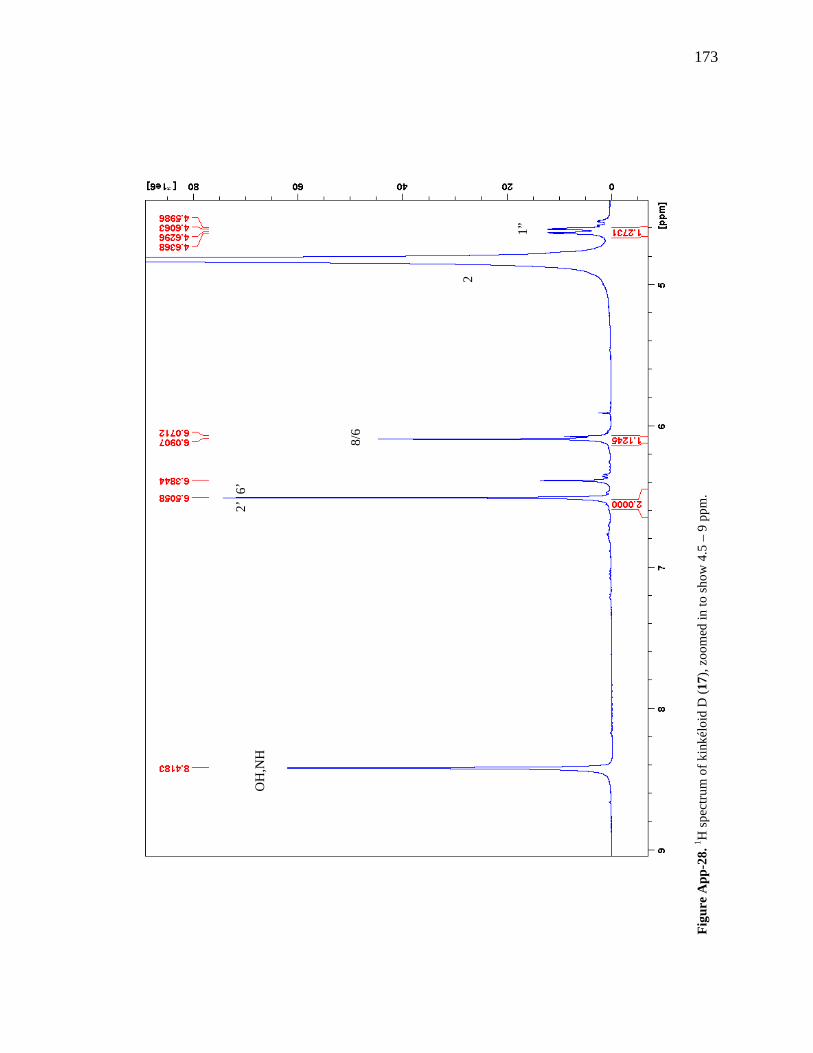
173
Figu
re A
pp-2
8. 1 H
spec
trum
of k
inké
loid
D (1
7), z
oom
ed in
to sh
ow 4
.5 –
9 p
pm.
8/6
2
1”
OH
,NH
2’
6’
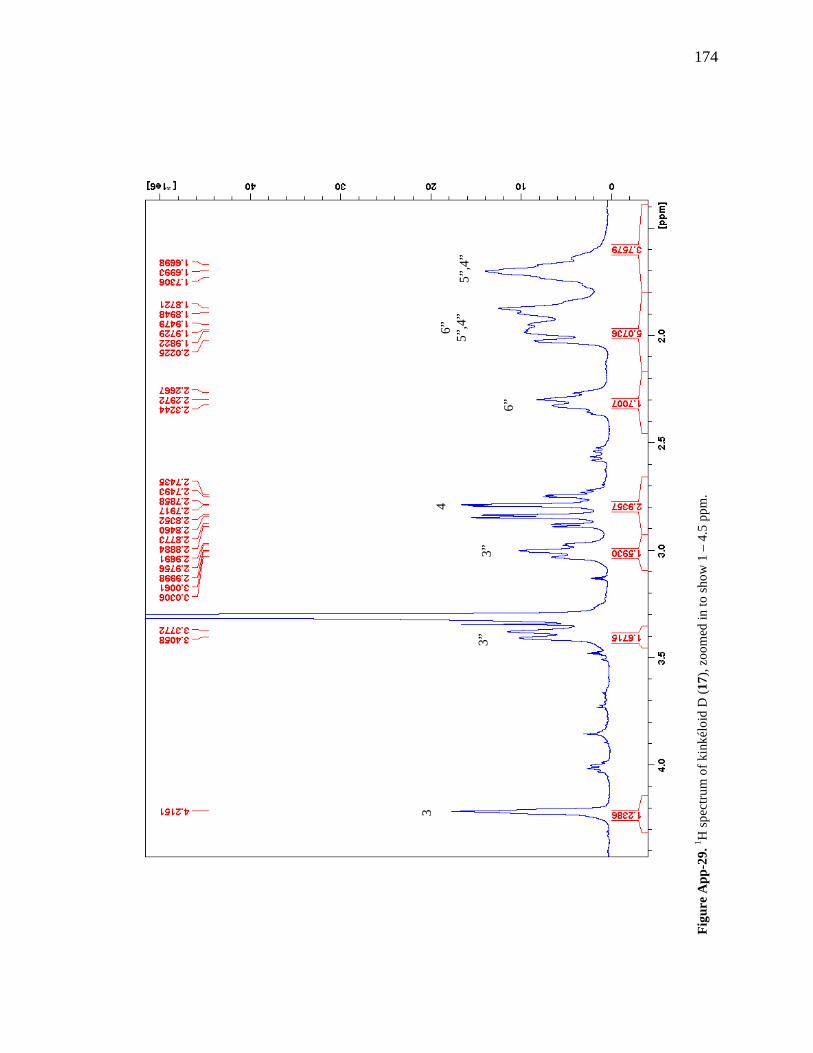
174
Figu
re A
pp-2
9. 1 H
spec
trum
of k
inké
loid
D (1
7), z
oom
ed in
to sh
ow 1
– 4
.5 p
pm.
3”
3”
4
6”
3 6”
5”
,4”
5”,4
”
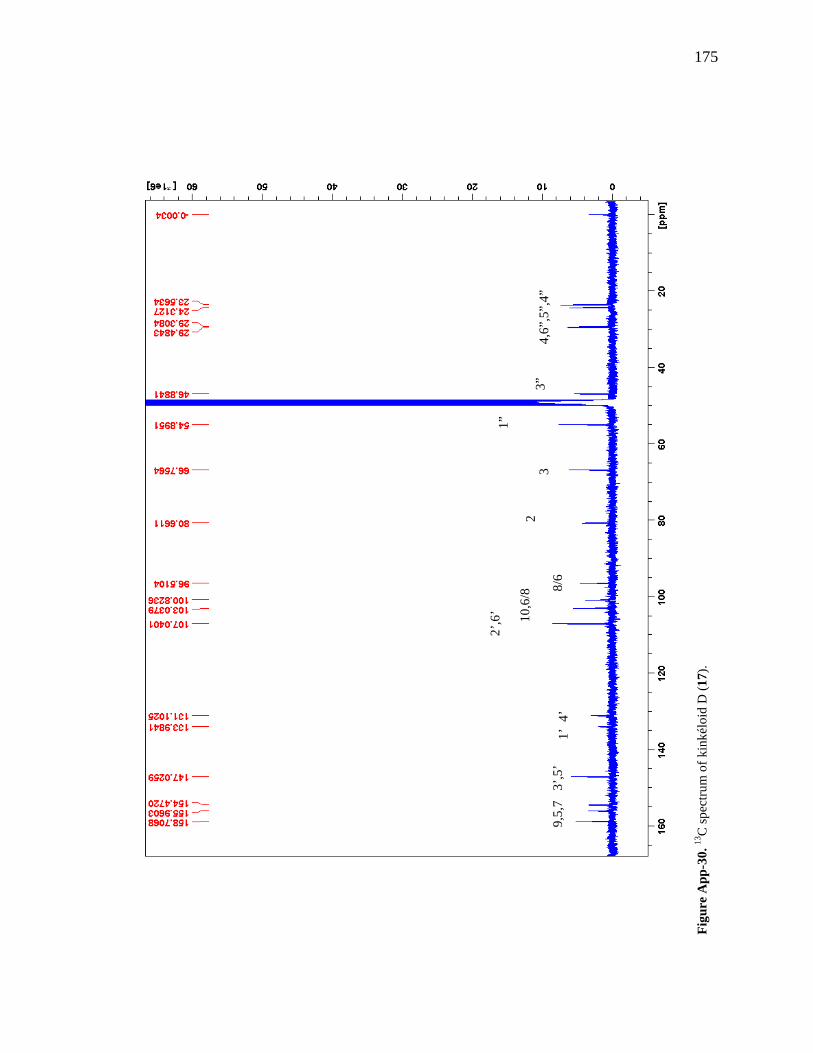
175
Figu
re A
pp-3
0. 13
C sp
ectru
m o
f kin
kélo
id D
(17)
.
9,5,
7 3
’,5’
2’,6
’
1’ 4
’
10,6
/8 8/
6
2
1”
3”
3 4
,6”,
5”,4
”
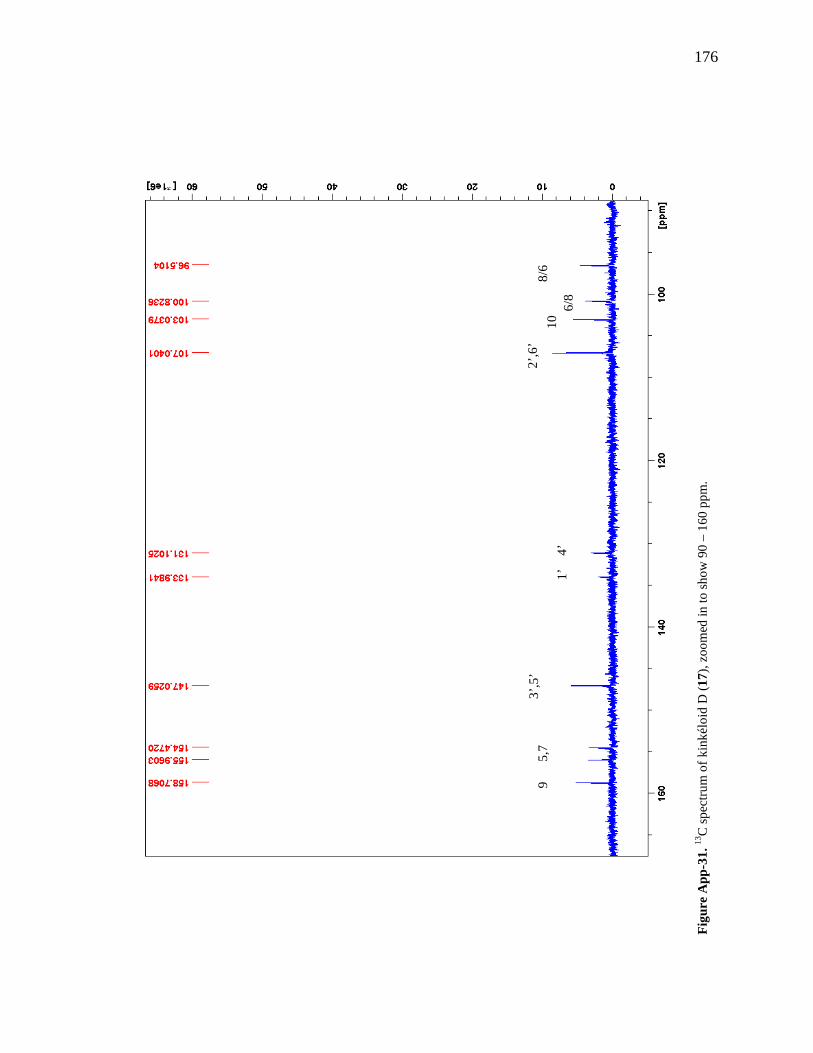
176
Figu
re A
pp-3
1. 13
C sp
ectru
m o
f kin
kélo
id D
(17)
, zoo
med
in to
show
90
– 16
0 pp
m.
9
5,7
2’
,6’
1’
4’
3’,5
’
6/8
8/6
10
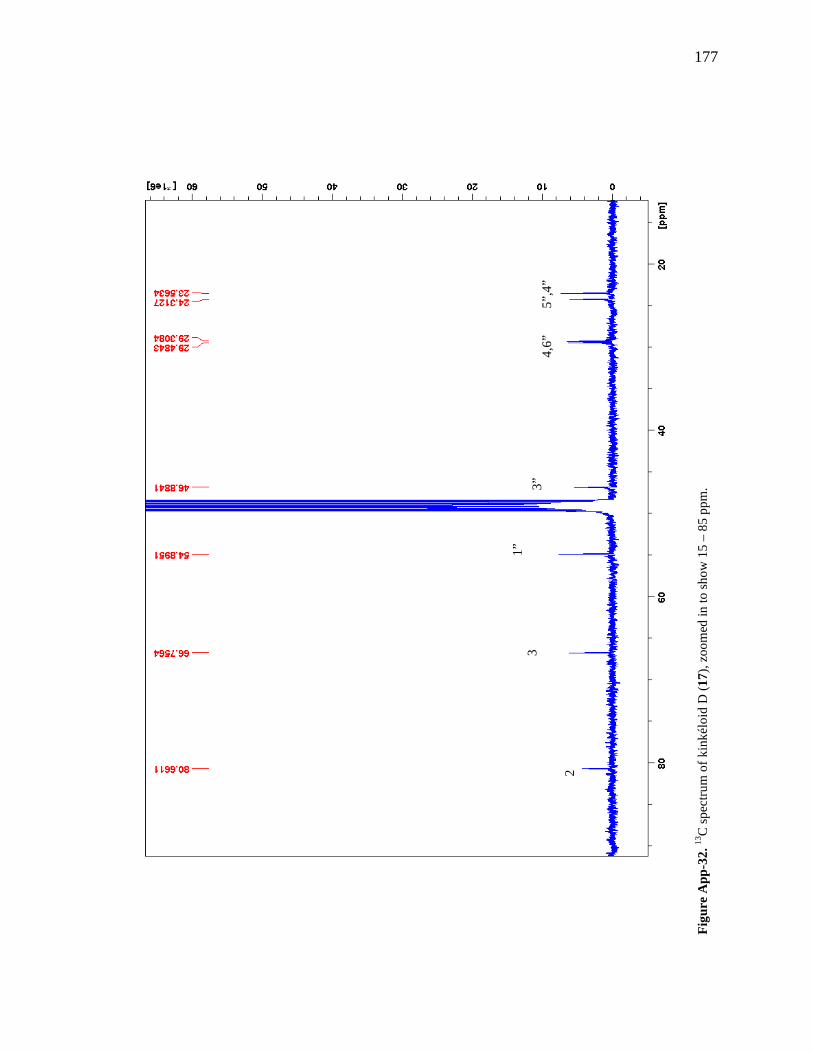
177
Figu
re A
pp-3
2. 13
C sp
ectru
m o
f kin
kélo
id D
(17)
, zoo
med
in to
show
15
– 85
ppm
.
4,6
”
5
”,4”
2
3 1”
3”
178
Recent Advances in Anthocyanin Analysis and Characterization
Cara R. Welcha, Qingli Wub* and James E. Simonb
aDepartment of Medicinal Chemistry, Ernest Mario School of Pharmacy,
Rutgers University, Piscataway, New Jersey 08854
bNew Use Agriculture and Natural Plant Products Program, Department of Plant Biology and Pathology, Cook College,
Rutgers University, New Brunswick, New Jersey 08901
*address correspondence to this author at Department of Plant Biology & Pathology,
Cook College, 59 Dudley Road, New Brunswick, New Jersey 08901
Phone: 732-932-9711 x367 Fax: 732-932-9441 E-mail: [email protected]
179
Abstract: Anthocyanins are a class of polyphenols responsible for the orange, red, purple and blue colors of many fruits, vegetables, grains, flowers and other plants. Consumption of anthocyanins has been linked as protective agents against many chronic diseases and possesses strong antioxidant properties leading to a variety of health benefits. In this review, we examine the advances in the chemical profiling of natural anthocyanins in plant and biological matrices using various chromatographic separations (HPLC and CE) coupled with different detection systems (UV, MS and NMR). An overview of anthocyanin chemistry, prevalence in plants, biosynthesis and metabolism, bioactivities and health properties, sample preparation and phytochemical investigations are discussed while the major focus examines the comparative advantages and disadvantages of each analytical technique. Keywords: Anthocyanins; Polyphenols; Plant sources; Analytical methodology; HPLC; CE
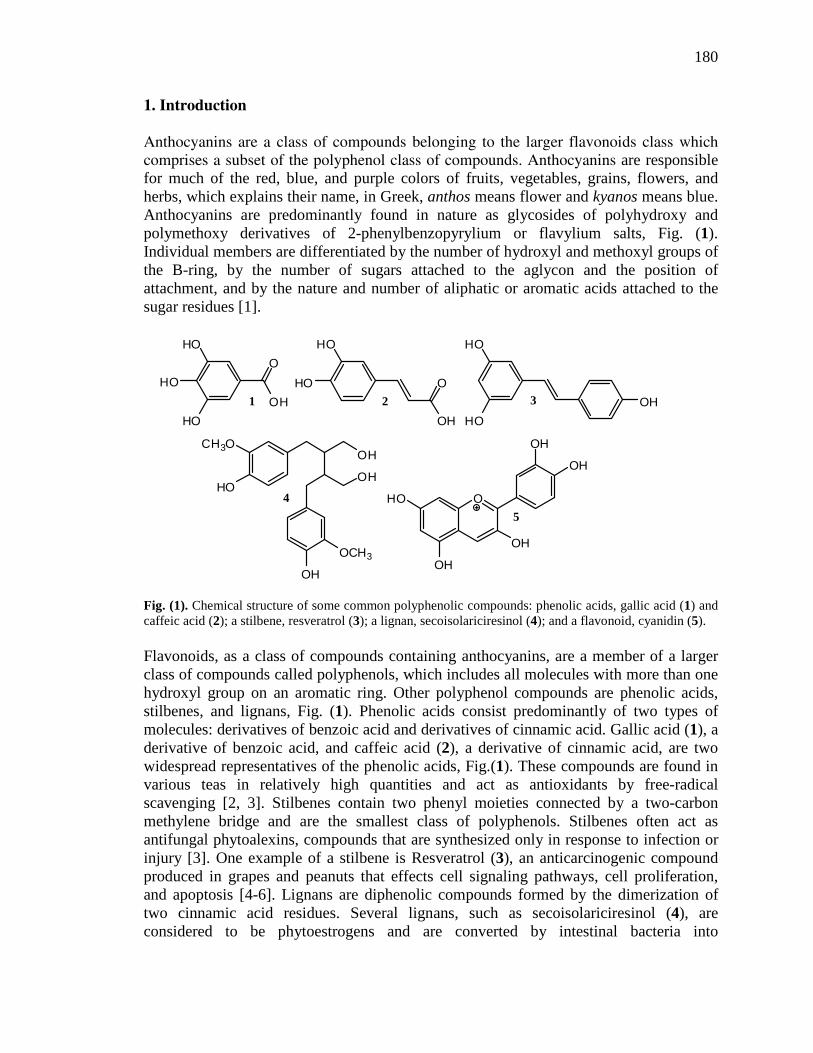
180
1. Introduction Anthocyanins are a class of compounds belonging to the larger flavonoids class which comprises a subset of the polyphenol class of compounds. Anthocyanins are responsible for much of the red, blue, and purple colors of fruits, vegetables, grains, flowers, and herbs, which explains their name, in Greek, anthos means flower and kyanos means blue. Anthocyanins are predominantly found in nature as glycosides of polyhydroxy and polymethoxy derivatives of 2-phenylbenzopyrylium or flavylium salts, Fig. (1). Individual members are differentiated by the number of hydroxyl and methoxyl groups of the B-ring, by the number of sugars attached to the aglycon and the position of attachment, and by the nature and number of aliphatic or aromatic acids attached to the sugar residues [1].
Fig. (1). Chemical structure of some common polyphenolic compounds: phenolic acids, gallic acid (1) and caffeic acid (2); a stilbene, resveratrol (3); a lignan, secoisolariciresinol (4); and a flavonoid, cyanidin (5). Flavonoids, as a class of compounds containing anthocyanins, are a member of a larger class of compounds called polyphenols, which includes all molecules with more than one hydroxyl group on an aromatic ring. Other polyphenol compounds are phenolic acids, stilbenes, and lignans, Fig. (1). Phenolic acids consist predominantly of two types of molecules: derivatives of benzoic acid and derivatives of cinnamic acid. Gallic acid (1), a derivative of benzoic acid, and caffeic acid (2), a derivative of cinnamic acid, are two widespread representatives of the phenolic acids, Fig.(1). These compounds are found in various teas in relatively high quantities and act as antioxidants by free-radical scavenging [2, 3]. Stilbenes contain two phenyl moieties connected by a two-carbon methylene bridge and are the smallest class of polyphenols. Stilbenes often act as antifungal phytoalexins, compounds that are synthesized only in response to infection or injury [3]. One example of a stilbene is Resveratrol (3), an anticarcinogenic compound produced in grapes and peanuts that effects cell signaling pathways, cell proliferation, and apoptosis [4-6]. Lignans are diphenolic compounds formed by the dimerization of two cinnamic acid residues. Several lignans, such as secoisolariciresinol (4), are considered to be phytoestrogens and are converted by intestinal bacteria into
HO
HO
HOOH
OHO
HO
O
OH
HO
HO1 2 3
4
OH
OH
OH
OCH3
OH
CH3O
HOOHO
OH
OH
OH
OH
5
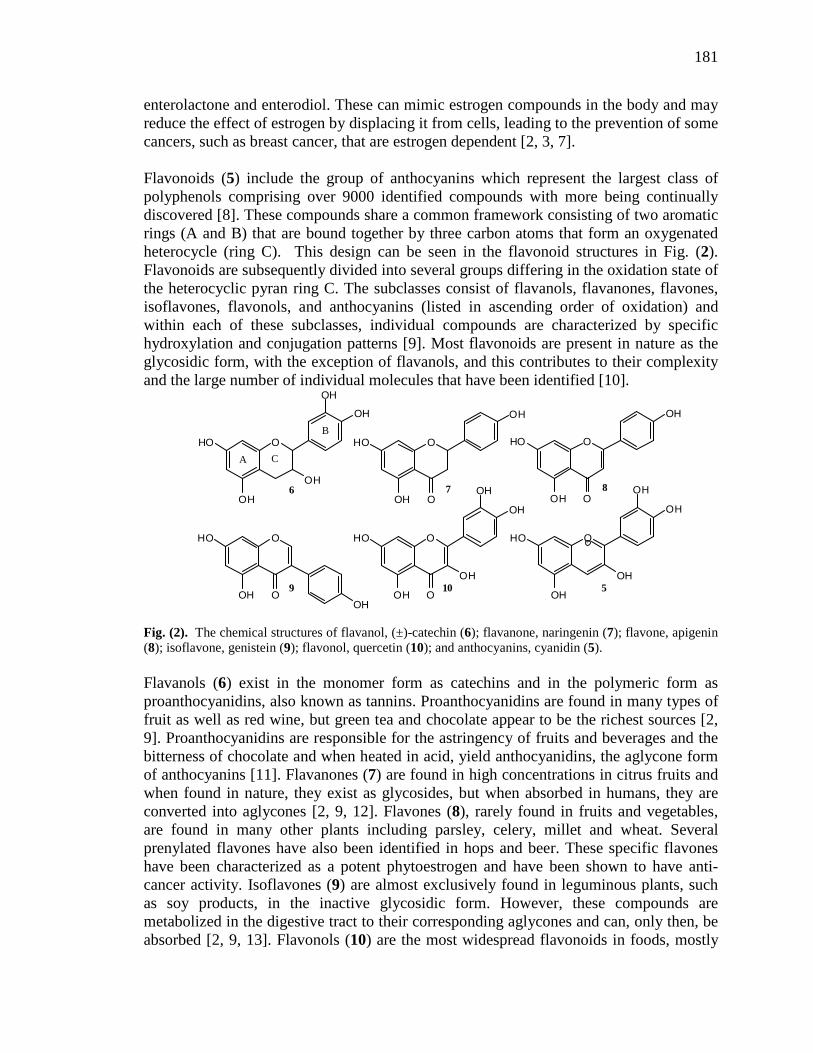
181
enterolactone and enterodiol. These can mimic estrogen compounds in the body and may reduce the effect of estrogen by displacing it from cells, leading to the prevention of some cancers, such as breast cancer, that are estrogen dependent [2, 3, 7]. Flavonoids (5) include the group of anthocyanins which represent the largest class of polyphenols comprising over 9000 identified compounds with more being continually discovered [8]. These compounds share a common framework consisting of two aromatic rings (A and B) that are bound together by three carbon atoms that form an oxygenated heterocycle (ring C). This design can be seen in the flavonoid structures in Fig. (2). Flavonoids are subsequently divided into several groups differing in the oxidation state of the heterocyclic pyran ring C. The subclasses consist of flavanols, flavanones, flavones, isoflavones, flavonols, and anthocyanins (listed in ascending order of oxidation) and within each of these subclasses, individual compounds are characterized by specific hydroxylation and conjugation patterns [9]. Most flavonoids are present in nature as the glycosidic form, with the exception of flavanols, and this contributes to their complexity and the large number of individual molecules that have been identified [10]. Fig. (2). The chemical structures of flavanol, (±)-catechin (6); flavanone, naringenin (7); flavone, apigenin (8); isoflavone, genistein (9); flavonol, quercetin (10); and anthocyanins, cyanidin (5). Flavanols (6) exist in the monomer form as catechins and in the polymeric form as proanthocyanidins, also known as tannins. Proanthocyanidins are found in many types of fruit as well as red wine, but green tea and chocolate appear to be the richest sources [2, 9]. Proanthocyanidins are responsible for the astringency of fruits and beverages and the bitterness of chocolate and when heated in acid, yield anthocyanidins, the aglycone form of anthocyanins [11]. Flavanones (7) are found in high concentrations in citrus fruits and when found in nature, they exist as glycosides, but when absorbed in humans, they are converted into aglycones [2, 9, 12]. Flavones (8), rarely found in fruits and vegetables, are found in many other plants including parsley, celery, millet and wheat. Several prenylated flavones have also been identified in hops and beer. These specific flavones have been characterized as a potent phytoestrogen and have been shown to have anti-cancer activity. Isoflavones (9) are almost exclusively found in leguminous plants, such as soy products, in the inactive glycosidic form. However, these compounds are metabolized in the digestive tract to their corresponding aglycones and can, only then, be absorbed [2, 9, 13]. Flavonols (10) are the most widespread flavonoids in foods, mostly
OHO
OH
OH
OH
OH
OHO
OH
OH
O
OHO
OH
OH
O
OHO
OH OOH
OHO
OH
OH
O
OH
OH
OHO
OH
OH
OH
OH
A C
B
6 7 8
9 10 5
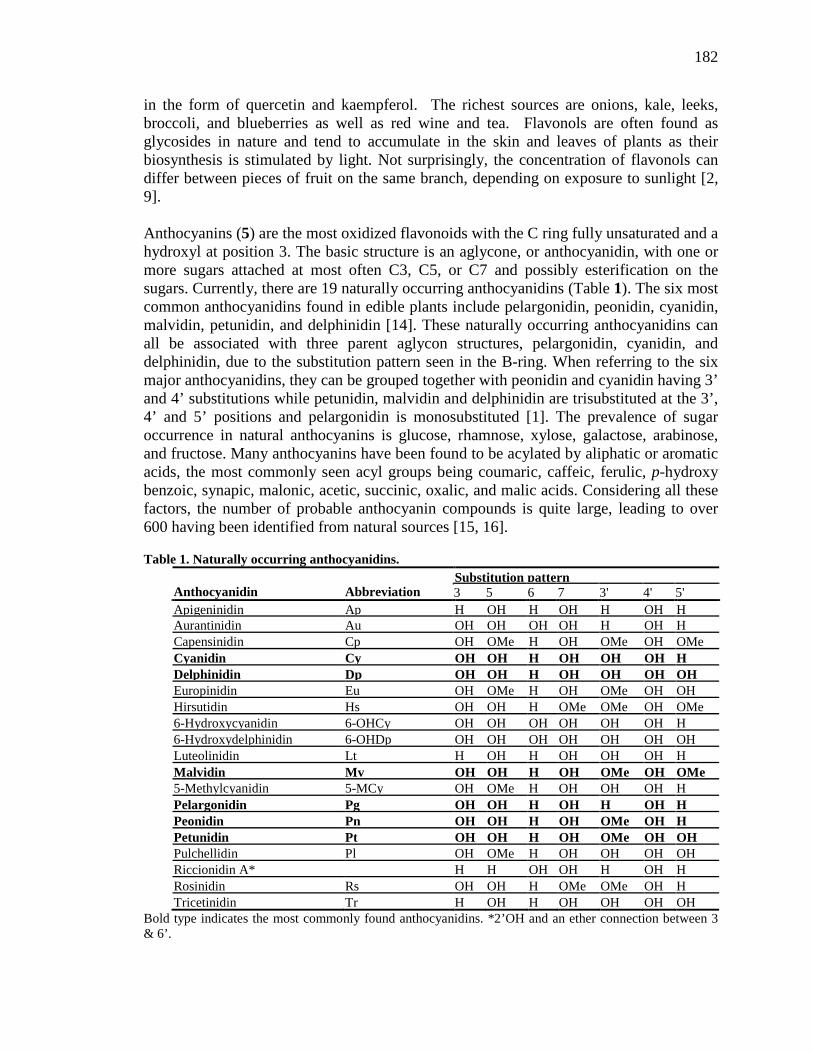
182
in the form of quercetin and kaempferol. The richest sources are onions, kale, leeks, broccoli, and blueberries as well as red wine and tea. Flavonols are often found as glycosides in nature and tend to accumulate in the skin and leaves of plants as their biosynthesis is stimulated by light. Not surprisingly, the concentration of flavonols can differ between pieces of fruit on the same branch, depending on exposure to sunlight [2, 9]. Anthocyanins (5) are the most oxidized flavonoids with the C ring fully unsaturated and a hydroxyl at position 3. The basic structure is an aglycone, or anthocyanidin, with one or more sugars attached at most often C3, C5, or C7 and possibly esterification on the sugars. Currently, there are 19 naturally occurring anthocyanidins (Table 1). The six most common anthocyanidins found in edible plants include pelargonidin, peonidin, cyanidin, malvidin, petunidin, and delphinidin [14]. These naturally occurring anthocyanidins can all be associated with three parent aglycon structures, pelargonidin, cyanidin, and delphinidin, due to the substitution pattern seen in the B-ring. When referring to the six major anthocyanidins, they can be grouped together with peonidin and cyanidin having 3’ and 4’ substitutions while petunidin, malvidin and delphinidin are trisubstituted at the 3’, 4’ and 5’ positions and pelargonidin is monosubstituted [1]. The prevalence of sugar occurrence in natural anthocyanins is glucose, rhamnose, xylose, galactose, arabinose, and fructose. Many anthocyanins have been found to be acylated by aliphatic or aromatic acids, the most commonly seen acyl groups being coumaric, caffeic, ferulic, p-hydroxy benzoic, synapic, malonic, acetic, succinic, oxalic, and malic acids. Considering all these factors, the number of probable anthocyanin compounds is quite large, leading to over 600 having been identified from natural sources [15, 16].
Table 1. Naturally occurring anthocyanidins.
Anthocyanidin Abbreviation Substitution pattern 3 5 6 7 3' 4' 5'
Apigeninidin Ap H OH H OH H OH H Aurantinidin Au OH OH OH OH H OH H Capensinidin Cp OH OMe H OH OMe OH OMe Cyanidin Cy OH OH H OH OH OH H Delphinidin Dp OH OH H OH OH OH OH Europinidin Eu OH OMe H OH OMe OH OH Hirsutidin Hs OH OH H OMe OMe OH OMe 6-Hydroxycyanidin 6-OHCy OH OH OH OH OH OH H 6-Hydroxydelphinidin 6-OHDp OH OH OH OH OH OH OH Luteolinidin Lt H OH H OH OH OH H Malvidin Mv OH OH H OH OMe OH OMe 5-Methylcyanidin 5-MCy OH OMe H OH OH OH H Pelargonidin Pg OH OH H OH H OH H Peonidin Pn OH OH H OH OMe OH H Petunidin Pt OH OH H OH OMe OH OH Pulchellidin Pl OH OMe H OH OH OH OH Riccionidin A* H H OH OH H OH H Rosinidin Rs OH OH H OMe OMe OH H Tricetinidin Tr H OH H OH OH OH OH
Bold type indicates the most commonly found anthocyanidins. *2’OH and an ether connection between 3 & 6’.
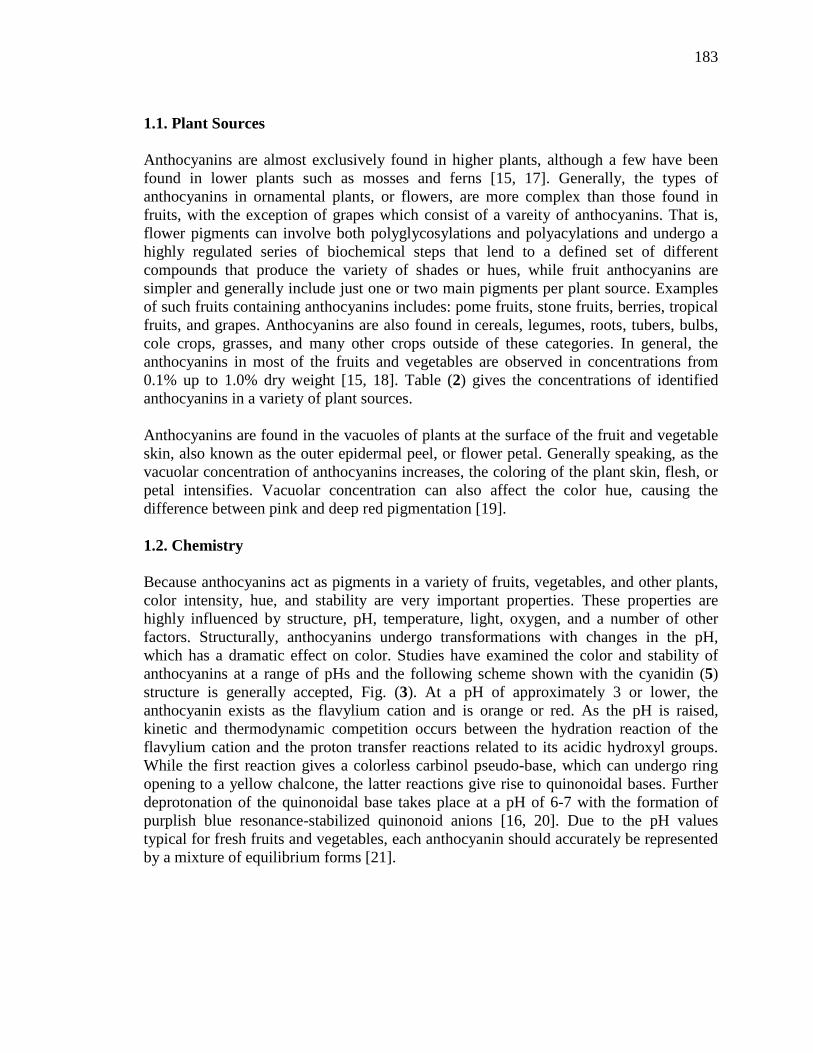
183
1.1. Plant Sources
Anthocyanins are almost exclusively found in higher plants, although a few have been found in lower plants such as mosses and ferns [15, 17]. Generally, the types of anthocyanins in ornamental plants, or flowers, are more complex than those found in fruits, with the exception of grapes which consist of a vareity of anthocyanins. That is, flower pigments can involve both polyglycosylations and polyacylations and undergo a highly regulated series of biochemical steps that lend to a defined set of different compounds that produce the variety of shades or hues, while fruit anthocyanins are simpler and generally include just one or two main pigments per plant source. Examples of such fruits containing anthocyanins includes: pome fruits, stone fruits, berries, tropical fruits, and grapes. Anthocyanins are also found in cereals, legumes, roots, tubers, bulbs, cole crops, grasses, and many other crops outside of these categories. In general, the anthocyanins in most of the fruits and vegetables are observed in concentrations from 0.1% up to 1.0% dry weight [15, 18]. Table (2) gives the concentrations of identified anthocyanins in a variety of plant sources. Anthocyanins are found in the vacuoles of plants at the surface of the fruit and vegetable skin, also known as the outer epidermal peel, or flower petal. Generally speaking, as the vacuolar concentration of anthocyanins increases, the coloring of the plant skin, flesh, or petal intensifies. Vacuolar concentration can also affect the color hue, causing the difference between pink and deep red pigmentation [19]. 1.2. Chemistry Because anthocyanins act as pigments in a variety of fruits, vegetables, and other plants, color intensity, hue, and stability are very important properties. These properties are highly influenced by structure, pH, temperature, light, oxygen, and a number of other factors. Structurally, anthocyanins undergo transformations with changes in the pH, which has a dramatic effect on color. Studies have examined the color and stability of anthocyanins at a range of pHs and the following scheme shown with the cyanidin (5) structure is generally accepted, Fig. (3). At a pH of approximately 3 or lower, the anthocyanin exists as the flavylium cation and is orange or red. As the pH is raised, kinetic and thermodynamic competition occurs between the hydration reaction of the flavylium cation and the proton transfer reactions related to its acidic hydroxyl groups. While the first reaction gives a colorless carbinol pseudo-base, which can undergo ring opening to a yellow chalcone, the latter reactions give rise to quinonoidal bases. Further deprotonation of the quinonoidal base takes place at a pH of 6-7 with the formation of purplish blue resonance-stabilized quinonoid anions [16, 20]. Due to the pH values typical for fresh fruits and vegetables, each anthocyanin should accurately be represented by a mixture of equilibrium forms [21].
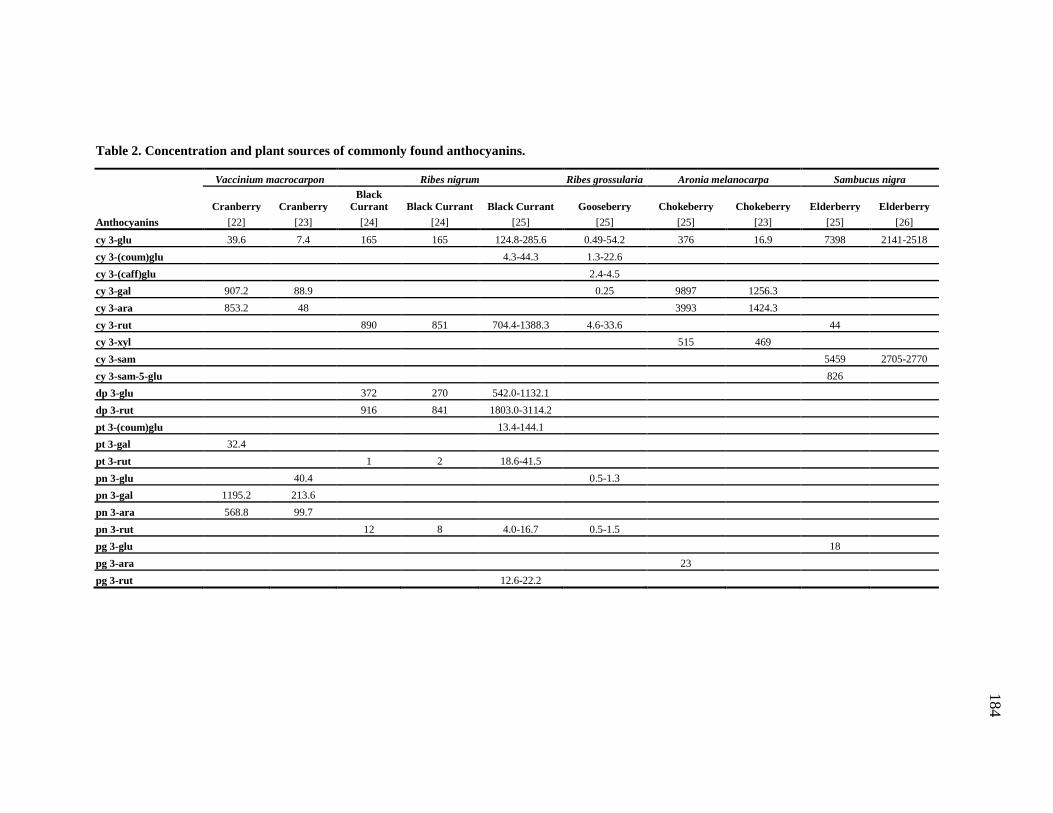
Table 2. Concentration and plant sources of commonly found anthocyanins.
Vaccinium macrocarpon Ribes nigrum Ribes grossularia Aronia melanocarpa Sambucus nigra
Cranberry Cranberry Black
Currant Black Currant Black Currant Gooseberry Chokeberry Chokeberry Elderberry Elderberry Anthocyanins [22] [23] [24] [24] [25] [25] [25] [23] [25] [26]
cy 3-glu 39.6 7.4 165 165 124.8-285.6 0.49-54.2 376 16.9 7398 2141-2518 cy 3-(coum)glu 4.3-44.3 1.3-22.6 cy 3-(caff)glu 2.4-4.5 cy 3-gal 907.2 88.9 0.25 9897 1256.3 cy 3-ara 853.2 48 3993 1424.3 cy 3-rut 890 851 704.4-1388.3 4.6-33.6 44 cy 3-xyl 515 469 cy 3-sam 5459 2705-2770 cy 3-sam-5-glu 826 dp 3-glu 372 270 542.0-1132.1 dp 3-rut 916 841 1803.0-3114.2 pt 3-(coum)glu 13.4-144.1 pt 3-gal 32.4 pt 3-rut 1 2 18.6-41.5 pn 3-glu 40.4 0.5-1.3 pn 3-gal 1195.2 213.6 pn 3-ara 568.8 99.7 pn 3-rut 12 8 4.0-16.7 0.5-1.5 pg 3-glu 18 pg 3-ara 23 pg 3-rut 12.6-22.2
184
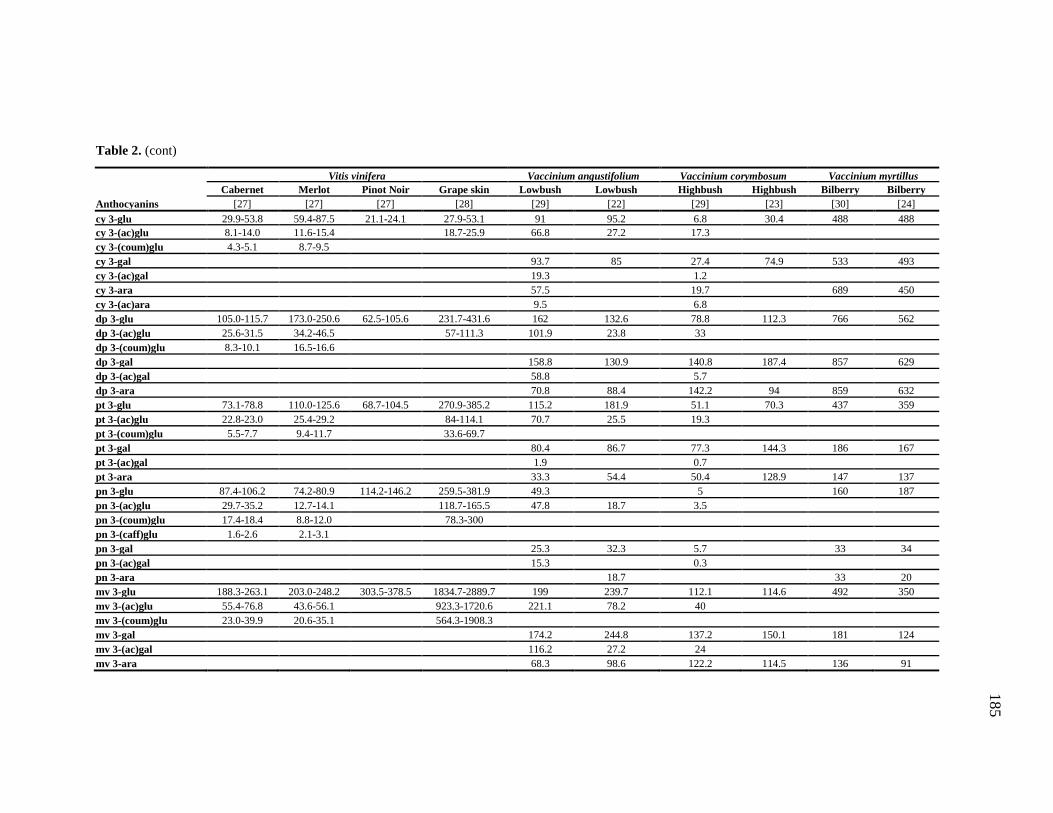
185
Table 2. (cont)
Vitis vinifera Vaccinium angustifolium Vaccinium corymbosum Vaccinium myrtillus Cabernet
Merlot Pinot Noir Grape skin Lowbush
Lowbush
Highbush
Highbush
Bilberry Bilberry
Anthocyanins [27] [27] [27] [28] [29] [22] [29] [23] [30] [24] cy 3-glu 29.9-53.8 59.4-87.5 21.1-24.1 27.9-53.1 91 95.2 6.8 30.4 488 488 cy 3-(ac)glu 8.1-14.0 11.6-15.4 18.7-25.9 66.8 27.2 17.3 cy 3-(coum)glu 4.3-5.1 8.7-9.5 cy 3-gal 93.7 85 27.4 74.9 533 493 cy 3-(ac)gal 19.3 1.2 cy 3-ara 57.5 19.7 689 450 cy 3-(ac)ara 9.5 6.8 dp 3-glu 105.0-115.7 173.0-250.6 62.5-105.6 231.7-431.6 162 132.6 78.8 112.3 766 562 dp 3-(ac)glu 25.6-31.5 34.2-46.5 57-111.3 101.9 23.8 33 dp 3-(coum)glu 8.3-10.1 16.5-16.6 dp 3-gal 158.8 130.9 140.8 187.4 857 629 dp 3-(ac)gal 58.8 5.7 dp 3-ara 70.8 88.4 142.2 94 859 632 pt 3-glu 73.1-78.8 110.0-125.6 68.7-104.5 270.9-385.2 115.2 181.9 51.1 70.3 437 359 pt 3-(ac)glu 22.8-23.0 25.4-29.2 84-114.1 70.7 25.5 19.3 pt 3-(coum)glu 5.5-7.7 9.4-11.7 33.6-69.7 pt 3-gal 80.4 86.7 77.3 144.3 186 167 pt 3-(ac)gal 1.9 0.7 pt 3-ara 33.3 54.4 50.4 128.9 147 137 pn 3-glu 87.4-106.2 74.2-80.9 114.2-146.2 259.5-381.9 49.3 5 160 187 pn 3-(ac)glu 29.7-35.2 12.7-14.1 118.7-165.5 47.8 18.7 3.5 pn 3-(coum)glu 17.4-18.4 8.8-12.0 78.3-300 pn 3-(caff)glu 1.6-2.6 2.1-3.1 pn 3-gal 25.3 32.3 5.7 33 34 pn 3-(ac)gal 15.3 0.3 pn 3-ara 18.7 33 20 mv 3-glu 188.3-263.1 203.0-248.2 303.5-378.5 1834.7-2889.7 199 239.7 112.1 114.6 492 350 mv 3-(ac)glu 55.4-76.8 43.6-56.1 923.3-1720.6 221.1 78.2 40 mv 3-(coum)glu 23.0-39.9 20.6-35.1 564.3-1908.3 mv 3-gal 174.2 244.8 137.2 150.1 181 124 mv 3-(ac)gal 116.2 27.2 24 mv 3-ara 68.3 98.6 122.2 114.5 136 91
184
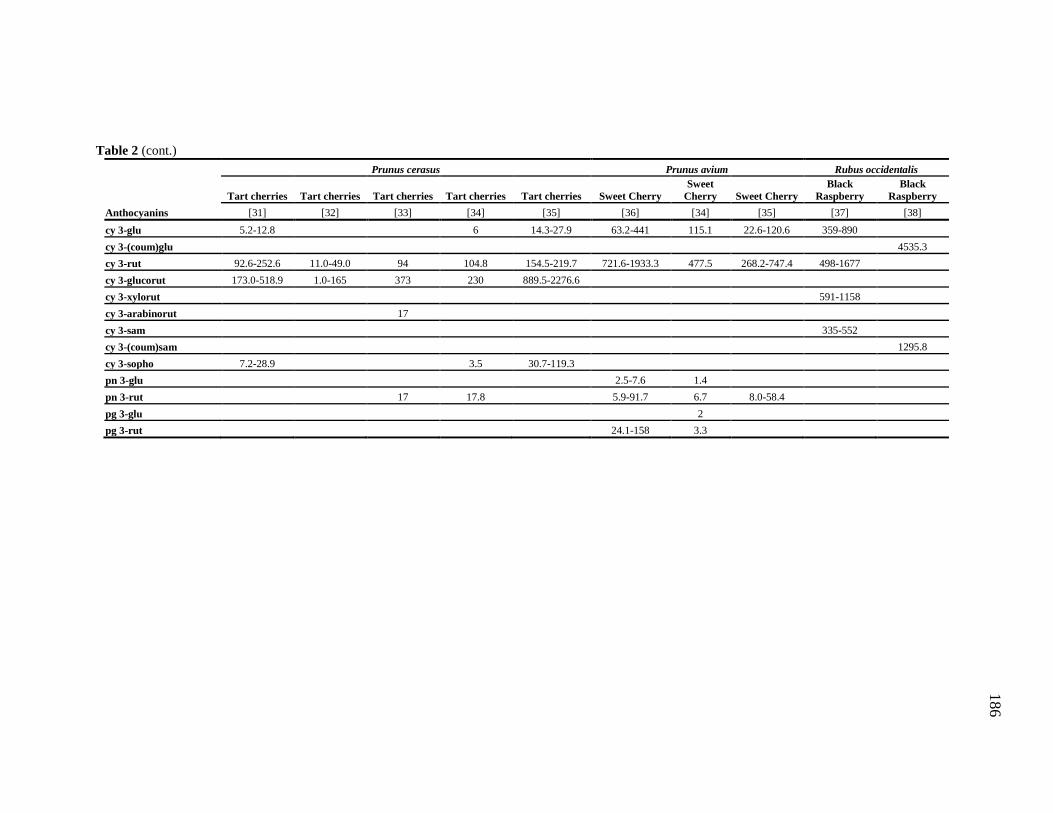
186
Table 2 (cont.) Prunus cerasus Prunus avium Rubus occidentalis
Tart cherries Tart cherries Tart cherries Tart cherries Tart cherries Sweet Cherry Sweet
Cherry Sweet Cherry Black
Raspberry Black
Raspberry Anthocyanins [31] [32] [33] [34] [35] [36] [34] [35] [37] [38] cy 3-glu 5.2-12.8 6 14.3-27.9 63.2-441 115.1 22.6-120.6 359-890 cy 3-(coum)glu 4535.3 cy 3-rut 92.6-252.6 11.0-49.0 94 104.8 154.5-219.7 721.6-1933.3 477.5 268.2-747.4 498-1677 cy 3-glucorut 173.0-518.9 1.0-165 373 230 889.5-2276.6 cy 3-xylorut 591-1158 cy 3-arabinorut 17 cy 3-sam 335-552 cy 3-(coum)sam 1295.8 cy 3-sopho 7.2-28.9 3.5 30.7-119.3 pn 3-glu 2.5-7.6 1.4 pn 3-rut 17 17.8 5.9-91.7 6.7 8.0-58.4 pg 3-glu 2 pg 3-rut 24.1-158 3.3
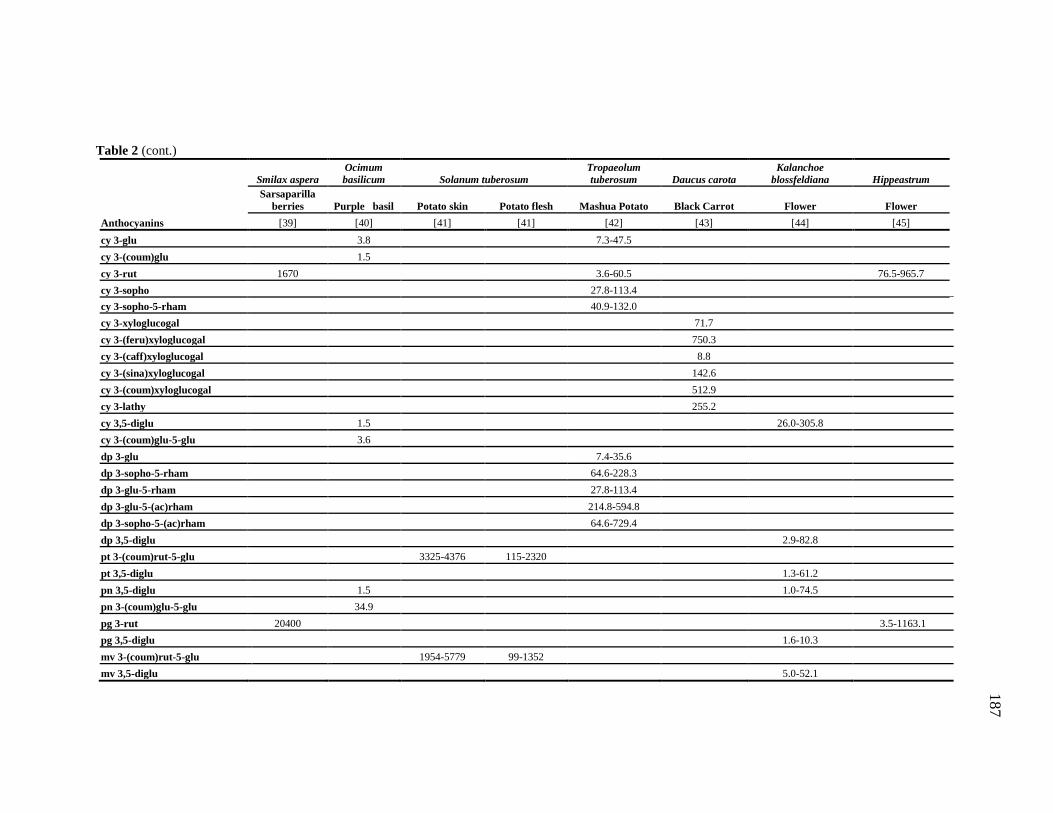
187
Table 2 (cont.)
Smilax aspera Ocimum basilicum Solanum tuberosum
Tropaeolum tuberosum Daucus carota
Kalanchoe blossfeldiana Hippeastrum
Sarsaparilla
berries Purple basil Potato skin Potato flesh Mashua Potato Black Carrot Flower Flower Anthocyanins [39] [40] [41] [41] [42] [43] [44] [45] cy 3-glu 3.8 7.3-47.5 cy 3-(coum)glu 1.5 cy 3-rut 1670 3.6-60.5 76.5-965.7 cy 3-sopho 27.8-113.4 cy 3-sopho-5-rham 40.9-132.0 cy 3-xyloglucogal 71.7 cy 3-(feru)xyloglucogal 750.3 cy 3-(caff)xyloglucogal 8.8 cy 3-(sina)xyloglucogal 142.6 cy 3-(coum)xyloglucogal 512.9 cy 3-lathy 255.2 cy 3,5-diglu 1.5 26.0-305.8 cy 3-(coum)glu-5-glu 3.6 dp 3-glu 7.4-35.6 dp 3-sopho-5-rham 64.6-228.3 dp 3-glu-5-rham 27.8-113.4 dp 3-glu-5-(ac)rham 214.8-594.8 dp 3-sopho-5-(ac)rham 64.6-729.4 dp 3,5-diglu 2.9-82.8 pt 3-(coum)rut-5-glu 3325-4376 115-2320 pt 3,5-diglu 1.3-61.2 pn 3,5-diglu 1.5 1.0-74.5 pn 3-(coum)glu-5-glu 34.9 pg 3-rut 20400 3.5-1163.1 pg 3,5-diglu 1.6-10.3 mv 3-(coum)rut-5-glu 1954-5779 99-1352 mv 3,5-diglu 5.0-52.1
186
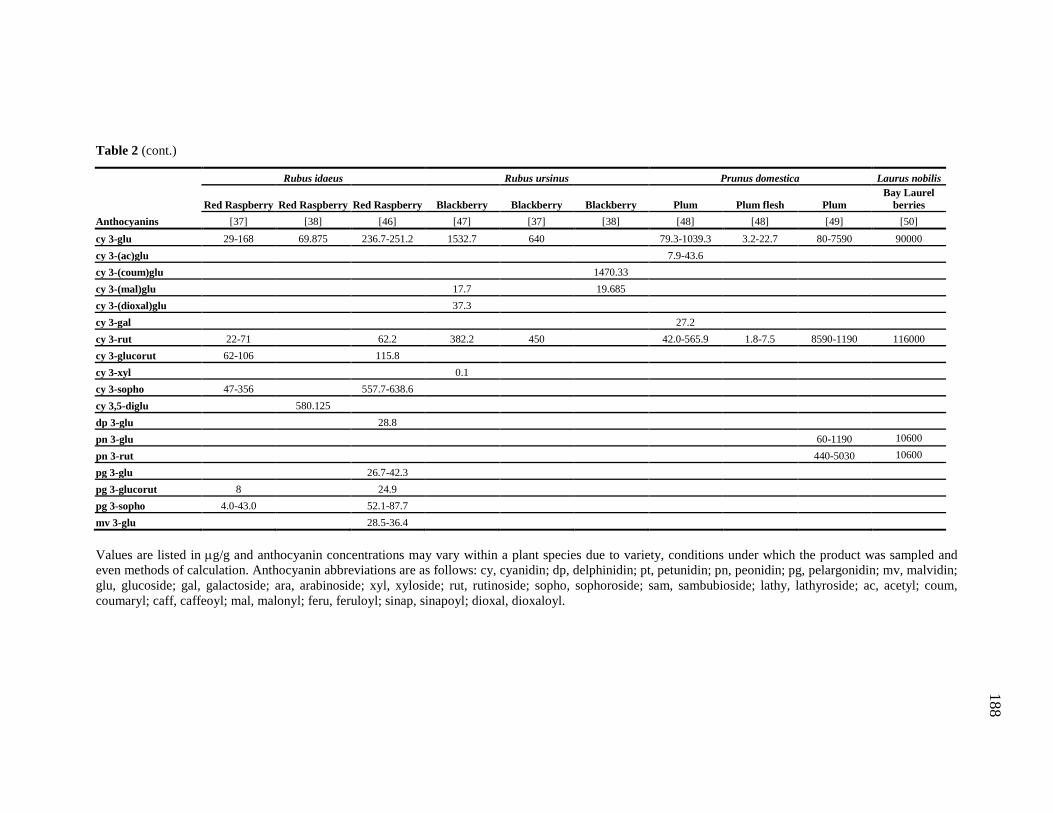
188
Table 2 (cont.)
Values are listed in µg/g and anthocyanin concentrations may vary within a plant species due to variety, conditions under which the product was sampled and even methods of calculation. Anthocyanin abbreviations are as follows: cy, cyanidin; dp, delphinidin; pt, petunidin; pn, peonidin; pg, pelargonidin; mv, malvidin; glu, glucoside; gal, galactoside; ara, arabinoside; xyl, xyloside; rut, rutinoside; sopho, sophoroside; sam, sambubioside; lathy, lathyroside; ac, acetyl; coum, coumaryl; caff, caffeoyl; mal, malonyl; feru, feruloyl; sinap, sinapoyl; dioxal, dioxaloyl.
Rubus idaeus Rubus ursinus Prunus domestica Laurus nobilis
Red Raspberry Red Raspberry Red Raspberry Blackberry Blackberry Blackberry Plum Plum flesh Plum Bay Laurel
berries Anthocyanins [37] [38] [46] [47] [37] [38] [48] [48] [49] [50] cy 3-glu 29-168 69.875 236.7-251.2 1532.7 640 79.3-1039.3 3.2-22.7 80-7590 90000 cy 3-(ac)glu 7.9-43.6 cy 3-(coum)glu 1470.33 cy 3-(mal)glu 17.7 19.685 cy 3-(dioxal)glu 37.3 cy 3-gal 27.2 cy 3-rut 22-71 62.2 382.2 450 42.0-565.9 1.8-7.5 8590-1190 116000 cy 3-glucorut 62-106 115.8 cy 3-xyl 0.1 cy 3-sopho 47-356 557.7-638.6 cy 3,5-diglu 580.125 dp 3-glu 28.8 pn 3-glu 60-1190 10600
pn 3-rut 440-5030 10600
pg 3-glu 26.7-42.3 pg 3-glucorut 8 24.9 pg 3-sopho 4.0-43.0 52.1-87.7 mv 3-glu 28.5-36.4
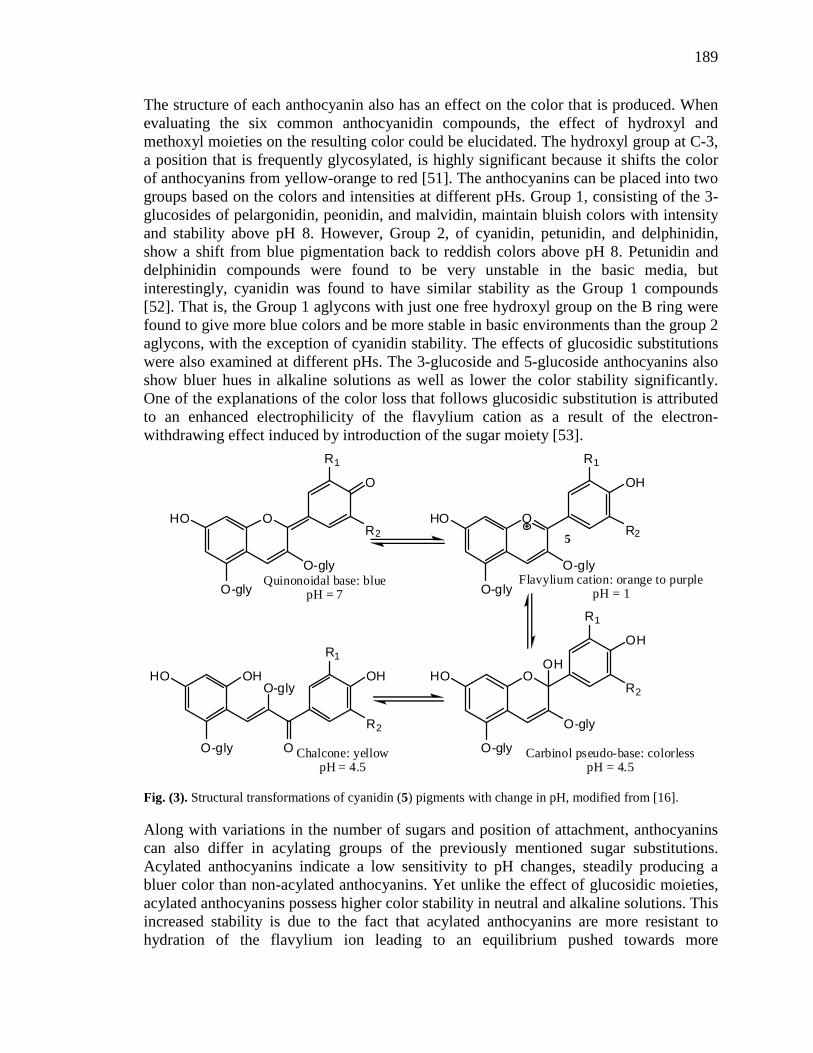
189
The structure of each anthocyanin also has an effect on the color that is produced. When evaluating the six common anthocyanidin compounds, the effect of hydroxyl and methoxyl moieties on the resulting color could be elucidated. The hydroxyl group at C-3, a position that is frequently glycosylated, is highly significant because it shifts the color of anthocyanins from yellow-orange to red [51]. The anthocyanins can be placed into two groups based on the colors and intensities at different pHs. Group 1, consisting of the 3-glucosides of pelargonidin, peonidin, and malvidin, maintain bluish colors with intensity and stability above pH 8. However, Group 2, of cyanidin, petunidin, and delphinidin, show a shift from blue pigmentation back to reddish colors above pH 8. Petunidin and delphinidin compounds were found to be very unstable in the basic media, but interestingly, cyanidin was found to have similar stability as the Group 1 compounds [52]. That is, the Group 1 aglycons with just one free hydroxyl group on the B ring were found to give more blue colors and be more stable in basic environments than the group 2 aglycons, with the exception of cyanidin stability. The effects of glucosidic substitutions were also examined at different pHs. The 3-glucoside and 5-glucoside anthocyanins also show bluer hues in alkaline solutions as well as lower the color stability significantly. One of the explanations of the color loss that follows glucosidic substitution is attributed to an enhanced electrophilicity of the flavylium cation as a result of the electron-withdrawing effect induced by introduction of the sugar moiety [53].
Fig. (3). Structural transformations of cyanidin (5) pigments with change in pH, modified from [16]. Along with variations in the number of sugars and position of attachment, anthocyanins can also differ in acylating groups of the previously mentioned sugar substitutions. Acylated anthocyanins indicate a low sensitivity to pH changes, steadily producing a bluer color than non-acylated anthocyanins. Yet unlike the effect of glucosidic moieties, acylated anthocyanins possess higher color stability in neutral and alkaline solutions. This increased stability is due to the fact that acylated anthocyanins are more resistant to hydration of the flavylium ion leading to an equilibrium pushed towards more
OHO
O-gly
O-gly
R1
O
R2OHO
O-gly
O-gly
R1
OH
R2
OHO
O-gly
O-gly
R1
OH
R2O-glyOHHO
O-gly
R1
OH
R2
OH
O
5
Quinonoidal base: bluepH = 7
Flavylium cation: orange to purplepH = 1
Carbinol pseudo-base: colorlesspH = 4.5
Chalcone: yellowpH = 4.5
190
quinonoidal base forms [21, 54]. In effect, the acylating groups encourage the production of the bluer pigmentation that glucosidic moieties bring forth but also counteract the instability attributed to the sugars. Because anthocyanins are highly reactive and therefore easily degraded, the storage environment plays a critical role in maintaining pigmentation. Light and temperature are both known to breakdown anthocyanins. Anthocyanins are best kept in cool, dark environments as the presence of sunlight and high temperatures result in the loss of pigmentation. The degradation of anthocyanins increases proportionally with the heat of storage and exposure of pigments to temperatures from 65º-90º C for only a short amount of time lowered the color half-life to just a few hours. Anthocyanins have been successfully stored for several weeks at temperatures around 2-4º C [55-58]. Relative to storage and preservation of the anthocyanins is the bleaching effect of sulfur dioxide on these compounds. While SO2 is often added to fruits and vegetables as an inhibitor of microbial growth, it also acts as a nucleophile and attacks the flavylium ion of the anthocyanin, effectively bleaching the pigment as it progresses to the colorless hemiacetal form [59-61]. Anthocyanins are also degraded by oxidative mechanisms involving the enzyme polyphenol oxidase (PPO). PPO can be found in blueberries, strawberries, grapes, and cherries and plays an important role in the browning of these fruit juices. However, polyphenol oxidase cannot degrade anthocyanins on its own, but must be in the presence of another substrate, such as caffeic acid, chlorogenic acid, or gallic acid. All these acids are o-diphenolic compounds found in fruits and are involved in the first step of polyphenolic oxidation. The acid is oxidized to its o-quinone form which then oxidizes the anthocyanin to form brown polymers. The different aglycones will result in different products with o-diphenolic anthocyanidins giving products with part of the original acid incorporated. That is, the cyanidin degradation products involve a coupled oxidation mechanism with partial regeneration of the acid. The non-o-diphenolic anthocyanidins such as pelargonidin react with the quinone to form adducts, still resulting in loss of pigmentation. Because the quinone formation from acid is vital in polyphenol oxidation, reduction of the quinone would effectively inhibit the oxidative degradation of anthocyanins. Addition of ascorbic acid retards the color loss by acting as the hydrogen donor to convert the quinone back into its acid form. As long as ascorbic acid is present in the reaction mixture, the anthocyanins remain preserved in the presence of polyphenol oxidase [62-66]. However, ascorbic acid (vitamin C) on its own has an additional degradation effect on anthocyanins. When ascorbic acid is present in the anthocyanin solution, the introduction of oxygen causes the destruction of both compounds. Ascorbic acid performs an oxidative cleavage of the flavylium ion in a manner analogous to the attack by SO2 [67]. Another property of color hue and intensity is the presence of a copigment. A copigment is another compound that is typically colorless, but when added to anthocyanins, interacts with the anthocyanin and greatly enhances the color of the solution [68]. Intermolecular copigmentation reactions are the result of associations between anthocyanins and cofactors such as other polyphenolics, metal ions, or organic acids to produce weak
191
chemical bonds with increased physical and chemical attributes. When polyphenol compounds act as cofactors towards anthocyanins, the two compounds are held together by vertical hydrophobic stacking of the aromatic nuclei. The flavylium cation is then stabilized by its interaction with the copigment and avoids hydration which would form the colorless carbinol pseudo-base. Rather, more flavylium ions are present in the solution leading to intense red colors [69, 70]. Commonly found organic copigments include catechin, epicatechin, procyanidin B2, caffeic acid, p-coumaric acid, chlorogenic acid, myricitrin, and quercitrin [71]. As expected, the effect of copigmentation on the color and intensity of solutions varies with anthocyanin structure and changing pH environments. The copigment effect increases with both the number of methoxyl moieties and the number of glycosidic groups on each anthocyanidin. That is, copigmentation with pelargonidin, peonidin, and malvidin would produce more intense colors than the other common aglycons or a diglycosidic form would increase the intensity over a monoglycoside [68]. Also, copigmentation increases color intensity at pH values from about 2 to neutral. This indicates that a copigment stabilizes not only the flavylium ion but also the quinonoidal base that is found at neutral pHs and leads to brighter red colors in acidic media and brighter blue colors at neutrality [68]. Another form of copigmentation found in blue flowers is the complexation of metal ions. These metalloanthocyanins involve a supramolecular metal-complex pigment composed of simple anthocyanins, ones that are commonly found in other flowers, flavone cofactors, and metal ions. The metals include Fe3+, Al3+, Mg2+, and Ca2+ and are essential for the blue pigmentation of the flower petals. All known metalloanthocyanin structures show a chiral molecular stacking of the anthocyanins and flavone cofactors, which distinguishes these pigments from other assemblies of compounds [72-74]. While copigmentation is used to intensify color hues by resisting hydration of the flavylium ion, it does not necessarily increase the stability of the anthocyanins with respect to temperature and the presence of light. Heating of the copigmented anthocyanins causes dissociation of the complex resulting in a loss of color at the same rate as non-copigmented anthocyanins. The influence of UV or visible light on the stability of the anthocyanin-copigment complex is fairly similar to anthocyanins without copigments. The pigment complex is shown to slow the degradation, but given enough time, the complexed pigments will also become bleached [75, 76]. The resistance of anthocyanins toward hydration and nucleophilic attack is a promising area and recently new compounds were reported in wine pigments. A type of anthocyanin-pyruvic acid adduct has been studied recently because of an increased stability to pH and SO2 bleaching. They are the pyranoanthocyanins comprised of anthocyanins with the addition of pyruvic acid at C4 and a hydroxyl group at C5 of the original anthocyanin structure. This forms a fourth ring which is responsible for the increased stability found with this compound. The nucleophilic attack of water and sulfur dioxide preferentially occurs at the C4 position of the original anthocyanin structure. This converts the red flavylium ion into its colorless hemiacetal form, causing discoloration of the solution. If this pyruvic acid adduct adds to the C4 position, the molecule is blocked from nucleophilic attack and is suddenly more stable at pH values up to neutral and in higher concentrations of sulfur dioxide [61, 77].
192
1.3. Bioactivity and Health Properties The ability of anthocyanins to impart color to the plants or plant products in which they occur leads to an important role of attraction or repulsion of various animals, birds and insects. They serve to attract animals, birds and insects for pollination in flowers and seed dispersal in fruits [1]. The reddish color of Canadian shrub foliage accentuates the black-colored fruits to birds leading to increased removal of the black fruits [78]. One of the more commonly found anthocyanins, cyanidin-3-glucoside, was reported to inhibit larval growth in tobacco worms making anthocyanins agents of biological control as well [79]. California maple aphids flock to and consume yellow leaves of the Japanese maple but tend to ignore the red colored leaves [80]. Anthocyanins can serve as optical filters by protecting molecules from being degraded by visible light. The silver beachweed, for example, holds large amounts of thiarubrine A, a toxin acting as a defense mechanism from insects. Thiarubrine A happens to be very photolabile and since the tree grows along the California coast, it could easily be rendered inactive by the sunlight. However, beachweed also contains a mix of two anthocyanins that serves to protect the compound from sunlight by absorbing the visible light that would otherwise lead to its destruction [81]. Anthocyanins can also protect leaves from a decrease in photosynthesis by absorbing extra light that would otherwise be intercepted by chlorophyll b. Anthocyanins are, in addition to optical filters, excellent scavengers of free radicals. This is a property that has been exploited for its therapeutic purpose, but is also evident in plant cells. Purified solutions can effectively scavenge almost all species of reactive oxygen and nitrogen in a leaf [82]. While anthocyanins serve these important assignments in plants, they are currently studied for their ability to protect against myriad human diseases. The natural electron deficiency of anthocyanins makes these compounds particularly reactive towards oxygen radicals. These antioxidative properties result from the chemical structure of anthocyanins, particularly from the hydroxyl moieties of the C ring which allows chelation of metal ions such as Fe or Cu. The antioxidative activity is also increased by acylation of the sugar residues with aromatic acids. In fact, studies show that anthocyanins can have higher antioxidative activity than vitamin E, ascorbic acid, and β-carotene [83, 84]. The antioxidative activity of anthocyanins has been exhaustively examined [24, 25, 42, 85-91]. Anthocyanin-rich plants have historically been used to treat a number of symptoms and diseases, such as the improvement of visual acuity. Administration of cyanidin-3-rutinoside enhanced night and overall vision due to its effect on rhodopsin regeneration. Studies show that the anthocyanin accelerates formation of an intermediate to regenerate the G-protein-coupled receptor in the retina of the eye [92]. Protection from heart attacks is also associated with administration of anthocyanins, particularly in the form of grape juice and wine but also from other sources [93, 94]. This role is attributed to the ability of these products to reduce inflammation, enhance capillary strength and permeability, and inhibit platelet formation. The mechanism of vasorelaxation that was observed is due to increased nitric oxide release [93]. Anthocyanins can even be shown to
193
aid in the prevention of obesity and diabetes. Studies show that anthocyanin pigments from purple corn inhibit both body weight and adipose tissue increases. The symptoms of hyperglycemia that can follow a high-fat diet were also suppressed with ingestion of this cyanidin-3-glucoside [95]. Interestingly, some antioxidants have shown anti-inflammatory activity as well by interfering with the signaling mechanisms that regulate the cyclooxygenase (COX) gene. Anthocyanins from tart cherries and hibiscus flowers were found to inhibit the activities of COX-1 and COX-2 in vitro [91, 94, 96] and because the COX-2 gene plays a role in tumorigenesis, anthocyanins can affect the spread of cancer through a variety of mechanisms. Apoptosis is a common method of eliminating tumor cells and apoptosis-inducing agents are expected to be excellent anticancer or antitumor drugs. Some anthocyanidins and their glycosides, specifically delphinidin, cyanidin, and petunidin, induce apoptosis of human promyelocytic leukemia (HL-60) cells. These compounds differ from pelargonidin, peonidin, and malvidin by the number of hydroxyl groups on the B ring and it appears the specific ortho position of the hydroxyls is necessary for the apoptosis action [97, 98]. The same anthocyanidins can also inhibit activator protein 1 (AP-1) transcriptional activity and cell transformation in certain mouse epidermal cells. AP-1 is a transcription factor that promotes carcinogenesis and so the associated anthocyanins show encouraging properties against the progression of cancer. Again, since only delphinidin, cyanidin, and petunidin exhibited this inhibition, the researchers postulated that the structure of the B ring produces the observed activity [99]. The chemopreventive studies of anthocyanin pigments have mostly been limited to the aglycone form. This does not suggest that anthocyanins lack chemopreventive activity, in fact they do possess the same properties, but to a different degree. The biological activities of anthocyanins tend to increase with decreasing number of glycosides and an increasing number of hydroxyls [96]. Given the increasing number of research studies highlighting and examining the health benefits, it is reasonable to predict that over time, an icreasing array of health benefits and applications to improve human health and nutrition will follow as well as a greater understanding of their mode of actions as well as their bioavailability and final form at the targeted tissue site(s) of action. 1.4. Biosynthesis and Metabolism The rainbow of colors and diverse functions attributed to anthocyanins has made these pigments of great interest to biochemists and molecular biologists. The biosynthetic pathway of anthocyanins is one of the most extensively studied pathways of plant secondary products and has lead to the identification of the genes and enzymes responsible for the biosynthesis of anthocyanins. A representation of the general biosynthetic pathway is shown in Fig. (4); this pathway was mostly formed from the investigation of three main species: maize (Zea mays), snapdragon (Antirrhinum majus), and petunia (Petunia hybrida) [100, 101]. The precursors for the synthesis of all flavonoids, including anthocyanins, are malonyl-CoA and p-coumaryl-CoA. Chalcone synthase (CHS) catalyzes the first committed step in the biosynthetic pathway by sequential condensations of three acetate moieties from
194
malonyl-CoA with p-coumaryl-CoA to yield a tetraketide intermediate that immediately cyclizes to form naringenin chalcone (11), a tetrahydroxychalcone [100]. The accumulation of this chalcone in plant tissues is quite rare; therefore, naringenin chalcone undergoes a Michael-type addition, catalyzed by chalcone isomerase (CHI), to the stereospecific (2S)-naringenin (7) with the nucleophilic attack of the deprotonated hydroxyl on the α,β-unsaturated alkene. This isomerization can occur spontaneously, without CHI, but does so at a much slower rate [101]. Naringenin, a flavanone, is then converted to a dihydroflavonol (dihydrokaempferol, 12) by hydroxylation at position 3 catalyzed by flavanone 3-hydroxylase (F3H). From this point, the dihydroflavonol can be converted into three different molecules, leading to three different anthocyanidins. Dihydrokaempferol can be converted to a dihydroquercetin (13) with hydroxylation at the 3’ position, catalyzed by flavanone 3’-hydroxylase (F3’H), which will give cyanidin pigments (5). Hydroxylation at the 3’ and 5’ positions to give dihydromyricetin (14), catalyzed by flavanone 3’,5’-hydroxylase (F3’5’H), will eventually lead to the blue delphinidin pigments (19). Finally, no additional hydroxylations on the B ring will give the pelargonidin pigments (18) [101]. The dihydroflavonols are reduced by dihydroflavonol 4-reductase (DFR) to leucoanthocyanidins (leucopelargonidin 15, leucocyanidin 16, and leucodelphinidin 17) in the course of the biosynthetic pathway. The reductase enzyme catalyzes the stereospecific reduction of the ketone at position 4 to give (2R,3S,4S)-leucoanthocyanidins [100]. Anthocyanidin synthase (ANS) catalyzes the next step, conversion of the colorless leucoanthocyanidin to 2-flaven-3,4-diol, which is then glycosylated by flavonoid 3-O-glucosyltransferase (3-GT) and transported into the vacuole where it is finally converted to the colored flavylium ion [100]. The ANS belongs to a family of 2-oxoglutarate-dependent oxygenases and, therefore, requires the presence of Fe2+, 2-oxoglutarate, molecular oxygen, and ascorbate; however, the reaction sequence does not require any additional dehydratase, despite the involvement of a formal dehydration step [102, 103]. In the first step, ANS uses the ferrous ion, molecular oxygen, and 2-oxoglutarate to form an oxoferryl-enzyme complex, along with succinate and CO2. This oxoferryl-enzyme complex catalyzes the hydroxylation at position 2 followed by spontaneous dehydration to give 2-flaven-3,4-diol. This product immediately isomerizes to the more stable pseudo-base (3-flaven-2,3-diol) at neutral pH [104]. The enzyme 3-GT now catalyzes the glucosylation at position 3 of the pseudo-base which is subsequently transported into the vacuoles and converted to the colored flavylium ion due to the acidic vacuolar conditions [100].
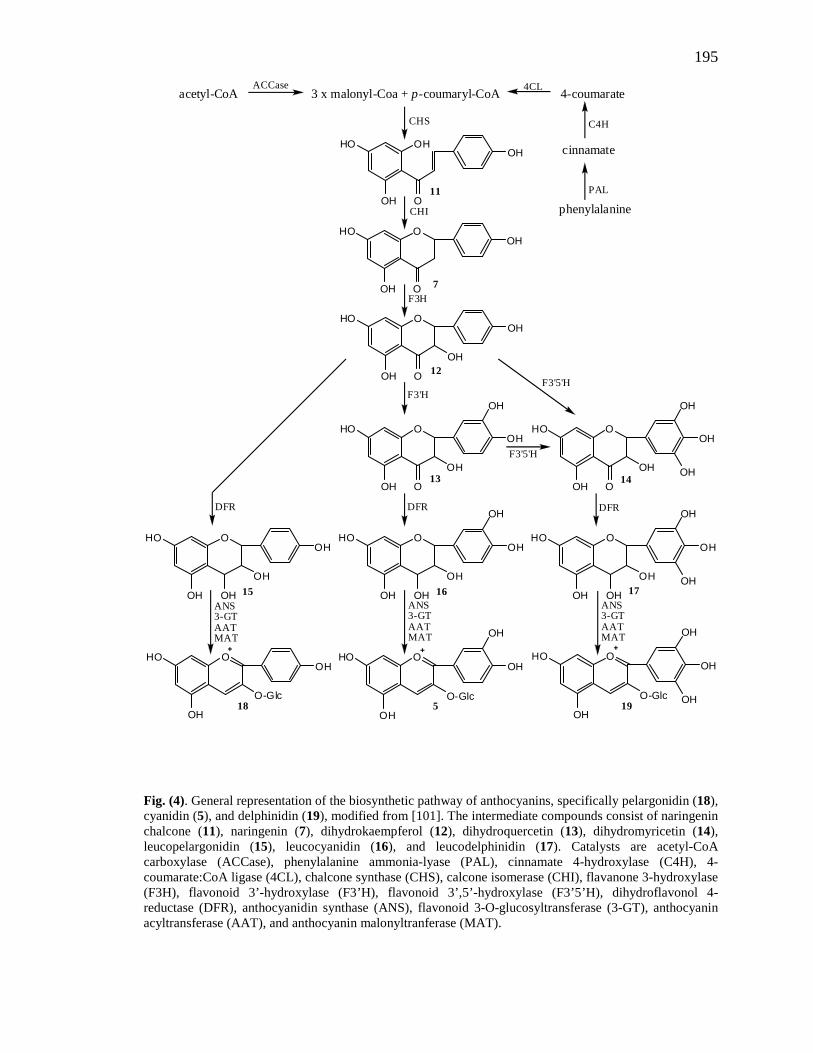
195
Fig. (4). General representation of the biosynthetic pathway of anthocyanins, specifically pelargonidin (18), cyanidin (5), and delphinidin (19), modified from [101]. The intermediate compounds consist of naringenin chalcone (11), naringenin (7), dihydrokaempferol (12), dihydroquercetin (13), dihydromyricetin (14), leucopelargonidin (15), leucocyanidin (16), and leucodelphinidin (17). Catalysts are acetyl-CoA carboxylase (ACCase), phenylalanine ammonia-lyase (PAL), cinnamate 4-hydroxylase (C4H), 4-coumarate:CoA ligase (4CL), chalcone synthase (CHS), calcone isomerase (CHI), flavanone 3-hydroxylase (F3H), flavonoid 3’-hydroxylase (F3’H), flavonoid 3’,5’-hydroxylase (F3’5’H), dihydroflavonol 4-reductase (DFR), anthocyanidin synthase (ANS), flavonoid 3-O-glucosyltransferase (3-GT), anthocyanin acyltransferase (AAT), and anthocyanin malonyltranferase (MAT).
OH
OOH
HOOH
O
OOH
HOOH
O
OOH
HOOH
OH
O
OOH
HOOH
OH
O
OOH
HOOH
OH
OH OH
OH
O
OHOH
HOOH
OH
O
OHOH
HOOH
OH
OH
O
OHOH
HOOH
OH
OH
OH
O
OH
HOOH
O-Glc
O
OH
HOOH
O-Glc
OH
O
OH
HOOH
O-Glc
OH
OH
CHI
CHS
F3H
F3'HF3'5'H
DFR
ANS3-GTAATMAT
ANS3-GTAATMAT
ANS3-GTAATMAT
DFR DFR
F3'5'H
acetyl-CoA 3 x malonyl-Coa + p-coumaryl-CoA 4-coumarate
cinnamate
phenylalanine
ACCase 4CL
C4H
PAL11
7
12
13 14
15 16 17
18 195
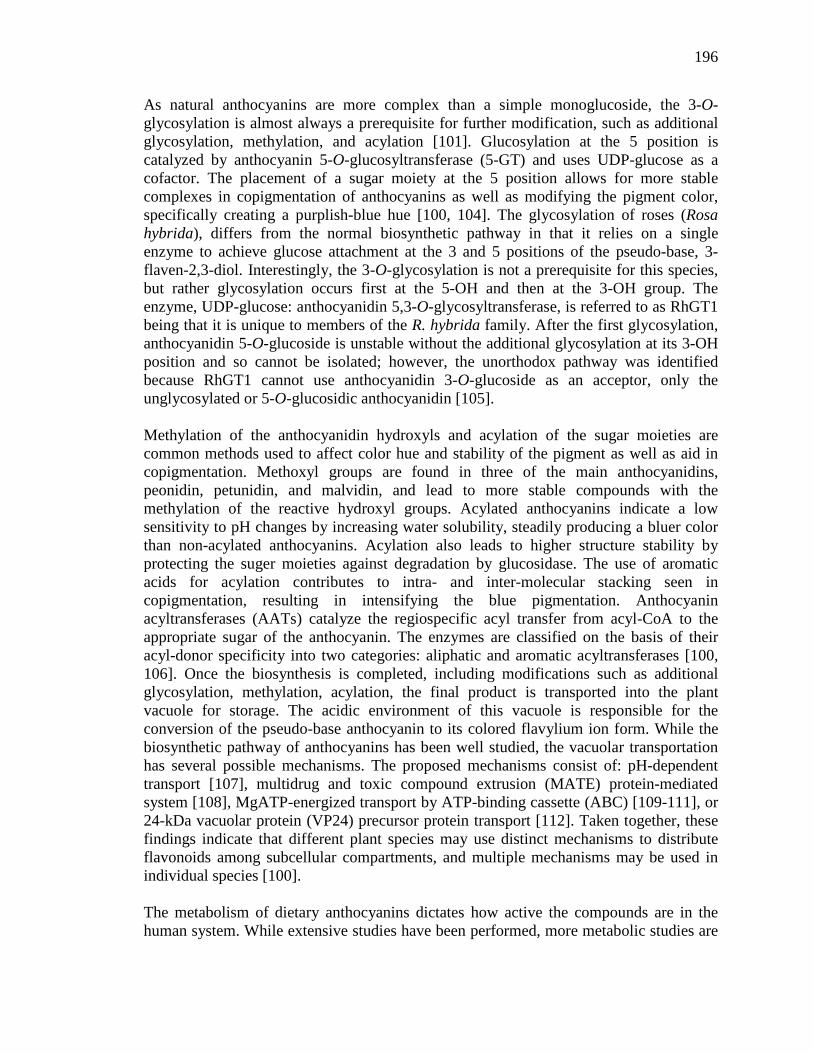
196
As natural anthocyanins are more complex than a simple monoglucoside, the 3-O-glycosylation is almost always a prerequisite for further modification, such as additional glycosylation, methylation, and acylation [101]. Glucosylation at the 5 position is catalyzed by anthocyanin 5-O-glucosyltransferase (5-GT) and uses UDP-glucose as a cofactor. The placement of a sugar moiety at the 5 position allows for more stable complexes in copigmentation of anthocyanins as well as modifying the pigment color, specifically creating a purplish-blue hue [100, 104]. The glycosylation of roses (Rosa hybrida), differs from the normal biosynthetic pathway in that it relies on a single enzyme to achieve glucose attachment at the 3 and 5 positions of the pseudo-base, 3-flaven-2,3-diol. Interestingly, the 3-O-glycosylation is not a prerequisite for this species, but rather glycosylation occurs first at the 5-OH and then at the 3-OH group. The enzyme, UDP-glucose: anthocyanidin 5,3-O-glycosyltransferase, is referred to as RhGT1 being that it is unique to members of the R. hybrida family. After the first glycosylation, anthocyanidin 5-O-glucoside is unstable without the additional glycosylation at its 3-OH position and so cannot be isolated; however, the unorthodox pathway was identified because RhGT1 cannot use anthocyanidin 3-O-glucoside as an acceptor, only the unglycosylated or 5-O-glucosidic anthocyanidin [105]. Methylation of the anthocyanidin hydroxyls and acylation of the sugar moieties are common methods used to affect color hue and stability of the pigment as well as aid in copigmentation. Methoxyl groups are found in three of the main anthocyanidins, peonidin, petunidin, and malvidin, and lead to more stable compounds with the methylation of the reactive hydroxyl groups. Acylated anthocyanins indicate a low sensitivity to pH changes by increasing water solubility, steadily producing a bluer color than non-acylated anthocyanins. Acylation also leads to higher structure stability by protecting the suger moieties against degradation by glucosidase. The use of aromatic acids for acylation contributes to intra- and inter-molecular stacking seen in copigmentation, resulting in intensifying the blue pigmentation. Anthocyanin acyltransferases (AATs) catalyze the regiospecific acyl transfer from acyl-CoA to the appropriate sugar of the anthocyanin. The enzymes are classified on the basis of their acyl-donor specificity into two categories: aliphatic and aromatic acyltransferases [100, 106]. Once the biosynthesis is completed, including modifications such as additional glycosylation, methylation, acylation, the final product is transported into the plant vacuole for storage. The acidic environment of this vacuole is responsible for the conversion of the pseudo-base anthocyanin to its colored flavylium ion form. While the biosynthetic pathway of anthocyanins has been well studied, the vacuolar transportation has several possible mechanisms. The proposed mechanisms consist of: pH-dependent transport [107], multidrug and toxic compound extrusion (MATE) protein-mediated system [108], MgATP-energized transport by ATP-binding cassette (ABC) [109-111], or 24-kDa vacuolar protein (VP24) precursor protein transport [112]. Taken together, these findings indicate that different plant species may use distinct mechanisms to distribute flavonoids among subcellular compartments, and multiple mechanisms may be used in individual species [100]. The metabolism of dietary anthocyanins dictates how active the compounds are in the human system. While extensive studies have been performed, more metabolic studies are
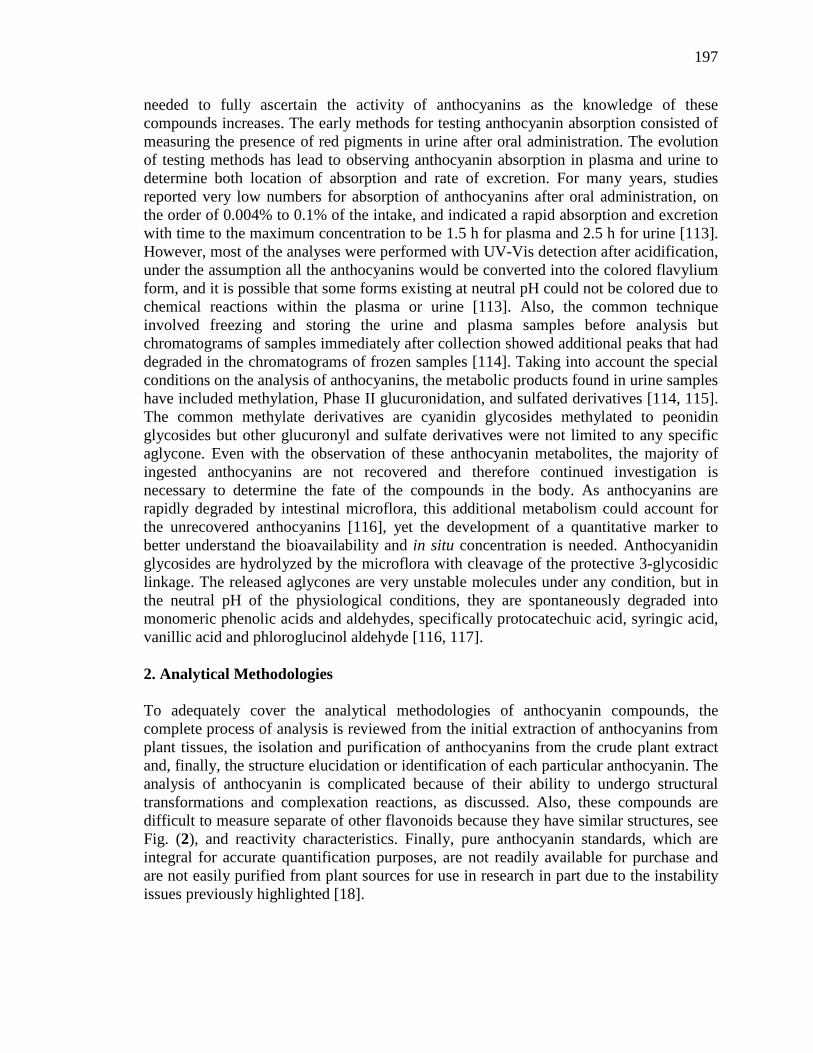
197
needed to fully ascertain the activity of anthocyanins as the knowledge of these compounds increases. The early methods for testing anthocyanin absorption consisted of measuring the presence of red pigments in urine after oral administration. The evolution of testing methods has lead to observing anthocyanin absorption in plasma and urine to determine both location of absorption and rate of excretion. For many years, studies reported very low numbers for absorption of anthocyanins after oral administration, on the order of 0.004% to 0.1% of the intake, and indicated a rapid absorption and excretion with time to the maximum concentration to be 1.5 h for plasma and 2.5 h for urine [113]. However, most of the analyses were performed with UV-Vis detection after acidification, under the assumption all the anthocyanins would be converted into the colored flavylium form, and it is possible that some forms existing at neutral pH could not be colored due to chemical reactions within the plasma or urine [113]. Also, the common technique involved freezing and storing the urine and plasma samples before analysis but chromatograms of samples immediately after collection showed additional peaks that had degraded in the chromatograms of frozen samples [114]. Taking into account the special conditions on the analysis of anthocyanins, the metabolic products found in urine samples have included methylation, Phase II glucuronidation, and sulfated derivatives [114, 115]. The common methylate derivatives are cyanidin glycosides methylated to peonidin glycosides but other glucuronyl and sulfate derivatives were not limited to any specific aglycone. Even with the observation of these anthocyanin metabolites, the majority of ingested anthocyanins are not recovered and therefore continued investigation is necessary to determine the fate of the compounds in the body. As anthocyanins are rapidly degraded by intestinal microflora, this additional metabolism could account for the unrecovered anthocyanins [116], yet the development of a quantitative marker to better understand the bioavailability and in situ concentration is needed. Anthocyanidin glycosides are hydrolyzed by the microflora with cleavage of the protective 3-glycosidic linkage. The released aglycones are very unstable molecules under any condition, but in the neutral pH of the physiological conditions, they are spontaneously degraded into monomeric phenolic acids and aldehydes, specifically protocatechuic acid, syringic acid, vanillic acid and phloroglucinol aldehyde [116, 117]. 2. Analytical Methodologies To adequately cover the analytical methodologies of anthocyanin compounds, the complete process of analysis is reviewed from the initial extraction of anthocyanins from plant tissues, the isolation and purification of anthocyanins from the crude plant extract and, finally, the structure elucidation or identification of each particular anthocyanin. The analysis of anthocyanin is complicated because of their ability to undergo structural transformations and complexation reactions, as discussed. Also, these compounds are difficult to measure separate of other flavonoids because they have similar structures, see Fig. (2), and reactivity characteristics. Finally, pure anthocyanin standards, which are integral for accurate quantification purposes, are not readily available for purchase and are not easily purified from plant sources for use in research in part due to the instability issues previously highlighted [18].
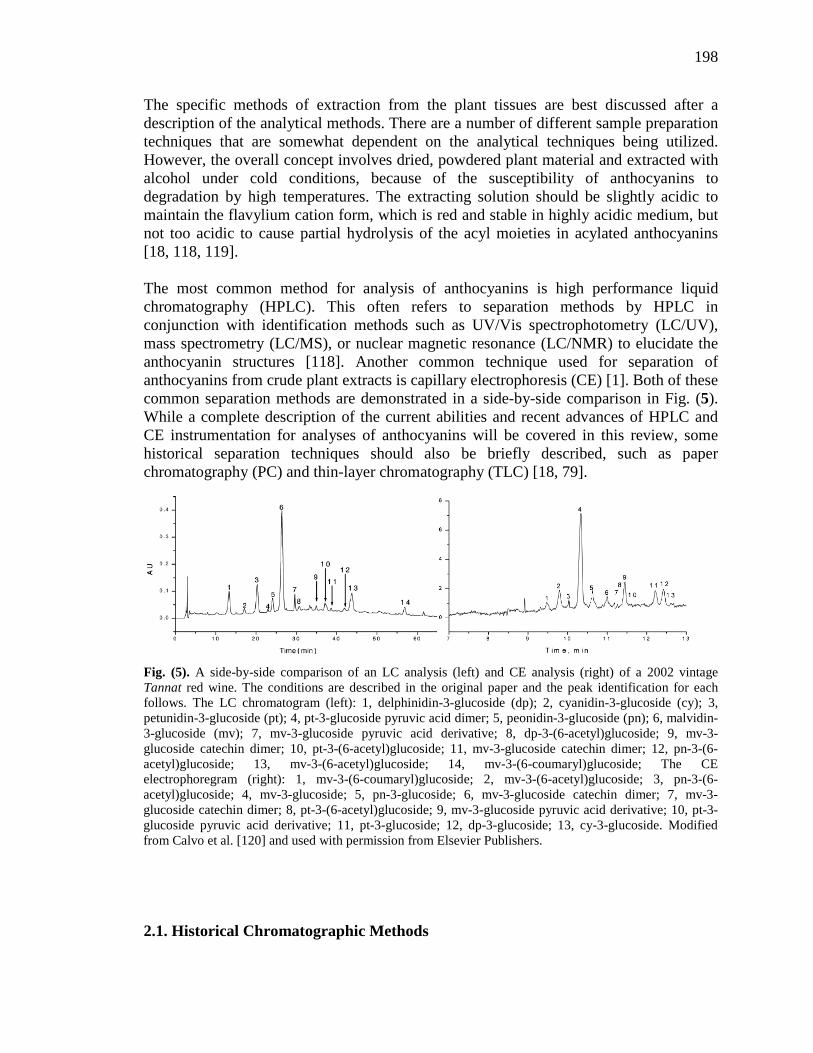
198
The specific methods of extraction from the plant tissues are best discussed after a description of the analytical methods. There are a number of different sample preparation techniques that are somewhat dependent on the analytical techniques being utilized. However, the overall concept involves dried, powdered plant material and extracted with alcohol under cold conditions, because of the susceptibility of anthocyanins to degradation by high temperatures. The extracting solution should be slightly acidic to maintain the flavylium cation form, which is red and stable in highly acidic medium, but not too acidic to cause partial hydrolysis of the acyl moieties in acylated anthocyanins [18, 118, 119]. The most common method for analysis of anthocyanins is high performance liquid chromatography (HPLC). This often refers to separation methods by HPLC in conjunction with identification methods such as UV/Vis spectrophotometry (LC/UV), mass spectrometry (LC/MS), or nuclear magnetic resonance (LC/NMR) to elucidate the anthocyanin structures [118]. Another common technique used for separation of anthocyanins from crude plant extracts is capillary electrophoresis (CE) [1]. Both of these common separation methods are demonstrated in a side-by-side comparison in Fig. (5). While a complete description of the current abilities and recent advances of HPLC and CE instrumentation for analyses of anthocyanins will be covered in this review, some historical separation techniques should also be briefly described, such as paper chromatography (PC) and thin-layer chromatography (TLC) [18, 79]. Fig. (5). A side-by-side comparison of an LC analysis (left) and CE analysis (right) of a 2002 vintage Tannat red wine. The conditions are described in the original paper and the peak identification for each follows. The LC chromatogram (left): 1, delphinidin-3-glucoside (dp); 2, cyanidin-3-glucoside (cy); 3, petunidin-3-glucoside (pt); 4, pt-3-glucoside pyruvic acid dimer; 5, peonidin-3-glucoside (pn); 6, malvidin-3-glucoside (mv); 7, mv-3-glucoside pyruvic acid derivative; 8, dp-3-(6-acetyl)glucoside; 9, mv-3-glucoside catechin dimer; 10, pt-3-(6-acetyl)glucoside; 11, mv-3-glucoside catechin dimer; 12, pn-3-(6-acetyl)glucoside; 13, mv-3-(6-acetyl)glucoside; 14, mv-3-(6-coumaryl)glucoside; The CE electrophoregram (right): 1, mv-3-(6-coumaryl)glucoside; 2, mv-3-(6-acetyl)glucoside; 3, pn-3-(6-acetyl)glucoside; 4, mv-3-glucoside; 5, pn-3-glucoside; 6, mv-3-glucoside catechin dimer; 7, mv-3-glucoside catechin dimer; 8, pt-3-(6-acetyl)glucoside; 9, mv-3-glucoside pyruvic acid derivative; 10, pt-3-glucoside pyruvic acid derivative; 11, pt-3-glucoside; 12, dp-3-glucoside; 13, cy-3-glucoside. Modified from Calvo et al. [120] and used with permission from Elsevier Publishers. 2.1. Historical Chromatographic Methods
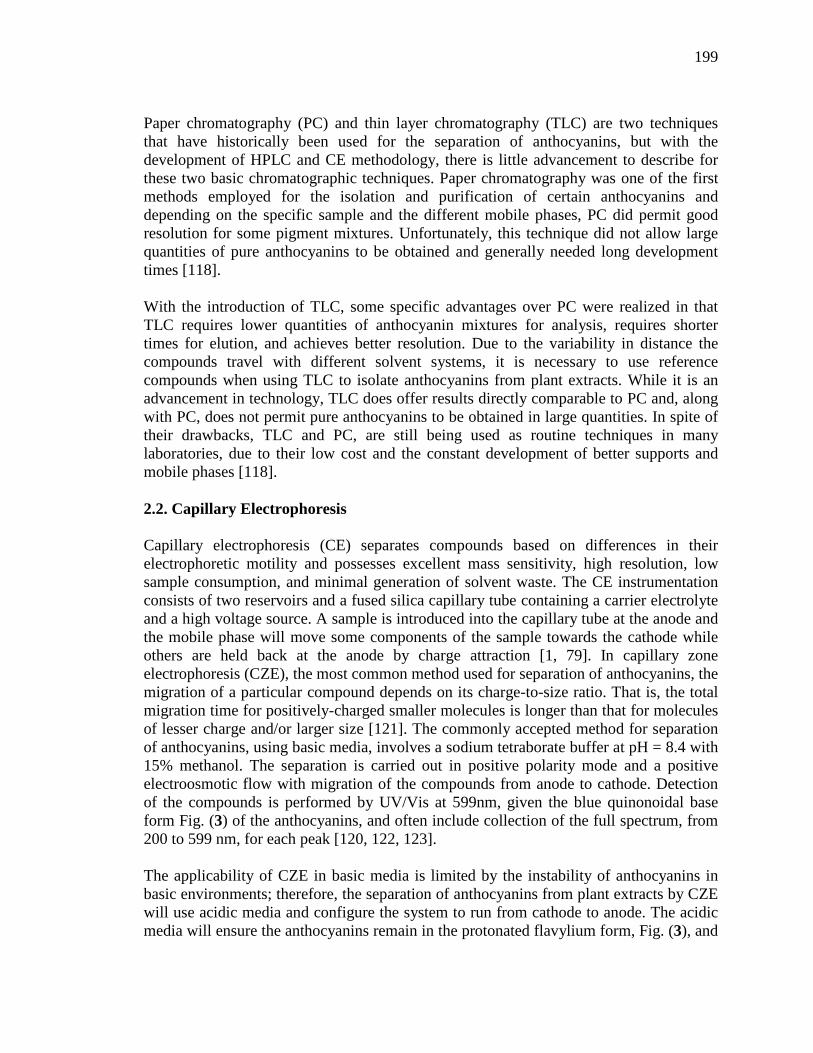
199
Paper chromatography (PC) and thin layer chromatography (TLC) are two techniques that have historically been used for the separation of anthocyanins, but with the development of HPLC and CE methodology, there is little advancement to describe for these two basic chromatographic techniques. Paper chromatography was one of the first methods employed for the isolation and purification of certain anthocyanins and depending on the specific sample and the different mobile phases, PC did permit good resolution for some pigment mixtures. Unfortunately, this technique did not allow large quantities of pure anthocyanins to be obtained and generally needed long development times [118]. With the introduction of TLC, some specific advantages over PC were realized in that TLC requires lower quantities of anthocyanin mixtures for analysis, requires shorter times for elution, and achieves better resolution. Due to the variability in distance the compounds travel with different solvent systems, it is necessary to use reference compounds when using TLC to isolate anthocyanins from plant extracts. While it is an advancement in technology, TLC does offer results directly comparable to PC and, along with PC, does not permit pure anthocyanins to be obtained in large quantities. In spite of their drawbacks, TLC and PC, are still being used as routine techniques in many laboratories, due to their low cost and the constant development of better supports and mobile phases [118]. 2.2. Capillary Electrophoresis Capillary electrophoresis (CE) separates compounds based on differences in their electrophoretic motility and possesses excellent mass sensitivity, high resolution, low sample consumption, and minimal generation of solvent waste. The CE instrumentation consists of two reservoirs and a fused silica capillary tube containing a carrier electrolyte and a high voltage source. A sample is introduced into the capillary tube at the anode and the mobile phase will move some components of the sample towards the cathode while others are held back at the anode by charge attraction [1, 79]. In capillary zone electrophoresis (CZE), the most common method used for separation of anthocyanins, the migration of a particular compound depends on its charge-to-size ratio. That is, the total migration time for positively-charged smaller molecules is longer than that for molecules of lesser charge and/or larger size [121]. The commonly accepted method for separation of anthocyanins, using basic media, involves a sodium tetraborate buffer at pH = 8.4 with 15% methanol. The separation is carried out in positive polarity mode and a positive electroosmotic flow with migration of the compounds from anode to cathode. Detection of the compounds is performed by UV/Vis at 599nm, given the blue quinonoidal base form Fig. (3) of the anthocyanins, and often include collection of the full spectrum, from 200 to 599 nm, for each peak [120, 122, 123]. The applicability of CZE in basic media is limited by the instability of anthocyanins in basic environments; therefore, the separation of anthocyanins from plant extracts by CZE will use acidic media and configure the system to run from cathode to anode. The acidic media will ensure the anthocyanins remain in the protonated flavylium form, Fig. (3), and
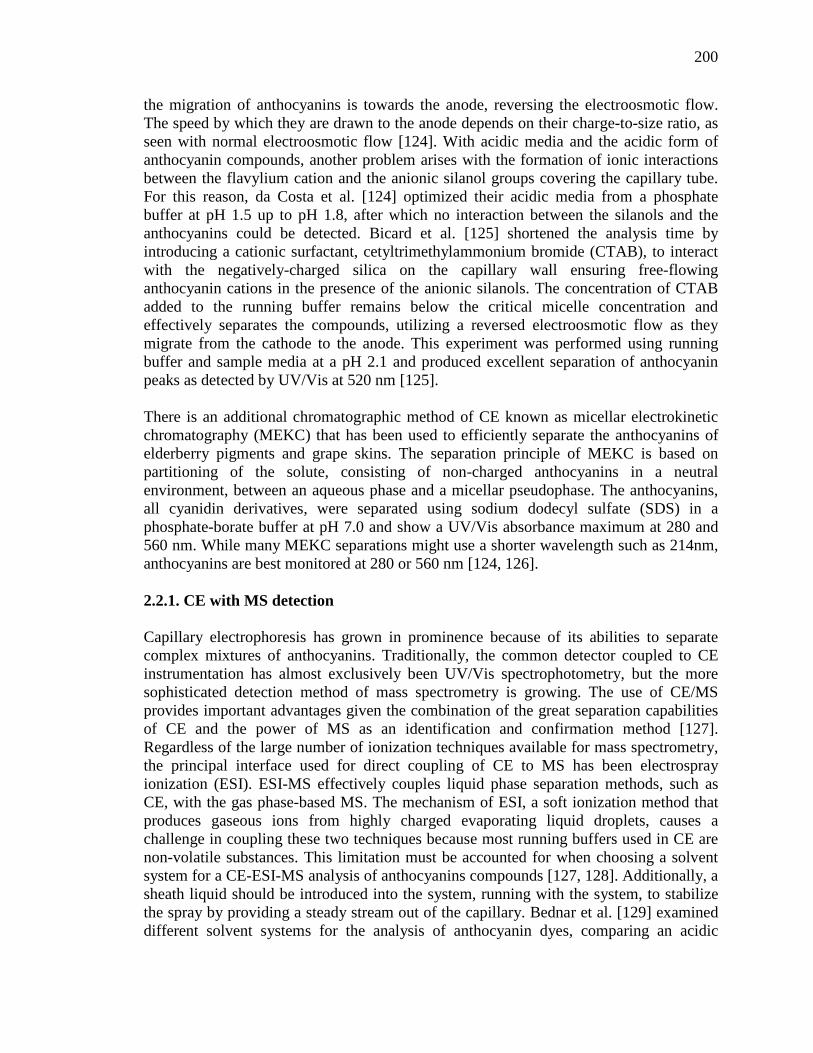
200
the migration of anthocyanins is towards the anode, reversing the electroosmotic flow. The speed by which they are drawn to the anode depends on their charge-to-size ratio, as seen with normal electroosmotic flow [124]. With acidic media and the acidic form of anthocyanin compounds, another problem arises with the formation of ionic interactions between the flavylium cation and the anionic silanol groups covering the capillary tube. For this reason, da Costa et al. [124] optimized their acidic media from a phosphate buffer at pH 1.5 up to pH 1.8, after which no interaction between the silanols and the anthocyanins could be detected. Bicard et al. [125] shortened the analysis time by introducing a cationic surfactant, cetyltrimethylammonium bromide (CTAB), to interact with the negatively-charged silica on the capillary wall ensuring free-flowing anthocyanin cations in the presence of the anionic silanols. The concentration of CTAB added to the running buffer remains below the critical micelle concentration and effectively separates the compounds, utilizing a reversed electroosmotic flow as they migrate from the cathode to the anode. This experiment was performed using running buffer and sample media at a pH 2.1 and produced excellent separation of anthocyanin peaks as detected by UV/Vis at 520 nm [125]. There is an additional chromatographic method of CE known as micellar electrokinetic chromatography (MEKC) that has been used to efficiently separate the anthocyanins of elderberry pigments and grape skins. The separation principle of MEKC is based on partitioning of the solute, consisting of non-charged anthocyanins in a neutral environment, between an aqueous phase and a micellar pseudophase. The anthocyanins, all cyanidin derivatives, were separated using sodium dodecyl sulfate (SDS) in a phosphate-borate buffer at pH 7.0 and show a UV/Vis absorbance maximum at 280 and 560 nm. While many MEKC separations might use a shorter wavelength such as 214nm, anthocyanins are best monitored at 280 or 560 nm [124, 126]. 2.2.1. CE with MS detection Capillary electrophoresis has grown in prominence because of its abilities to separate complex mixtures of anthocyanins. Traditionally, the common detector coupled to CE instrumentation has almost exclusively been UV/Vis spectrophotometry, but the more sophisticated detection method of mass spectrometry is growing. The use of CE/MS provides important advantages given the combination of the great separation capabilities of CE and the power of MS as an identification and confirmation method [127]. Regardless of the large number of ionization techniques available for mass spectrometry, the principal interface used for direct coupling of CE to MS has been electrospray ionization (ESI). ESI-MS effectively couples liquid phase separation methods, such as CE, with the gas phase-based MS. The mechanism of ESI, a soft ionization method that produces gaseous ions from highly charged evaporating liquid droplets, causes a challenge in coupling these two techniques because most running buffers used in CE are non-volatile substances. This limitation must be accounted for when choosing a solvent system for a CE-ESI-MS analysis of anthocyanins compounds [127, 128]. Additionally, a sheath liquid should be introduced into the system, running with the system, to stabilize the spray by providing a steady stream out of the capillary. Bednar et al. [129] examined different solvent systems for the analysis of anthocyanin dyes, comparing an acidic
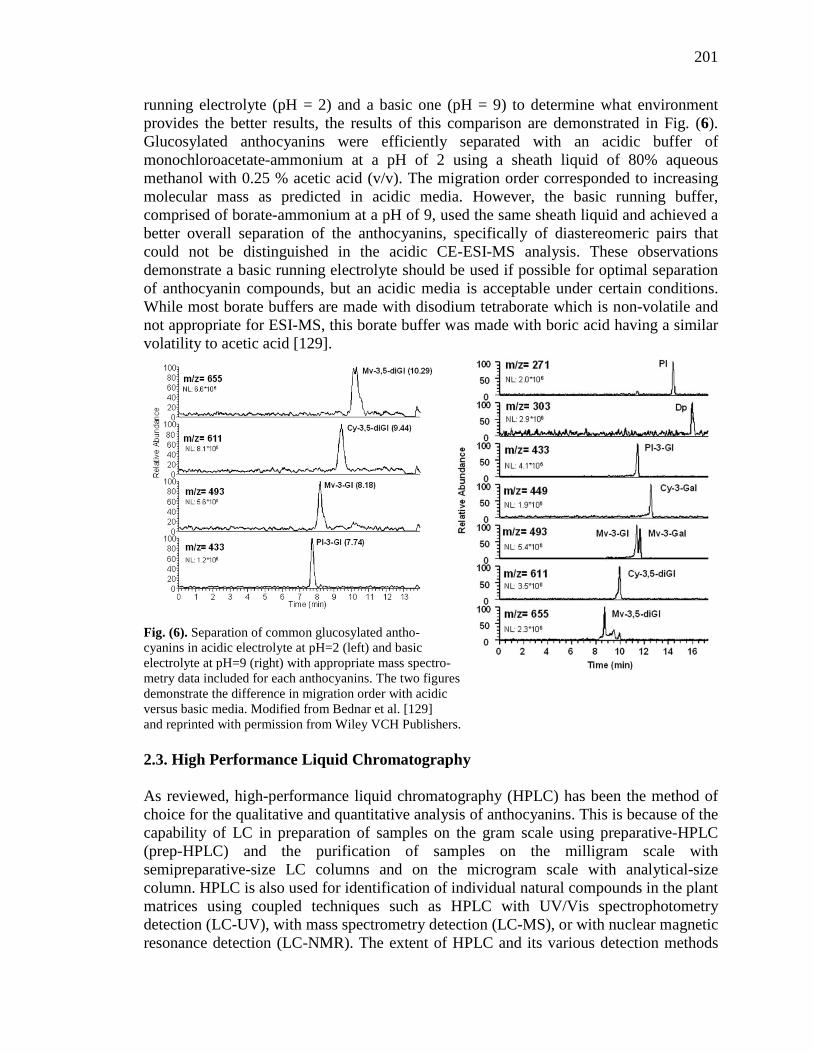
201
running electrolyte (pH = 2) and a basic one (pH = 9) to determine what environment provides the better results, the results of this comparison are demonstrated in Fig. (6). Glucosylated anthocyanins were efficiently separated with an acidic buffer of monochloroacetate-ammonium at a pH of 2 using a sheath liquid of 80% aqueous methanol with 0.25 % acetic acid (v/v). The migration order corresponded to increasing molecular mass as predicted in acidic media. However, the basic running buffer, comprised of borate-ammonium at a pH of 9, used the same sheath liquid and achieved a better overall separation of the anthocyanins, specifically of diastereomeric pairs that could not be distinguished in the acidic CE-ESI-MS analysis. These observations demonstrate a basic running electrolyte should be used if possible for optimal separation of anthocyanin compounds, but an acidic media is acceptable under certain conditions. While most borate buffers are made with disodium tetraborate which is non-volatile and not appropriate for ESI-MS, this borate buffer was made with boric acid having a similar volatility to acetic acid [129]. Fig. (6). Separation of common glucosylated antho- cyanins in acidic electrolyte at pH=2 (left) and basic electrolyte at pH=9 (right) with appropriate mass spectro- metry data included for each anthocyanins. The two figures demonstrate the difference in migration order with acidic versus basic media. Modified from Bednar et al. [129] and reprinted with permission from Wiley VCH Publishers. 2.3. High Performance Liquid Chromatography As reviewed, high-performance liquid chromatography (HPLC) has been the method of choice for the qualitative and quantitative analysis of anthocyanins. This is because of the capability of LC in preparation of samples on the gram scale using preparative-HPLC (prep-HPLC) and the purification of samples on the milligram scale with semipreparative-size LC columns and on the microgram scale with analytical-size column. HPLC is also used for identification of individual natural compounds in the plant matrices using coupled techniques such as HPLC with UV/Vis spectrophotometry detection (LC-UV), with mass spectrometry detection (LC-MS), or with nuclear magnetic resonance detection (LC-NMR). The extent of HPLC and its various detection methods
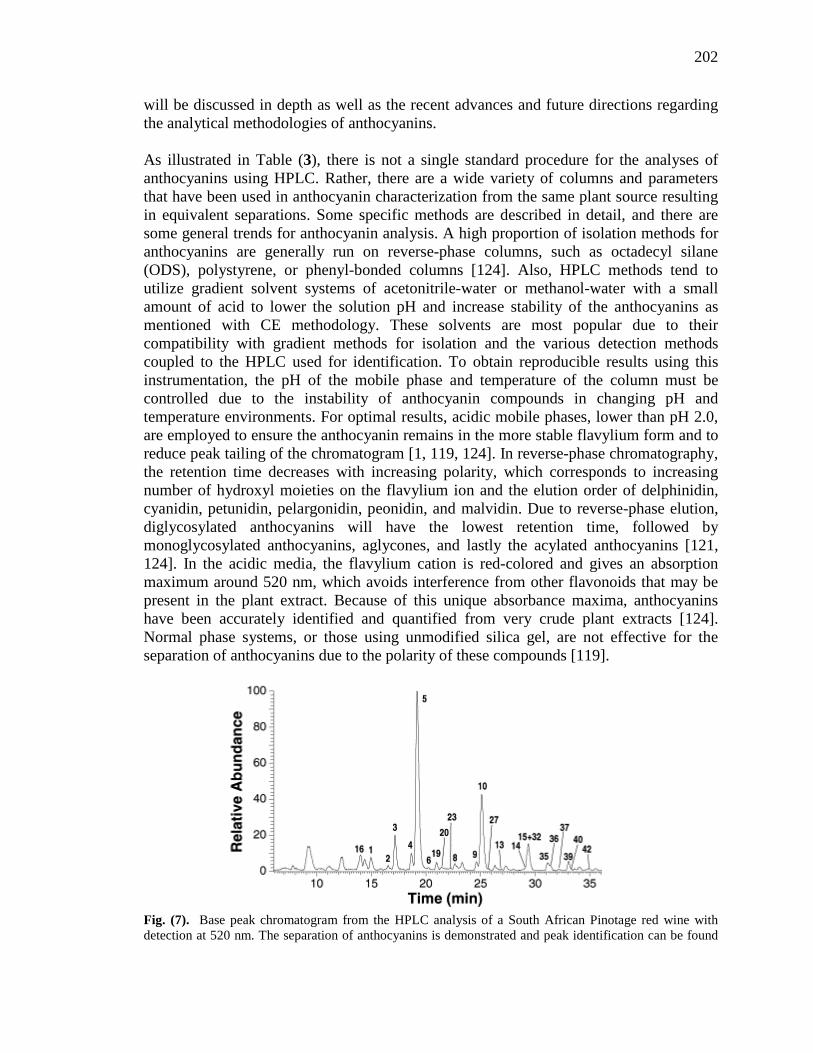
202
will be discussed in depth as well as the recent advances and future directions regarding the analytical methodologies of anthocyanins. As illustrated in Table (3), there is not a single standard procedure for the analyses of anthocyanins using HPLC. Rather, there are a wide variety of columns and parameters that have been used in anthocyanin characterization from the same plant source resulting in equivalent separations. Some specific methods are described in detail, and there are some general trends for anthocyanin analysis. A high proportion of isolation methods for anthocyanins are generally run on reverse-phase columns, such as octadecyl silane (ODS), polystyrene, or phenyl-bonded columns [124]. Also, HPLC methods tend to utilize gradient solvent systems of acetonitrile-water or methanol-water with a small amount of acid to lower the solution pH and increase stability of the anthocyanins as mentioned with CE methodology. These solvents are most popular due to their compatibility with gradient methods for isolation and the various detection methods coupled to the HPLC used for identification. To obtain reproducible results using this instrumentation, the pH of the mobile phase and temperature of the column must be controlled due to the instability of anthocyanin compounds in changing pH and temperature environments. For optimal results, acidic mobile phases, lower than pH 2.0, are employed to ensure the anthocyanin remains in the more stable flavylium form and to reduce peak tailing of the chromatogram [1, 119, 124]. In reverse-phase chromatography, the retention time decreases with increasing polarity, which corresponds to increasing number of hydroxyl moieties on the flavylium ion and the elution order of delphinidin, cyanidin, petunidin, pelargonidin, peonidin, and malvidin. Due to reverse-phase elution, diglycosylated anthocyanins will have the lowest retention time, followed by monoglycosylated anthocyanins, aglycones, and lastly the acylated anthocyanins [121, 124]. In the acidic media, the flavylium cation is red-colored and gives an absorption maximum around 520 nm, which avoids interference from other flavonoids that may be present in the plant extract. Because of this unique absorbance maxima, anthocyanins have been accurately identified and quantified from very crude plant extracts [124]. Normal phase systems, or those using unmodified silica gel, are not effective for the separation of anthocyanins due to the polarity of these compounds [119]. Fig. (7). Base peak chromatogram from the HPLC analysis of a South African Pinotage red wine with detection at 520 nm. The separation of anthocyanins is demonstrated and peak identification can be found
203
in the original paper. Modified from de Villiers et al. [130] and used with permission from Elsevier Publishers. 2.3.1. HPLC with UV detection The most frequently used detection method for HPLC is UV/Vis spectrophotometry. This is due to the prevalence of spectrophotometric instrumentation in laboratories studying anthocyanin chemistry, both in the industrial and academic sectors. Anthocyanins have a unique absorption maximum at ~520 nm which sets these compounds apart from other flavonoids in the plant extract and simplifies the resulting chromatograms for isolation and purification. An example of an HPLC chromatogram with detection at 520 nm can be seen in Fig. (7). UV/Vis spectrophotometry was not used for identification of anthocyanin compounds until the introduction of diode-array technology, which allowed for the accumulation of UV/Vis spectral data libraries, aiding in peak identification. Diode array detection coupled to HPLC (LC-UV-DAD) performs a complete spectrophotometric scan on each peak as it elutes and provides a unique chromatogram for each anthocyanin compound that can subsequently be compared to other compound spectra and used for identification purposes [119, 121, 124]. Generally, the spectral characteristics of a particular anthocyanin are related to the hydroxylation pattern of the aglycone structure from which it is derived. The anthocyanidin with just one oxygenated position on the B-ring, pelargonidin, gives an absorption maxima at approximately 520 nm while di-oxygenated anthocyanidins, cyanidin and peonidin, give maxima at 535 nm and tri-oxygenated anthocyanidins, delphinidin, petunidin and malvidin, give maxima at 544 nm. Glycosidic substitution of the anthocyanins also affects the spectral characteristics specifically in that 3-monoglycosides generate a ratio of absorbance at 440 nm to absorbance at the wavelength maxima that is twice as large as the 3,5-diglycoside anthocyanins [131, 132]. The various sugars commonly seen in the glycosidic substitution do not seem to have an effect on the observed spectra but do significantly change the retention times of anthocyanins. Finally, acylation of anthocyanins result in a fairly significant increase in the retention time compared to nonacylated anthocyanins [132].
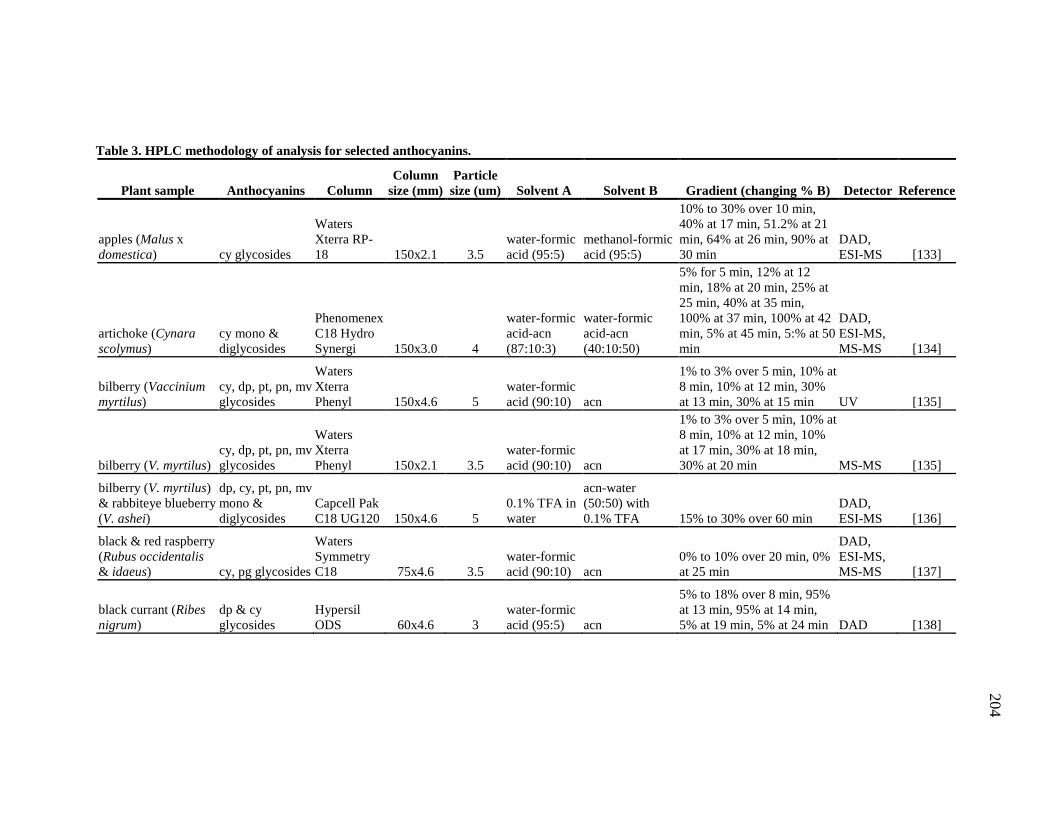
204
Table 3. HPLC methodology of analysis for selected anthocyanins.
Plant sample Anthocyanins Column Column
size (mm) Particle
size (um) Solvent A Solvent B Gradient (changing % B) Detector Reference
apples (Malus x domestica) cy glycosides
Waters Xterra RP-18 150x2.1 3.5
water-formic acid (95:5)
methanol-formic acid (95:5)
10% to 30% over 10 min, 40% at 17 min, 51.2% at 21 min, 64% at 26 min, 90% at 30 min
DAD, ESI-MS [133]
artichoke (Cynara scolymus)
cy mono & diglycosides
Phenomenex C18 Hydro Synergi 150x3.0 4
water-formic acid-acn (87:10:3)
water-formic acid-acn (40:10:50)
5% for 5 min, 12% at 12 min, 18% at 20 min, 25% at 25 min, 40% at 35 min, 100% at 37 min, 100% at 42 min, 5% at 45 min, 5:% at 50 min
DAD, ESI-MS, MS-MS [134]
bilberry (Vaccinium myrtilus)
cy, dp, pt, pn, mv glycosides
Waters Xterra Phenyl 150x4.6 5
water-formic acid (90:10) acn
1% to 3% over 5 min, 10% at 8 min, 10% at 12 min, 30% at 13 min, 30% at 15 min UV [135]
bilberry (V. myrtilus) cy, dp, pt, pn, mv glycosides
Waters Xterra Phenyl 150x2.1 3.5
water-formic acid (90:10) acn
1% to 3% over 5 min, 10% at 8 min, 10% at 12 min, 10% at 17 min, 30% at 18 min, 30% at 20 min MS-MS [135]
bilberry (V. myrtilus) & rabbiteye blueberry (V. ashei)
dp, cy, pt, pn, mv mono & diglycosides
Capcell Pak C18 UG120 150x4.6 5
0.1% TFA in water
acn-water (50:50) with 0.1% TFA 15% to 30% over 60 min
DAD, ESI-MS [136]
black & red raspberry (Rubus occidentalis & idaeus) cy, pg glycosides
Waters Symmetry C18 75x4.6 3.5
water-formic acid (90:10) acn
0% to 10% over 20 min, 0% at 25 min
DAD, ESI-MS, MS-MS [137]
black currant (Ribes nigrum)
dp & cy glycosides
Hypersil ODS 60x4.6 3
water-formic acid (95:5) acn
5% to 18% over 8 min, 95% at 13 min, 95% at 14 min, 5% at 19 min, 5% at 24 min DAD [138]
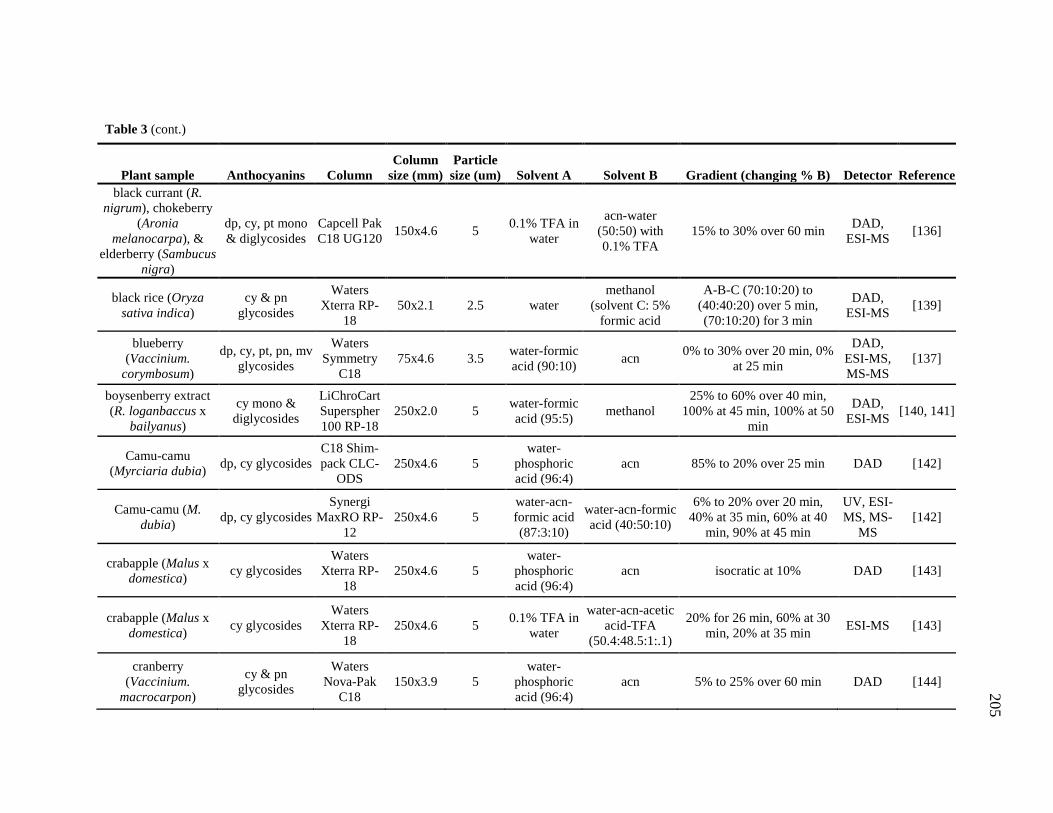
205
Plant sample Anthocyanins Column Column
size (mm) Particle
size (um) Solvent A Solvent B Gradient (changing % B) Detector Reference black currant (R.
nigrum), chokeberry (Aronia
melanocarpa), & elderberry (Sambucus
nigra)
dp, cy, pt mono & diglycosides
Capcell Pak C18 UG120 150x4.6 5 0.1% TFA in
water
acn-water (50:50) with 0.1% TFA
15% to 30% over 60 min DAD, ESI-MS [136]
black rice (Oryza sativa indica)
cy & pn glycosides
Waters Xterra RP-
18 50x2.1 2.5 water
methanol (solvent C: 5%
formic acid
A-B-C (70:10:20) to (40:40:20) over 5 min, (70:10:20) for 3 min
DAD, ESI-MS [139]
blueberry (Vaccinium.
corymbosum)
dp, cy, pt, pn, mv glycosides
Waters Symmetry
C18 75x4.6 3.5 water-formic
acid (90:10) acn 0% to 30% over 20 min, 0% at 25 min
DAD, ESI-MS, MS-MS
[137]
boysenberry extract (R. loganbaccus x
bailyanus)
cy mono & diglycosides
LiChroCart Superspher 100 RP-18
250x2.0 5 water-formic acid (95:5) methanol
25% to 60% over 40 min, 100% at 45 min, 100% at 50
min
DAD, ESI-MS [140, 141]
Camu-camu (Myrciaria dubia) dp, cy glycosides
C18 Shim-pack CLC-
ODS 250x4.6 5
water-phosphoric acid (96:4)
acn 85% to 20% over 25 min DAD [142]
Camu-camu (M. dubia) dp, cy glycosides
Synergi MaxRO RP-
12 250x4.6 5
water-acn-formic acid (87:3:10)
water-acn-formic acid (40:50:10)
6% to 20% over 20 min, 40% at 35 min, 60% at 40
min, 90% at 45 min
UV, ESI-MS, MS-
MS [142]
crabapple (Malus x domestica) cy glycosides
Waters Xterra RP-
18 250x4.6 5
water-phosphoric acid (96:4)
acn isocratic at 10% DAD [143]
crabapple (Malus x domestica) cy glycosides
Waters Xterra RP-
18 250x4.6 5 0.1% TFA in
water
water-acn-acetic acid-TFA
(50.4:48.5:1:.1)
20% for 26 min, 60% at 30 min, 20% at 35 min ESI-MS [143]
cranberry (Vaccinium.
macrocarpon)
cy & pn glycosides
Waters Nova-Pak
C18 150x3.9 5
water-phosphoric acid (96:4)
acn 5% to 25% over 60 min DAD [144]
Table 3 (cont.)
Table 3 (cont.)
204
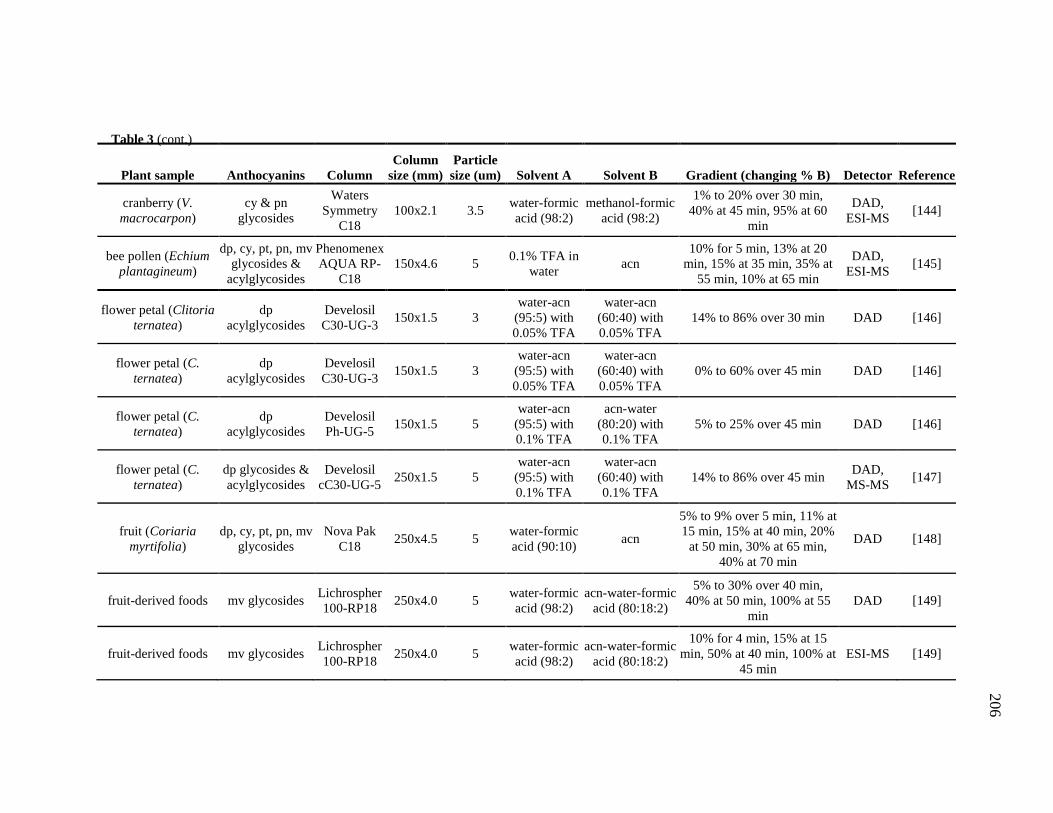
206
Plant sample Anthocyanins Column Column
size (mm) Particle
size (um) Solvent A Solvent B Gradient (changing % B) Detector Reference
cranberry (V. macrocarpon)
cy & pn glycosides
Waters Symmetry
C18 100x2.1 3.5 water-formic
acid (98:2) methanol-formic
acid (98:2)
1% to 20% over 30 min, 40% at 45 min, 95% at 60
min
DAD, ESI-MS [144]
bee pollen (Echium plantagineum)
dp, cy, pt, pn, mv glycosides &
acylglycosides
Phenomenex AQUA RP-
C18 150x4.6 5 0.1% TFA in
water acn 10% for 5 min, 13% at 20
min, 15% at 35 min, 35% at 55 min, 10% at 65 min
DAD, ESI-MS [145]
flower petal (Clitoria ternatea)
dp acylglycosides
Develosil C30-UG-3 150x1.5 3
water-acn (95:5) with 0.05% TFA
water-acn (60:40) with 0.05% TFA
14% to 86% over 30 min DAD [146]
flower petal (C. ternatea)
dp acylglycosides
Develosil C30-UG-3 150x1.5 3
water-acn (95:5) with 0.05% TFA
water-acn (60:40) with 0.05% TFA
0% to 60% over 45 min DAD [146]
flower petal (C. ternatea)
dp acylglycosides
Develosil Ph-UG-5 150x1.5 5
water-acn (95:5) with 0.1% TFA
acn-water (80:20) with 0.1% TFA
5% to 25% over 45 min DAD [146]
flower petal (C. ternatea)
dp glycosides & acylglycosides
Develosil cC30-UG-5 250x1.5 5
water-acn (95:5) with 0.1% TFA
water-acn (60:40) with 0.1% TFA
14% to 86% over 45 min DAD, MS-MS [147]
fruit (Coriaria myrtifolia)
dp, cy, pt, pn, mv glycosides
Nova Pak C18 250x4.5 5 water-formic
acid (90:10) acn
5% to 9% over 5 min, 11% at 15 min, 15% at 40 min, 20%
at 50 min, 30% at 65 min, 40% at 70 min
DAD [148]
fruit-derived foods mv glycosides Lichrospher 100-RP18 250x4.0 5 water-formic
acid (98:2) acn-water-formic
acid (80:18:2)
5% to 30% over 40 min, 40% at 50 min, 100% at 55
min DAD [149]
fruit-derived foods mv glycosides Lichrospher 100-RP18 250x4.0 5 water-formic
acid (98:2) acn-water-formic
acid (80:18:2)
10% for 4 min, 15% at 15 min, 50% at 40 min, 100% at
45 min ESI-MS [149]
Table 3 (cont.)
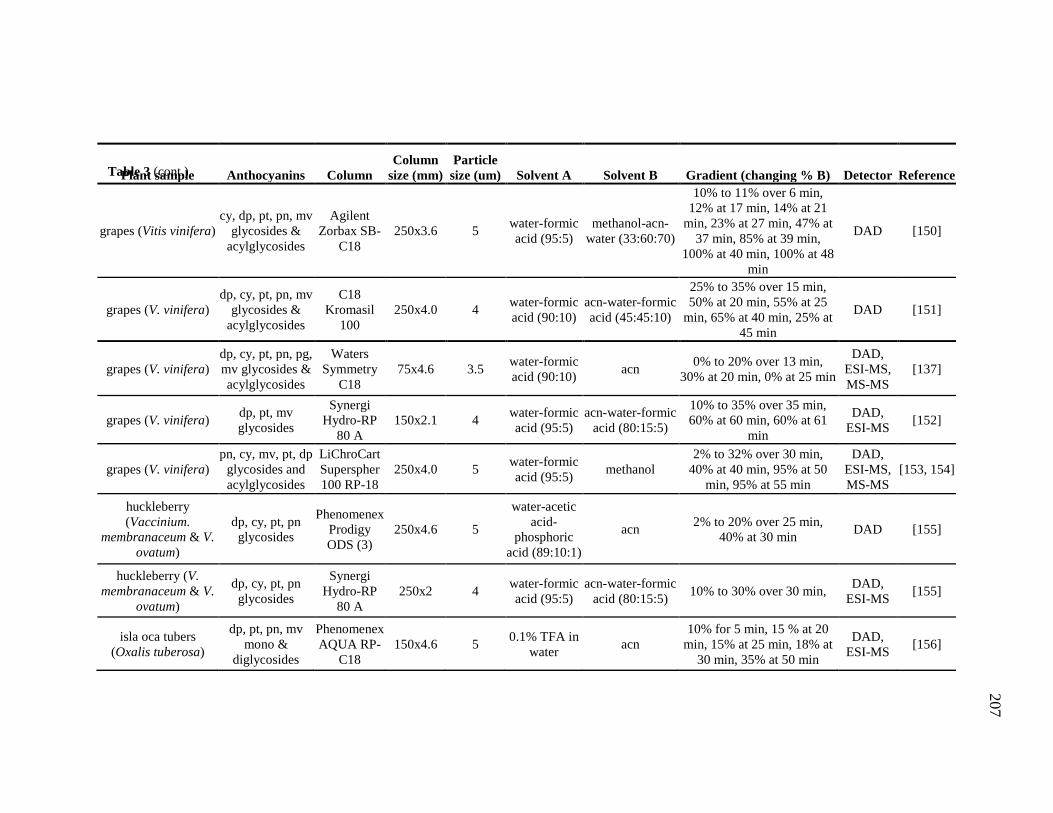
207
Plant sample Anthocyanins Column Column
size (mm) Particle
size (um) Solvent A Solvent B Gradient (changing % B) Detector Reference
grapes (Vitis vinifera) cy, dp, pt, pn, mv
glycosides & acylglycosides
Agilent Zorbax SB-
C18 250x3.6 5 water-formic
acid (95:5) methanol-acn-
water (33:60:70)
10% to 11% over 6 min, 12% at 17 min, 14% at 21
min, 23% at 27 min, 47% at 37 min, 85% at 39 min,
100% at 40 min, 100% at 48 min
DAD [150]
grapes (V. vinifera) dp, cy, pt, pn, mv
glycosides & acylglycosides
C18 Kromasil
100 250x4.0 4 water-formic
acid (90:10) acn-water-formic acid (45:45:10)
25% to 35% over 15 min, 50% at 20 min, 55% at 25
min, 65% at 40 min, 25% at 45 min
DAD [151]
grapes (V. vinifera) dp, cy, pt, pn, pg, mv glycosides & acylglycosides
Waters Symmetry
C18 75x4.6 3.5 water-formic
acid (90:10) acn 0% to 20% over 13 min, 30% at 20 min, 0% at 25 min
DAD, ESI-MS, MS-MS
[137]
grapes (V. vinifera) dp, pt, mv glycosides
Synergi Hydro-RP
80 A 150x2.1 4 water-formic
acid (95:5) acn-water-formic
acid (80:15:5)
10% to 35% over 35 min, 60% at 60 min, 60% at 61
min
DAD, ESI-MS [152]
grapes (V. vinifera) pn, cy, mv, pt, dp
glycosides and acylglycosides
LiChroCart Superspher 100 RP-18
250x4.0 5 water-formic acid (95:5) methanol
2% to 32% over 30 min, 40% at 40 min, 95% at 50
min, 95% at 55 min
DAD, ESI-MS, MS-MS
[153, 154]
huckleberry (Vaccinium.
membranaceum & V. ovatum)
dp, cy, pt, pn glycosides
Phenomenex Prodigy ODS (3)
250x4.6 5
water-acetic acid-
phosphoric acid (89:10:1)
acn 2% to 20% over 25 min, 40% at 30 min DAD [155]
huckleberry (V. membranaceum & V.
ovatum)
dp, cy, pt, pn glycosides
Synergi Hydro-RP
80 A 250x2 4 water-formic
acid (95:5) acn-water-formic
acid (80:15:5) 10% to 30% over 30 min, DAD, ESI-MS [155]
isla oca tubers (Oxalis tuberosa)
dp, pt, pn, mv mono &
diglycosides
Phenomenex AQUA RP-
C18 150x4.6 5 0.1% TFA in
water acn 10% for 5 min, 15 % at 20
min, 15% at 25 min, 18% at 30 min, 35% at 50 min
DAD, ESI-MS [156]
Table 3 (cont.)
206
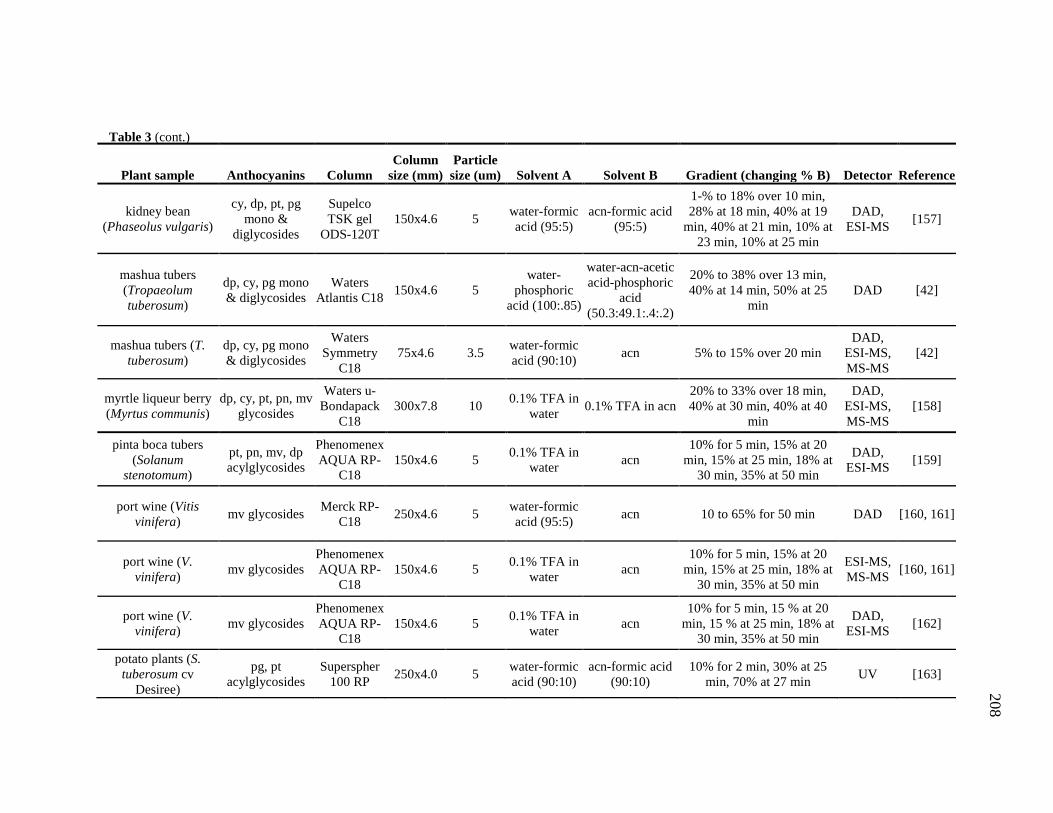
208
Plant sample Anthocyanins Column Column
size (mm) Particle
size (um) Solvent A Solvent B Gradient (changing % B) Detector Reference
kidney bean (Phaseolus vulgaris)
cy, dp, pt, pg mono &
diglycosides
Supelco TSK gel
ODS-120T 150x4.6 5 water-formic
acid (95:5) acn-formic acid
(95:5)
1-% to 18% over 10 min, 28% at 18 min, 40% at 19
min, 40% at 21 min, 10% at 23 min, 10% at 25 min
DAD, ESI-MS [157]
mashua tubers (Tropaeolum tuberosum)
dp, cy, pg mono & diglycosides
Waters Atlantis C18 150x4.6 5
water-phosphoric
acid (100:.85)
water-acn-acetic acid-phosphoric
acid (50.3:49.1:.4:.2)
20% to 38% over 13 min, 40% at 14 min, 50% at 25
min DAD [42]
mashua tubers (T. tuberosum)
dp, cy, pg mono & diglycosides
Waters Symmetry
C18 75x4.6 3.5 water-formic
acid (90:10) acn 5% to 15% over 20 min DAD,
ESI-MS, MS-MS
[42]
myrtle liqueur berry (Myrtus communis)
dp, cy, pt, pn, mv glycosides
Waters u-Bondapack
C18 300x7.8 10 0.1% TFA in
water 0.1% TFA in acn 20% to 33% over 18 min, 40% at 30 min, 40% at 40
min
DAD, ESI-MS, MS-MS
[158]
pinta boca tubers (Solanum
stenotomum)
pt, pn, mv, dp acylglycosides
Phenomenex AQUA RP-
C18 150x4.6 5 0.1% TFA in
water acn 10% for 5 min, 15% at 20
min, 15% at 25 min, 18% at 30 min, 35% at 50 min
DAD, ESI-MS [159]
port wine (Vitis vinifera) mv glycosides Merck RP-
C18 250x4.6 5 water-formic acid (95:5) acn 10 to 65% for 50 min DAD [160, 161]
port wine (V. vinifera) mv glycosides
Phenomenex AQUA RP-
C18 150x4.6 5 0.1% TFA in
water acn 10% for 5 min, 15% at 20
min, 15% at 25 min, 18% at 30 min, 35% at 50 min
ESI-MS, MS-MS [160, 161]
port wine (V. vinifera) mv glycosides
Phenomenex AQUA RP-
C18 150x4.6 5 0.1% TFA in
water acn 10% for 5 min, 15 % at 20
min, 15 % at 25 min, 18% at 30 min, 35% at 50 min
DAD, ESI-MS [162]
potato plants (S. tuberosum cv
Desiree)
pg, pt acylglycosides
Superspher 100 RP 250x4.0 5 water-formic
acid (90:10) acn-formic acid
(90:10) 10% for 2 min, 30% at 25
min, 70% at 27 min UV [163]
Table 3 (cont.)
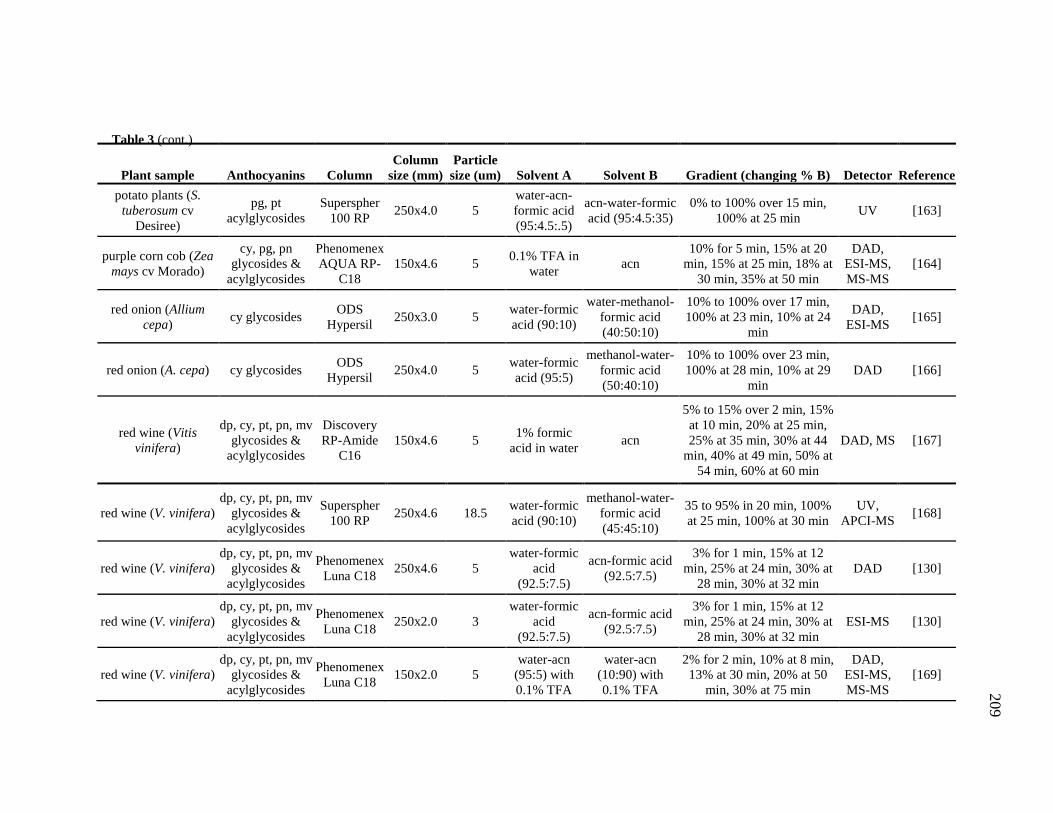
209
Plant sample Anthocyanins Column Column
size (mm) Particle
size (um) Solvent A Solvent B Gradient (changing % B) Detector Reference potato plants (S.
tuberosum cv Desiree)
pg, pt acylglycosides
Superspher 100 RP 250x4.0 5
water-acn-formic acid (95:4.5:.5)
acn-water-formic acid (95:4.5:35)
0% to 100% over 15 min, 100% at 25 min UV [163]
purple corn cob (Zea mays cv Morado)
cy, pg, pn glycosides &
acylglycosides
Phenomenex AQUA RP-
C18 150x4.6 5 0.1% TFA in
water acn 10% for 5 min, 15% at 20
min, 15% at 25 min, 18% at 30 min, 35% at 50 min
DAD, ESI-MS, MS-MS
[164]
red onion (Allium cepa) cy glycosides ODS
Hypersil 250x3.0 5 water-formic acid (90:10)
water-methanol-formic acid (40:50:10)
10% to 100% over 17 min, 100% at 23 min, 10% at 24
min
DAD, ESI-MS [165]
red onion (A. cepa) cy glycosides ODS Hypersil 250x4.0 5 water-formic
acid (95:5)
methanol-water-formic acid (50:40:10)
10% to 100% over 23 min, 100% at 28 min, 10% at 29
min DAD [166]
red wine (Vitis vinifera)
dp, cy, pt, pn, mv glycosides &
acylglycosides
Discovery RP-Amide
C16 150x4.6 5 1% formic
acid in water acn
5% to 15% over 2 min, 15% at 10 min, 20% at 25 min, 25% at 35 min, 30% at 44
min, 40% at 49 min, 50% at 54 min, 60% at 60 min
DAD, MS [167]
red wine (V. vinifera) dp, cy, pt, pn, mv
glycosides & acylglycosides
Superspher 100 RP 250x4.6 18.5 water-formic
acid (90:10)
methanol-water-formic acid (45:45:10)
35 to 95% in 20 min, 100% at 25 min, 100% at 30 min
UV, APCI-MS [168]
red wine (V. vinifera) dp, cy, pt, pn, mv
glycosides & acylglycosides
Phenomenex Luna C18 250x4.6 5
water-formic acid
(92.5:7.5)
acn-formic acid (92.5:7.5)
3% for 1 min, 15% at 12 min, 25% at 24 min, 30% at
28 min, 30% at 32 min DAD [130]
red wine (V. vinifera) dp, cy, pt, pn, mv
glycosides & acylglycosides
Phenomenex Luna C18 250x2.0 3
water-formic acid
(92.5:7.5)
acn-formic acid (92.5:7.5)
3% for 1 min, 15% at 12 min, 25% at 24 min, 30% at
28 min, 30% at 32 min ESI-MS [130]
red wine (V. vinifera) dp, cy, pt, pn, mv
glycosides & acylglycosides
Phenomenex Luna C18 150x2.0 5
water-acn (95:5) with 0.1% TFA
water-acn (10:90) with 0.1% TFA
2% for 2 min, 10% at 8 min, 13% at 30 min, 20% at 50
min, 30% at 75 min
DAD, ESI-MS, MS-MS
[169]
Table 3 (cont.)
208
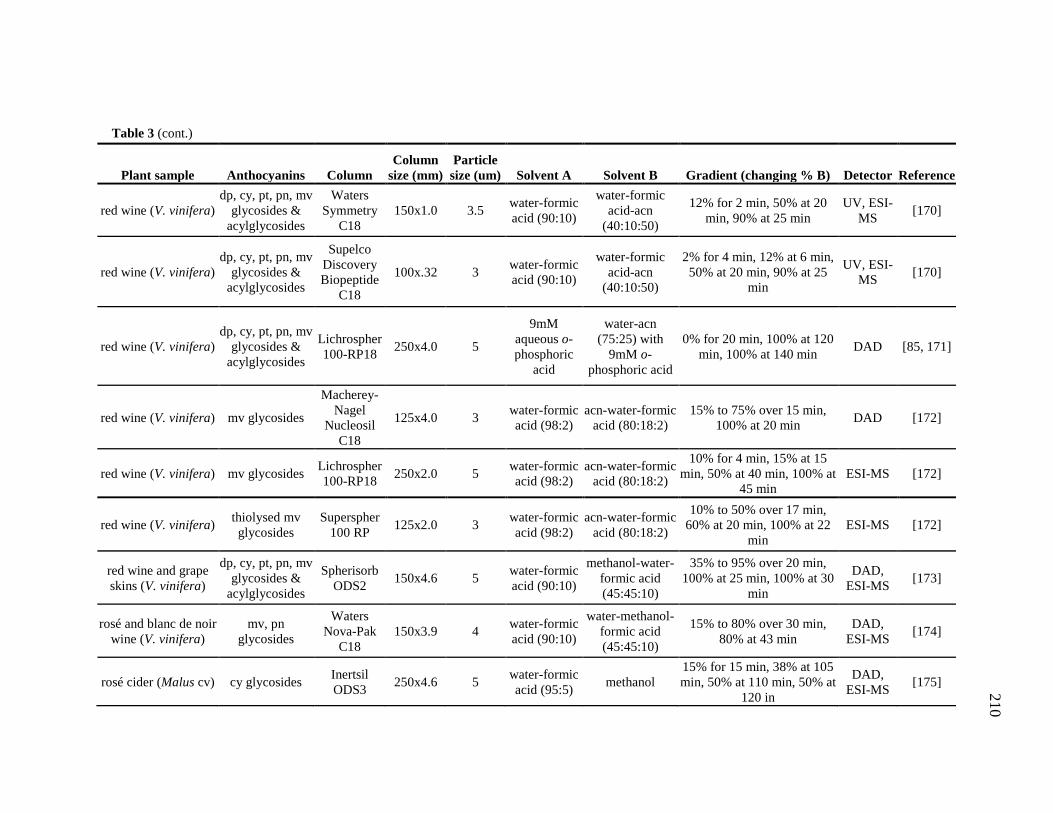
210
Plant sample Anthocyanins Column Column
size (mm) Particle
size (um) Solvent A Solvent B Gradient (changing % B) Detector Reference
red wine (V. vinifera) dp, cy, pt, pn, mv
glycosides & acylglycosides
Waters Symmetry
C18 150x1.0 3.5 water-formic
acid (90:10)
water-formic acid-acn
(40:10:50)
12% for 2 min, 50% at 20 min, 90% at 25 min
UV, ESI-MS [170]
red wine (V. vinifera) dp, cy, pt, pn, mv
glycosides & acylglycosides
Supelco Discovery Biopeptide
C18
100x.32 3 water-formic acid (90:10)
water-formic acid-acn
(40:10:50)
2% for 4 min, 12% at 6 min, 50% at 20 min, 90% at 25
min
UV, ESI-MS [170]
red wine (V. vinifera) dp, cy, pt, pn, mv
glycosides & acylglycosides
Lichrospher 100-RP18 250x4.0 5
9mM aqueous o-phosphoric
acid
water-acn (75:25) with
9mM o-phosphoric acid
0% for 20 min, 100% at 120 min, 100% at 140 min DAD [85, 171]
red wine (V. vinifera) mv glycosides
Macherey-Nagel
Nucleosil C18
125x4.0 3 water-formic acid (98:2)
acn-water-formic acid (80:18:2)
15% to 75% over 15 min, 100% at 20 min DAD [172]
red wine (V. vinifera) mv glycosides Lichrospher 100-RP18 250x2.0 5 water-formic
acid (98:2) acn-water-formic
acid (80:18:2)
10% for 4 min, 15% at 15 min, 50% at 40 min, 100% at
45 min ESI-MS [172]
red wine (V. vinifera) thiolysed mv glycosides
Superspher 100 RP 125x2.0 3 water-formic
acid (98:2) acn-water-formic
acid (80:18:2)
10% to 50% over 17 min, 60% at 20 min, 100% at 22
min ESI-MS [172]
red wine and grape skins (V. vinifera)
dp, cy, pt, pn, mv glycosides &
acylglycosides
Spherisorb ODS2 150x4.6 5 water-formic
acid (90:10)
methanol-water-formic acid (45:45:10)
35% to 95% over 20 min, 100% at 25 min, 100% at 30
min
DAD, ESI-MS [173]
rosé and blanc de noir wine (V. vinifera)
mv, pn glycosides
Waters Nova-Pak
C18 150x3.9 4 water-formic
acid (90:10)
water-methanol-formic acid (45:45:10)
15% to 80% over 30 min, 80% at 43 min
DAD, ESI-MS [174]
rosé cider (Malus cv) cy glycosides Inertsil ODS3 250x4.6 5 water-formic
acid (95:5) methanol 15% for 15 min, 38% at 105 min, 50% at 110 min, 50% at
120 in
DAD, ESI-MS [175]
Table 3 (cont.)
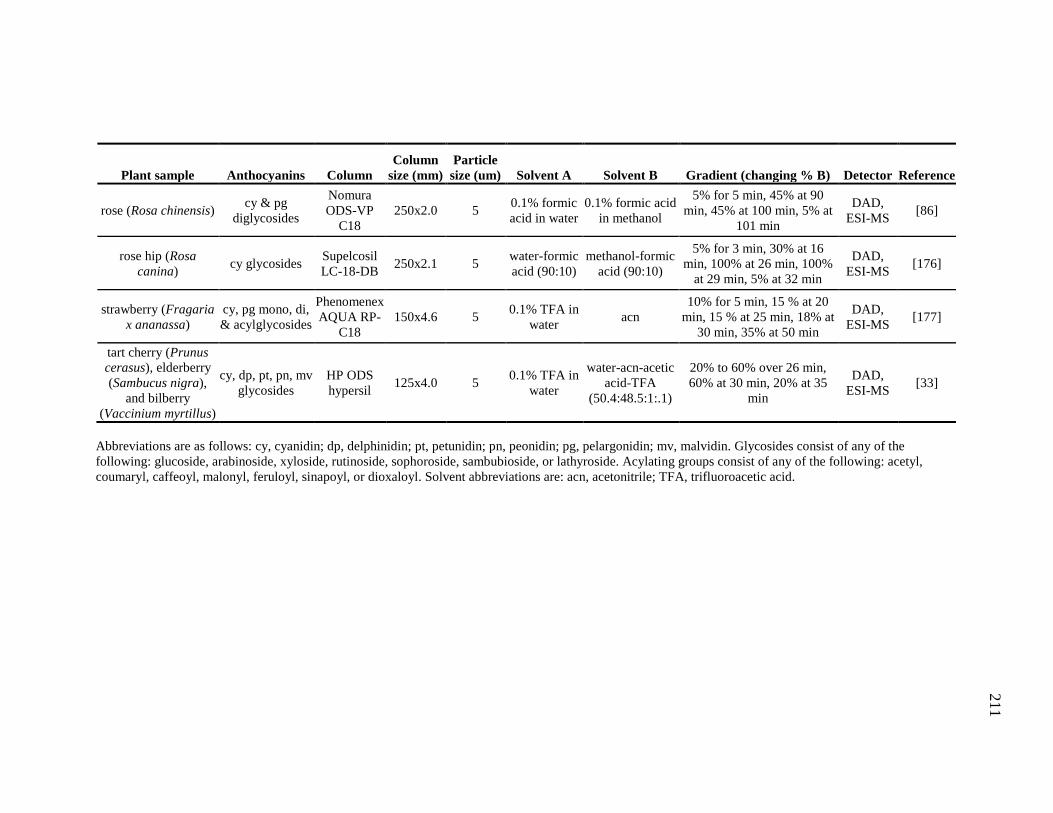
211
Plant sample Anthocyanins Column Column
size (mm) Particle
size (um) Solvent A Solvent B Gradient (changing % B) Detector Reference
rose (Rosa chinensis) cy & pg diglycosides
Nomura ODS-VP
C18 250x2.0 5 0.1% formic
acid in water 0.1% formic acid
in methanol
5% for 5 min, 45% at 90 min, 45% at 100 min, 5% at
101 min
DAD, ESI-MS [86]
rose hip (Rosa canina) cy glycosides Supelcosil
LC-18-DB 250x2.1 5 water-formic acid (90:10)
methanol-formic acid (90:10)
5% for 3 min, 30% at 16 min, 100% at 26 min, 100%
at 29 min, 5% at 32 min
DAD, ESI-MS [176]
strawberry (Fragaria x ananassa)
cy, pg mono, di, & acylglycosides
Phenomenex AQUA RP-
C18 150x4.6 5 0.1% TFA in
water acn 10% for 5 min, 15 % at 20
min, 15 % at 25 min, 18% at 30 min, 35% at 50 min
DAD, ESI-MS [177]
tart cherry (Prunus cerasus), elderberry (Sambucus nigra),
and bilberry (Vaccinium myrtillus)
cy, dp, pt, pn, mv glycosides
HP ODS hypersil 125x4.0 5 0.1% TFA in
water
water-acn-acetic acid-TFA
(50.4:48.5:1:.1)
20% to 60% over 26 min, 60% at 30 min, 20% at 35
min
DAD, ESI-MS [33]
Abbreviations are as follows: cy, cyanidin; dp, delphinidin; pt, petunidin; pn, peonidin; pg, pelargonidin; mv, malvidin. Glycosides consist of any of the following: glucoside, arabinoside, xyloside, rutinoside, sophoroside, sambubioside, or lathyroside. Acylating groups consist of any of the following: acetyl, coumaryl, caffeoyl, malonyl, feruloyl, sinapoyl, or dioxaloyl. Solvent abbreviations are: acn, acetonitrile; TFA, trifluoroacetic acid.
210
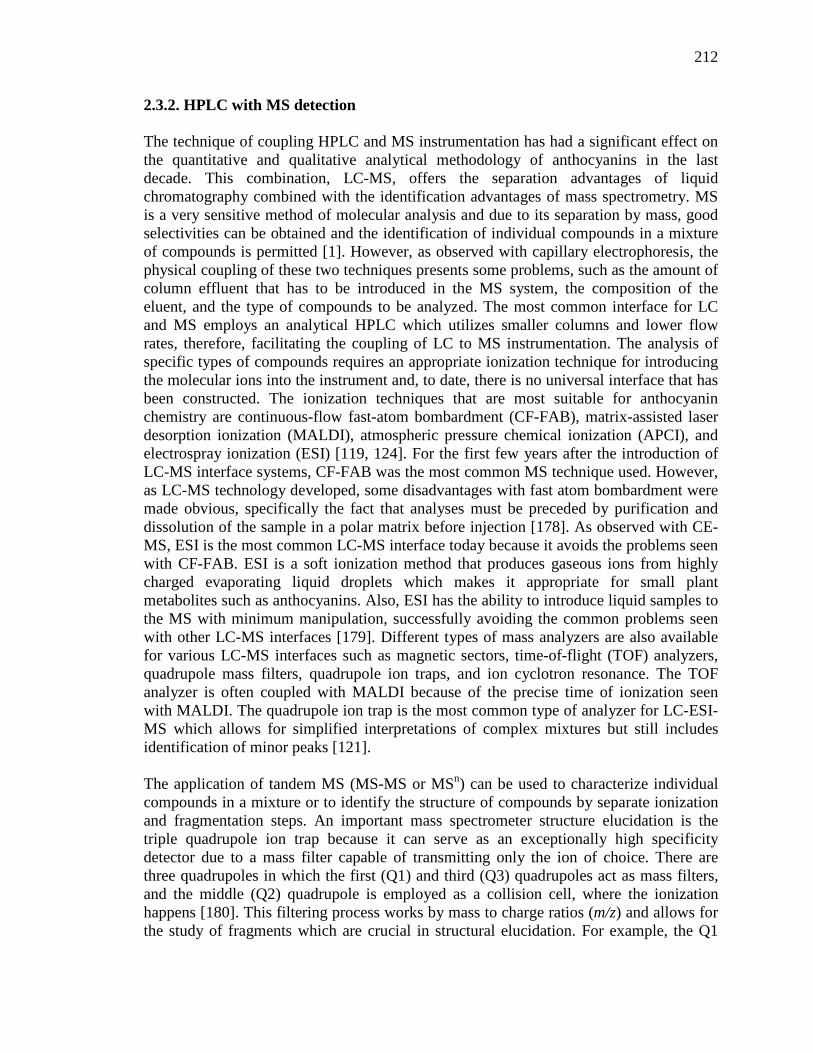
212
2.3.2. HPLC with MS detection The technique of coupling HPLC and MS instrumentation has had a significant effect on the quantitative and qualitative analytical methodology of anthocyanins in the last decade. This combination, LC-MS, offers the separation advantages of liquid chromatography combined with the identification advantages of mass spectrometry. MS is a very sensitive method of molecular analysis and due to its separation by mass, good selectivities can be obtained and the identification of individual compounds in a mixture of compounds is permitted [1]. However, as observed with capillary electrophoresis, the physical coupling of these two techniques presents some problems, such as the amount of column effluent that has to be introduced in the MS system, the composition of the eluent, and the type of compounds to be analyzed. The most common interface for LC and MS employs an analytical HPLC which utilizes smaller columns and lower flow rates, therefore, facilitating the coupling of LC to MS instrumentation. The analysis of specific types of compounds requires an appropriate ionization technique for introducing the molecular ions into the instrument and, to date, there is no universal interface that has been constructed. The ionization techniques that are most suitable for anthocyanin chemistry are continuous-flow fast-atom bombardment (CF-FAB), matrix-assisted laser desorption ionization (MALDI), atmospheric pressure chemical ionization (APCI), and electrospray ionization (ESI) [119, 124]. For the first few years after the introduction of LC-MS interface systems, CF-FAB was the most common MS technique used. However, as LC-MS technology developed, some disadvantages with fast atom bombardment were made obvious, specifically the fact that analyses must be preceded by purification and dissolution of the sample in a polar matrix before injection [178]. As observed with CE-MS, ESI is the most common LC-MS interface today because it avoids the problems seen with CF-FAB. ESI is a soft ionization method that produces gaseous ions from highly charged evaporating liquid droplets which makes it appropriate for small plant metabolites such as anthocyanins. Also, ESI has the ability to introduce liquid samples to the MS with minimum manipulation, successfully avoiding the common problems seen with other LC-MS interfaces [179]. Different types of mass analyzers are also available for various LC-MS interfaces such as magnetic sectors, time-of-flight (TOF) analyzers, quadrupole mass filters, quadrupole ion traps, and ion cyclotron resonance. The TOF analyzer is often coupled with MALDI because of the precise time of ionization seen with MALDI. The quadrupole ion trap is the most common type of analyzer for LC-ESI-MS which allows for simplified interpretations of complex mixtures but still includes identification of minor peaks [121]. The application of tandem MS (MS-MS or MSn) can be used to characterize individual compounds in a mixture or to identify the structure of compounds by separate ionization and fragmentation steps. An important mass spectrometer structure elucidation is the triple quadrupole ion trap because it can serve as an exceptionally high specificity detector due to a mass filter capable of transmitting only the ion of choice. There are three quadrupoles in which the first (Q1) and third (Q3) quadrupoles act as mass filters, and the middle (Q2) quadrupole is employed as a collision cell, where the ionization happens [180]. This filtering process works by mass to charge ratios (m/z) and allows for the study of fragments which are crucial in structural elucidation. For example, the Q1
213
can be set to filter out an ion of a known mass, which is fragmented in Q2, and Q3 can then be set to scan the entire m/z range, giving information on the sizes of the fragments made as well as information on that one specific ion fragment. Thus, the structure of the original ion can be deduced [181]. However, as was mentioned, electrospray ionization has been an efficient ionization technique for LC-MS but is a soft technique and does not tend to produce many fragments, which are essential for MS/MS. Because of this, LC-MS/MS will use two methods of ionization, ESI to introduce a parent ion into the mass spectrometer and then collision-induced dissociation (CID) to enhance the fragmentation of the parent ion [119]. An example of LC-ESI-MS/MS, demonstrating precursor-ion analysis and product-ion analysis by Tian et al. can be seen in Fig. (8) [137]. 2.3.3. HPLC with NMR detection While LC-UV-MS and LC-MS-MS are very powerful analytical methods for anthocyanins, the use of NMR detection combined with HPLC separation (LC-NMR) surpasses the previous methodologies in structural elucidation of unknown compounds in crude plant extracts. When it was first introduced, LC-NMR struggled due to a lack of sensitivity, but with progress in solvent suppression, pulse field gradients, probe technology, and high-field magnets this technique has only grown in popularity. The physical interfacing of these two instruments was not difficult, but observing the analyte response in the presence of nondeuterated solvents caused serious problems until the development of solvent suppression techniques [118]. Also, the precise separation procedures with HPLC often employ gradient solvent systems, which cause the resonances to change frequency during analysis in the gradient mode but with increased pulse field gradient technologies, this problem has also been alleviated [119]. At the current time, LC-NMR methodology is mostly limited to 1H NMR spectra or, under certain conditions, 13C NMR spectra, but only when the peak concentration of interest is high and inverse detection experiments are acceptable. Due to the low natural abundance of 13C isotope, the sensitivity for direct measurement of 13C-NMR using LC-NMR instrumentation has not yet been developed. When measuring the 1H spectra of the main constituents of a crude extract, this can be done in what is called on-flow mode. The on-flow operation requires a fairly high concentration of the crude plant extract (at least 1 mg injection) and the spectra are acquired continuously during the separation; what is observed with on-flow operation is a 2-D NMR spectrum with a low senstivity. For more precise measurements or 2-D correlation experiments, the LC-NMR can be operated in the stopped-flow mode which halts the flow of solvent, for a short amount of time, when the required peak reaches the NMR flow cell. In this mode, various 2-D experiments can be performed such as COSY, NOESY, HSQC, and HMBC, because stopping the mobile phase flow allows for a large number of scans (or transients) to be taken for a given LC peak [118, 119].
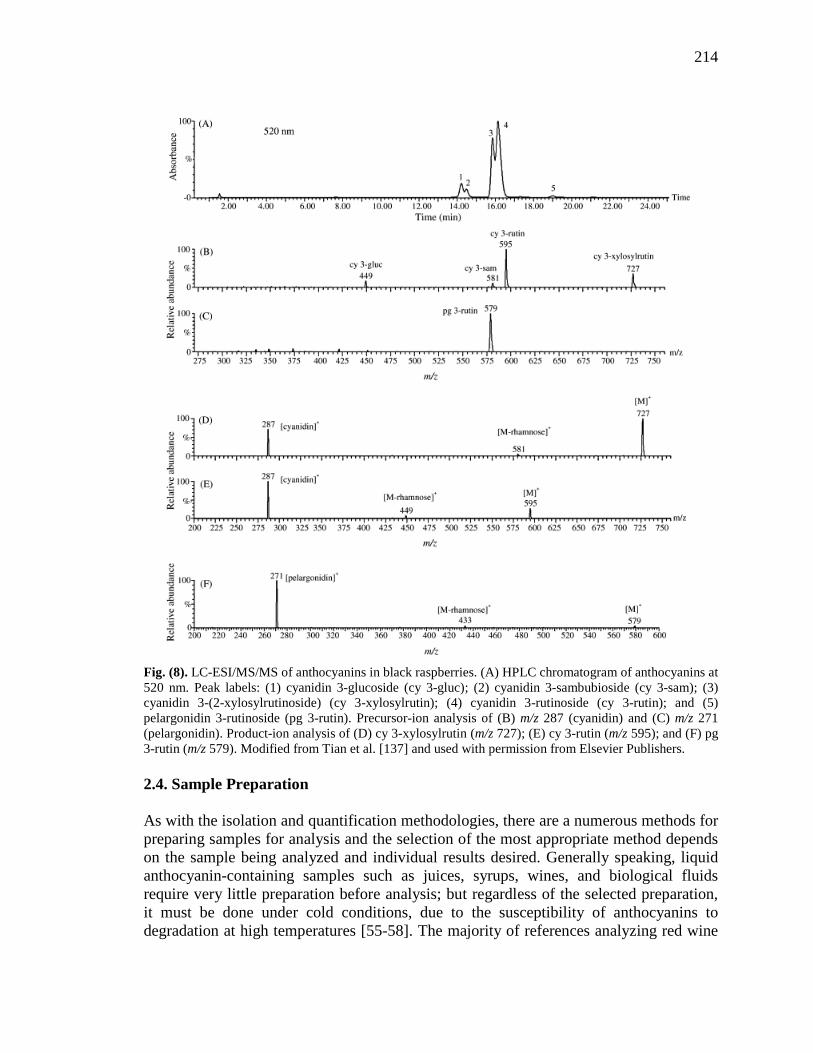
214
Fig. (8). LC-ESI/MS/MS of anthocyanins in black raspberries. (A) HPLC chromatogram of anthocyanins at 520 nm. Peak labels: (1) cyanidin 3-glucoside (cy 3-gluc); (2) cyanidin 3-sambubioside (cy 3-sam); (3) cyanidin 3-(2-xylosylrutinoside) (cy 3-xylosylrutin); (4) cyanidin 3-rutinoside (cy 3-rutin); and (5) pelargonidin 3-rutinoside (pg 3-rutin). Precursor-ion analysis of (B) m/z 287 (cyanidin) and (C) m/z 271 (pelargonidin). Product-ion analysis of (D) cy 3-xylosylrutin (m/z 727); (E) cy 3-rutin (m/z 595); and (F) pg 3-rutin (m/z 579). Modified from Tian et al. [137] and used with permission from Elsevier Publishers. 2.4. Sample Preparation As with the isolation and quantification methodologies, there are a numerous methods for preparing samples for analysis and the selection of the most appropriate method depends on the sample being analyzed and individual results desired. Generally speaking, liquid anthocyanin-containing samples such as juices, syrups, wines, and biological fluids require very little preparation before analysis; but regardless of the selected preparation, it must be done under cold conditions, due to the susceptibility of anthocyanins to degradation at high temperatures [55-58]. The majority of references analyzing red wine
215
samples have progressed to simply filtering the samples through a 0.45 µm filter before injection or even just a direct injection method for anthocyanin analysis [85, 130, 169-171]. When testing anthocyanins in biological fluids, such as urine or plasma, the samples are generally acidified, to maintain the anthocyanin in its flavylium form, filtered and injected into the LC [30, 114, 137]. Solid anthocyanin containing samples, however, require the samples to be homogenized before a representative sample can be extracted. For seeds or dried plant materials, the samples must first be crushed using a mortar and pestle or ground using a coffee grinder, depending on the specific sample. Once the samples have been powdered and mixed, a representative aliquot can easily be removed for a smaller scale extraction [121]. Berry samples are different in that when they are fresh, they need to be crushed and filtered, in order to isolate and dry the solid residue which subsequently undergoes extraction [177]. Berries can also be individually frozen, stored for a short amount of time, and ground in liquid nitrogen allowing for large amounts of berries to be ground together and completely mixed before a representative subsample is removed [182]. Once the plant tissues have been prepared, the next step involves solid-phase extraction (SPE) or liquid-liquid extraction (LLE). Whichever method is preferred, it must allow for recovery of the anthocyanins avoiding any chemical modification. Anthocyanins are soluble in polar solvents, due to the hydroxyls and sugars attached, and are therefore commonly extracted with methanol or ethanol. Because of the instability of the compounds, extractions are performed under cold conditions, not higher than 30ºC, and with small amounts of acid to give an environment of pH 2.0 or below. The most common acids used for extraction are hydrochloric (HCl) or formic acid; however, the use of these acids can cause hydrolysis of acylating groups in certain anthocyanins [1, 121, 124]. Because of this, acylated anthocyanins should be extracted with solvent containing HCl below a concentration of 0.12 mol/L or containing organic acids (e.g., acetic or formic acid) [183]. When extracting malonated anthocyanins, extractions are proceeded with weak acids, such as tartaric or citric acid, to avoid hydrolysis of the dicarboxylic acid [79]. Acetone is also used for LLE with efficient and more reproducible results than using methanol or ethanol. This technique works well because solvent concentration can be done at the lower temperatures needed for anthocyanins and also avoids problems with pectins that are observed with the other LLE techniques. The pectins that are found in the walls of some anthocyanin containing berries can cause problems when in the acidic extraction environments, forming a turbid extract that slows the procedure; however, acetone contains pectin-clotting properties and rapidly produces a clean anthocyanin extract [184, 185]. For solid-phase extraction, popular methods utilize C18 cartridges or Sephadex LH-20 for the initial separation of the anthocyanin extracts from the crude plant sample. The polar anthocyanins bind to these adsorbants through unsubstituted hydroxyl groups and are separated from other plant compounds using solvents of increasing polarity. Investigations have shown SPE to be a fast and highly efficient method for the separation of crude anthocyanin solutions from plant material [1, 124, 186]. With the collection of the anthocyanin extract, the next step is to remove the solvent to a known amount and continue with the analysis. Samples which need to be stored are generally stored as dried samples, with the solvent rotovapped and lyophilized, in cold, dark environments to avoid decomposition of the anthocyanins.
216
2.5. Phytochemical Investigation Procedures After the anthocyanin extract has been separated from the plant tissue, the extracts are evaluated to determine whether additional preparation is needed before the purification and quantification methods. Generally, because the results of SPE or LLE give crude anthocyanin extracts, additional separation methods are utilized to purify the sample before analysis. The appropriate techniques for a preliminary separation include large-scale chromatographic techniques, such as normal-phase column chromatography, countercurrent chromatography and preparative-HPLC and these methods would be monitored with the previously mentioned TLC to ensure minimum loss of the desire product. These steps are routinely employed when working with a comprehensive phytochemical investigation of anthocyanin-containing plant tissues. 2.5.1. Normal-Phase Column Chromatographic Separations The first of these techniques, column chromatography, originally grew in popularity because of the need to obtain pure anthocyanin compounds in sufficient quantities for subsequent identification and characterization as well as to be used as reference substances in qualitative and quantitative analyses. An effective column chromatography technique capable of separating the impure anthocyanin derivatization and degradation products that are inevitably present in crude plant extracts, as well as resolving the naturally found mixture of different anthocyanins was needed [118]. Liu et al. [187] investigated six adsorbant resins, each a cross-linked polystyrene copolymer, and X-5 was found to be the most efficient adsorbant of the anthocyanin as a nonpolar resin with relatively high surface area (500-600 m2/g) and pore radius (290-300 Å). The tested resins were loaded with centrifuged mulberry juice and washed with distilled H2O until clear, which effectively removed the sugars, acids, and other water-soluble compounds. The adsorbed anthocyanins were then eluted with acidic ethanol (0.5% hydrochloric acid v/v) until the resins was clean [187]. The concentrated anthocyanins were quantified using the pH differential method with the total content calculated as cyanidin-3-glucoside which, even though mulberry anthocyanins consist of cyanidin-3-glucoside and cyanidin-3-rutinoside, gives acceptable calculations [188]. A more popular adsorbent resin is Amberlite XAD-7, an acrylic ester of intermediate polarity, ~450 m2/g surface area and ~90 Å pore diameter. Similar to Liu’s experiment with macroporous resins, an Amberlite XAD-7 column was loaded with the crude plant extract and washed with distilled H2O to remove sugars, acids, and other by products after which the anthocyanin compounds are eluted with acidic methanol (0.3-1.0 % trifluoroacetic acid v/v) [189, 190]. Following this initial separation of the anthocyanin fractions by macroporous resins, the anthocyanins are often further purified using size exclusion chromatography with Sephadex LH-20 or Toyopearl HW-40 and acidic methanol elution or silica gel preparative TLC [189-191]. 2.5.2. Countercurrent Chromatographic Separations
217
Countercurrent chromatography (CCC), in contrast to chromatography with a solid phase, is an all liquid chromatographic technique that operates under gentle conditions and allows non-destructive isolation of the anthocyanin compounds. Due to the absence of any solid stationary phase, adsorption losses are minimized and a 100% sample recovery is assured. CCC is an automated version of liquid-liquid extraction, comparable to the repeated partitioning of an analyte between two immiscible pases by vigorous mixing in a separatory funnel. The latest technique, high-speed CCC (HSCCC) or multilayer coil CCC (MLCCC), creates separation by wrapping an inert Teflon tubing around a holder in multiple layers and the coil is subsequently rotated in a planetary fashion; that is, it rotates at ~900 rpm around its own ‘planetary’ axis and simultaneously around a parallel ‘solar’ axis [192]. High-speed countercurrent chromatography requires the use of two immiscible solvents, generally an organic and an aqueous phase, one to serve as the stationary phase and the other as the mobile phase. Throughout the utilization of CCC, a common multisolvent system composed of tert-butyl methyl ether (TBME)/n-butanol/acetonitrile/water acidified with 0.1% (v/v) trifluoroacetic acid (TFA) has been proven to be efficient regarding anthocyanin fractionation from a number of different plant sources [87, 193]. A similar solvent system containing less TFA (0.01% instead of 0.1% v/v) can be used with malonylated anthocyanins to avoid degradation of these more labile compounds compared to other acylated anthocyanins [192]. Winterhalter et al. [194] effectively separated the different classes of anthocyanins in wine by using multiple solvent systems of different polarities. This large-scale separation technique retained the solvent system involving TBME/n-butanol/acetonitrile/water acidified with 0.1% TFA (2:2:1:5) for the glucosidic anthocyanins, ethyl acetate/water (1:1) plus 0.1% TFA for the coumaroyl- and caffeoyl-glucosides and ethyl acetate/n-butanol/water (4:1:5) plus 0.1% TFA for the acetyl-glucosides [194]. Furthermore, a step gradient system was designed to efficiently separate anthocyanin compounds of red wine marc and grape skins by varying the polarity of the mobile phase, which is the organic phase in this case. This protocol, meant to simplify the process, involves changing the ratio of an auxiliary solvent, the acetonitrile concentration, while maintaining the immiscibility of the partitioning solvents. A three step gradient was selected to shorten the chromatographic process while keeping the level of resolution seen with an isocratic elution and consists of the following: TBME/n-butanol/acetonitrile/water acidified with 0.02% TFA (2:2:x:5), with x = 0.1, 1.2, and 1.8 parts [195]. As described, the step gradient method used the aqueous phase as the stationary phase, due to better phase retention, resulting in a tail to head elution pattern while the previous multisolvent systems all employed the lighter, organic phase as the stationary phase leading to a head to tail elution mode [87, 192-196]. The complication most often seen with countercurrent chromatography is difficulty keeping the stationary phase in its stationary position, whether it is aqueous or organic; because of this, stationary chromatographic techniques are still the most popular and reported separation methods for anthocyanins. 2.5.3. Preparative-HPLC Separations
218
HPLC, as discussed, is a popular method for the analysis of anthocyanin compounds; however, when preparative separations are necessary before the analyses, preparative-HPLC (prep-HPLC) can be used to clean up gram-scale quantities of plant extracts. Because of the larger column size and higher flow rate allowed with prep-HPLC, it is easy to inject as much as 100-200 mg and clean out the crude plant extracts. The columns that are used can be the same packing material, but a larger dimension, as is used for the analytical HPLC methods and the same mobile phases with an isocratic or simple gradient system. TLC is used to monitor the collected fractions and the similar TLC plates will correspond to the fractions that can be combined, concentrated, and used to continue on with the isolation techniques [119]. 3. Conclusions Plant anthocyanins play an important role in the biology of the plant, and more recently have been shown to have increasingly important applications in human health and nutrition. From their biological activity, such as antioxidant, anti-inflammatory, antiatherosclerotic, and anticancer properties, to their use as a natural pigment of processed foods, the interest in anthocyanins continues to grow. This class of compounds is found in hundreds of different plant tissues at very wide ranges of concentration (Table 2). In this review, various chromatographic separations and their derived analytical techniques to identify and quantitate natural anthocyanins have been described in detail. The progression of anthocyanin separation techniques started with traditional paper chromatography and thin-layer chromatography, and has grown with advances in analytical instrumentations to HPLC and CE combined with a variety of UV, MS, or NMR detectors. The range of investigated approaches spans normal-phase column chromatography and CCC for separation and preparation of large scale quantities to CE and HPLC for analytical identification and quantification of complex mixtures. Though some may be more common than others, each of these analyses has an appropriate function and capacity for execution in the analysis of anthocyanin-containing plant tissues. The analytical methodologies described here represent the current and foremost methodologies for the complete analyses of anthocyanins. As improved technologies continue to advance, so will our abilities for greater resolution at lower concentrations. This review also detailed the importance in the preanalytical phase of plant and sample preparation relative to maintaining the integrity of the natural anthocyanins. We illustrated the type of chemical changes that may occur during the processing and analysis of samples which could result in the identification of polyphenols that are artifacts of the extraction and analytical methods employed. Anthocyanins represent an increasingly examined class of compounds from their role in plant biology to their use and impact in health and nutrition. As a consequence, chemistry and analysis are the foundation upon which all other studies involving these compounds rely whether in biochemistry, chemistry, genetics, nutrition, foods, and pharmacognosy.
219
References [1]. Kong, J.-M., L.-S. Chia, N.-K. Goh, T.-F. Chia, and R. Brouillard,
Phytochemistry, 2003. 64. p. 923-933. [2]. Manach, C., A. Scalbert, C. Morand, C. Rémésy, and L. Jiménez, American
Journal of Clinical Nutrition, 2004. 79. p. 727-747. [3]. Kondratyuk, T. P. and J. M. Pezzuto, Pharmaceutical Biology, 2004. 42S. p. 46-
63. [4]. Siemann, E. H. and L. L. Creasy, American Journal of Enology and Viticulture,
1992. 43. p. 49-52. [5]. Gehm, B. D., J. M. McAndrew, P. Y. Chien, and J. L. Jameson, Proceedings for
the National Academy of Science USA, 1997. 9. p. 14138-14143. [6]. Stewart, J. R., N. E. Ward, C. G. Ioannides, and C. A. O'Brian, Biochemistry,
1999. 38. p. 13244-13251. [7]. Kitts, D. D., Y. V. Yuan, A. N. Wijewickreme, and L. U. Thompson, Molecular
Cell Biochemistry, 1999. 202. p. 91-100. [8]. Williams, C. A. and R. J. Grayer, Natural Product Report, 2004. 21. p. 539-573. [9]. Beecher, G. R., Journal of Nutrition, 2003. 133. p. 3248S-3254S. [10]. Harborne, J. B. and C. A. Williams, Phytochemistry (Elsevier), 2000. 55. p. 481-
504. [11]. Santos-Buelga, C. and A. Scalbert, Journal of the Science of Food and
Agriculture, 2000. 80. p. 1094-1117. [12]. Manach, C., C. Morand, A. Gil-Izquierdo, C. Bouteloup-Demange, and C.
Remesy, European Journal of Clinical Nutrition, 2003. 57. p. 235-242. [13]. Cos, P., T. De Bruyne, S. Apers, D. Vanden Berghe, L. Pieters, and A. J.
Vlietinck, Planta Medica, 2003. 69. [14]. Iwashina, T., Journal of Plant Research, 2000. 113. p. 287-299. [15]. Delgado-Vargas, F., A. R. Jimenez, and O. Paredes-Lopez, Critical Reviews in
Food Science and Nutrition, 2000. 40. p. 173-289. [16]. Wrolstad, R. E., Journal of Food Science, 2004. 69. p. C419-C421.
220
[17]. Fossen, T., R. Slimestad, D. O. Ovstedal, and O. M. Andersen, Biochemical Systematics and Ecology, 2002. 30. p. 855-864.
[18]. Mazza, G. and E. Miniati, Anthocyanins in fruits, vegetables and grains. CRC
Press, Inc, Boca Raton, FL.1993. [19]. Markham, K. R., K. S. Gould, C. S. Winefield, K. A. Mitchell, S. J. Bloor, and M.
R. Boase, Phytochemistry (Elsevier), 2000. 55. p. 327-336. [20]. Brouillard, R., Flavonoids and flower colour, in The flavonoids, advances in
research since 1980, J.B. Harborne, Editor. 1998, Chapman and Hall: London. p. 525.
[21]. Torskangerpoll, K. and O. M. Andersen, Food Chemistry, 2005. 89. p. 427-440. [22]. Prior, R. L., S. A. Lazarus, G. Cao, H. Muccitelli, and J. F. Hammerstone, Journal
of Agricultural and Food Chemistry, 2001. 49. p. 1270-1276. [23]. Zheng, W. and S. Y. Wang, Journal of Agricultural and Food Chemistry, 2003.
51. p. 502-509. [24]. Kahkonen, M. P., J. Heinamaki, V. Ollilainen, and M. Heinonen, Journal of the
Science of Food and Agriculture, 2003. 83. p. 1403-1411. [25]. Wu, X., L. Gu, R. L. Prior, and S. McKay, Journal of Agricultural and Food
Chemistry, 2004. 52. p. 7846-7856. [26]. Dawidowicz, A. L., D. Wianowski, and B. Baraniak, LWT - Food Science and
Technology, 2006. 39. p. 308-315. [27]. Mazza, G., L. Fukumoto, P. Delaquis, B. Girard, and B. Ewert, Journal of
Agricultural and Food Chemistry, 1999. 47. p. 4009-4017. [28]. Ortega-Regules, A., I. Romero-Cascales, J. M. Lopez-Roca, J. M. Ros-Garcia,
and E. Gomez-Plaza, Journal of the Science of Food and Agriculture, 2006. 86. p. 1460-1467.
[29]. Gao, L. and G. Mazza, Journal of Food Science, 1994. 59. p. 1057-1059. [30]. Ichiyanagi, T., Y. Hatano, S. Matsugo, and T. Konishi, Chemical and
Pharmaceutical Bulletin, 2004. 52. p. 628-630. [31]. Blando, F., C. Gerardi, and I. Nicoletti, Journal of Biomedicine and
Biotechnology, 2004. 5. p. 253-258.
221
[32]. Simunic, V., S. Kovac, D. Gaso-Sokac, W. Pfannhauser, and M. Murkovic, European Food Research and Technology, 2005. 220. p. 575-578.
[33]. Chandra, A., J. Rana, and Y. Li, Journal of Agricultural and Food Chemistry,
2001. 49. p. 3515-3521. [34]. Chaovanalikit, A. and R. E. Wrolstad, Journal of Food Science, 2004. 69. p.
FCT73-FCT83. [35]. Kim, D.-O., H. J. Heo, Y. J. Kim, H. S. Yang, and C. Y. Lee, Journal of
Agricultural and Food Chemistry, 2005. 53. p. 9921-9927. [36]. Gao, L. and G. Mazza, Journal of Agricultural and Food Chemistry, 1995. 43. p.
343-346. [37]. Torre, L. C. and B. H. Barritt, Journal of Food Science, 1977. 42. p. 488-490. [38]. Wada, L. and B. Ou, Journal of Agricultural and Food Chemistry, 2002. 50. p.
3495-3500. [39]. Longo, L. and G. Vasapollo, Food Chemistry, 2006. 94. p. 226-231. [40]. Phippen, W. B. and J. E. Simon, Journal of Agricultural and Food Chemistry,
1998. 46. p. 1734-1738. [41]. Lewis, C. E., J. R. L. Walker, J. E. Lancaster, and K. H. Sutton, Journal of the
Science of Food and Agriculture, 1998. 77. p. 45-57. [42]. Chirinos, R., D. Campos, I. Betalleluz, M. M. Giusti, S. J. Schwartz, Q. Tian, R.
Pedreschi, and Y. Larondelle, Journal of Agricultural and Food Chemistry, 2006. 54. p. 7089-7097.
[43]. Kammerer, D., R. Carle, and A. Schieber, European Food Research and
Technology, 2004. 219. p. 479-486. [44]. Nielsen, A. H., C. E. Olsen, and B. L. Moller, Phytochemistry, 2005. 66. p. 2829-
2835. [45]. Byamukama, R., M. Jordheim, B. Kiremire, J. Namukobe, and O. M. Andersen,
Scientia Horticulturae, 2006. 109. p. 262-266. [46]. de Ancos, B., E. Gonzalez, and M. P. Cano, Z Lebensm Unters Forsch A, 1999.
208. p. 33-38. [47]. Fan-Chiang, H.-J. and R. E. Wrolstad, Journal of Food Science, 2005. 70. p.
c198-c202.
222
[48]. Tomás-Barberán, F. A., M. I. Gil, P. Cremin, A. L. Waterhouse, B. Hess-Pierce,
and A. A. Kader, Journal of Agricultural and Food Chemistry, 2001. 49. p. 4748-4760.
[49]. Deineka, V. I., L. A. Deineka, and A. A. Sirotin, Chemistry of Natural
Compounds, 2005. 41. p. 230-231. [50]. Longo, L. and G. Vasapollo, Journal of Agricultural and Food Chemistry, 2005.
53. p. 8063-8067. [51]. Ahmed, J., U. S. Shivhare, and G. S. V. Raghavan, European Food Research and
Technology, 2004. 218. p. 525-528. [52]. Cabrita, L., T. Fossen, and O. M. Andersen, Food Chemistry, 2000. 68. p. 101-
107. [53]. Borkowski, T., H. Szymusiak, A. Gliszczynska-Swiglo, and B. Tyrakowska, Food
Research International, 2005. 38. p. 1031-1037. [54]. Fossen, T., L. Cabrita, and O. M. Andersen, Food Chemistry, 1998. 63. p. 435-
440. [55]. Abdel-Aal, E.-S. M. and P. Hucl, Journal of Agricultural and Food Chemistry,
2003. 51. p. 2174-2180. [56]. Connor, A. M., J. J. Luby, J. F. Hancock, S. Berkheimer, and E. J. Hanson,
Journal of Agricultural and Food Chemistry, 2002. 50. p. 893-898. [57]. Kirca, A., M. Ozkan, and B. Cemeroglu, Food Chemistry, 2007. 101. p. 212-218. [58]. Reyes, L. F. and L. Cisneros-Zevallos, Food Chemistry, 2007. 100. p. 885-894. [59]. Goodman, L. P. and P. Markakis, Journal of Food Science, 1965. 30. p. 135-137. [60]. McBean, D. M., A. A. Johnson, and J. I. Pitt, Journal of Food Science, 1964. 29.
p. 257-265. [61]. Oliveira, J., V. Fernandes, C. Miranda, C. Santos-Buelga, A. Silva, V. de Freitas,
and N. Mateus, Journal of Agricultural and Food Chemistry, 2006. 54. p. 6894-6903.
[62]. Kader, F., J.-P. Haluk, J. P. Nicolas, and M. Metche, Journal of Agricultural and
Food Chemistry, 1998. 46. p. 3060-3065.
223
[63]. Kader, F., M. Irmouli, J. P. Nicolas, and M. Metche, Food Chemistry, 2001. 75. p. 139-144.
[64]. Kader, F., M. Irmouli, J. P. Nicolas, and M. Metche, Journal of Food Science,
2002. 67. p. 910-915. [65]. Kader, F., M. Irmouli, N. Zitouni, J.-P. Nicolas, and M. Metche, Journal of
Agricultural and Food Chemistry, 1999. 47. p. 4625-4630. [66]. Wesche-Ebeling, P. and M. W. Montgomery, Journal of Food Science, 1990. 55.
p. 731-734. [67]. Garcia-Viguera, C. and P. Bridle, Food Chemistry, 1999. 64. p. 21-26. [68]. Mazza, G. and R. Brouillard, Phytochemistry, 1990. 29. p. 1097-1102. [69]. Brouillard, R., G. Mazza, Z. Saad, A. M. Albrecht-Gary, and A. Cheminat,
Journal of the American Chemical Society, 1989. 111. p. 2604-2610. [70]. Mistry, T. V., Y. Cai, T. H. Lilley, and E. Haslam, Journal of the Chemical
Society. Perkin Transaction 2, 1991. 8. p. 1287-1296. [71]. Gomez-Miguez, M., S. Gonzalez-Manzano, M. T. Escribano-Bailon, F. J.
Heredia, and C. Santos-Buelga, Journal of Agricultural and Food Chemistry, 2006. 54. p. 5422-5429.
[72]. Ellestad, G. A., Chirality, 2006. 18. p. 134-144. [73]. Takeda, K., Proceedings of the Japan Academy, Series B, 2006. 82. p. 142-154. [74]. Yoshida, K., S. Kitahara, D. Ito, and T. Kondo, Phytochemistry, 2006. 67. p. 992-
998. [75]. Bakowskia, A., A. Z. Kucharska, and J. Oszmianski, Food Chemistry, 2003. 81.
p. 349-355. [76]. Gradinaru, G., C. G. Biliaderis, S. Kallithraka, P. Kefalas, and C. Garcia-Viguera,
Food Chemistry, 2003. 83. p. 423-436. [77]. Hakansson, A. E., K. Pardon, Y. Hayasaka, M. de Sa, and M. Herderich,
Tetrahedron Letters, 2003. 44. p. 4887-4891. [78]. Burns, K. C. and J. L. Dalen, Oikos, 2002. 96. p. 463-469. [79]. Escribano-Bailón, M. T., C. Santos-Buelga, and J. C. Rivas-Gonzalo, Journal of
Chromatography A, 2004. 1054. p. 129-141.
224
[80]. Furuta, K., Journal of Applied Entomology, 1986. 102. p. 93-100. [81]. Page, J. E. and G. H. Towers, Planta, 2002. 215. p. 478-484. [82]. Gould, K. S., T. C. Vogelmann, T. Han, and M. J. Clearwater, Physiologia
Plantarum, 2002. 116. p. 127-133. [83]. Galvano, F., L. La Fauci, G. Lazzarino, V. Fogliano, A. Ritieni, S. Ciappellano,
N. C. Battistini, B. Tavazzi, and G. Galvano, Journal of Nutritional Biochemistry, 2004. 15. p. 2-11.
[84]. Kowalczyk, E., P. Krzesiński, M. Kura, B. Szmigiel, and J. Blaszczyk, Polish
Journal of Pharmacology, 2003. 55. p. 699-702. [85]. Arnous, A., D. P. Makris, and P. Kefalas, Journal of Agricultural and Food
Chemistry, 2001. 49. p. 5736-5742. [86]. Cai, Y.-Z., J. Xing, M. Sun, Z.-Q. Zhan, and H. Corke, Journal of Agricultural
and Food Chemistry, 2005. 53. p. 9940-9948. [87]. Degenhardt, A., H. Knapp, and P. Winterhalter, Journal of Agricultural and Food
Chemistry, 2000. 48. p. 338-343. [88]. Ichiyanagi, T., Y. Hatano, S. Matsugo, and T. Konishi, Reactivity of anthocyanin
toward reactive oxygen and reactive nitrogen species. Oxidative Stress and Disease. Vol. 21(Molecular Interventions in Lifestyle-Related Diseases). CRC Press LLC, Niigata, Japan.2006.
[89]. Juranic, Z. and Z. Zizak, BioFactors, 2005. 23. p. 207-211. [90]. Wang, H., G. Cao, and R. L. Prior, Journal of Agricultural and Food Chemistry,
1997. 45. p. 304-309. [91]. Wang, H., M. G. Nair, and G. M. Strasburg, Journal of Natural Products, 1999.
62. p. 294-296. [92]. Matsumoto, H., Y. Nakamura, S. Tachibanaki, S. Kawamura, and M. Hirayama,
Journal of Agricultural and Food Chemistry, 2003. 51. p. 3560-3563. [93]. Folts, J., Pharmaceutical Biology, 1998. 36. p. 21-27. [94]. Christian, K. R., M. G. Nair, and J. C. Jackson, Journal of Food Composition and
Analysis, 2006. 19. p. 778-783.
225
[95]. Tsuda, T., F. Horio, K. Uchida, H. Aoki, and T. Osawa, Journal of Nutrition, 2003. 133. p. 2125-2130.
[96]. Hou, D.-X., M. Fujii, N. Terahara, and M. Yoshimoto, Journal of Biomedicine
and Biotechnology, 2004. 5. p. 321-325. [97]. Hou, D.-X., T. Ose, and S. Lin, International Journal of Oncology, 2003. 23. p.
705-712. [98]. Katsube, N., K. Iwashita, T. Tsushida, K. Yamaki, and M. Kobori, Journal of
Agricultural and Food Chemistry, 2003. 51. p. 68-75. [99]. Hou, D.-X., K. Kai, and J. J. Li, Carcinogenesis, 2004. 25. p. 29-36. [100]. Springob, K., J.-i. Nakajima, M. Yamazaki, and K. Saito, Natural Product Report,
2003. 20. p. 288-303. [101]. Holton, T. A. and E. C. Cornish, Plant Cell, 1995. 7. p. 1071-1083. [102]. Nakajima, J.-i., Y. Tanaka, M. Yamazaki, and K. Saito, The Journal of Biological
Chemistry, 2001. 276. p. 25797-25803. [103]. Nakajima, J.-i., Y. Sato, T. Hoshino, M. Yamazaki, and K. Saito, The Journal of
Biological Chemistry, 2006. 281. p. 21387-21398. [104]. Saito, K. and M. Yamazaki, New Phytologist, 2002. 155. p. 9-23. [105]. Ogata, J., Y. Kanno, Y. Itoh, H. Tsugawa, and M. Suzuki, Nature, 2005. 435. p.
757-758. [106]. Nakayama, T., H. Suzuki, and T. Nishino, Journal of Molecular Catalysis B:
Enzymatic, 2003. 23. p. 117-132. [107]. Hopp, W. and H. U. Seitz, Planta, 1987. 170. p. 74-85. [108]. Debeaujon, I., A. J. M. Peeters, K. M. Leon-Kloosteriziel, and M. Koornneef,
Plant Cell, 2001. 13. p. 853-871. [109]. Klein, M., E. Martinoia, G. Hoffmann-Thoma, and G. Weissenbock, The Plant
Journal, 2000. 21. p. 289-304. [110]. Marrs, K. A., M. R. Alfenito, A. M. Lloyd, and V. Walbot, Nature, 1995. 375. p.
397-400. [111]. Mueller, L. A., C. D. Goodman, R. A. Silady, and V. Walbot, Plant Physiology,
2000. 123. p. 1561-1570.
226
[112]. Xu, W., H. Shiori, M. Kojima, and M. Nozue, Plant Physiology, 2001. 125. p.
447. [113]. Manach, C., G. Williamson, C. Morand, A. Scalbert, and C. Remesy, American
Journal of Clinical Nutrition, 2005. 81. p. 230S-242S. [114]. Felgines, C., S. Talavera, O. Texier, A. Gil-Izquierdo, J.-L. Lamaison, and C.
Remesy, Journal of Agricultural and Food Chemistry, 2005. 53. p. 7721-7727. [115]. Felgines, C., S. Talavera, M. P. Gonthier, O. Texier, A. Scalbert, J.-L. Lamaison,
and C. Remesy, Journal of Nutrition, 2003. 133. p. 1296-1301. [116]. Keppler, K. and H.-U. Humpf, Bioorganic and Medicinal Chemistry, 2005. 13. p.
5195-5205. [117]. Fleschhut, J., F. Kratzer, G. Rechkemmer, and S. E. Kulling, European Journal of
Nutrition, 2006. 45. p. 7-18. [118]. Santos-Buelga, C. and G. Williamson, Methods in polyphenol analysis. The Royal
Society of Chemistry, Cambridge, UK.2003. [119]. Andersen, O. M. and K. R. Markham, Flavonoids: chemistry, biochemistry and
applications. CRC Press, Boca Raton, FL.2006. [120]. Calvo, D., R. Saenz-Lopez, P. Fernandez-Zurbano, and M. T. Tena, Analytica
Chimica Acta, 2004. 524. p. 207-213. [121]. Mazza, G., J. E. Cacace, and C. D. Kay, Food Composition and Additives, 2004.
87. p. 129-145. [122]. Saenz-Lopez, R., P. Fernandez-Zurbano, and M. T. Tena, Journal of
Chromatography A, 2003. 990. p. 247-258. [123]. Saenz-Lopez, R., P. Fernandez-Zurbano, and M. T. Tena, Journal of
Chromatography A, 2004. 1052. p. 191-197. [124]. da Costa, C. T., D. Horton, and S. A. Margolis, Journal of Chromatography A,
2000. 881. p. 403-410. [125]. Bicard, V., A. Fougerousse, and R. Brouillard, Journal of Liquid
Chromatography & Related Technologies, 1999. 22. p. 541-550. [126]. Bednar, P., A. V. Tomassi, C. Presutti, M. Pavlikova, K. Lemr, and S. Fanali,
Chromatographia, 2003. 58. p. 283-287.
227
[127]. Simo, C., C. Barbas, and A. Cifuentes, Electrophoresis, 2005. 26. p. 1306-1318. [128]. Smyth, W. F., Electrophoresis, 2005. 26. p. 1334-1357. [129]. Bednar, P., B. Papouskova, L. Muller, P. Bartak, J. Stavek, P. Pavlousek, and K.
Lemr, Journal of Separation Science, 2005. 28. p. 1291-1299. [130]. de Villiers, A., G. Vanhoenacker, P. Majek, and P. Sandra, Journal of
Chromatography A, 2004. 1054. p. 195-204. [131]. Harborne, J. B., Biochemical Journal, 1958. 70. p. 22-28. [132]. Hong, V. and R. E. Wrolstad, Journal of Agricultural and Food Chemistry, 1990.
38. p. 708-715. [133]. Vrhovsek, U., A. Rigo, D. Tonon, and F. Mattivi, Journal of Agricultural and
Food Chemistry, 2004. 52. p. 6532-6538. [134]. Schutz, K., M. Persike, R. Carle, and A. Schieber, Analytical and Bioanalytical
Chemistry, 2006. 384. p. 1511-1517. [135]. Cooke, D. N., S. Thomasset, D. J. Boocock, M. Schwarz, P. Winterhalter, and W.
P. Steward, Journal of Agricultural and Food Chemistry, 2006. 54. [136]. Nakajima, J.-i., I. Tanaka, S. Seo, M. Yamazaki, and K. Saito, Journal of
Biomedicine and Biotechnology, 2004. 5. p. 241-247. [137]. Tian, Q., M. M. Giusti, G. D. Stoner, and S. J. Schwartz, Journal of
Chromatography A, 2005. 1091. p. 72-82. [138]. Anttonen, M. J. and R. O. Karjalainen, Journal of Agricultural and Food
Chemistry, 2006. 54. p. 7530-7538. [139]. Hu, C., J. Zawistowski, W. Ling, and D. D. Kitts, Journal of Agricultural and
Food Chemistry, 2003. 51. p. 5271-5277. [140]. Cooney, J. M., D. J. Jensen, and T. K. McGhie, Journal of the Science of Food
and Agriculture, 2004. 84. p. 237-245. [141]. McGhie, T. K., G. D. Ainge, L. E. Barnett, J. M. Cooney, and D. J. Jensen,
Journal of Agricultural and Food Chemistry, 2003. 51. p. 4539-4548. [142]. Zanatta, C. F., E. Cuevas, F. O. Bobbio, P. Winterhalter, and A. Z. Mercadante,
Journal of Agricultural and Food Chemistry, 2005. 53. p. 9531-9535.
228
[143]. Seeram, N. P., R. H. Cichewicz, A. Chandra, and M. G. Nair, Journal of Agricultural and Food Chemistry, 2003. 51. p. 1948-1951.
[144]. Seeram, N. P., L. S. Adams, M. L. Hardy, and D. Heber, Journal of Agricultural
and Food Chemistry, 2004. 52. p. 2512-2517. [145]. Di Paola-Naranjo, R. D., J. Sanchez-Sanchez, A. M. Gonzalez-Paramas, and J. C.
Rivas-Gonzalo, Journal of Chromatography A, 2004. 1054. p. 205-210. [146]. Kazuma, K., N. Noda, and M. Suzuki, Phytochemistry (Elsevier), 2003. 64. p.
1133-1139. [147]. Kazuma, K., N. Noda, and M. Suzuki, Phytochemistry (Elsevier), 2003. 62. p.
229-237. [148]. Escribano-Bailon, M. T., C. Santos-Buelga, G. L. Alonso, and M. R. Salinas,
Phytochemical Analysis, 2002. 13. p. 354-357. [149]. Es-Safi, N.-E., V. Cheynier, and M. Moutounet, Journal of Agricultural and Food
Chemistry, 2002. 50. p. 5571-5585. [150]. Ali, A. and J. Strommer, Journal of Agricultural and Food Chemistry, 2003. 51.
p. 7246-7251. [151]. Pomar, F., M. Novo, and A. Masa, Journal of Chromatography A, 2005. 1094. p.
34-41. [152]. Vidal, S., E. Meudec, V. Cheynier, G. Skouroumounis, and Y. Hayasaka, Journal
of Agricultural and Food Chemistry, 2004. 52. p. 7144-7151. [153]. Cantos, E., J. C. Espin, and F. A. Tomás-Barberán, Journal of Agricultural and
Food Chemistry, 2002. 50. p. 5691-5696. [154]. Cantos, E., C. Garcia-Viguera, S. de Pascual-Teresa, and F. A. Tomás-Barberán,
Journal of Agricultural and Food Chemistry, 2000. 48. p. 4606-4612. [155]. Lee, J., C. E. Finn, and R. E. Wrolstad, Journal of Agricultural and Food
Chemistry, 2004. 52. p. 7039-7044. [156]. Alcalde-Eon, C., G. Saavedra, S. de Pascual-Teresa, and J. C. Rivas-Gonzalo,
Journal of Chromatography A, 2004. 1054. p. 211-215. [157]. Choung, M.-G., B. R. Choi, Y.-N. An, Y.-H. Chu, and Y.-S. Cho, Journal of
Agricultural and Food Chemistry, 2003. 51. p. 7040-7043.
229
[158]. Montoro, P., C. I. G. Tuberoso, A. Perrone, S. Piacenta, P. Cabras, and C. Pizza, Journal of Chromatography A, 2006. 1112. p. 232-240.
[159]. Alcalde-Eon, C., G. Saavedra, S. de Pascual-Teresa, and J. C. Rivas-Gonzalo,
Food Chemistry, 2004. 86. p. 441-448. [160]. Pissarra, J., S. Lourenco, A. M. Gonzalez-Paramas, N. Mateus, C. Santos-Buelga,
and V. de Freitas, Analytica Chimica Acta, 2004. 513. p. 215-221. [161]. Pissarra, J., N. Mateus, J. C. Rivas-Gonzalo, C. Santos-Buelga, and V. de Freitas,
Journal of Food Science, 2003. 68. p. 476-481. [162]. Mateus, N., S. de Pascual-Teresa, J. C. Rivas-Gonzalo, C. Santos-Buelga, and V.
de Freitas, Food Chemistry, 2002. 76. p. 335-342. [163]. Stobiecki, M., I. Matysiak-Kata, R. Franski, J. Skala, and J. Szopa,
Phytochemistry (Elsevier), 2003. 62. p. 959-969. [164]. de Pascual-Teresa, S., C. Santos-Buelga, and J. C. Rivas-Gonzalo, Journal of the
Science of Food and Agriculture, 2002. 82. p. 1003-1006. [165]. Fossen, T. and O. M. Andersen, Phytochemistry (Elsevier), 2003. 62. p. 1217-
1220. [166]. Fossen, T., R. Slimestad, and O. M. Andersen, Phytochemistry (Elsevier), 2003.
64. p. 1367-1374. [167]. Vivar-Quintana, A. M., C. Santos-Buelga, and J. C. Rivas-Gonzalo, Analytica
Chimica Acta, 2002. 458. p. 147-155. [168]. Kosir, I. J., B. Lapornik, S. Andrensek, A. G. Wondra, U. Vrhovsek, and J.
Kidric, Analytica Chimica Acta, 2004. 513. p. 277-282. [169]. Pati, S., I. Losito, G. Gambacorta, E. La Notte, F. Palmisano, and P. G.
Zambonin, Journal of Mass Spectrometry, 2006. 41. p. 861-871. [170]. Dugo, P., O. Favoino, M. Lo Presti, R. Luppino, G. Dugo, and L. Mondello,
Journal of Separation Science, 2004. 27. p. 1458-1466. [171]. Makris, D. P., S. Kallithraka, and A. Mamalos, Talanta, 2006. 70. p. 1143-1152. [172]. Remy, S., H. Fulcrand, B. Labarbe, V. Cheynier, and M. Moutounet, Journal of
the Science of Food and Agriculture, 2000. 80. p. 745-751. [173]. Revilla, I., S. Perez-Magarino, M. L. Gonzalez-SanJose, and S. Beltran, Journal
of Chromatography A, 1999. 847. p. 83-90.
230
[174]. Pozo-Bayon, M. A., M. Monagas, M. C. Polo, and C. Gomez-Cordoves, Journal
of Agricultural and Food Chemistry, 2004. 52. p. 1300-1306. [175]. Shoji, T., Y. Goda, M. Toyoda, A. Yanagida, and T. Kanda, Phytochemistry
(Elsevier), 2002. 59. p. 183-189. [176]. Hvattum, E., Rapid Communications in Mass Spectrometry, 2002. 16. p. 655-662. [177]. Lopes-da-Silva, F., S. de Pascual-Teresa, J. C. Rivas-Gonzalo, and C. Santos-
Buelga, European Food Research and Technology, 2002. 214. p. 248-253. [178]. Flamini, R., Mass Spectrometry Reviews, 2003. 22. p. 213-250. [179]. Baldi, A., A. Romani, N. Mulinacci, F. F. Vincieri, and B. Casetta, Journal of
Agricultural and Food Chemistry, 1995. 43. p. 2104-2109. [180]. Johnstone, R. A. W. and M. E. Rose, Mass spectrometry for chemists and
biochemists. 2nd ed. University Press, Cambridge, UK.1996. [181]. de Rijke, E., H. Zappey, F. Ariese, C. Gooijer, and U. A. T. Brinkman, Journal of
Chromatography A, 2003. 984. p. 45-58. [182]. Mazza, G. and J. E. Cacace, Journal of Food Science, 2003. 68. p. 240-248. [183]. Revilla, E., J.-M. Ryan, and G. Martin-Ortega, Journal of Agricultural and Food
Chemistry, 1998. 46. p. 4592-4597. [184]. Garcia-Viguera, C., P. Zafrilla, and F. A. Tomás-Barberán, Phytochemical
Analysis, 1998. 9. p. 274-277. [185]. Giusti, M. M., L. E. Rodriguez-Saona, J. R. Baggett, G. L. Reed, R. W. Durst, and
R. E. Wrolstad, Journal of Food Science, 1998. 63. p. 219-224. [186]. Kraemer-Schafhalter, A., H. Fuchs, and W. Pfannhauser, Journal of the Science of
Food and Agriculture, 1998. 78. p. 435-440. [187]. Liu, Z., G. Xiao, W. Chen, Y. Xu, and J. Wu, Journal of Biomedicine and
Biotechnology, 2004. 5. p. 326-331. [188]. Giusti, M. M. and R. E. Wrolstad, Journal of Food Science, 1996. 61. p. 322-326. [189]. Byamukama, R., B. Kiremire, O. M. Andersen, and A. Steigen, Journal of Food
Composition and Analysis, 2005. 18. p. 599-605.
231
[190]. Pale, E., M. Nacro, M. Vanhaelen, and R. Vanhaelen-Fastre, Journal of Agricultural and Food Chemistry, 1997. 45. p. 3359-3361.
[191]. Sun, B., M. C. Leandro, V. de Freitas, and M. I. Spranger, Journal of
Chromatography A, 2006. 1128. p. 27-38. [192]. Schwarz, M., S. Hillebrand, S. Habben, A. Degenhardt, and P. Winterhalter,
Biochemical Engineering Journal, 2003. 14. p. 179-189. [193]. Du, Q., G. Jerz, and P. Winterhalter, Journal of Chromatography A, 2004. 1045.
p. 59-63. [194]. Degenhardt, A., S. Hofmann, H. Knapp, and P. Winterhalter, Journal of
Agricultural and Food Chemistry, 2000. 48. p. 5812-5818. [195]. Vidal, S., Y. Hayasaka, E. Meudec, V. Cheynier, and G. Skouroumounis, Journal
of Agricultural and Food Chemistry, 2004. 52. p. 713-719. [196]. Degenhardt, A., M. Schwarz, P. Winterhalter, and Y. Ito, Journal of
Chromatography A, 2001. 922. p. 355-358.
232
Chemistry, Quality and Functional Properties of Grains of Paradise (Aframomum melegueta), A Rediscovered Spice.
H. Rodolfo Juliani1, Cara Welch1, Juliana Asante-Dartey2, Dan Acquaye2, Mingfu Wang1, James E. Simon1
1 New Use Agriculture and Natural Plant Products Program. Cook College, Rutgers and the New Jersey Agricultural Experimental Station (NJAES), The State University of New Jersey - 59 Dudley
Rd, New Brunswick, NJ 08901-8520, USA. 2 Agribusiness in Sustainable Natural African Plant Products Accra, Ghana.
This study evaluates the variation of quality, essential oil and polyphenol profile and antioxidant activity of Grains of Paradise (Aframomum melegueta (Roscol) K.Schum) from Ghana and reviews the pharmacological properties of this species. This work has shown the potential of Grains of Paradise, a forgotten spice to provide the western world with new flavors and taste, as it contains higher levels of pungent principles ([6]-gingerol) than ginger and offers a distinct flavor and aroma and functional properties.
Zingiberaceae is the largest family of the Order Zingiberales and is found through the tropics This family, predominantly Asian, with 40 genera and ca. 900 species has provided economically important species which have established themselves as aromatic spices. The genus Zingiber (ginger), Curcuma (turmeric), Alpinia (galanga) and Kaempferia all represent rhizomatous spices, while the “cardamoms” include seed spices of the genus Elettaria (small cardamom), Amomum and Aframomum are known as large cardamoms (1). The genus Aframomum includes 50 species that are restricted to tropical Africa. The seeds of A. melegueta (Roscol) K.Schum are known as the grains of paradise, melegueta pepper or guinea peppers.
Spices are not only valuable to add flavor to foods, but their functional properties have been recognized since ancient times (2,3). Some spices including ginger were used as food preservatives (4), herbal medicines to cure urinary complaints, piles, jaundice, to increase flow of saliva and aid digestion (3).
In western Africa, grains of paradise have been extensively used as condiments (5,6), but also in popular medicine for the treatment of coughs, bronchitis, rheumatitis, digestive complaints (7), as aphrodisiac and antiparasitic (6).
Five centuries ago grains of paradise was very popular in Europe as a substitute of true pepper (3,8) though today, it is almost unknown in the modern western world. The global spice trade is expected to increase with the growing consumer demand in importing countries for more exotic, ethnic tastes in food (2), and this tendency will create new commercial opportunities for the developing world.
Although the essential oil and phenolic composition in A. melegueta has been studied, the variability of their components and quality aspects are less understood. Such lack of scientific information on the chemical composition, quality parameters and functional properties of natural products, may limit the access to markets (9,10,11). Thus, by providing users and the international community with consistent and defined products new commercial opportunities for local communities can be developed and a wider range of consumers could enjoy and gain access to this old yet “new spice”.
In view of the commercial potential of grains of paradise, this study evaluates the variation of quality, essential oil and polyphenol profile and antioxidant activity of A. melegueta from Ghana and reviews the pharmacological properties of this species.
233
Material and Methods
Plant material.
As part of our quality control program on African natural products, we conducted quality control and chemical analyses of grains of paradise from Akante (Ghana). The sun dried seed were received from 2003 to 2005 (samples 2003, 2004 and 2005a-b). The 2003 sample was grounded and separated in the seed coat (known as chaffs) and the whitish endosperm (plus the embryo). A commercial sample of ginger rhizome (New Jersey, local store) was included for comparison purposes. Each procedure was run at least in duplicate.
Quality Control Analysis
Moisture, total ashes, total insoluble ashes and essential oil content were assessed for each sample using methods described by the Food Chemical Codex (12).
Chemical and Antioxidant Activity Analysis
The ground seeds (200 mg) were extracted with 25 mL of methanol through sonication for one hour and subjected to HPLC, total phenol content, and antioxidant activity analyses. Two commercial ginger samples (1.0 g of fresh ginger) was also extracted with 25 mL of methanol and sonicated for one hour as a comparison and the dry weight was factored in at the time of calculations. The total phenols were measured using the Folin Ciocalteu’s reagent (13) and the results were expressed as a percent of gallic acid equivalents on a dry weight basis (m/m). The antioxidant activity was evaluated using the ABTS method3 (14) and the results were expressed as a percent of Trolox (a water soluble analog of vitamin E) on a dry weight basis (m/m).
Quantitative HPLC Analysis.
The analysis was performed on a Waters 2695 separations module with photodiode array detector. The HPLC was run on a Phenomenex Luna C18 column (5 µm, 250 x 4.6 mm) and the detection wavelength was 282 nm, the injection volume was 20 µL and flow rate was 1.0mL/min. The mobile phase was water (solvent A) and acetonitrile (solvent B) in the following gradient system: 0 min (55% A and 45% B), 8 min (50% A and 50% B), 15 min (45% A and 55% B), 40 min (10% A and 90% B), 45 min (55% A and 45% B), 55 min (55% A and 45% B). The total running time was 55 minutes with no post running time. Dihydrocapsaicin was used for the quantification of [6]-gingerol and the results were expressed as a percent of 6-gingerol on a dry weight basis (m/m). [6]-Gingerol was tentatively analyzed by HPLC-MS by comparing the UV and MS spectra with the reference standards and by their [M+1] and [M+Na]+ ions.
Essential Oil Analysis.
The essential oils were analyzed by a gas chromatograph (GC) coupled to a mass spectrometer (MS) (Agilent GC System 6890 Series, Mass Selective Detector, Agilent 5973 Network, FID detector) (15).
Results and Discussion
Quality Standards
The grains of paradise is a small seed (around 2mm), the testa is brown or brown-reddish and the endosperm is white. The aroma is spicy and woody and the taste is sharp and pungent (Table I). Most of the
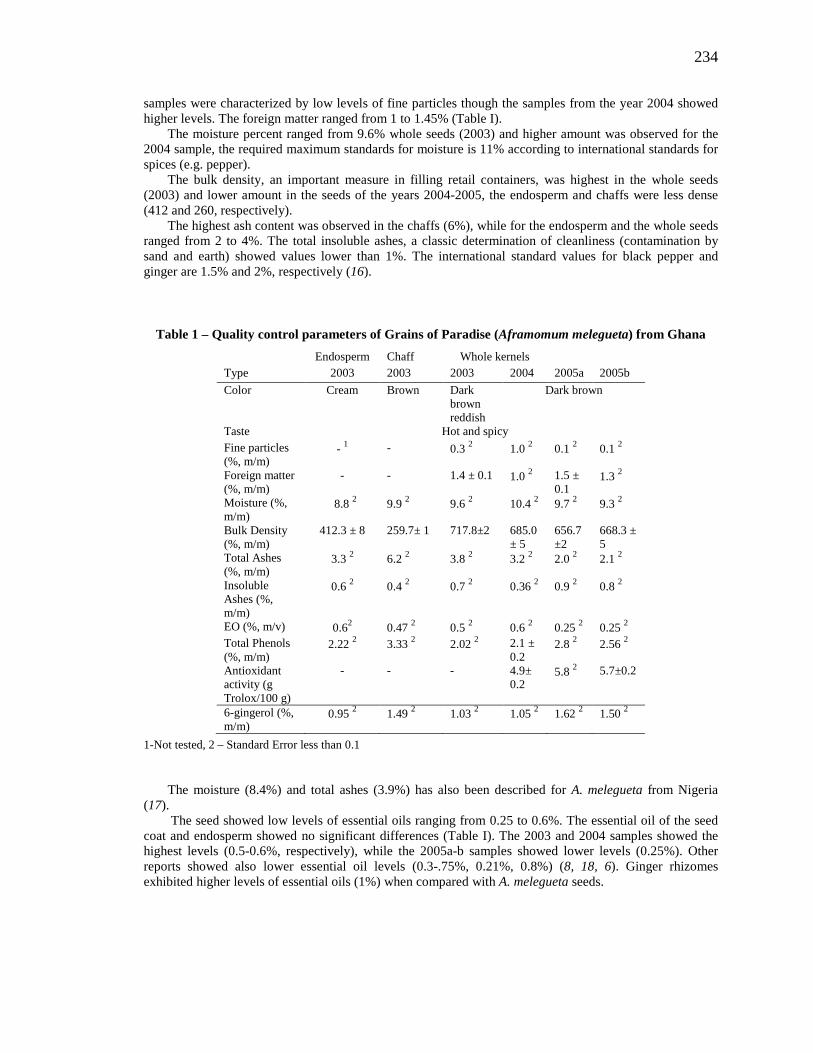
234
samples were characterized by low levels of fine particles though the samples from the year 2004 showed higher levels. The foreign matter ranged from 1 to 1.45% (Table I).
The moisture percent ranged from 9.6% whole seeds (2003) and higher amount was observed for the 2004 sample, the required maximum standards for moisture is 11% according to international standards for spices (e.g. pepper).
The bulk density, an important measure in filling retail containers, was highest in the whole seeds (2003) and lower amount in the seeds of the years 2004-2005, the endosperm and chaffs were less dense (412 and 260, respectively).
The highest ash content was observed in the chaffs (6%), while for the endosperm and the whole seeds ranged from 2 to 4%. The total insoluble ashes, a classic determination of cleanliness (contamination by sand and earth) showed values lower than 1%. The international standard values for black pepper and ginger are 1.5% and 2%, respectively (16).
Table 1 – Quality control parameters of Grains of Paradise (Aframomum melegueta) from Ghana Endosperm Chaff Whole kernels Type 2003 2003 2003 2004 2005a 2005b Color Cream Brown Dark
brown reddish
Dark brown
Taste Hot and spicy Fine particles (%, m/m)
- 1 - 0.3 2 1.0 2 0.1 2 0.1 2
Foreign matter (%, m/m)
- - 1.4 ± 0.1 1.0 2 1.5 ± 0.1
1.3 2
Moisture (%, m/m)
8.8 2 9.9 2 9.6 2 10.4 2 9.7 2 9.3 2
Bulk Density (%, m/m)
412.3 ± 8 259.7± 1 717.8±2 685.0 ± 5
656.7±2
668.3 ± 5
Total Ashes (%, m/m)
3.3 2 6.2 2 3.8 2 3.2 2 2.0 2 2.1 2
Insoluble Ashes (%, m/m)
0.6 2 0.4 2 0.7 2 0.36 2 0.9 2 0.8 2
EO (%, m/v) 0.62 0.47 2 0.5 2 0.6 2 0.25 2 0.25 2 Total Phenols (%, m/m)
2.22 2 3.33 2 2.02 2 2.1 ± 0.2
2.8 2 2.56 2
Antioxidant activity (g Trolox/100 g)
- - - 4.9± 0.2
5.8 2 5.7±0.2
6-gingerol (%, m/m)
0.95 2 1.49 2 1.03 2 1.05 2 1.62 2 1.50 2
1-Not tested, 2 – Standard Error less than 0.1 The moisture (8.4%) and total ashes (3.9%) has also been described for A. melegueta from Nigeria
(17). The seed showed low levels of essential oils ranging from 0.25 to 0.6%. The essential oil of the seed
coat and endosperm showed no significant differences (Table I). The 2003 and 2004 samples showed the highest levels (0.5-0.6%, respectively), while the 2005a-b samples showed lower levels (0.25%). Other reports showed also lower essential oil levels (0.3-.75%, 0.21%, 0.8%) (8, 18, 6). Ginger rhizomes exhibited higher levels of essential oils (1%) when compared with A. melegueta seeds.
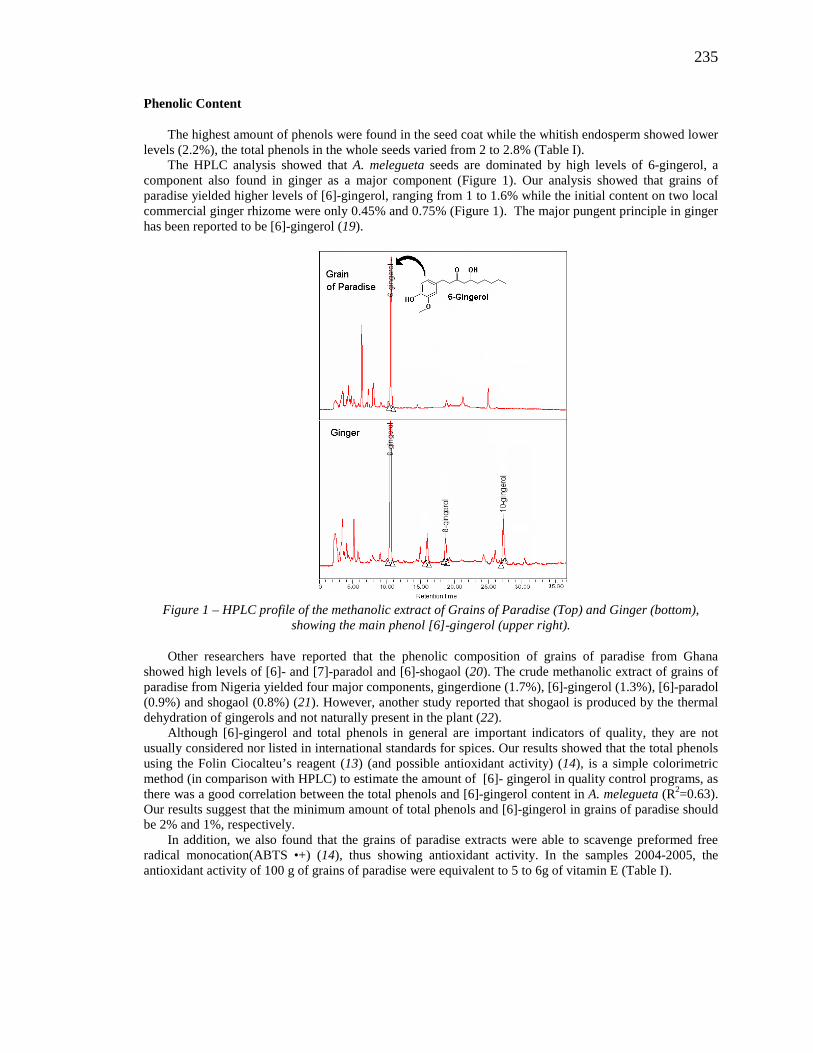
235
Phenolic Content
The highest amount of phenols were found in the seed coat while the whitish endosperm showed lower levels (2.2%), the total phenols in the whole seeds varied from 2 to 2.8% (Table I).
The HPLC analysis showed that A. melegueta seeds are dominated by high levels of 6-gingerol, a component also found in ginger as a major component (Figure 1). Our analysis showed that grains of paradise yielded higher levels of [6]-gingerol, ranging from 1 to 1.6% while the initial content on two local commercial ginger rhizome were only 0.45% and 0.75% (Figure 1). The major pungent principle in ginger has been reported to be [6]-gingerol (19).
Figure 1 – HPLC profile of the methanolic extract of Grains of Paradise (Top) and Ginger (bottom),
showing the main phenol [6]-gingerol (upper right).
Other researchers have reported that the phenolic composition of grains of paradise from Ghana showed high levels of [6]- and [7]-paradol and [6]-shogaol (20). The crude methanolic extract of grains of paradise from Nigeria yielded four major components, gingerdione (1.7%), [6]-gingerol (1.3%), [6]-paradol (0.9%) and shogaol (0.8%) (21). However, another study reported that shogaol is produced by the thermal dehydration of gingerols and not naturally present in the plant (22).
Although [6]-gingerol and total phenols in general are important indicators of quality, they are not usually considered nor listed in international standards for spices. Our results showed that the total phenols using the Folin Ciocalteu’s reagent (13) (and possible antioxidant activity) (14), is a simple colorimetric method (in comparison with HPLC) to estimate the amount of [6]- gingerol in quality control programs, as there was a good correlation between the total phenols and [6]-gingerol content in A. melegueta (R2=0.63). Our results suggest that the minimum amount of total phenols and [6]-gingerol in grains of paradise should be 2% and 1%, respectively.
In addition, we also found that the grains of paradise extracts were able to scavenge preformed free radical monocation(ABTS •+) (14), thus showing antioxidant activity. In the samples 2004-2005, the antioxidant activity of 100 g of grains of paradise were equivalent to 5 to 6g of vitamin E (Table I).
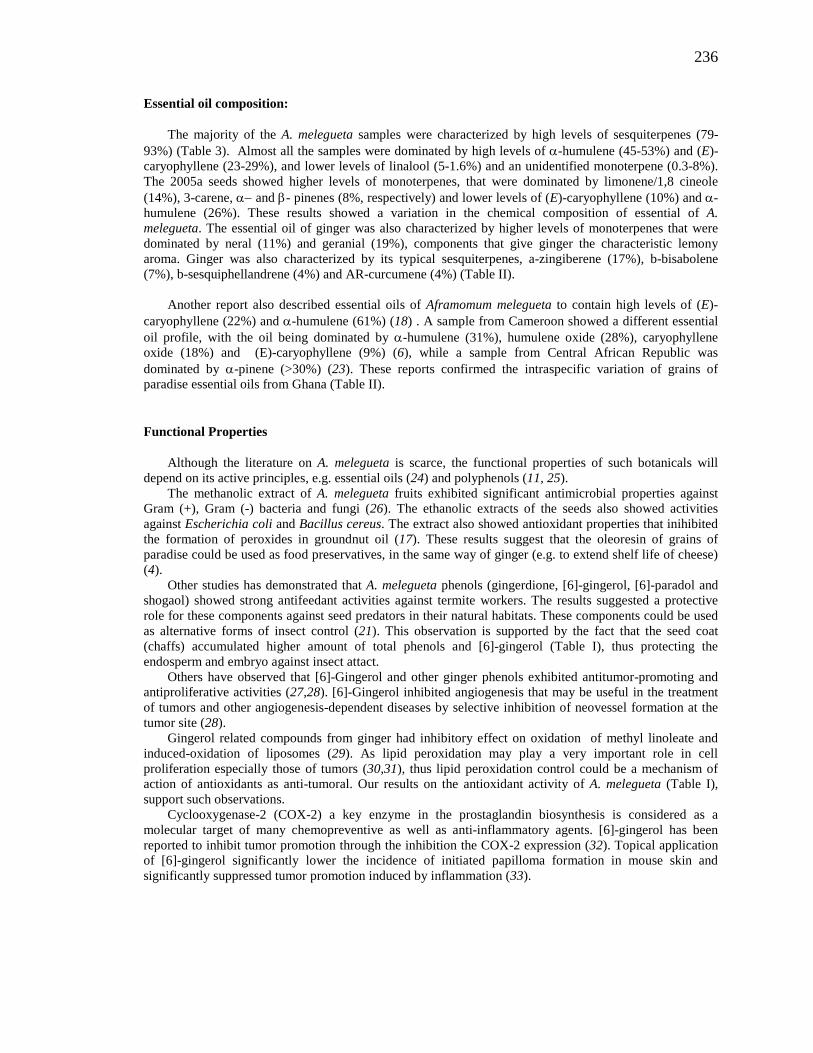
236
Essential oil composition:
The majority of the A. melegueta samples were characterized by high levels of sesquiterpenes (79-93%) (Table 3). Almost all the samples were dominated by high levels of α-humulene (45-53%) and (E)-caryophyllene (23-29%), and lower levels of linalool (5-1.6%) and an unidentified monoterpene (0.3-8%). The 2005a seeds showed higher levels of monoterpenes, that were dominated by limonene/1,8 cineole (14%), 3-carene, α− and β- pinenes (8%, respectively) and lower levels of (E)-caryophyllene (10%) and α-humulene (26%). These results showed a variation in the chemical composition of essential of A. melegueta. The essential oil of ginger was also characterized by higher levels of monoterpenes that were dominated by neral (11%) and geranial (19%), components that give ginger the characteristic lemony aroma. Ginger was also characterized by its typical sesquiterpenes, a-zingiberene (17%), b-bisabolene (7%), b-sesquiphellandrene (4%) and AR-curcumene (4%) (Table II).
Another report also described essential oils of Aframomum melegueta to contain high levels of (E)-
caryophyllene (22%) and α-humulene (61%) (18) . A sample from Cameroon showed a different essential oil profile, with the oil being dominated by α-humulene (31%), humulene oxide (28%), caryophyllene oxide (18%) and (E)-caryophyllene (9%) (6), while a sample from Central African Republic was dominated by α-pinene (>30%) (23). These reports confirmed the intraspecific variation of grains of paradise essential oils from Ghana (Table II).
Functional Properties
Although the literature on A. melegueta is scarce, the functional properties of such botanicals will depend on its active principles, e.g. essential oils (24) and polyphenols (11, 25).
The methanolic extract of A. melegueta fruits exhibited significant antimicrobial properties against Gram (+), Gram (-) bacteria and fungi (26). The ethanolic extracts of the seeds also showed activities against Escherichia coli and Bacillus cereus. The extract also showed antioxidant properties that inihibited the formation of peroxides in groundnut oil (17). These results suggest that the oleoresin of grains of paradise could be used as food preservatives, in the same way of ginger (e.g. to extend shelf life of cheese) (4).
Other studies has demonstrated that A. melegueta phenols (gingerdione, [6]-gingerol, [6]-paradol and shogaol) showed strong antifeedant activities against termite workers. The results suggested a protective role for these components against seed predators in their natural habitats. These components could be used as alternative forms of insect control (21). This observation is supported by the fact that the seed coat (chaffs) accumulated higher amount of total phenols and [6]-gingerol (Table I), thus protecting the endosperm and embryo against insect attact.
Others have observed that [6]-Gingerol and other ginger phenols exhibited antitumor-promoting and antiproliferative activities (27,28). [6]-Gingerol inhibited angiogenesis that may be useful in the treatment of tumors and other angiogenesis-dependent diseases by selective inhibition of neovessel formation at the tumor site (28).
Gingerol related compounds from ginger had inhibitory effect on oxidation of methyl linoleate and induced-oxidation of liposomes (29). As lipid peroxidation may play a very important role in cell proliferation especially those of tumors (30,31), thus lipid peroxidation control could be a mechanism of action of antioxidants as anti-tumoral. Our results on the antioxidant activity of A. melegueta (Table I), support such observations.
Cyclooxygenase-2 (COX-2) a key enzyme in the prostaglandin biosynthesis is considered as a molecular target of many chemopreventive as well as anti-inflammatory agents. [6]-gingerol has been reported to inhibit tumor promotion through the inhibition the COX-2 expression (32). Topical application of [6]-gingerol significantly lower the incidence of initiated papilloma formation in mouse skin and significantly suppressed tumor promotion induced by inflammation (33).
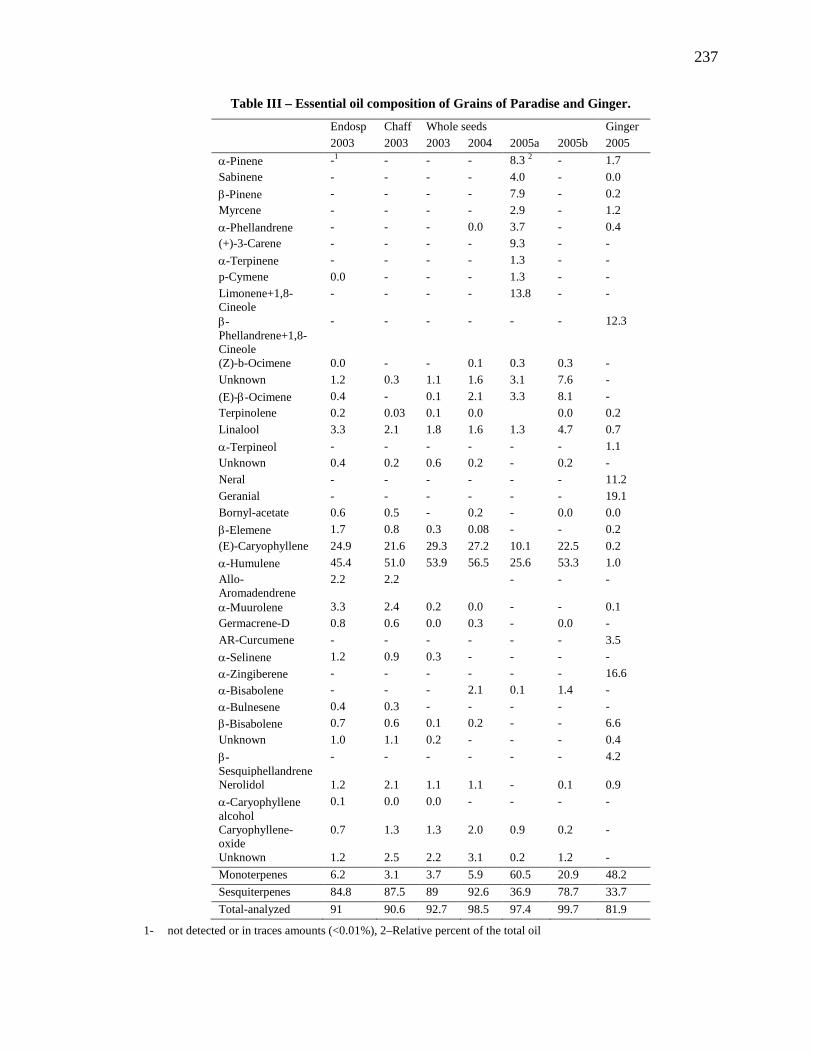
237
Table III – Essential oil composition of Grains of Paradise and Ginger.
Endosp Chaff Whole seeds Ginger 2003 2003 2003 2004 2005a 2005b 2005 α-Pinene -1 - - - 8.3 2 - 1.7 Sabinene - - - - 4.0 - 0.0 β-Pinene - - - - 7.9 - 0.2 Myrcene - - - - 2.9 - 1.2 α-Phellandrene - - - 0.0 3.7 - 0.4 (+)-3-Carene - - - - 9.3 - - α-Terpinene - - - - 1.3 - - p-Cymene 0.0 - - - 1.3 - - Limonene+1,8-Cineole
- - - - 13.8 - -
β-Phellandrene+1,8-Cineole
- - - - - - 12.3
(Z)-b-Ocimene 0.0 - - 0.1 0.3 0.3 - Unknown 1.2 0.3 1.1 1.6 3.1 7.6 - (E)-β-Ocimene 0.4 - 0.1 2.1 3.3 8.1 - Terpinolene 0.2 0.03 0.1 0.0 0.0 0.2 Linalool 3.3 2.1 1.8 1.6 1.3 4.7 0.7 α-Terpineol - - - - - - 1.1 Unknown 0.4 0.2 0.6 0.2 - 0.2 - Neral - - - - - - 11.2 Geranial - - - - - - 19.1 Bornyl-acetate 0.6 0.5 - 0.2 - 0.0 0.0 β-Elemene 1.7 0.8 0.3 0.08 - - 0.2 (E)-Caryophyllene 24.9 21.6 29.3 27.2 10.1 22.5 0.2 α-Humulene 45.4 51.0 53.9 56.5 25.6 53.3 1.0 Allo-Aromadendrene
2.2 2.2 - - -
α-Muurolene 3.3 2.4 0.2 0.0 - - 0.1 Germacrene-D 0.8 0.6 0.0 0.3 - 0.0 - AR-Curcumene - - - - - - 3.5 α-Selinene 1.2 0.9 0.3 - - - - α-Zingiberene - - - - - - 16.6 α-Bisabolene - - - 2.1 0.1 1.4 - α-Bulnesene 0.4 0.3 - - - - - β-Bisabolene 0.7 0.6 0.1 0.2 - - 6.6 Unknown 1.0 1.1 0.2 - - - 0.4 β-Sesquiphellandrene
- - - - - - 4.2
Nerolidol 1.2 2.1 1.1 1.1 - 0.1 0.9 α-Caryophyllene alcohol
0.1 0.0 0.0 - - - -
Caryophyllene-oxide
0.7 1.3 1.3 2.0 0.9 0.2 -
Unknown 1.2 2.5 2.2 3.1 0.2 1.2 - Monoterpenes 6.2 3.1 3.7 5.9 60.5 20.9 48.2 Sesquiterpenes 84.8 87.5 89 92.6 36.9 78.7 33.7 Total-analyzed 91 90.6 92.7 98.5 97.4 99.7 81.9
1- not detected or in traces amounts (<0.01%), 2–Relative percent of the total oil
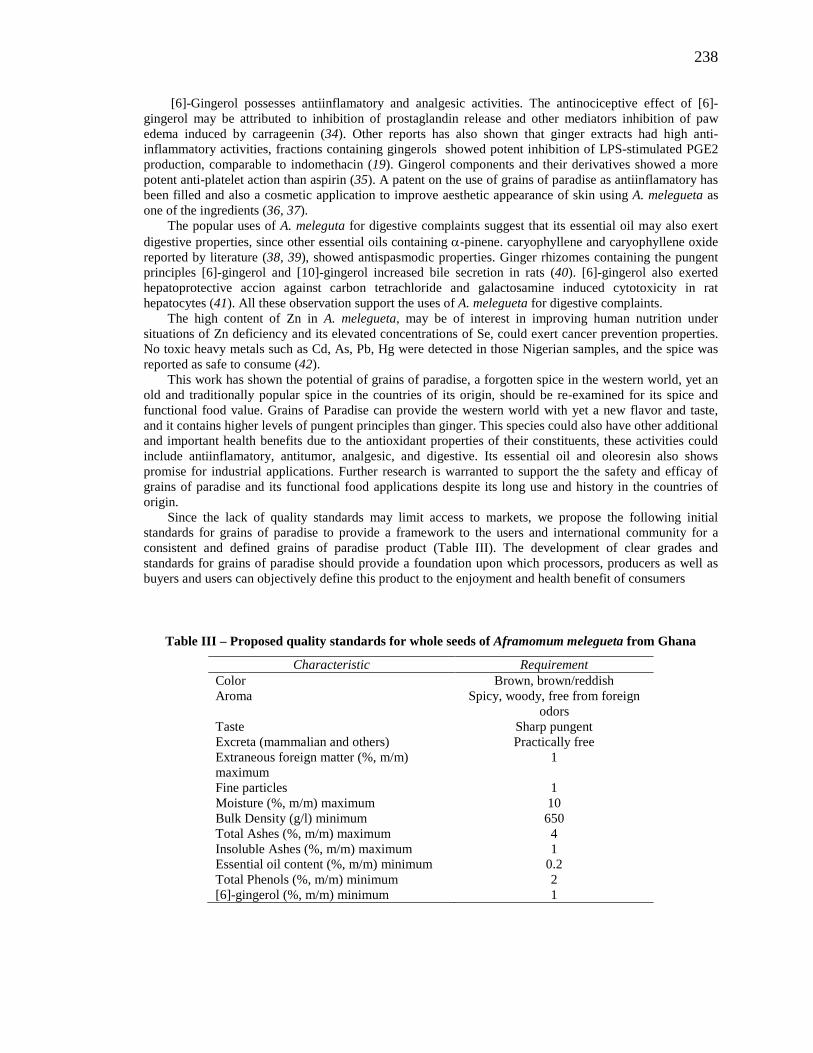
238
[6]-Gingerol possesses antiinflamatory and analgesic activities. The antinociceptive effect of [6]-gingerol may be attributed to inhibition of prostaglandin release and other mediators inhibition of paw edema induced by carrageenin (34). Other reports has also shown that ginger extracts had high anti-inflammatory activities, fractions containing gingerols showed potent inhibition of LPS-stimulated PGE2 production, comparable to indomethacin (19). Gingerol components and their derivatives showed a more potent anti-platelet action than aspirin (35). A patent on the use of grains of paradise as antiinflamatory has been filled and also a cosmetic application to improve aesthetic appearance of skin using A. melegueta as one of the ingredients (36, 37).
The popular uses of A. meleguta for digestive complaints suggest that its essential oil may also exert digestive properties, since other essential oils containing α-pinene. caryophyllene and caryophyllene oxide reported by literature (38, 39), showed antispasmodic properties. Ginger rhizomes containing the pungent principles [6]-gingerol and [10]-gingerol increased bile secretion in rats (40). [6]-gingerol also exerted hepatoprotective accion against carbon tetrachloride and galactosamine induced cytotoxicity in rat hepatocytes (41). All these observation support the uses of A. melegueta for digestive complaints.
The high content of Zn in A. melegueta, may be of interest in improving human nutrition under situations of Zn deficiency and its elevated concentrations of Se, could exert cancer prevention properties. No toxic heavy metals such as Cd, As, Pb, Hg were detected in those Nigerian samples, and the spice was reported as safe to consume (42).
This work has shown the potential of grains of paradise, a forgotten spice in the western world, yet an old and traditionally popular spice in the countries of its origin, should be re-examined for its spice and functional food value. Grains of Paradise can provide the western world with yet a new flavor and taste, and it contains higher levels of pungent principles than ginger. This species could also have other additional and important health benefits due to the antioxidant properties of their constituents, these activities could include antiinflamatory, antitumor, analgesic, and digestive. Its essential oil and oleoresin also shows promise for industrial applications. Further research is warranted to support the the safety and efficay of grains of paradise and its functional food applications despite its long use and history in the countries of origin.
Since the lack of quality standards may limit access to markets, we propose the following initial standards for grains of paradise to provide a framework to the users and international community for a consistent and defined grains of paradise product (Table III). The development of clear grades and standards for grains of paradise should provide a foundation upon which processors, producers as well as buyers and users can objectively define this product to the enjoyment and health benefit of consumers
Table III – Proposed quality standards for whole seeds of Aframomum melegueta from Ghana
Characteristic Requirement Color Brown, brown/reddish Aroma Spicy, woody, free from foreign
odors Taste Sharp pungent Excreta (mammalian and others) Practically free Extraneous foreign matter (%, m/m) maximum
1
Fine particles 1 Moisture (%, m/m) maximum 10 Bulk Density (g/l) minimum 650 Total Ashes (%, m/m) maximum 4 Insoluble Ashes (%, m/m) maximum 1 Essential oil content (%, m/m) minimum 0.2 Total Phenols (%, m/m) minimum 2 [6]-gingerol (%, m/m) minimum 1
239
Acknowledgements
We thank the Ghanaian communities involved in these domestication and commercialization studies, who, with assistance from the ASNAPP project, were among the first to actually begin to export this specialized tea collected from the wild. In particular, we thank Kodzo Gbewonyo, BioResources of Ghana and New Jesey for his interest and support of this work. We thank Carol Wilson, USAID Chief Technical Officer of our Partnership for Food and Industry in Natural Products (PFID/NP) project supported by the Office of Economic Growth, Agriculture and Trade (EGAT/AG) of the USAID (Contract Award No. AEG-A-00-04-00012-00) in support of their global economic development programs. We also thank Jerry Brown, USAID project officer, for his support and encouragement as this work originally began as part of the Agri-Business in Sustainable African Natural Plant Products Program (ASNAPP) with funding from the USAID (Contract Award No. HFM-O-00-01-00116). Finally, we recognize and thank the New Use Agriculture and Natural Plant Products Program (NUANPP) and the New Jersey Agricultural Experiment Station, Rutgers University.
240
References
1. Madhusoodanan, K.J.; Saideswara Rao, Y. In Handbook of Herbs and Spices; Peter, K.V., Ed.; CRC Press: Boca Raton, FL, 2001; pp. 134-142.
2. Peter, K.V. In Handbook of Herbs and Spices; Peter, K.V., Ed.; CRC Press: Boca Raton, FL, 2001; pp. 1-12.
3. Rosengarten, F. The Book of Spices. Livinsgton Publishing Company: Philadelphia, PA, 1969.
4. Belewu, M.A.; Belewu, K.Y.B.; Nkwunonwo, C.C. African Journal of Biotechnology 2005, 4, 1076-1079.
5. Dahlgre, R.M.T.; Clifford, H.T.; Yeo, P.F. The Families of the Monocotyledons, Springer Verlag: Berlin, Germany, 1985.
6. Menut, C.; Lamaty, G.; Amvam Zollo, P.H.; Atogho, B.M.; Abondo, R.; Bessiere, J.M. Flavour Fragrance J. 1991, 6, 183-186.
7. Ayiku, M.N.B. Ghana Herbal Pharmacopeia. Technology Transfer Center, Accra, Ghana, 1992, pp. 86-88.
8. Guenther E. The Essential Oils, Vol. 5, Van Nostrand Reinhold: New York, 1949, p 104.
9. Juliani, H.R.; Simon, J.E.; Ramboatiana, M.M.R.; Behra, O.; Garvey, A.; Raskin, I. Acta Horticulturae 2004, 629, 77-81.
10. Juliani, H.R.; Behra, O.; Moharram, H.; Ranarivelo, L.; Ralijerson, B.; Andriantsiferana, M.; Ranjatoson, N.; Rasoarahona, J.; Ramanoelina, P.; Wang, M.; Simon, J.E. Perfumer and Flavorist 2005, 30, 60-65.
11. Juliani, H.R.; Wang, M.; Asante-Dartey, J.; Acquaye, D.; Moharram, H.; Koroch, A.R.; Simon, J.E. In: Herbs: Challenges in Chemistry and Biology, Wang, M.; Sang, S.; Hwang, L.S.; Ho, C.-T., Eds.; ACS Symp. Ser. 925, American Chemical Society: Washington, D.C., 2006, pp. 126-142.
12. Committee on Food Chemical Codex. Food Chemical Codex. National Academy Press: Washington, DC, 1996.
13. Gao, X.; Bjork, L.; Trajkovski, V.; Uggla, M. J. Sci. Food Agric. 2000, 80, 2021-2027.
14. Re, R.; Pellegrini, N.; Proteggente, A.; Pannala, A.; Yang, M.; Rice Evans, C. Free Rad. Biol. Med. 1999, 26, 1231-1237.
15. Juliani, H.R.; J.A Zygadlo, J.A.; R. Scrivanti, R.; E. de La Sota, E.; and J. E. Simon, J.E. Flavour Fragr. J. 2004, 19, 541–543.
16. Muggeridge, M.; Foods, L.; Clay, M. In Handbook of Herbs and Spices, Peter, K.V., Ed.; CRC Press: Boca Raton, FL, 2001.
17. Adegoke, G.O.; Makinde, O.; Falade, K.O.; Peters, P.I.U. Eur. Food Res. Technol. 2003, 216, 526 – 528.
18. Ajaiyeoba, E.O.; Ekundayo, O. Flavour Fragrance J. 1999, 14, 109-111.
241
19. Jolad, S.D.; Lantz, R.C.; Chen, G.J.; Bates, R.B.; Timmermann, B.N. Phytochemistry 2005, 66, 1614–1635.
20. Tackie, A.N.; Dwuma, B.D.; Ayim, J.S.K.; Dabra, T.T.; Knapp, J.E.; Slatkin, D.J.; Schiff, P.L., Jr. Phytochemistry 1975, 14, 853-854.
21. Escoubas, P.; Lajide, L.; Mizutani, J. Phytochemistry 1995, 40, 4, 1097-1099.
22. Chen, C.C.; Rosen, R.T.; Ho, C.-T. J. Chromatography 1986, 360, 175-184.
23. Lamaty, G.; Menut, C.; Koudou, J.; Regnier, P.; Bessiere, J.M. J. Essential Oil Res. 1993, 5, 81-83.
24. Koroch, A.R.; Zygadlo, J.A.; Juliani, H.R. In Flavours-Chemistry, Technology and Resources, Berger, R.G., Ed.; 2006, in press.
25. Wang, M.; Juliani, R.; Simon, J.E.; Ekanem, A.; Liang, C.P.; Ho, C.-T. In Phenolic Compounds in Foods and Natural Health Products, Shahidi, F.; Ho, C.-T., Eds.; ACS Symposium Series 909. American Chemical Society. Washington DC., 2005, pp. 118-142.
26. Konning, G.H.; Agyare, C.; Ennison, B. Fitoterapia 2004, 75, 65–67.
27. Surh, Y.J. Mutation Res. 1999, 428, 305-327.
28. Kim, E.C.; Min, J.K.; Kim, T.Y.; Lee, S.J.; Yang, H.O.; Han, S.H.; Kim, Y.M.; Kwon, Y.G. Biochem. Biophys. Res. Commun. 2005, 335, 2, 300-308.
29. Masuda, Y.; Kikuzaki, H.; Hisamoto, M.; Nakatani, N. BioFactors 2004, 21, 293-296.
30. Udilova, N.; Jurek, D.; Marian, B.; Gille, L.; Schulte, H.R.; Nohl, H. Food Chem. Toxicol. 2003, 41, 1481.
31. Gonzalez, M.J. Medical Hypotheses 1992, 38, 106.
32. Kim, S.O.; Chun, K.S.; Kundu, J.K.; Surh, Y.J. BioFactors 2004, 21, 27-31.
33. Park, K.K.; Chun, K.S.; Lee, J.M.; Lee, S.S.; Surh, Y.J. Cancer Letters 1998, 129, 139–144
34. Young, H.Y.; Luo, Y.L.; Cheng, H.Y.; Hsieh, W.C.; Liao, J.C.; Peng, W.H. J. Ethnopharmacology 2005, 96, 207-210.
35. Nurtjahja, T.E.; Ammit, A.J.; Roufogalis, B.D.; Tran, V.H.; Duke, C.C. Thrombosis Research 2003, 111, 259-265.
36. Raskin, I.; Ilic, N. U.S. Pat. Appl. Publ. 2005-134195, 2005.
37. Mahalingam, H.; Kyrou, C.D.; Traudt, M.; Ptchelintsev, D. U.S. Pat. Appl. Publ. 741,383, 2004.
38. Camara, C.C.; Nascimento, N.R.F.; Macedo-Filho, C.L.; Almeida, F.B.S.; Fonteles, M.C. Planta Med. 2003, 69, 1080.
39. Sadraei, H.; Asghari, G.; Naddafi, A. Phytother. Res. 2003, 17, 645.
40. Yamahara, J.; Miki, K.; Chisaka, T.; Sawada, T.; Fujimura, H.; Tomimatsu, T.; Nakano, K.; Nohara, T. J. Ethnopharmacology 1985, 13, 217-225.

242
41. Hikino, H.; Kiso, Y.; Kato, N.; Hamada, Y.; Shioiri, T.; Aiyama, R.; Itokawa, H.; Kiuchi, F.; Sankawa, U. J. Ethnopharmacology 1985, 14, 31-39.
42. Obiajunwa, E.I.; Adeleke, C.A.; O.; Olanrewaju, R.O. J. Radioanal. Nuclear Chem. 2002, 252, 473–476.
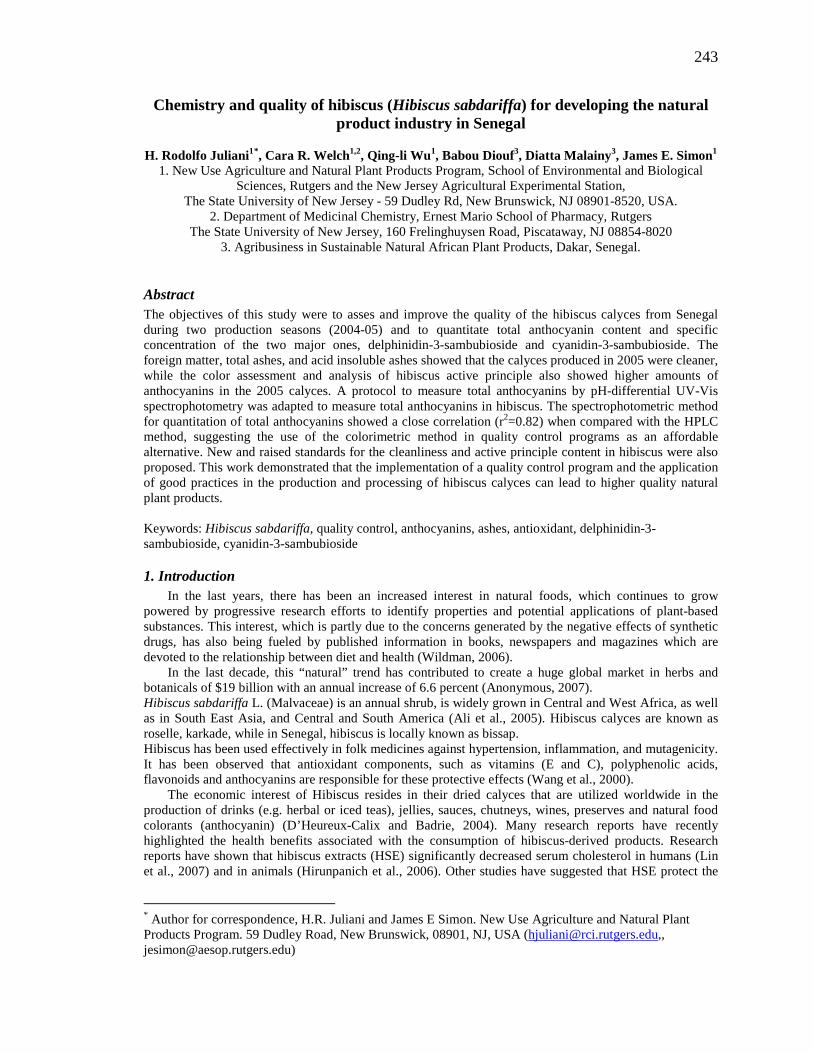
243
Chemistry and quality of hibiscus (Hibiscus sabdariffa) for developing the natural product industry in Senegal
H. Rodolfo Juliani1*
1. New Use Agriculture and Natural Plant Products Program, School of Environmental and Biological Sciences, Rutgers and the New Jersey Agricultural Experimental Station,
, Cara R. Welch1,2, Qing-li Wu1, Babou Diouf3, Diatta Malainy3, James E. Simon1
The State University of New Jersey - 59 Dudley Rd, New Brunswick, NJ 08901-8520, USA. 2. Department of Medicinal Chemistry, Ernest Mario School of Pharmacy, Rutgers
The State University of New Jersey, 160 Frelinghuysen Road, Piscataway, NJ 08854-8020 3. Agribusiness in Sustainable Natural African Plant Products, Dakar, Senegal.
Abstract The objectives of this study were to asses and improve the quality of the hibiscus calyces from Senegal during two production seasons (2004-05) and to quantitate total anthocyanin content and specific concentration of the two major ones, delphinidin-3-sambubioside and cyanidin-3-sambubioside. The foreign matter, total ashes, and acid insoluble ashes showed that the calyces produced in 2005 were cleaner, while the color assessment and analysis of hibiscus active principle also showed higher amounts of anthocyanins in the 2005 calyces. A protocol to measure total anthocyanins by pH-differential UV-Vis spectrophotometry was adapted to measure total anthocyanins in hibiscus. The spectrophotometric method for quantitation of total anthocyanins showed a close correlation (r2=0.82) when compared with the HPLC method, suggesting the use of the colorimetric method in quality control programs as an affordable alternative. New and raised standards for the cleanliness and active principle content in hibiscus were also proposed. This work demonstrated that the implementation of a quality control program and the application of good practices in the production and processing of hibiscus calyces can lead to higher quality natural plant products. Keywords: Hibiscus sabdariffa, quality control, anthocyanins, ashes, antioxidant, delphinidin-3-sambubioside, cyanidin-3-sambubioside
1. Introduction In the last years, there has been an increased interest in natural foods, which continues to grow
powered by progressive research efforts to identify properties and potential applications of plant-based substances. This interest, which is partly due to the concerns generated by the negative effects of synthetic drugs, has also being fueled by published information in books, newspapers and magazines which are devoted to the relationship between diet and health (Wildman, 2006).
In the last decade, this “natural” trend has contributed to create a huge global market in herbs and botanicals of $19 billion with an annual increase of 6.6 percent (Anonymous, 2007). Hibiscus sabdariffa L. (Malvaceae) is an annual shrub, is widely grown in Central and West Africa, as well as in South East Asia, and Central and South America (Ali et al., 2005). Hibiscus calyces are known as roselle, karkade, while in Senegal, hibiscus is locally known as bissap. Hibiscus has been used effectively in folk medicines against hypertension, inflammation, and mutagenicity. It has been observed that antioxidant components, such as vitamins (E and C), polyphenolic acids, flavonoids and anthocyanins are responsible for these protective effects (Wang et al., 2000).
The economic interest of Hibiscus resides in their dried calyces that are utilized worldwide in the production of drinks (e.g. herbal or iced teas), jellies, sauces, chutneys, wines, preserves and natural food colorants (anthocyanin) (D’Heureux-Calix and Badrie, 2004). Many research reports have recently highlighted the health benefits associated with the consumption of hibiscus-derived products. Research reports have shown that hibiscus extracts (HSE) significantly decreased serum cholesterol in humans (Lin et al., 2007) and in animals (Hirunpanich et al., 2006). Other studies have suggested that HSE protect the
* Author for correspondence, H.R. Juliani and James E Simon. New Use Agriculture and Natural Plant Products Program. 59 Dudley Road, New Brunswick, 08901, NJ, USA ([email protected],, [email protected])
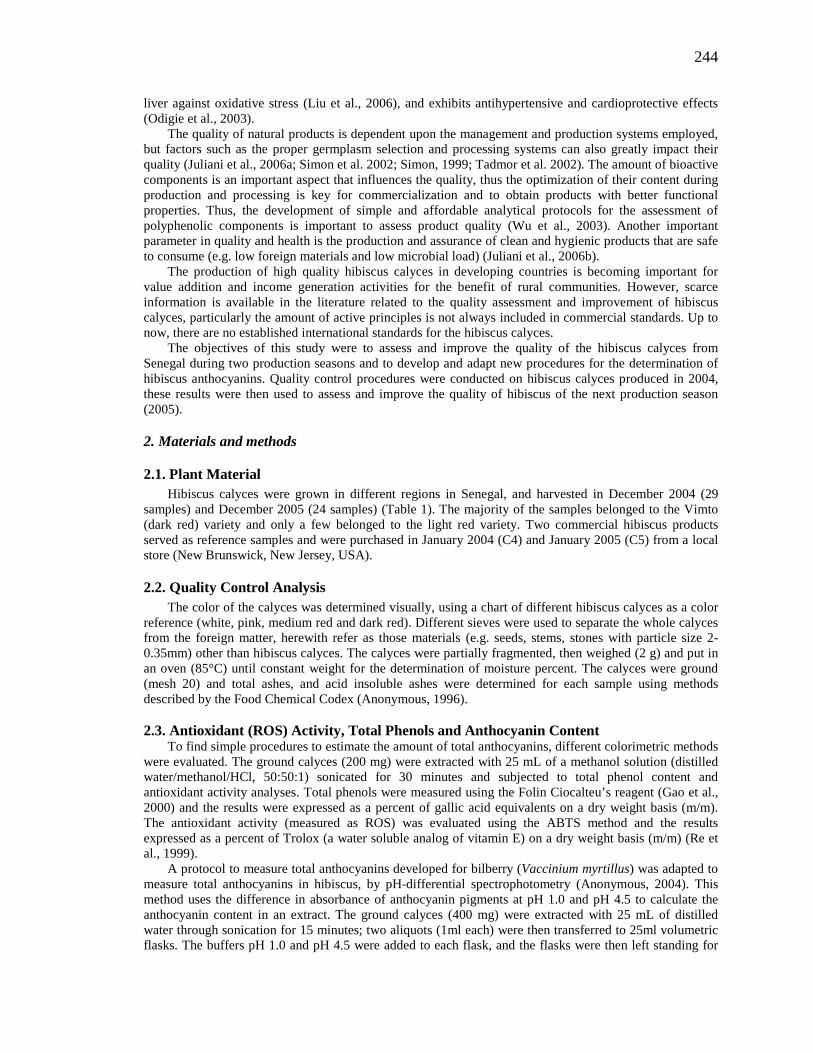
244
liver against oxidative stress (Liu et al., 2006), and exhibits antihypertensive and cardioprotective effects (Odigie et al., 2003).
The quality of natural products is dependent upon the management and production systems employed, but factors such as the proper germplasm selection and processing systems can also greatly impact their quality (Juliani et al., 2006a; Simon et al. 2002; Simon, 1999; Tadmor et al. 2002). The amount of bioactive components is an important aspect that influences the quality, thus the optimization of their content during production and processing is key for commercialization and to obtain products with better functional properties. Thus, the development of simple and affordable analytical protocols for the assessment of polyphenolic components is important to assess product quality (Wu et al., 2003). Another important parameter in quality and health is the production and assurance of clean and hygienic products that are safe to consume (e.g. low foreign materials and low microbial load) (Juliani et al., 2006b).
The production of high quality hibiscus calyces in developing countries is becoming important for value addition and income generation activities for the benefit of rural communities. However, scarce information is available in the literature related to the quality assessment and improvement of hibiscus calyces, particularly the amount of active principles is not always included in commercial standards. Up to now, there are no established international standards for the hibiscus calyces.
The objectives of this study were to assess and improve the quality of the hibiscus calyces from Senegal during two production seasons and to develop and adapt new procedures for the determination of hibiscus anthocyanins. Quality control procedures were conducted on hibiscus calyces produced in 2004, these results were then used to assess and improve the quality of hibiscus of the next production season (2005).
2. Materials and methods
2.1. Plant Material Hibiscus calyces were grown in different regions in Senegal, and harvested in December 2004 (29
samples) and December 2005 (24 samples) (Table 1). The majority of the samples belonged to the Vimto (dark red) variety and only a few belonged to the light red variety. Two commercial hibiscus products served as reference samples and were purchased in January 2004 (C4) and January 2005 (C5) from a local store (New Brunswick, New Jersey, USA).
2.2. Quality Control Analysis The color of the calyces was determined visually, using a chart of different hibiscus calyces as a color
reference (white, pink, medium red and dark red). Different sieves were used to separate the whole calyces from the foreign matter, herewith refer as those materials (e.g. seeds, stems, stones with particle size 2-0.35mm) other than hibiscus calyces. The calyces were partially fragmented, then weighed (2 g) and put in an oven (85°C) until constant weight for the determination of moisture percent. The calyces were ground (mesh 20) and total ashes, and acid insoluble ashes were determined for each sample using methods described by the Food Chemical Codex (Anonymous, 1996).
2.3. Antioxidant (ROS) Activity, Total Phenols and Anthocyanin Content To find simple procedures to estimate the amount of total anthocyanins, different colorimetric methods were evaluated. The ground calyces (200 mg) were extracted with 25 mL of a methanol solution (distilled water/methanol/HCl, 50:50:1) sonicated for 30 minutes and subjected to total phenol content and antioxidant activity analyses. Total phenols were measured using the Folin Ciocalteu’s reagent (Gao et al., 2000) and the results were expressed as a percent of gallic acid equivalents on a dry weight basis (m/m). The antioxidant activity (measured as ROS) was evaluated using the ABTS method and the results expressed as a percent of Trolox (a water soluble analog of vitamin E) on a dry weight basis (m/m) (Re et al., 1999). A protocol to measure total anthocyanins developed for bilberry (Vaccinium myrtillus) was adapted to measure total anthocyanins in hibiscus, by pH-differential spectrophotometry (Anonymous, 2004). This method uses the difference in absorbance of anthocyanin pigments at pH 1.0 and pH 4.5 to calculate the anthocyanin content in an extract. The ground calyces (400 mg) were extracted with 25 mL of distilled water through sonication for 15 minutes; two aliquots (1ml each) were then transferred to 25ml volumetric flasks. The buffers pH 1.0 and pH 4.5 were added to each flask, and the flasks were then left standing for
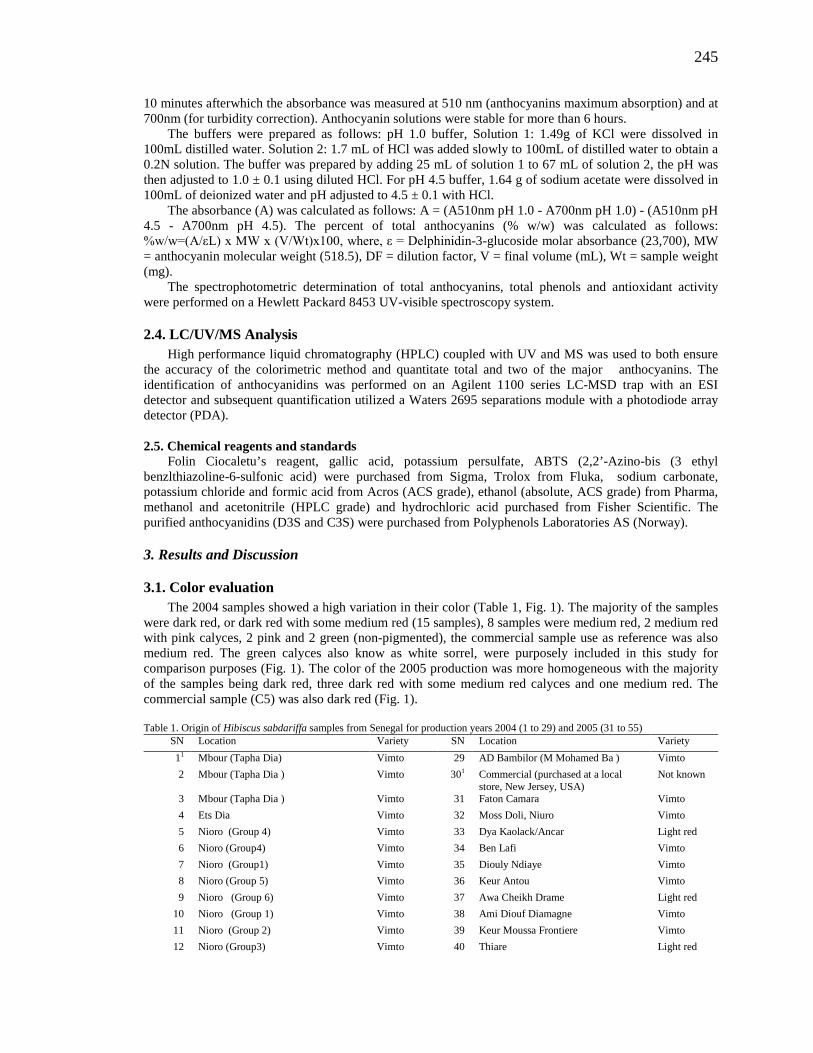
245
10 minutes afterwhich the absorbance was measured at 510 nm (anthocyanins maximum absorption) and at 700nm (for turbidity correction). Anthocyanin solutions were stable for more than 6 hours. The buffers were prepared as follows: pH 1.0 buffer, Solution 1: 1.49g of KCl were dissolved in 100mL distilled water. Solution 2: 1.7 mL of HCl was added slowly to 100mL of distilled water to obtain a 0.2N solution. The buffer was prepared by adding 25 mL of solution 1 to 67 mL of solution 2, the pH was then adjusted to 1.0 ± 0.1 using diluted HCl. For pH 4.5 buffer, 1.64 g of sodium acetate were dissolved in 100mL of deionized water and pH adjusted to 4.5 ± 0.1 with HCl. The absorbance (A) was calculated as follows: A = (A510nm pH 1.0 - A700nm pH 1.0) - (A510nm pH 4.5 - A700nm pH 4.5). The percent of total anthocyanins (% w/w) was calculated as follows: %w/w=(A/εL) x MW x (V/Wt)x100, where, ε = Delphinidin-3-glucoside molar absorbance (23,700), MW = anthocyanin molecular weight (518.5), DF = dilution factor, V = final volume (mL), Wt = sample weight (mg). The spectrophotometric determination of total anthocyanins, total phenols and antioxidant activity were performed on a Hewlett Packard 8453 UV-visible spectroscopy system.
2.4. LC/UV/MS Analysis High performance liquid chromatography (HPLC) coupled with UV and MS was used to both ensure
the accuracy of the colorimetric method and quantitate total and two of the major anthocyanins. The identification of anthocyanidins was performed on an Agilent 1100 series LC-MSD trap with an ESI detector and subsequent quantification utilized a Waters 2695 separations module with a photodiode array detector (PDA). 2.5. Chemical reagents and standards
Folin Ciocaletu’s reagent, gallic acid, potassium persulfate, ABTS (2,2’-Azino-bis (3 ethyl benzlthiazoline-6-sulfonic acid) were purchased from Sigma, Trolox from Fluka, sodium carbonate, potassium chloride and formic acid from Acros (ACS grade), ethanol (absolute, ACS grade) from Pharma, methanol and acetonitrile (HPLC grade) and hydrochloric acid purchased from Fisher Scientific. The purified anthocyanidins (D3S and C3S) were purchased from Polyphenols Laboratories AS (Norway).
3. Results and Discussion
3.1. Color evaluation The 2004 samples showed a high variation in their color (Table 1, Fig. 1). The majority of the samples
were dark red, or dark red with some medium red (15 samples), 8 samples were medium red, 2 medium red with pink calyces, 2 pink and 2 green (non-pigmented), the commercial sample use as reference was also medium red. The green calyces also know as white sorrel, were purposely included in this study for comparison purposes (Fig. 1). The color of the 2005 production was more homogeneous with the majority of the samples being dark red, three dark red with some medium red calyces and one medium red. The commercial sample (C5) was also dark red (Fig. 1). Table 1. Origin of Hibiscus sabdariffa samples from Senegal for production years 2004 (1 to 29) and 2005 (31 to 55)
SN Location Variety SN Location Variety 11 Mbour (Tapha Dia) Vimto 29 AD Bambilor (M Mohamed Ba ) Vimto 2 Mbour (Tapha Dia ) Vimto 301 Commercial (purchased at a local
store, New Jersey, USA) Not known
3 Mbour (Tapha Dia ) Vimto 31 Faton Camara Vimto 4 Ets Dia Vimto 32 Moss Doli, Niuro Vimto 5 Nioro (Group 4) Vimto 33 Dya Kaolack/Ancar Light red 6 Nioro (Group4) Vimto 34 Ben Lafi Vimto 7 Nioro (Group1) Vimto 35 Diouly Ndiaye Vimto 8 Nioro (Group 5) Vimto 36 Keur Antou Vimto 9 Nioro (Group 6) Vimto 37 Awa Cheikh Drame Light red
10 Nioro (Group 1) Vimto 38 Ami Diouf Diamagne Vimto 11 Nioro (Group 2) Vimto 39 Keur Moussa Frontiere Vimto 12 Nioro (Group3) Vimto 40 Thiare Light red
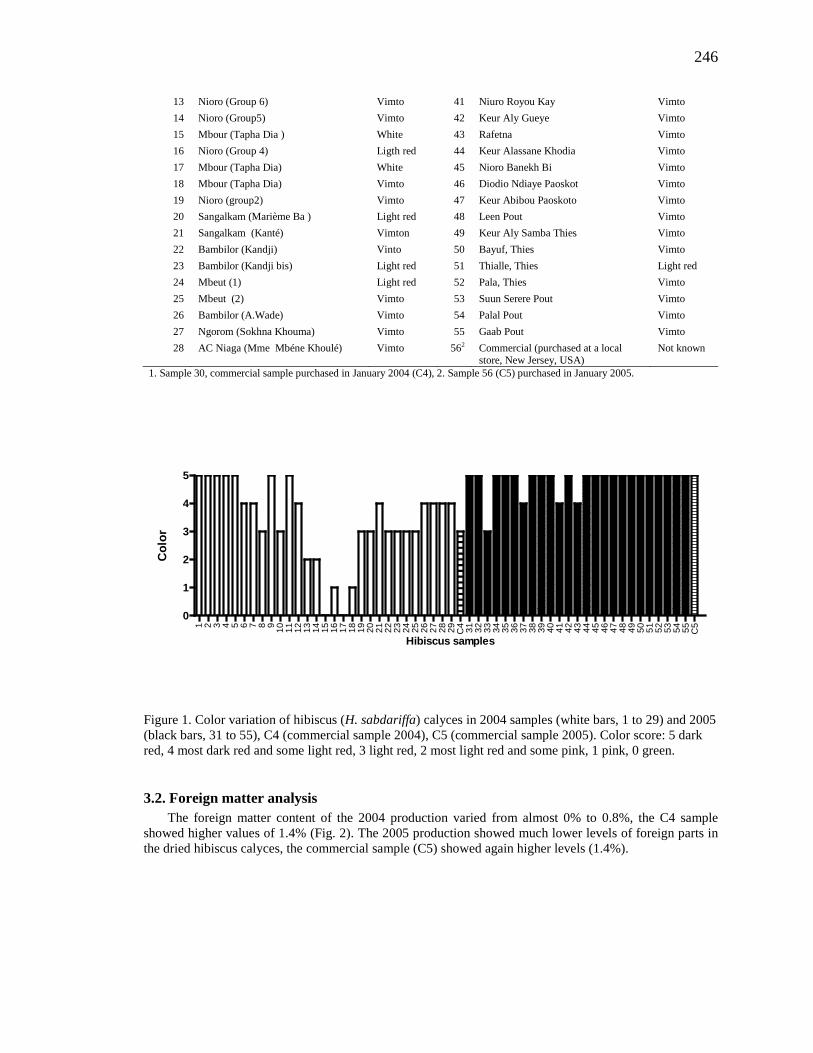
246
13 Nioro (Group 6) Vimto 41 Niuro Royou Kay Vimto 14 Nioro (Group5) Vimto 42 Keur Aly Gueye Vimto 15 Mbour (Tapha Dia ) White 43 Rafetna Vimto 16 Nioro (Group 4) Ligth red 44 Keur Alassane Khodia Vimto 17 Mbour (Tapha Dia) White 45 Nioro Banekh Bi Vimto 18 Mbour (Tapha Dia) Vimto 46 Diodio Ndiaye Paoskot Vimto 19 Nioro (group2) Vimto 47 Keur Abibou Paoskoto Vimto 20 Sangalkam (Marième Ba ) Light red 48 Leen Pout Vimto 21 Sangalkam (Kanté) Vimton 49 Keur Aly Samba Thies Vimto 22 Bambilor (Kandji) Vinto 50 Bayuf, Thies Vimto 23 Bambilor (Kandji bis) Light red 51 Thialle, Thies Light red 24 Mbeut (1) Light red 52 Pala, Thies Vimto 25 Mbeut (2) Vimto 53 Suun Serere Pout Vimto 26 Bambilor (A.Wade) Vimto 54 Palal Pout Vimto 27 Ngorom (Sokhna Khouma) Vimto 55 Gaab Pout Vimto 28 AC Niaga (Mme Mbéne Khoulé) Vimto 562 Commercial (purchased at a local
store, New Jersey, USA) Not known
1. Sample 30, commercial sample purchased in January 2004 (C4), 2. Sample 56 (C5) purchased in January 2005.
1 2 3 4 5 6 7 8 9 10 11 12 13 14 15 16 17 18 19 20 21 22 23 24 25 26 27 28 29 C4 31 32 33 34 35 36 37 38 39 40 41 42 43 44 45 46 47 48 49 50 51 52 53 54 55 C5
0
1
2
3
4
5
Hibiscus samples
Col
or
Figure 1. Color variation of hibiscus (H. sabdariffa) calyces in 2004 samples (white bars, 1 to 29) and 2005 (black bars, 31 to 55), C4 (commercial sample 2004), C5 (commercial sample 2005). Color score: 5 dark red, 4 most dark red and some light red, 3 light red, 2 most light red and some pink, 1 pink, 0 green.
3.2. Foreign matter analysis The foreign matter content of the 2004 production varied from almost 0% to 0.8%, the C4 sample
showed higher values of 1.4% (Fig. 2). The 2005 production showed much lower levels of foreign parts in the dried hibiscus calyces, the commercial sample (C5) showed again higher levels (1.4%).
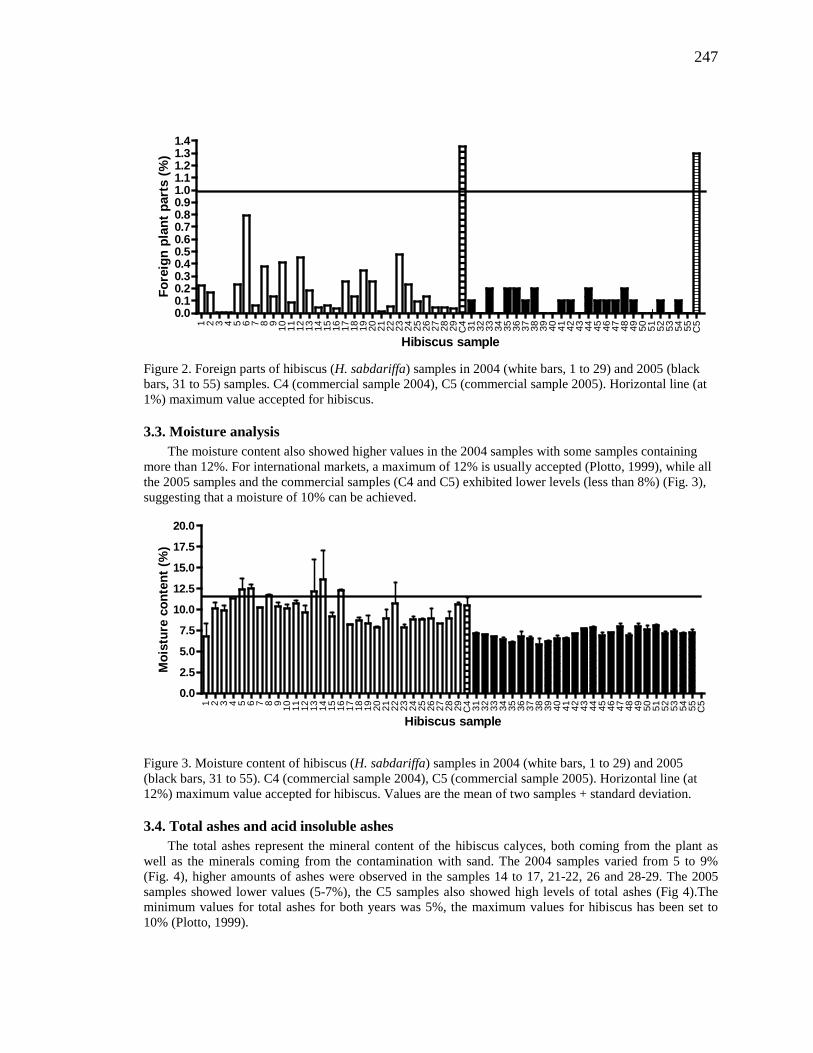
247
1 2 3 4 5 6 7 8 9 10 11 12 13 14 15 16 17 18 19 20 21 22 23 24 25 26 27 28 29 C4 31 32 33 34 35 36 37 38 39 40 41 42 43 44 45 46 47 48 49 50 51 52 53 54 55 C5
0.00.10.20.30.40.50.60.70.80.91.01.11.21.31.4
Hibiscus sample
Fore
ign
plan
t par
ts (%
)
Figure 2. Foreign parts of hibiscus (H. sabdariffa) samples in 2004 (white bars, 1 to 29) and 2005 (black bars, 31 to 55) samples. C4 (commercial sample 2004), C5 (commercial sample 2005). Horizontal line (at 1%) maximum value accepted for hibiscus.
3.3. Moisture analysis The moisture content also showed higher values in the 2004 samples with some samples containing
more than 12%. For international markets, a maximum of 12% is usually accepted (Plotto, 1999), while all the 2005 samples and the commercial samples (C4 and C5) exhibited lower levels (less than 8%) (Fig. 3), suggesting that a moisture of 10% can be achieved.
1 2 3 4 5 6 7 8 9 10 11 12 13 14 15 16 17 18 19 20 21 22 23 24 25 26 27 28 29 C4 31 32 33 34 35 36 37 38 39 40 41 42 43 44 45 46 47 48 49 50 51 52 53 54 55 C5
0.0
2.5
5.0
7.5
10.0
12.5
15.0
17.5
20.0
Hibiscus sample
Moi
stur
e co
nten
t (%
)
Figure 3. Moisture content of hibiscus (H. sabdariffa) samples in 2004 (white bars, 1 to 29) and 2005 (black bars, 31 to 55). C4 (commercial sample 2004), C5 (commercial sample 2005). Horizontal line (at 12%) maximum value accepted for hibiscus. Values are the mean of two samples + standard deviation.
3.4. Total ashes and acid insoluble ashes The total ashes represent the mineral content of the hibiscus calyces, both coming from the plant as
well as the minerals coming from the contamination with sand. The 2004 samples varied from 5 to 9% (Fig. 4), higher amounts of ashes were observed in the samples 14 to 17, 21-22, 26 and 28-29. The 2005 samples showed lower values (5-7%), the C5 samples also showed high levels of total ashes (Fig 4).The minimum values for total ashes for both years was 5%, the maximum values for hibiscus has been set to 10% (Plotto, 1999).
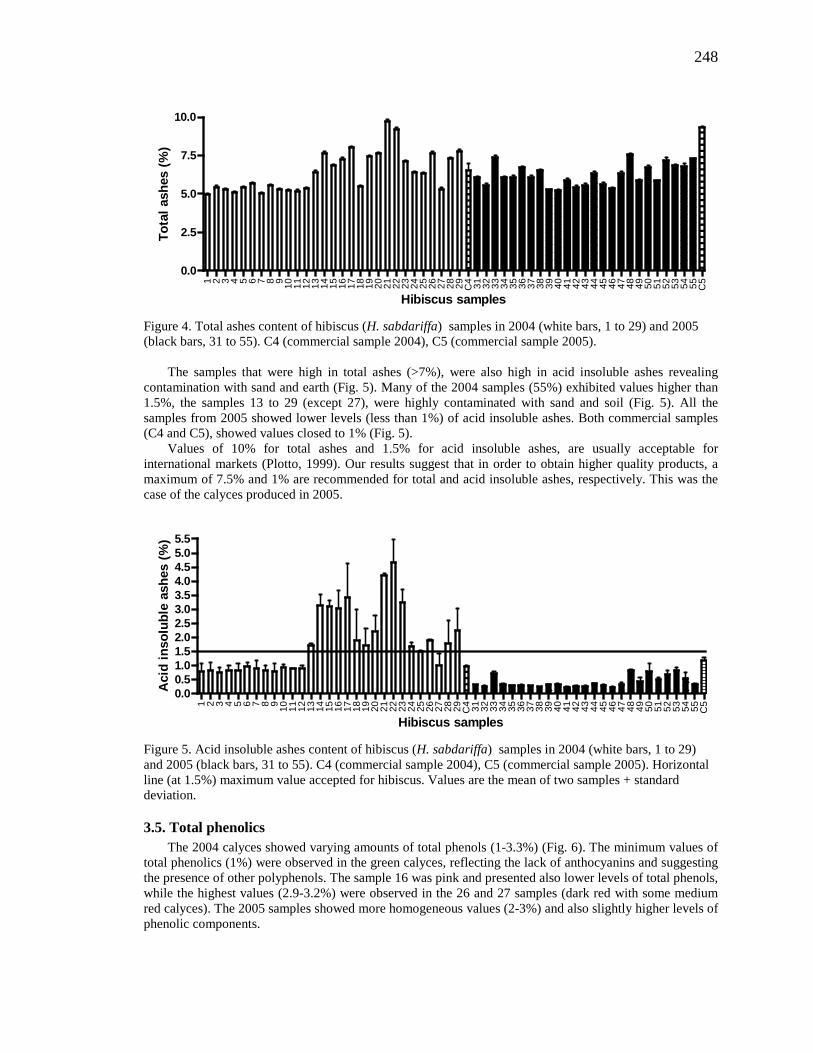
248
1 2 3 4 5 6 7 8 9 10 11 12 13 14 15 16 17 18 19 20 21 22 23 24 25 26 27 28 29 C4 31 32 33 34 35 36 37 38 39 40 41 42 43 44 45 46 47 48 49 50 51 52 53 54 55 C5
0.0
2.5
5.0
7.5
10.0
Hibiscus samples
Tota
l ash
es (%
)
Figure 4. Total ashes content of hibiscus (H. sabdariffa) samples in 2004 (white bars, 1 to 29) and 2005 (black bars, 31 to 55). C4 (commercial sample 2004), C5 (commercial sample 2005).
The samples that were high in total ashes (>7%), were also high in acid insoluble ashes revealing contamination with sand and earth (Fig. 5). Many of the 2004 samples (55%) exhibited values higher than 1.5%, the samples 13 to 29 (except 27), were highly contaminated with sand and soil (Fig. 5). All the samples from 2005 showed lower levels (less than 1%) of acid insoluble ashes. Both commercial samples (C4 and C5), showed values closed to 1% (Fig. 5).
Values of 10% for total ashes and 1.5% for acid insoluble ashes, are usually acceptable for international markets (Plotto, 1999). Our results suggest that in order to obtain higher quality products, a maximum of 7.5% and 1% are recommended for total and acid insoluble ashes, respectively. This was the case of the calyces produced in 2005.
1 2 3 4 5 6 7 8 9 10 11 12 13 14 15 16 17 18 19 20 21 22 23 24 25 26 27 28 29 C4 31 32 33 34 35 36 37 38 39 40 41 42 43 44 45 46 47 48 49 50 51 52 53 54 55 C5
0.00.51.01.52.02.53.03.54.04.55.05.5
Hibiscus samples
Aci
d in
solu
ble
ashe
s (%
)
Figure 5. Acid insoluble ashes content of hibiscus (H. sabdariffa) samples in 2004 (white bars, 1 to 29) and 2005 (black bars, 31 to 55). C4 (commercial sample 2004), C5 (commercial sample 2005). Horizontal line (at 1.5%) maximum value accepted for hibiscus. Values are the mean of two samples + standard deviation.
3.5. Total phenolics The 2004 calyces showed varying amounts of total phenols (1-3.3%) (Fig. 6). The minimum values of
total phenolics (1%) were observed in the green calyces, reflecting the lack of anthocyanins and suggesting the presence of other polyphenols. The sample 16 was pink and presented also lower levels of total phenols, while the highest values (2.9-3.2%) were observed in the 26 and 27 samples (dark red with some medium red calyces). The 2005 samples showed more homogeneous values (2-3%) and also slightly higher levels of phenolic components.
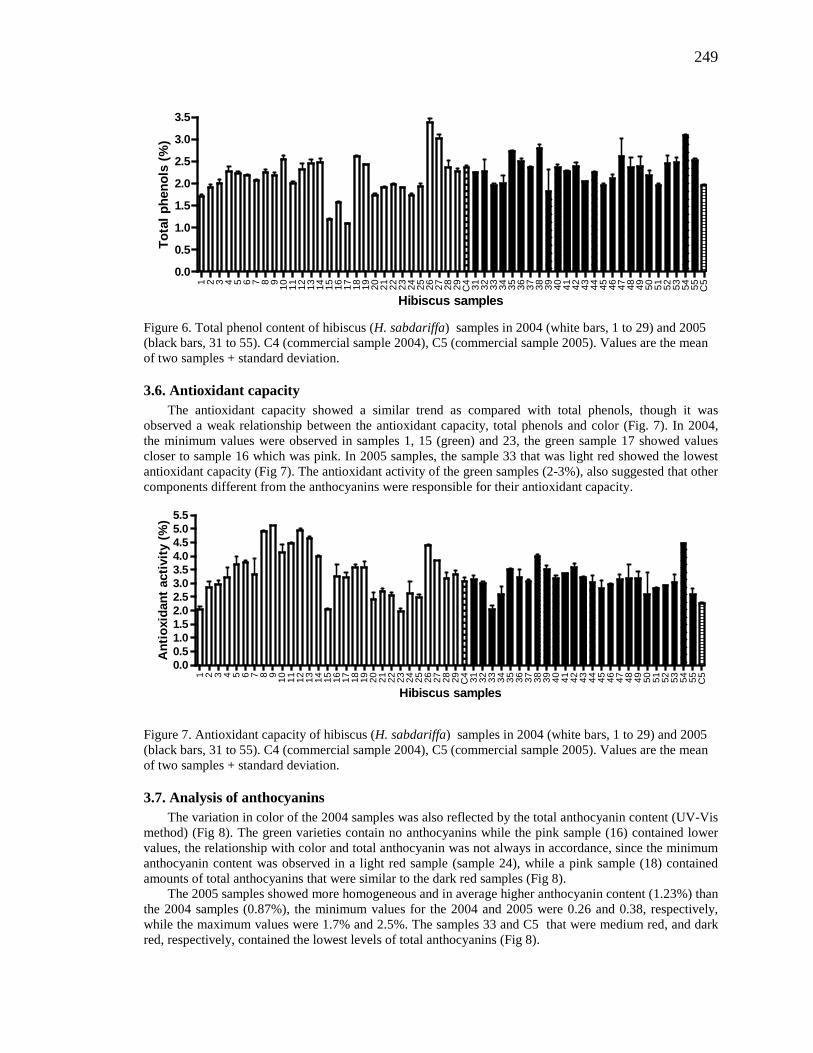
249
1 2 3 4 5 6 7 8 9 10 11 12 13 14 15 16 17 18 19 20 21 22 23 24 25 26 27 28 29 C4 31 32 33 34 35 36 37 38 39 40 41 42 43 44 45 46 47 48 49 50 51 52 53 54 55 C5
0.0
0.5
1.0
1.5
2.0
2.5
3.0
3.5
Hibiscus samples
Tota
l phe
nols
(%)
Figure 6. Total phenol content of hibiscus (H. sabdariffa) samples in 2004 (white bars, 1 to 29) and 2005 (black bars, 31 to 55). C4 (commercial sample 2004), C5 (commercial sample 2005). Values are the mean of two samples + standard deviation.
3.6. Antioxidant capacity The antioxidant capacity showed a similar trend as compared with total phenols, though it was
observed a weak relationship between the antioxidant capacity, total phenols and color (Fig. 7). In 2004, the minimum values were observed in samples 1, 15 (green) and 23, the green sample 17 showed values closer to sample 16 which was pink. In 2005 samples, the sample 33 that was light red showed the lowest antioxidant capacity (Fig 7). The antioxidant activity of the green samples (2-3%), also suggested that other components different from the anthocyanins were responsible for their antioxidant capacity.
1 2 3 4 5 6 7 8 9 10 11 12 13 14 15 16 17 18 19 20 21 22 23 24 25 26 27 28 29 C4 31 32 33 34 35 36 37 38 39 40 41 42 43 44 45 46 47 48 49 50 51 52 53 54 55 C5
0.00.51.01.52.02.53.03.54.04.55.05.5
Hibiscus samples
Ant
ioxi
dant
act
ivity
(%)
Figure 7. Antioxidant capacity of hibiscus (H. sabdariffa) samples in 2004 (white bars, 1 to 29) and 2005 (black bars, 31 to 55). C4 (commercial sample 2004), C5 (commercial sample 2005). Values are the mean of two samples + standard deviation.
3.7. Analysis of anthocyanins The variation in color of the 2004 samples was also reflected by the total anthocyanin content (UV-Vis
method) (Fig 8). The green varieties contain no anthocyanins while the pink sample (16) contained lower values, the relationship with color and total anthocyanin was not always in accordance, since the minimum anthocyanin content was observed in a light red sample (sample 24), while a pink sample (18) contained amounts of total anthocyanins that were similar to the dark red samples (Fig 8).
The 2005 samples showed more homogeneous and in average higher anthocyanin content (1.23%) than the 2004 samples (0.87%), the minimum values for the 2004 and 2005 were 0.26 and 0.38, respectively, while the maximum values were 1.7% and 2.5%. The samples 33 and C5 that were medium red, and dark red, respectively, contained the lowest levels of total anthocyanins (Fig 8).
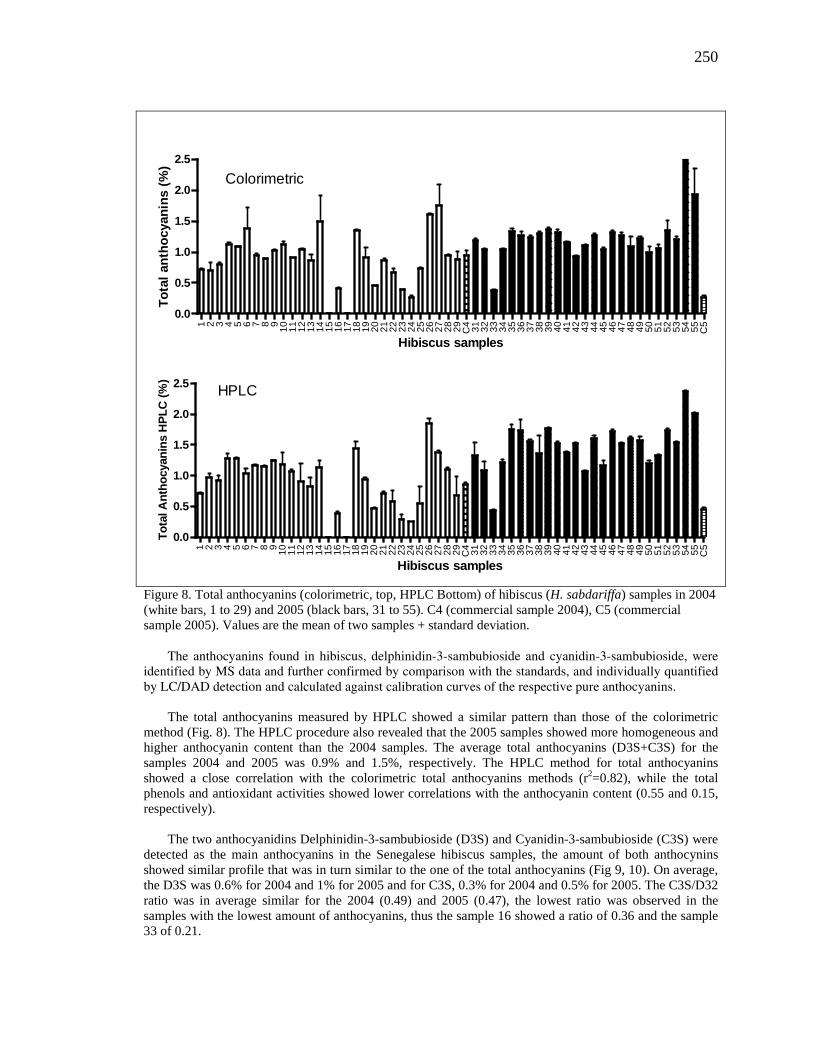
250
1 2 3 4 5 6 7 8 9 10 11 12 13 14 15 16 17 18 19 20 21 22 23 24 25 26 27 28 29 C4 31 32 33 34 35 36 37 38 39 40 41 42 43 44 45 46 47 48 49 50 51 52 53 54 55 C5
0.0
0.5
1.0
1.5
2.0
2.5
Colorimetric
Hibiscus samples
Tota
l ant
hocy
anin
s (%
)
1 2 3 4 5 6 7 8 9 10 11 12 13 14 15 16 17 18 19 20 21 22 23 24 25 26 27 28 29 C4 31 32 33 34 35 36 37 38 39 40 41 42 43 44 45 46 47 48 49 50 51 52 53 54 55 C5
0.0
0.5
1.0
1.5
2.0
2.5 HPLC
Hibiscus samples
Tota
l Ant
hocy
anin
s H
PLC
(%)
Figure 8. Total anthocyanins (colorimetric, top, HPLC Bottom) of hibiscus (H. sabdariffa) samples in 2004 (white bars, 1 to 29) and 2005 (black bars, 31 to 55). C4 (commercial sample 2004), C5 (commercial sample 2005). Values are the mean of two samples + standard deviation.
The anthocyanins found in hibiscus, delphinidin-3-sambubioside and cyanidin-3-sambubioside, were identified by MS data and further confirmed by comparison with the standards, and individually quantified by LC/DAD detection and calculated against calibration curves of the respective pure anthocyanins.
The total anthocyanins measured by HPLC showed a similar pattern than those of the colorimetric
method (Fig. 8). The HPLC procedure also revealed that the 2005 samples showed more homogeneous and higher anthocyanin content than the 2004 samples. The average total anthocyanins (D3S+C3S) for the samples 2004 and 2005 was 0.9% and 1.5%, respectively. The HPLC method for total anthocyanins showed a close correlation with the colorimetric total anthocyanins methods (r2=0.82), while the total phenols and antioxidant activities showed lower correlations with the anthocyanin content (0.55 and 0.15, respectively).
The two anthocyanidins Delphinidin-3-sambubioside (D3S) and Cyanidin-3-sambubioside (C3S) were detected as the main anthocyanins in the Senegalese hibiscus samples, the amount of both anthocynins showed similar profile that was in turn similar to the one of the total anthocyanins (Fig 9, 10). On average, the D3S was 0.6% for 2004 and 1% for 2005 and for C3S, 0.3% for 2004 and 0.5% for 2005. The C3S/D32 ratio was in average similar for the 2004 (0.49) and 2005 (0.47), the lowest ratio was observed in the samples with the lowest amount of anthocyanins, thus the sample 16 showed a ratio of 0.36 and the sample 33 of 0.21.
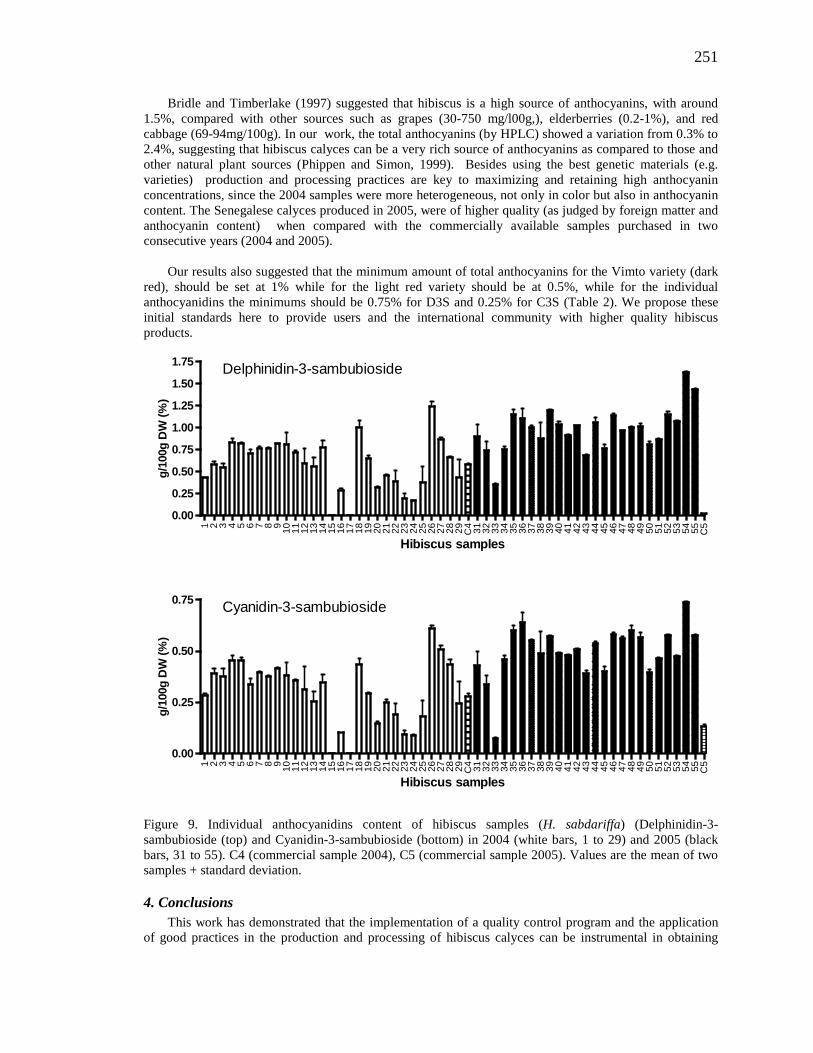
251
Bridle and Timberlake (1997) suggested that hibiscus is a high source of anthocyanins, with around 1.5%, compared with other sources such as grapes (30-750 mg/l00g,), elderberries (0.2-1%), and red cabbage (69-94mg/100g). In our work, the total anthocyanins (by HPLC) showed a variation from 0.3% to 2.4%, suggesting that hibiscus calyces can be a very rich source of anthocyanins as compared to those and other natural plant sources (Phippen and Simon, 1999). Besides using the best genetic materials (e.g. varieties) production and processing practices are key to maximizing and retaining high anthocyanin concentrations, since the 2004 samples were more heterogeneous, not only in color but also in anthocyanin content. The Senegalese calyces produced in 2005, were of higher quality (as judged by foreign matter and anthocyanin content) when compared with the commercially available samples purchased in two consecutive years (2004 and 2005).
Our results also suggested that the minimum amount of total anthocyanins for the Vimto variety (dark red), should be set at 1% while for the light red variety should be at 0.5%, while for the individual anthocyanidins the minimums should be 0.75% for D3S and 0.25% for C3S (Table 2). We propose these initial standards here to provide users and the international community with higher quality hibiscus products.
1 2 3 4 5 6 7 8 9 10 11 12 13 14 15 16 17 18 19 20 21 22 23 24 25 26 27 28 29 C4 31 32 33 34 35 36 37 38 39 40 41 42 43 44 45 46 47 48 49 50 51 52 53 54 55 C5
0.00
0.25
0.50
0.75
1.00
1.25
1.50
1.75 Delphinidin-3-sambubioside
Hibiscus samples
g/10
0g D
W (%
)
1 2 3 4 5 6 7 8 9 10 11 12 13 14 15 16 17 18 19 20 21 22 23 24 25 26 27 28 29 C4 31 32 33 34 35 36 37 38 39 40 41 42 43 44 45 46 47 48 49 50 51 52 53 54 55 C5
0.00
0.25
0.50
0.75 Cyanidin-3-sambubioside
Hibiscus samples
g/10
0g D
W (%
)
Figure 9. Individual anthocyanidins content of hibiscus samples (H. sabdariffa) (Delphinidin-3-sambubioside (top) and Cyanidin-3-sambubioside (bottom) in 2004 (white bars, 1 to 29) and 2005 (black bars, 31 to 55). C4 (commercial sample 2004), C5 (commercial sample 2005). Values are the mean of two samples + standard deviation.
4. Conclusions This work has demonstrated that the implementation of a quality control program and the application
of good practices in the production and processing of hibiscus calyces can be instrumental in obtaining
252
improved and higher quality products. In the second year, the application of good practices yielded not only darker calyces with higher amounts of anthocyanins, but also cleaner calyces (low foreign matter and sand) that were safer and healthier to consume. These good practices included trainings to local producers, high quality seed procurement, proper grading and sorting of hibiscus calyces during harvesting and processing and drying the calyces in raised beds to avoid contact with soil.
This quality control program can be easily implemented in producing countries since it utilizes relatively simple procedures and equipment that is usually available at research institutions. The colorimetric method adapted to estimate the total anthocyanins in hibiscus is an easy and inexpensive method to assess the anthocyanins content in hibiscus that can be used for quality control purposes. The HPLC method proposed here is simple and sensitive and allows a direct quantification of anthocyanins in dried hibiscus calyces, this is a choice method for accurately analying total and individual anthocyanidins, although, the proximate analysis of anthocyanins provide an affordable alternative, since the HPLC equipment, supplies and anthocyanindins standards are expensive to obtain.
Acknowledgements We thank the many Senegalese communities, and in particular the women’s growers associations
(4000+ members) involved in this study, who, with assistance from the Agribusiness in Sustainable Natural African Plant Products program (ASNAPP) and Association Education Sante (AES)-Senegal were among the first to actually begin to export organically certified and high quality hibiscus from Senegal. We thank the USAID for providing funds to support this work and our ASNAPP and PFID/NP programs, particularly for purchasing lab equipment to conduct QC procedures and proximate analysis described in this paper. Specifically, we thank Carol Wilson, USAID Cognizant Technical Officer of our Partnership for Food and Industry in Natural Products (PFID/NP), a university led program supported by the Office of Economic Growth, Agriculture and Trade (EGAT/AG) of the USAID (Contract Award No. AEG-A-00-04-00012-00) in support of their global economic development programs. We also thank Mr. Etienne Bessene and Christian Poiner for their assistance. We give particular thanks to one of our major private sector partners ADINA, USA and to Magette Wade for her leadership in our organic hibiscus and womens based community programs. Finally, we thank the New Use Agriculture and Natural Plant Products Program (http://aesop.rutgers.edu/~newuseag/) and the New Jersey Agricultural Experiment Station, Rutgers University. For further information, see www.pfidnp.org; www.asnapp.org.
253
References Anonymous, 1996. Food Chemical Codex. National Academy Press. Washington DC. Anonymous, 2004. Anthocyanin Content in Bilberry (Vaccinium myrtillus) by pH-Differential Spectrophotometry. Institute for Nutraceutical Advancement (INA) Method 116.000. Retrieve 2004-01-10 http://www.nsf.org/business/ina/bilberry.asp Anonymous, 2007. Herbal medicine market to top US$26 bil. in 2011. The China Post Wednesday, May 02, 2007. Taipei, Taiwan. Ali, B.H., Wabel, N.A., Blunden, G., 2005. Phytochemical, Pharmacological and Toxicological Aspects of Hibiscus sabdariffa L.: A Review. Phytotherapy. Research 19, 369–375. Bridle, P., Timberlake, C. F., 1997. Anthocyanins as natural food colors-selected aspects. Food Chemistry, 58(1-2): 103-109. D’Heureux-Calix, F., Badrie N., 2004. Consumer acceptance and physicochemical quality of processed red sorrel/roselle (Hibiscus sabdariffa L.) sauces from enzymatic extracted calyces. Food Service Technology. 4: 141–148. Gao X., Bjork L., Trajkovski V., Uggla M., 2000. Evaluation of antioxidant activities of rosehip ethanol extracts in different test systems. Journal of the Science of Food and Agriculture. 80: 2021-2027. Hirunpanich, V., Utaipat, A., Morales, N.P., Bunyapraphatsara N., Sato H, Herunsale A., Suthisisang, C., 2006. Hypocholesterolemic and antioxidant effects of aqueous extracts from the dried calyx of Hibiscus sabdariffa L. in hypercholesterolemic rats. J Ethnopharmacol 2006;103:252- 60. Lin, T.L., Lin, H.H.., Chen, C.C., Lin, M.C., Chou, M.C., Wang, C.J., 2007. Hibiscus sabdariffa extract reduces serum cholesterol in men and women. Nutrition Research 27: 140– 145 Liu, J.Y., Chen, C.C., Wang, W.H., Hsu J.D., Yang, M.Y., Wang, C.J., 2006. The protective effects of Hibiscus sabdariffa extract on CCl4-induced liver fibrosis in rats. Food and Chemical Toxicology 44: 336–343. Juliani, H. R., Koroch, A., Simon, J.E., Hitimana, N., Daka, A., Ranarivelo, L., Langenhoven, P., 2006a. Quality of Geranium Oils (Pelargonium Species): Case Studies in Southern and Eastern Africa. J. Essent. Oil Res., 18, 116-121 (Special Edition 2006) Juliani, H.R., Wang, M., Moharram, H., Asante-Dartey, J., Acquaye, D., Koroch, A.R., Simon, J.E., 2006b. Intraspecific Variation in Quality Control Parameters, Polyphenol Profile, and Antioxidant Activity in Wild Populations of Lippia multiflora from Ghana. In: Wang, M., S. Shengmin, L.S. Hwang and C.T. Ho (eds.). Herbs: Challenges in Chemistry and Biology. American Chemical Society Symposium Series 925. American Chemical Society. Washington DC. USA. Pp 126-142. Odigie I.P., Ettarh, R.R., Adigun, S.A., 2003. Chronic administration of aqueous extract of Hibiscus sabdariffa attenuates hypertension and reverses cardiac hypertrophy in 2K-1C hypertensive rats. Journal of Ethnopharmacology 86: 181–185 Phippen, W.B. and J.E. Simon. 1998. Anthocyanins in Basil (Ocimum basilicum L.). J. Agric. Food Chemistry 46(5):1734-1738. Plotto, A, 1999. Post-Production Management for Improved Market Access for Herbs and Spices – Hibiscus. In: François Mazaud, Alexandra Röttger, Katja Steffel, Larissa D'Aquilio (eds.). Compendium on Post-harvest Operations. Food and Agriculture Organization of the United Nations (FAO). Rome. Italy Retrieve 2007-08-29: http://www.fao.org/inpho/content/compend/allintro.htm
254
Re R, Pellegrini N., Proteggente A., Pannala A., Yang M., Rice-Evans C., 1999. Antioxidant activity applying an improved ABTS radical cation decolorization assay. Free Radical Biology and Medicine. 26(9/10):1231-1237. Simon, J.E., Jefthas, E., P. Longenhaven, M. Smith, E. Renaud, R. Juliani, M. Wang, N. Zimba, D. Acquaye, C. Park, I. Raskin and P. Tannous. 2002. Challenges and Tribulations in the Commercialization of New Crops: Aromatic and Medicinal Crops. Korean J. Medicinal Crop Sci. 10(4): 303-313. Simon, J.E. 1999. Domestication and production considerations in quality control of botanicals, pp. 133-137. In: D. Eskinazi, M. Blumenthal, N. Farnsworth, and C.W. Riggins (eds). Botanical Medicine. Efficacy, Quality Assurance, and Regulation. Mary Ann Liebert, Inc. Larchmont, NY. Tadmor, Y., E. Jefthas, J. Goliath, M. Smith, P. Langenhoven, D. Acquaye, R. Juliani, W. Letchamo, E. Renaud, N. Zimba, I. Raskin, J. Brown, and J.E. Simon. 2002. Quality Assurance and Quality Control for African Natural Plant Products from the Ground Up, pp. 93-99. In: Janick, J. and A. Whipkey (eds). Trends in New Crops and New Uses. Amer. Soc. Hort. Sci. Press, Alexandria, VA. Wang, C.-J., Wang, J.M., Lin, W.L., Chu, C.Y., Chou, F.P., Tseng, T.H., 2000. Protective Effect of Hibiscus Anthocyanins Against tert-butyl Hydroperoxide-induced Hepatic Toxicity in Rats. Food and Chemical Toxicology 38:411-416. Wildman, R.C., 2006. Handbook of Nutraceuticals and Functional Foods. CRC Press. FL. USA. Wu, Q.L., Wang, M.F., Simon, J.E., 2003. Determination of proanthocyaninidins in grape products by liquid chromatography/mass spectrometric determination detection under low collision energy. Analytical Chemistry 75, 2440-2444
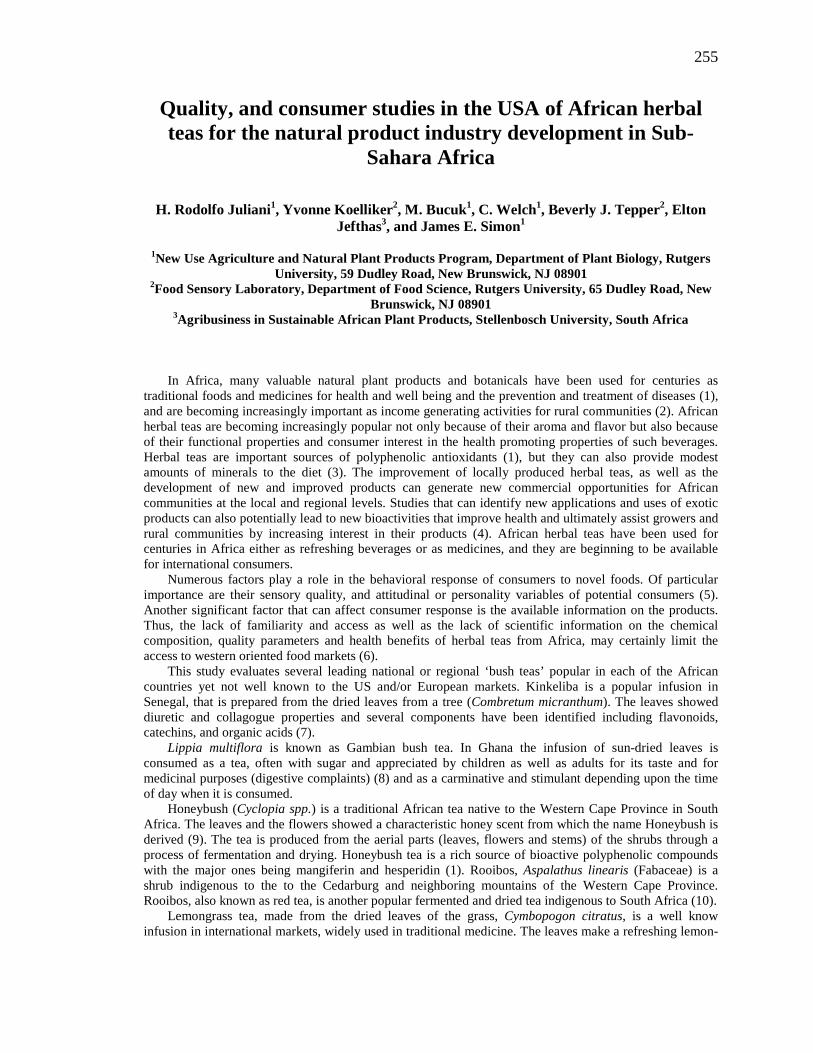
255
Quality, and consumer studies in the USA of African herbal teas for the natural product industry development in Sub-
Sahara Africa
H. Rodolfo Juliani1, Yvonne Koelliker2, M. Bucuk1, C. Welch1, Beverly J. Tepper2, Elton Jefthas3, and James E. Simon1
1New Use Agriculture and Natural Plant Products Program, Department of Plant Biology, Rutgers University, 59 Dudley Road, New Brunswick, NJ 08901
2Food Sensory Laboratory, Department of Food Science, Rutgers University, 65 Dudley Road, New Brunswick, NJ 08901
3Agribusiness in Sustainable African Plant Products, Stellenbosch University, South Africa In Africa, many valuable natural plant products and botanicals have been used for centuries as
traditional foods and medicines for health and well being and the prevention and treatment of diseases (1), and are becoming increasingly important as income generating activities for rural communities (2). African herbal teas are becoming increasingly popular not only because of their aroma and flavor but also because of their functional properties and consumer interest in the health promoting properties of such beverages. Herbal teas are important sources of polyphenolic antioxidants (1), but they can also provide modest amounts of minerals to the diet (3). The improvement of locally produced herbal teas, as well as the development of new and improved products can generate new commercial opportunities for African communities at the local and regional levels. Studies that can identify new applications and uses of exotic products can also potentially lead to new bioactivities that improve health and ultimately assist growers and rural communities by increasing interest in their products (4). African herbal teas have been used for centuries in Africa either as refreshing beverages or as medicines, and they are beginning to be available for international consumers.
Numerous factors play a role in the behavioral response of consumers to novel foods. Of particular importance are their sensory quality, and attitudinal or personality variables of potential consumers (5). Another significant factor that can affect consumer response is the available information on the products. Thus, the lack of familiarity and access as well as the lack of scientific information on the chemical composition, quality parameters and health benefits of herbal teas from Africa, may certainly limit the access to western oriented food markets (6).
This study evaluates several leading national or regional ‘bush teas’ popular in each of the African countries yet not well known to the US and/or European markets. Kinkeliba is a popular infusion in Senegal, that is prepared from the dried leaves from a tree (Combretum micranthum). The leaves showed diuretic and collagogue properties and several components have been identified including flavonoids, catechins, and organic acids (7).
Lippia multiflora is known as Gambian bush tea. In Ghana the infusion of sun-dried leaves is consumed as a tea, often with sugar and appreciated by children as well as adults for its taste and for medicinal purposes (digestive complaints) (8) and as a carminative and stimulant depending upon the time of day when it is consumed.
Honeybush (Cyclopia spp.) is a traditional African tea native to the Western Cape Province in South Africa. The leaves and the flowers showed a characteristic honey scent from which the name Honeybush is derived (9). The tea is produced from the aerial parts (leaves, flowers and stems) of the shrubs through a process of fermentation and drying. Honeybush tea is a rich source of bioactive polyphenolic compounds with the major ones being mangiferin and hesperidin (1). Rooibos, Aspalathus linearis (Fabaceae) is a shrub indigenous to the to the Cedarburg and neighboring mountains of the Western Cape Province. Rooibos, also known as red tea, is another popular fermented and dried tea indigenous to South Africa (10).
Lemongrass tea, made from the dried leaves of the grass, Cymbopogon citratus, is a well know infusion in international markets, widely used in traditional medicine. The leaves make a refreshing lemon-
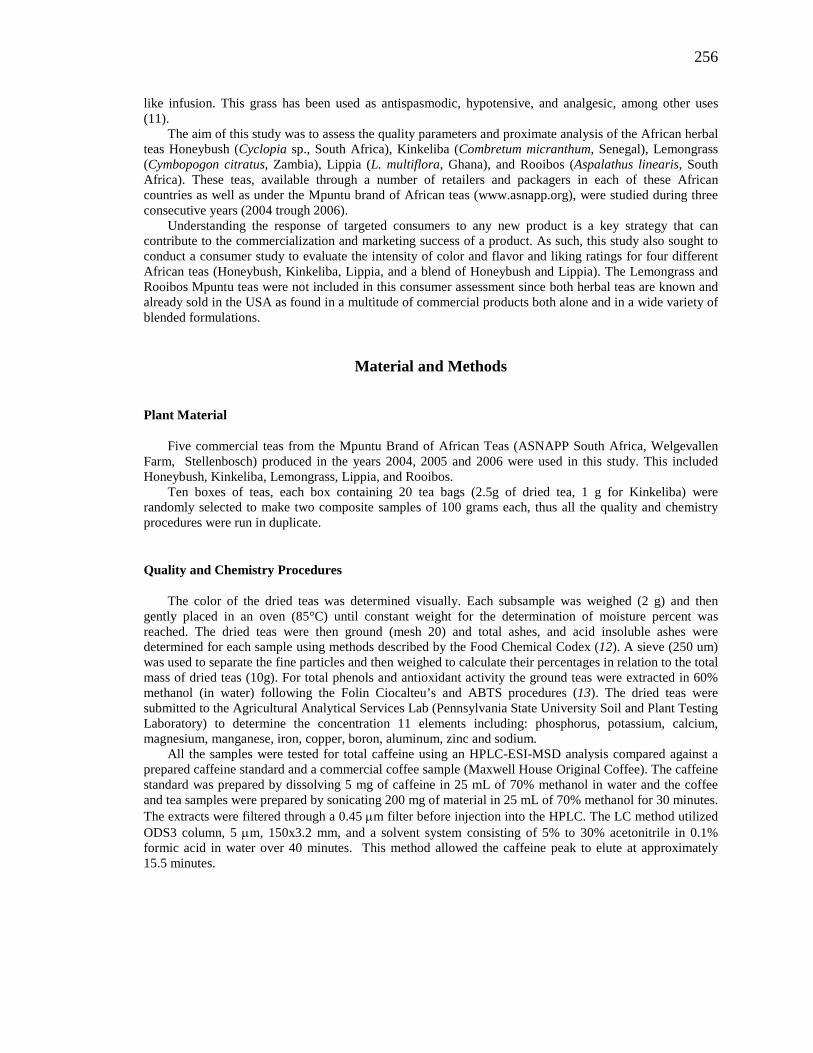
256
like infusion. This grass has been used as antispasmodic, hypotensive, and analgesic, among other uses (11).
The aim of this study was to assess the quality parameters and proximate analysis of the African herbal teas Honeybush (Cyclopia sp., South Africa), Kinkeliba (Combretum micranthum, Senegal), Lemongrass (Cymbopogon citratus, Zambia), Lippia (L. multiflora, Ghana), and Rooibos (Aspalathus linearis, South Africa). These teas, available through a number of retailers and packagers in each of these African countries as well as under the Mpuntu brand of African teas (www.asnapp.org), were studied during three consecutive years (2004 trough 2006).
Understanding the response of targeted consumers to any new product is a key strategy that can contribute to the commercialization and marketing success of a product. As such, this study also sought to conduct a consumer study to evaluate the intensity of color and flavor and liking ratings for four different African teas (Honeybush, Kinkeliba, Lippia, and a blend of Honeybush and Lippia). The Lemongrass and Rooibos Mpuntu teas were not included in this consumer assessment since both herbal teas are known and already sold in the USA as found in a multitude of commercial products both alone and in a wide variety of blended formulations.
Material and Methods
Plant Material
Five commercial teas from the Mpuntu Brand of African Teas (ASNAPP South Africa, Welgevallen Farm, Stellenbosch) produced in the years 2004, 2005 and 2006 were used in this study. This included Honeybush, Kinkeliba, Lemongrass, Lippia, and Rooibos.
Ten boxes of teas, each box containing 20 tea bags (2.5g of dried tea, 1 g for Kinkeliba) were randomly selected to make two composite samples of 100 grams each, thus all the quality and chemistry procedures were run in duplicate.
Quality and Chemistry Procedures
The color of the dried teas was determined visually. Each subsample was weighed (2 g) and then gently placed in an oven (85°C) until constant weight for the determination of moisture percent was reached. The dried teas were then ground (mesh 20) and total ashes, and acid insoluble ashes were determined for each sample using methods described by the Food Chemical Codex (12). A sieve (250 um) was used to separate the fine particles and then weighed to calculate their percentages in relation to the total mass of dried teas (10g). For total phenols and antioxidant activity the ground teas were extracted in 60% methanol (in water) following the Folin Ciocalteu’s and ABTS procedures (13). The dried teas were submitted to the Agricultural Analytical Services Lab (Pennsylvania State University Soil and Plant Testing Laboratory) to determine the concentration 11 elements including: phosphorus, potassium, calcium, magnesium, manganese, iron, copper, boron, aluminum, zinc and sodium.
All the samples were tested for total caffeine using an HPLC-ESI-MSD analysis compared against a prepared caffeine standard and a commercial coffee sample (Maxwell House Original Coffee). The caffeine standard was prepared by dissolving 5 mg of caffeine in 25 mL of 70% methanol in water and the coffee and tea samples were prepared by sonicating 200 mg of material in 25 mL of 70% methanol for 30 minutes. The extracts were filtered through a 0.45 µm filter before injection into the HPLC. The LC method utilized ODS3 column, 5 µm, 150x3.2 mm, and a solvent system consisting of 5% to 30% acetonitrile in 0.1% formic acid in water over 40 minutes. This method allowed the caffeine peak to elute at approximately 15.5 minutes.
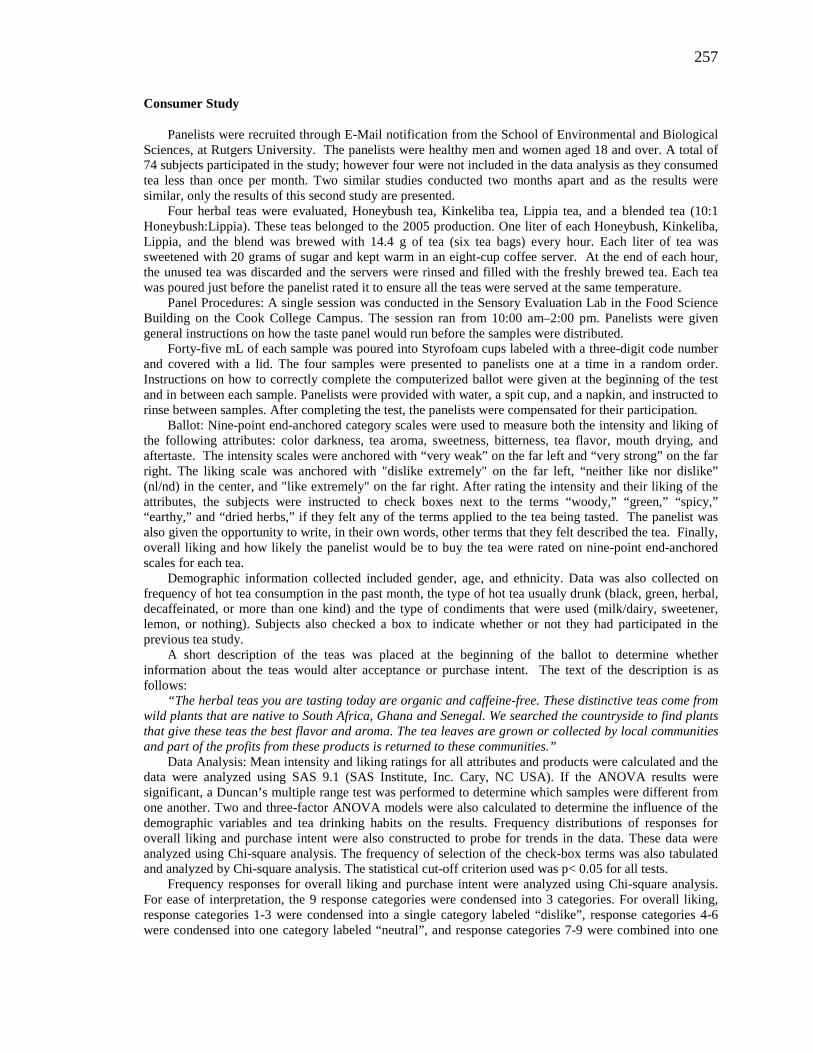
257
Consumer Study
Panelists were recruited through E-Mail notification from the School of Environmental and Biological Sciences, at Rutgers University. The panelists were healthy men and women aged 18 and over. A total of 74 subjects participated in the study; however four were not included in the data analysis as they consumed tea less than once per month. Two similar studies conducted two months apart and as the results were similar, only the results of this second study are presented.
Four herbal teas were evaluated, Honeybush tea, Kinkeliba tea, Lippia tea, and a blended tea (10:1 Honeybush:Lippia). These teas belonged to the 2005 production. One liter of each Honeybush, Kinkeliba, Lippia, and the blend was brewed with 14.4 g of tea (six tea bags) every hour. Each liter of tea was sweetened with 20 grams of sugar and kept warm in an eight-cup coffee server. At the end of each hour, the unused tea was discarded and the servers were rinsed and filled with the freshly brewed tea. Each tea was poured just before the panelist rated it to ensure all the teas were served at the same temperature.
Panel Procedures: A single session was conducted in the Sensory Evaluation Lab in the Food Science Building on the Cook College Campus. The session ran from 10:00 am–2:00 pm. Panelists were given general instructions on how the taste panel would run before the samples were distributed.
Forty-five mL of each sample was poured into Styrofoam cups labeled with a three-digit code number and covered with a lid. The four samples were presented to panelists one at a time in a random order. Instructions on how to correctly complete the computerized ballot were given at the beginning of the test and in between each sample. Panelists were provided with water, a spit cup, and a napkin, and instructed to rinse between samples. After completing the test, the panelists were compensated for their participation.
Ballot: Nine-point end-anchored category scales were used to measure both the intensity and liking of the following attributes: color darkness, tea aroma, sweetness, bitterness, tea flavor, mouth drying, and aftertaste. The intensity scales were anchored with “very weak” on the far left and “very strong” on the far right. The liking scale was anchored with "dislike extremely" on the far left, “neither like nor dislike” (nl/nd) in the center, and "like extremely" on the far right. After rating the intensity and their liking of the attributes, the subjects were instructed to check boxes next to the terms “woody,” “green,” “spicy,” “earthy,” and “dried herbs,” if they felt any of the terms applied to the tea being tasted. The panelist was also given the opportunity to write, in their own words, other terms that they felt described the tea. Finally, overall liking and how likely the panelist would be to buy the tea were rated on nine-point end-anchored scales for each tea.
Demographic information collected included gender, age, and ethnicity. Data was also collected on frequency of hot tea consumption in the past month, the type of hot tea usually drunk (black, green, herbal, decaffeinated, or more than one kind) and the type of condiments that were used (milk/dairy, sweetener, lemon, or nothing). Subjects also checked a box to indicate whether or not they had participated in the previous tea study.
A short description of the teas was placed at the beginning of the ballot to determine whether information about the teas would alter acceptance or purchase intent. The text of the description is as follows:
“The herbal teas you are tasting today are organic and caffeine-free. These distinctive teas come from wild plants that are native to South Africa, Ghana and Senegal. We searched the countryside to find plants that give these teas the best flavor and aroma. The tea leaves are grown or collected by local communities and part of the profits from these products is returned to these communities.”
Data Analysis: Mean intensity and liking ratings for all attributes and products were calculated and the data were analyzed using SAS 9.1 (SAS Institute, Inc. Cary, NC USA). If the ANOVA results were significant, a Duncan’s multiple range test was performed to determine which samples were different from one another. Two and three-factor ANOVA models were also calculated to determine the influence of the demographic variables and tea drinking habits on the results. Frequency distributions of responses for overall liking and purchase intent were also constructed to probe for trends in the data. These data were analyzed using Chi-square analysis. The frequency of selection of the check-box terms was also tabulated and analyzed by Chi-square analysis. The statistical cut-off criterion used was p< 0.05 for all tests.
Frequency responses for overall liking and purchase intent were analyzed using Chi-square analysis. For ease of interpretation, the 9 response categories were condensed into 3 categories. For overall liking, response categories 1-3 were condensed into a single category labeled “dislike”, response categories 4-6 were condensed into one category labeled “neutral”, and response categories 7-9 were combined into one
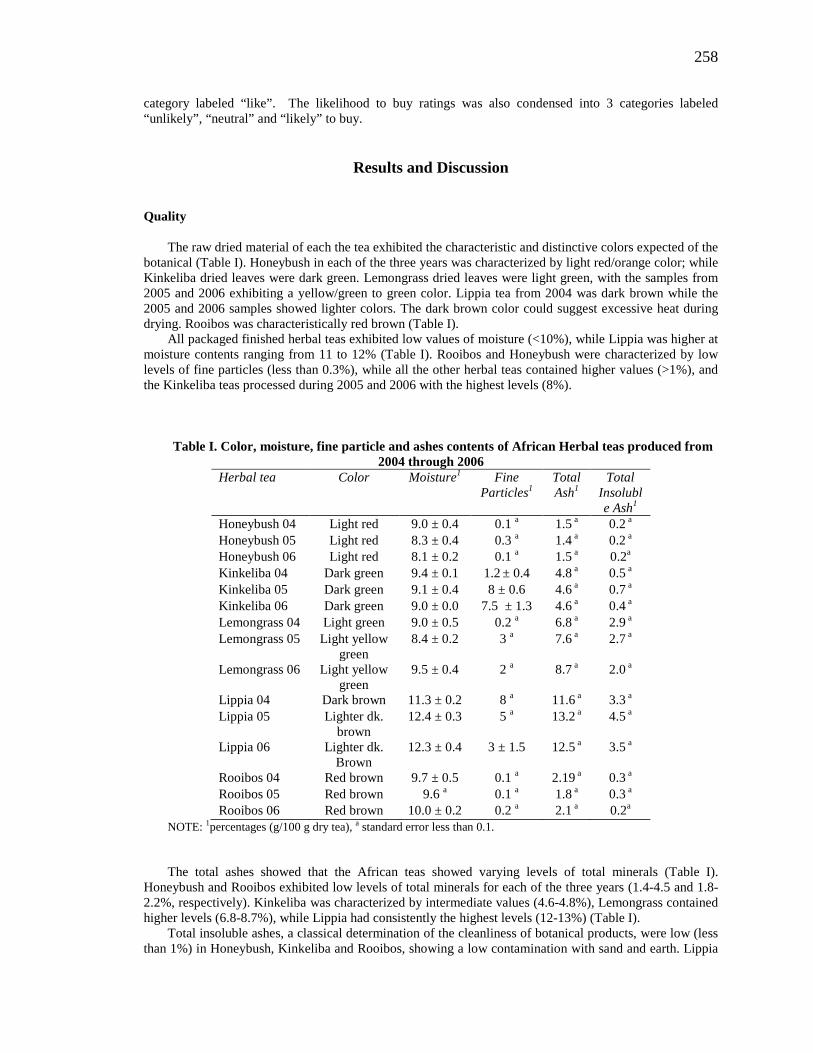
258
category labeled “like”. The likelihood to buy ratings was also condensed into 3 categories labeled “unlikely”, “neutral” and “likely” to buy.
Results and Discussion
Quality
The raw dried material of each the tea exhibited the characteristic and distinctive colors expected of the botanical (Table I). Honeybush in each of the three years was characterized by light red/orange color; while Kinkeliba dried leaves were dark green. Lemongrass dried leaves were light green, with the samples from 2005 and 2006 exhibiting a yellow/green to green color. Lippia tea from 2004 was dark brown while the 2005 and 2006 samples showed lighter colors. The dark brown color could suggest excessive heat during drying. Rooibos was characteristically red brown (Table I).
All packaged finished herbal teas exhibited low values of moisture (<10%), while Lippia was higher at moisture contents ranging from 11 to 12% (Table I). Rooibos and Honeybush were characterized by low levels of fine particles (less than 0.3%), while all the other herbal teas contained higher values (>1%), and the Kinkeliba teas processed during 2005 and 2006 with the highest levels (8%).
Table I. Color, moisture, fine particle and ashes contents of African Herbal teas produced from
2004 through 2006 Herbal tea Color Moisture1 Fine
Particles1 Total Ash1
Total Insoluble Ash1
Honeybush 04 Light red 9.0 ± 0.4 0.1 a 1.5 a 0.2 a Honeybush 05 Light red 8.3 ± 0.4 0.3 a 1.4 a 0.2 a Honeybush 06 Light red 8.1 ± 0.2 0.1 a 1.5 a 0.2a Kinkeliba 04 Dark green 9.4 ± 0.1 1.2 ± 0.4 4.8 a 0.5 a Kinkeliba 05 Dark green 9.1 ± 0.4 8 ± 0.6 4.6 a 0.7 a Kinkeliba 06 Dark green 9.0 ± 0.0 7.5 ± 1.3 4.6 a 0.4 a Lemongrass 04 Light green 9.0 ± 0.5 0.2 a 6.8 a 2.9 a Lemongrass 05 Light yellow
green 8.4 ± 0.2 3 a 7.6 a 2.7 a
Lemongrass 06 Light yellow green
9.5 ± 0.4 2 a 8.7 a 2.0 a
Lippia 04 Dark brown 11.3 ± 0.2 8 a 11.6 a 3.3 a Lippia 05 Lighter dk.
brown 12.4 ± 0.3 5 a 13.2 a 4.5 a
Lippia 06 Lighter dk. Brown
12.3 ± 0.4 3 ± 1.5 12.5 a 3.5 a
Rooibos 04 Red brown 9.7 ± 0.5 0.1 a 2.19 a 0.3 a Rooibos 05 Red brown 9.6 a 0.1 a 1.8 a 0.3 a Rooibos 06 Red brown 10.0 ± 0.2 0.2 a 2.1 a 0.2a
NOTE: 1percentages (g/100 g dry tea), a standard error less than 0.1. The total ashes showed that the African teas showed varying levels of total minerals (Table I).
Honeybush and Rooibos exhibited low levels of total minerals for each of the three years (1.4-4.5 and 1.8-2.2%, respectively). Kinkeliba was characterized by intermediate values (4.6-4.8%), Lemongrass contained higher levels (6.8-8.7%), while Lippia had consistently the highest levels (12-13%) (Table I).
Total insoluble ashes, a classical determination of the cleanliness of botanical products, were low (less than 1%) in Honeybush, Kinkeliba and Rooibos, showing a low contamination with sand and earth. Lippia
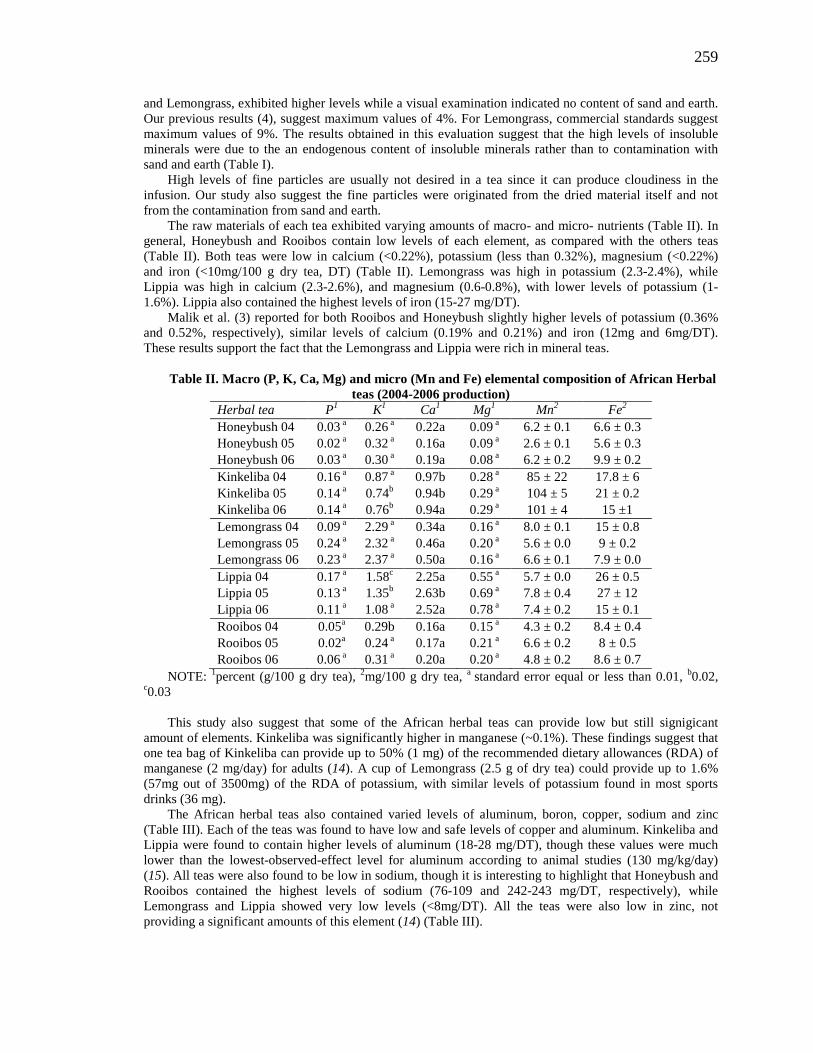
259
and Lemongrass, exhibited higher levels while a visual examination indicated no content of sand and earth. Our previous results (4), suggest maximum values of 4%. For Lemongrass, commercial standards suggest maximum values of 9%. The results obtained in this evaluation suggest that the high levels of insoluble minerals were due to the an endogenous content of insoluble minerals rather than to contamination with sand and earth (Table I).
High levels of fine particles are usually not desired in a tea since it can produce cloudiness in the infusion. Our study also suggest the fine particles were originated from the dried material itself and not from the contamination from sand and earth.
The raw materials of each tea exhibited varying amounts of macro- and micro- nutrients (Table II). In general, Honeybush and Rooibos contain low levels of each element, as compared with the others teas (Table II). Both teas were low in calcium (<0.22%), potassium (less than 0.32%), magnesium (<0.22%) and iron (<10mg/100 g dry tea, DT) (Table II). Lemongrass was high in potassium (2.3-2.4%), while Lippia was high in calcium (2.3-2.6%), and magnesium (0.6-0.8%), with lower levels of potassium (1-1.6%). Lippia also contained the highest levels of iron (15-27 mg/DT).
Malik et al. (3) reported for both Rooibos and Honeybush slightly higher levels of potassium (0.36% and 0.52%, respectively), similar levels of calcium (0.19% and 0.21%) and iron (12mg and 6mg/DT). These results support the fact that the Lemongrass and Lippia were rich in mineral teas.
Table II. Macro (P, K, Ca, Mg) and micro (Mn and Fe) elemental composition of African Herbal
teas (2004-2006 production) Herbal tea P1 K1 Ca1 Mg1 Mn2 Fe2 Honeybush 04 0.03 a 0.26 a 0.22a 0.09 a 6.2 ± 0.1 6.6 ± 0.3 Honeybush 05 0.02 a 0.32 a 0.16a 0.09 a 2.6 ± 0.1 5.6 ± 0.3 Honeybush 06 0.03 a 0.30 a 0.19a 0.08 a 6.2 ± 0.2 9.9 ± 0.2 Kinkeliba 04 0.16 a 0.87 a 0.97b 0.28 a 85 ± 22 17.8 ± 6 Kinkeliba 05 0.14 a 0.74b 0.94b 0.29 a 104 ± 5 21 ± 0.2 Kinkeliba 06 0.14 a 0.76b 0.94a 0.29 a 101 ± 4 15 ±1 Lemongrass 04 0.09 a 2.29 a 0.34a 0.16 a 8.0 ± 0.1 15 ± 0.8 Lemongrass 05 0.24 a 2.32 a 0.46a 0.20 a 5.6 ± 0.0 9 ± 0.2 Lemongrass 06 0.23 a 2.37 a 0.50a 0.16 a 6.6 ± 0.1 7.9 ± 0.0 Lippia 04 0.17 a 1.58c 2.25a 0.55 a 5.7 ± 0.0 26 ± 0.5 Lippia 05 0.13 a 1.35b 2.63b 0.69 a 7.8 ± 0.4 27 ± 12 Lippia 06 0.11 a 1.08 a 2.52a 0.78 a 7.4 ± 0.2 15 ± 0.1 Rooibos 04 0.05a 0.29b 0.16a 0.15 a 4.3 ± 0.2 8.4 ± 0.4 Rooibos 05 0.02a 0.24 a 0.17a 0.21 a 6.6 ± 0.2 8 ± 0.5 Rooibos 06 0.06 a 0.31 a 0.20a 0.20 a 4.8 ± 0.2 8.6 ± 0.7
NOTE: 1percent (g/100 g dry tea), 2mg/100 g dry tea, a standard error equal or less than 0.01, b0.02, c0.03
This study also suggest that some of the African herbal teas can provide low but still signigicant
amount of elements. Kinkeliba was significantly higher in manganese (~0.1%). These findings suggest that one tea bag of Kinkeliba can provide up to 50% (1 mg) of the recommended dietary allowances (RDA) of manganese (2 mg/day) for adults (14). A cup of Lemongrass (2.5 g of dry tea) could provide up to 1.6% (57mg out of 3500mg) of the RDA of potassium, with similar levels of potassium found in most sports drinks (36 mg).
The African herbal teas also contained varied levels of aluminum, boron, copper, sodium and zinc (Table III). Each of the teas was found to have low and safe levels of copper and aluminum. Kinkeliba and Lippia were found to contain higher levels of aluminum (18-28 mg/DT), though these values were much lower than the lowest-observed-effect level for aluminum according to animal studies (130 mg/kg/day) (15). All teas were also found to be low in sodium, though it is interesting to highlight that Honeybush and Rooibos contained the highest levels of sodium (76-109 and 242-243 mg/DT, respectively), while Lemongrass and Lippia showed very low levels (<8mg/DT). All the teas were also low in zinc, not providing a significant amounts of this element (14) (Table III).
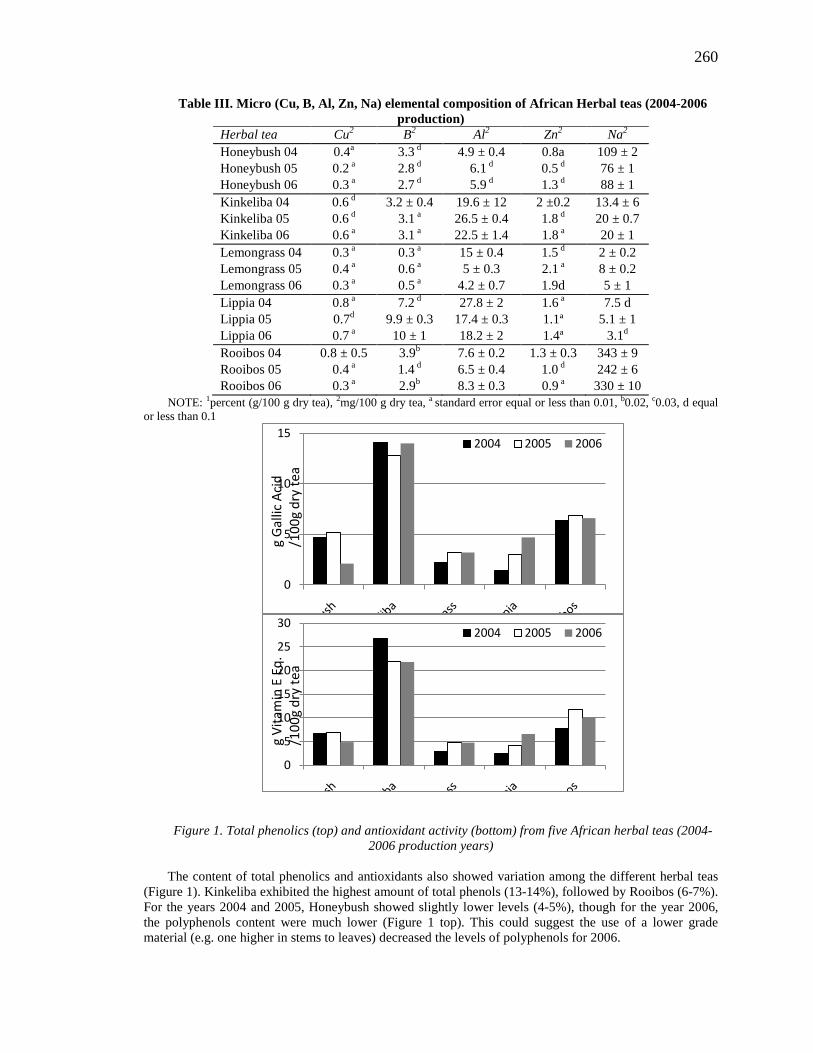
260
Table III. Micro (Cu, B, Al, Zn, Na) elemental composition of African Herbal teas (2004-2006 production)
Herbal tea Cu2 B2 Al2 Zn2 Na2 Honeybush 04 0.4a 3.3 d 4.9 ± 0.4 0.8a 109 ± 2 Honeybush 05 0.2 a 2.8 d 6.1 d 0.5 d 76 ± 1 Honeybush 06 0.3 a 2.7 d 5.9 d 1.3 d 88 ± 1 Kinkeliba 04 0.6 d 3.2 ± 0.4 19.6 ± 12 2 ±0.2 13.4 ± 6 Kinkeliba 05 0.6 d 3.1 a 26.5 ± 0.4 1.8 d 20 ± 0.7 Kinkeliba 06 0.6 a 3.1 a 22.5 ± 1.4 1.8 a 20 ± 1 Lemongrass 04 0.3 a 0.3 a 15 ± 0.4 1.5 d 2 ± 0.2 Lemongrass 05 0.4 a 0.6 a 5 ± 0.3 2.1 a 8 ± 0.2 Lemongrass 06 0.3 a 0.5 a 4.2 ± 0.7 1.9d 5 ± 1 Lippia 04 0.8 a 7.2 d 27.8 ± 2 1.6 a 7.5 d Lippia 05 0.7d 9.9 ± 0.3 17.4 ± 0.3 1.1ª 5.1 ± 1 Lippia 06 0.7 a 10 ± 1 18.2 ± 2 1.4ª 3.1d Rooibos 04 0.8 ± 0.5 3.9b 7.6 ± 0.2 1.3 ± 0.3 343 ± 9 Rooibos 05 0.4 a 1.4 d 6.5 ± 0.4 1.0 d 242 ± 6 Rooibos 06 0.3 a 2.9b 8.3 ± 0.3 0.9 a 330 ± 10
NOTE: 1percent (g/100 g dry tea), 2mg/100 g dry tea, a standard error equal or less than 0.01, b0.02, c0.03, d equal or less than 0.1
Figure 1. Total phenolics (top) and antioxidant activity (bottom) from five African herbal teas (2004-
2006 production years)
The content of total phenolics and antioxidants also showed variation among the different herbal teas (Figure 1). Kinkeliba exhibited the highest amount of total phenols (13-14%), followed by Rooibos (6-7%). For the years 2004 and 2005, Honeybush showed slightly lower levels (4-5%), though for the year 2006, the polyphenols content were much lower (Figure 1 top). This could suggest the use of a lower grade material (e.g. one higher in stems to leaves) decreased the levels of polyphenols for 2006.
0
5
10
152004 2005 2006
g G
allic
Aci
d /1
00g
dry
tea
0
5
10
15
20
25
302004 2005 2006
g Vi
tam
in E
Eq.
/1
00g
dry
tea
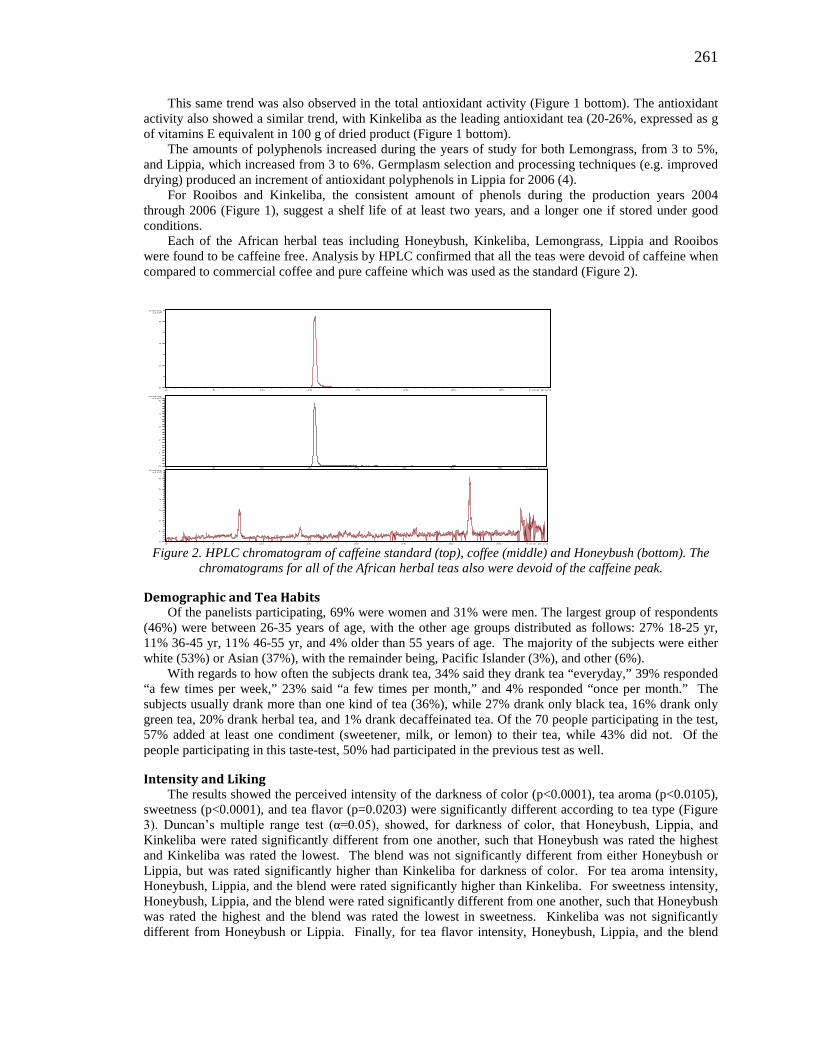
261
This same trend was also observed in the total antioxidant activity (Figure 1 bottom). The antioxidant activity also showed a similar trend, with Kinkeliba as the leading antioxidant tea (20-26%, expressed as g of vitamins E equivalent in 100 g of dried product (Figure 1 bottom).
The amounts of polyphenols increased during the years of study for both Lemongrass, from 3 to 5%, and Lippia, which increased from 3 to 6%. Germplasm selection and processing techniques (e.g. improved drying) produced an increment of antioxidant polyphenols in Lippia for 2006 (4).
For Rooibos and Kinkeliba, the consistent amount of phenols during the production years 2004 through 2006 (Figure 1), suggest a shelf life of at least two years, and a longer one if stored under good conditions.
Each of the African herbal teas including Honeybush, Kinkeliba, Lemongrass, Lippia and Rooibos were found to be caffeine free. Analysis by HPLC confirmed that all the teas were devoid of caffeine when compared to commercial coffee and pure caffeine which was used as the standard (Figure 2).
Figure 2. HPLC chromatogram of caffeine standard (top), coffee (middle) and Honeybush (bottom). The
chromatograms for all of the African herbal teas also were devoid of the caffeine peak.
Demographic and Tea Habits Of the panelists participating, 69% were women and 31% were men. The largest group of respondents
(46%) were between 26-35 years of age, with the other age groups distributed as follows: 27% 18-25 yr, 11% 36-45 yr, 11% 46-55 yr, and 4% older than 55 years of age. The majority of the subjects were either white (53%) or Asian (37%), with the remainder being, Pacific Islander (3%), and other (6%).
With regards to how often the subjects drank tea, 34% said they drank tea “everyday,” 39% responded “a few times per week,” 23% said “a few times per month,” and 4% responded “once per month.” The subjects usually drank more than one kind of tea (36%), while 27% drank only black tea, 16% drank only green tea, 20% drank herbal tea, and 1% drank decaffeinated tea. Of the 70 people participating in the test, 57% added at least one condiment (sweetener, milk, or lemon) to their tea, while 43% did not. Of the people participating in this taste-test, 50% had participated in the previous test as well.
Intensity and Liking The results showed the perceived intensity of the darkness of color (p<0.0001), tea aroma (p<0.0105),
sweetness (p<0.0001), and tea flavor (p=0.0203) were significantly different according to tea type (Figure 3). Duncan’s multiple range test (α=0.05), showed, for darkness of color, that Honeybush, Lippia, and Kinkeliba were rated significantly different from one another, such that Honeybush was rated the highest and Kinkeliba was rated the lowest. The blend was not significantly different from either Honeybush or Lippia, but was rated significantly higher than Kinkeliba for darkness of color. For tea aroma intensity, Honeybush, Lippia, and the blend were rated significantly higher than Kinkeliba. For sweetness intensity, Honeybush, Lippia, and the blend were rated significantly different from one another, such that Honeybush was rated the highest and the blend was rated the lowest in sweetness. Kinkeliba was not significantly different from Honeybush or Lippia. Finally, for tea flavor intensity, Honeybush, Lippia, and the blend
0 5 10 15 20 25 30 35 Time [min]0
2
4
6
6x10Intens.
0 5 10 15 20 25 30 35 Time [min]0
1
2
3
4
5
6x10Intens.
0 5 10 15 20 25 30 35 Time [min]0
1
2
3
4
5
6
4x10Intens.
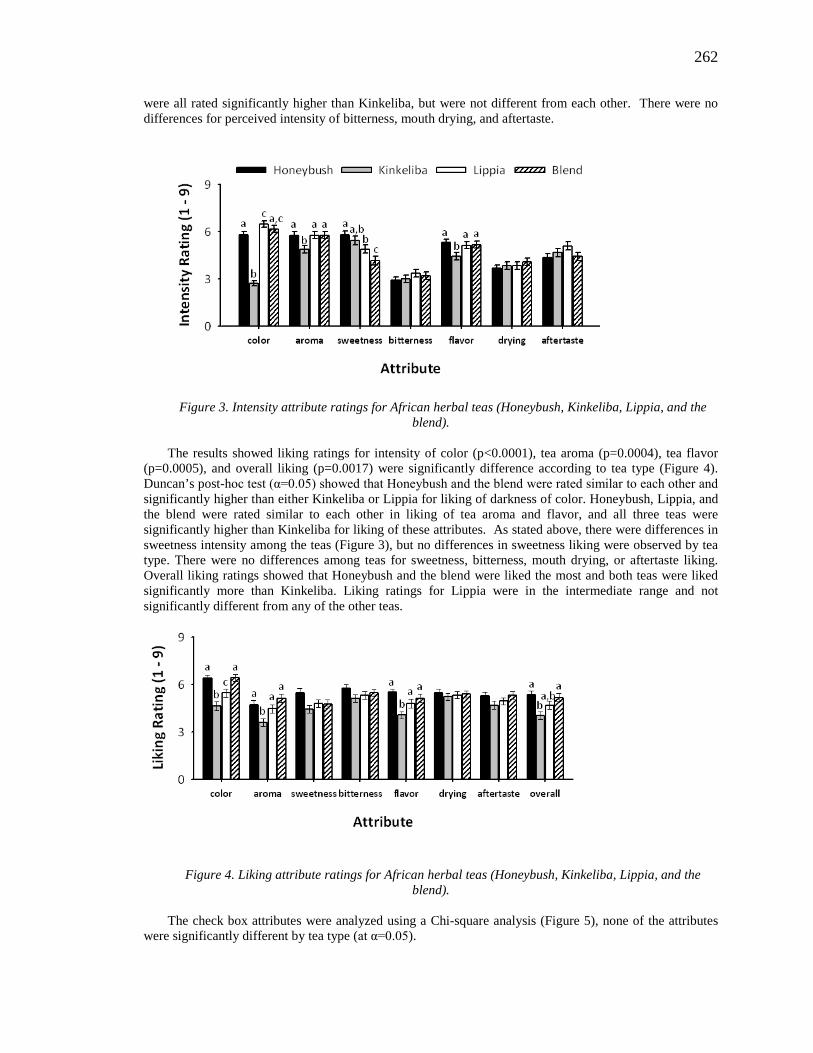
262
were all rated significantly higher than Kinkeliba, but were not different from each other. There were no differences for perceived intensity of bitterness, mouth drying, and aftertaste.
Figure 3. Intensity attribute ratings for African herbal teas (Honeybush, Kinkeliba, Lippia, and the blend).
The results showed liking ratings for intensity of color (p<0.0001), tea aroma (p=0.0004), tea flavor
(p=0.0005), and overall liking (p=0.0017) were significantly difference according to tea type (Figure 4). Duncan’s post-hoc test (α=0.05) showed that Honeybush and the blend were rated similar to each other and significantly higher than either Kinkeliba or Lippia for liking of darkness of color. Honeybush, Lippia, and the blend were rated similar to each other in liking of tea aroma and flavor, and all three teas were significantly higher than Kinkeliba for liking of these attributes. As stated above, there were differences in sweetness intensity among the teas (Figure 3), but no differences in sweetness liking were observed by tea type. There were no differences among teas for sweetness, bitterness, mouth drying, or aftertaste liking. Overall liking ratings showed that Honeybush and the blend were liked the most and both teas were liked significantly more than Kinkeliba. Liking ratings for Lippia were in the intermediate range and not significantly different from any of the other teas.
Figure 4. Liking attribute ratings for African herbal teas (Honeybush, Kinkeliba, Lippia, and the blend).
The check box attributes were analyzed using a Chi-square analysis (Figure 5), none of the attributes
were significantly different by tea type (at α=0.05).
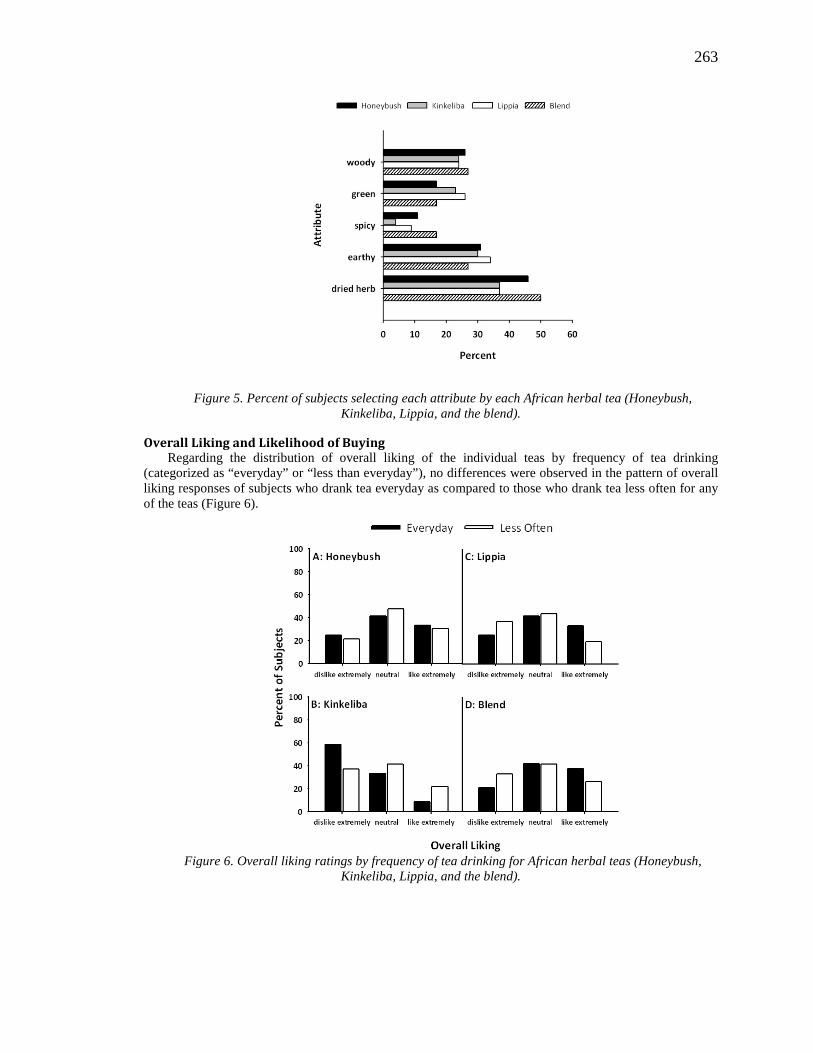
263
Figure 5. Percent of subjects selecting each attribute by each African herbal tea (Honeybush, Kinkeliba, Lippia, and the blend).
Overall Liking and Likelihood of Buying Regarding the distribution of overall liking of the individual teas by frequency of tea drinking
(categorized as “everyday” or “less than everyday”), no differences were observed in the pattern of overall liking responses of subjects who drank tea everyday as compared to those who drank tea less often for any of the teas (Figure 6).
Figure 6. Overall liking ratings by frequency of tea drinking for African herbal teas (Honeybush,
Kinkeliba, Lippia, and the blend).
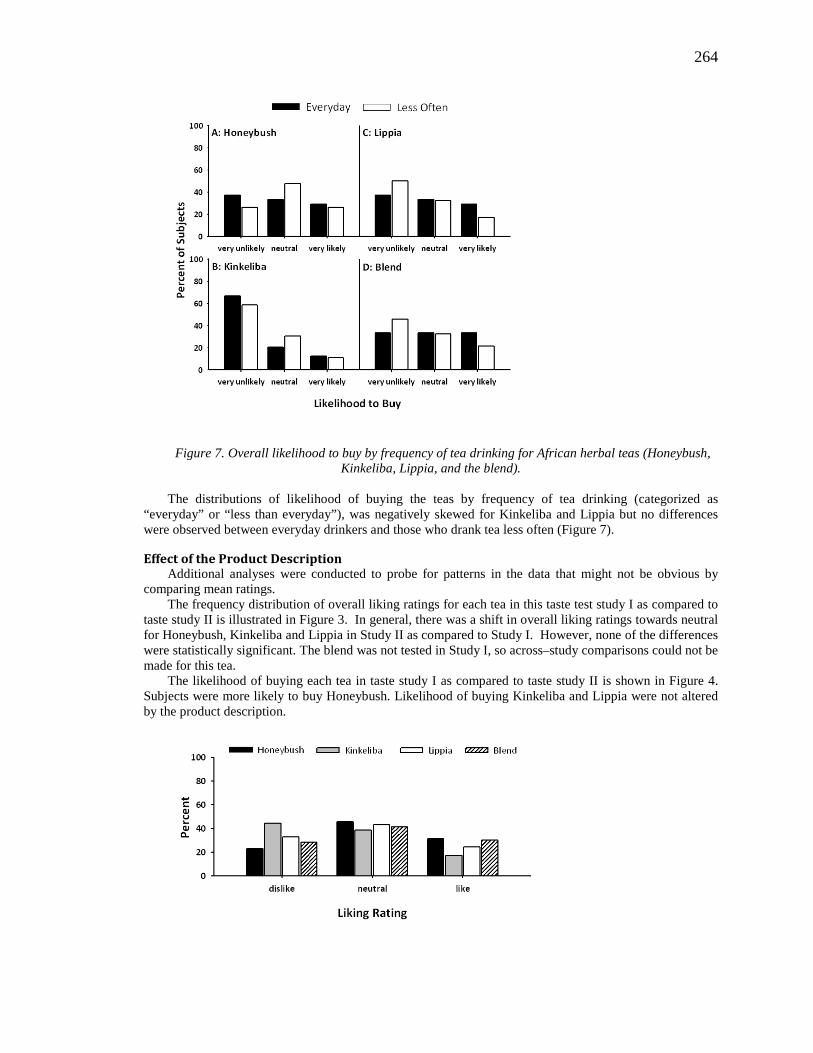
264
Figure 7. Overall likelihood to buy by frequency of tea drinking for African herbal teas (Honeybush, Kinkeliba, Lippia, and the blend).
The distributions of likelihood of buying the teas by frequency of tea drinking (categorized as
“everyday” or “less than everyday”), was negatively skewed for Kinkeliba and Lippia but no differences were observed between everyday drinkers and those who drank tea less often (Figure 7).
Effect of the Product Description Additional analyses were conducted to probe for patterns in the data that might not be obvious by
comparing mean ratings. The frequency distribution of overall liking ratings for each tea in this taste test study I as compared to
taste study II is illustrated in Figure 3. In general, there was a shift in overall liking ratings towards neutral for Honeybush, Kinkeliba and Lippia in Study II as compared to Study I. However, none of the differences were statistically significant. The blend was not tested in Study I, so across–study comparisons could not be made for this tea.
The likelihood of buying each tea in taste study I as compared to taste study II is shown in Figure 4. Subjects were more likely to buy Honeybush. Likelihood of buying Kinkeliba and Lippia were not altered by the product description.
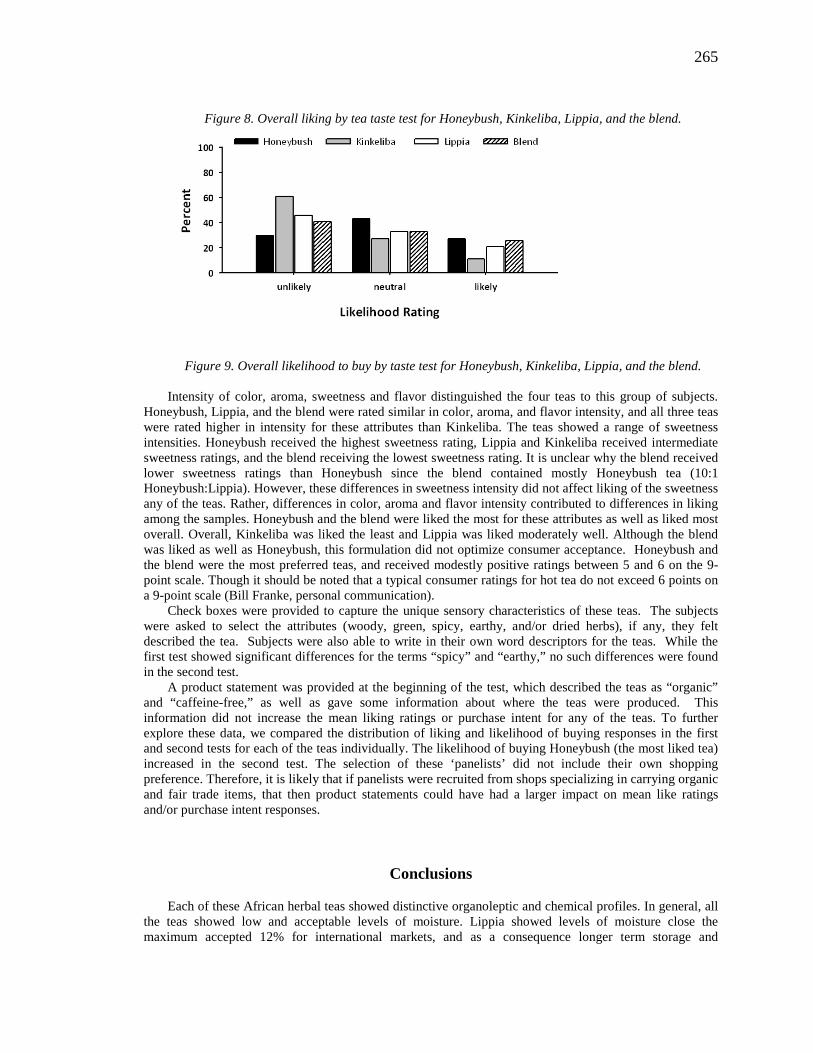
265
Figure 8. Overall liking by tea taste test for Honeybush, Kinkeliba, Lippia, and the blend.
Figure 9. Overall likelihood to buy by taste test for Honeybush, Kinkeliba, Lippia, and the blend.
Intensity of color, aroma, sweetness and flavor distinguished the four teas to this group of subjects. Honeybush, Lippia, and the blend were rated similar in color, aroma, and flavor intensity, and all three teas were rated higher in intensity for these attributes than Kinkeliba. The teas showed a range of sweetness intensities. Honeybush received the highest sweetness rating, Lippia and Kinkeliba received intermediate sweetness ratings, and the blend receiving the lowest sweetness rating. It is unclear why the blend received lower sweetness ratings than Honeybush since the blend contained mostly Honeybush tea (10:1 Honeybush:Lippia). However, these differences in sweetness intensity did not affect liking of the sweetness any of the teas. Rather, differences in color, aroma and flavor intensity contributed to differences in liking among the samples. Honeybush and the blend were liked the most for these attributes as well as liked most overall. Overall, Kinkeliba was liked the least and Lippia was liked moderately well. Although the blend was liked as well as Honeybush, this formulation did not optimize consumer acceptance. Honeybush and the blend were the most preferred teas, and received modestly positive ratings between 5 and 6 on the 9-point scale. Though it should be noted that a typical consumer ratings for hot tea do not exceed 6 points on a 9-point scale (Bill Franke, personal communication).
Check boxes were provided to capture the unique sensory characteristics of these teas. The subjects were asked to select the attributes (woody, green, spicy, earthy, and/or dried herbs), if any, they felt described the tea. Subjects were also able to write in their own word descriptors for the teas. While the first test showed significant differences for the terms “spicy” and “earthy,” no such differences were found in the second test.
A product statement was provided at the beginning of the test, which described the teas as “organic” and “caffeine-free,” as well as gave some information about where the teas were produced. This information did not increase the mean liking ratings or purchase intent for any of the teas. To further explore these data, we compared the distribution of liking and likelihood of buying responses in the first and second tests for each of the teas individually. The likelihood of buying Honeybush (the most liked tea) increased in the second test. The selection of these ‘panelists’ did not include their own shopping preference. Therefore, it is likely that if panelists were recruited from shops specializing in carrying organic and fair trade items, that then product statements could have had a larger impact on mean like ratings and/or purchase intent responses.
Conclusions
Each of these African herbal teas showed distinctive organoleptic and chemical profiles. In general, all the teas showed low and acceptable levels of moisture. Lippia showed levels of moisture close the maximum accepted 12% for international markets, and as a consequence longer term storage and
266
accelerated storage studies are needed to evaluate the effect of this level of moisture on the quality and shelf life. Rooibos and Honeybush herbal teas were also characterized by low levels of fine particles. Future efforts in all African herbal teas should be made to reduce botanical dust in the teas particularly for Kinkeliba. Fine particles can also be problematic depending upon the actual mesh of the tea bag itself leading to a cloudier tea after infusion. Honeybush and Rooibos contained low levels of mineral, while Lippia and Lemongrass can be considered as teas rich in minerals. Kinkeliba tea showed the highest amounts of antioxidant polyphenols.
Overall, Honeybush was ‘liked the most’ while Kinkeliba was ‘liked the least’ and Lippia was liked moderately well. These findings do not suggest one herbal tea will be more popular and successful than another but rather suggest the marketing of each African tea needs to be carefully planned and targeted. This study also suggested that the ratings by frequency of tea tastings were higher in everyday tea drinker. It appears that the likelihood to buy such herbal teas is affected by the repeated exposure to the teas. This study suggests that the market could be expanded as more consumers get to know these herbal teas and become familiar with their names, taste and associated story. The new information on the quality and chemistry of these African herbal teas will also contribute toward their commercialization though in the end we conclude that color, taste and aroma will have a far greater impact on the consumer decision than nutritional benefit only. Further studies using focused groups that opt to purchase organic, green products and Fair Trade should be considered as such herbal African teas with exciting stories linking the products back to their communities may provide additional incentive or interest in purchasing in the US marketplace.
Acknowledgements
Part of this research was conducted as part of the undergraduate research internsphips (Dept. of Plant Biology) by Mike Bucuk. Funds to conduct this research were provided by the Office of Economic Growth, Agriculture and Trade (EGAT/AG) of the USAID (Contract Award No. AEG-A-00-04-00012-00) in support of the Partnership for Food and Industry in Natural Products (PFID/NP) project which is part of their global economic development programs. We thank Robert Hedlund, Larry Paulson and Carol Wilson, USAID; Jerry Brown, USDA-FAS for their support and encouragement.
We acknowledge the assistance of all the ASNAPP-staff and personnel in Ghana, Senegal and Zambia who provided the dried herbal botanicals to South Africa where it was processed and packaged into the Mpuntu herbal tea lines by Cape Natural Teas, Cape Town, South Africa, and then shipped to Rutgers for analysis and study. In particular, we thank Bismarck Diawuo, ASNAPP-Zambia for the Lemongrass; Babou Diouf and Diatta Malainy, ASNAPP-Senegal for the Kinkeliba; Jacky Goliath, ASNAPP-South Africa for the Honeybush; and Julie Asante-Dartey and Dan Acquaye, ASNAPP-Ghana for the Lippia.
267
References
1. Wang, M.; Juliani, H.R.; Simon, J.E.; Ekanem, A.; Liang, C.P.; Ho, C.-T. In Phenolics in Foods and Natural Health Products, Shahidi, F.; C. - T. Ho, Eds.; ACS Symposium Series 909,: Oxford Univ. Press. Washington, DC., 2005, pp 118-128.
2. Juliani, H.R.; Koroch, A.; Simon, J.E.; Hitimana, N.; Daka, A.; Ranarivelo, L.; Langenhoven, P. J. Essent. Oil Res., 18, 116-121
3. Malik, J.; Szakova, J.; Drabek, O.; Balik, J.; Kokoska, L. Food Chem. 2008, 111, 520-525.
4. Juliani, H.R.; Wang, M.; Asante-Dartey, J.; Acquaye, D.; Moharram, H.; Koroch, A.R.; Simon, J.E. In: Herbs: Challenges in Chemistry and Biology, Wang, M.; Sang, S.; Hwang, L.S.; Ho, C.-T., Eds.; ACS Symposium Series 925, American Chemical Society: Washington, D.C., 2006, pp. 126-142.
5. Tuorila, H.; Meiselman, H., Bell, R.; Cardello, A.V; Johnson, W. Appetite, 1994, 23, 231–246.
6. Juliani H.R.; Simon, J.E.; Ramboatima, M.M.R.; Behra, 0.; Garvey, A.; Raskin, I. Acta Horticulturae, 2004, 629, 77-81.
7. Kerharo, J. La Pharmacopee Senegalaise Traditionnelle. Editions Vigot Freres: Paris, France, 1974, pp 346-349
8. Irvine, F.R. Woody Plants of Ghana. Oxford University Press: London. UK. 1961, pp. 758-759.
9. Joubert, E.; Otto, F.; Grüner, S.; Weinreich, B. Eur. Food Res. Technol. 2003, 216,270-273.
10. Marnewick, J.L. In African Natural Plant Products: New Discoveries and Challenges in Chemistry and Quality, Juliani, H.R., Simon, J.E.,Ho, C.T. (Eds). ACS Symposium Series, American Chemical Society: Washington, D.C., 2009, In press.
11. DerMarderosian, Ara; Liberti, L.; Beutler, J.A.; Grauds, C.; Tatro, D.S.; Cirigliano, M.; DeSilva, D. Jr. 2005. The Review of Natural Products. Facts and Comparisons, St. Louis. MI, 2005, pp 696-700.
12. Food chemicals codex. Committee on Food Chemicals codex, Food and Nutrition Board, Institute of Medicine. National Academies Press: Washington, DC, 1996; p 748.
13. Juliani, H.R.; Fonseca, Y.; Acquaye, D; Malumo, H.; Malainy, D.; Simon. In African Natural Plant Products: New Discoveries and Challenges in Chemistry and Quality, Juliani, H.R., Simon, J.E.,Ho, C.T. (Eds). ACS Symposium Series, American Chemical Society: Washington, D.C., 2009, In press.
14. Anonymous. Dietary Reference Intakes: Elements. National Academies Press, Washington, DC, 2001.
15. Committee on Minerals and Toxic Substances in Diets and Water for Animals. Mineral Tolerance of Animals. National Academies Press, Washington, DC, 2005, pp 22.
268
Curriculum Vitae
Cara R. Welch Colleges Attended August 2005 – January 2010 Rutgers University (New Brunswick, NJ) Ph.D. Medicinal Chemistry, January 2010 Advisor: Prof. James Simon
“Chemistry and Pharmacology of Kinkéliba (Combretum micranthum), a West African Medicinal Plant”
August 2003 – Mary 2005 University of Iowa (Iowa City, IA) M.S. Chemistry, May 2005 Advisor: Prof. James Gloer
January 2000 – May 2002 Dordt College (Sioux Center, IA) B.A. Chemistry, May 2002. Work Related Experience August 1998 – December 1999 Northwestern College (Orange City, IA) August 2002 – August 2003 Diamond Vogel Paints (Orange City, IA) Scientist in Research & Development: Interior Latex Paints July 2007 – December 2009 Rutgers University (New Brunswick, NJ)
Graduate Research Assistant/Laboratory Technician Fall 2005 – Spring 2007 Rutgers University (Piscataway, NJ) Teaching Assistant Fall 2003 – Spring 2005 University of Iowa (Iowa City, IA) Teaching Assistant. Publications Welch, C. R.; Wu, Q-L.; Simon, J. E. Recent Advances in Anthocyanin
Analysis and Characterization. Current Analytical Chemistry. 2008, 4 (2): 75-101. Juliani, H. R.; Welch, C.; Asante-Dartey, J.; Acquaye, D.; Wang, M.; Simon, J. E. “Chemistry, Quality, and Functional Properties of Grains of Paradise (Aframomum melegueta), a Rediscovered Spice” Dietary Supplements. American Chemical Society Symposium Series 987. American Chemical Society, Washington, D.C. USA. 2008, pp. 100-113. Juliani, H. R.; Welch, C. R.; Wu, Q.; Diouf, B.; Malainy, D.; Simon, J. E . Chemistry and Quality of Hibiscus (Hibiscus sabdariffa) for Developing the Natural-Product Industry in Senegal. Journal of Food Science. 2009, 74 (2): S113-S121. Feruzzi, M.G.; Lobo, J.K.; Janle, E.; Whittaker, N.; Cooper, B.; Simon, J.E.; Wu, Q-L.; Welch, C.; Ho, L.; Weaver, C.; Pasinetti, G.M. Bioavailability of Gallic Acid and Catechins from Neuroprotective Grape Seed Extract is Improved by Repeated Dosing in Rats. Journal of Alzheimer’s Disease. 2009, 18 (1): 113-124. Juliani, H. R.; Koelliker, Y.; Bucuk, M.; Welch, C.; Tepper, B. J.; Jefthas, E.; Simon, J. E. “Quality and Consumer Studies in the USA of African Herbal Teas for the Natural Product Industry Development in Sub-Sahara Africa” African Natural Plant Products: New Discoveries and Challenges in Chemistry and Quality. American Chemical Society Symposium Series 1021. American Chemical Society, Washington, D.C. USA. 2009, pp. 403-420.