Embed Size (px)
Citation preview
CHEMISTRY 59-320CHEMISTRY 59-320ANALYTICAL CHEMISTRYANALYTICAL CHEMISTRY
Fall - 2010Fall - 2010
Lecture 7
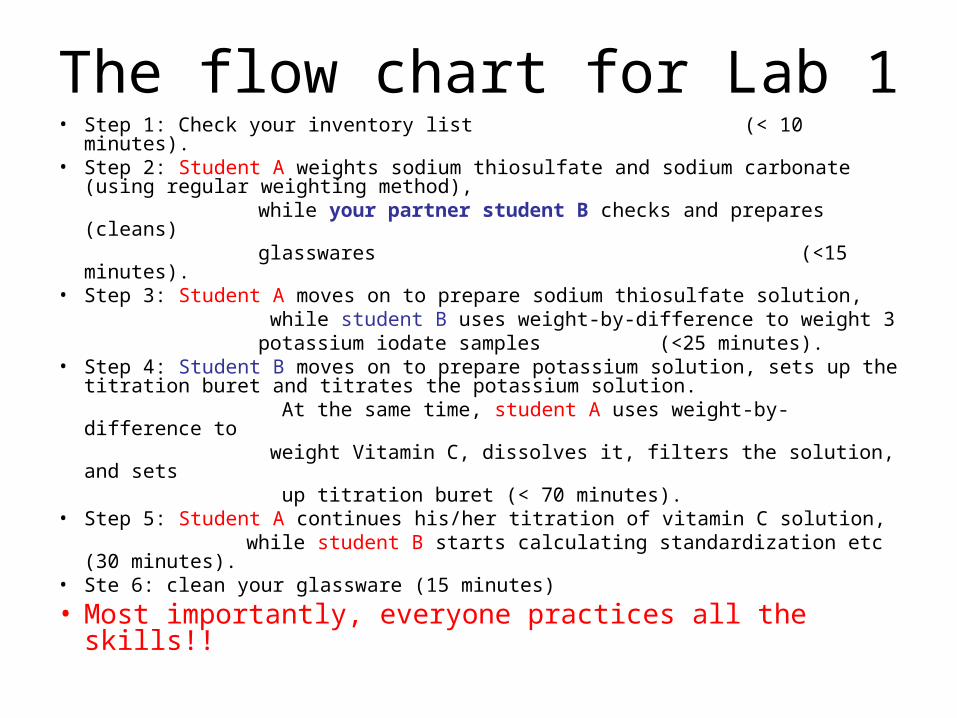
The flow chart for Lab 1• Step 1: Check your inventory list (< 10 minutes).• Step 2: Student A weights sodium thiosulfate and sodium carbonate
(using regular weighting method), while your partner student B checks and prepares (cleans) glasswares (<15 minutes).• Step 3: Student A moves on to prepare sodium thiosulfate solution, while student B uses weight-by-difference to weight 3 potassium iodate samples (<25 minutes).• Step 4: Student B moves on to prepare potassium solution, sets up the
titration buret and titrates the potassium solution. At the same time, student A uses weight-by-difference to weight Vitamin C, dissolves it, filters the solution, and sets up titration buret (< 70 minutes).• Step 5: Student A continues his/her titration of vitamin C solution, while student B starts calculating standardization etc (30
minutes).• Ste 6: clean your glassware (15 minutes)
• Most importantly, everyone practices all the skills!!
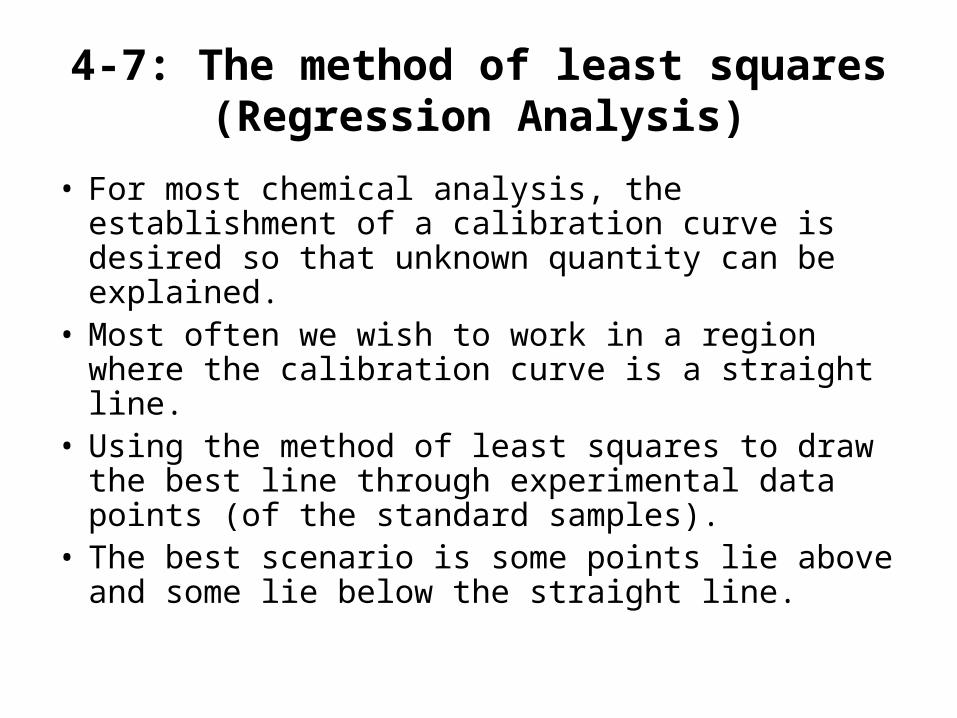
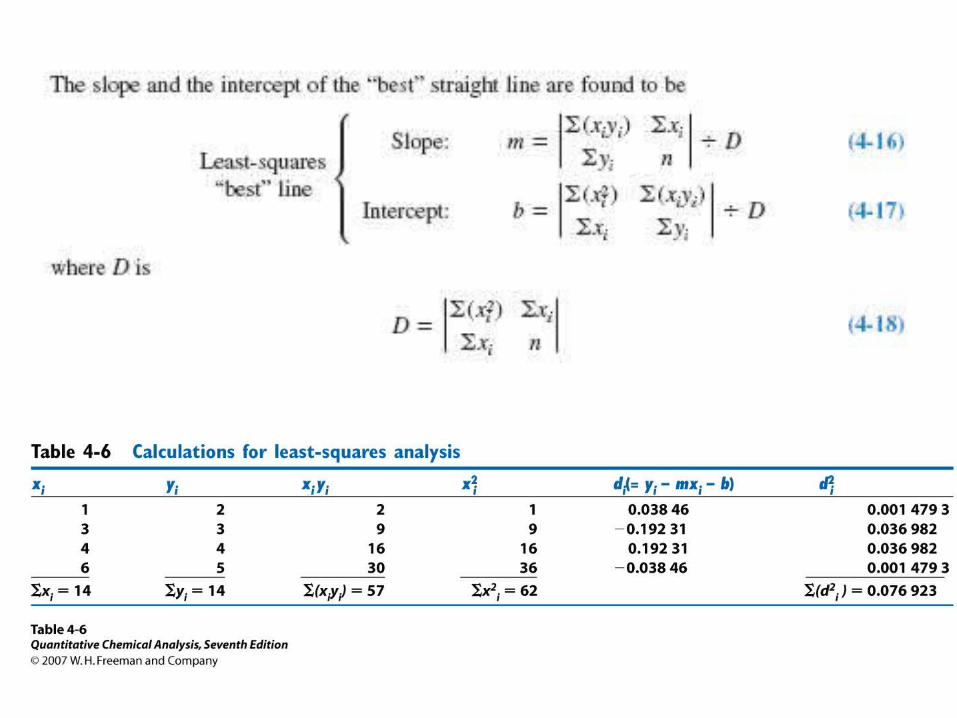
4-7: The method of least squares (Regression Analysis)
• For most chemical analysis, the establishment of a calibration curve is desired so that unknown quantity can be explained.
• Most often we wish to work in a region where the calibration curve is a straight line.
• Using the method of least squares to draw the best line through experimental data points (of the standard samples).
• The best scenario is some points lie above and some lie below the straight line.
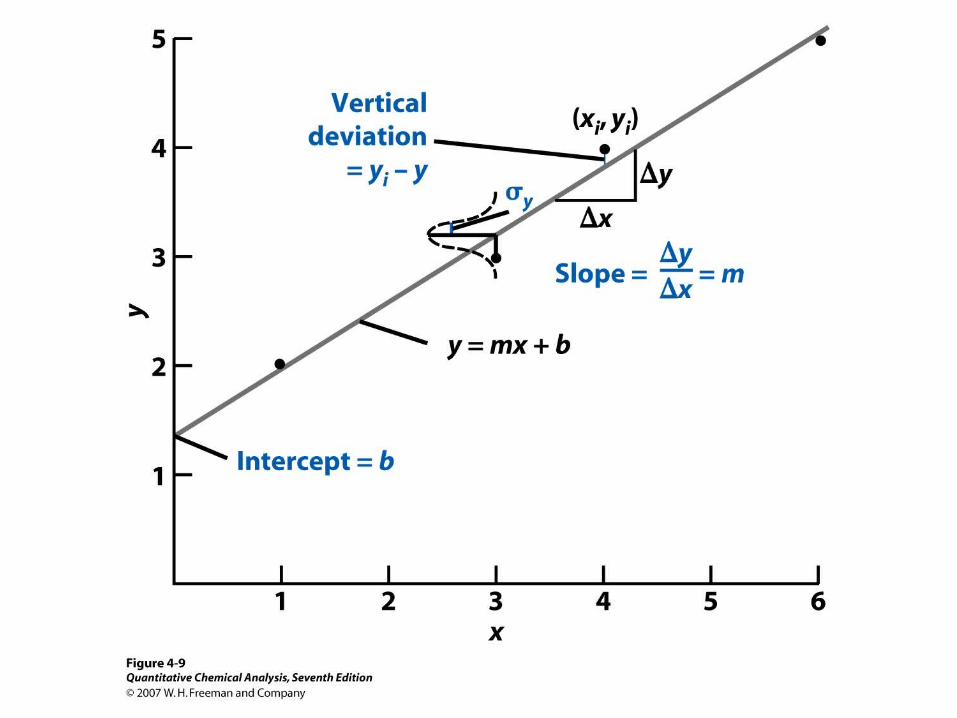
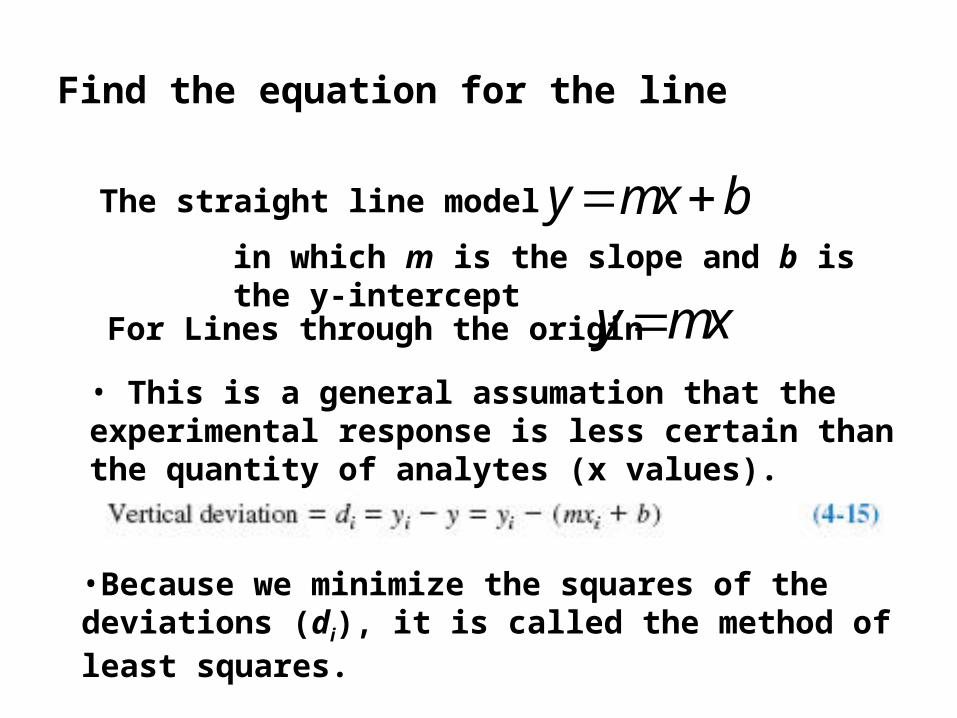
Find the equation for the line
y mx b The straight line model
For Lines through the origin y mx
•Because we minimize the squares of the deviations (di), it is called the method of least squares.
in which m is the slope and b is the y-intercept
• This is a general assumation that the experimental response is less certain than the quantity of analytes (x values).
2
1
( ) ( )n
obs ii
S S y x
i iy mx
2
1
( )n
R obs ii
S y y
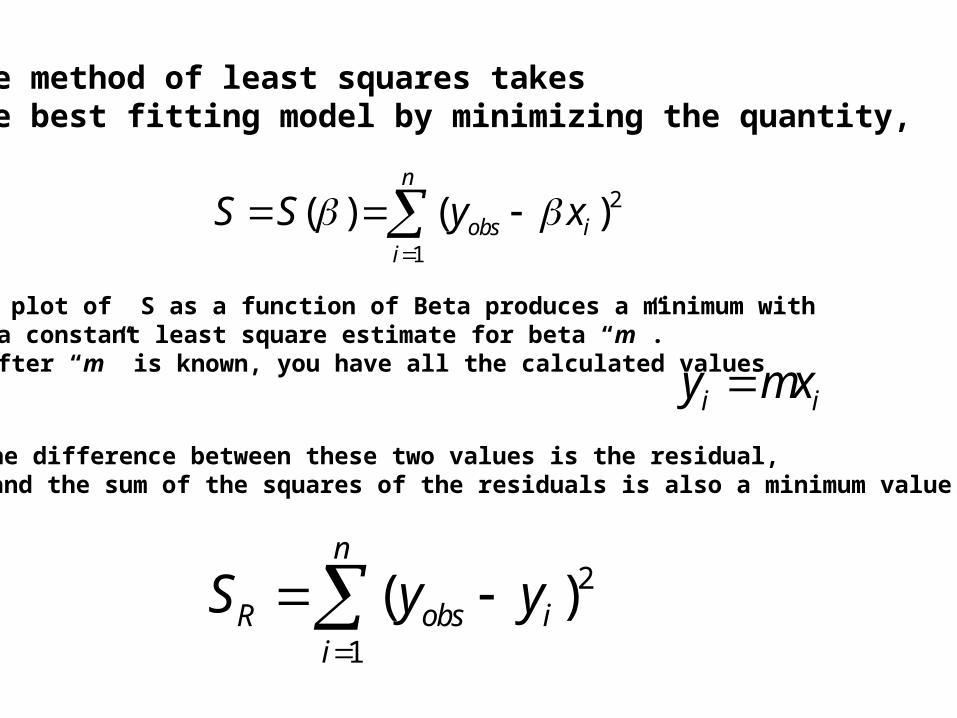
A plot of S as a function of Beta produces a minimum with a constant least square estimate for beta “m”.After “m” is known, you have all the calculated values
The difference between these two values is the residual, and the sum of the squares of the residuals is also a minimum value.
The method of least squares takes the best fitting model by minimizing the quantity,
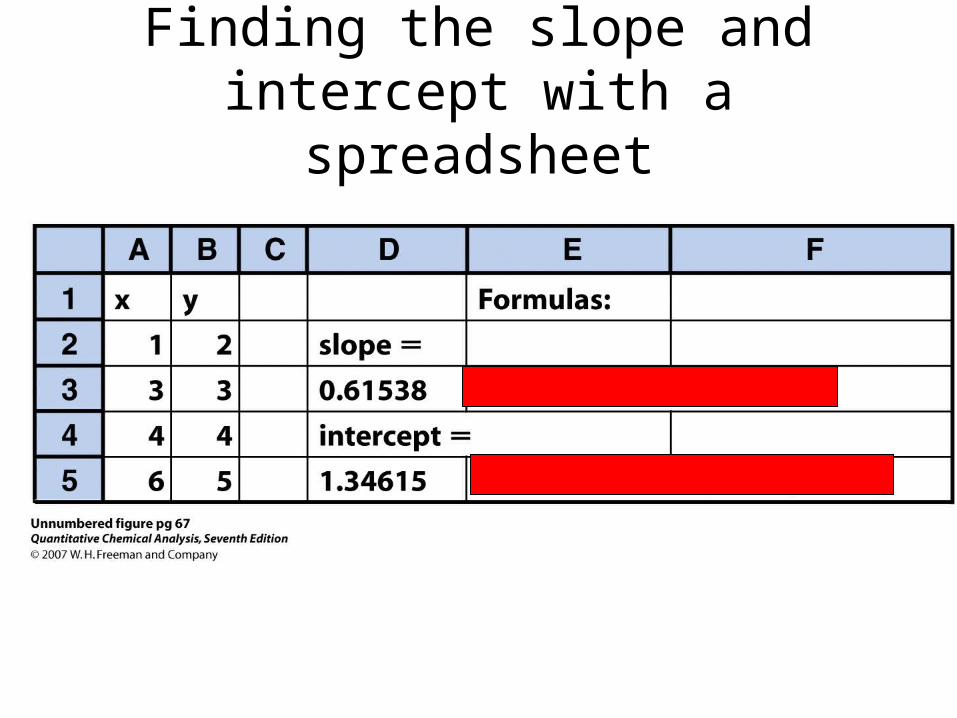
Finding the slope and intercept with a spreadsheet
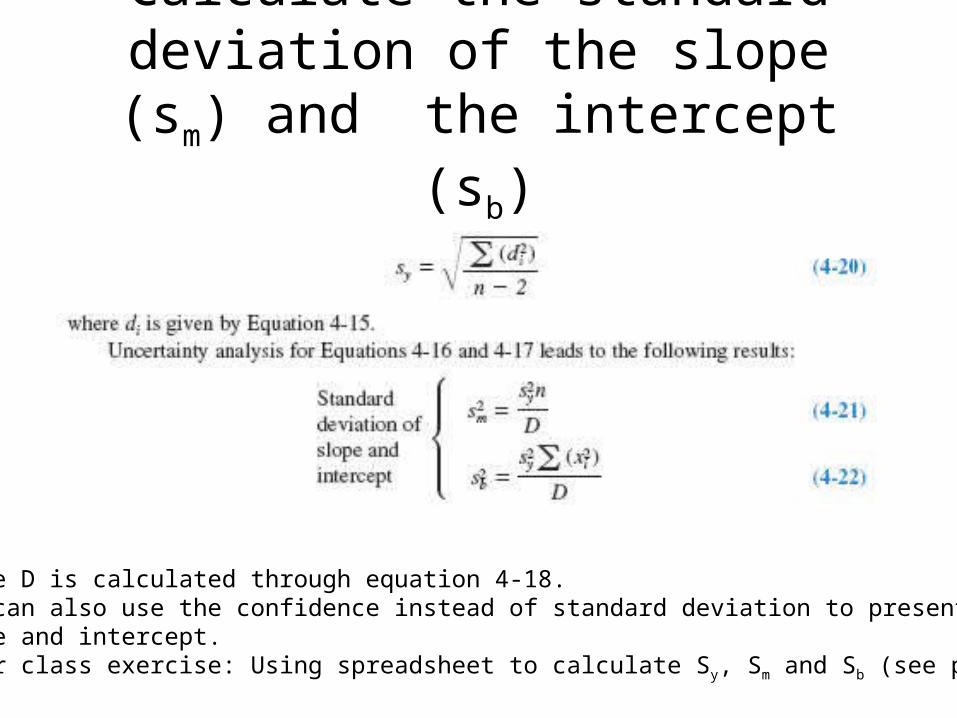
Calculate the standard deviation of the slope (sm) and the intercept (sb)
Where D is calculated through equation 4-18.One can also use the confidence instead of standard deviation to present the Slope and intercept.After class exercise: Using spreadsheet to calculate Sy, Sm and Sb (see page 68)
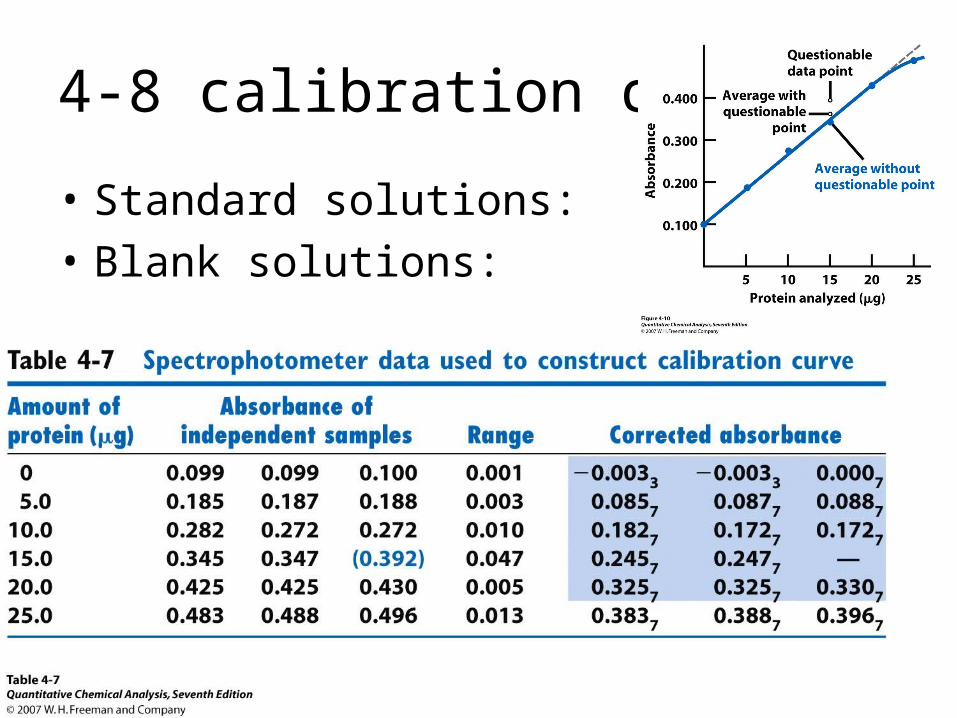
4-8 calibration curves
• Standard solutions:
• Blank solutions:
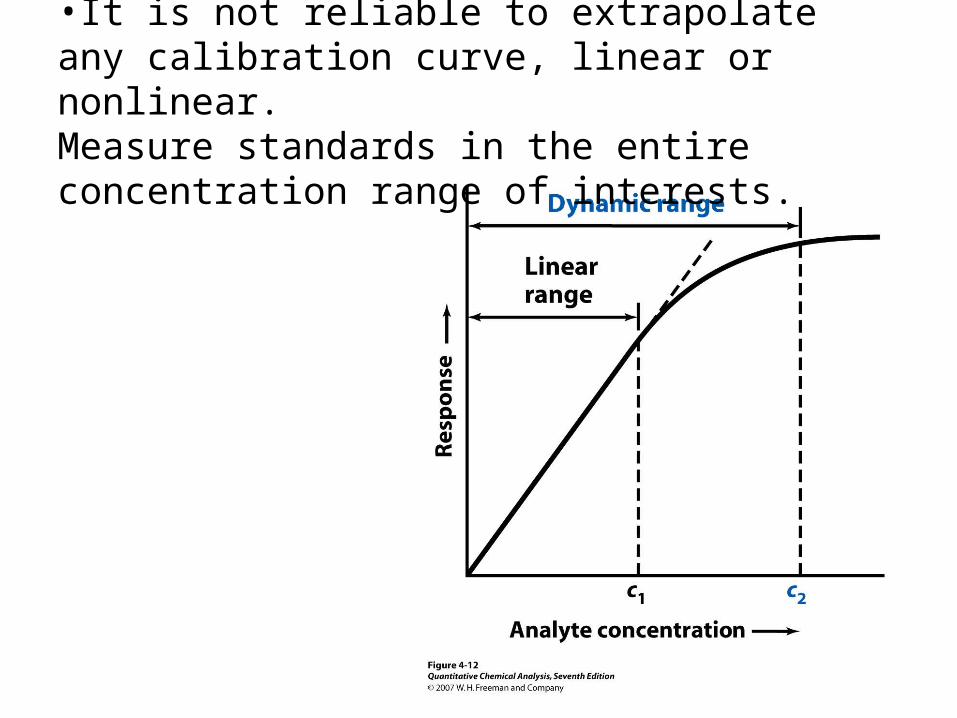
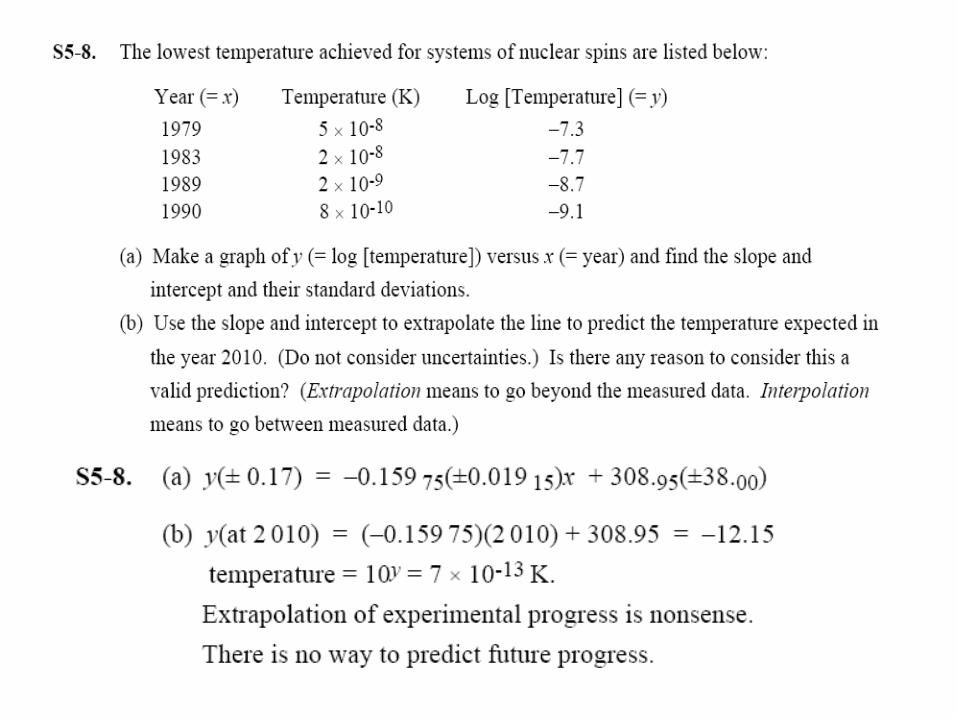
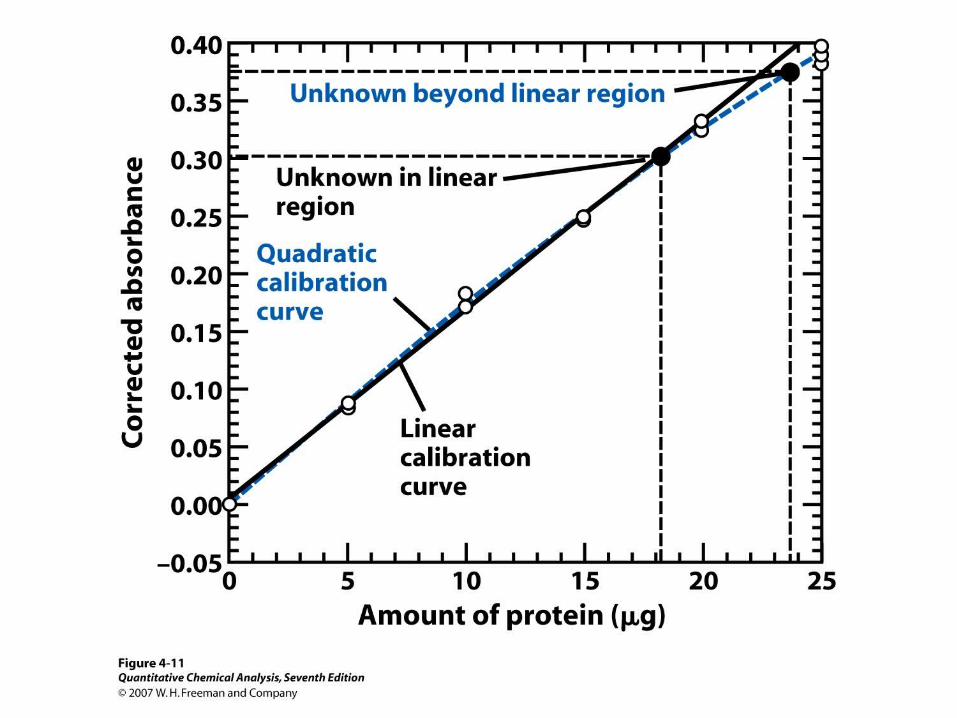
•It is not reliable to extrapolate any calibration curve, linear or nonlinear.Measure standards in the entire concentration range of interests.
Chapter 5 Quality assurance and Calibration method
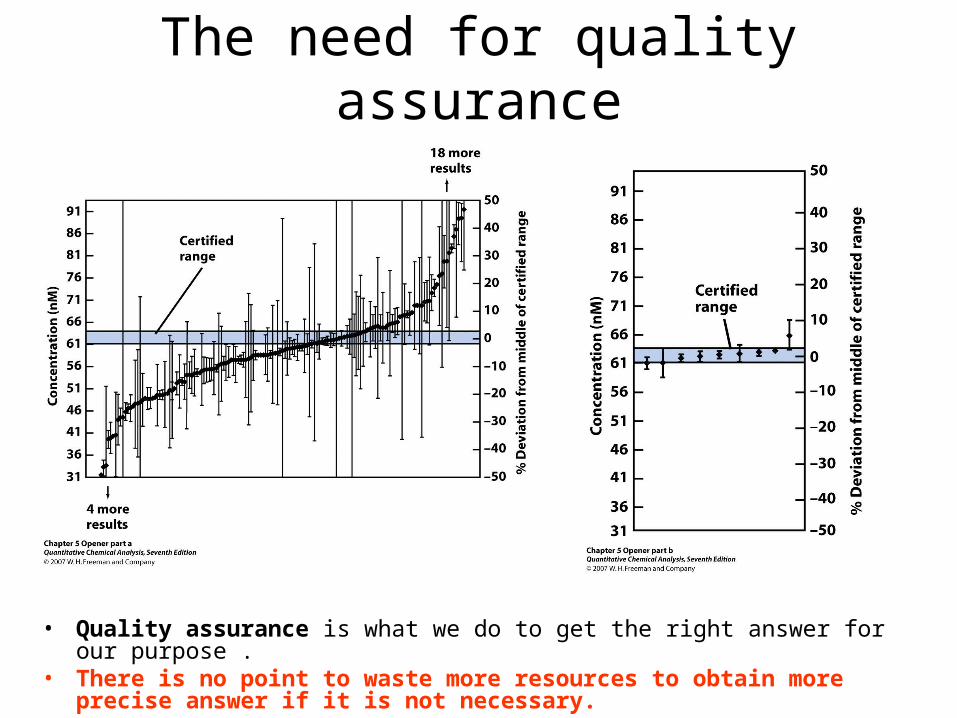
The need for quality assurance
• Quality assurance is what we do to get the right answer for our purpose .• There is no point to waste more resources to obtain more precise
answer if it is not necessary.
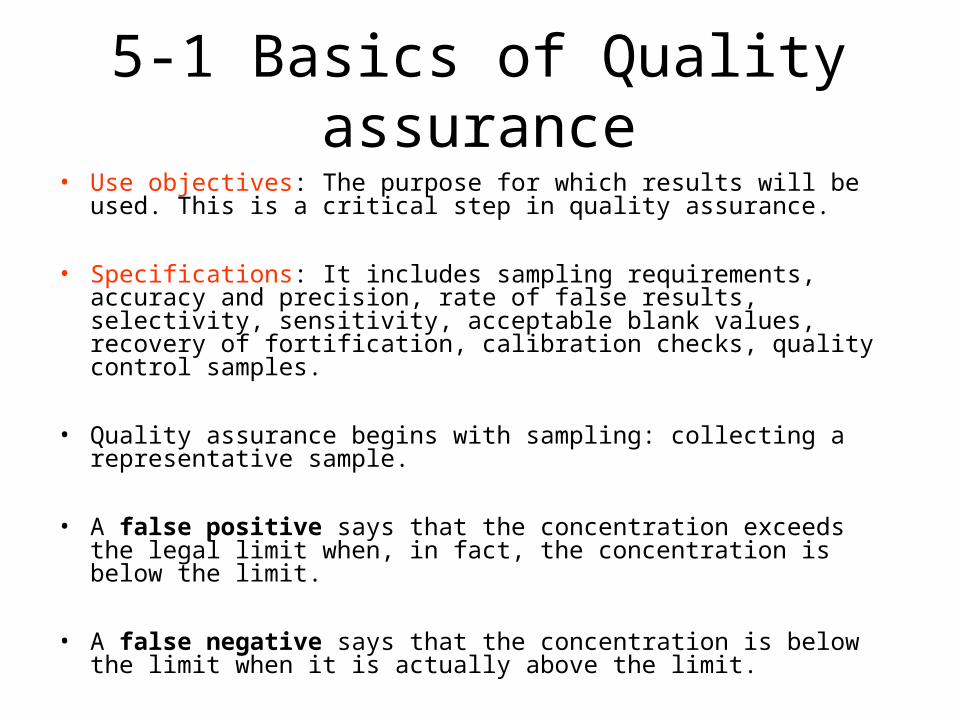
5-1 Basics of Quality assurance• Use objectives: The purpose for which results will be used. This is a
critical step in quality assurance.
• Specifications: It includes sampling requirements, accuracy and precision, rate of false results, selectivity, sensitivity, acceptable blank values, recovery of fortification, calibration checks, quality control samples.
• Quality assurance begins with sampling: collecting a representative sample.
• A false positive says that the concentration exceeds the legal limit when, in fact, the concentration is below the limit.
• A false negative says that the concentration is below the limit when it is actually above the limit.
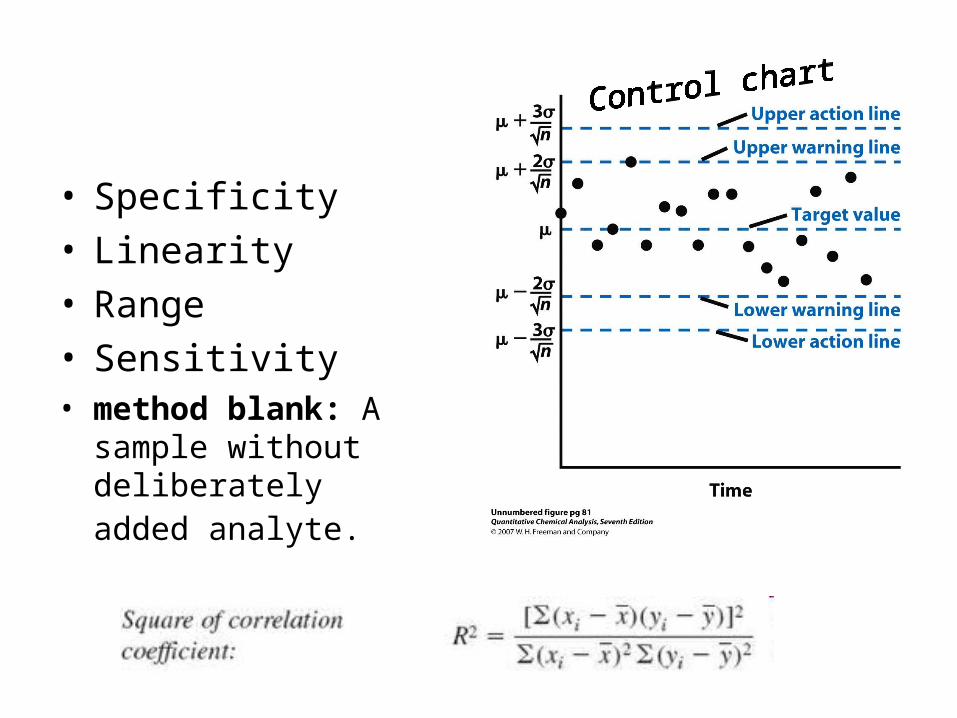
• Specificity• Linearity• Range• Sensitivity• method blank: A
sample without deliberately added analyte.
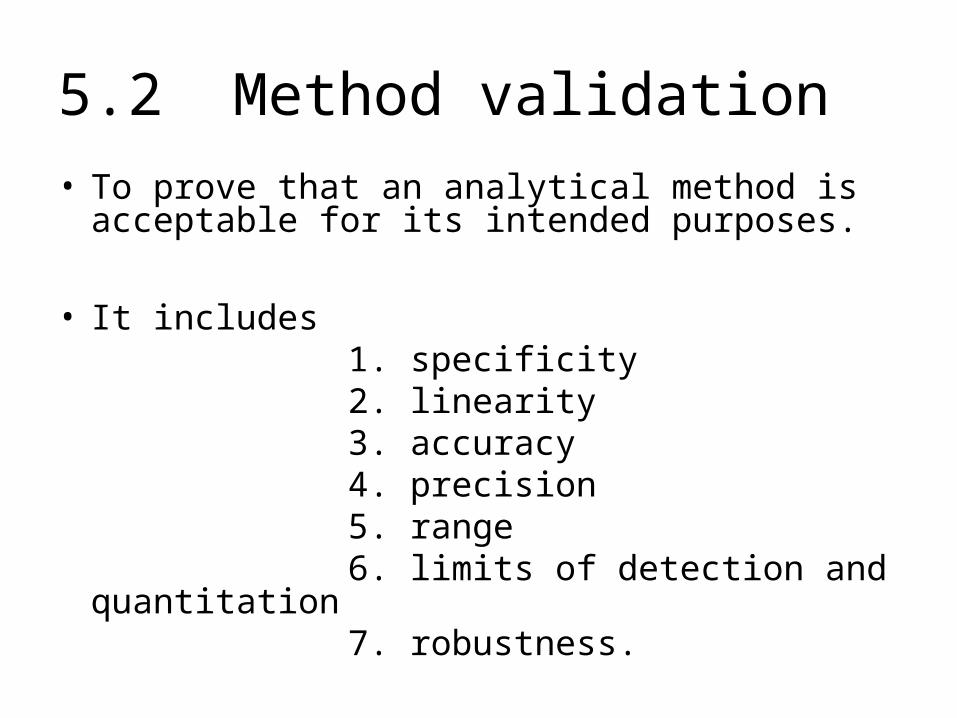
5.2 Method validation
• To prove that an analytical method is acceptable for its intended purposes.
• It includes 1. specificity 2. linearity 3. accuracy 4. precision 5. range 6. limits of detection and quantitation 7. robustness.
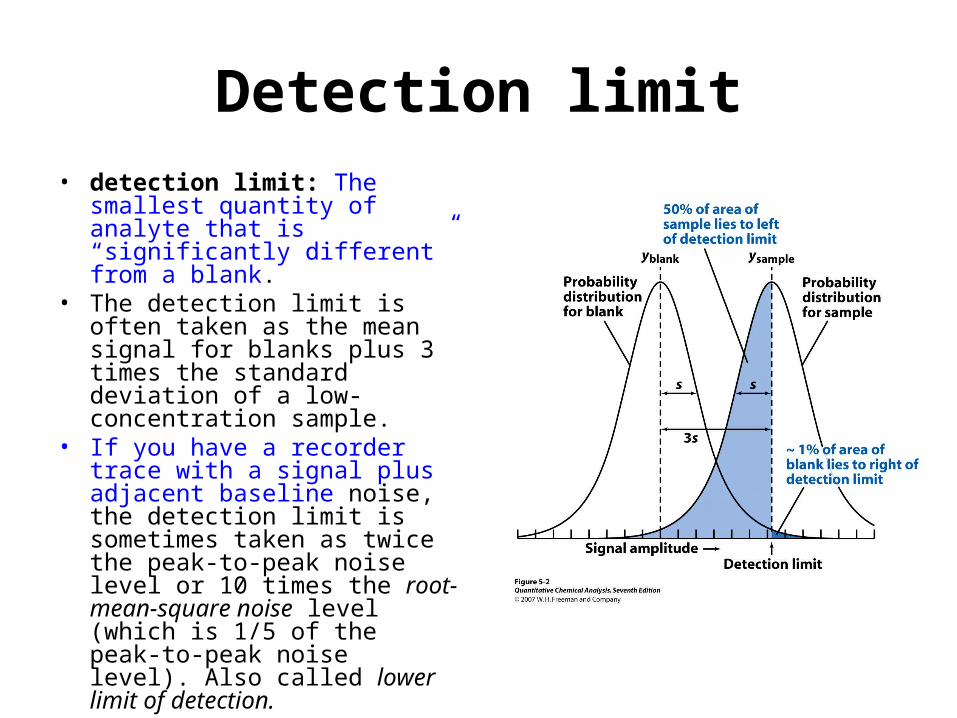
Detection limit• detection limit: The smallest
quantity of analyte that is “significantly different” from a blank.
• The detection limit is often taken as the mean signal for blanks plus 3 times the standard deviation of a low-concentration sample.
• If you have a recorder trace with a signal plus adjacent baseline noise, the detection limit is sometimes taken as twice the peak-to-peak noise level or 10 times the root-mean-square noise level (which is 1/5 of the peak-to-peak noise level). Also called lower limit of detection.
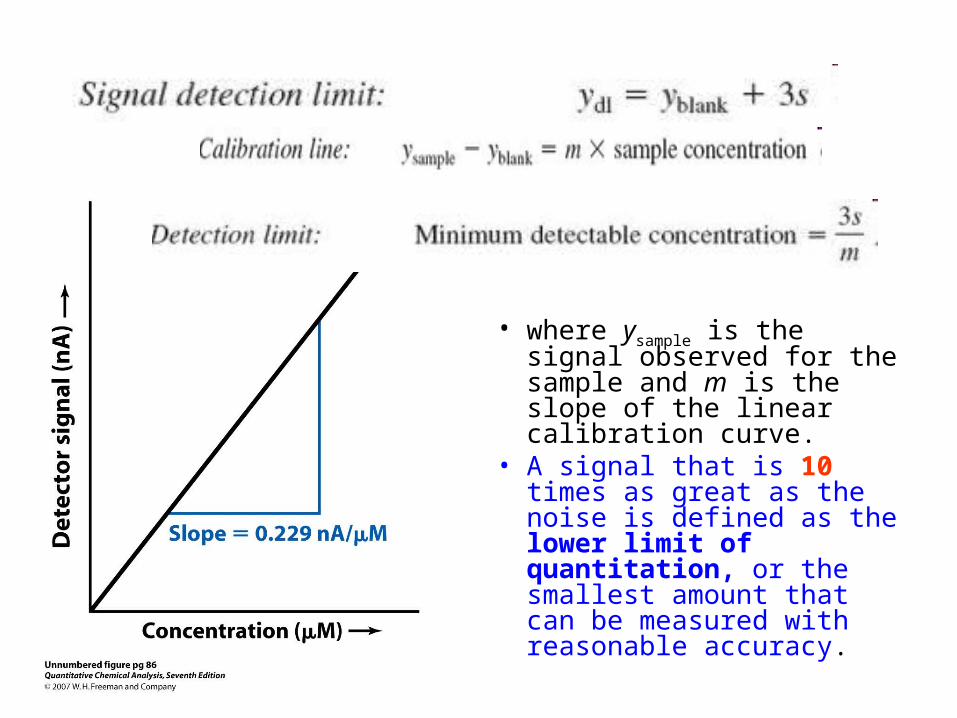
• where ysample is the signal observed for the sample and m is the slope of the linear calibration curve.
• A signal that is 10 times as great as the noise is defined as the lower limit of quantitation, or the smallest amount that can be measured with reasonable accuracy.
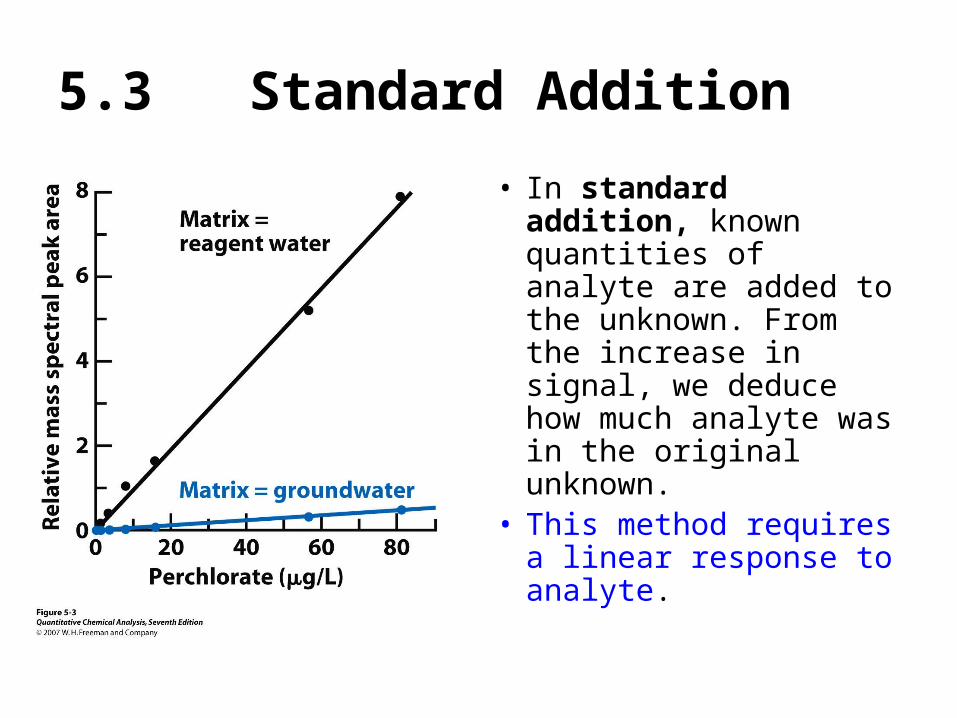
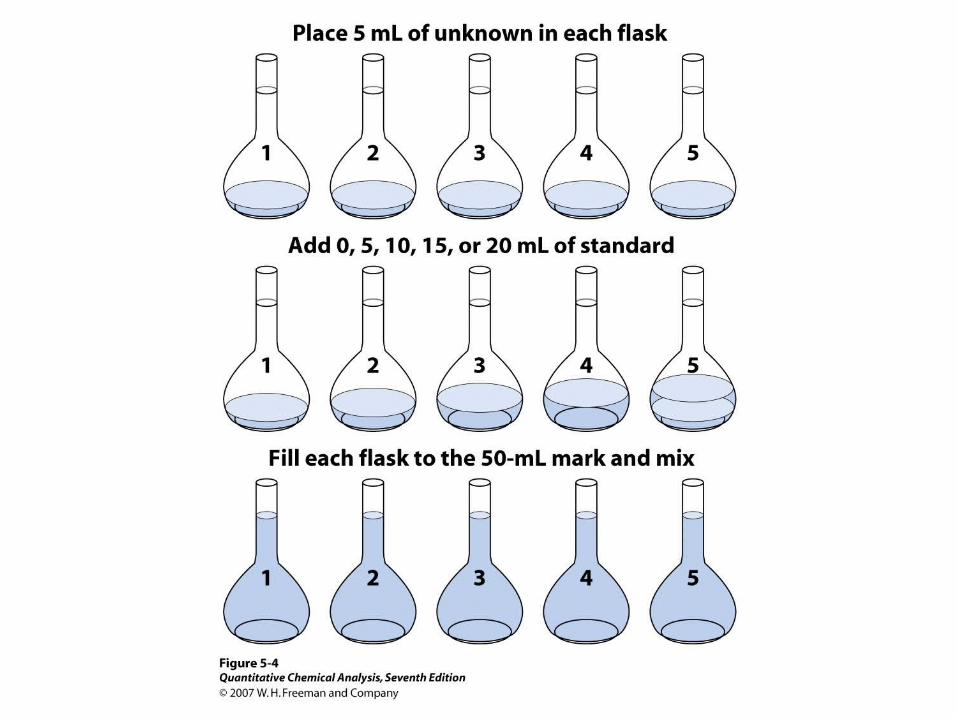
5.3 Standard Addition
• In standard addition, known quantities of analyte are added to the unknown. From the increase in signal, we deduce how much analyte was in the original unknown.
• This method requires a linear response to analyte.
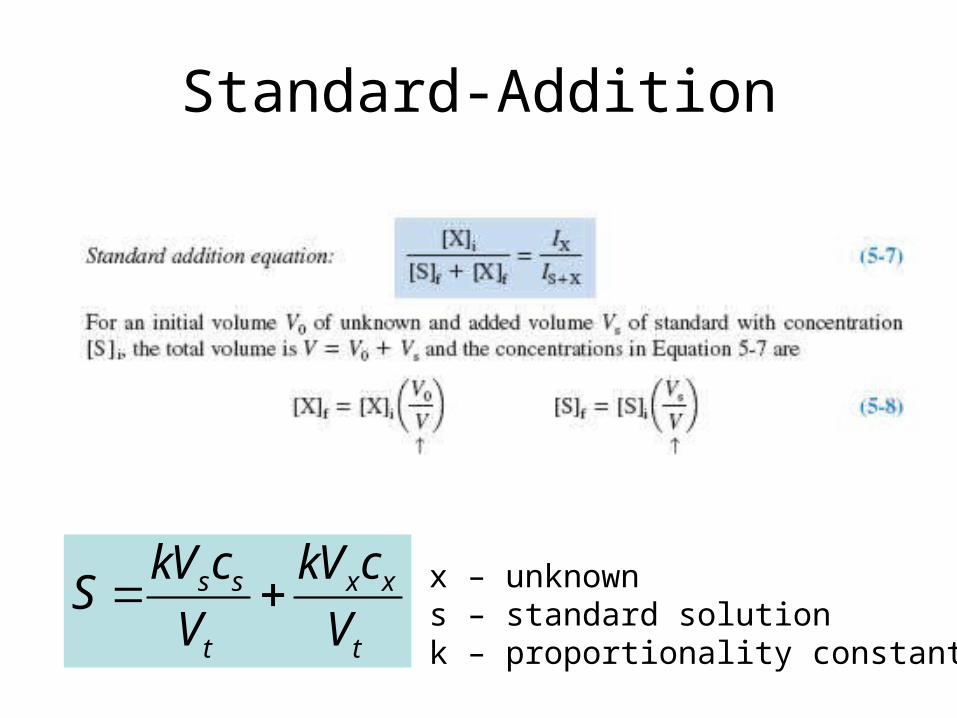
Standard-Addition
s s x x
t t
kV c kV cS
V V x – unknown
s – standard solutionk – proportionality constant
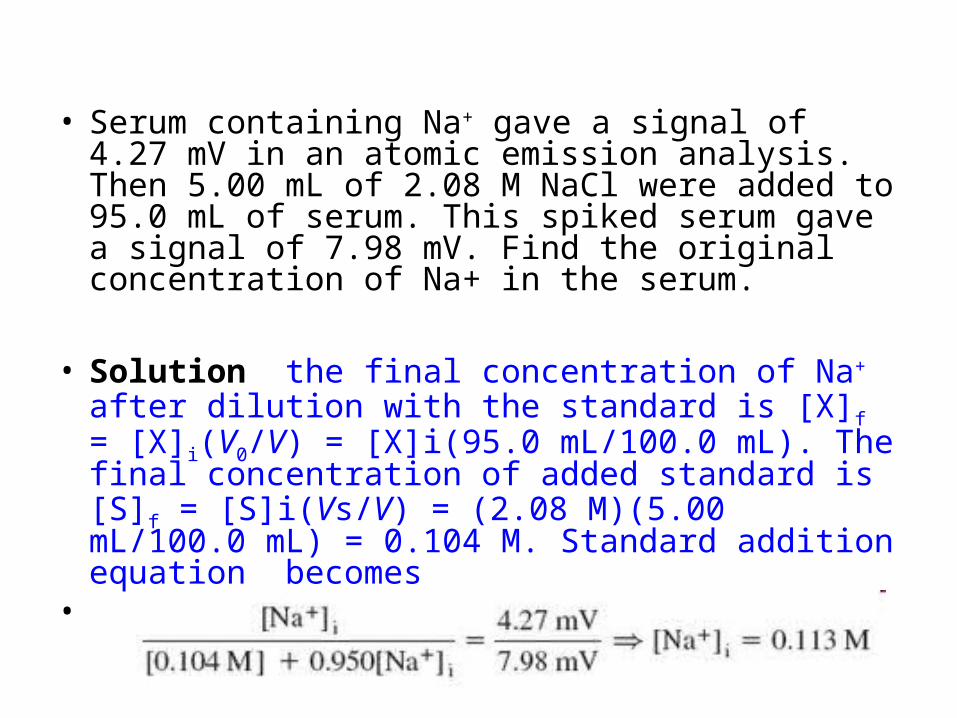
• Serum containing Na+ gave a signal of 4.27 mV in an atomic emission analysis. Then 5.00 mL of 2.08 M NaCl were added to 95.0 mL of serum. This spiked serum gave a signal of 7.98 mV. Find the original concentration of Na+ in the serum.
• Solution the final concentration of Na+ after dilution with the standard is [X]f = [X]i(V0/V) = [X]i(95.0 mL/100.0 mL). The final concentration of added standard is [S]f = [S]i(Vs/V) = (2.08 M)(5.00 mL/100.0 mL) = 0.104 M. Standard addition equation becomes
•
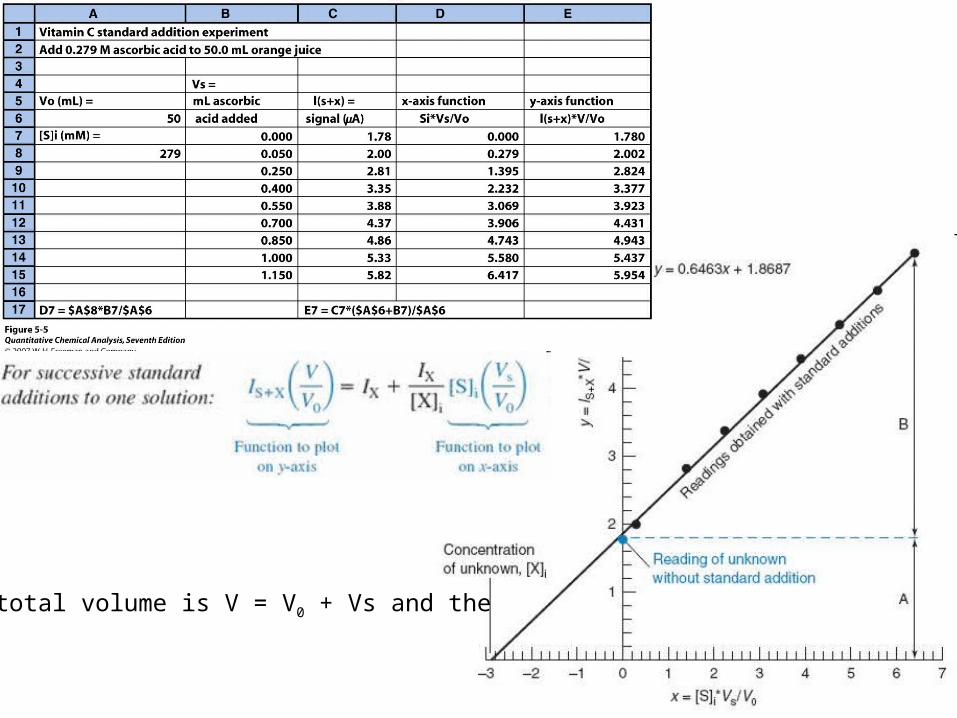
The total volume is V = V0 + Vs and the
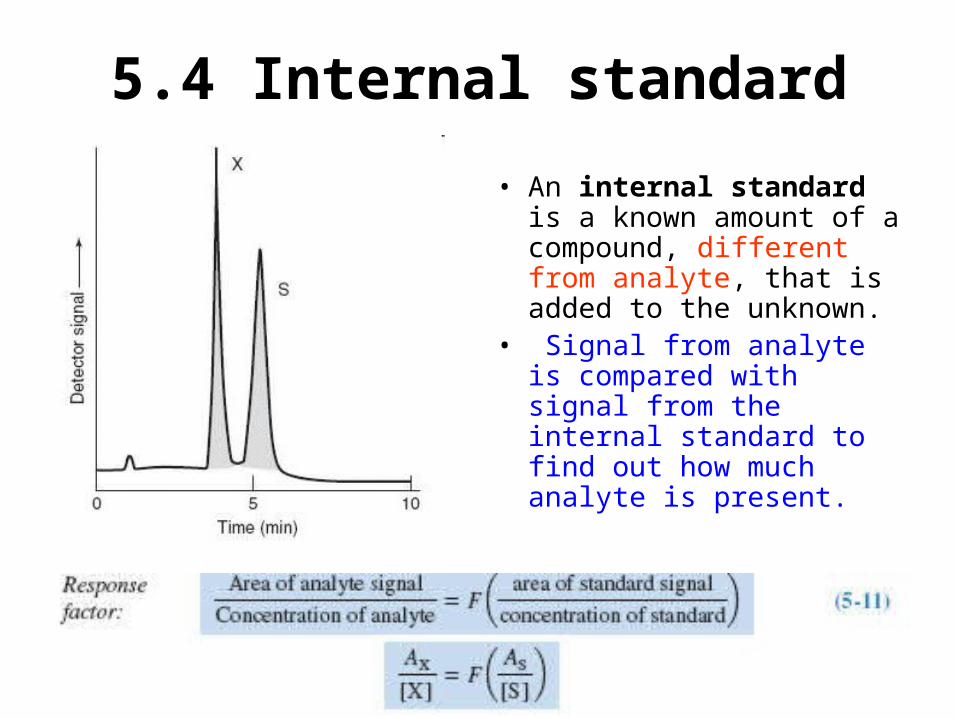
5.4 Internal standard
• An internal standard is a known amount of a compound, different from analyte, that is added to the unknown.
• Signal from analyte is compared with signal from the internal standard to find out how much analyte is present.
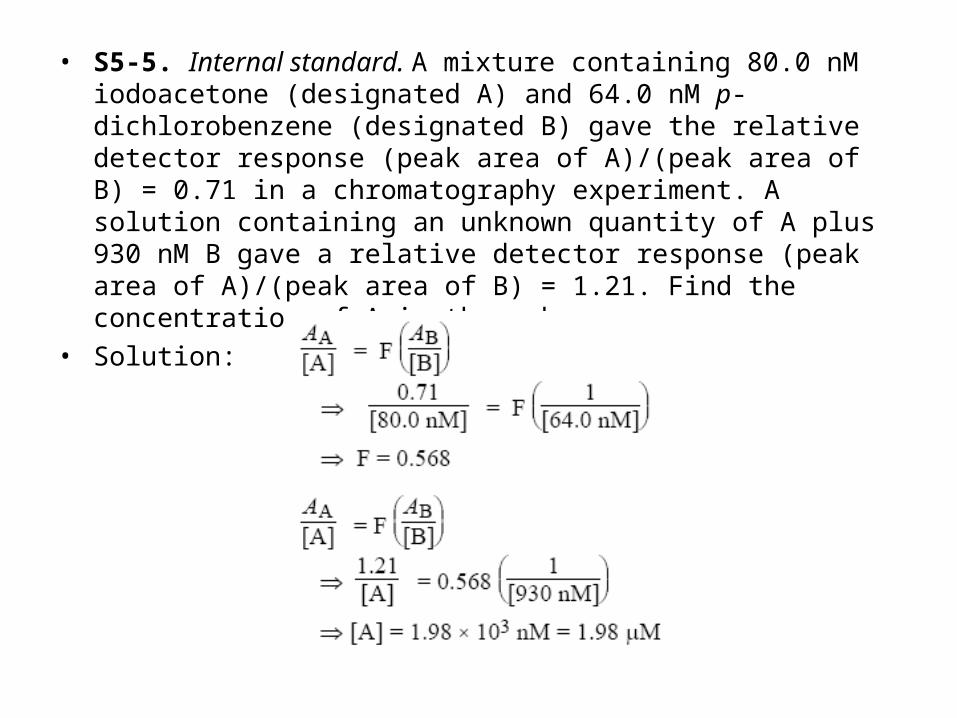
• S5-5. Internal standard. A mixture containing 80.0 nM iodoacetone (designated A) and 64.0 nM p-dichlorobenzene (designated B) gave the relative detector response (peak area of A)/(peak area of B) = 0.71 in a chromatography experiment. A solution containing an unknown quantity of A plus 930 nM B gave a relative detector response (peak area of A)/(peak area of B) = 1.21. Find the concentration of A in the unknown.
• Solution: