Embed Size (px)
Citation preview

Chemistry 152 Laboratory Manual
Lower Columbia College Winter 2003
aherbelin Page 1/2 1/5/2003 Chemistry152_Lab_Manual.doc

aherbelin Page 2/2 1/5/2003 Chemistry152_Lab_Manual.doc
Contents 1. Excel Tutorial 2. Quantitative Analysis by Titration 3. Chemical Bonding & Molecular Models 4. Determining the Concentration of a Solution: Beer’s Law 5. Rate Law Determination of the Crystal Violet Reaction 6. Chemical Equilibrium: Finding a Constant, Kc 7. Potentiometric Titration 8. Formula Of A Complex Ion 9. Establishing a Table of Reduction Potentials: Micro-Voltaic Cells A. Outline for Formal Laboratory Reports B. Role of Excel and Laboratory Notebook

Experiment
2 Chemistry 152 Experiment 2: Quantitative Analysis by Titration The instructor will give a short introduction to the buret and titration procedures at the beginning of the lab period.
Procedure A: Standardization of an acid solution. A solution of acid which is about 0.5 normal is prepared by dilution of concentrated hydrochloric acid. Obtain a sample of acid in a clean, dry beaker and cover it with a watch glass. This acid will be titrated against a sample of pure sodium carbonate using bromphenol-blue as an indicator at the equivalence point. Sodium carbonate is obtained from the stockroom and this must be weighed in a tared, covered crucible to the nearest 0.001 g. Dissolve the sodium carbonate in 30-40 mL of water in a 250 ml flask. Add 4-5 drops of indicator and titrate with the acid until one drop gives a definite color change. Repeat with a second sample. The two normalities must agree within + 0.004. Record data in a tabular form in your notebook, calculate the normality, and have this data approved by the instructor.
Procedure B: Standardization of a base. Standardize a solution of sodium hydroxide using the acid from part A, and phenolphthalein as an indicator. Pipette 25 ml of the base into the flask, add 4-5 drops of indicator and titrate until one drop gives a colorless solution. Calculate the normality of the base to three significant figures. Repeat. Show agreement to + 0.004.
Procedure C: Back titration of an acid. Bring a weighed 250 ml flask to the stockroom to obtain a sample. Analyze a sample of vinegar for percent by weight of acetic acid, using phenolphthalein as an indicator. Weigh the vinegar. Return to the stockroom for exactly 25.00 ml of your base (Part B standardized base). Titrate the standardized base with excess acid. Calculate the percent acetic acid. This is called a back titration.
Procedure D: Back titration of a base. Bring a weighed 250 ml flask to the stockroom to obtain a sample. Analyze a sample of household ammonia for percent ammonia by weight, using methyl orange as an indicator. Use the same acid as in Part A and B. Titrate NH3 directly with the acid.
Chemistry 152 2- 1

Quantitative Analysis by Titration
Chemistry 152 2- 2
Report Tabulate the data for procedures A, B, C, and D in a second sheet in Excel. Perform all of your calculations using Excel formulas. Calculate relative standard deviation ( %100/ ×= xsRSD ). The Excel formulas for the average ( x ) standard deviation (s) of a range of date (e.g. C1:C10) are AVERAGE(C1:C10) and STDEV(C1:C10), respectively. Titrand
C____V____
TitrantC____V____
Prelab Exercise
Complete the following in your laboratory notebook. You may wish to leave space for your experimental data between sketches. Plan to do at least 2 titrations for each step (hopefully not more than 4). 1. As done in Chemistry 151, sketch the titration for each procedure. Label everything on each sketch, include the chemical name, concentration, and volume for both the titrant and titrand. If a quantity is unknown or the result of a previous procedure, label it as such. 2. Below each titration, write a balanced chemical equation (include phases) for each titration reaction. 3. To how many decimal places must you read the buret for titrations?
Post-Lab Exercises Answer these questions in a separate worksheet in your Excel report. Use Excel formulas for all calculations. You may wish to do the calculations before lab. 1. 35.00 ml of 0.150 molar KOH reacts with a 40.00 ml sample of H3PO4. The reaction is:
H3PO4 (aq) + 2 OH- (aq) HPO4
2- (aq) + 2 H2O (l) Calculate the normality and molarity of the H3PO4 solution.
2. 39.2 ml of 0.1333 molar sulfuric acid was added to a 0.455 g sample of soda ash which is 60.0% sodium carbonate. What volume of 0.105 molar sodium hydroxide is needed for back titration?

Experiment
3 Chemistry 152 Experiment 3: Chemical Bonding & Molecular Models
Objective To illustrate ionic and covalent chemical bonding using Lewis structures; to demonstrate common structural features using molecular models; to illustrate the connection between structures and simple models for chemical bonds.
Discussion The electrons involved in bond formation between atoms are the valence electrons; that is, the electrons in the outermost (or in some transition elements, next to the outermost) energy level of the neutral atom. The number of valence electrons can be identified by the position of the element in the Periodic Table. Valence electrons are usually represented by dots written next to the symbol for the atom. For example, H· or Na·. these are called “electron dot” formulas. In the case of Na·, the single dot represents the electron in the neutral sodium atom (23Na) has in its outermost energy level. The other electrons of the sodium atom are not designated because they are not involved in ordinary chemical reactions and bond formation. When an atom that loses electrons easily, such as sodium, reacts with an atom that gains electrons easily, such as chlorine, the reaction may be illustrated as follows: the single valence electron of sodium is transferred completely to chlorine, resulting in sodium ion, Na+, and chloride ion Cl-. A compound between these two ions if formed by electrostatic forces between the ions; namely, by an ionic bond. Na+ + Cl- Na+Cl- (Sodium Ion) (Chloride Ion) (Sodium chloride,
an ionic compound)
Electron transfer to form oppositely charged ions is favored when the atoms involved differ greatly in electronegativity. Typically, ionic bonds are found in compounds formed by the reaction between a metal in the Periodic Table of Groups IA and IIA (or transition metals), and a highly electronegative nonmetal of Groups VIA and VIIA. In such reactions there is a tendency for the atoms to acquire particularly stable configurations (an octet structure, s2p6). The nature of the bond formed when two atoms such as hydrogen combine to form the molecule H2 may be represented as follows: H· + H· H : H (Hydrogen atoms) (Hydrogen Molecule)
Chemistry 152 3 - 1
Chemical Bonding & Molecular Models
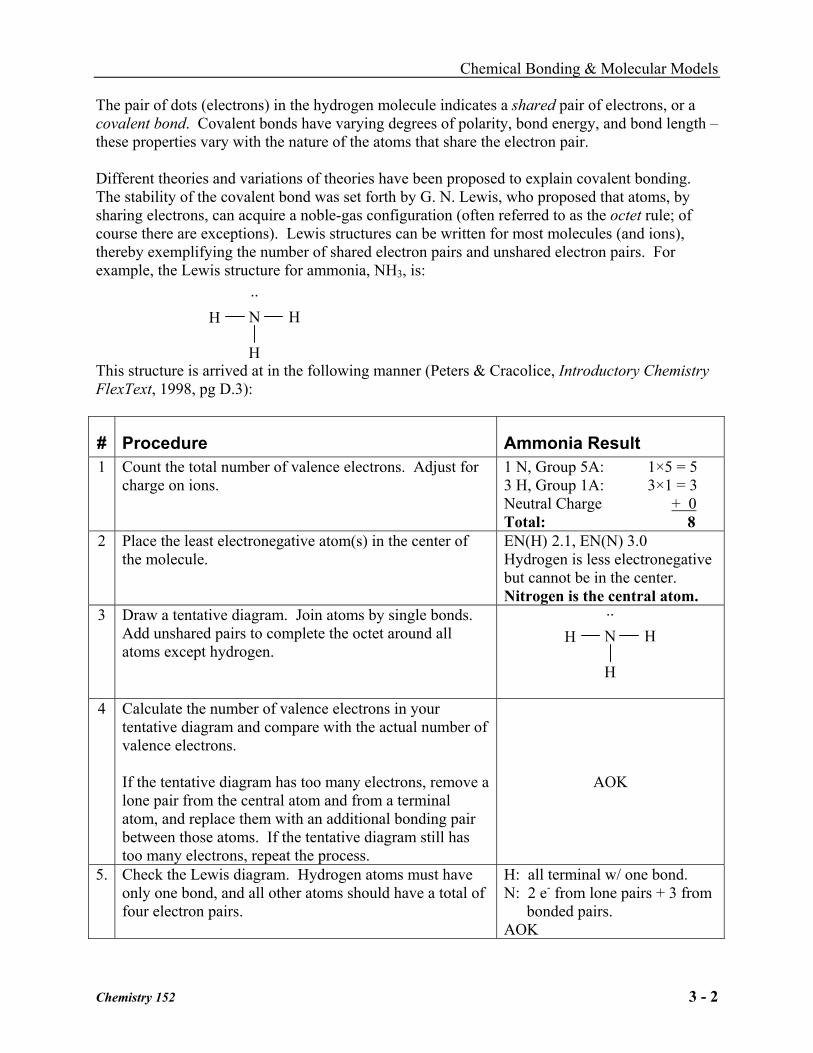
The pair of dots (electrons) in the hydrogen molecule indicates a shared pair of electrons, or a covalent bond. Covalent bonds have varying degrees of polarity, bond energy, and bond length – these properties vary with the nature of the atoms that share the electron pair. Different theories and variations of theories have been proposed to explain covalent bonding. The stability of the covalent bond was set forth by G. N. Lewis, who proposed that atoms, by sharing electrons, can acquire a noble-gas configuration (often referred to as the octet rule; of course there are exceptions). Lewis structures can be written for most molecules (and ions), thereby exemplifying the number of shared electron pairs and unshared electron pairs. For example, the Lewis structure for ammonia, NH3, is:
··
This structure is arrived at in the following manner (Peters & Cracolice, Introductory Chemistry FlexText, 1998, pg D.3):
N
H
H H
# Procedure Ammonia Result 1 Count the total number of valence electrons. Adjust for
charge on ions. 1 N, Group 5A: 1×5 = 5 3 H, Group 1A: 3×1 = 3 Neutral Charge + 0 Total: 8
2 Place the least electronegative atom(s) in the center of the molecule.
EN(H) 2.1, EN(N) 3.0 Hydrogen is less electronegative but cannot be in the center. Nitrogen is the central atom.
3 Draw a tentative diagram. Join atoms by single bonds. Add unshared pairs to complete the octet around all atoms except hydrogen.
4 Calculate the number of valence electrons in your
tentative diagram and compare with the actual number of valence electrons. If the tentative diagram has too many electrons, remove a lone pair from the central atom and from a terminal atom, and replace them with an additional bonding pair between those atoms. If the tentative diagram still has too many electrons, repeat the process.
AOK
5. Check the Lewis diagram. Hydrogen atoms must have only one bond, and all other atoms should have a total of four electron pairs.
H: all terminal w/ one bond. N: 2 e- from lone pairs + 3 from
bonded pairs. AOK
··N
H
H H
Chemistry 152 3 - 2

Chemical Bonding & Molecular Models
Lewis structures, together with the valence bond theory, and the concept of hybrid atomic orbitals, are useful in the prediction of the “geometry” of the molecule. Along with these ideas, the valence shell electron repulsion (VSEPR) theory must be employed: The electron pairs surrounding an atom are oriented to be as far apart as possible; the electron pairs associated with the valence shell of a central atom either are bonding pairs or are unshared pairs that occupy a restricted region of space shaped rather like that occupied by the bonding pair. Thus, for
··N
H ··
: : H H
with three bonds and one unshared pair of electrons; that is, a total of four regions of high electron density, the geometry (shape) would be tetrahedral. The electron density of the unshared pair would “appear” in the geometry of the molecule. However, the shape of the molecule is trigonal pyramidal because there are only 3 bonded pairs of electrons. `
Procedure In this exercise you will write valence symbols by placing dots representing the correct number of valence electrons next to the symbol for the element. You will represent valence electron formulas (Lewis Structures) for ionic compounds by combining the symbols for the particular positive and negative ions. A positive charge (+) indicates one or more electrons have been donated by an atom; a negative charge (-) indicates one or more electrons have been accepted by an atom. You will represent valence electron formulas (Lewis structures) for molecular compounds by combinations of valence electron symbols, with shared pairs of electrons designating covalent bonding. You will construct some geometric models from ball-and-stick or plastic Minit model kits for a few simple molecules, based on Lewis structures plus the VSEPR theory. Remember, as far as molecular geometry is concerned, a double (two shared electron pairs) or a triple (three shared electron pairs) bond has the same representation as a single (one shared electron pair) bond.
Report 1. Write valence electron symbols for the atoms of Period 3 on the Periodic Table; Na, Mg, Al,
Si, P, S, Cl, and Ar.
2. Write valence electron symbols for the ions that would be expected to exist, corresponding to the atoms listed above.
3. Write valence electron formulas for sodium chloride and magnesium chloride, assuming ionic bonding.
4. Write a valence electron formula for silane, SiH4, assuming covalent bonding.
5. Write a valence electron formula for the polyatomic ion, SO42-.
Chemistry 152 3 - 3

Chemical Bonding & Molecular Models
Chemistry 152 3 - 4
Use Tables 10.1 and 10.2 in Chang, 7th Edition to help answer 6 and 7. 6. First, draw Lewis structures for each of the following molecules or ions; then make the
model representing its geometry. [If ball-and-stick models are used, the holes in the balls (atoms) represent electron density (or valence) regions; the sticks represent bonds; the spring must be used for multiple bonds.] record these data in your report, including careful sketches of the models and geometry name on the basis of bonds. H2O NH3 NH4
+ H2 H2C=CH2
BF3 BeF2 CH4 CO N2
7. Classify the geometry of the following species, on the basis of bonds plus unshared pairs of electrons. Refer to examples in the table in your textbook. ICl3 ClF2
- SF6 ClF5 8. What has to be the geometry of a diatomic molecule? Explain.

Experiment
4
Chemistry 152 4 - 1
Determining the Concentration of a Solution: Beer’s Law
The primary objective of this experiment is to determine the concentration of an unknown nickel (II) sulfate solution. You will be using the Colorimeter shown in Figure 1. In this device, red light from the LED light source will pass through the solution and strike a photocell. The NiSO4 solution used in this experiment has a deep green color. A higher concentration of the colored solution absorbs more light (and transmits less) than a solution of lower concentration. The Colorimeter monitors the light received by the photocell as either an absorbance or a percent transmittance value.
Figure 1
Figure 2 You are to prepare five nickel sulfate solutions of known concentration (standard solutions). Each is transferred to a small, rectangular cuvette that is placed into the Colorimeter. The amount of light that penetrates the solution and strikes the photocell is used to compute the absorbance of each solution. When a graph of absorbance vs. concentration is plotted for the standard solutions, a direct relationship should result, as shown in Figure 2. The direct relationship between absorbance and concentration for a solution is known as Beer’s law.
The concentration of an unknown NiSO4 solution is then determined by measuring its absorbance with the Colorimeter. By locating the absorbance of the unknown on the vertical axis of the graph, the corresponding concentration can be found on the horizontal axis (follow the arrows in Figure 2). The concentration of the unknown can also be found using the slope of the Beer’s law curve.

Determining the Concentration of a Solution: Beer’s Law
PROCEDURE 1. Obtain and wear goggles! CAUTION: Be careful not to ingest any NiSO4 solution or spill
any on your skin. Inform your instructor immediately in the event of an accident.
2. Add about 30 mL of 0.40 M NiSO4 stock solution to a 100-mL beaker. Add about 30 mL of distilled water to another 100-mL beaker.
3. Label four clean, dry, test tubes 1-4 (the fifth solution is the beaker of 0.40 M NiSO4). Pipet 2, 4, 6, and 8 mL of 0.40 M NiSO4 solution into Test Tubes 1-4, respectively. With a second pipet, deliver 8, 6, 4, and 2 mL of distilled water into Test Tubes 1-4, respectively. Thoroughly mix each solution with a stirring rod. Clean and dry the stirring rod between stirrings. Keep the remaining 0.40 M NiSO4 in the 100-mL beaker to use in the fifth trial. These solutions are called “standards” or “standard solutions”. They are used to establish a relationship between absorbance and concentration for the colorimeter. Volumes and concentrations for the trials are summarized below:
Trial number
0.40 M NiSO4 (mL)
Distilled H2O (mL)
Concentration (M)
1 2 8 0.08 2 4 6 0.16 3 6 4 0.24 4 8 2 0.32 5 ~10 0 0.40
4. Open the file “Exp 11 Colorimeter” in the Experiment 11 folder of Chemistry with
Computers. The vertical axis has absorbance scaled from 0 to 0.6. The horizontal axis has concentration scaled from 0 to 0.5 mol/L.
5. You are now ready to calibrate the Colorimeter. Prepare a blank by filling a cuvette 3/4 full with distilled water. To correctly use a Colorimeter cuvette, remember: • All cuvettes should be wiped clean and dry on the outside with a tissue. • Handle cuvettes only by the top edge of the ribbed sides. • All solutions should be free of bubbles. • Always position the cuvette with its reference mark facing toward the white reference
mark at the right of the cuvette slot on the Colorimeter. 6. Calibrate the Colorimeter.
a. Holding the cuvette by the upper edges, place it in the cuvette slot of the Colorimeter. b. If your Colorimeter has an AUTO CAL button, set the wavelength on the Colorimeter to
635 nm (Red), press the AUTO CAL button, and proceed directly to Step 7. If your Colorimeter does not have an AUTO CAL button, continue with this step to calibrate your Colorimeter.
First Calibration Point c. Choose Calibrate from the Experiment menu and then click Perform Now . d. Turn the wavelength knob on the Colorimeter to the “0% T” position. e. Type “0” in the edit box. f. When the displayed voltage reading for Input 1 stabilizes, click Keep .
Chemistry 152 4- 2

Determining the Concentration of a Solution: Beer’s Law
Chemistry 152 4- 3
Second Calibration Point g. Turn the knob of the Colorimeter to the Red LED position (635 nm). h. Type “100” in the edit box. i. When the displayed voltage reading for Input 1 stabilizes, click Keep , then click OK .
7. You are now ready to collect absorbance data for the five standard solutions. Click Collect .
Empty the water from the cuvette. Using the solution in Test Tube 1, rinse the cuvette twice with ~1-mL amounts and then fill it 3/4 full. Wipe the outside with a tissue and place it in the Colorimeter. After closing the lid, wait for the absorbance value displayed on the monitor to stabilize. Then click Keep , type “0.080” in the edit box, and press the ENTER key. The data pair you just collected should now be plotted on the graph.
8. Discard the cuvette contents as directed by your instructor. Rinse the cuvette twice with the Test Tube 2 solution, 0.16 M NiSO4, and fill the cuvette 3/4 full. Wipe the outside, place it in the Colorimeter, and close the lid. When the absorbance value stabilizes, click Keep , type “0.16” in the edit box, and press the ENTER key.
9. Repeat the Step 8 procedure to save and plot the absorbance and concentration values of the solutions in Test Tube 3 (0.24 M) and Test Tube 4 (0.32 M), as well as the stock 0.40 M NiSO4. Wait until Step 12 to do the unknown. When you have finished with the 0.40 M NiSO4 solution, click Stop .
10. In your laboratory notebook, record the absorbance and concentration data pairs that are displayed in the Table window.
11. Obtain about 5 mL of the unknown NiSO4 in another clean, dry, test tube. Record the number of the unknown in the Data and Calculations table. Rinse the cuvette twice with the unknown solution and fill it about 3/4 full. Wipe the outside of the cuvette, place it into the Colorimeter, and close the lid. Read the absorbance value displayed in the Meter window. (Important: The reading in the Meter window is live, so it is not necessary to click Collect to read the absorbance value.) When the displayed absorbance value stabilizes, record its value in Trial 6 of the Data and Calculations table.
12. Process the data following the procedure below. If you have bad data points, you will need to redo some of your standard solutions as time allows. Do not discard the solutions until you have a successfully calculated your unknown solution concentration. When done, discard the solution in the appropriate waste container.
PROCESSING THE DATA 1. Copy your data to Microsoft Excel. Generate a calibration curve plotting Absorbance vs.
Concentration. Create a trendline and check the quality of your standard solutions. If a point is off the trendline, consult your instructor.
2. Use the SLOPE and INTERCEPT worksheet functions to get the slope and intercept values into the spreadsheet.
3. Refer to the Hydrogen Emission Spectrum prelab exercise from Chemistry 151 to get mnew and bnew for reversing the calibration curve. Use these values in the reversed calibration equation (x = mnew y + bnew) to calculate your unknown concentration.
4. Check your results with the instructor before cleaning up.

Experiment
5
Chemistry 152 5 - 1
Rate Law Determination of the Crystal Violet Reaction
In this experiment, you will observe the reaction between crystal violet and sodium hydroxide. One objective is to study the relationship between concentration of crystal violet and the time elapsed during the reaction. The equation for the reaction is shown here:
CC
OH
OH–+
N(CH )
N(CH )
N(CH )
+ N(CH )
N(CH )
N(CH )3 3
3
3
3
32
2
2
2
2
2
A simplified (and less intimidating!) version of the equation is:
CV+ + OH– → CVOH (crystal violet) (hydroxide) The rate law for this reaction is in the form: rate = k[CV+]m[OH–]n, where k is the rate constant for the reaction, m is the order with respect to crystal violet (CV+), and n is the order with respect to the hydroxide ion. Since the hydroxide ion concentration is more than 1000 times as large as the concentration of crystal violet, [OH-] will not change appreciably during this experiment. Thus, you will find the order with respect to crystal violet (m), but not the order with respect to hydroxide (n).
As the reaction proceeds, a violet-colored reactant will be slowly changing to a colorless product. Using the green (565 nm) light source of a computer-interfaced Colorimeter, you will monitor the absorbance of the crystal violet solution with time. We will assume that absorbance is proportional to the concentration of crystal violet (Beer’s law). Absorbance will be used in place of concentration in plotting the following three graphs:
• Absorbance vs. time: A linear plot indicates a zero order reaction (k = –slope). • ln Absorbance vs. time: A linear plot indicates a first order reaction (k = –slope). • 1/Absorbance vs. time: A linear plot indicates a second order reaction (k = slope).
Once the order with respect to crystal violet has been determined, you will also be finding the rate constant, k, and the half-life for this reaction. MATERIALS
Power Macintosh or Windows PC 0.020 M NaOH Vernier computer interface 2.0 X 10⁻⁵ M crystal violet Logger Pro distilled water Vernier Colorimeter stirring rod one plastic cuvette two 10-mL graduated cylinders 250-mL beaker

Rate Law Determination of the Crystal Violet Reaction
PROCEDURE 1. Obtain and wear goggles.
2. Use a 10-mL graduated cylinder to obtain 10.0 mL of 0.020 M NaOH solution. CAUTION: Sodium hydroxide solution is caustic. Avoid spilling it on your skin or clothing. Use another 10-mL graduated cylinder to obtain 10.0 mL of 2.0 X 10⁻⁵ M crystal violet solution. CAUTION: Crystal violet is a biological stain. Avoid spilling it on your skin or clothing.
3. Prepare the computer for data collection by opening the file in the Experiment 30 folder of Chemistry with Computers. The vertical axis has absorbance scaled from 0 to 0.35. The horizontal axis has time scaled from 0 to 20 minutes.
4. Prepare a blank by filling an empty cuvette 3/4 full with water. Seal the cuvette with a lid. To correctly use a colorimeter cuvette, remember: • All cuvettes should be wiped clean and dry on the outside with a tissue. • Handle cuvettes only by the top edge of the ribbed sides. • All solutions should be free of bubbles. • Always position the cuvette with its reference mark facing toward the white reference
mark at the right of the cuvette slot on the Colorimeter.
5. Calibrate the Colorimeter. a. Holding the cuvette by the upper edges, place it in the cuvette slot of the Colorimeter. b. If your Colorimeter has an AUTO CAL button, set the wavelength on the Colorimeter to
565 nm (Green), press the AUTO CAL button, and proceed directly to Step 6. If your Colorimeter does not have an AUTO CAL button, continue with this step to calibrate your Colorimeter.
First Calibration Point c. Choose Calibrate from the Experiment menu and click Perform Now . d. Turn the wavelength knob on the Colorimeter to the “0% T” position. e. Type “0” in the edit box. f. When the displayed voltage reading for Input 1 stabilizes, click Keep . Second Calibration Point g. Turn the wavelength knob of the Colorimeter to the Green LED position (565 nm). h. Type “100” in the edit box. i. When the displayed voltage reading for Input 1 stabilizes, click Keep , then click OK .
6. To initiate the reaction, simultaneously pour the 10-mL portions of crystal violet and sodium
hydroxide into a 250-mL beaker and stir the reaction mixture with a stirring rod. Click Collect . Note: Because the initial data are sometimes sporadic, you will not actually take a
reading until 3 minutes have passed. Empty the water from the cuvette. Rinse the cuvette twice with ~1-mL amounts of the reaction mixture and then fill it 3/4 full. Do not put the cuvette in the Colorimeter yet. To keep the solution from warming inside the Colorimeter, the cuvette is left outside the Colorimeter between readings.
7. After about three minutes have passed since combining the 2 solutions, wipe the outside of the cuvette, place it in the cuvette slot of the Colorimeter, and close the lid. Wait for the absorbance reading to stabilize. When it is stable, click Keep —this saves both the absorbance and time data values. Remove the cuvette from the Colorimeter. After 45 seconds have elapsed, again place the cuvette in the Colorimeter, wait for the absorbance to stabilize,
Chemistry 152 5 - 2

Rate Law Determination of the Crystal Violet Reaction
and click Keep . After saving this second data pair, remove the cuvette again. Continue in this manner, collecting data about once every minute, until 20 minutes have elapsed.
8. Data collection will end after 20 minutes. Discard the beaker and cuvette contents as directed by your instructor.
9. The next several steps describe how to analyze the data graphically to decide if the reaction is zero, first, or second order with respect to crystal violet. • Zero Order: If the current graph of absorbance vs. time is linear, the reaction is zero order. • First Order: To see if the reaction is first order, it is necessary to plot a graph of the natural
logarithm (ln) of absorbance vs. time. If this plot is linear, the reaction is first order. • Second Order: To see if the reaction is second order, plot a graph of the reciprocal of
absorbance vs. time. If this plot is linear, the reaction is second order.
10. Copy the data to Excel. Create a graph of the Absorbance vs. Time data. Make sure it is properly formatted and labeled.
11. Follow these directions to create a calculated column, ln Absorbance, and then plot a graph of ln Absorbance vs. time: a. Label the column to the right of your data “ln Absorbance” b. Enter the correct formula for the column into the first row of this data (e.g. “=ln(C5)” if
your absorbance data is in column C and starts at row 5). c. Create a graph of the Absorbance vs. Time data. Make sure it is properly formatted and
labeled. 11. Follow these directions to create a calculated column, 1/Absorbance, and then plot a graph of
1/Absorbance vs. time: a. Label the next column to the right of your data “1/Absorbance” b. Enter the correct formula for the column into the first row of this data (e.g. “=1/C5” if
your absorbance data is in column C and starts at row 5). c. Create a graph of the Absorbance vs. Time data. Make sure it is properly formatted and
labeled. 12. Determine which graph is linear. Record this result in your laboratory notebook.
PROCESSING THE DATA 1. Was the reaction zero, first, or second order, with respect to the concentration of crystal
violet? Explain.
2. Calculate the rate constant, k, using the slope of the linear regression line for your linear curve (k = –slope for zero and first order and k = slope for second order). Be sure to include correct units for the rate constant. Note: This constant is sometimes referred to as the pseudo rate constant, because it does not take into account the effect of the other reactant, OH-.
3. Write the correct rate law expression for the reaction, in terms of crystal violet (omit OH-).
4. Using the data, estimate the half-life of the reaction; select two points, one with an absorbance value that is about half of the other absorbance value. The time it takes the absorbance (or concentration) to be halved is known the half-life for the reaction. (As an alternative, you may choose to calculate the half-life from the rate constant, k, using the appropriate concentration-time formula.)
Chemistry 152 5 - 3
Experiment
6
Chemistry 152 6 - 1
Chemical Equilibrium: Finding a Constant, Kc
The purpose of this lab is to experimentally determine the equilibrium constant, Kc, for the following chemical reaction:
Fe3+(aq) + SCN–(aq) FeSCN← → 2+(aq)
iron(III) thiocyanate thiocyanoiron(III) When Fe3+ and SCN- are combined, equilibrium is established between these two ions and the FeSCN2+ ion. In order to calculate Kc for the reaction, it is necessary to know the concentrations of all ions at equilibrium: [FeSCN2+]eq, [SCN–]eq, and [Fe3+]eq. You will prepare four equilibrium systems containing different concentrations of these three ions. The equilibrium concentrations of the three ions will then be experimentally determined. These values will be substituted into the equilibrium constant expression to see if Kc is indeed constant.
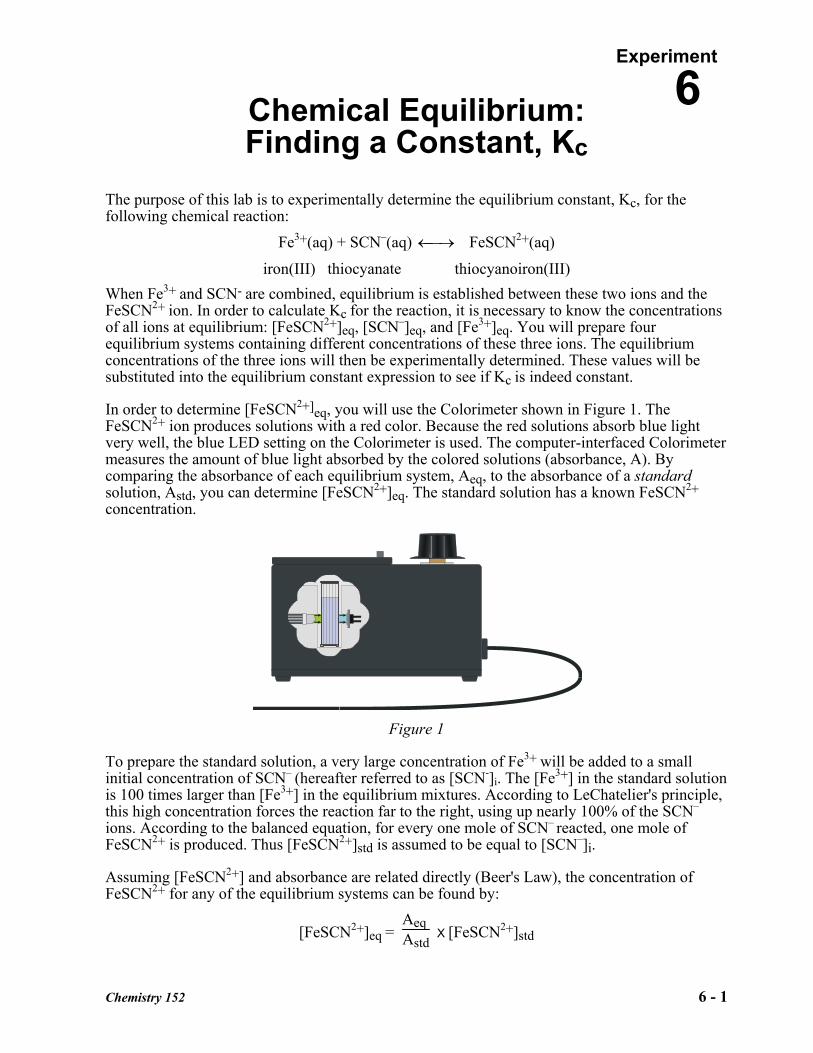
In order to determine [FeSCN2+]eq, you will use the Colorimeter shown in Figure 1. The FeSCN2+ ion produces solutions with a red color. Because the red solutions absorb blue light very well, the blue LED setting on the Colorimeter is used. The computer-interfaced Colorimeter measures the amount of blue light absorbed by the colored solutions (absorbance, A). By comparing the absorbance of each equilibrium system, Aeq, to the absorbance of a standard solution, Astd, you can determine [FeSCN2+]eq. The standard solution has a known FeSCN2+ concentration.
Figure 1
To prepare the standard solution, a very large concentration of Fe3+ will be added to a small initial concentration of SCN– (hereafter referred to as [SCN-]i. The [Fe3+] in the standard solution is 100 times larger than [Fe3+] in the equilibrium mixtures. According to LeChatelier's principle, this high concentration forces the reaction far to the right, using up nearly 100% of the SCN– ions. According to the balanced equation, for every one mole of SCN– reacted, one mole of FeSCN2+ is produced. Thus [FeSCN2+]std is assumed to be equal to [SCN–]i.
Assuming [FeSCN2+] and absorbance are related directly (Beer's Law), the concentration of FeSCN2+ for any of the equilibrium systems can be found by:
[FeSCN2+]eq = Aeq Astd
X [FeSCN2+]std

Chemical Equilibrium: Finding a Constant, Kc
Chemistry 152 6 - 2
Knowing the [FeSCN2+]eq allows you to determine the concentrations of the other two ions at equilibrium. For each mole of FeSCN2+ ions produced, one less mole of Fe3+ ions will be found in the solution (see the 1:1 ratio of coefficients in the equation on the previous page). The [Fe3+] can be determined by:
[Fe3+]eq = [Fe3+]i – [FeSCN2+]eq Because one mole of SCN- is used up for each mole of FeSCN2+ ions produced, [SCN–]eq can be determined by:
[SCN–]eq = [SCN–]i – [FeSCN2+]eq Knowing the values of [Fe3+]eq, [SCN–]eq, and [FeSCN2+]eq, you can now calculate the value of Kc, the equilibrium constant. MATERIALS
Power Macintosh or Windows PC 0.0020 M KSCN Vernier computer interface 0.0020 M Fe(NO3)3 (in 1.0 M HNO3) Logger Pro 0.200 M Fe(NO3)3 (in 1.0 M HNO3) Vernier Colorimeter four pipets 1 plastic cuvette pipet bulb or pipet pump five 20 X 150 mm test tubes three 100-mL beakers thermometer tissues (preferably lint-free)
PROCEDURE 1. Obtain and wear goggles.
2. Label four 20 X 150 mm test tubes 1-4. Pour about 30 mL of 0.0020 M Fe(NO3)3 into a clean, dry 100-mL beaker. Pipet 5.0 mL of this solution into each of the four labeled test tubes. Use a pipet pump or bulb to pipet all solutions. CAUTION: Fe(NO3)3 solutions in this experiment are prepared in 1.0 M HNO3 and should be handled with care. Pour about 25 mL of the 0.0020 M KSCN into another clean, dry 100-mL beaker. Pipet 2, 3, 4 and 5 mL of this solution into Test Tubes 1-4, respectively. Obtain about 25 mL of distilled water in a 100-mL beaker. Then pipet 3, 2, 1 and 0 mL of distilled water into Test Tubes 1-4, respectively, to bring the total volume of each test tube to 10 mL. Mix each solution thoroughly with a stirring rod. Be sure to clean and dry the stirring rod after each mixing. Measure and record the temperature of one of the above solutions to use as the temperature for the equilibrium constant, Kc. Volumes added to each test tube are summarized below:
Test Tube
Number Fe(NO3)3
(mL) KSCN (mL)
H2O (mL)
1 5 2 3 2 5 3 2 3 5 4 1 4 5 5 0

Chemical Equilibrium: Finding a Constant, Kc
3. Prepare a standard solution of FeSCN2+ by pipetting 18 mL of 0.200 M Fe(NO3)3 into a 20 X 150 mm test tube labeled “5”. Pipet 2 mL of 0.0020 M KSCN into the same test tube. Stir thoroughly.
4. Prepare the computer for data collection by opening the file in the Experiment 20 folder of Chemistry with Computers. You should see a live Meter window to display absorbance, and a Table window with columns for the trial number and the absorbance value.
5. Prepare a blank by filling a cuvette 3/4 full with distilled water. To correctly use a Colorimeter cuvette, remember: • All cuvettes should be wiped clean and dry on the outside with a tissue. • Handle cuvettes only by the top edge of the ribbed sides. • All solutions should be free of bubbles. • Always position the cuvette with its reference mark facing toward the white reference
mark at the right of the cuvette slot on the Colorimeter. 6. Calibrate the Colorimeter.
a. Holding the cuvette by the upper edges, place it in the cuvette slot of the Colorimeter. b. If your Colorimeter has an AUTO CAL button, set the wavelength on the Colorimeter to
470 nm (Blue), press the AUTO CAL button, and proceed directly to Step 7. If your Colorimeter does not have an AUTO CAL button, continue with this step to calibrate your Colorimeter.
First Calibration Point c. Choose Calibrate from the Experiment menu and then click Perform Now . d. Turn the wavelength knob on the Colorimeter to the “0% T” position. e. Type “0” in the edit box. f. When the displayed voltage reading for Input 1 stabilizes, click Keep .
Second Calibration Point g. Turn the knob of the Colorimeter to the Blue LED position (470 nm). h. Type “100” in the edit box. i. When the displayed voltage reading for Input 1 stabilizes, click Keep , then click OK .
7. You are now ready to collect absorbance data for the four equilibrium systems and the
standard solution.
a. Click Collect to begin data collection. b. Empty the water from the cuvette. Rinse it twice with ~1-mL portions of the Test Tube 1
solution. c. Wipe the outside of the cuvette with a tissue and then place the cuvette in the Colorimeter.
After closing the lid, wait for the absorbance value displayed in the Meter window to stabilize. Then click Keep , type “1” (the trial number) in edit box, and press the ENTER key.
d. Discard the cuvette contents as directed by your teacher. Rinse the cuvette twice with the Test Tube 2 solution and fill the cuvette 3/4 full. Follow the Step-c procedure to find the absorbance of this solution. Type “2” in the edit box and press ENTER.
e. Repeat the Step-d procedure to find the absorbance of the solutions in Test Tubes 3, 4, and 5 (the standard solution).
Chemistry 152 6 - 3

Chemical Equilibrium: Finding a Constant, Kc
Chemistry 152 6 - 4
f. From the Table window, record the absorbance values for each of the five trials in your data table.
g. Dispose of all solutions as directed by your instructor. PROCESSING THE DATA 1. Write the Kc expression for the reaction in your laboratory notebook.
2. Calculate the initial concentration of Fe3+, based on the dilution that results from adding KSCN solution and water to the original 0.0020 M Fe(NO3)3 solution. See Step 2 of the procedure for the volume of each substance used in Trials 1-4. Calculate [Fe3+]i using the equation:
[Fe3+]i = Fe(NO3)3 mL
total mL X (0.0020 M) This should be the same for all four test tubes.
3. Calculate the initial concentration of SCN–, based on its dilution by Fe(NO3)3 and water:
[SCN–]i = KSCN mLtotal mL X (0.0020 M)
In Test Tube 1, [SCN–]i = (2 mL / 10 mL)(.0020 M) = .00040 M. Calculate this for the other three test tubes.
4. [FeSCN2+]eq is calculated using the formula:
[FeSCN2+]eq = Aeq Astd
X [FeSCN2+]std where Aeq and Astd are the absorbance values for the equilibrium and standard test tubes,
respectively, and [FeSCN2+]std = (1/10)(0.0020) = 0.00020 M. Calculate [FeSCN2+]eq for each of the four trials.
5. [Fe3+]eq: Calculate the concentration of Fe3+ at equilibrium for Trials 1-4 using the equation:
[Fe3+]eq = [Fe3+]i – [FeSCN2+]eq
6. [SCN–]eq: Calculate the concentration of SCN- at equilibrium for Trials 1-4 using the equation:
[SCN–]eq = [SCN–]i – [FeSCN2+]eq 7. Calculate Kc for Trials 1-4. Be sure to show the Kc expression and the values substituted in
for each of these calculations.
8. Using your four calculated Kc values, determine an average value for Kc. How constant were your Kc values?

Experiment
7 Acid Dissociation Constant, Ka
In this experiment you will: • Gain experience mixing solutions of specified concentration. • Experimentally determine the dissociation constant, Ka, of an acid. • Investigate the effect of initial solution concentration on the equilibrium constant.
The acid to be used is acetic acid, HC2H3O2, and its dissociation equation is:
HC2H3O2(aq) → H+(aq) + C2H3O2–(aq)
MATERIALS
Vernier computer interface wash bottle Logger Pro distilled water Vernier pH Sensor 100-mL volumetric flask 100-mL beaker pipets 2.00 M HC2H3O2 pipet bulb
PRE-LAB 1. Write the equilibrium constant expression, Ka, for the dissociation of acetic acid, HC2H3O2.
2. You have been assigned two different HC2H3O2 solution concentrations by your instructor. Determine the volume, in mL, of 2.00 M HC2H3O2 required to prepare each. (Show your calculations and answers in Space 4 of the Data and Calculations table.)
Figure 1
Chemistry with Computers 7 - 1

Acid Dissociation Constant, Ka
PROCEDURE 1. Obtain and wear safety goggles.
2. Put approximately 50 mL of distilled water into a 100-mL volumetric flask.
3. Use a pipet bulb (or pipet pump) to pipet the required volume of 2.00 M acetic acid (calculated in Pre-Lab Step 2) into the volumetric flask. CAUTION: Use care when handling the acetic acid. It can cause painful burns if it comes in contact with your skin or gets into your eyes. Fill the flask with distilled water to the 100-mL mark. To prevent overshooting the mark, use a wash bottle filled with distilled water for the last few mL. Mix thoroughly.
4. Use a utility clamp to secure a pH Sensor to a ring stand as shown in Figure 1.
5. Prepare the computer for data collection by opening the file in the Experiment 27 folder of Chemistry with Computers. The Meter window will display live pH readings.
6. Determine the pH of your solution as follows: • Use about 40 mL of distilled water in a 100-mL beaker to rinse the pH Sensor. • Pour about 30 mL of your solution into a clean 100-mL beaker and use it to thoroughly
rinse the sensor.
• Repeat the previous step by rinsing with a second 30-mL portion of your solution. • Use the remaining 40-mL portion to determine pH. Swirl the solution vigorously. (Note:
Readings may drift without proper swirling!) Record the measured pH reading in your data table.
• When done, place the pH Sensor in distilled water. 7. Repeat the procedure for your second assigned solution.
PROCESSING THE DATA 1. Use a scientific calculator to determine the [H+]eq from the pH values for each solution.
2. Use the obtained value for [H+]eq and the equation: HC2H3O2(aq) → H+(aq) + C2H3O2
–(aq) to determine [C2H3O2
–]eq and [HC2H3O2]eq.
3. Substitute these calculated concentrations into the Ka expression you wrote in Step 1 of the Pre-Lab.
4. Compare your results with those of other students. What effect does initial HC2H3O2 concentration seem to have on Ka?
Chemistry with Computers 7 - 2

Acid Dissociation Constant, Ka
Chemistry with Computers 7 - 3
SAMPLE DATA TABLE
1. Assigned concentration M M
2. Measured pH 3. Ka expression
4. Volume of 2 M acetic acid
mL
mL
5. [H+]eq
M
M
6. [C2H3O2–]eq
M
M
7. [HC2H3O2]eq
M
M
8. Ka calculation

Experiment
8 Chemistry 152 Experiment 8: Formula Of A Complex Ion LEARNING OBJECTIVES The objectives of this experiment are to ... • investigate the formula of the Complexes formed between Ni2+ and ethylenediamine (en) and
between Cu2+ and en. • determine the maximum number of en molecules that will bind to Ni2+ and Cu2+ by making
heat of reaction measurements with the Vernier Interface BACKGROUND When a metal ion such as Ni2+ is present in aqueous solution, the metal ion interacts with solvent water molecules and forms what is called a complex ion. For Ni2+ the complex ion has the formula Ni(OH2)6
2+. Note that six water molecules interact and bond with each Ni2+. The complex has an octahedral geometry as shown in Figure 1. There is some terminology that is used when describing complex ions. The metal ion is called the central metal ion and the molecules bonded to the central metal ion are called ligands. In this example the central metal ion is Ni2+ and the ligand is H2O. There is a limit to the number of bonds that a central metal ion can form with ligands. In the above example this number is six. This maximum bond number is called the coordination number of the central metal ion. Hence the coordination number of Ni2+ is six. Six is a very common coordination number but certainly not the only possibility. For other central metal ions, coordination numbers or two, three, four, five, seven and eight are known as well.
Figure 1. Structure of Ni(OH2)62+
According to Figure 1, bonding occurs between the Ni2+ and the oxygen atom in the water molecule. Recall that the oxygen atom in H2O contains two lone electron pairs. Ligands must always have at least one lone electron pair to bond to the central metal ion (i.e. they are Lewis bases).
If ligands other than water molecules are available in solution, they can selectively bond to the central metal ion and displace the original water ligands. An example is ammonia, NH3. If NH3 is added to a solution originally containing Ni(OH2)6
2+, the complex Ni(NH3)62+ is formed. Its
structure is shown in Figure 2. You probably have observed this reaction in the laboratory. If ammonia is added to an aqueous solution of Ni(NO3)2, the solution color changes from light green to a sky blue. The green color is due to the presence of Ni(OH2)6
2+ and the blue color denotes the presence of Ni(NH3)6
2+. Note that even though the ligand has changed, the coordination number of Ni2+ remains the same. Note as well that the bonding occurs between
Chemistry 152 8- 1

Formula Of A Complex Ion
the Ni2+ ion and the nitrogen atom in the ammonia molecule because the nitrogen atom contains the lone electron pair.
Some ligands have a structure which allows them to form more than one bond with the central metal ion. An example is the molecule ethylenediamine (abbreviated en). The formula for en is H2NCH2CH2NH2. Each nitrogen atom in en has a lone electron pair and can bond to the central metal ion. This assumes, of course, that the en molecule is long enough to allow each nitrogen to bond with the central metal ion at adjacent coordination positions. Since the carbon atoms in en function as a chain to connect the two nitrogen atoms, the relevant nature of the ligand en can be abbreviated as N---N. Bonding involves interaction of the free electron pair on each nitrogen with the central metal ion.
Figure 2. Structure of Ni(NH3)62+
Figure 3. Structure of Ni(en)32+
A specific example is the complex formed between Ni2+ and en. It has the formula Ni(en)3
2+ and the structure displayed in Figure 3. Since Ni2+ has coordination number six and en can occupy two coordination positions, three molecules of en react with each Ni2+ ion.
The reaction between Ni(OH2)62+ and en is rapid and
quite exothermic. See Table 1 below.
Table 1. Heats of Reaction of Ni(OH2)62+ with Ethylenediamine.
Reaction ∆H (kJ/mol Ni)
Ni(OH2)62+ + en Ni(en)(OH2)4
2+ + 2 H2O
Ni(en)(OH2)42+ + en Ni(en)2(OH2)2
2+ + 2 H2O
Ni(en)2(OH2)22+ + en Ni(en)3
2+ + 2 H2O
-38
-38
-41
The maximum number of en molecules which will bind to Ni2+ can be verified by the following series of experiments in combination with the data in Table 1. Experiment 1 Reaction of 1 mol Ni(OH2)6
2+ with 1 mol en in aqueous solution. Since the reaction is exothermic, the temperature of the reaction mixture will increase. If the temperature increase is followed with the Vernier interface, ∆T can be easily determined graphically.
Chemistry 152 8- 2

Formula Of A Complex Ion
Experiment 2 Reaction of the solution in Experiment 1 (1 mole of Ni(en)(OH2)42+) with 1
additional mole en. Since this reaction is also exothermic, the temperature of the solution should again increase. According to Table 1, ∆T for Experiment 2 should be about the same as ∆T for Experiment 1.
Experiment 3 Reaction of the solution in Experiment 2 (1 mole of Ni(en)2(OH2)22+) with 1
additional mole en. Since this reaction is also exothermic, the temperature of the solution should again increase. According to Table 1, ∆T for Experiment 3 should be about the same as ∆T for Experiments 1 and 2.
Experiment 4 Reaction of the solution in Experiment 3 (1 mole of Ni(en)32+) with 1
additional mole en. As a result of Experiment 3 all six coordination positions of Ni2+ should be occupied by en since 1 mol Ni and 3 mol en have been added. Hence there should be no reaction in Experiment 4 and the temperature of the solution should not rise. In fact, ∆T ~ 0 for Experiment 4 would indicate a maximum Ni to en mole ratio of 1:3.
If the results of Experiment 1 through 4 follow our predictions, the formula of the complex formed will have been verified as Ni(en)3
2+, i.e., a maximum of 3 molecules of en for each Ni2+ ion. A major goal of this exercise is to carry out the above experiments and determine the maximum number of en molecules that will bind to Ni2+.
Figure 4. Structure of Cu(OH)6
2+ Figure 5. Possible Cu-en structure. Cu2+ ion, like Ni2+ ion, has a coordination number of six. In Ni(OH2)6
2+, however, all six Ni-OH2 bonds have the same length. Such is not the case for Cu(OH2)6
2+. The Cu(OH2)62+
octahedron is distorted with four Cu-OH2 bonds much shorter than the other two Cu-OH2 bonds as shown in Figure 4. The four shorter Cu-OH2 bonds form a square planar arrangement with the two longer bonds above and below the plane in two axial positions. Because of these bond length differences, it remains to be seen whether or not three en molecules can coordinate to Cu2+. Because the carbon chain in en is fixed in length, it may be that an en molecule is not long enough to bond from a planar position up or down to an axial position. If this is the case, one
Chemistry 152 8- 3

Formula Of A Complex Ion
would expect to be able to coordinate only two en molecules to Cu2+. See Figure 5. If so, the predicted formula for the complex formed between Cu(OH2)6
2+ an en would be Cu(en)2(OH2)22+,
or a maximum of 2 en molecules for each Cu2+ ion. On the other hand, if the difference between planar and axial distances is not too great, 3 en molecules could coordinate to Cu2+ yielding a structure similar to the Ni(en)3
2+ complex shown in Figure 3. Analogous to Ni(OH2)6
2+ and en, the reaction between Cu(OH2)62+ and en is rapid and quite
exothermic. Hence an experimental scheme similar to that described on the preceding page can be used to determine the maximum number of en molecules that will bind to Cu2+. A second major goal of this laboratory exercise is to carry out this experimental scheme and determine the maximum number of en molecules that will bind to Cu2+. Safety Precautions
Ethylenediamine is a basic, caustic substance. Any contacted skin should be washed immediately with soap and cool water. Any solutions containing Ni, Cu, or en should be placed in their respective waste bottles. Safety goggles must be worn at all times in the lab. As usual, wash hands with soap and water before leaving the lab. Experimental Procedure Vernier Software Configure the Vernier software to measure Temperature vs. Time. The program should be configured to display temperatures between 15 and 30 °C for 0 to 250 seconds at a rate of 1 reading per second. It is recommended that you test the program before starting the experiment. Running the Experiment Obtain a Styrofoam cup, interface box, and temperature probe from the stockroom. The Ni(OH2)6
2+ / Ethylenediamine Reaction Series 1. Measure exactly 25 ml of 0.20 M NiSO4 solution into a clean, dry 25 ml graduated cylinder.
2. Obtain ~10 mL of 5.0 M ethylenediamine in a beaker. Practice using your graduated pipette
for quickly measuring exactly 1 ml of this solution.
3. Transfer the NiSO4 solution into the dry calorimeter (place the Styrofoam cup into a suitably sized beaker for stability). Place the dry thermocouple in the cup and gently stir for 60 seconds for the temperature to equilibrate.
4. Start data collection. As the experiment starts, you should see successive, constant temperature readings of near room temperature. Allow these readings to continue for 25 seconds to establish an initial temperature baseline value.
Chemistry 152 8- 4

Formula Of A Complex Ion
5. Using the pipette, quickly add 1.0 ml of the ethylenediamine solution to the calorimeter. As the reaction occurs, you should observe an increase in temperature. Continue taking data until a constant temperature plateau is established (probably about 25 seconds from the time of ethylenediamine addition).
6. Without stopping the experiment, quickly add a second 1.0 ml aliquot of the ethylenediamine solution to the calorimeter. Again the temperature should rise. Continue taking data until a constant temperature plateau is established (about 25 seconds).
7. Repeat step 6 two additional times.
8. After four individual aliquots of ethylenediamine have been added to the NiSO4 solution and the temperature has stabilized, stop the experiment. (total experiment time should be about 150 seconds.)
The Cu(OH2)6
2+ / Ethylenediamine Reaction Series This series of experiments is conducted in a manner identical to that described above except that 0.20 M CuSO4 solution is used instead of 0.20 M NiSO4. Also, four separate additions of ethylenediamine may not be necessary. Data Analysis Do the following for the Ni(OH2)6
2+/en reaction series and the Cu(OH2)62+/en series.
1. Copy the data to Excel and plot temperature vs. Time. Be sure to properly label and format the graph.
2. Using the above graphs, indicate the maximum number of moles of ethylenediamine per one
mole of each metal ion. Write the correct formula for the complex ion. Results Ni(OH2)6
2+ / Ethylenediamine System Maximum en/Ni ratio _______________ Formula of Complex Ion _________ Cu(OH2)6
2+ / Ethylenediamine System Maximum en/Cu ratio _______________ Formula of Complex Ion _________
Chemistry 152 8- 5

Formula Of A Complex Ion
Prelab Exercises 1. When ethylenediamine (en) is added to an aqueous solution of NiSO4, the color changes.
Explain why this occurs.
2. When a 5.0 ml, sample of 15 M ethylenediamine is added to 50.0 ml of 0.15 M MSO4 (where M is a 2+ transition metal ion) the temperature changes from 22.78°C to 23.88 °C. Calculate ∆H for reaction of one mole of the transition metal ion. Write the equation for the reaction that is occurring. Assume that the calorimeter has a heat capacity of l.0×l01 J/°C, that the final solution has a density of 1.0 g/mL, and that the heat capacity of the solution is 4.18 J/(g°C).
Chemistry 152 8- 6

Experiment
9 Chemistry 152 Experiment 9: Potentiometric Titration The student is responsible for development of the procedure for this experiment. Use the skills and methods from Experiments 2 and 7. This procedure must be written before coming to lab.
Required Results 1. Standardize Alkaline Titrant 2. Determine concentration of unknown weak solution to 4 significant figures with at least
two runs. 3. Generate titration plot with pH at each point on your titration curve. This curve should
have many points throughout the curve to produce an appealing plot. 4. Label titration plot with buffer point, endpoint (equivalence point). 5. Measure pKa of weak acid from titration curve, identify unknown acid.
Report This experiment requires a written, formal report. More information is available in Appendixes A & B.
Prelab Exercise Complete the following in your laboratory notebook or a computer document. Plan and write a procedure for your experiment. Remember you only have a few hours to get the work done! You may wish to sketch the titrations that you will be doing to avoid confusion.
Chemistry 152 9- 1

Experiment
10
Chemistry 152 10 - 1
Establishing a Table of Reduction Potentials: Micro-Voltaic Cells
The main objective of this experiment is to establish the reduction potentials of five unknown metals relative to an arbitrarily chosen metal. This will be done by measuring the voltage, or potential difference, between various pairs of half-cells. A voltaic cell utilizes a spontaneous oxidation-reduction reaction to produce electrical energy. Half-cells are normally produced by placing a piece of metal into a solution containing a cation of the metal (e.g., Cu metal in a solution of CuSO4 or Cu2+). In this micro-version of a voltaic cell, the half cell will be a small piece of metal placed into 3 drops of solution on a piece of filter paper. The solution contains the cation of the solid metal. Figure 1 shows the arrangement of half-cells on the piece of filter paper. The two half-reactions are normally separated by a porous barrier or a salt bridge. Here, the salt bridge will be several drops of aqueous NaNO3 placed on the filter paper between the two half cells. Using the computer as a voltmeter, the (+) lead makes contact with one metal and the (–) lead with another. If a positive voltage is recorded on the screen, you have connected the cell correctly. The metal attached to the (+) lead is the cathode (reduction) and thus has a higher, more positive, reduction potential. The metal attached to the (–) lead is the anode (oxidation) and has the lower, more negative, reduction potential. If you get a negative voltage reading,1 then you must reverse the leads. By comparing the voltage values obtained for several pairs of half-cells, and by recording which metal made contact with the (+) and (–) leads, you can establish the reduction potential sequence for the five metals in this lab. MATERIALS
Power Macintosh or Windows PC one piece of filter paper, 11.0 cm diameter Vernier computer interface 1 X 1 cm metals M1, M2, M3, M4 and M5 Logger Pro 1 M NaNO3 Vernier Voltage Probe 1 M solutions of M1
2+, M22+, ..., and M5
2+one glass plate, 15 X 15 cm, or one Petri sand paper
dish, 11.5 cm diameter forceps PROCEDURE 1. Obtain and wear goggles.
2. Prepare the computer for data collection by opening the Experiment 28 folder from Chemistry with Computers. Then open the experiment file that matches the probe and interface you are using. The computer is now set to monitor potential, in volts. You can read the potential in the Meter window when the leads are connected to a cell. When the Voltage Probe leads are not in contact with a cell (or each other), a meaningless default voltage may be displayed. If you touch the two leads together, the voltage will drop to 0.00 V.
1 Having the leads reversed when using a ULI or Serial Box Interface will give a voltage reading of 0.00 V instead
of a negative voltage.

Establishing a Table of Reduction Potentials: Micro-Voltaic Cells
3. Obtain a piece of filter paper and draw five small circles with connecting lines, as shown in Figure 1. Using a pair of scissors, cut wedges between the circles as shown. Label the circles M1, M2, M3, M4, and M5. Place the filter paper on top of the glass plate.
M
M
M
M
M
1 2
3
4
5
•
••
••
•••••
••
•
•
•
•
•
•••
•
Figure 1
4. Obtain 5 pieces of metal, M1, M2, M3, M4, and M5. Sand both surfaces of each piece of metal. Place each metal near the circle with the same number.
5. Place 3 drops of each solution on its circle (M12+ on M1, etc.). Then place the piece of metal
on the wet spot with its respective cation. The top side of the metal should be kept dry. Then add several drops of 1 M NaNO3 to the line drawn between each circle and the center of the filter paper. Be sure there is a continuous trail of NaNO3 between each circle and the center. You may have to periodically dampen the filter paper with NaNO3 during the experiment. CAUTION: Handle these solutions with care. Some are poisonous and some cause hard-to-remove stains. If a spill occurs, ask your teacher how to clean up safely.
6. Use metal M1 (the one that is obviously copper) as the reference metal. Determine the potential of four cells by connecting M1 to M2, M1 to M3, M1 to M4, and M1 to M5. This is done by bringing the (+) lead in contact with one metal and the (–) lead in contact with the other. If the voltage displayed in the Meter window is negative (with a LabPro interface), then reverse the leads; With a Serial Box Interface or ULI, reverse the leads when the reading is 0 V.
With a positive voltage displayed, wait about 5 seconds to take a voltage reading, and record the value in Data Table 1. Also record which metal is the (+) terminal and which is (–). Use the same procedure and measure the potential of the other three cells, continuing to use M1 as the reference electrode.
7. Go to Step 1 of Processing the Data. Use the method described in Step 1 to rank the five metals from the lowest (–) reduction potential to the highest (+) reduction potential. Then predict the potentials for the remaining six cell combinations.
8. Using the computer and Voltage Probe, measure the potential of the six remaining half-cell combinations. If the NaNO3 salt bridge solution has dried, you may have to re-moisten it. Record each measured potential in Data Table 3.
9. When you have finished, use forceps to remove each of the pieces of metal from the filter paper. Rinse each piece of metal with tap water. Dry it and return it to the correct container.
Chemistry 152 10 - 2

Establishing a Table of Reduction Potentials: Micro-Voltaic Cells
Chemistry 152 10 - 3
Remove the filter paper from the glass plate using the forceps, and discard it as directed by your teacher. Rinse the glass plate with tap water, making sure that your hands do not come in contact with wet spots on the glass.
PROCESSING THE DATA 1. After finishing Step 6 in the procedure, arrange the five metals (including M1) in Data Table
2 from the lowest reduction potential at the top (most negative) to the highest reduction potential at the bottom (most positive). Metal M1, the standard reference, will be given an arbitrary value of 0.00 V. If the other metal was correctly connected to the negative terminal, it will be placed above M1 in the chart (with a negative E° value). If it was connected to the positive terminal, it will be placed below M1 in the chart (with a positive E° value). The numerical value of the potential relative to M1 will simply be the value that you measured on the computer. Record your results in Data Table 2.
Then calculate the predicted potential of each of the remaining cell combinations shown in Data Table 3, using the reduction potentials you just determined (in Data Table 2). Record the predicted cell potentials in Data Table 3. Return to Step 8 in the procedure and finish the experiment.
2. Calculate the % error for each of the potentials you measured in Step 8 of the procedure. Do this by comparing the measured cell potentials with the predicted cell potentials in Data Table 3.
3. (Optional) You can determine the identity of metals M2 through M5 using a reduction potential chart in your textbook. Remember that hydrogen, H2, has a reduction potential of 0.00 V on this chart. Locate copper, M1, on the chart, and then determine the likely identity of each of the other metals using your experimental reduction potential sequence in Data Table 2. Note: One of the metals has a 1+ oxidation state; the remainder of the metals have 2+ oxidation states.

Establishing a Table of Reduction Potentials: Micro-Voltaic Cells
Chemistry 152 10 - 4
SAMPLE DATA TABLE 1
Voltaic Cell (metals used)
Measured Potential (V)
Metal Number of (+) Lead
Metal Number of (–) Lead
M1 / M2
M1 / M3
M1 / M4
M1 / M5
SAMPLE DATA TABLE 2
Metal (Mx)
Lowest (–) Reduction Potential, E° (V)
Highest (+) Reduction Potential, E° (V)
SAMPLE DATA TABLE 3
Predicted Potential (V)
Measured Potential (V)
Percent Error (%)
M2 / M3
M2 / M4
M2 / M5
M3 / M4
M3 / M5
M4 / M5

Appendix
A Outline for Formal Laboratory Reports Title Page
a. experiment title b. student name c. date due d. date in
Objective A one-or-two sentence statement of the objectives, goals or purposes of the experiment. Experimental Details This section should describe what was actually done. It is a succinct exposition of the laboratory notebook, describing procedures, techniques, instrumentation, special precautions, and so on. It should be sufficiently detailed that other experienced researchers would be able to repeat the work and obtain comparable results. If the experiment is performed without modification using a published procedure, it is necessary only to provide an explicit reference to the source(s) of the procedure. For example, Colligative Properties of Solutions, Chemistry 126 Laboratory Manual, Spring 1993, p. 3. Calculations Sample calculations should be shown for each type of calculation requested in the experiment. Calculations can sometimes be organized into a table. Results In this section, relevant data, observations, and findings are summarized. Tabulation of data, equations, charts, and figures can be used effectively to present results clearly and concisely. Schemes to show reaction sequences may be used here or elsewhere in the report. Discussion The crux of the report is the analysis and interpretation of the results. What do the results mean? How do they relate to the objectives of the project? To what extent have they resolved the problem? This is the place to prove, in your own words, that you understand the concepts included in the laboratory experiment. This section should be written assuming the reader is not familiar with the laboratory experiment. Conclusions & Summary A separate section outlining the main conclusions of the project is appropriate if conclusions have not already been stated in the "Discussion" section. A lengthy report, or one in which the findings are complex, usually benefits from a paragraph summarizing the main features of the report - the objectives, the findings, and the conclusions.
Chemistry 152 A- 1

Formal Report Guidelines
Additional Tips for Writing Laboratory Reports • Lab reports must be typed on one side only of 8 1/2" x 11" sheets of paper. Any graphs must
be generated using a spreadsheet program such as Microsoft Excel. Securely staple all of the pages of the report together in the upper left- hand corner and do not place in a folder. Follow the guidelines in the course packet. The suggested format (in the order given) should be followed exactly.
• The Discussion section is a prose piece - not a list of points. This section pulls together the chemical concepts studied in the laboratory activity and allows you to discuss whether the experiment was successful or not in illustrating the concepts. This is your opportunity to let your readers know how well you understand the material. Assume the reader is someone that is unfamiliar with the experiment you conducted.
• The Discussion section is not the place to express personal opinions about the lab or your instructors. A lab report is a technical paper and not a critique or review for the newspaper. First person is acceptable in scientific writing because it is more active and less awkward.
• One approach to writing the Discussion section is to do the following: o Restate the purpose of the laboratory activity (1-2 sentences). o Explain in your own words the chemical concept(s) involved in the experiment (1-2
sentences). For example, the chemical reaction occurring, or the constant being found, etc.
o Explain how the laboratory work you did connects to the chemical concept(s) and purpose(s) of the experiment. Be sure to include equations for the reactions and calculations. For example, relating the freezing point depression to molality, which in turn can be used to find the molecular weight of the solute.
o State the results of the experiment (1-2 sentences). Include the unknown numbers here also.
o Discuss the results. Points to consider addressing: how close are your results to the theoretical values; were any trials omitted and why; what criteria did you use to identify your unknown; what is the percent deviation of your trials; what additional information can you find to support your results and/or conclusions, etc.
o Discuss how the experiment relates to the concepts discussed in lecture.
Sample Lab Report Comments are in italics.
The Preparation and Analysis of a Chocolate Dessert: Brownies
The title of the report should be brief but informative. The title should describe the work and allow the reader to determine whether the report is of interest. "Spectroscopy Lab" is not an adequate title.
Abstract: Following literature procedures, 24 chocolate brownies were prepared using a conventional oven. The products were analyzed using an in vivo assay. A yield of 40% was obtained under the experimental conditions.
Chemistry 152 A- 2

Formal Report Guidelines
The abstract should briefly describe the experimental procedure followed, the system studied, and the final outcome of the work. If a single value or a small collection of values was obtained, include the numerical results in the abstract. The abstract should give the reader all the information obtained from the experiment (or group or experiments). The abstract is not a "teaser" to tempt the reader to read the rest of the report ‹ it's a summary. The reader should be able to understand the main points by reading the abstract, examining the tables and figures (with their detailed captions) and reading the conclusions. An abstract is typically less than 300 words.
Introduction: One of the earliest recorded preparations of a chocolate confection was by Montezuma et al. The resulting drink, while satisfying, was not easily portable. The synthesis of a more portable, solid product is thus desirable. The cacahuatl drink is a homogeneous liquid, in contrast to the brownies prepared by Boynton, which, though solid and more easily handled, includes chunks of pecan. Modifying the procedure of Boynton, we have succeeded in preparing a solid, homogeneous chocolate confection.
The introduction should inform the reader of the significance and objectives of your work and provide the appropriate background. Unless offering a comprehensive review of the literature is the purpose of the report, include only those references that are directly relevant to the work at hand. Do not put the procedure into the introduction. Give the structures of relevant compounds. Relevant equations should be placed in the text. Give highlights of the derivation of major equations. Define any abbreviations used, unless they are in broad usage (for example, NMR is fine, but PMSE should be defined). The length of the introduction depends on the nature of the experiment.
Procedure: The brownies were prepared following the procedure described by Boynton in Chocolate: The Consuming Passion. The procedure was modified to eliminate the pecan halves. A 25-cm square glass pan made by Corning was used. The brownies were baked in a conventional oven. Bittersweet chocolate was obtained as chips from Nestlé and used as supplied. The purity was checked by an in vivo assay of samples drawn from the stock supply. All-purpose flour was obtained from Pillsbury and sifted prior to use. Brownies were tested for doneness by sampling one square of brownie mix. When crumbs resulted, the brownies were considered "done."
In a description of the procedure, you should not repeat instructions easily obtainable elsewhere. Careful note should be made of all differences between the procedure as given in the literature and the one that you followed. If the procedure is new, you should provide sufficient detail for another chemist to reproduce it. In other words, don¹t bother giving detailed instructions on how to rinse a pipette, but do describe any specialized glassware or equipment used. In addition to a stepwise procedure, you should also include such information as the model and manufacturer of critical pieces of equipment, because the performance of the instruments may affect the precision of the results. For
Chemistry 152 A- 3

Formal Report Guidelines
example, the frequency of the NMR spectrometer used could be important to someone trying to repeat the work, whereas the model number of the analytical balance used is not likely to affect the results. The sources of chemicals used can also be important. Different methods of manufacture can leave in the reagents different impurities that could also affect the results obtained. If the chemicals were not used as supplied, described how they were prepared prior to use, such as by distillation. The purity of the materials is also noted, as well as the method by which purity was determined.
Calculations: Theoretical yield of 5-cm2 brownies per batch: 25 cm x 25 cm = 625 cm2/batch 625 cm2/5 cm2 … brownie-1 = 25 brownies (theoretical yield) Actual yield was determined by hand-count as 10. 10 brownies/25 brownies x 100% = 40% (actual yield)
In this section, the method by which numerical results were obtained should be laid out. If a computer program was used, this should be noted and, if appropriate, included as an appendix to the report. The formula used to calculate each number should be given, and for complicated calculations, a sample should be worked. It is not necessary to type this section. Neatly handwritten calculations are generally acceptable and much less time- consuming to produce.
Results: A yield of 40% was obtained. The results of the analysis (Table 1) showed that all testers found the brownies to be acceptably chocolaty and easily handled. Table 1 Sample Size Chocolaty Ease of Handling
4 4 4 6 6 6
The Results section should contain just that, your results. It is usually best to present the results first and then discuss the possible errors and significance in a separate section. Tabular or graphical presentation of data is nearly always clearest. When using graphs, you can include more than one set of data on a single sheet. Be sure to use different styles of lines or points to differentiate the data sets. All tables and graphs should have captions. Give each table or figure a number for easy reference from the text. A reader should be able to understand the main points of the report by reading the abstract and examining the tables and figures (including their captions).
Discussion: The preparation of a solid, homogeneous chocolate confection was successful. However, the yield was found to be very low because of the destructive sampling procedure. A higher yield
Chemistry 152 A- 4

Formal Report Guidelines
could be obtained by sampling of the reaction mixture less frequently, or by using a non-destructive sampling method, such as the fork method advocated by Boynton or a spectroscopic method (are they brown on top or black?). The baking time was found to be about 10% longer than that reported by Boynton, as a result of either the glass pan or the lack of pecans. Because the type of pan used was not given by the previous workers, further work will be required to establish the cause of the extended baking time.
This is really the most important part of the report. Here you should describe the significance of your results and discuss ways to improve or extend the work. The length of this section will vary considerably, depending on the type of experiment. Did the experiment work overall? Comment on the percent error in numerical values, describe any systematic errors that you believe occurred, and suggest improvements to the procedures that might overcome these difficulties. Indicate what other experiments related to this work could be done, and answer questions that these results raise.
Conclusions: A good recipe for chocolate brownies was presented. The yield is low but could be improved. Further work is in progress.
This section is really just a recap of the abstract. Repeat any important data or constants that were found as part of the experiment. If more work is planned, this is usually noted here. When a report has been particularly long and has presented a lot of results, this section is a valuable tool for your reader.
Acknowledgments: The author would like to thank those who sampled the brownies.
It is customary to acknowledge any financial support for the work performed, as well as the help of colleagues and/or support facilities. For example, a helpful series of discussions with someone or the assistance of the computing center might be noted.
References:
List all the books and articles you used in the course of doing the work and preparing the report. Referencing styles differ between disciplines and even between journals in the same discipline.
Appendices:
In the chemical literature, supporting data, long derivations, and short computer programs are often included as an appendix.
Chemistry 152 A- 5
Appendix
B The Role of Excel and the Laboratory Notebook This document is intended to clear up any misunderstandings about the role of your laboratory notebook and Excel for Chemistry labs. The Notebook The laboratory notebook is intended to be the primary record of everything that went on during the experimental phase of the lab. Everything that you write down during lab should be written in the notebook, especially any masses that you measure. The information in the notebook combined with the laboratory manual (or handout) should allow another science student to exactly repeat your work.. For this reason, it is important to record is any observations that you take during lab, especially the appearance and color of samples and solutions. Descriptions of changes that occur including how fast they took place are very helpful. Additionally, you should record anything that goes wrong such as spilling a portion of your sample, observing the wrong color, or overshooting a titration endpoint. This information is extremely helpful when you are writing your laboratory report a week later and may explain any discrepancies in your results. The Computer Before the common use of computers for data processing and writing, sample calculations and all data analysis were also performed in the notebook. Calculations were typically accomplished by explicitly showing a sample calculation for the first data point (explicitly writing out the formulas with numbers) and then showing a table of raw data and the calculation results without work for the rest. In the modern day of computerized data collection (usually with many more data points), some compromise must be found between the old and new. It is obviously a waste of time to copy numbers from the computer to your notebook and then type them back into the computer for your report. Consider recording some important data points in your notebook (e.g. average initial and final temperature for Thermochemistry runs). At a minimum, the filename for your data file must be recorded in your notebook. Excel vs. Vernier Software We use the Vernier software to collect data during experiments. While you can save data from the Vernier software, you cannot use that data file on computers outside the chemistry lab. For this reason, copying the data into a spreadsheet such as Microsoft Excel is a good choice due to its wide availability and data processing/presentation capabilities. It may be helpful to treat Excel as an electronic extension to your laboratory notebook (where you should record the Excel filename and some information in case the computer crashes). In doing so, make sure that you label your spreadsheet so someone else can easily read and understand it. For Chemistry 151 – 153 at LCC, use of Excel will be required for electronic submission of your lab reports.
Chemistry 152 B- 1