Embed Size (px)
Citation preview
Chemical Testing of Commercial Vessel Personnel An Analysis of Archived Test Results
by
Walter J. Brudzinski, JD, Ph.D. Chief Administrative Law Judge
U.S. Coast Guard
© by Walter J. Brudzinski 2013 All Rights Reserved
i
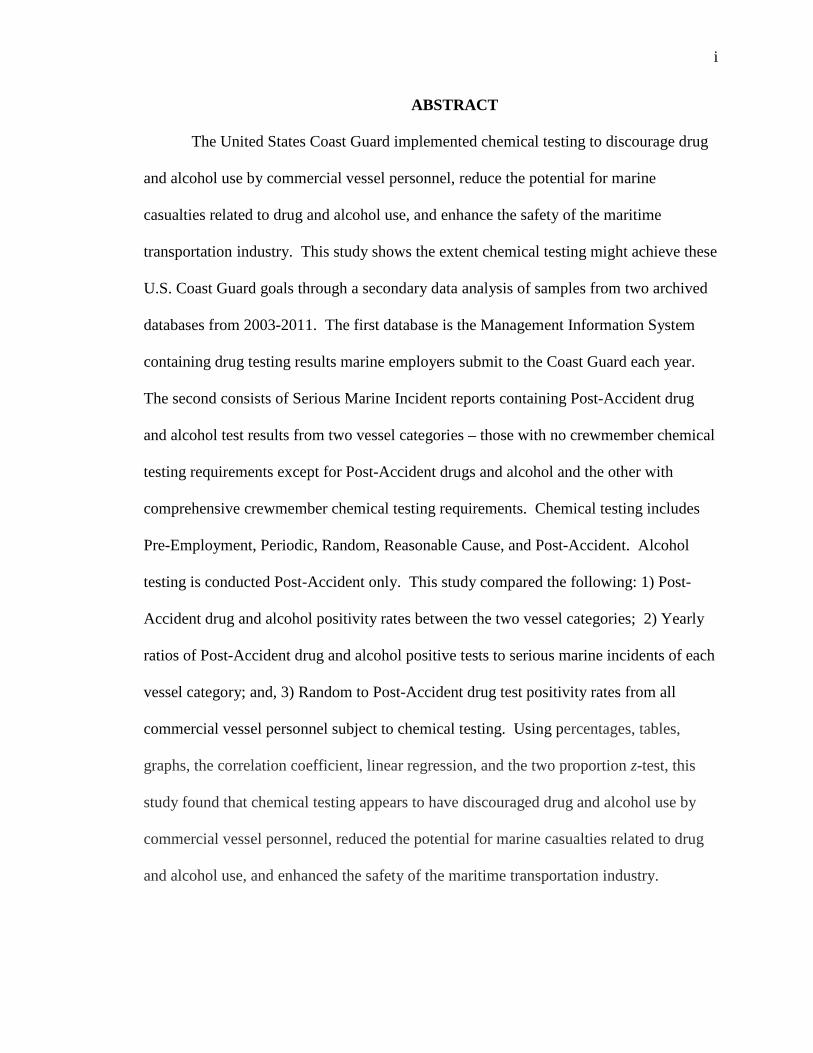
ABSTRACT
The United States Coast Guard implemented chemical testing to discourage drug
and alcohol use by commercial vessel personnel, reduce the potential for marine
casualties related to drug and alcohol use, and enhance the safety of the maritime
transportation industry. This study shows the extent chemical testing might achieve these
U.S. Coast Guard goals through a secondary data analysis of samples from two archived
databases from 2003-2011. The first database is the Management Information System
containing drug testing results marine employers submit to the Coast Guard each year.
The second consists of Serious Marine Incident reports containing Post-Accident drug
and alcohol test results from two vessel categories – those with no crewmember chemical
testing requirements except for Post-Accident drugs and alcohol and the other with
comprehensive crewmember chemical testing requirements. Chemical testing includes
Pre-Employment, Periodic, Random, Reasonable Cause, and Post-Accident. Alcohol
testing is conducted Post-Accident only. This study compared the following: 1) Post-
Accident drug and alcohol positivity rates between the two vessel categories; 2) Yearly
ratios of Post-Accident drug and alcohol positive tests to serious marine incidents of each
vessel category; and, 3) Random to Post-Accident drug test positivity rates from all
commercial vessel personnel subject to chemical testing. Using percentages, tables,
graphs, the correlation coefficient, linear regression, and the two proportion z-test, this
study found that chemical testing appears to have discouraged drug and alcohol use by
commercial vessel personnel, reduced the potential for marine casualties related to drug
and alcohol use, and enhanced the safety of the maritime transportation industry.
ii
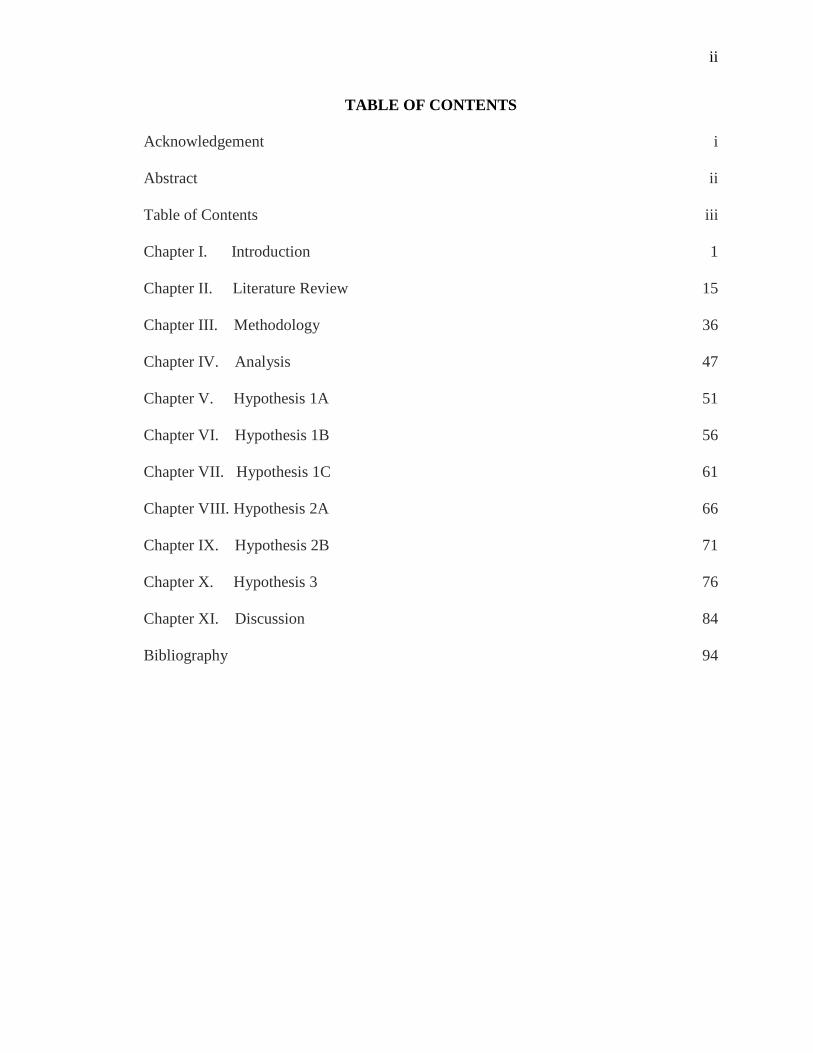
TABLE OF CONTENTS
Acknowledgement i Abstract ii Table of Contents iii Chapter I. Introduction 1 Chapter II. Literature Review 15 Chapter III. Methodology 36 Chapter IV. Analysis 47 Chapter V. Hypothesis 1A 51 Chapter VI. Hypothesis 1B 56 Chapter VII. Hypothesis 1C 61 Chapter VIII. Hypothesis 2A 66 Chapter IX. Hypothesis 2B 71 Chapter X. Hypothesis 3 76 Chapter XI. Discussion 84 Bibliography 94
iii
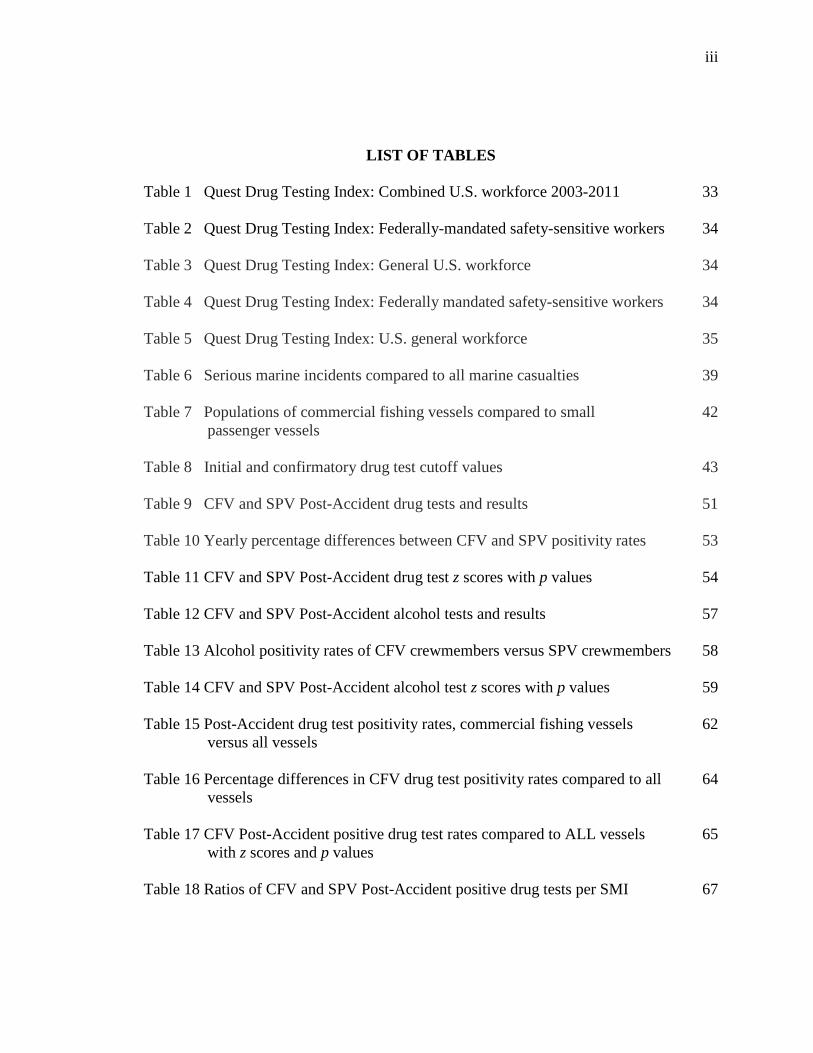
LIST OF TABLES Table 1 Quest Drug Testing Index: Combined U.S. workforce 2003-2011 33 Table 2 Quest Drug Testing Index: Federally-mandated safety-sensitive workers 34 Table 3 Quest Drug Testing Index: General U.S. workforce 34 Table 4 Quest Drug Testing Index: Federally mandated safety-sensitive workers 34 Table 5 Quest Drug Testing Index: U.S. general workforce 35 Table 6 Serious marine incidents compared to all marine casualties 39 Table 7 Populations of commercial fishing vessels compared to small 42 passenger vessels Table 8 Initial and confirmatory drug test cutoff values 43 Table 9 CFV and SPV Post-Accident drug tests and results 51 Table 10 Yearly percentage differences between CFV and SPV positivity rates 53 Table 11 CFV and SPV Post-Accident drug test z scores with p values 54 Table 12 CFV and SPV Post-Accident alcohol tests and results 57 Table 13 Alcohol positivity rates of CFV crewmembers versus SPV crewmembers 58 Table 14 CFV and SPV Post-Accident alcohol test z scores with p values 59 Table 15 Post-Accident drug test positivity rates, commercial fishing vessels 62 versus all vessels Table 16 Percentage differences in CFV drug test positivity rates compared to all 64 vessels Table 17 CFV Post-Accident positive drug test rates compared to ALL vessels 65 with z scores and p values Table 18 Ratios of CFV and SPV Post-Accident positive drug tests per SMI 67
iv
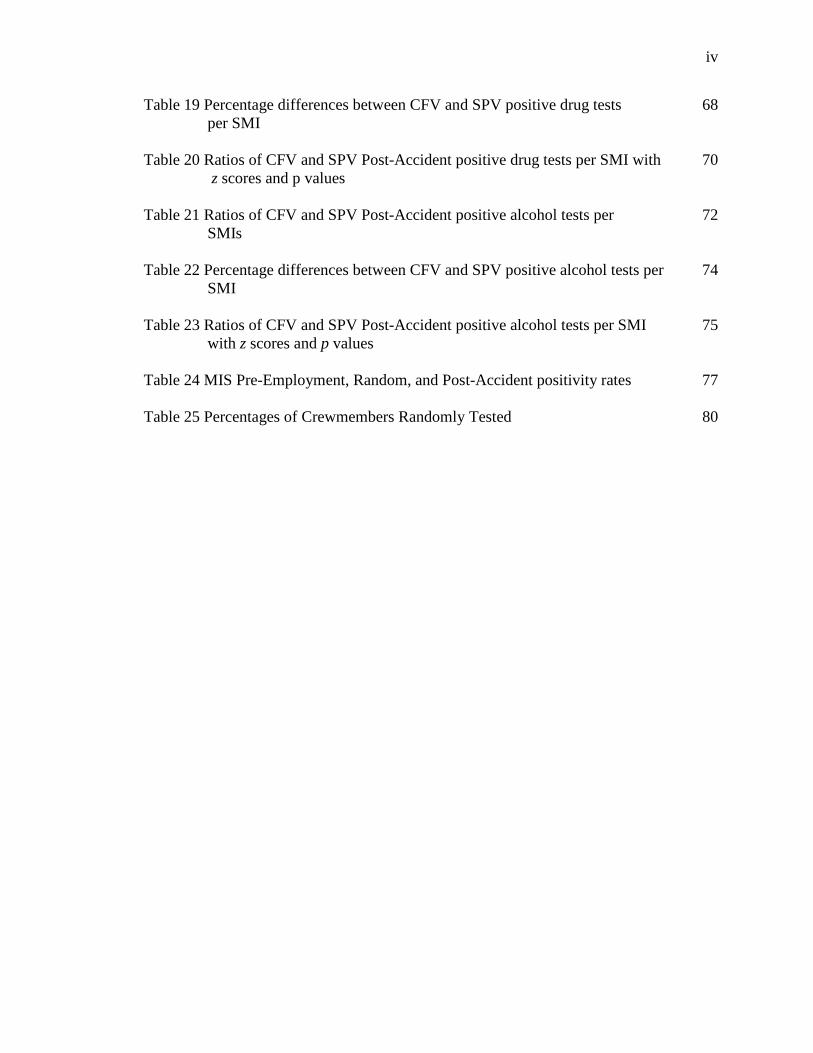
Table 19 Percentage differences between CFV and SPV positive drug tests 68 per SMI Table 20 Ratios of CFV and SPV Post-Accident positive drug tests per SMI with 70 z scores and p values Table 21 Ratios of CFV and SPV Post-Accident positive alcohol tests per 72 SMIs Table 22 Percentage differences between CFV and SPV positive alcohol tests per 74 SMI Table 23 Ratios of CFV and SPV Post-Accident positive alcohol tests per SMI 75 with z scores and p values Table 24 MIS Pre-Employment, Random, and Post-Accident positivity rates 77 Table 25 Percentages of Crewmembers Randomly Tested 80
v
LIST OF FIGURES
Figure 1 Differences between CFV and SPV Post-Accident drug test positivity rates 52 Figure 2 Differences between CFV and SPV alcohol test positivity rates 58 Figure 3 Differences between CFV and ALL drug test positivity rates 63 Figure 4 Differences between CFV and SPV positive drug tests per SMI 68 Figure 5 Differences between CFV and SPV positive alcohol tests per SMI 73 Figure 6 MIS Pre-Employment, Random, and Post-Accident positivity rates 78 Figure 7 Trend Line of Random and Post-Accident positivity rates 79 Figure 8 Scatter Plot of Random and Post-Accident positivity rates 80 Figure 9 Scatter Plot and regression line for Random versus Post-Accident 82 positivity rates
1
I. INTRODUCTION
A. OVERVIEW
The U.S. Coast Guard issues and enforces regulations to promote safety of life
and property on and under the high seas and waters subject to the jurisdiction of the
United States1 14 U.S.C. § 2 (2006). It also exercises general regulatory authority over
the Merchant Marine, its vessels, and its personnel 46 U.S.C. § 2103 (2006). Pursuant to
that authority, among others, the Coast Guard implemented chemical testing programs
“to discourage drug and alcohol use by commercial vessel personnel, reduce the potential
for marine casualties related to drug and alcohol use, and enhance the safety of the
maritime transportation industry” Programs for Chemical Drug and Alcohol Testing of
Commercial Vessel Personnel, 53 Fed. Reg. Nov. 21, 1988, p. 47,064. Title 46 U.S.C. §
7702(c)(2) (2006) also mandates chemical testing commercial vessel personnel that are
holders of Coast Guard issued Credentials for use of alcohol or dangerous drugs.
B. CHEMICAL TESTING PROCESS
“Chemical testing means a scientifically recognized test which analyzes an
individual’s breath, blood, urine, saliva, bodily fluids, or tissues for evidence of
dangerous drug use” 46 C.F.R. § 16.105 (2012). “Dangerous drug means a narcotic
drug, a controlled substance, or a controlled substance analog as defined in section 102 of
1 The author is the Chief Administrative Law Judge for the U.S. Coast Guard, an agency of the U.S. Department of Homeland Security. Coast Guard Administrative Law Judges hear and decide cases Investigating Officers initiate to suspend or revoke Merchant Marine Credentials of commercial vessel personnel for misconduct, negligence, incompetence, violation of law or regulation, and drug use. Coast Guard Administrative Law Judges also hear and decide cases for other Homeland Security agency components as well as other agencies. The author’s opinions expressed herein are his own and do not reflect the views of the U.S. Department of Homeland Security, the Commandant of the Coast Guard, or the Office of Chief Administrative Law Judge, U.S. Coast Guard.
2
the Comprehensive Drug Abuse and Control Act of 1970 (21 U.S.C. 820)” 46 C.F.R. §
16.105 (2012). As used in this study, the term “drug test” is a test of an individual’s
urine for evidence of dangerous drug use 49 C.F.R. pt. 40, subpts. C through F. The
types of chemical testing include Pre-Employment, Periodic, Random, Reasonable
Cause, and Post-Accident2 46 C.F.R. §§ 16.201-250 (2012).
According to 46 C.F.R. § 4.06-15(a)(2)(2012), alcohol testing of commercial
vessel personnel is performed with devices listed on either the Conforming Products List
titled “Modal Specifications for Devices To Measure Breath Alcohol” or “Conforming
Products List of Screening Devices To Measure Alcohol in Bodily Fluids.” For
commercial vessel personnel, Post-Accident alcohol testing is ordered pursuant to 46
C.F.R. §§ 16.240 and 16.500 (2012) for serious marine incidents and 33 C.F.R. §
95.035(a)(1) (2012) when “[t]he individual was directly involved in the occurrence of a
marine casualty as defined in Chapter 61 of Title 46, United States Code.” When
comparing Post-Accident drug and alcohol test positivity rates between crewmembers
subject to chemical testing and crewmembers not otherwise subject to chemical testing
except for Post-Accident tests, this study focuses only on the positivity rates from serious
marine incidents, not all marine casualties.
As prescribed in 46 C.F.R. § 16.201(a) (2012), marine employers must initiate
and conduct chemical testing as required by 46 C.F.R. pt. 16, subpt. B and in accordance
with the procedures detailed in 49 C.F.R. pt. 40. With very few exceptions, marine
employers of commercial fishing vessel crewmembers are exempt from initiating and
2 Employees previously testing positive must take Follow-Up and Return-To-Duty drug tests in accordance with 49 C.F.R. §§40.305 and 40.307 (2012). Those tests are not the subject of this study.
3
conducting chemical testing except for Post-Accident drugs and alcohol under 46 C.F.R.
§ 16.240. Each urine specimen is chemically tested in accordance with the procedures in
49 C.F.R. pt. 40 for the following dangerous drugs: marijuana, cocaine, opiates,
phencyclidine (PCP); and amphetamines 46 C.F.R. § 16.103 (2012); 49 C.F.R. § 40.85
(2012). The term “marine employer” means the owner, managing operator, charterer,
agent, master, or person in charge of a vessel, other than a recreational vessel” 46 C.F.R.
§ 16.105 (2012). Drug testing must be conducted by laboratories certified by the U.S.
Department of Health and Human Services under the National Laboratory Certification
Program for all testing conducted under 49 C.F.R. pt. 40 49 C.F.R. § 40.81(a) (2012).
C. CONSEQUENCES OF FAILING A CHEMICAL TEST
The law as well as marine employers require certain commercial vessel
crewmembers to hold Coast Guard issued Credentials.3 Credentials determine and verify
a crewmember’s qualifications and competencies to serve on merchant vessels. Under 46
C.F.R. § 16.201(c) (2012), if an individual holding a Credential fails a chemical test, the
employer, prospective employer, or sponsoring organization must report the test results in
writing to the Coast Guard.4 The employer, prospective employer, or sponsoring
organization must deny the individual employment as a crewmember or remove the
individual from duties directly affecting the safe operation of the vessel as soon as
practicable. Because chemical test results are reported to the Coast Guard, the individual
3The term “Credential” refers to Merchant Mariner’s Document, Merchant Mariner’s License, STCW Endorsement, and Certificate of Registry, as well as the Merchant Mariner’s Credential [46 C.F.R. § 16.105 (2012)]. STCW Endorsement means the International Convention on Standards of Training, Certification and Watchkeeping for Seafarers, 1978, as amended 1995 46 C.F.R. §§ 10.101, 10.103(b) (2012). 4 See also 46 U.S.C. § 7706 (2006) directing other federal agencies employing Credentialed crewmembers to forward test results to the Coast Guard.
4
holder of a Coast Guard issued Credential failing the chemical test is also subject to
suspension and revocation proceedings against his or her Credential in accordance with
46 U.S.C. §§ 7701-7705 (2006), 46 C.F.R. pt. 5, and 33 C.F.R. pt. 20. The purpose of
suspension and revocation proceedings is to promote safety at sea 46 U.S.C. § 7701(a)
(2006). Those proceedings are remedial, not penal in nature and are intended to help
maintain standards for competence and conduct essential for the promotion of safety at
sea 46 C.F.R. § 5.5 (2012).
If the individual failing a chemical test for dangerous drugs does not hold a
Credential, 46 C.F.R. § 16.201(d) (2012) requires marine employers to deny the
individual employment as a crewmember or remove the individual from duties directly
affecting the safe operation of the vessel as soon as possible. Under 46 C.F.R. §
16.201(f) (2012), marine employers may not re-employ any individual described in 46
C.F.R. §§ 16.201(c) and (d) aboard a vessel until the individual has completed the
recommendations of the Substance Abuse Professional as described in 49 C.F.R. §§
40.281-313 (2012). Further, the Medical Review Officer (MRO) must determine the
individual is drug-free and that the subsequent risk of drug use by that person is
sufficiently low to justify a return to work. Moreover, the crewmember testing positive
must agree to be subject to increased, unannounced testing for a minimum of six (6) tests
in the first year after the crewmember returns to work as required in 49 CFR pt. 40 and
for any additional period as determined by the Substance Abuse Professional or the MRO
up to a total of 60 months. The first test is a Return-To-Duty test performed under direct
5
observation. Subsequent to that test, Follow-Up tests are also performed under direct
observation as ordered by the Substance Abuse professional or the MRO.5
If the Administrative Law Judge in suspension and revocation proceedings finds
the positive chemical test was ordered in accordance with 46 C.F.R. pt. 16 and tested in
accordance with the procedures in 49 C.F.R. pt. 40, the individual is presumed to be a
user of dangerous drugs 46 C.F.R. §§ 16.201(a) and (b) (2012). Under 46 U.S.C. §
7704(c) “[i]f it is shown that a [Credential] holder has been a user of, or addicted to, a
dangerous drug, the license, certificate of registry, or merchant mariner's document
(currently referred to as Credentials) shall be revoked unless the holder provides
satisfactory proof that the holder is cured” (Emphasis and brackets added). The
Administrative Law Judge must revoke the individual’s Credential unless the individual
rebuts the presumption that he or she is a user of dangerous drugs or provides satisfactory
proof of cure.
D. CURE
Credentialed crewmembers testing positive are subject to having their credentials
revoked in Coast Guard suspension and revocation proceedings. To provide satisfactory
proof of cure, the current practice is for the crewmember/respondent to enter into a
settlement agreement with the Coast Guard. This process allows the individual to deposit
his or her Credential(s) with the Coast Guard pending successful completion of a
recognized drug rehabilitation program followed by a one year period of remaining drug
free, evidenced by passing 12 random, unannounced drug tests and attending prescribed
5 Interview with Mr. Robert C. Schoening, U.S. Coast Guard Drug and Alcohol Program Manager, August 27, 2012.
6
Narcotics Anonymous (NA) and/or Alcoholic Anonymous (AA) meetings. The Coast
Guard will return the Credential(s) to the individual upon the following conditions:
successfully completing drug rehabilitation (usually 2 months); remaining drug free for
one year following drug rehabilitation as evidence by passing the prescribed,
unannounced, random drug tests; attending NA/AA meetings as agreed upon; and,
obtaining clearance from the Substance Abuse Professional and the MRO that the
individual is drug-free and the risk of subsequent dangerous drug use is sufficiently low
to justify his or her return to work. During the period of Credential deposit, the
individual is not permitted to work in any position requiring a Coast Guard issued
Credential (Brudzinski, 2010, April 13).
E. REQUIRED CHEMICAL TESTING
Pre-Employment. An individual seeking employment as a crewmember in a
position involving the safe operation of a vessel must pass a Pre-Employment chemical
test for dangerous drugs as per 46 C.F.R. § 16.210(a) (2012). A marine employer may
waive a Pre-Employment test if the individual provides satisfactory evidence of passing a
chemical test for dangerous drugs required by 46 C.F.R. Part 16 within the previous six
(6) months with no subsequent, positive drug tests during the remainder of the six month
period; or, during the previous 185 days had been subject to a Random testing program
required by 46 C.F.R §16.230 for at least 60 days and did not fail or refuse to participate
in any chemical test required under 46 C.F.R. pt. 16 as per 46 C.F.R. § 16.210(b) (2012).
After the potential crewmember passes the Pre-Employment drug test and is hired, that
individual is further subject to unannounced Random tests, Reasonable Cause tests, and
Post-Accident tests as per 46 C.F.R. pt.16, subpt. B (2012).
7
Random. Title 46 C.F.R. § 16.230 (2012) requires marine employers to randomly
drug test at least 50% of their crewmembers that work in safety-sensitive positions each
year, performed at least once per quarter. For example, if the marine employer has 200
covered employees subject to mandatory chemical testing, the marine employer must
conduct at least 25 random tests each quarter of that year, for a total of 100 tests (.50 x
200). Crewmembers previously selected in the first quarter’s test are also are subject to
being selected for the next three quarters in the same fashion as those crewmembers not
previously selected.6 The Coast Guard may adjust the 50% annual percentage rate
downward to 25% of covered employees if the overall, yearly drug testing reports
received from all employers show the Random positive rate to be less than 1% for two
consecutive calendar years. Conversely, if the minimum annual percentage rate for
Random drug testing is 25% and the drug testing reports from marine employers from the
previous year indicate that the Random positive rate is equal to or greater than 1%, the
Coast Guard will increase the minimum annual percentage rate for Random testing back
to 50% for the following calendar year in accordance with 46 C.F.R. § 16.230 (2012).
6 Selecting crewmembers for Random testing is described in 46 C.F.R. § 16.230(c) (2012) as follows:
The selection of crewmembers for random drug testing shall be made by a scientifically valid method, such as a random number table or a computer-based random number generator that is matched with crewmembers' Social Security numbers, payroll identification numbers, or other comparable identifying numbers. Under the testing frequency and selection process used, each covered crewmember shall have an equal chance of being tested each time selections are made and an employee's chance of selection shall continue to exist throughout his or her employment. As an alternative, random selection may be accomplished by periodically selecting one or more vessels and testing all crewmembers covered by this section, provided that each vessel subject to the marine employer's test program remains equally subject to selection.
8
Periodic. Under 46 C.F.R. 16.220 (2012), the Coast Guard requires Periodic
testing when it issues an initial Credential to a crewmember and any subsequent raise in
grade, reissuance, or annual physical. As with Pre-Employment testing, the crewmember
need not submit evidence of passing a chemical test for dangerous drugs if he or she
provides satisfactory evidence of passing such a test as required by 46 C.F.R. pt. 16
within the past previous six (6) months with no subsequent positive drug tests during the
remainder of the six month period; or, during the previous 185 days had been subject to a
Random testing program required by 46 C.F.R §16.230 (2012) for at least 60 days and
did not fail or refuse to participate in any chemical test required under 46 C.F.R. pt. 16.
Reasonable Cause. Title 46 C.F.R. § 16.250 (2012) prescribes marine employers
shall require any crewmember engaged or employed on board a vessel owned in the
United States that is required by law or regulation to engage, employ, or be operated by
an individual holding a Credential issued by the Coast Guard who is reasonably
suspected of using a dangerous drug to undergo a chemical test for the use of dangerous
drugs. “The employer’s suspicion must be based on a reasonable and articulable belief
that the individual has used a dangerous drug based on direct observation of specific,
contemporaneous, physical, behavioral, or performance indicators of probable use” as
stated at 46 C.F.R. § 16.250(b) (2012).
Post-Accident tests from serious marine incidents. Title 46 C.F.R. § 16.240
(2012) requires marine employers to ensure all persons directly involved in a serious
marine incident are chemically tested for evidence of dangerous drugs and alcohol in
accordance with the requirements of 46 C.F.R. subpt. 4.06. A serious marine incident is
defined in 46 C.F.R. § 4.03-2 (2012) and includes any incident described as a Marine
9
Casualty or Accident in 46 C.F.R. 4.03-1 (2012) for which the owner, agent, master,
operator, or person in charge shall notify the Coast Guard in accordance with 46 C.F.R. §
4.05.1 (2012).7 Serious Marine Incidents include one or more deaths; any injury to a
crewmember, passenger, or other person which requires professional medical treatment
beyond first aid; damage to property in excess of $100,000; actual or constructive loss of
a vessel; a discharge of 10,000 gallons or more of oil into the navigable waters of the
United States; and, discharges of a reportable quantity of hazardous substance into the
environment or navigable waters of the United States.
Under 46 C.F.R. § 4.05-1 (2012) the Coast Guard must be notified of the
following: an unintended grounding, or an unintended strike of (allusion with) a bridge;
an intended grounding or an intended strike of a bridge that creates a hazard to
navigation, the environment, or the safety of a vessel; a loss of main propulsion, steering,
or any associated component or control system that reduces the maneuverability of the
vessel; an occurrence that adversely affects the vessel’s seaworthiness including fire or
flooding; loss of life; injury requiring professional medical treatment beyond first aid;
property damage in excess of $25,000; and, an occurrence involving significant harm to
the environment.
Title 46 C.F.R. § 4.06-1(b) (2012) prescribes once a marine employer determines
a casualty or incident is or is likely to become a serious marine incident, the marine
7 Ordinary Marine Casualties or Accidents defined in section 4.03-1 generally include any fall overboard, injury, or loss of life of any person and any occurrence involving a vessel that results in grounding, stranding, foundering, flooding, collision, allusion, explosion, fire, reduction or loss of a vessel’s electrical power, propulsion, or steering capabilities. Marine Casualties or Accidents also include failures that impair any aspect of a vessel’s operation; any other circumstances that might affect or impair a vessel’s seaworthiness, efficiency, or fitness for service or route; and, any incident involving significant harm to the environment, among other things.
10
employer shall take all practicable steps to have each crewmember on board the vessel
who is directly involved in the incident chemically tested for evidence of drug and
alcohol use. Alcohol testing must occur within two hours of the serious marine incident,
if practicable; drug testing must occur within 32 hours of the serious marine incident 46
C.F.R. § 4.06-3 (2012).
F. RECORDS AND REPORTS
In addition to the immediate notice required in section 4.05-1, the owner, agent,
master, operator, or person in charge must prepare written report of any marine casualty
required to be reported under § 4.05–1 within five days of the incident. This written
report must be delivered to a Coast Guard Sector Office or Marine Inspection Office. It
must be provided on Form CG-2692 (Report of Marine Accident, Injury or Death),
supplemented as necessary by appended Forms CG-2692A (Barge Addendum) and CG-
2692B (Report of Required Chemical Drug and Alcohol Testing Following a Serious
Marine Incident) 46 C.F.R. 4.05-10(a) (2012). This is how the Coast Guard obtains Post-
Accident chemical testing results from serious marine incidents in accordance with 46
C.F.R. § 4.06-3 (2012).
Marine employers are also required to maintain records of chemical tests and
make those records available to the Coast Guard upon request 46 C.F.R § 16.260 (2012).
Further, marine employers must submit yearly drug testing data and results on the U.S.
Department of Transportation Drug and Alcohol Testing Management Information
System (MIS) Data Collection Form to Commandant, (CG–INV), U.S. Coast Guard,
2100 2nd St. SW., Stop 7581, Washington, DC 20593–7581 46 C.F.R. §16.500 (2012);
49 C.F.R. pt. 40, Appendix H. The provisions in 49 C.F.R. pt. 40 for alcohol testing by
11
Department of Transportation (DOT) agencies do not apply to the Coast Guard or to
marine employers. Marine employers are not required or permitted to submit alcohol
testing data other than in accordance with the requirements of 46 C.F.R. § 4.06 (2012) for
Serious Marine Incident reports as per 46 C.F.R. § 16.500(a)(2) (2012). Marine
employers submit alcohol testing results on the Report of Required Chemical Drug and
Alcohol Testing Following a Serious Marine Incident which supplements the Report of
Marine Accident, Injury or Death, CG-2692B.8
G. EMPLOYEE ASSISTANCE PROGRAMS
Crewmembers are aware that a positive chemical test has serious consequences
from loss of their employment to loss of their Coast Guard issued Credentials. Their
employers make them aware through the company’s policy and the Coast Guard makes
those with Credentials aware during their licensing process. Yet, significant numbers of
crewmembers still test positive, lose their employment, and, if they are Credential
holders, are subject to suspension and revocation proceedings typically resulting in the
loss of their Credentials unless they provide satisfactory proof that they are cured of
dangerous drug use.
To assist crewmembers in avoiding dangerous drug use, the Coast Guard also
requires marine employers to provide Employee Assistance Programs (EAP) for all
crewmembers. Each EAP must include education and training on drug use for both
crewmembers and supervisory personnel. The EAP must: 1) display and distribute
informational material; 2) display and distribute a community service hot-line telephone
8 Under 46 C.F.R. §§ 4.06-70 and 16.115 (2012), marine employers failing to implement, conduct or comply with chemical testing requirements are subject to civil penalties.
12
number for crewmember assistance; and, 3) display and distribute the employer's policy
regarding drug and alcohol use in the workplace 46 C.F.R. 16.401 (2012).
H. PURPOSE
As stated in the Final Rule, chemical testing’s goals are “to discourage drug and
alcohol use by commercial vessel personnel, reduce the potential for marine casualties
related to drug and alcohol use, and enhance the safety of the maritime transportation
industry.”
Federally mandated chemical testing of commercial vessel personnel substantially
impacts crewmembers as well as marine employers; however, its effects on discouraging
drug and alcohol use, reducing the potential for marine casualties related to drug and
alcohol use, and enhancing the safety of the maritime transportation have not been the
subject of empirical study and to that extent remain largely unknown. Determining the
extent chemical testing is discouraging drug and alcohol use, reducing the potential for
marine casualties, and enhancing the safety of the maritime transportation industry is
therefore appropriate for inquiry and is this study’s purpose.
I. RESEARCH QUESTIONS AND HYPOTHESES
Research question number 1: To what extent, if any, has chemical testing
discouraged drug and alcohol use by commercial vessel personnel? The following
Hypotheses address that research question:
Hypothesis 1A: Yearly 2003-2011 Post-Accident drug test positivity rates from
small passenger vessel crewmembers subject to chemical testing are significantly lower
than yearly 2003-2011 Post-Accident drug test positivity rates from commercial fishing
vessel crewmembers not otherwise subject to chemical testing.
13
Hypothesis 1B: Yearly 2003-2011 Post-Accident alcohol test positivity rates
from small passenger vessel crewmembers subject to chemical testing are significantly
lower than yearly 2003-2011 Post-Accident alcohol test positivity rates from commercial
fishing vessel crewmembers not otherwise subject to chemical testing.
Hypothesis 1C: Yearly 2003-2011 Post-Accident drug test positivity rates from
all crewmembers subject to chemical testing from all vessels are significantly lower than
yearly 2003-2011 Post-Accident drug test positivity rates from commercial fishing vessel
crewmembers not otherwise subject to chemical testing.
Research question number 2: To what extent, if any, does chemical testing reduce
the potential for marine casualties related to drug and alcohol use? The following
Hypotheses address that research question:
Hypothesis 2A: The yearly 2003-2011 ratios of Post-Accident positive drug tests
per serious marine incident from small passenger vessel crewmembers subject to
chemical testing are significantly lower than corresponding Post-Accident positive drug
tests per serious marine incident from commercial fishing vessel crewmembers not
otherwise subject to chemical testing.
Hypothesis 2B: The yearly 2003-2011 ratios of Post-Accident positive alcohol
tests per serious marine incident from small passenger vessel crewmembers subject to
chemical testing are significantly lower than corresponding Post-Accident positive
alcohol tests per serious marine incident from commercial fishing vessel crewmembers
not otherwise subject to chemical testing.
14
Research question number 3: To what extent, if any, does chemical testing
enhance the safety of the maritime transportation industry? The following Hypothesis
addresses that research question:
Hypothesis 3: Yearly 2003-2011 Post-Accident drug test positivity rates from all
vessels with crewmembers subject to chemical testing will correlate positively and
strongly with decreasingly lower Random drug test positivity rates from 2003-2011 for
all vessels with crewmembers subject to chemical testing.
This study assumes the data reported to the Coast Guard was accurate; that small
passenger vessel crewmembers have passed a Pre-Employment chemical prior to being
hired and are aware they are still subject to Random, Reasonable-Cause, and Post-
Accident chemical tests for drugs and alcohol; that commercial fishing vessel
crewmembers are not subject to chemical tests except Post-Accident drugs and alcohol
and may not be aware they are subject to Post-Accident chemical tests.
15
II. LITERATURE REVIEW
A. OVERVIEW
There are no empirical studies specifically concerning chemical testing of
commercial vessel personnel. This might be attributed in part to the overall
comprehensiveness of the regulations as described above; the “zero tolerance” sanctions
for those crewmembers testing positive; and, the opportunities available to crewmembers
to demonstrate they are cured of drug use so they can return to work. The lack of
empirical studies on commercial vessel personnel chemical testing is not surprising
because it is consistent with the relative dearth of empirical studies in transportation and
workplace drug testing in general, especially in the last five years. This may be due in
part to the difficulty in attributing drug testing directly to those areas it seeks to improve,
such as work performance and safety. As shown in the literature review, empirical
studies to measure drug testing’s effect on work performance and safety have met with
mixed results, not because drug use has no effects on work performance or safety, but
because of the methods used. Instead of attempting to measure specific areas of work
performance or safety, this study measured the goals of federally mandated chemical
testing as expressed in the final rule.
The Literature Review begins with a brief discussion of the reasons for
implementing chemical testing followed by brief discussions of articles pertaining to the
suspension and revocation process against credentialed crewmembers/mariners that test
positive for dangerous drugs.9 The “zero tolerance” nature of the suspension and
revocation process is perhaps the major factor in discouraging drug use. The Literature
9 For the purpose of this study, the terms “crewmember(s)” and “mariner(s)” are used interchangeably.
16
Review also acknowledges the constitutional issues surrounding mandatory drug testing.
This study does not evaluate the suspension and revocation process nor does it discuss the
constitutional aspects of mandatory drug testing; however, having a familiarity with these
aspects is helpful in understanding the expressed goals of federally mandated chemical
testing. It is also helpful to show the need for more empirical work on testing results.
The Literature Review then discusses articles on drug testing’s limitations
followed by discussions of articles on discouraging drug use, drug testing and accidents,
and Quest Diagnostics’ Drug Testing Index. It ends with a brief discussion of the most
practical methods to evaluate federally-mandated chemical testing of commercial vessel
personnel which leads to the methods employed in this study.
B. BACKGROUND
The Coast Guard initially expressed its reasons for implementing chemical testing
in the Summary section of its Notice of Proposed Rulemaking as follows: “Through
chemical testing, the Coast Guard expects to discourage drug and alcohol use by
merchant marine personnel, an activity which adversely impacts the users, their
shipmates, the marine industry, and the public in general. Chemical testing should also
reduce the potential for marine casualties related to drug and alcohol use” (proposed, 53
Fed. Reg. Jun. 8, 1988, p. 25,926). The Summary section of the Final Rule, entitled
“Programs for Chemical Drug and Alcohol Testing of Commercial Vessel Personnel”
further articulated those reasons as follows:
These regulations require the establishment of anti-drug programs to reduce the incidence of drug abuse by commercial vessel personnel. These programs include pre-employment, periodic, random, post-accident and reasonable cause testing. The post-accident portion of the program also involves testing for alcohol use. The Coast Guard believes these rules will
17
discourage drug and alcohol use by commercial vessel personnel, reduce the potential for marine casualties related to drug and alcohol use, and enhance the safety of the maritime transportation industry (Programs for Chemical Drug and Alcohol Testing of Commercial Vessel Personnel, 53 Fed. Reg. Nov. 21, 1988, p. 47,064).10 Shortly after the Coast Guard implemented chemical testing, one law review
article entitled “Drug and Alcohol Testing of Maritime Personnel” addressed the
constitutionality of on-the-job drug testing (Wright, 1989). The Wright article discusses
the regulations in light of the Supreme Court’s decisions in Skinner v. Railway Labor
Executives Association, 409 U.S. 602 (1989) (warrant not required for safety sensitive
positions) and National Treasury Employees Union v. Von Raab, 409 U.S. 656 (1989)
(drug testing must be reasonable). In both cases, the Supreme Court of the United States
found mandatory drug testing did not violate the Fourth Amendment because the
Government had a compelling interest in ensuring public safety. Wright analyzes those
decisions and discusses the likely impact on Coast Guard regulations mandating chemical
testing of commercial vessel personnel.
Wright finds the regulations at 46 C.F.R. pt. 16 are probably constitutional
because little or no discretion is permitted in implementing them. The scope of
permissible testing is well defined; however, he finds the privacy interests of maritime
employees are severely infringed upon which would tend not to support the regulations’
constitutionality. But, Wright recognizes the maritime industry has always been highly
10 In 1988, the Coast Guard was part of the U.S. Department of Transportation. The Coast Guard became part of the U.S. Department of Homeland Security pursuant to § 888 of “The Homeland Security Act of 2002,” Pub. L. 107-296, 116 Stat. 2135, 2249 (Nov. 25, 2002). Implementing chemical testing was done in concert with other Department of Transportation modal agencies. See the Department of Transportation’s Office of Drug and Alcohol Policy and Compliance website at http://www.dot.gov/odapc/oamanagers.html.

18
regulated and that these regulations narrowly define the types of drugs to be tested for,
the circumstances under which the tests may be performed, and who may perform them.
Most importantly, Wright recognizes that the Government’s interest in
maintaining safety in the maritime industry is very significant and that “it will be up to a
federal judge or perhaps the Supreme Court to make a policy decision regarding whose
interest is more important – that of the Government in maintaining safety in the maritime
industry, or that of the employees in maintaining their privacy” (Wright, 1989, pp. 556-
57). The constitutional aspects of federally mandated drug testing have survived many
constitutional tests so it appears testing commercial vessel personnel in accordance with
the procedures described above are here to stay.
Concerning what happens to test results after marine employers forward them to
the Coast Guard, only three articles appeared in the literature pertaining to federally-
mandated chemical testing of commercial vessel personnel. The first article concerns
those crewmembers holding Coast Guard Credentials and testing positive for dangerous
drugs. It provides guidance to maritime attorneys representing those mariners in
administrative hearings (Spivey, 1997). Spivey discusses the circumstances under which
crewmembers are required to be tested for dangerous drugs, the testing process, and the
method by which the Coast Guard issues formal charges if the drug test result is positive.
She also covers procedures in lieu of an administrative hearing such as voluntary deposit,
or voluntary surrender in lieu of a hearing that relinquishes the Credential permanently.
Finally, she discusses the administrative hearing process, the Administrative Law Judge’s
role, and appeal procedures. Although the procedural rules have changed in the last 15
years, this article is still an excellent primer on the suspension and revocation process
19
involving crewmembers facing loss of their Credentials as the result of a positive
chemical test for dangerous drugs.
This author also published an article addressing similar issues covered in the
Spivey article but with new information based on regulatory changes and recent appeal
decisions concerning the cure process (Brudzinski, 2010, April 13). The latter article
places particular emphasis on the options available to mariners that test positive for
dangerous drugs which enable them to have their Credentials returned. It addresses the
hearing process but also details procedures for entering into and successfully completing
the terms of a cure settlement agreement, an avenue chosen by most credentialed
mariners/crewmembers that test positive. The suspension and revocation process allows
for little discretion on the part of the Administrative Law Judge if the Judge finds the
reason for the test is in accordance with 46 C.F.R. pt. 16 and the sample was tested in
accordance with 49 C.F.R. pt. 40. If the chemical test is ordered in accordance with 46
C.F.R. pt. 16, a positive result creates the presumption that the crewmember is a user of
dangerous drugs for which is the law mandates Revocation of the crewmember’s
Credential (Brudzinski, 2011); 46 U.S.C. § 7704(c) (2006). The above articles provide a
thorough overview of the Coast Guard’s suspension and revocation process involving
credentialed mariners that test positive for dangerous drugs; however, the articles do not
provide any empirical evidence that chemical testing discourages drug use, reduces the
potential for casualties related to drug and alcohol use, and enhances the safety of
maritime transportation.
20
C. DRUG TESTING’S LIMITATIONS
Rothstein (1991) claims there are several problems with drug testing from the
standpoint of technology assessment: 1) misidentification can occur because drug tests
detect metabolites rather than the drugs themselves (chemical tests under 49 C.F.R. pt. 40
detects both); 2) metabolites do not detect impairment (except through the blood
immediately, then it shows in the urine); 3) the duration of detectability of drug
metabolites in urine is limited; and, 4) there may be positives due to passive inhalation
(however, the cut off levels in 49 C.F.R. pt. 40 are high enough to disprove this). Despite
these limitations, one may infer people that test positive are more likely than those who
test negative to come to work under the influence of drugs or take drugs during the
workday. In general, Rothstein claims drug testing’s goal was not clear and its
effectiveness was unproven (Rothstein, 1991). These are all valid concerns and
improvements over the last two decades have minimized many of them; however,
federally-mandated chemical testing of commercial vessel personnel’s goals are clear: 1)
discourage drug and alcohol use among commercial vessel personnel; 2) reduce the
potential for marine casualties related to drug and alcohol use; and, 3) enhance the safety
of maritime transportation industry.
Drug testing’s proponents claim improved productivity and safety with fewer
drug related absences and accidents are being directly attributed to drug testing but even
if these improvements resulted from drug testing, it is not clear that they would not have
occurred in the absence of drug testing (Rothstein, 1991). Agreed, but “Coast Guard data
do not specifically indentify the use of drugs or alcohol as a major causal effect in
commercial vessel losses or casualty damage” (proposed, 53 Fed. Reg. Jul. 8, 1988, p.
21
25,927). Accordingly, this study does not examine the relationship between chemical
testing and the number or frequency of accidents, personal injuries, or deaths because
increases or decreases in injuries or deaths may be due to factors other than use of
dangerous drugs. Reducing the potential for marine casualties related to drug and alcohol
use does not require findings that drugs or alcohol caused the casualty.
A few years later, Comer (1994) claimed, among other things, that drug testing
has not been shown to be associated with enhanced organizational productivity and
safety. Comer cites Normand, Salyards, and Mahoney (1990) who studied applicants for
postal service jobs in Washington, D.C. Those applicants tested positive for drugs but
were hired for the purposes of data collection. The hired applicants had higher rates of
absenteeism and involuntary turnover but there was no significant relationship between
their Pre-Employment drug test results and their rate of injuries and accidents (Comer,
1994). These findings are similar to those in Parish (1989) concerning drug testing and
job performance. Parish (1989) conducted a six month examination of 180 new
employees at a large teaching hospital. Urine testing resulted in a 12% positivity rate.
Parish (1989) found no significant differences between employees testing positive and
those testing negative because the size of the drug-positive groups was not large enough
to detect subtle differences in job performance or retention and that further study is
needed. These findings seem to be consistent with the observations of Rothstein (1991)
and Comer (1994). The Coast Guard did not attempt to claim chemical testing would
improve job performance, productivity, or overall safety. It claimed chemical testing
“should also reduce the potential for marine casualties related to drug and alcohol use”
(proposed, 53 Fed. Reg. Jul. 8, 1988, p. 25,927). In its Final Rule, it expanded that
22
statement to “reduce the potential for marine casualties related to drug and alcohol use,
and enhance the safety of the maritime transportation industry” (53 Fed. Reg. Nov. 21,
1988, p. 47,064).
D. DISCOURAGING DRUG USE IN GENERAL
It makes sense that the first step any employer would take to discourage drug use
would be to screen employment applicants for evidence of drug use.11 To determine the
effectiveness of drug screening applicants, Cabanilla, Frankenfield, Fudala, Lange, and
Moler (1994) conducted a two month study in 1989 and again in 1991, screening
applicants for employment at the Johns Hopkins Hospital in Baltimore, Maryland.
Among other things, they found 10.8% of acceptable urine specimens tested positive for
one or more drugs in 1989 versus 5.8% in 1991. They also found the decrease to be
statistically significant (p < 0.05). The authors acknowledge that the rate of drug use
within society had also decreased from 1989 to 1991; however, they claim the decrease in
their study was more dramatic and appears to reflect other forces rendering it unlikely to
be due to shifting drug use patterns within the community where their applicants were
drawn.
Cabanilla et al. (1994) conclude the decrease in drug detection among applicants
for employment was related, at least in part, to the existence of the urine testing program.
The United States Coast Guard implemented chemical testing to discourage drug and
alcohol use by commercial vessel personnel, reduce the potential for marine casualties
related to drug and alcohol use, and enhance the safety of the maritime transportation
industry. Similar to Cabanill et al. (1994) the study described herein examines the extent
11 The terms “discourage” and “deter” are used interchangeably in this study.
23
to which chemical testing has discouraged drug and alcohol use by commercial vessel
personnel. A good starting point to determine whether drug testing discourages drug use
among commercial vessel crewmembers is the military. The military has been drug
testing its personnel since 1981. Like chemical testing of commercial vessel personnel,
the military imposes job loss on those who test positive and such high penalties are likely
to yield the maximum deterrence (Mehay & Pacula, 1999).
Using 1995 data from the National Household Survey of Drug Abuse (NHSDA)
and the Department of Defense’s Worldwide Survey of Drug Abuse (DODWWS),
Mehay and Pacula (1999) examined the deterrence effect by comparing differences in
illicit drug use between the military and the civilian populations.12 They found the
military’s strict anti-drug program to be highly effective in deterring illicit drug use to the
extent drug participation in the military ranged between 4% and 16% lower than in the
civilian sector, depending on the age group. They also used surveys based on self-
reported data, which by their very nature may be subject to biases or underreporting.
Mehay and Pacula (1999) suggest costs savings and deterrence through lower
random testing rates might be better achieved by returning to the “two-strikes policy”
used in 1984 (allowing lower ranking members to remain in the service after a positive
drug test) rather than terminating all personnel and replacing them as a result of one
positive test13 (Mehay & Pacula, 1999).
12 The National Household Survey on Drug Abuse (NHSDA) is now called the National Survey on Drug Use and Health (NSDUH). Source - http://www.oas.samhsa.gov/NSDUHlatest.htm. 13 The survey questionnaire asks “if the military stopped random, unannounced drug testing, how likely do you think you would be to use drugs” but does not discuss the percentage breakdown in responses. DODWWS, (2008), Appendix J, p.16, question 94.
24
According to the 2008 DOD Survey of Health Related Behaviors Among Active
Duty Military, self-reported dangerous drug use within the last 30 days in the military
decreased from 27.6% in 1980 to 19.0% in 1982, 8.9% in 1985, 4.5% in 1988, 3.4% in
1992, 3.0% in 1995, 2.7% in 1998, and 3.4% in 2002. In 2005 and 2008 it increased to
5.0% and 12.0% respectively due in part to wording changes in the questionnaires;
therefore, percentages from those years are not comparable to prior years (DOD Survey,
2008, Table 3.2.2). Self-reported heavy alcohol use (consuming five or more drinks on
the same occasion at least once a week during the past 30 days) within the past month has
remained at about the same level (20 to 21%), except between 1988 and 2005 when it fell
to 15-18.5% (DOD Survey, 2008, Table 3.2.1; Executive Summary, p. 3).
Mehay and Pacula’s (1999) concern about the cost of replacing terminated
personnel is valid because commercial vessel personnel that test positive lose their jobs
as well. If they are holders of Coast Guard issued Credentials, they also are subject to
losing their Credentials through the suspension and revocation process; however, they
may avail themselves of the opportunities for cure as detailed at 46 C.F.R. §§16.201(e)
and (f) so they can return to work; and, if they are Credential holders, the additional
requirements prescribed in their settlement agreements. The individual crewmember,
however, must bear the cost of cure. Unlike Mehay and Pacula (1999), this study did not
use surveys; instead, it used drug testing results reported to the Coast Guard by marine
employers.
French, Roebuck, and Alexandre (2004) found, among other things, 47% of those
surveyed worked for a company that had some type of drug testing program, the most
popular of which was pre-employment testing (38.8%) followed by reasonable suspicion
25
testing (30.6%), then random testing (24.2%). The study used data from the 1997 and
1998 National Household Surveys on Drug Abuse to examine the relationships among
drug use and workplace drug testing programs for employed individuals between age 18
and 65. They found those programs achieved a desirable result by deterring some
potential drug using employees but it often comes at a high cost in the form of drug
testing expenses, employee turnover, and additional recruitment efforts, similar to the
findings in the Mehay and Pacula (1999) study.
Mehay and Pacula (1999) as well as French et al. (2004) suggest drug testing
seems to discourage drug use but questions whether the costs are worth it. The costs of
chemical testing commercial vessel personnel (approximately $50 - $65 per test,
depending on the type) are dispersed among individual commercial vessel personnel and
their employers. These costs can be kept low by fewer positive Random tests which will
result in overall Random testing at the 25% level instead of the 50% level. Fewer
positive chemical tests will ordinarily result in a decreased need for additional chemical
tests which necessarily drive up the costs. Further, less drug use will ordinarily result in
fewer Reasonable Cause tests and fewer Post-Accident tests.
E. DISCOURAGING STUDENT DRUG USE
On the issue of simply discouraging drug use, studies pertaining to students are
informative. James-Burdumy, Goesling, Deke, and Einspruch (2010) studied mandatory-
random student drug testing (MRSDT). MRSDT’s goal is to reduce substance use among
students whose high school districts have applied for and received funds to implement
mandatory-random drug testing. MRSDT requires students and their parents to sign
consent forms agreeing that participation in sports or other school activities will be
26
conditioned upon the students being subject to random drug testing. Like commercial
vessel personnel chemical testing, the MRSDT program administers drug tests to at least
50% of eligible students to detect the presence of at least five substances (marijuana,
amphetamines, cocaine, methamphetamines, and opiates). MRSDT also uses
questionnaires concerning alcohol use.
The MRSDT program’s theory predicts mandatory, random student drug testing
may reduce students’ use of substances. If students are aware a random drug test is
possible they might stop using substances or at least give them a reason to refuse to use
substances. The program also predicted students testing positive for drugs can be
identified and referred for treatment or counseling. Finally, the MRSDT program
predicted it would most likely have a “spillover” effect on other students as they observe
and are influenced by their peers’ behavior.
James-Burdumy et al. (2010) compared students in treatment schools with
MRSDT to students in control schools without MRSDT. Among other things, the study
discovered that within the preceding thirty days, 16% of students subject to MRSDT
reported using any substance compared with 22 % of comparable students in the control
schools without MRSDT. It also found 10 % of students subject to MRSDT reported
using any substance excluding alcohol within the preceding thirty days compared to 13%
of comparable students in the control schools without MRSDT. Further, it found testing
for a larger number of substances as well as testing for alcohol and tobacco were
significantly correlated with lower substance use in the treatment schools relative to the
control schools. Out of 3,476 random drug tests administered in MRSDT schools during
the year long, 2007-2008 evaluation period, 38 were positive, resulting in a drug test positive
27
rate of 1.09%. The study also found a decline in student drug use over the last 10 years.
This study of commercial vessel personnel shows similar results from archived drug
testing results, not from questionnaires. For example, the Random positive test rate for
commercial vessel personnel during 2007-2008 averaged 1.15%, close to the MRST
positive rate of 1.09%. MRST students and commercial vessel crewmembers were aware
that they were subject to unannounced random drug testing.
The MRST study found no “spillover effect” from experimental schools to control
schools and no impact on the number of disciplinary incidents. Like the MRSDT program’s
theory that drug testing reduces student substance use in part by deterrence through the threat
of testing, this study shows mandatory chemical testing of commercial vessel personnel
coincides with reduced substance use, including alcohol.
There are two other studies pertaining to student drug testing that have relevance to
discouraging drug use by commercial vessel personnel. The first study is by Yamaguchi,
Johnston, and O’Malley (2003a). The authors used questionnaires and focused on grades
8, 10, and 12. Among other research questions, Yamaguchi et al., 2003a, p. 159 asked:
“What relationship exists between student drug use and school testing?” The
investigators found no association between drug testing and the prevalence or frequency
of student drug use (Yamaguchi et al., 2003a).
The same authors conducted a subsequent study, referred to as Yamagouchi et al.,
(2003b). Their second study found drug testing does not inhibit student drug use but
random testing of all students was the most promising in reducing student drug use. It
also found testing of athletes did not produce encouraging results (Yamagouchi et al.
2003b). Consistent with these findings, the study of commercial vessel crewmembers
28
shows, among other things, that gradually decreasing Random drug test positivity rates
are an accurate predictor of gradually decreasing Post-Accident positivity rates.
F. DRUG TESTING AND ACCIDENTS
In the construction industry, with its high rates of alcohol and other drug use
coupled with the high-risk, safety-sensitive nature of the work, Gerber and Yacoubian
(2001) found that between 1988 and 1998, the average company in its questionnaire
sample that tested for drugs reduced its injury rate 51% within two years of implementing
drug testing. The sample’s injury rate went from 8.9 injuries per 200,000 work-hours to
4.4 injuries per 200,000 work-hours, which was statistically significant (Gerber &
Yacoubian, 2001).
Even if the improvements noted in the Gerber and Yacoubian (2001) study
resulted from drug testing, they could have taken place in the absence of drug testing
(Rothstein, 1991). The same can be said for vessel casualties, injuries, and deaths.
Crewmember injuries and deaths as well as vessel losses and damages may be higher or
lower but the reasons may not necessarily be due to chemical testing or the absence of
chemical testing. For example, from 1992 through 2010, there were 2,072 fishing vessels
lost at sea and 1,055 fishing vessel fatalities. The fishing vessel losses averaged 109 per
year but from 2006 through 2010, the average loss rate dropped to 61 per year. The
fatalities averaged 56 per year but from 2006 through 2010, the average dropped to 39 per
year (U.S. Coast Guard, 2011). Most losses are due to flooding and fires - problems that
are largely not covered nor can be substantially prevented by the current regulations.
The reductions in fishing vessel losses and fatalities cannot be attributed to Pre-
Employment, Random, or Reasonable-Cause drug testing because commercial fishing
29
vessel crewmembers are not subject to those comprehensive chemical tests except for
Post-Accident drug and alcohol tests. In the case of crewmembers on other vessels
subject to comprehensive chemical testing, the potential for marine casualties related to
drugs or alcohol may decrease but it does not necessarily mean that the potential for
marine casualties related to non-drug or non-alcohol factors will also decrease. Put
another way, while the number of vessel casualties related to drugs and alcohol
decreases, the number of vessel casualties related to other factors may increase.
Jacobson (2003) found from 1988 through 1990, drug testing led to a 9 to 10
percent reduction in truck accident fatalities but she does not “reject at the 5 percent level
the hypothesis that there has been no change in trends in fatal truck crashes relative to car
crashes per VMT [vehicle miles traveled] in 1998, 1989, or 1990” (Jacobson, 2003,
p.139). Put another way, the reduction in truck accident fatalities may not necessarily be
attributed to drug testing compared to car crash fatalities per vehicle miles traveled. The
Jacobson study illustrates the limitations in attempting to link drug testing with improved
safety statistics. Relating the Jacobson study to chemical testing of commercial vessel
personnel, marine casualty data might show vessels with crewmembers not subject to
chemical testing other than Post-Accident drug and alcohol testing have a higher death
rate per serious marine incident than vessels with crewmembers previously subject to
Random drug testing. To claim chemical testing reduces the number of deaths per
serious marine incident would ignore the multitude of other causative factors such as
crew training and certification, material condition of the vessel, the relative danger of the
vessel’s work, duration and conditions of deployment, and crew fatigue, just to name a
few. Because of those limitations, this study addressed only the goals of commercial
30
vessel personnel chemical testing as expressed in the Final Rule and avoided any
comparisons of death or injury rates.
Normand et al. (1990) investigated the relationship between pre-employment
drug-test results and absenteeism, turnover, injury, and accidents of U.S. Postal Service
employees. Among other things, the Normand study found the positive drug-test group
had a 59.3% higher absence rate and a 47% higher involuntary separation rate than those
who tested negative. However, Normand et al. (1990) found no statistically significant
relationship between drug-test results and the number of injuries and no statistically
significant relationship between drug-test results and the number of accidents. The study
explained that various factors may have contributed to the non-significant findings such
as the relatively short amount of time new employees were studied and the relatively low
numbers of employees. “As the tenure of participants increases, the accident and injury
rates are expected to increase, which will permit us to more efficiently detect any true
differences” (Normand et al., 1990, p. 637).
Zwerling, Ryan, and Orav (1990) conducted pre-employment drug screening of
U.S. Postal Service employees that were hired and found those testing positive for
marijuana had increased risks of termination, accident, injuries, and discipline compared
to those testing negative. More specifically, Zwerling et al. (1990) found those testing
positive for marijuana have 55% more industrial accidents, 85% more injuries, and a 78%
increase in absenteeism. Zwerling et al. (1990) also found those testing positive for
cocaine had no increased risk for termination but did have an increased risk for accidents,
injuries, and disciplinary actions relative to those testing negative; however, only the risk
for injuries was statistically significant for those testing positive for cocaine. Those
31
testing positive for cocaine had a 145% increase in absenteeism and also an 85% increase
in injuries (Zwerling et al., 1990).
In their second Post Office study, Ryan, Zwerling, and Jones (1992) found those
that tested positive for marijuana and cocaine had increased risks for firing, accidents,
injuries, discipline, and absence. Ryan et al. (1992) specifically found marijuana users
had a statically significant increased risk of accident and injury and that cocaine users had
a statistically significant increased risk of accident but just short of a statistically
significant risk for injury ( p = .051).
Consistent with Normand et al. (1990) and somewhat at odds with Zwerling et al.
(1990) and Ryan et al. (1992) is Parish (1989). Parish assessed the relationship between
positive drug tests and job performance. He compared job performance characteristics
of employees testing positive with those employees testing negative and found “no
significant difference between individuals who tested positive and those who tested
negative using broad categories of job performance” (Parish, 1989, p. 47).
The instant study on commercial vessel crewmembers focused on Random and
Post-Accident positivity rates with the latter category including injuries and accidents. It
did not address job performance because prospective crewmembers that failed the Pre-
Employment drug test must be denied employment as a crewmember; therefore, this
study could not measure employment outcomes based on the Pre-Employment drug test.
Moreover, employed crewmembers failing a Random, Reasonable Cause, Periodic, or
Post-Accident drug test must also be removed from duties which directly affect the safe
operation of the vessel as soon as practicable, so conducting a study of crewmembers like
32
Normand et al. (1990) and Zwerling et al. (1990) was not possible for commercial vessel
crewmembers.
Fortner, Martin, Esen, and Shelton, (2011) surveyed 1,058 human resource
professionals whose companies had drug testing programs. The participants responded
from a sample of 6,000 randomly selected from the Society of Human Resource
Management’s 600,000 members. The human resource professionals answered multiple
choice questions the Drug and Alcohol Testing Industry Association developed to obtain
their current opinions about drug testing. They reported a decrease in workers’
compensation incidence rates from 14% to 6% after implementing drug testing programs,
a decrease of 57%. Fortner et al. (2011) also found workers’ compensation premiums
were lower for companies having mandatory drug testing because it is known drug
testing will decrease accidents and costs associated with claims. Most relevant to this
study, Fortner et al. (2011) found Random testing to be the greatest on the job drug abuse
deterrent because employees do not know when they will be asked to provide a specimen.
The instant study showed similar results; that is, crewmembers not knowing when the
Random test will occur will be a great deterrent to drug use.
The Fortner et al. (2011) results are consistent with Levine and Rennie (2004).
Levine and Rennie (2004) found that to truly focus on drug detection, Random drug
testing is better than Pre-Employment drug testing. Pre-Employment drug testing
encourages employees to simply pass a one-time drug test which will only detect “the
uninformed, forgetful, or most severely addicted individuals” (Levine and Rennie, 2004,
p 323). The Fortner study does not indicate whether the human resource respondents also
relied upon drug testing results to support their answers. This study did not use
33
questionnaires but instead used drug and alcohol testing results submitted to the Coast
Guard by marine employers as required by regulation. This eliminated subjective
responses from crewmembers and their employers and allowed inferences and
conclusions to come from the data, not the opinions of crewmembers or their employers.
G. DRUG TESTING RESULTS
The federal government’s primary contractor for safety-sensitive drug testing is
Quest Diagnostics. Quest’s Drug Testing Index Archives provide an abundance of drug
testing results going back to 1988, and, for federally-mandated, safety-sensitive drug
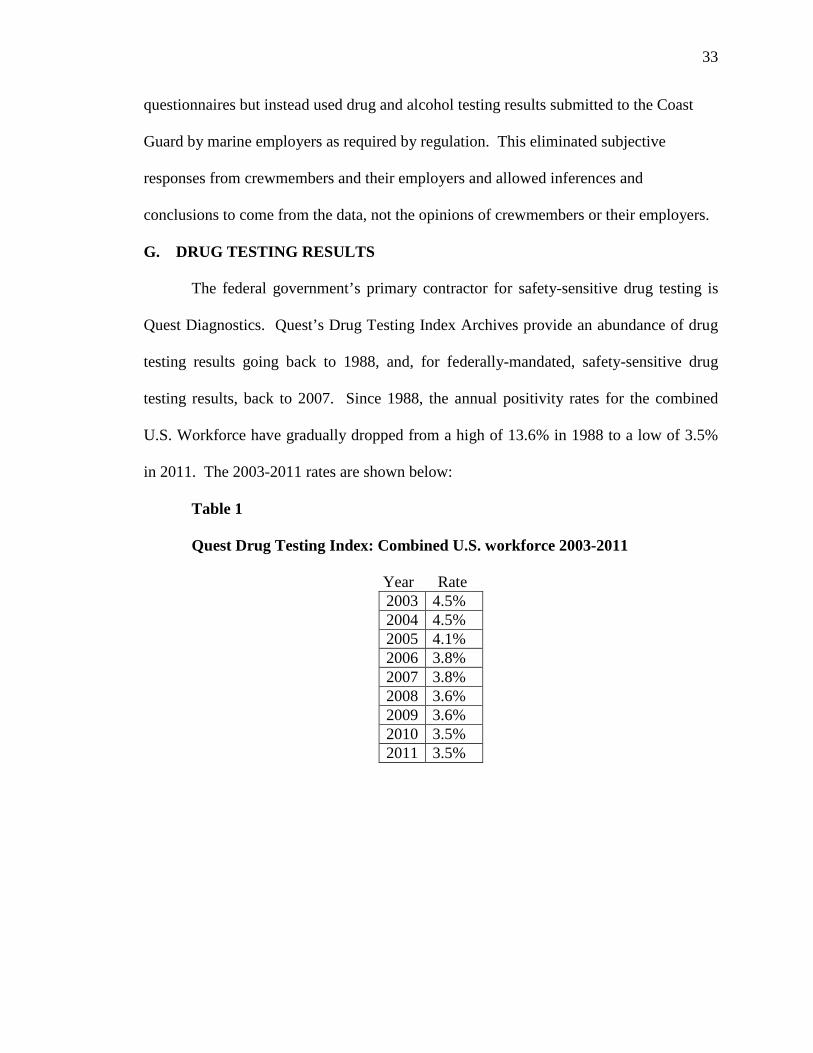
testing results, back to 2007. Since 1988, the annual positivity rates for the combined
U.S. Workforce have gradually dropped from a high of 13.6% in 1988 to a low of 3.5%
in 2011. The 2003-2011 rates are shown below:
Table 1
Quest Drug Testing Index: Combined U.S. workforce 2003-2011
Year Rate 2003 4.5% 2004 4.5% 2005 4.1% 2006 3.8% 2007 3.8% 2008 3.6% 2009 3.6% 2010 3.5% 2011 3.5%
34
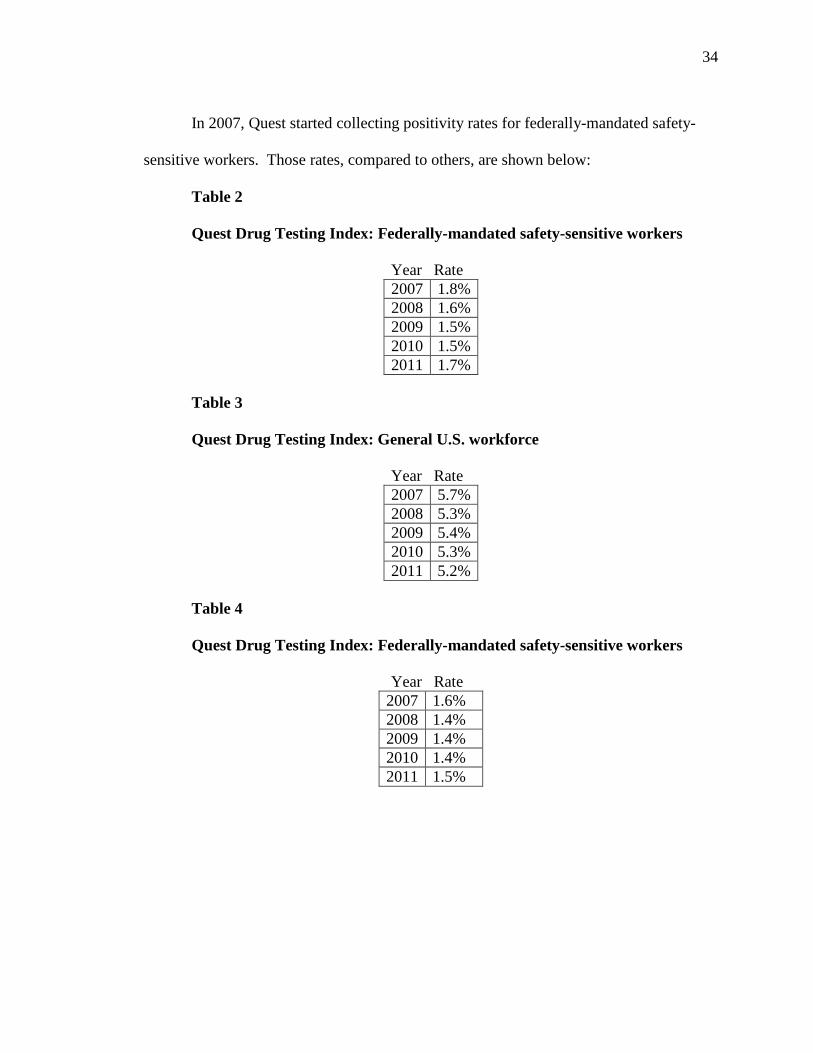
In 2007, Quest started collecting positivity rates for federally-mandated safety-
sensitive workers. Those rates, compared to others, are shown below:
Table 2
Quest Drug Testing Index: Federally-mandated safety-sensitive workers
Year Rate 2007 1.8% 2008 1.6% 2009 1.5% 2010 1.5% 2011 1.7%
Table 3
Quest Drug Testing Index: General U.S. workforce
Year Rate 2007 5.7% 2008 5.3% 2009 5.4% 2010 5.3% 2011 5.2%
Table 4
Quest Drug Testing Index: Federally-mandated safety-sensitive workers
Year Rate 2007 1.6% 2008 1.4% 2009 1.4% 2010 1.4% 2011 1.5%
35
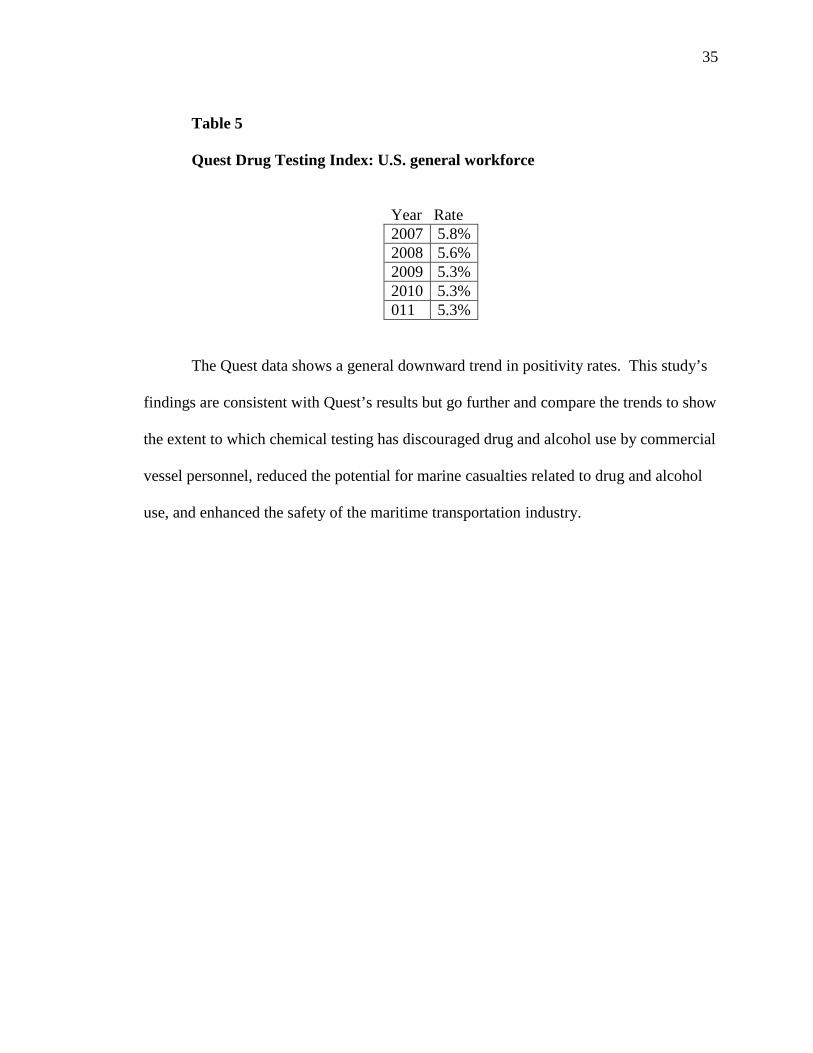
Table 5
Quest Drug Testing Index: U.S. general workforce
Year Rate
2007 5.8% 2008 5.6% 2009 5.3% 2010 5.3% 011 5.3%
The Quest data shows a general downward trend in positivity rates. This study’s
findings are consistent with Quest’s results but go further and compare the trends to show
the extent to which chemical testing has discouraged drug and alcohol use by commercial
vessel personnel, reduced the potential for marine casualties related to drug and alcohol
use, and enhanced the safety of the maritime transportation industry.
36
III. METHODOLOGY
A. OVERVIEW
The methodology used in this study was a secondary data analysis of archived,
Management Information System (MIS) chemical testing reports and archived, Serious
Marine Incident (SMI) reports including chemical testing supplements, from 2003
through 2011. SMI reports and supplements are contained in the Marine Information
Safety and Law Enforcement (MISLE) system. In 2003, the Coast Guard implemented
the MISLE system. Among other things, MISLE has made vessel casualty and
supplemental Post-Accident drug and alcohol testing information more readily available
and retrievable than previous systems. Readily available and retrievable data is the
reason this study focuses on the 2003-2011 timeframe. That timeframe is a sufficiently
long and recent enough period from which to draw conclusions about the Coast Guard’s
chemical testing program.
B. DATA COLLECTION MEASURES/PROCEDURES
A data archive of drug and alcohol test results marine employers are required to
submit to the Coast Guard was analyzed for this study. This author obtained these data
archives through requests to the U.S. Coast Guard at [email protected] under the Freedom
of Information Act (FOIA), 5 U.S.C. § 552 (2006); 6 C.F.R. Part 5 (2012).14 The requests
described this academic study and asked for Marine Information System Pre-
Employment, Random, Reasonable Cause, and Post-Accident drug testing results from
2003-2011 that marine employers send to the Coast Guard on a yearly basis.
14 See http://www.dhs.gov/xfoia/Copy_of_editorial_0318.shtm.
37
The FOIA request also asked for the yearly 2003-2011 listing of serious marine
incident reports for commercial fishing vessels and small passenger vessels together with
Post-Accident drug or alcohol test results. After the initial request, this author was able
to maintain contact with the appropriate official most knowledgeable of the data available
and was therefore able to further refine the requests. The listed reports contain the
number of drug or alcohol tests initiated and the results of those tests. For drug test
results, it asked only for the number of verified positives for one or more drugs. For
alcohol tests, it asked only for the number of tests and whether the tests were positive.
The SMI data were made available in EXCEL® Spreadsheet form and contain no names
or other personal identifying information.
The MIS drug testing results were provided in Microsoft Word form and entered
into EXCEL® spreadsheets. All types of drug tests and corresponding results are
displayed on a form similar to the form marine employers submit to the Coast Guard on a
yearly basis. The employers’ yearly reports are compiled and maintained at Coast Guard
Headquarters. This study did not require names or other personal identifying information
as part of the data requested. The author asked for and was granted a FOIA fees waiver
in accordance with 6 C.F.R. § 5.11(d) (4) and (5) (2012) because this is an academic
study.
C. DATABASES
The MIS database consists of the following chemical test results from all
commercial vessel crewmembers subject to chemical testing for the following types of
drug tests: Pre-Employment, Random, Post-Accident, Reasonable Cause, Return-to-Duty,
and Follow-up. For each type of chemical test, marine employers list the results on the
38
U.S. Department of Transportation Drug and Alcohol Testing Management Information
System (MIS) Data Collection Form in thirteen (13) numbered columns as follows: 1)
total number of test results; 2) verified negative; 3) verified positive results for one or
more drugs; 4) positive for marijuana; 5) positive for cocaine; 6) positive for PCP; 7)
positive for opiates; 8) positive for amphetamines; 9) adulterated; 10) substituted; 11) shy
bladder with no medical explanation; 12) other refusals to submit to testing; and, 13)
cancelled results. The totals in columns 1, 2, 3, 9, 10, 11, and 12 comprise the total
number of test results for each type of test. Cancelled results are not included in the total
number of test results. Positive results for the presence of specific drugs such as
marijuana, cocaine, etc., are subsumed in column 3, titled “verified positive results for
one or more drugs.” Crewmembers’ names or other identifying information are not
included in the MIS data collection forms.
The SMI data base in the MISLE system consists of all vessel casualty reports
meeting the requirements of Serious Marine Incident as described earlier in this proposal
under the headings “Required Testing” as well as “Records and Reports.” Marine
employers submit those reports to the Coast Guard on form CG-2692, “Report of Marine
Accident, Injury or Death” together with a supplemental form entitled “Required
Chemical Drug and Alcohol Testing Following a Serious Marine Incident,” form CG-
2692B, as described in 46 C.F.R. §§ 4.05-10, 4.06-60, and 16.240 (2012).
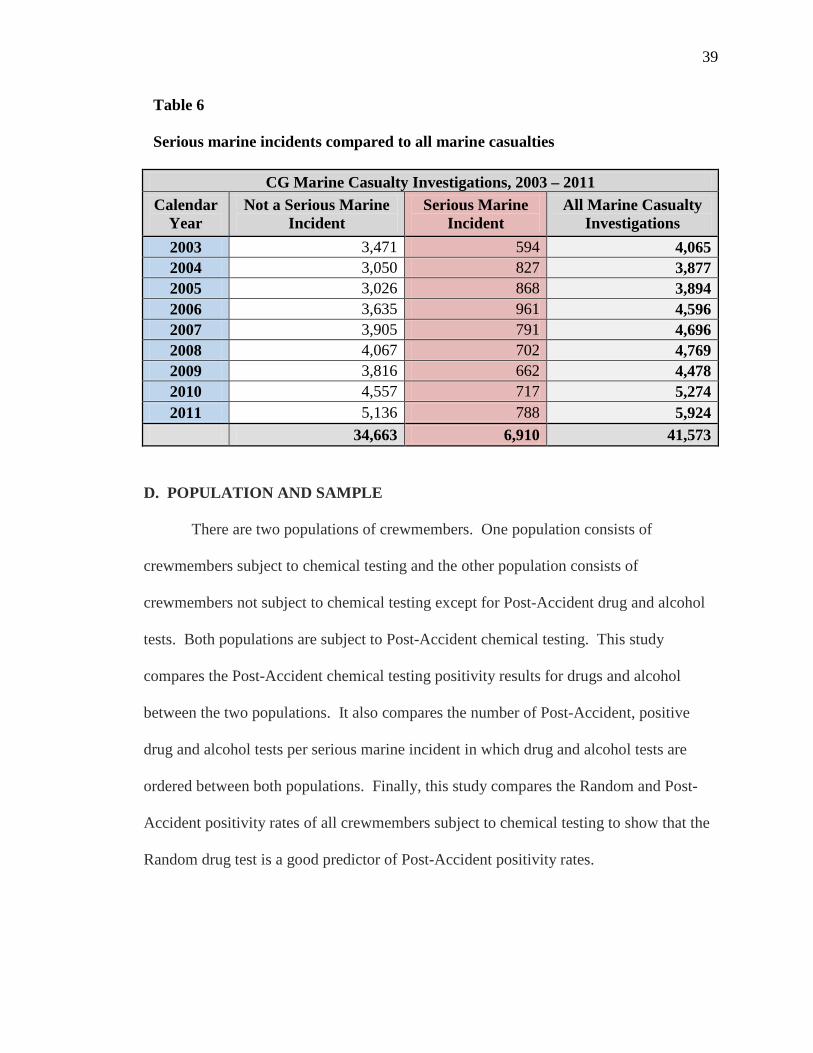
The numerical relationship of serious marine incidents to all marine casualties is
displayed in Table 6 on the following page.
39
Table 6
Serious marine incidents compared to all marine casualties
CG Marine Casualty Investigations, 2003 – 2011 Calendar
Year Not a Serious Marine
Incident Serious Marine
Incident All Marine Casualty
Investigations 2003 3,471 594 4,065 2004 3,050 827 3,877 2005 3,026 868 3,894 2006 3,635 961 4,596 2007 3,905 791 4,696 2008 4,067 702 4,769 2009 3,816 662 4,478 2010 4,557 717 5,274 2011 5,136 788 5,924
34,663 6,910 41,573
D. POPULATION AND SAMPLE
There are two populations of crewmembers. One population consists of
crewmembers subject to chemical testing and the other population consists of
crewmembers not subject to chemical testing except for Post-Accident drug and alcohol
tests. Both populations are subject to Post-Accident chemical testing. This study
compares the Post-Accident chemical testing positivity results for drugs and alcohol
between the two populations. It also compares the number of Post-Accident, positive
drug and alcohol tests per serious marine incident in which drug and alcohol tests are
ordered between both populations. Finally, this study compares the Random and Post-
Accident positivity rates of all crewmembers subject to chemical testing to show that the
Random drug test is a good predictor of Post-Accident positivity rates.
40
Samples from the population subject to chemical testing consist of yearly 2003-
2011 Post-Accident drug and alcohol test results from the SMI database as well as the
number of serious marine incidents involving one vessel category. Samples from the
population subject to chemical testing also consist of yearly 2003-2011 Pre-Employment,
Random, and Post-Accident chemical drug test results from the MIS database. In
addition to all crewmembers subject to chemical testing from the MIS database, serious
marine incidents and Post-Accident positivity rates from crewmembers of U.S.
Documented vessels of 100 gross tons or less certificated for carrying six or more
passengers for hire were examined.
Samples from the population not subject to comprehensive chemical testing (Pre-
Employment, Random, etc.) consist of drug and alcohol tests and the number of serious
marine accidents in the SMI database from crewmembers of U.S. Documented
commercial fishing vessels.
The 100 tons or less vessels are more fully described in Subchapters T and K of
Title 46 Code of Federal Regulations (C.F.R.) and are hereinafter referred to as small
passenger vessels or SPVs. Small passenger vessel crewmembers in safety sensitive
positions are subject to chemical testing as well as Coast Guard credentialing or licensing
requirements. SPVs are also subject to Coast Guard inspection and are the most
regulated of all U.S. Documented vessels. They are required to be manned with a
minimum number of credentialed crewmembers in certain positions that are subject to
watch standing limitations. The vessel’s Certificate of Inspection shows it has met the
minimum Coast Guard safety standards for fire-extinguishing systems, manning, vessel
de-watering capabilities, life saving, and navigation equipment. The Certificate of
41
Inspection also prescribes the maximum number of passengers the vessel may carry. It is
displayed in an area accessible to passengers.
U.S. Documented commercial fishing vessels (hereinafter referred to as
commercial fishing vessels, CFVs, or fishing vessels) are the least regulated of all U.S.
Documented commercial vessels and are not subject to Coast Guard inspection except for
some safety features.15 Commercial fishing vessel crewmembers are not subject to Coast
Guard credentialing or licensing requirements; they have no limits on the time they are on
duty standing watch; and, they are not required to pass a Pre-Employment chemical test
or be subject to subsequent Random or Reasonable Cause testing.16 They are, however,
subject to Post-Accident drug and alcohol testing so they present a perfect contrast to
small passenger vessel crewmembers for comparison.17
Table 7 shows the yearly 2003-2009 selected vessel populations of active U.S.
Documented commercial fishing vessels compared to the population of active U.S.
Documented small passenger vessels.
15 46 C.F.R. § 16.240 (2012); 49 C.F.R. Part 40, Appendix H (2012). Alcohol testing results are submitted to the Coast Guard only as part of the Serious Marine Incident Report under 46 C.F.R. § 4.06, not as part of the MIS data collection form in accordance with 46 C.F.R. § 16.500(a) (2012). 16 This study refers to Pre-Employment, Random, and Reasonable Cause testing as comprehensive chemical testing. 17 Commercial fishing vessels 200 gross tons and above require a licensed master thus subjecting crewmembers in safety sensitive positions to comprehensive drug testing in addition to Post-Accident testing. The MIS data base may therefore include some Post-Accident drug test results from commercial fishing vessels 200 gross tons and above which are also included in the second SMI sample. The number of such vessels is relatively small and will not affect the differences in Post-Accident positivity rates between the MIS and SMI second samples because the positivity rates are reported to the SMI database as well as the MIS database.
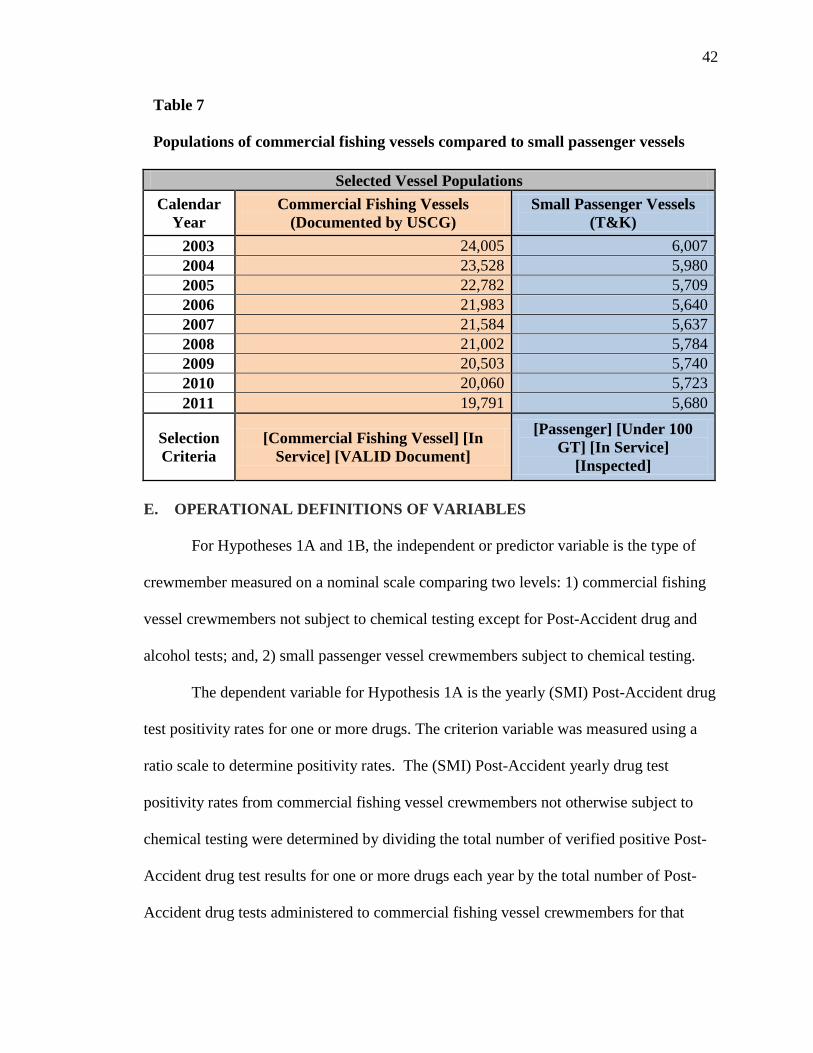
42
Table 7 Populations of commercial fishing vessels compared to small passenger vessels
Selected Vessel Populations Calendar
Year Commercial Fishing Vessels
(Documented by USCG) Small Passenger Vessels
(T&K) 2003 24,005 6,007 2004 23,528 5,980 2005 22,782 5,709 2006 21,983 5,640 2007 21,584 5,637 2008 21,002 5,784 2009 20,503 5,740 2010 20,060 5,723 2011 19,791 5,680
Selection Criteria
[Commercial Fishing Vessel] [In Service] [VALID Document]
[Passenger] [Under 100 GT] [In Service]
[Inspected] E. OPERATIONAL DEFINITIONS OF VARIABLES
For Hypotheses 1A and 1B, the independent or predictor variable is the type of
crewmember measured on a nominal scale comparing two levels: 1) commercial fishing
vessel crewmembers not subject to chemical testing except for Post-Accident drug and
alcohol tests; and, 2) small passenger vessel crewmembers subject to chemical testing.
The dependent variable for Hypothesis 1A is the yearly (SMI) Post-Accident drug
test positivity rates for one or more drugs. The criterion variable was measured using a
ratio scale to determine positivity rates. The (SMI) Post-Accident yearly drug test
positivity rates from commercial fishing vessel crewmembers not otherwise subject to
chemical testing were determined by dividing the total number of verified positive Post-
Accident drug test results for one or more drugs each year by the total number of Post-
Accident drug tests administered to commercial fishing vessel crewmembers for that
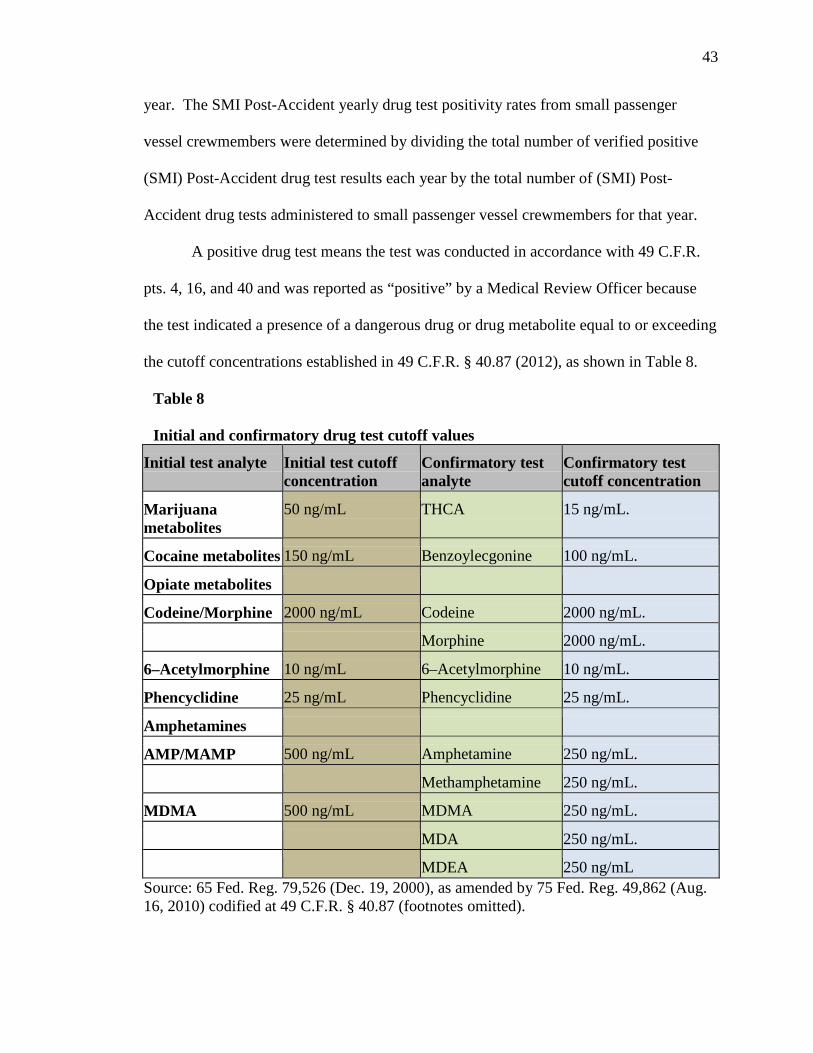
43
year. The SMI Post-Accident yearly drug test positivity rates from small passenger
vessel crewmembers were determined by dividing the total number of verified positive
(SMI) Post-Accident drug test results each year by the total number of (SMI) Post-
Accident drug tests administered to small passenger vessel crewmembers for that year.
A positive drug test means the test was conducted in accordance with 49 C.F.R.
pts. 4, 16, and 40 and was reported as “positive” by a Medical Review Officer because
the test indicated a presence of a dangerous drug or drug metabolite equal to or exceeding
the cutoff concentrations established in 49 C.F.R. § 40.87 (2012), as shown in Table 8.
Table 8 Initial and confirmatory drug test cutoff values
Initial test analyte Initial test cutoff concentration
Confirmatory test analyte
Confirmatory test cutoff concentration
Marijuana metabolites
50 ng/mL THCA 15 ng/mL.
Cocaine metabolites 150 ng/mL Benzoylecgonine 100 ng/mL.
Opiate metabolites
Codeine/Morphine 2000 ng/mL Codeine 2000 ng/mL.
Morphine 2000 ng/mL.
6–Acetylmorphine 10 ng/mL 6–Acetylmorphine 10 ng/mL.
Phencyclidine 25 ng/mL Phencyclidine 25 ng/mL.
Amphetamines
AMP/MAMP 500 ng/mL Amphetamine 250 ng/mL.
Methamphetamine 250 ng/mL.
MDMA 500 ng/mL MDMA 250 ng/mL.
MDA 250 ng/mL.
MDEA 250 ng/mL Source: 65 Fed. Reg. 79,526 (Dec. 19, 2000), as amended by 75 Fed. Reg. 49,862 (Aug. 16, 2010) codified at 49 C.F.R. § 40.87 (footnotes omitted).
44
Federal Regulations include very specific procedures to prevent the possibility of
false positive drug tests. Those procedures include: 1) using certified laboratories subject
to inspection and audit; 2) validating all results by a Medical Review Officer (MRO) for
each positive determination; and, 3) having pre-defined thresholds for positive test
determinations. Given these tight controls, the positive drug test results used in this study
are considered to include few errors.18
The dependent variable for Hypothesis 1B is the same as for Hypotheses 1A
except it compares the yearly (SMI) Post-Accident alcohol test positivity rates instead of
drug test positivity rates. A positive test for the presence of alcohol means evidence of
alcohol to the extent of 0.02 or higher as provided in 49 C.F.R. §§ 40.3 and 40.23.19
For Hypotheses 1C, the independent or predictor variable is the same as for
Hypothesis 1A and 1B except this variable is measured using a nominal scale comparing
two levels: 1) crewmembers on commercial fishing vessels not subject to chemical
testing except for Post-Accident drug and alcohol tests; and, 2) crewmembers on ALL
vessels subject to chemical testing.
The dependent or criterion variable for Hypothesis 1C is the yearly Post-Accident
drug test rates for one or more drugs. This study measured the criterion variable using a
ratio scale to determine positivity rates. The (SMI) Post-Accident yearly drug test
18 Prior to October 1, 2010, the cocaine metabolite initial test cutoff concentration was 300 ng/ml vice 150 ng/ml. Also, the amphetamine initial test cutoff was 1000 ng/ml vice 500 ng/ml and the confirmatory test cutoff was 500 ng/ml vice 250 ng/ml. For methamphetamine, the old confirmation test cutoff was 500 ng/ml vice 250 ng/ml. These lower cutoffs will likely produce an increase in the number of positive cocaine and amphetamine drug tests which will result in an “uptick” in positivity rates starting in 2011. 19 The regulations at 49 C.F.R. § 40.23(c) (2012) require the employer that receives an alcohol test result of 0.04 or higher to remove immediately the employee involved in the accident from performing safety-sensitive functions. If the employer receives an alcohol test result of 0.02 – 0.39, the employer must temporarily remove the employee involved from performing safety sensitive functions.
45
positivity rates from commercial fishing vessel crewmembers not otherwise subject to
chemical testing were determined by dividing the total number of verified positive Post-
Accident drug test results for one or more drugs each year by the total number of Post-
Accident drug tests administered to commercial fishing vessel crewmembers for that
year. The MIS Post-Accident yearly drug test positivity rates from all vessels with
crewmembers subject to chemical testing were determined by dividing the total number
of verified positive Post-Accident drug test results each year by the total number of Post-
Accident drug tests administered.
For Hypotheses 2A and 2B, the independent or predictor variable was the same as
for Hypotheses 1A and 1B; that is, the type of crewmember. This variable is measured
using a nominal scale comparing two levels: 1) crewmembers on commercial fishing
vessels not subject to chemical testing except for Post-Accident drug and alcohol tests;
and, 2) crewmembers on small passenger vessels subject to chemical testing.
The dependent or criterion variable for Hypothesis 2A is yearly (SMI) Post-
Accident positive drug tests for one or more drugs per serous marine incident in which
drug tests were reported. The criterion variable was measured using a ratio scale to
determine positive tests per serious marine incident. The (SMI) Post-Accident yearly
positive drug tests per serious marine incident from commercial fishing vessel
crewmembers were determined by dividing the yearly number of positive drug tests by
the yearly number of commercial fishing vessel serious marine incidents in which drug
tests were reported.
The dependent or criterion variable for Hypothesis 2B is the yearly (SMI) Post-
Accident positive alcohol tests per serous marine incident in which alcohol tests were
46
reported. This study measured the criterion variable using a ratio scale to determine
positive tests per serious marine incident. The (SMI) Post-Accident yearly positive
alcohol tests per serious marine incident from commercial fishing vessel crewmembers
were determined by dividing the yearly number of positive alcohol tests by the yearly
number of commercial fishing vessel serious marine incidents in which alcohol tests were
reported.
For Hypothesis 3, the Predictor Variable is the type of drug test. This variable
was measured using a nominal scale comparing two levels: 1) Random drug tests of all
crewmembers subject to chemical testing; and 2) Post-Accident drug tests of all
crewmembers subject to chemical testing.
The dependent or criterion variable is the Random and Post-Accident yearly
positivity rates for one or more drugs using a ratio scale to determine positivity rates.
The (MIS) Random drug test positivity rates from all vessels with crewmembers subject
to chemical testing were determined by taking the yearly number of verified positives for
one or more drugs plus the number of Random drug test refusals which includes
adulterated, substituted, “shy bladder” with no medical explanation, and other refusals to
submit to drug testing, and dividing the sum by the total number of Random drug test
results reported for that year. The Coast Guard used this method to determine Random
positivity rates. The (MIS) Post-Accident drug test positivity rates from all vessels with
crewmembers subject to chemical testing were determined by taking the yearly number
of verified positives for one or more drugs and dividing it by the total number of Post-
Accident tests reported for that year.
47
IV. ANALYSIS
Hypotheses 1A and 1B addressed comparisons between yearly and total 2003-
2011 Post-Accident drug and alcohol positivity rates of commercial fishing vessel
crewmembers and small passenger vessel crewmembers. Hypothesis 1C addressed
comparisons between yearly and total 2003-2011 Post-Accident drug test positivity rates
of commercial fishing vessel crewmembers and all crewmembers subject to chemical
testing from all vessels. Hypotheses 2A and 2B addressed comparisons between yearly
and total 2003-2011 ratios of positive Post-Accident drug and alcohol tests per serious
marine incident in which drug and alcohol tests were reported of commercial fishing
vessel crewmembers and small passenger vessel crewmembers. For Hypothesis 3, this
author examined the relationship between Random and Post-Accident drug test results
from crewmembers of all vessels to determine how strongly they are correlated and if
Random positivity rates are a good predictor of Post-Accident positivity rates.
In comparing positivity rates and ratios of positive tests per serious marine
incident in Hypotheses 1A, 1B, 1C, 2A, and 2B, this author employed tables and
histograms. To determine if the differences in positivity rates and differences in ratios of
positive tests per serious marine incident were statistically significant, this author used
the two proportion z-test for those hypotheses. This author applied that test to compare
the yearly and total differences in positivity rates and positive tests per serious marine
incident between two relevant populations, one with crewmembers subject to chemical
48
testing and one not subject to chemical testing except for Post-Accident drug and alcohol
testing.20
Utilizing the two proportion z-test was based on the following assumptions: 1) the
samples are categorical and independent; 2) crewmembers selected for drug and alcohol
tests are selected as the result of a serious marine incident which is a random occurrence;
3) the test results are either positive or negative; 4) the predictor variable has two levels
measured on a nominal scale – crewmembers subject to chemical testing and
crewmembers not subject to chemical testing; 5) the number of tests in the samples is
large - thirty and above; and, 6) ratio scale is used to determine positivity rates and
positive tests per serious marine incident. The two proportion z test can also be used to
examine each year individually.
In comparing Random and Post-Accident positivity rates in Hypothesis 3, I used
the correlation coefficient and linear regression analysis to determine if there is a
relationship between Random and Post-Accident positivity rates from all vessels with
crewmembers subject to chemical testing. For all hypotheses, except Hypothesis 3, the
null hypothesis would be zero; that is, there is no difference between the population
proportions. For Hypotheses 1A and 1B, the alternative Hypotheses is commercial
fishing vessel crewmember positivity population proportion is greater than the small
passenger vessel crewmember proportion. For Hypotheses 1C, the alternative
Hypothesis that the commercial fishing vessel crewmember population proportion is
greater than the crewmember population proportion of all vessels subject to chemical
20 “Subject to chemical testing” means subject to the prescriptions in 46 C.F.R. pt. 16; that is, subject to Pre-employment, Random, and Periodic as well as Post-Accident.
49
testing. For Hypotheses 2A and 2B, the alternative Hypotheses is commercial fishing
vessel population proportions are greater than the small passenger vessel proportions.
For Hypothesis 3, the null hypothesis is that there is no correlation. The alternative
Hypothesis is there is a strong correlation between the two population proportions. For
statistical tests in Hypotheses 1A, 1B, 1C, 2A, and 2B, the alpha level was set a priori at
.05.
Rumsey (2011, pp. 240-42) explains the two-proportion z-test in easy to
understand terms as does Larson and Farber (2009, pp. 407, 425) and Moore, McCabe,
and Craig (2009, pp. 512-16). Simple explanations are also found under Statistical
Hypothesis Testing, Common Test Statistics at wikipedia.org and at stattrek.com under
Hypothesis Test: Difference Between Proportions. The two proportion z test formula is
as follows:
This formula compares differences in positivity rates (numerator) to the overall,
or pooled, variation of the test results (denominator). The values p₁ and p₂ represent
positivity rates in Hypotheses 1A, 1B, and 1C and ratios of positive tests per serious
marine incident in Hypotheses 2A and 2B. For Hypotheses 1A, 1B, and 1C, those values
are obtained by dividing the yearly, 2003-2011 Post-Accident positive drug or alcohol
tests by the yearly number of tests administered for each variable. For Hypotheses 2A
and 2B, those values are obtained by dividing the yearly 2003-2011 Post-Accident
positive drug or alcohol tests by the yearly 2003-2011 number of serious marine
incidents in which drug or alcohol tests were conducted for each variable.
50
For Hypotheses 1A, 1B, and 1C, the letter p represents the sum of Post-Accident
positive drug or alcohol tests from each variable each year divided by the sum of Post-
Accident drug or alcohol tests administered from each variable. For Hypotheses 2A and
2B, the letter p represents the sum of Post-Accident positive drug or alcohol tests from
each variable each year divided by the sum of serious marine incidents each year from
each variable in which drug or alcohol tests were reported.
For Hypotheses 1A, 1B, and 1C, the letter n represents the number of Post-
Accident tests administered for each variable each year. In the case of determining the z
test statistic or z score for all cumulative years, it is the total number of positive tests for
all years divided by the total number of tests administered for Hypotheses 1A, 1B, and
1C. For Hypotheses 2A and 2B, it is the total number of positive tests divided by the
total number of serious marine incidents. As shown in the tables, this study applies the
two proportion z-test formula to the values each year as well as to the totals in order to
arrive at the test statistic or z score for that year.
Hypothesis 3 examines the relationship between Post-Accident drug test positivity
rates and Random drug test positivity rates from all vessels with crewmembers subject to
chemical testing. This author tested Hypothesis 3 using linear regression and the
correlation coefficient.
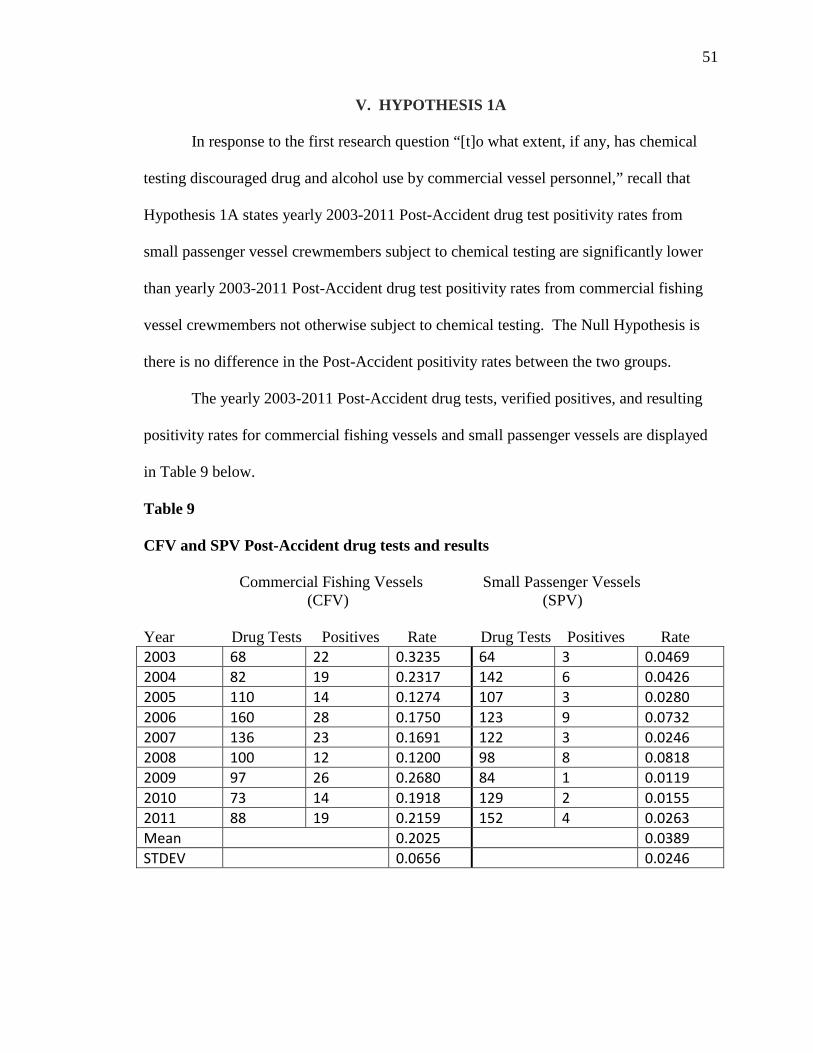
51
V. HYPOTHESIS 1A
In response to the first research question “[t]o what extent, if any, has chemical
testing discouraged drug and alcohol use by commercial vessel personnel,” recall that
Hypothesis 1A states yearly 2003-2011 Post-Accident drug test positivity rates from
small passenger vessel crewmembers subject to chemical testing are significantly lower
than yearly 2003-2011 Post-Accident drug test positivity rates from commercial fishing
vessel crewmembers not otherwise subject to chemical testing. The Null Hypothesis is
there is no difference in the Post-Accident positivity rates between the two groups.
The yearly 2003-2011 Post-Accident drug tests, verified positives, and resulting
positivity rates for commercial fishing vessels and small passenger vessels are displayed
in Table 9 below.
Table 9 CFV and SPV Post-Accident drug tests and results
Commercial Fishing Vessels Small Passenger Vessels (CFV) (SPV) Year Drug Tests Positives Rate Drug Tests Positives Rate 2003 68 22 0.3235 64 3 0.0469 2004 82 19 0.2317 142 6 0.0426 2005 110 14 0.1274 107 3 0.0280 2006 160 28 0.1750 123 9 0.0732 2007 136 23 0.1691 122 3 0.0246 2008 100 12 0.1200 98 8 0.0818 2009 97 26 0.2680 84 1 0.0119 2010 73 14 0.1918 129 2 0.0155 2011 88 19 0.2159 152 4 0.0263 Mean 0.2025 0.0389 STDEV 0.0656 0.0246
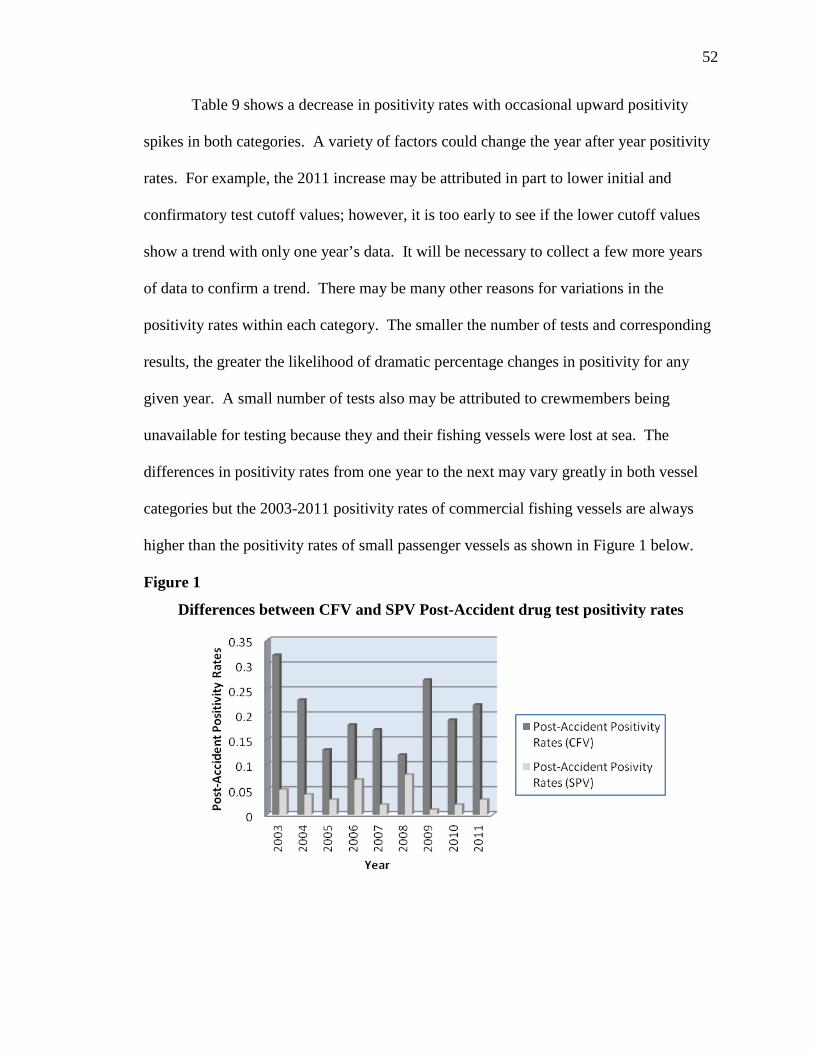
52
Table 9 shows a decrease in positivity rates with occasional upward positivity
spikes in both categories. A variety of factors could change the year after year positivity
rates. For example, the 2011 increase may be attributed in part to lower initial and
confirmatory test cutoff values; however, it is too early to see if the lower cutoff values
show a trend with only one year’s data. It will be necessary to collect a few more years
of data to confirm a trend. There may be many other reasons for variations in the
positivity rates within each category. The smaller the number of tests and corresponding
results, the greater the likelihood of dramatic percentage changes in positivity for any
given year. A small number of tests also may be attributed to crewmembers being
unavailable for testing because they and their fishing vessels were lost at sea. The
differences in positivity rates from one year to the next may vary greatly in both vessel
categories but the 2003-2011 positivity rates of commercial fishing vessels are always
higher than the positivity rates of small passenger vessels as shown in Figure 1 below.
Figure 1
Differences between CFV and SPV Post-Accident drug test positivity rates
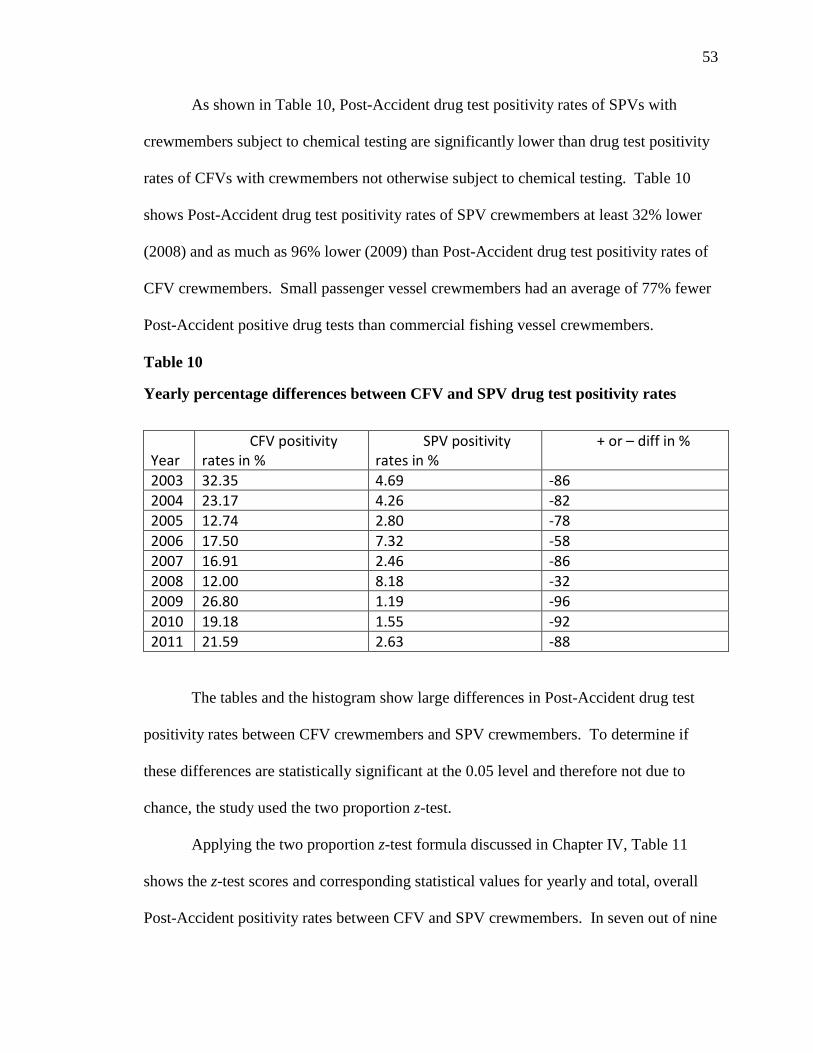
53
As shown in Table 10, Post-Accident drug test positivity rates of SPVs with
crewmembers subject to chemical testing are significantly lower than drug test positivity
rates of CFVs with crewmembers not otherwise subject to chemical testing. Table 10
shows Post-Accident drug test positivity rates of SPV crewmembers at least 32% lower
(2008) and as much as 96% lower (2009) than Post-Accident drug test positivity rates of
CFV crewmembers. Small passenger vessel crewmembers had an average of 77% fewer
Post-Accident positive drug tests than commercial fishing vessel crewmembers.
Table 10
Yearly percentage differences between CFV and SPV drug test positivity rates
The tables and the histogram show large differences in Post-Accident drug test
positivity rates between CFV crewmembers and SPV crewmembers. To determine if
these differences are statistically significant at the 0.05 level and therefore not due to
chance, the study used the two proportion z-test.
Applying the two proportion z-test formula discussed in Chapter IV, Table 11
shows the z-test scores and corresponding statistical values for yearly and total, overall
Post-Accident positivity rates between CFV and SPV crewmembers. In seven out of nine
Year CFV positivity
rates in % SPV positivity
rates in % + or – diff in %
2003 32.35 4.69 -86 2004 23.17 4.26 -82 2005 12.74 2.80 -78 2006 17.50 7.32 -58 2007 16.91 2.46 -86 2008 12.00 8.18 -32 2009 26.80 1.19 -96 2010 19.18 1.55 -92 2011 21.59 2.63 -88
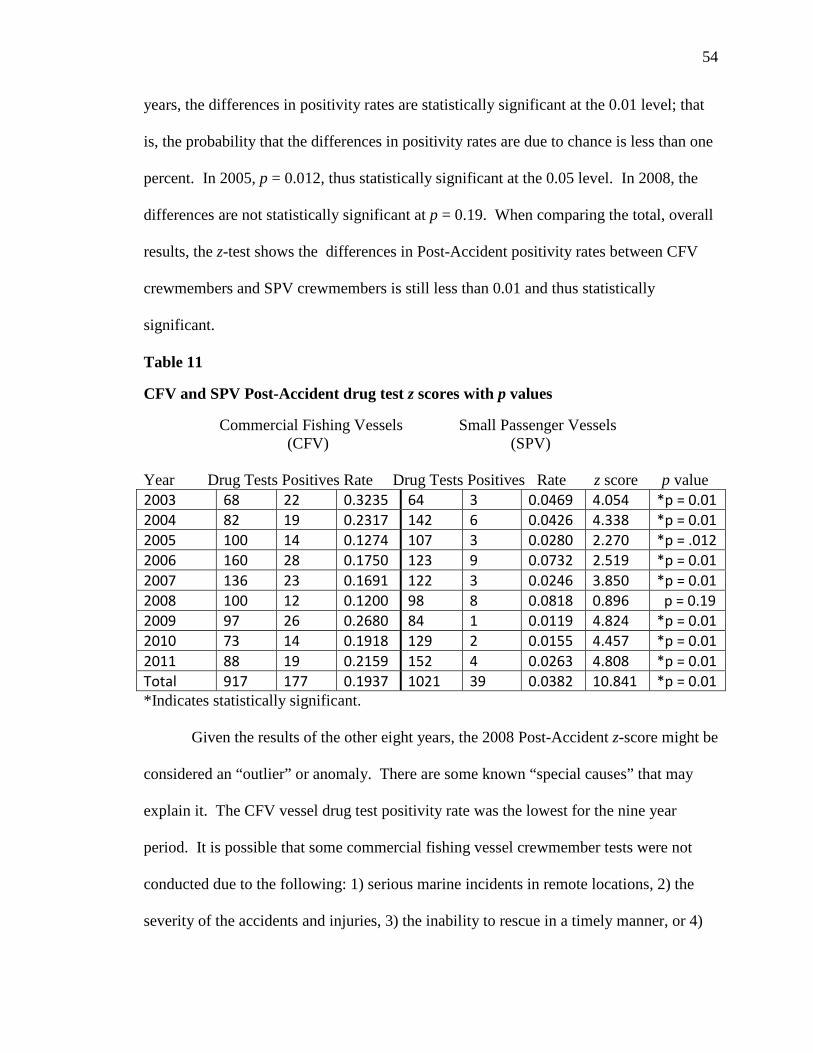
54
years, the differences in positivity rates are statistically significant at the 0.01 level; that
is, the probability that the differences in positivity rates are due to chance is less than one
percent. In 2005, p = 0.012, thus statistically significant at the 0.05 level. In 2008, the
differences are not statistically significant at p = 0.19. When comparing the total, overall
results, the z-test shows the differences in Post-Accident positivity rates between CFV
crewmembers and SPV crewmembers is still less than 0.01 and thus statistically
significant.
Table 11
CFV and SPV Post-Accident drug test z scores with p values
Commercial Fishing Vessels Small Passenger Vessels (CFV) (SPV) Year Drug Tests Positives Rate Drug Tests Positives Rate z score p value 2003 68 22 0.3235 64 3 0.0469 4.054 *p = 0.01 2004 82 19 0.2317 142 6 0.0426 4.338 *p = 0.01 2005 100 14 0.1274 107 3 0.0280 2.270 *p = .012 2006 160 28 0.1750 123 9 0.0732 2.519 *p = 0.01 2007 136 23 0.1691 122 3 0.0246 3.850 *p = 0.01 2008 100 12 0.1200 98 8 0.0818 0.896 p = 0.19 2009 97 26 0.2680 84 1 0.0119 4.824 *p = 0.01 2010 73 14 0.1918 129 2 0.0155 4.457 *p = 0.01 2011 88 19 0.2159 152 4 0.0263 4.808 *p = 0.01 Total 917 177 0.1937 1021 39 0.0382 10.841 *p = 0.01 *Indicates statistically significant.
Given the results of the other eight years, the 2008 Post-Accident z-score might be
considered an “outlier” or anomaly. There are some known “special causes” that may
explain it. The CFV vessel drug test positivity rate was the lowest for the nine year
period. It is possible that some commercial fishing vessel crewmember tests were not
conducted due to the following: 1) serious marine incidents in remote locations, 2) the
severity of the accidents and injuries, 3) the inability to rescue in a timely manner, or 4)
55
the crewmembers and their vessels were lost at sea. Conversely, the 2008 SPV
crewmember Post-Accident drug test positivity rate is the highest of the nine-year period.
This result may be due to a drop in the number of tests performed in 2008. Also, the
number of positive tests in any year is small enough that one casualty with multiple
vessels or multiple involved crewmembers can skew the results. These data for this
hypothesis are person-specific, not incident-specific. To determine if a special cause
contributed to this statistical anomaly it would be necessary to examine the Coast Guard
casualty data in more detail. Such a review is possible, but beyond the scope of this
study.
The two proportion z-test showed the total, overall differences in Post-Accident
positivity rates between SPV crewmembers and CFV crewmembers to be statistically
significant.
56
VI. HYPOTHESIS 1B
Also in response to the first research question “[t]o what extent, if any, has
chemical testing discouraged drug and alcohol use by commercial vessel personnel”
Hypothesis 1B states yearly 2003-2011 Post-Accident alcohol test positivity rates from
small passenger vessel crewmembers subject to chemical testing are significantly lower
than yearly 2003-2011 Post-Accident alcohol test positivity rates from commercial
fishing vessel crewmembers not otherwise subject to chemical testing. The Null
Hypothesis is there is no difference in Post-Accident alcohol test positivity rates between
the two groups.
The yearly 2003-2011 Post-Accident alcohol (ETOH) tests, positives, and
resulting positivity rates for CFVs and SPVs are displayed in Table 12. “ETOH” is the
chemical abbreviation of ethyl alcohol and is used in the tables and figures to refer to
chemical tests specifically for alcohol. As with drug test positivity rates in Hypothesis
1A, ETOH positivity rates for both CFV crewmembers and SPV crewmembers gradually
decrease year after year, with occasional upward spikes.
There is a gradual decrease with occasional upward positivity spikes in both
categories. There may be many reasons for the differences in alcohol positivity rates
within each separate category, including the availability of crewmembers to test for drugs
and alcohol and the requirement that the alcohol test be administered within two hours of
the serious marine incident. As is often the case with CFVs, crewmembers may not be
available to test because they and their vessels may be lost at sea.
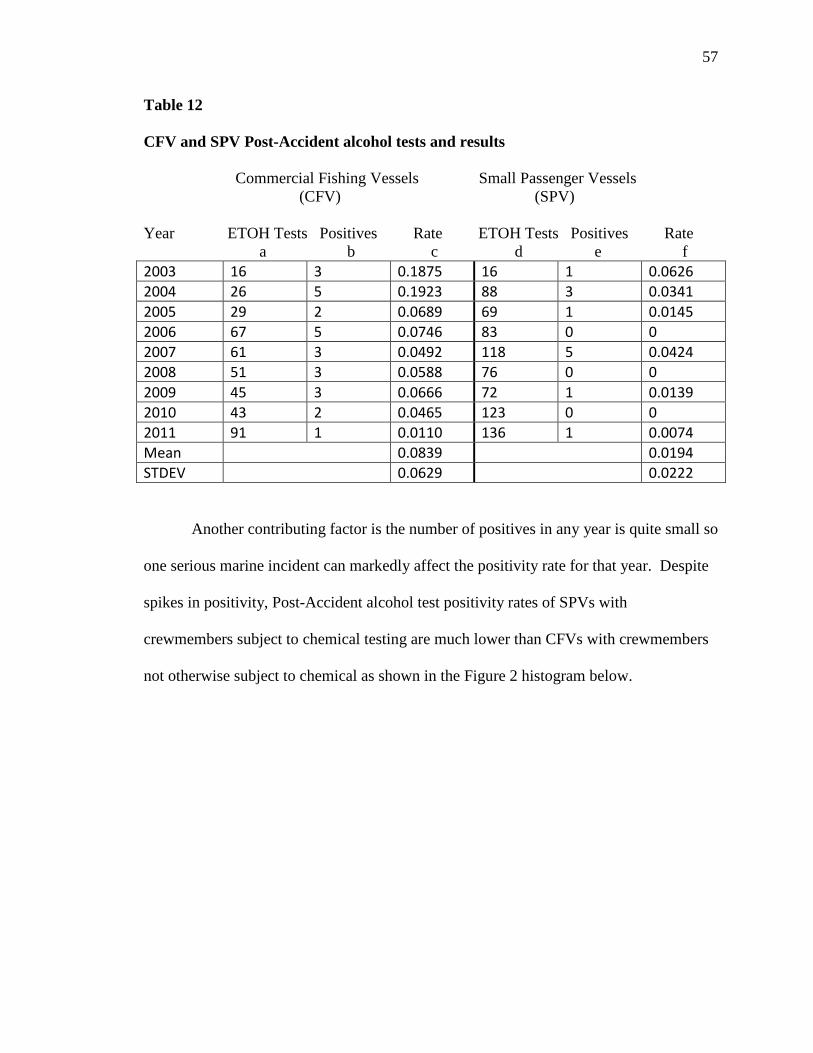
57
Table 12
CFV and SPV Post-Accident alcohol tests and results
Commercial Fishing Vessels Small Passenger Vessels (CFV) (SPV) Year ETOH Tests Positives Rate ETOH Tests Positives Rate a b c d e f 2003 16 3 0.1875 16 1 0.0626 2004 26 5 0.1923 88 3 0.0341 2005 29 2 0.0689 69 1 0.0145 2006 67 5 0.0746 83 0 0 2007 61 3 0.0492 118 5 0.0424 2008 51 3 0.0588 76 0 0 2009 45 3 0.0666 72 1 0.0139 2010 43 2 0.0465 123 0 0 2011 91 1 0.0110 136 1 0.0074 Mean 0.0839 0.0194 STDEV 0.0629 0.0222
Another contributing factor is the number of positives in any year is quite small so
one serious marine incident can markedly affect the positivity rate for that year. Despite
spikes in positivity, Post-Accident alcohol test positivity rates of SPVs with
crewmembers subject to chemical testing are much lower than CFVs with crewmembers
not otherwise subject to chemical as shown in the Figure 2 histogram below.
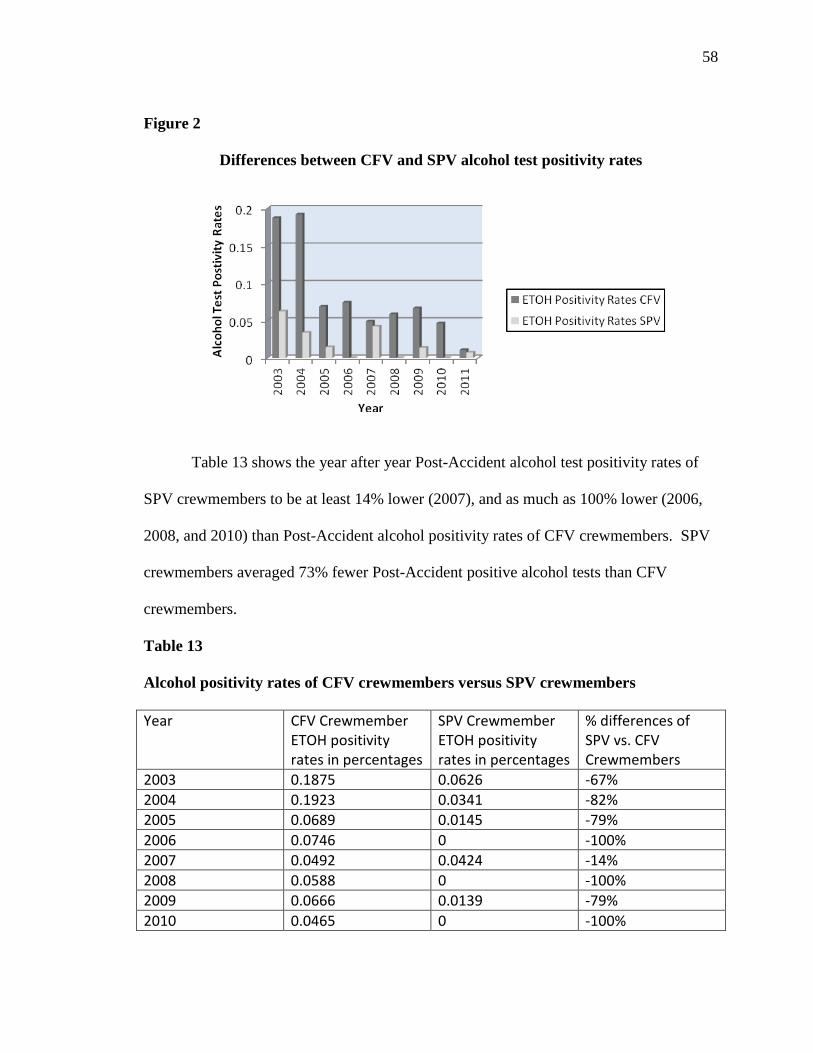
58
Figure 2
Differences between CFV and SPV alcohol test positivity rates
Table 13 shows the year after year Post-Accident alcohol test positivity rates of
SPV crewmembers to be at least 14% lower (2007), and as much as 100% lower (2006,
2008, and 2010) than Post-Accident alcohol positivity rates of CFV crewmembers. SPV
crewmembers averaged 73% fewer Post-Accident positive alcohol tests than CFV
crewmembers.
Table 13
Alcohol positivity rates of CFV crewmembers versus SPV crewmembers
Year CFV Crewmember ETOH positivity rates in percentages
SPV Crewmember ETOH positivity rates in percentages
% differences of SPV vs. CFV Crewmembers
2003 0.1875 0.0626 -67% 2004 0.1923 0.0341 -82% 2005 0.0689 0.0145 -79% 2006 0.0746 0 -100% 2007 0.0492 0.0424 -14% 2008 0.0588 0 -100% 2009 0.0666 0.0139 -79% 2010 0.0465 0 -100%
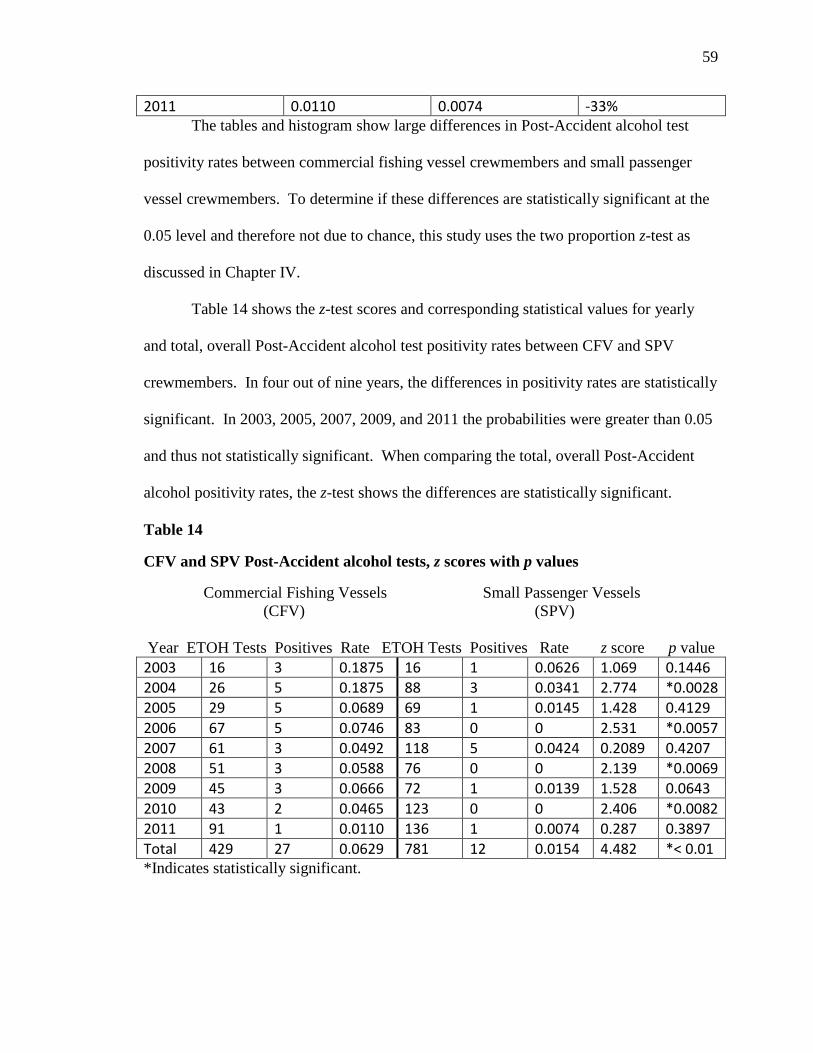
59
2011 0.0110 0.0074 -33% The tables and histogram show large differences in Post-Accident alcohol test
positivity rates between commercial fishing vessel crewmembers and small passenger
vessel crewmembers. To determine if these differences are statistically significant at the
0.05 level and therefore not due to chance, this study uses the two proportion z-test as
discussed in Chapter IV.
Table 14 shows the z-test scores and corresponding statistical values for yearly
and total, overall Post-Accident alcohol test positivity rates between CFV and SPV
crewmembers. In four out of nine years, the differences in positivity rates are statistically
significant. In 2003, 2005, 2007, 2009, and 2011 the probabilities were greater than 0.05
and thus not statistically significant. When comparing the total, overall Post-Accident
alcohol positivity rates, the z-test shows the differences are statistically significant.
Table 14
CFV and SPV Post-Accident alcohol tests, z scores with p values
Commercial Fishing Vessels Small Passenger Vessels (CFV) (SPV) Year ETOH Tests Positives Rate ETOH Tests Positives Rate z score p value 2003 16 3 0.1875 16 1 0.0626 1.069 0.1446 2004 26 5 0.1875 88 3 0.0341 2.774 *0.0028 2005 29 5 0.0689 69 1 0.0145 1.428 0.4129 2006 67 5 0.0746 83 0 0 2.531 *0.0057 2007 61 3 0.0492 118 5 0.0424 0.2089 0.4207 2008 51 3 0.0588 76 0 0 2.139 *0.0069 2009 45 3 0.0666 72 1 0.0139 1.528 0.0643 2010 43 2 0.0465 123 0 0 2.406 *0.0082 2011 91 1 0.0110 136 1 0.0074 0.287 0.3897 Total 429 27 0.0629 781 12 0.0154 4.482 *< 0.01 *Indicates statistically significant.
60
There is a gradual decrease with occasional upward positivity spikes in both
categories which may be attributed to the availability of crewmembers to test for drugs
and alcohol as noted in the discussion under Hypothesis 1A. The SMI’s remoteness is
more acute in alcohol testing because the test must be given within two hours of the
accident.
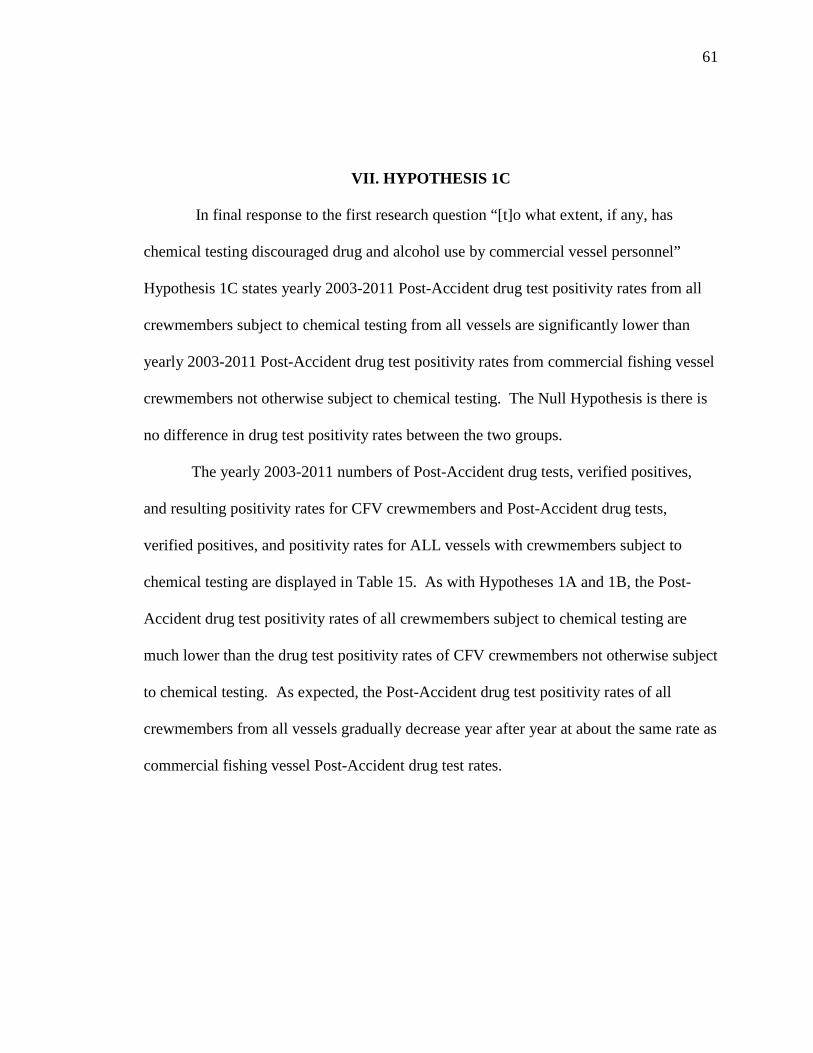
61
VII. HYPOTHESIS 1C
In final response to the first research question “[t]o what extent, if any, has
chemical testing discouraged drug and alcohol use by commercial vessel personnel”
Hypothesis 1C states yearly 2003-2011 Post-Accident drug test positivity rates from all
crewmembers subject to chemical testing from all vessels are significantly lower than
yearly 2003-2011 Post-Accident drug test positivity rates from commercial fishing vessel
crewmembers not otherwise subject to chemical testing. The Null Hypothesis is there is
no difference in drug test positivity rates between the two groups.
The yearly 2003-2011 numbers of Post-Accident drug tests, verified positives,
and resulting positivity rates for CFV crewmembers and Post-Accident drug tests,
verified positives, and positivity rates for ALL vessels with crewmembers subject to
chemical testing are displayed in Table 15. As with Hypotheses 1A and 1B, the Post-
Accident drug test positivity rates of all crewmembers subject to chemical testing are
much lower than the drug test positivity rates of CFV crewmembers not otherwise subject
to chemical testing. As expected, the Post-Accident drug test positivity rates of all
crewmembers from all vessels gradually decrease year after year at about the same rate as
commercial fishing vessel Post-Accident drug test rates.
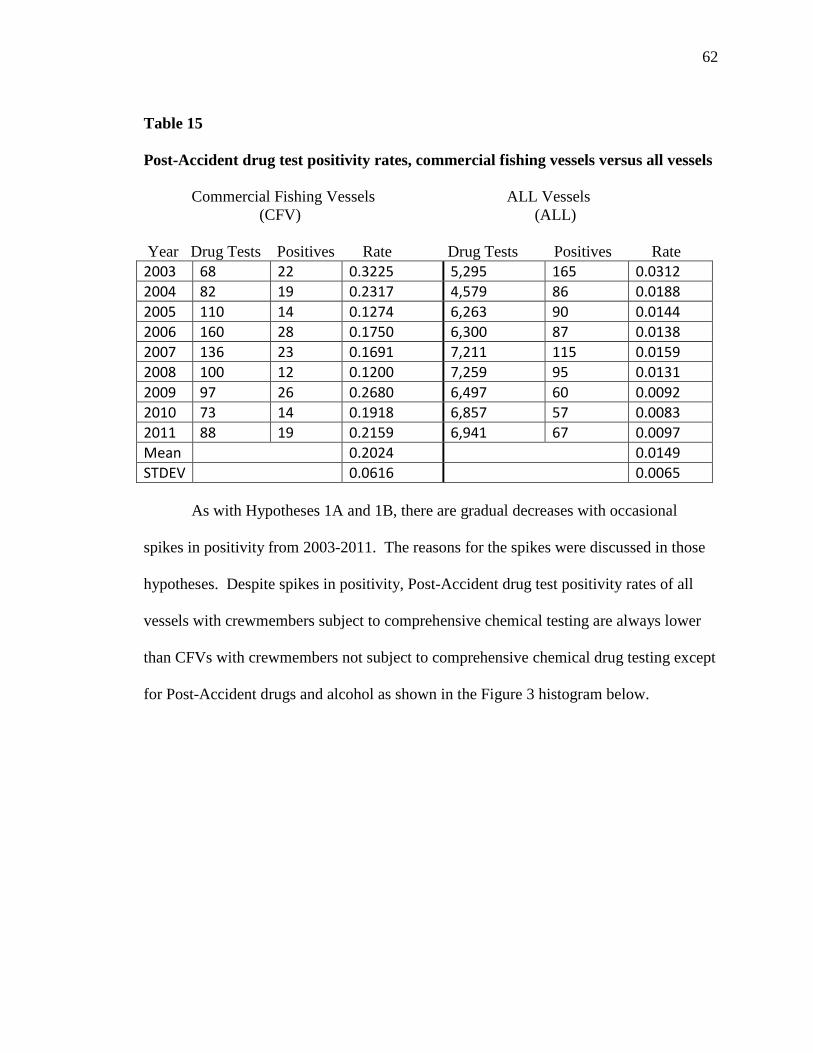
62
Table 15 Post-Accident drug test positivity rates, commercial fishing vessels versus all vessels
Commercial Fishing Vessels ALL Vessels
(CFV) (ALL) Year Drug Tests Positives Rate Drug Tests Positives Rate 2003 68 22 0.3225 5,295 165 0.0312 2004 82 19 0.2317 4,579 86 0.0188 2005 110 14 0.1274 6,263 90 0.0144 2006 160 28 0.1750 6,300 87 0.0138 2007 136 23 0.1691 7,211 115 0.0159 2008 100 12 0.1200 7,259 95 0.0131 2009 97 26 0.2680 6,497 60 0.0092 2010 73 14 0.1918 6,857 57 0.0083 2011 88 19 0.2159 6,941 67 0.0097 Mean 0.2024 0.0149 STDEV 0.0616 0.0065
As with Hypotheses 1A and 1B, there are gradual decreases with occasional
spikes in positivity from 2003-2011. The reasons for the spikes were discussed in those
hypotheses. Despite spikes in positivity, Post-Accident drug test positivity rates of all
vessels with crewmembers subject to comprehensive chemical testing are always lower
than CFVs with crewmembers not subject to comprehensive chemical drug testing except
for Post-Accident drugs and alcohol as shown in the Figure 3 histogram below.
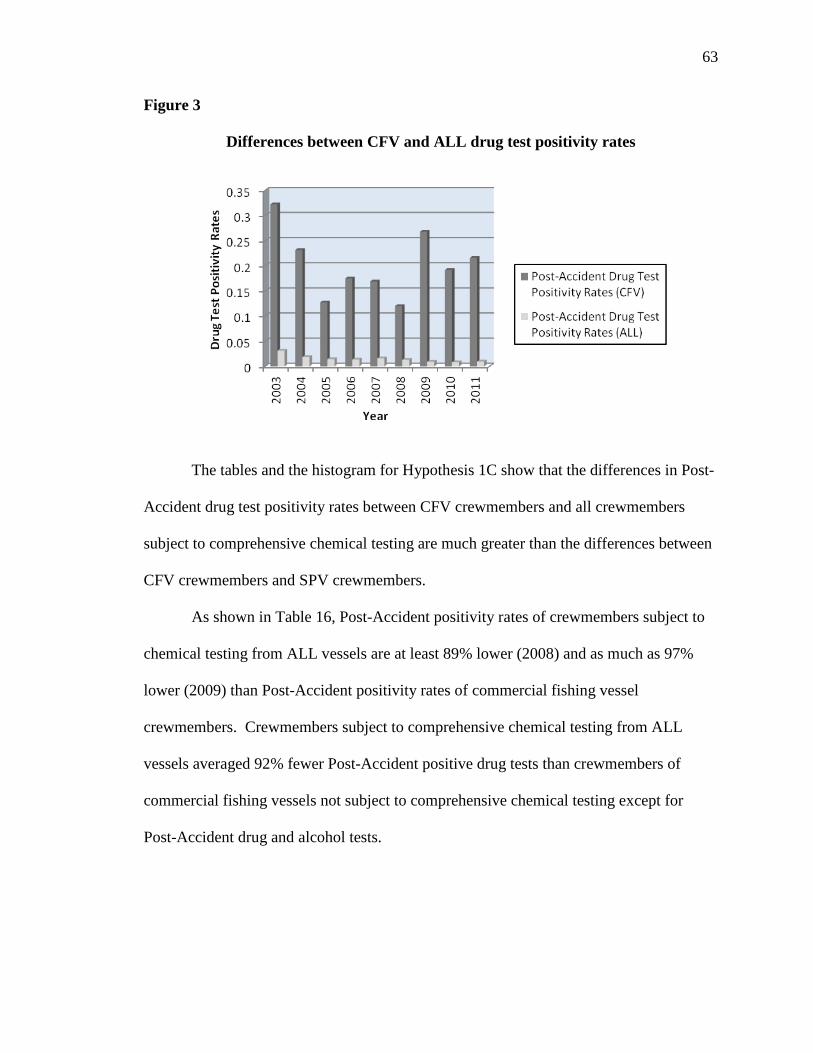
63
Figure 3
Differences between CFV and ALL drug test positivity rates
The tables and the histogram for Hypothesis 1C show that the differences in Post-
Accident drug test positivity rates between CFV crewmembers and all crewmembers
subject to comprehensive chemical testing are much greater than the differences between
CFV crewmembers and SPV crewmembers.
As shown in Table 16, Post-Accident positivity rates of crewmembers subject to
chemical testing from ALL vessels are at least 89% lower (2008) and as much as 97%
lower (2009) than Post-Accident positivity rates of commercial fishing vessel
crewmembers. Crewmembers subject to comprehensive chemical testing from ALL
vessels averaged 92% fewer Post-Accident positive drug tests than crewmembers of
commercial fishing vessels not subject to comprehensive chemical testing except for
Post-Accident drug and alcohol tests.
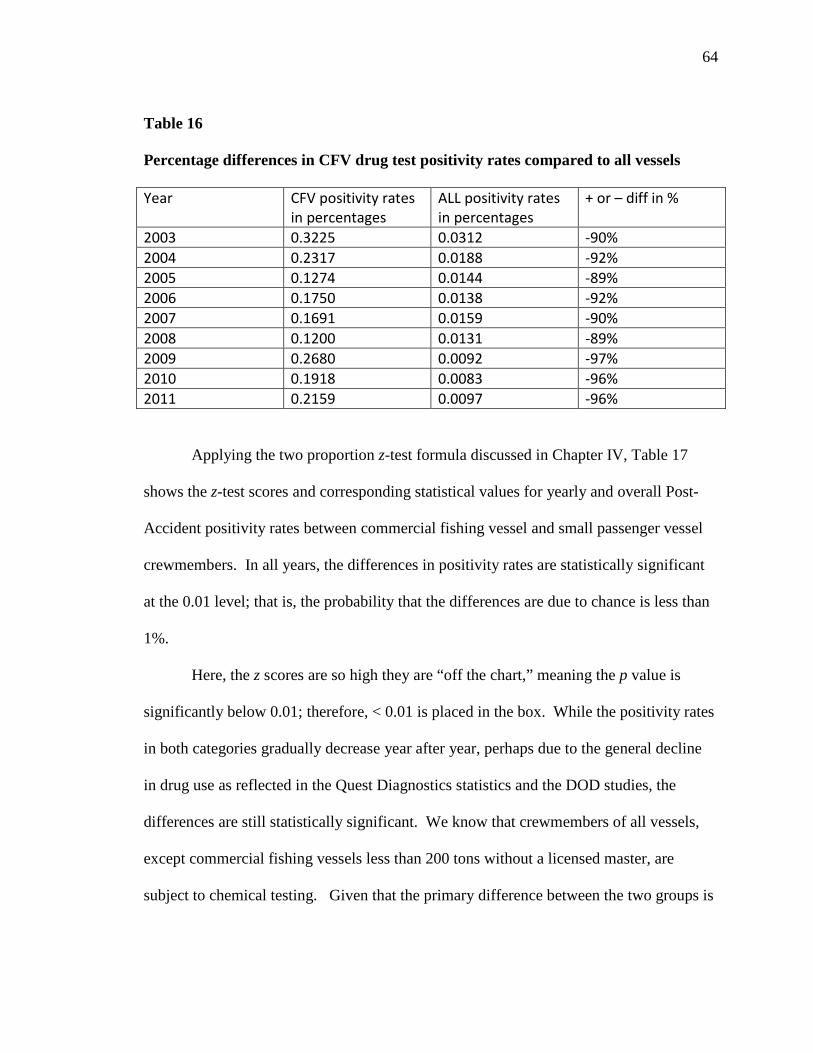
64
Table 16
Percentage differences in CFV drug test positivity rates compared to all vessels
Year CFV positivity rates in percentages
ALL positivity rates in percentages
+ or – diff in %
2003 0.3225 0.0312 -90% 2004 0.2317 0.0188 -92% 2005 0.1274 0.0144 -89% 2006 0.1750 0.0138 -92% 2007 0.1691 0.0159 -90% 2008 0.1200 0.0131 -89% 2009 0.2680 0.0092 -97% 2010 0.1918 0.0083 -96% 2011 0.2159 0.0097 -96%
Applying the two proportion z-test formula discussed in Chapter IV, Table 17
shows the z-test scores and corresponding statistical values for yearly and overall Post-
Accident positivity rates between commercial fishing vessel and small passenger vessel
crewmembers. In all years, the differences in positivity rates are statistically significant
at the 0.01 level; that is, the probability that the differences are due to chance is less than
1%.
Here, the z scores are so high they are “off the chart,” meaning the p value is
significantly below 0.01; therefore, < 0.01 is placed in the box. While the positivity rates
in both categories gradually decrease year after year, perhaps due to the general decline
in drug use as reflected in the Quest Diagnostics statistics and the DOD studies, the
differences are still statistically significant. We know that crewmembers of all vessels,
except commercial fishing vessels less than 200 tons without a licensed master, are
subject to chemical testing. Given that the primary difference between the two groups is
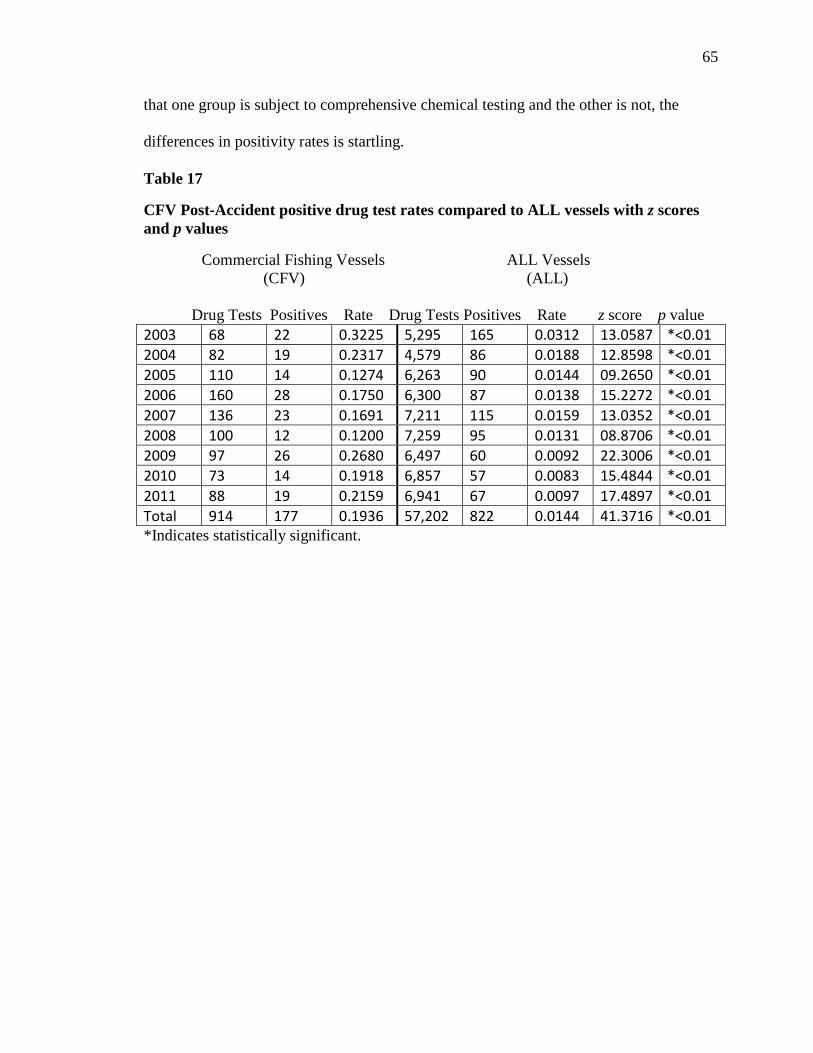
65
that one group is subject to comprehensive chemical testing and the other is not, the
differences in positivity rates is startling.
Table 17
CFV Post-Accident positive drug test rates compared to ALL vessels with z scores and p values
Commercial Fishing Vessels ALL Vessels (CFV) (ALL) Drug Tests Positives Rate Drug Tests Positives Rate z score p value 2003 68 22 0.3225 5,295 165 0.0312 13.0587 *<0.01 2004 82 19 0.2317 4,579 86 0.0188 12.8598 *<0.01 2005 110 14 0.1274 6,263 90 0.0144 09.2650 *<0.01 2006 160 28 0.1750 6,300 87 0.0138 15.2272 *<0.01 2007 136 23 0.1691 7,211 115 0.0159 13.0352 *<0.01 2008 100 12 0.1200 7,259 95 0.0131 08.8706 *<0.01 2009 97 26 0.2680 6,497 60 0.0092 22.3006 *<0.01 2010 73 14 0.1918 6,857 57 0.0083 15.4844 *<0.01 2011 88 19 0.2159 6,941 67 0.0097 17.4897 *<0.01 Total 914 177 0.1936 57,202 822 0.0144 41.3716 *<0.01 *Indicates statistically significant.
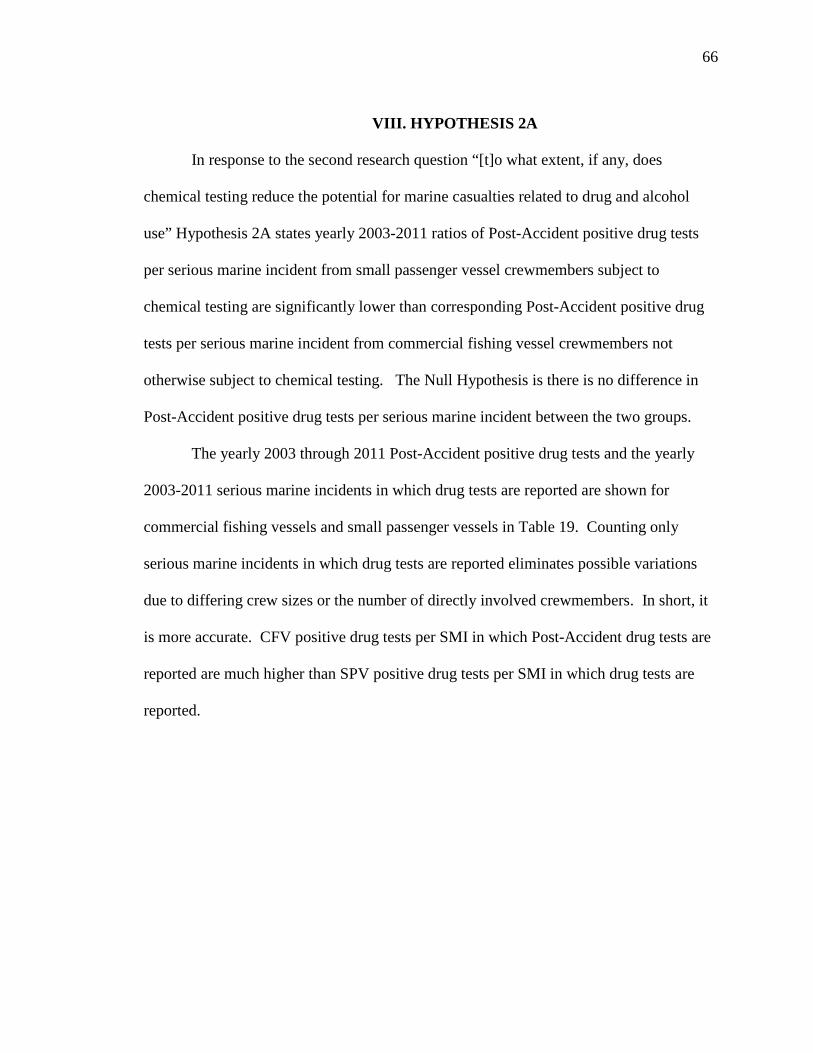
66
VIII. HYPOTHESIS 2A
In response to the second research question “[t]o what extent, if any, does
chemical testing reduce the potential for marine casualties related to drug and alcohol
use” Hypothesis 2A states yearly 2003-2011 ratios of Post-Accident positive drug tests
per serious marine incident from small passenger vessel crewmembers subject to
chemical testing are significantly lower than corresponding Post-Accident positive drug
tests per serious marine incident from commercial fishing vessel crewmembers not
otherwise subject to chemical testing. The Null Hypothesis is there is no difference in
Post-Accident positive drug tests per serious marine incident between the two groups.
The yearly 2003 through 2011 Post-Accident positive drug tests and the yearly
2003-2011 serious marine incidents in which drug tests are reported are shown for
commercial fishing vessels and small passenger vessels in Table 19. Counting only
serious marine incidents in which drug tests are reported eliminates possible variations
due to differing crew sizes or the number of directly involved crewmembers. In short, it
is more accurate. CFV positive drug tests per SMI in which Post-Accident drug tests are
reported are much higher than SPV positive drug tests per SMI in which drug tests are
reported.
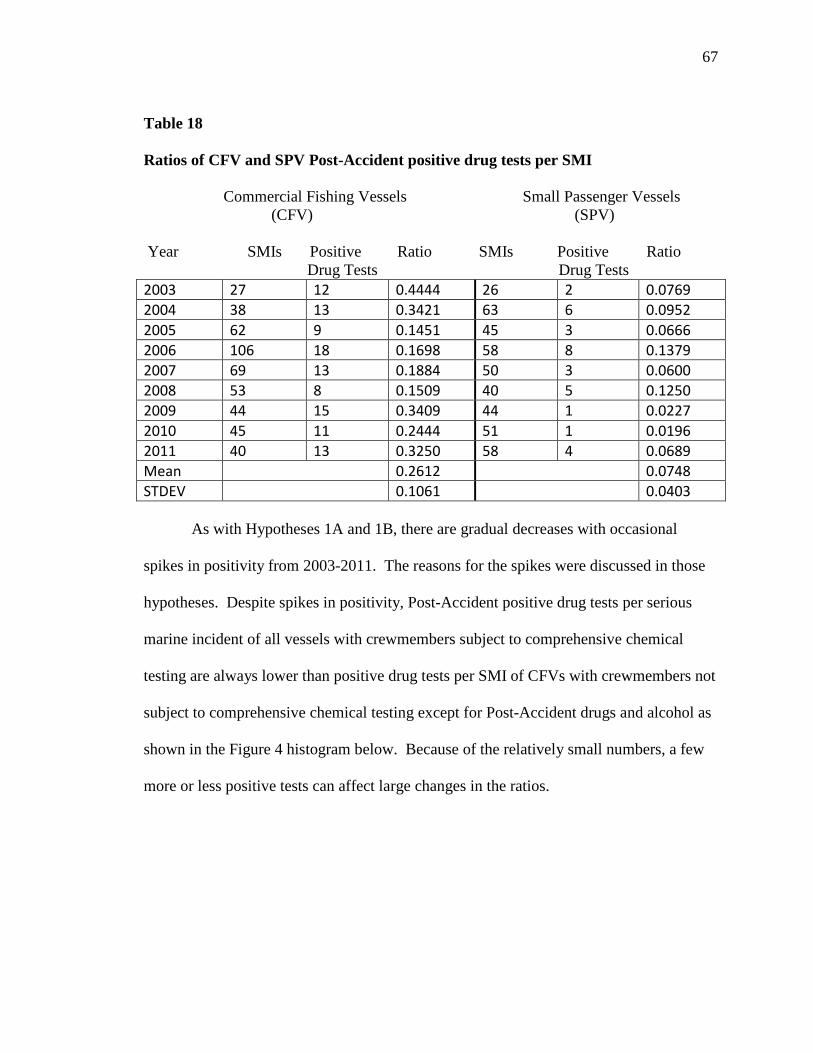
67
Table 18
Ratios of CFV and SPV Post-Accident positive drug tests per SMI
Commercial Fishing Vessels Small Passenger Vessels (CFV) (SPV) Year SMIs Positive Ratio SMIs Positive Ratio Drug Tests Drug Tests 2003 27 12 0.4444 26 2 0.0769 2004 38 13 0.3421 63 6 0.0952 2005 62 9 0.1451 45 3 0.0666 2006 106 18 0.1698 58 8 0.1379 2007 69 13 0.1884 50 3 0.0600 2008 53 8 0.1509 40 5 0.1250 2009 44 15 0.3409 44 1 0.0227 2010 45 11 0.2444 51 1 0.0196 2011 40 13 0.3250 58 4 0.0689 Mean 0.2612 0.0748 STDEV 0.1061 0.0403
As with Hypotheses 1A and 1B, there are gradual decreases with occasional
spikes in positivity from 2003-2011. The reasons for the spikes were discussed in those
hypotheses. Despite spikes in positivity, Post-Accident positive drug tests per serious
marine incident of all vessels with crewmembers subject to comprehensive chemical
testing are always lower than positive drug tests per SMI of CFVs with crewmembers not
subject to comprehensive chemical testing except for Post-Accident drugs and alcohol as
shown in the Figure 4 histogram below. Because of the relatively small numbers, a few
more or less positive tests can affect large changes in the ratios.
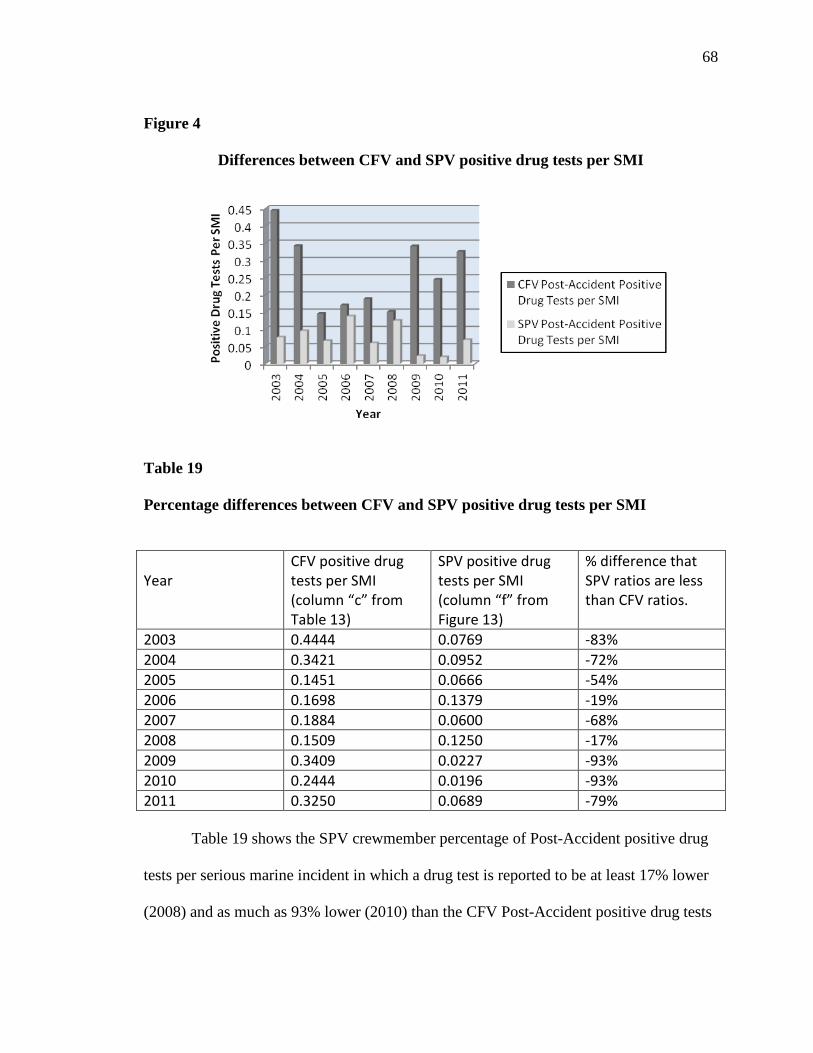
68
Figure 4
Differences between CFV and SPV positive drug tests per SMI
Table 19 Percentage differences between CFV and SPV positive drug tests per SMI Year
CFV positive drug tests per SMI (column “c” from Table 13)
SPV positive drug tests per SMI (column “f” from Figure 13)
% difference that SPV ratios are less than CFV ratios.
2003 0.4444 0.0769 -83% 2004 0.3421 0.0952 -72% 2005 0.1451 0.0666 -54% 2006 0.1698 0.1379 -19% 2007 0.1884 0.0600 -68% 2008 0.1509 0.1250 -17% 2009 0.3409 0.0227 -93% 2010 0.2444 0.0196 -93% 2011 0.3250 0.0689 -79%
Table 19 shows the SPV crewmember percentage of Post-Accident positive drug
tests per serious marine incident in which a drug test is reported to be at least 17% lower
(2008) and as much as 93% lower (2010) than the CFV Post-Accident positive drug tests
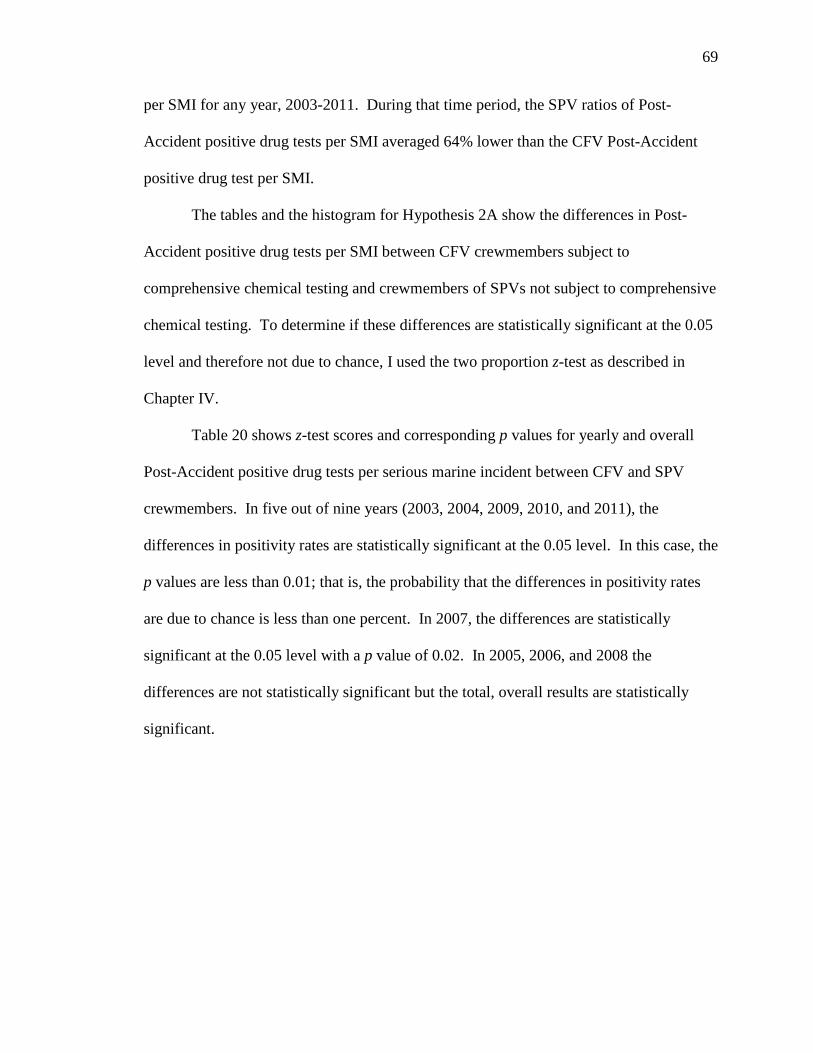
69
per SMI for any year, 2003-2011. During that time period, the SPV ratios of Post-
Accident positive drug tests per SMI averaged 64% lower than the CFV Post-Accident
positive drug test per SMI.
The tables and the histogram for Hypothesis 2A show the differences in Post-
Accident positive drug tests per SMI between CFV crewmembers subject to
comprehensive chemical testing and crewmembers of SPVs not subject to comprehensive
chemical testing. To determine if these differences are statistically significant at the 0.05
level and therefore not due to chance, I used the two proportion z-test as described in
Chapter IV.
Table 20 shows z-test scores and corresponding p values for yearly and overall
Post-Accident positive drug tests per serious marine incident between CFV and SPV
crewmembers. In five out of nine years (2003, 2004, 2009, 2010, and 2011), the
differences in positivity rates are statistically significant at the 0.05 level. In this case, the
p values are less than 0.01; that is, the probability that the differences in positivity rates
are due to chance is less than one percent. In 2007, the differences are statistically
significant at the 0.05 level with a p value of 0.02. In 2005, 2006, and 2008 the
differences are not statistically significant but the total, overall results are statistically
significant.
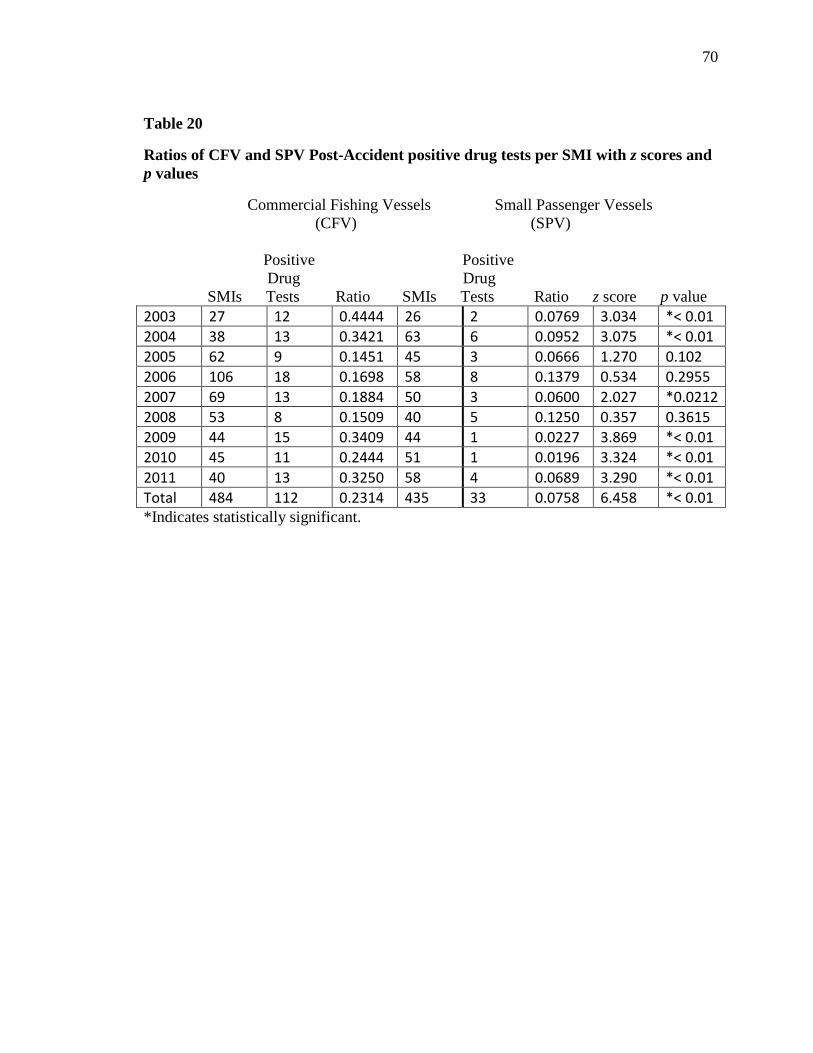
70
Table 20
Ratios of CFV and SPV Post-Accident positive drug tests per SMI with z scores and p values
Commercial Fishing Vessels Small Passenger Vessels (CFV) (SPV)
Positive Positive
Drug Drug SMIs Tests Ratio SMIs Tests Ratio z score p value 2003 27 12 0.4444 26 2 0.0769 3.034 *< 0.01 2004 38 13 0.3421 63 6 0.0952 3.075 *< 0.01 2005 62 9 0.1451 45 3 0.0666 1.270 0.102 2006 106 18 0.1698 58 8 0.1379 0.534 0.2955 2007 69 13 0.1884 50 3 0.0600 2.027 *0.0212 2008 53 8 0.1509 40 5 0.1250 0.357 0.3615 2009 44 15 0.3409 44 1 0.0227 3.869 *< 0.01 2010 45 11 0.2444 51 1 0.0196 3.324 *< 0.01 2011 40 13 0.3250 58 4 0.0689 3.290 *< 0.01 Total 484 112 0.2314 435 33 0.0758 6.458 *< 0.01 *Indicates statistically significant.
71
IX. HYPOTHESIS 2B
In further response to research question number two “[t]o what extent, if any,
does chemical testing reduce the potential for marine casualties related to drug and
alcohol use” Hypothesis 2B states the yearly 2003-2011 ratios of Post-Accident positive
alcohol tests per serious marine incident from small passenger vessel crewmembers
subject to chemical testing are significantly lower than corresponding Post-Accident
positive alcohol tests per serious marine incident from commercial fishing vessel
crewmembers not otherwise subject to chemical testing. The Null Hypothesis is there is
no difference in positive alcohol tests per serious marine incident between the two
groups.
The yearly 2003 through 2011 Post-Accident positive alcohol tests and the yearly
2003-2011 SMIs in which alcohol tests are reported are shown for CFVs and SPVs in
Table 21. Counting only serious marine incidents in which alcohol tests are reported
eliminates possible variations due to differing crew sizes or the number of directly
involved crewmembers. In short, it is more accurate. As the table shows, the ratio of
CFV positive alcohol tests per SMI is much higher than the ratio of SPV positive alcohol
tests per SMI. The CFV ratio of positive alcohol tests per SMI gradually decreases as
does the SPV ratio of positive alcohol tests per SMI but not as dramatically.
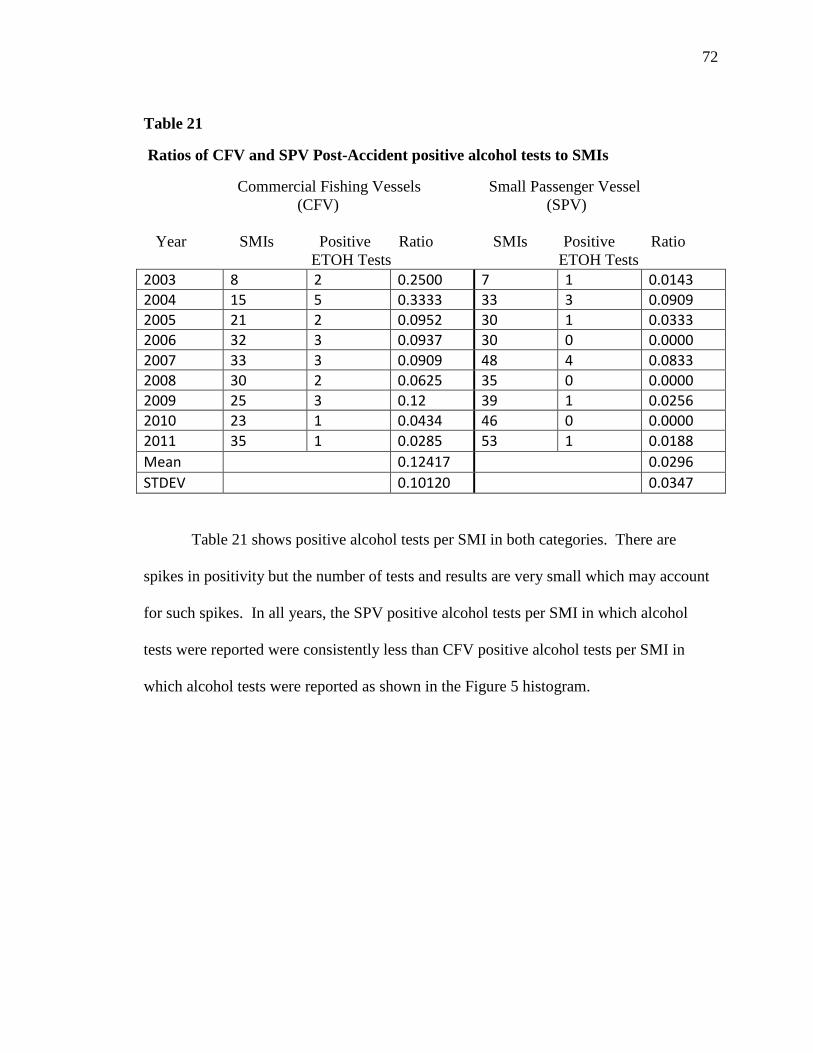
72
Table 21
Ratios of CFV and SPV Post-Accident positive alcohol tests to SMIs
Commercial Fishing Vessels Small Passenger Vessel (CFV) (SPV)
Year SMIs Positive Ratio SMIs Positive Ratio ETOH Tests ETOH Tests 2003 8 2 0.2500 7 1 0.0143 2004 15 5 0.3333 33 3 0.0909 2005 21 2 0.0952 30 1 0.0333 2006 32 3 0.0937 30 0 0.0000 2007 33 3 0.0909 48 4 0.0833 2008 30 2 0.0625 35 0 0.0000 2009 25 3 0.12 39 1 0.0256 2010 23 1 0.0434 46 0 0.0000 2011 35 1 0.0285 53 1 0.0188 Mean 0.12417 0.0296 STDEV 0.10120 0.0347
Table 21 shows positive alcohol tests per SMI in both categories. There are
spikes in positivity but the number of tests and results are very small which may account
for such spikes. In all years, the SPV positive alcohol tests per SMI in which alcohol
tests were reported were consistently less than CFV positive alcohol tests per SMI in
which alcohol tests were reported as shown in the Figure 5 histogram.
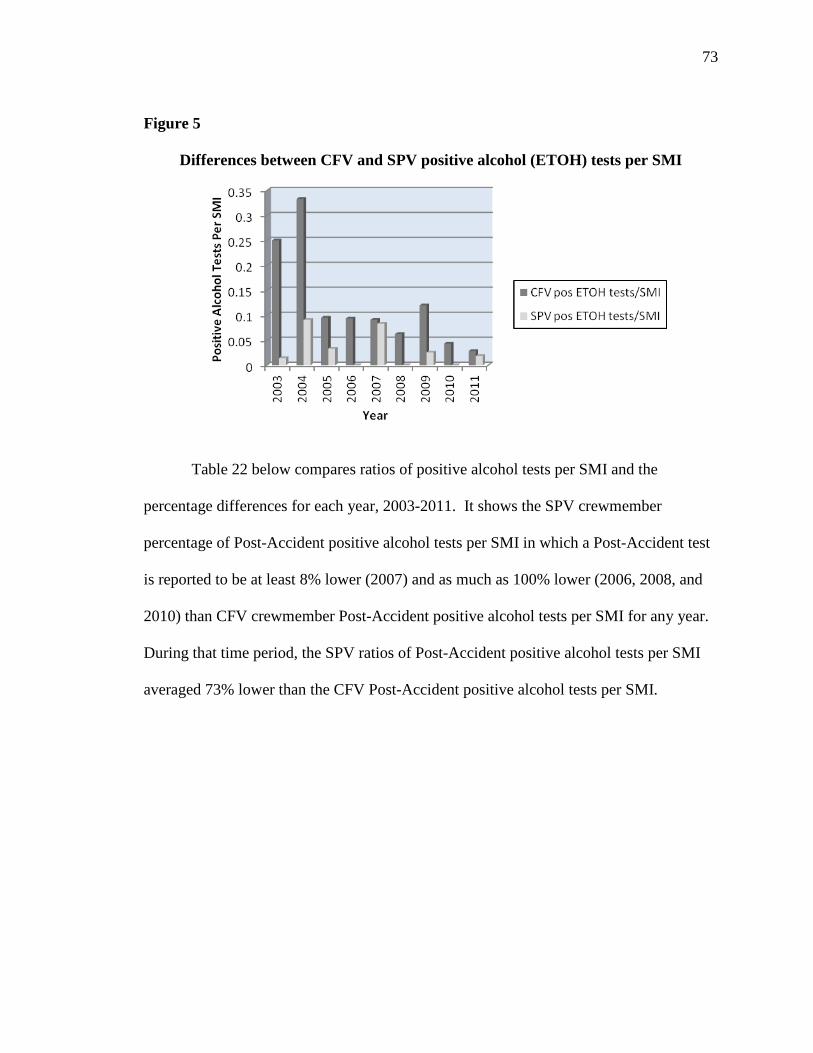
73
Figure 5
Differences between CFV and SPV positive alcohol (ETOH) tests per SMI
Table 22 below compares ratios of positive alcohol tests per SMI and the
percentage differences for each year, 2003-2011. It shows the SPV crewmember
percentage of Post-Accident positive alcohol tests per SMI in which a Post-Accident test
is reported to be at least 8% lower (2007) and as much as 100% lower (2006, 2008, and
2010) than CFV crewmember Post-Accident positive alcohol tests per SMI for any year.
During that time period, the SPV ratios of Post-Accident positive alcohol tests per SMI
averaged 73% lower than the CFV Post-Accident positive alcohol tests per SMI.
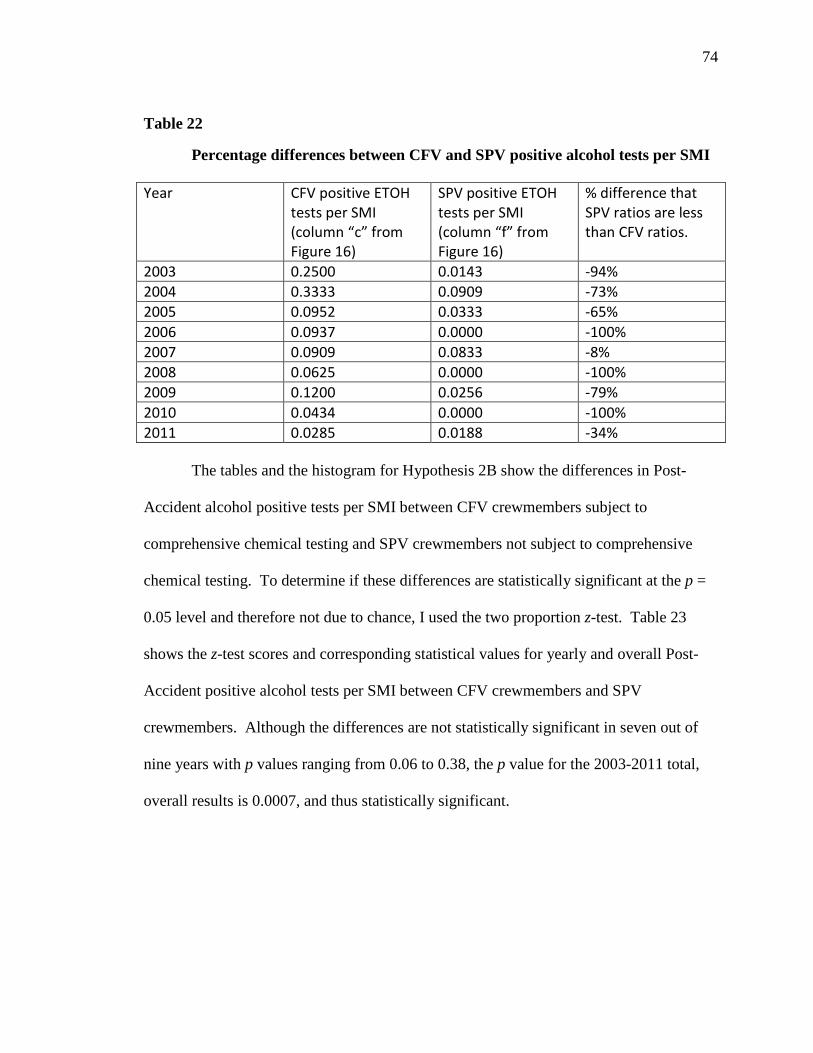
74
Table 22
Percentage differences between CFV and SPV positive alcohol tests per SMI Year CFV positive ETOH
tests per SMI (column “c” from Figure 16)
SPV positive ETOH tests per SMI (column “f” from Figure 16)
% difference that SPV ratios are less than CFV ratios.
2003 0.2500 0.0143 -94% 2004 0.3333 0.0909 -73% 2005 0.0952 0.0333 -65% 2006 0.0937 0.0000 -100% 2007 0.0909 0.0833 -8% 2008 0.0625 0.0000 -100% 2009 0.1200 0.0256 -79% 2010 0.0434 0.0000 -100% 2011 0.0285 0.0188 -34%
The tables and the histogram for Hypothesis 2B show the differences in Post-
Accident alcohol positive tests per SMI between CFV crewmembers subject to
comprehensive chemical testing and SPV crewmembers not subject to comprehensive
chemical testing. To determine if these differences are statistically significant at the p =
0.05 level and therefore not due to chance, I used the two proportion z-test. Table 23
shows the z-test scores and corresponding statistical values for yearly and overall Post-
Accident positive alcohol tests per SMI between CFV crewmembers and SPV
crewmembers. Although the differences are not statistically significant in seven out of
nine years with p values ranging from 0.06 to 0.38, the p value for the 2003-2011 total,
overall results is 0.0007, and thus statistically significant.
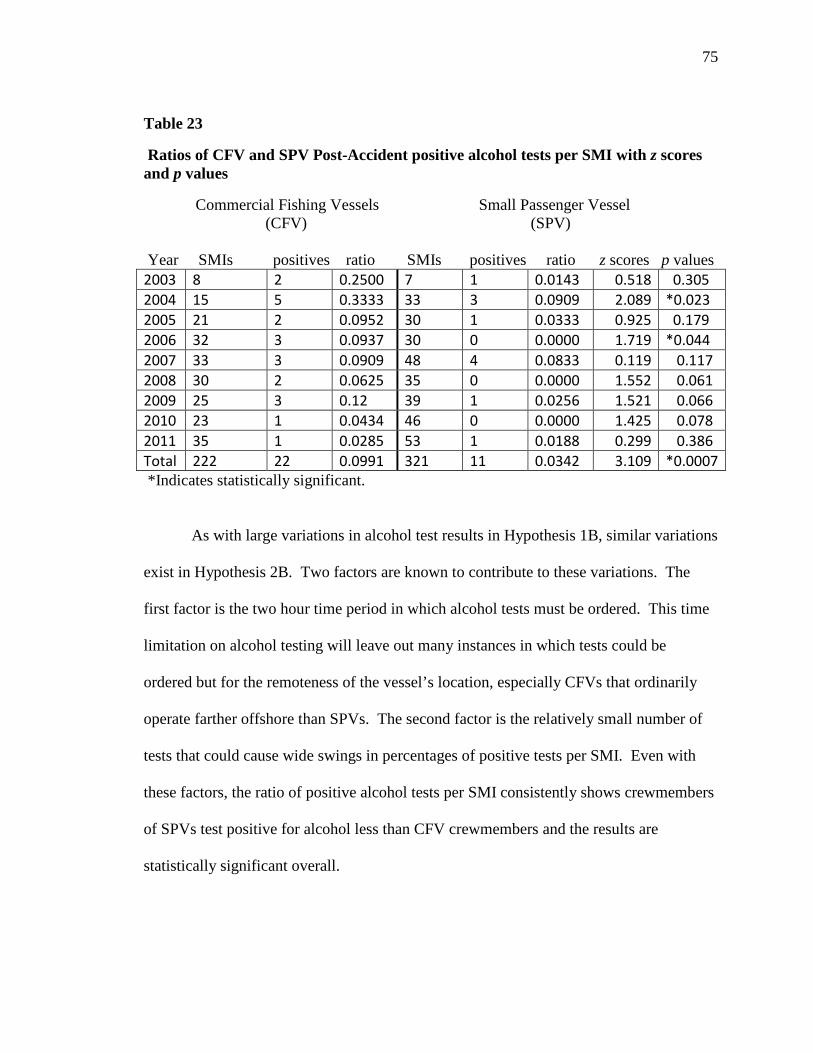
75
Table 23
Ratios of CFV and SPV Post-Accident positive alcohol tests per SMI with z scores and p values
Commercial Fishing Vessels Small Passenger Vessel (CFV) (SPV)
Year SMIs positives ratio SMIs positives ratio z scores p values 2003 8 2 0.2500 7 1 0.0143 0.518 0.305 2004 15 5 0.3333 33 3 0.0909 2.089 *0.023 2005 21 2 0.0952 30 1 0.0333 0.925 0.179 2006 32 3 0.0937 30 0 0.0000 1.719 *0.044 2007 33 3 0.0909 48 4 0.0833 0.119 0.117 2008 30 2 0.0625 35 0 0.0000 1.552 0.061 2009 25 3 0.12 39 1 0.0256 1.521 0.066 2010 23 1 0.0434 46 0 0.0000 1.425 0.078 2011 35 1 0.0285 53 1 0.0188 0.299 0.386 Total 222 22 0.0991 321 11 0.0342 3.109 *0.0007 *Indicates statistically significant.
As with large variations in alcohol test results in Hypothesis 1B, similar variations
exist in Hypothesis 2B. Two factors are known to contribute to these variations. The
first factor is the two hour time period in which alcohol tests must be ordered. This time
limitation on alcohol testing will leave out many instances in which tests could be
ordered but for the remoteness of the vessel’s location, especially CFVs that ordinarily
operate farther offshore than SPVs. The second factor is the relatively small number of
tests that could cause wide swings in percentages of positive tests per SMI. Even with
these factors, the ratio of positive alcohol tests per SMI consistently shows crewmembers
of SPVs test positive for alcohol less than CFV crewmembers and the results are
statistically significant overall.
76
X. HYPOTHESIS 3
In response to the third research question “[t]o what extent, if any, does chemical
testing enhance the safety of the maritime transportation industry” Hypothesis 3 states the
yearly 2003-2011 Post-Accident drug test positivity rates from all vessels with
crewmembers subject to chemical testing will correlate positively and strongly with
decreasingly lower Random drug test positivity rates from 2003-2011 for all vessels with
crewmembers subject to chemical testing. The Null Hypothesis is that there is no
correlation of Post-Accident positivity with downward Random positivity rates.
Table 24 shows yearly 2003 through 2011 Pre-Employment, Random, and Post-
Accident Random drug test positivity rates from ALL vessels with crewmembers subject
to chemical testing. The Pre-Employment positivity rate is obtained by dividing the total
number of Verified Positive Test Results by the total number of Pre-Employment drug
tests. For 2011, the total number of Pre-Employment, Verified Positive Test Results is
1,723 and the total number of Pre-Employment drug tests is 46,746. Dividing the total
number of Pre-Employment positive drug tests by the total number of tests yields a Pre-
Employment positivity rate of .03685. The positivity rates for Post-Accident are obtained
in the same manner; however, the Coast Guard calculates the Random positivity rate
differently.
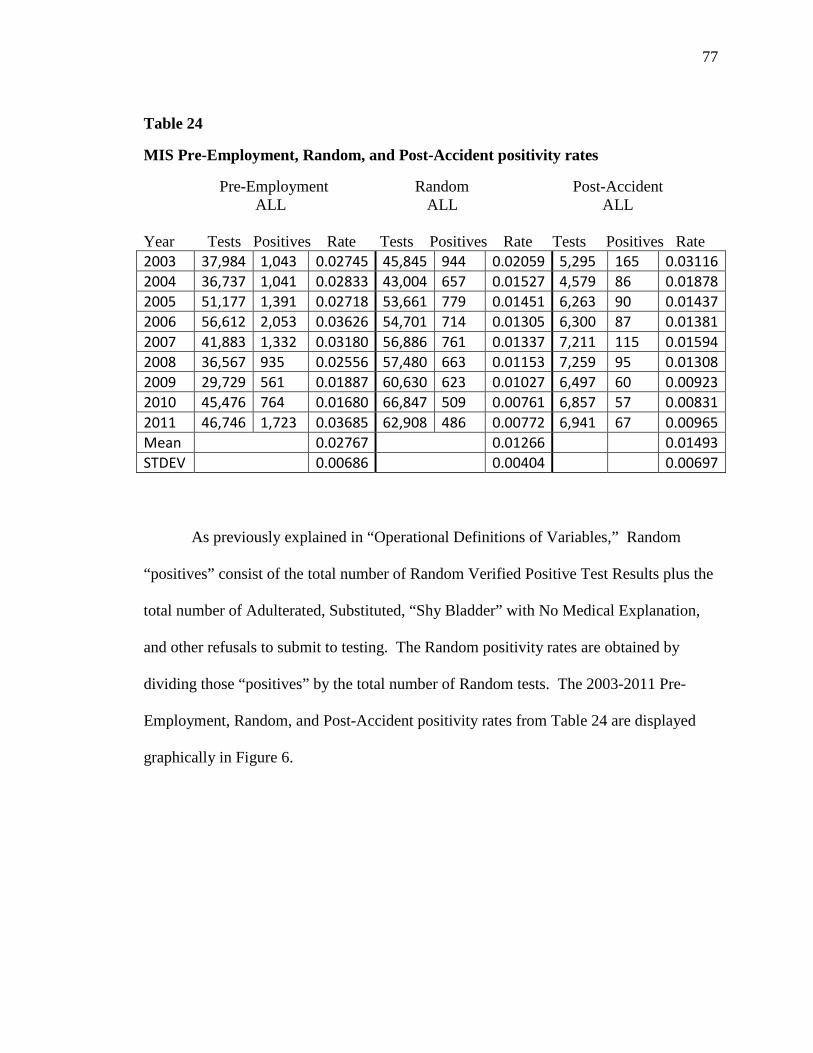
77
Table 24
MIS Pre-Employment, Random, and Post-Accident positivity rates
Pre-Employment Random Post-Accident ALL ALL ALL Year Tests Positives Rate Tests Positives Rate Tests Positives Rate 2003 37,984 1,043 0.02745 45,845 944 0.02059 5,295 165 0.03116 2004 36,737 1,041 0.02833 43,004 657 0.01527 4,579 86 0.01878 2005 51,177 1,391 0.02718 53,661 779 0.01451 6,263 90 0.01437 2006 56,612 2,053 0.03626 54,701 714 0.01305 6,300 87 0.01381 2007 41,883 1,332 0.03180 56,886 761 0.01337 7,211 115 0.01594 2008 36,567 935 0.02556 57,480 663 0.01153 7,259 95 0.01308 2009 29,729 561 0.01887 60,630 623 0.01027 6,497 60 0.00923 2010 45,476 764 0.01680 66,847 509 0.00761 6,857 57 0.00831 2011 46,746 1,723 0.03685 62,908 486 0.00772 6,941 67 0.00965 Mean 0.02767 0.01266 0.01493 STDEV 0.00686 0.00404 0.00697
As previously explained in “Operational Definitions of Variables,” Random
“positives” consist of the total number of Random Verified Positive Test Results plus the
total number of Adulterated, Substituted, “Shy Bladder” with No Medical Explanation,
and other refusals to submit to testing. The Random positivity rates are obtained by
dividing those “positives” by the total number of Random tests. The 2003-2011 Pre-
Employment, Random, and Post-Accident positivity rates from Table 24 are displayed
graphically in Figure 6.
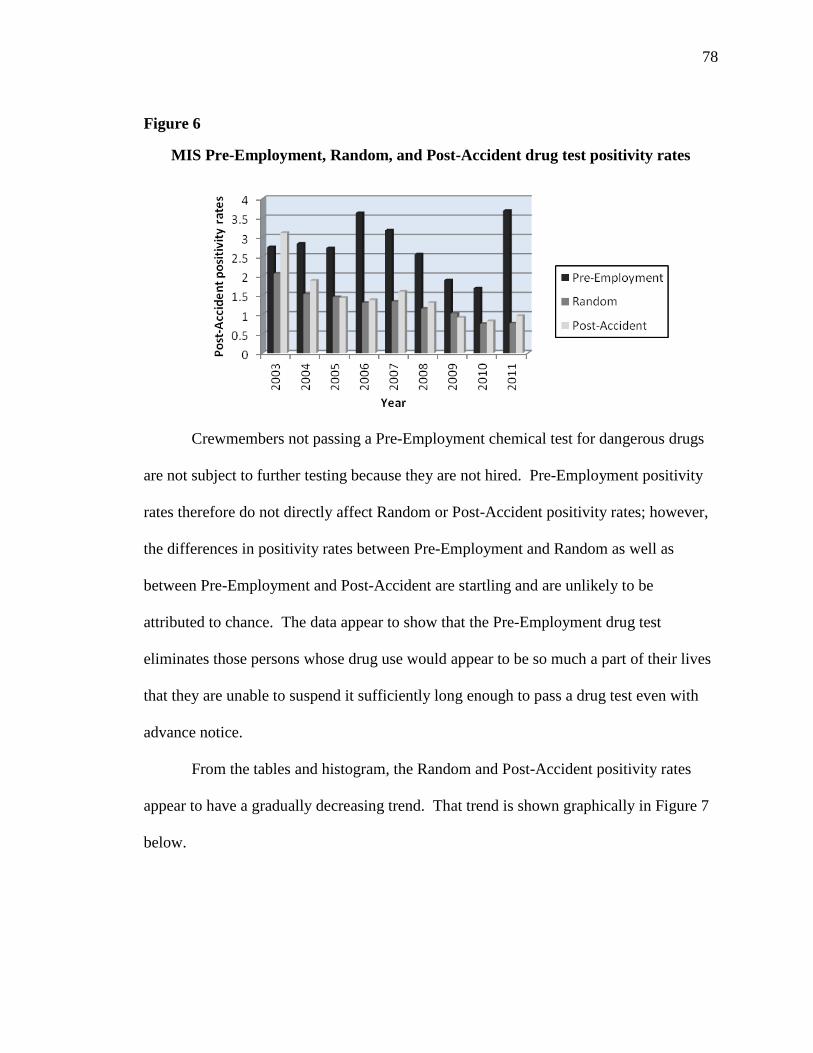
78
Figure 6
MIS Pre-Employment, Random, and Post-Accident drug test positivity rates
Crewmembers not passing a Pre-Employment chemical test for dangerous drugs
are not subject to further testing because they are not hired. Pre-Employment positivity
rates therefore do not directly affect Random or Post-Accident positivity rates; however,
the differences in positivity rates between Pre-Employment and Random as well as
between Pre-Employment and Post-Accident are startling and are unlikely to be
attributed to chance. The data appear to show that the Pre-Employment drug test
eliminates those persons whose drug use would appear to be so much a part of their lives
that they are unable to suspend it sufficiently long enough to pass a drug test even with
advance notice.
From the tables and histogram, the Random and Post-Accident positivity rates
appear to have a gradually decreasing trend. That trend is shown graphically in Figure 7
below.
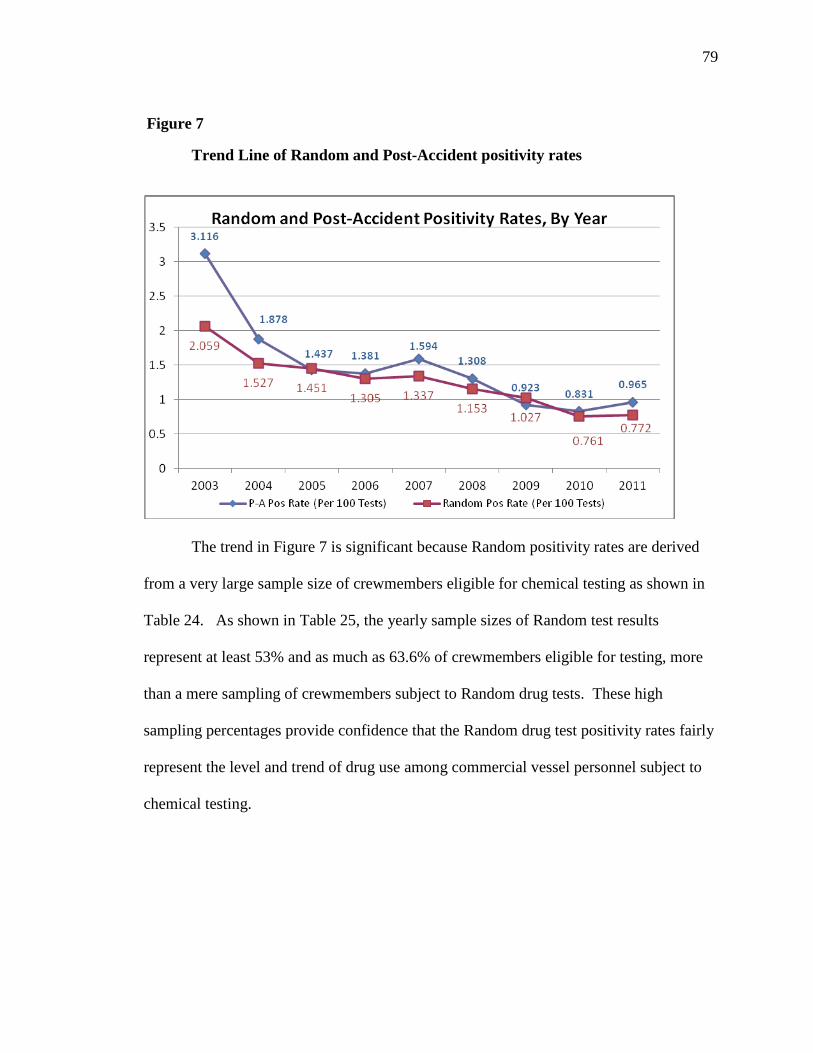
79
Figure 7
Trend Line of Random and Post-Accident positivity rates
The trend in Figure 7 is significant because Random positivity rates are derived
from a very large sample size of crewmembers eligible for chemical testing as shown in
Table 24. As shown in Table 25, the yearly sample sizes of Random test results
represent at least 53% and as much as 63.6% of crewmembers eligible for testing, more
than a mere sampling of crewmembers subject to Random drug tests. These high
sampling percentages provide confidence that the Random drug test positivity rates fairly
represent the level and trend of drug use among commercial vessel personnel subject to
chemical testing.

80
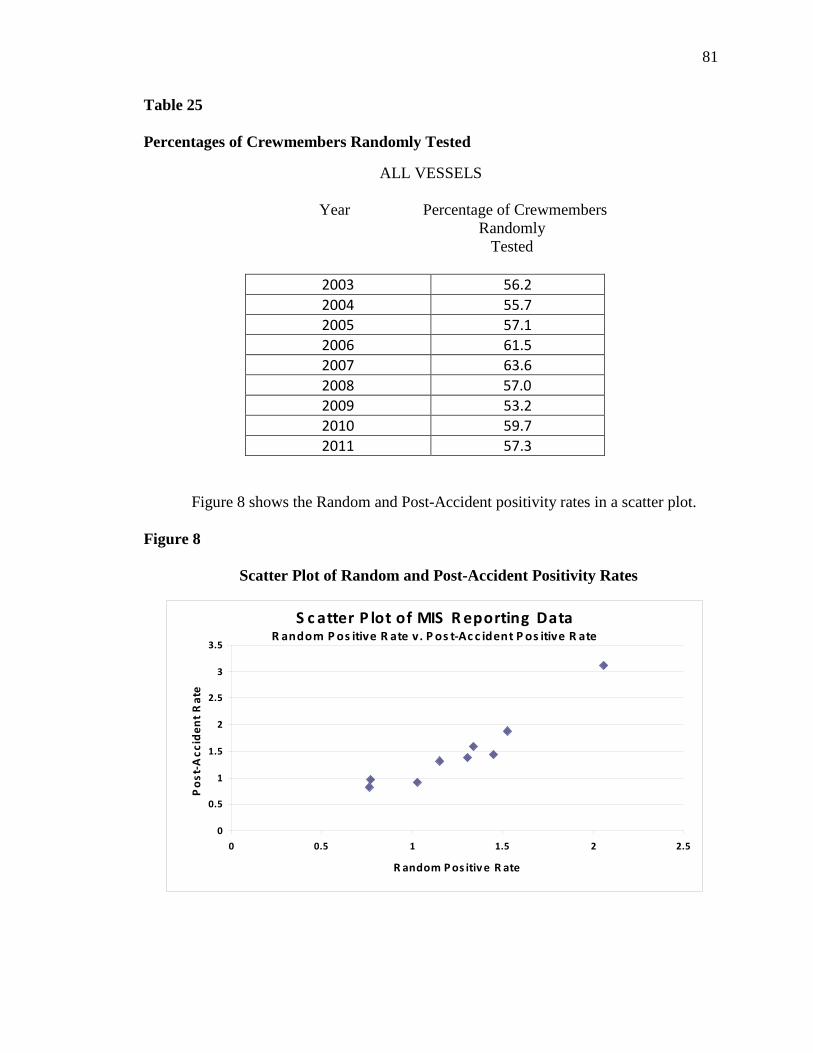
81
Table 25 Percentages of Crewmembers Randomly Tested
ALL VESSELS
Year Percentage of Crewmembers Randomly
Tested
2003 56.2 2004 55.7 2005 57.1 2006 61.5 2007 63.6 2008 57.0 2009 53.2 2010 59.7 2011 57.3
Figure 8 shows the Random and Post-Accident positivity rates in a scatter plot.
Figure 8
Scatter Plot of Random and Post-Accident Positivity Rates
S c atter P lot of MIS R eporting DataR andom P os itive R ate v. P os t-Ac c ident P os itive R ate
0
0.5
1
1.5
2
2.5
3
3.5
0 0.5 1 1.5 2 2.5
R andom P os itiv e R ate
Pos
t-A
ccid
ent R
ate
82
The Figure 8 scatter plot shows a strong linear relationship between Random
positivity rates represented by the horizontal or x axis and the Post-Accident positivity
rates represented by the vertical or y axis. That relationship suggests a regression line as
shown in the Figure 9 scatter plot.
The formula for the best-fitting regression line is y = mx + b where m is the slope
of the line and b is the y-intercept. The x values are the Random positivity rates and the y
values are the Post-Accident positivity rates. The slope of a line is the change in y values
over the change in x values. The y intercept is the point on the y axis where the x value is
zero. Applying the LINEST formula in EXCEL® yields a slope of 1.632. Applying the
INTERCEPT formula in EXCEL® yields -0.572 as the y intercept. The best fitting
regression line (y = mx + b) for the Random and Post-Accident positivity rates from
Table 17 is depicted in Figure 9 on the next page.
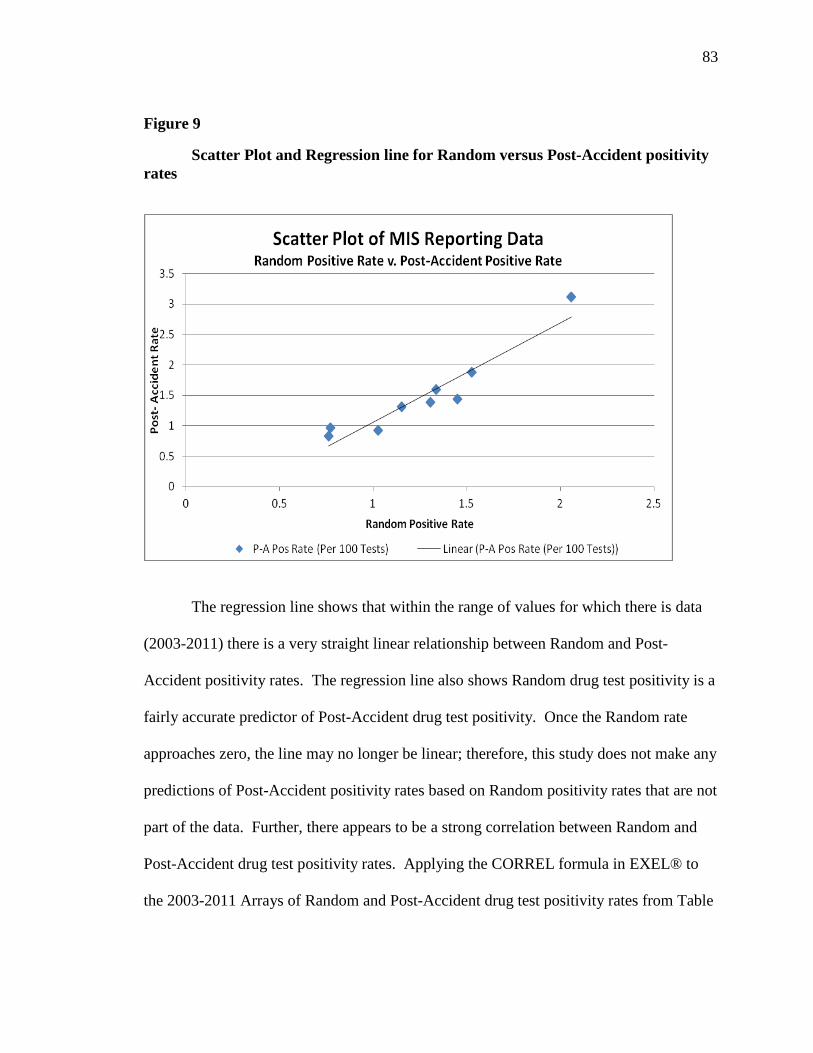
83
Figure 9
Scatter Plot and Regression line for Random versus Post-Accident positivity rates
The regression line shows that within the range of values for which there is data
(2003-2011) there is a very straight linear relationship between Random and Post-
Accident positivity rates. The regression line also shows Random drug test positivity is a
fairly accurate predictor of Post-Accident drug test positivity. Once the Random rate
approaches zero, the line may no longer be linear; therefore, this study does not make any
predictions of Post-Accident positivity rates based on Random positivity rates that are not
part of the data. Further, there appears to be a strong correlation between Random and
Post-Accident drug test positivity rates. Applying the CORREL formula in EXEL® to
the 2003-2011 Arrays of Random and Post-Accident drug test positivity rates from Table
84
24, the correlation coefficient is 0.94642525, showing a strong, linear relationship. It is
sufficient to conclude that decreasing Random positivity rates have, on the average,
predicted decreasing Post-Accident positivity rates at least from 2003-2011. Lower Post-
Accident positivity rates results in fewer serious marine incidents with drug involvement,
thereby enhancing the safety of the maritime transportation industry at least to the extent
of fewer positive drug tests per serious marine incident.
85
XI. DISCUSSION
A. SUMMARY
Research question number one is “[t]o what extent, if any, has chemical testing
discouraged drug and alcohol use by commercial vessel personnel.” In response to that
research question, this study showed yearly 2003-2011 Post-Accident drug test positivity
rates from small passenger vessel crewmembers were significantly lower than
corresponding Post-Accident drug test positivity rates from commercial fishing vessel
crewmembers. The difference between the two categories is small passenger vessel
crewmembers are subject to comprehensive chemical testing and commercial fishing
vessel crewmembers are not subject to comprehensive chemical testing except for Post-
Accident drugs and alcohol. Comprehensive chemical testing includes Pre-Employment,
Random, Reasonable Cause, and Post-Accident. The positivity rate differences are
statistically significant and not due to chance; therefore, I rejected the null hypothesis that
there is no difference in Post-Accident drug test positivity rates between the two
categories.
This author expected Post-Accident positivity rates for small passenger vessel
crewmembers to be less than those of commercial fishing vessel crewmembers because
experiences with the military’s drug testing program showed random testing to be an
effective deterrent. The Mehay and Pacula (1999) study corroborates this expectation.
Using 1995 data from the National Household Survey of Drug Abuse (NHSDA) and the
Department of Defense’s Worldwide Survey of Drug Abuse (DODWWS), Mehay and
Pacula (1999) examined the deterrence effect by comparing differences in illicit drug use
86
between the military and the civilian populations. They found the military’s strict anti-
drug program to be highly effective in deterring illicit drug use to the extent drug
participation in the military ranged between 4% and 16% lower than in the civilian
sector, depending on the age group. It was reasonable to assume the commercial vessel
personnel chemical drug and alcohol testing program would show crewmembers subject
to chemical testing have a lower positivity rate than crewmembers not subject to
chemical testing. I was surprised to see that the differences in Post-Accident positivity
rates between small passenger vessel crewmembers were at least 32% (2008) and as
much as 96% (2009) lower than Post-Accident drug test positivity rates of commercial
fishing vessel crewmembers. Small passenger vessel crewmembers subject to
comprehensive chemical testing had a 2003-2011 average of 77% fewer Post-Accident
positive drug tests than commercial fishing vessel crewmembers not subject to
comprehensive chemical testing. That is substantially more than a 4% to 16% difference
between the military and civilian populations.
Also in response to research question number one, this study showed yearly 2003-
2011 Post-Accident alcohol test positivity rates from SPV crewmembers subject to
comprehensive chemical testing were significantly lower than yearly 2003-2011 Post-
Accident alcohol test positivity rates from CFV crewmembers not otherwise subject to
chemical testing except for Post-Accident drugs and alcohol. The overall differences in
Post-Accident alcohol test positivity rates are statistically significant and not due to
chance; therefore, I rejected the null hypothesis that there is no difference in Post-
Accident alcohol test positivity rates between the two categories.
87
I did not expect to see the differences in Post-Accident alcohol test positivity rates
of SPVs to be at least 14% (2007) and as much as 100% (2006, 2008, and 2010) lower
than Post-Accident alcohol test positivity rates of CFV crewmembers. SPV
crewmembers subject to comprehensive chemical testing had a 2003-2011 average of
72% fewer Post-Accident positive alcohol tests than CFV crewmembers not subject to
comprehensive chemical testing. This author expected lower alcohol test positivity rates
but did not expect that the differences would be this large and statistically significant.
This is especially so because the Coast Guard does not mandate Pre-Employment,
Periodic, or Random alcohol testing. However, crewmembers are subject to Reasonable
Cause tests for alcohol as prescribed in 33 C.F.R. pt. 95. Credentialed crewmembers
testing positive for alcohol use under that part also face suspension and revocation
proceedings in addition to any personnel actions their employers impose.
Another reason for large differences in positivity rates may be due to credentialed
crewmembers potentially facing suspension and revocation proceedings if they are
convicted of operating a motor vehicle while under the influence of alcohol. Driving
While Intoxicated or Driving Under the Influence are offences described in the National
Driver Register Act, 49 U.S.C. 30304(a)(3)(A), and violations therefore would constitute
a wrongful violation of 46 U.S.C. § 7703(3). These deterrents, plus being subject to
comprehensive chemical testing for drugs, would appear to account for the large
differences in alcohol positivity rates between commercial fishing vessel crewmembers
and small passenger vessel crewmembers.
In final response to research question number one, this study showed yearly 2003-
2011 Post-Accident drug test positivity rates of all crewmembers subject to
88
comprehensive chemical testing from all vessels were substantially lower than positivity
rates of CFV crewmembers not subject to comprehensive chemical testing except for
Post-Accident drugs and alcohol. The differences in Post-Accident drug test positivity
rates between the two categories are statistically significant and not due to chance;
therefore, I rejected the null hypothesis that there is no difference in Post-Accident drug
test positivity rates between the two categories.
This author was surprised to learn the differences in Post-Accident positivity rates
between the two categories of crewmembers were at least 89% lower (2008) and as much
as 97% lower (2009) than Post-Accident drug test positivity rates of commercial fishing
vessel crewmembers not subject to comprehensive chemical testing. All vessels with
crewmembers subject to comprehensive chemical testing had a 2003-2011 average of
92% fewer Post-Accident positive drug tests than commercial fishing vessel
crewmembers not subject to comprehensive chemical testing. These results were also
surprising because it appeared SPVs would be the safest of all vessels with crewmembers
subject to chemical testing. Upon further consideration, small passenger vessels
ordinarily would be underway more often than other vessels because they are carrying
passengers on regular schedules exposing those vessels to the hazards of navigating in
close quarters with frequent trips involving docking and undocking. The results show all
vessels with crewmembers subject to chemical testing, including SPVs, have even lower
Post-Accident drug test positivity rates than SPVs exclusively.
Crewmembers subject to comprehensive chemical testing generally have much
more to lose than crewmembers on CFVs. A positive drug test will generally result in
loss of employment, at least in a safety sensitive position, as well as loss of credentials.
89
As pointed out in Mehay and Pacula (1999), facing job loss would appear to deter use of
dangerous drugs as well as alcohol.
I expected crewmembers not subject to comprehensive chemical testing except for
Post-Accident would have higher positivity rates in both drugs and alcohol than
crewmembers not subject to chemical testing. Not being subject to comprehensive
chemical testing except for Post-Accident drugs and alcohol coupled with the inherent
dangerousness of commercial fishing would also seem to result in higher drug and
alcohol positivity rates. The inherent dangerousness of commercial fishing is also more
likely to attract crewmembers that are more inclined to embrace risk and possibly engage
in risky behavior, including drugs and alcohol, compared to crewmembers of small
passenger vessels or other vessels with crewmembers subject to chemical testing.
Research question number two is “[t]o what extent, if any, does chemical testing
reduce the potential for marine casualties related to drug and alcohol use.” In response to
that question this study showed yearly 2003-2011 ratios of Post-Accident positive drug
tests per SMI from SPV crewmembers subject to chemical testing are substantially lower
than corresponding Post-Accident positive drug tests per SMI from CFV crewmembers
not otherwise subject to chemical testing. The differences in Post-Accident positive drug
tests per SMI between the two categories are statistically significant and not due to
chance; therefore, I rejected the null hypothesis that there are no differences in positive
drug tests between the two categories.
This author was surprised to learn the differences between the two categories of
crewmembers were at least 20% (2006) and as much as 96% (2009) lower for small
passenger vessel crewmembers. I knew small passenger vessel crewmembers subject to
90
comprehensive chemical testing would have fewer Post-Accident positive drug tests per
serious marine incident but I did not know that the differences would average 71%. This
is especially so because fewer drug related accidents may not necessarily be directly
attributed to drug testing but might have occurred due to other improvements in safety,
even in the absence of drug testing (Rothstein, 1991). However, with differences this
large and statistically significant, being subjected to Pre-Employment, Random, and
Reasonable Cause chemical testing would appear to be major influences in those
differences.
In further response to research question number two, this study showed yearly
2003-2011 ratios of Post-Accident positive alcohol tests per serious marine incident from
small passenger vessel crewmembers subject to chemical testing are substantially lower
than corresponding Post-Accident alcohol tests per serious marine incident from
commercial fishing vessel crewmembers not otherwise subject to chemical testing. The
differences in Post-Accident positive alcohol tests per serious marine incident between
the two categories are statistically significant and not due to chance; therefore, I rejected
the null hypothesis that there are no differences in positive alcohol tests between the two
categories.
For the reasons expressed above concerning the differences in alcohol tests
between the two categories, this author was surprised to learn that Post-Accident positive
alcohol tests per SMI were at least 8% (2007) and as much as 100% (2006, 2008, and
2010) lower for SPVs from 2003-2011. SPV crewmembers subject to comprehensive
chemical testing had a 2003-2011 average of 73% fewer Post-Accident positive alcohol
tests per SMI than CFV crewmembers not subject to comprehensive chemical testing.
91
Also, for the reasons expressed above concerning positive drug tests per SMI, fewer
alcohol related accidents may not necessarily be directly attributed to alcohol testing but
might have occurred due to other improvements in safety, even in the absence of alcohol
testing (Rothstein, 1991). However, with differences this large and statistically
significant, being subjected to Pre-Employment, Random, and Reasonable Cause
chemical testing as well as the alcohol testing requirements of 33 C.F.R. pt. 95 and the
threat of suspension and revocation proceedings for violations of the National Driver
Register Act, 49 U.S.C. 30304(a)(3)(A) would appear to contribute to the differences.
Research question number three is, “[t]o what extent, if any, does chemical
testing enhance the safety of the maritime transportation industry.” In response to
research question number three this study showed a strong linear relationship between
yearly 2003-2011 Post-Accident drug test positivity rates from all vessels with
crewmembers subject to chemical testing and decreasingly lower Random drug test
positivity rates for 2003-2011 from all vessels with crewmembers subject to chemical
testing; therefore, I rejected the null hypothesis that there is no strong correlation or linear
relationship between Random and Post-Accident positivity rates.
This author was aware that Pre-Employment, Random, and Post-Accident
positivity rates were gradually trending downward by simply observing the year after
year positivity rates. These downward trends are also consistent with the Quest
Diagnostics Drug Testing Index (2012) and the 2008 DOD Survey of Health Related
Behaviors Among Active Duty Military. I knew there was a moderate to strong
correlation between Random and Post-Accident drug test positivity rates but was
92
surprised to learn there was also a linear relationship showing Random positivity rates to
be a good predictor of Post-Accident positivity rates.
As discussed above, Pre-Employment drug tests screen out most dangerous drug
users. Those remaining are aware they are subject to an unannounced Random test, a
Reasonable Cause test, and, if there is a serious marine incident, a Post-Accident drug
and alcohol test. As shown graphically in the Figure 6 histogram, it stands to reason that
those remaining crewmembers would avoid using dangerous drugs compared to those
subject to the Pre-Employment test.
B. CONCLUSIONS
Through secondary data analysis of archived test results, this author examined the
extent chemical testing has discouraged drug and alcohol use by commercial vessel
personnel, reduced the potential for marine casualties related to drug and alcohol use, and
enhanced the safety of the maritime transportation industry. To determine the extent
chemical testing has discouraged drug and alcohol use, I examined Post-Accident drug
and alcohol positivity rates from two groups of commercial vessel personnel. One group
had been subject to chemical testing and the other group had not except for Post-Accident
drugs and alcohol. The results showed Post-Accident drug and alcohol positivity rates
from the group subject to chemical testing was significantly lower than those from the
group not subject to chemical testing except for Post-Accident.
The results also show the extent to which chemical testing has the potential to
reduce marine casualties related to drug and alcohol use because the group subject to
chemical testing had significantly fewer Post-Accident positive drug and alcohol tests per
93
serious marine incident than the group not subject to chemical testing, except for Post-
Accident.
Finally, these results illustrate the extent to which chemical testing has the potential
to enhance the safety of the maritime transportation industry. These results showed a
strong correlation between Random and Post-Accident drug test positivity rates. Further,
a linear regression analysis demonstrated Random positivity rates to be a fairly accurate
predictor of Post-Accident positivity rates. Maritime transportation safety is enhanced to
the extent of fewer positive chemical tests per serious marine incident.
A. RECOMMENDATIONS
These results suggest chemical testing might discourage drug and alcohol use,
reduce the potential for marine casualties, and enhance the safety of the maritime
transportation industry. Routine and wide dissemination of these results to the maritime
community could further enhance the safety of the maritime transportation industry.
Dissemination could simply take the form of displaying positivity rate trends and Post-
Accident positive drug and alcohol tests per SMI.
Future studies can encompass crewmembers of all vessel types as well as
crewmembers of specific vessel categories. Researchers could include specific drugs
(e.g., marijuana, cocaine, PCP, opiates, and amphetamines) and examine the trends in
that drug’s use as well as the number of positive tests of that drug per SMI in which tests
are reported for crewmembers of specific vessel categories. A researcher could also use
questionnaires in future studies. Questionnaires designed to ensure anonymity can be
made available to commercial vessel personnel at the time they renew their Credentials.
The questions can inquire into similar acts and practices as those asked in “Department of
94
Defense Surveys of Health Related Behaviors Among Active Duty Military” but focus on
acts and practices that relate to vessel safety.
This study showed statistically significant differences in Post-Accident positivity
rates and positive tests per serious marine incident between small passenger vessel
crewmembers and commercial fishing vessel crewmembers. It also showed Random
drug tests are good predictors of Post-Accident tests. When combined with current
initiatives to enhance commercial fishing vessel safety (Dickey, 2012), comprehensive
chemical testing of commercial fishing vessel crewmembers could help reduce the
potential for marine casualties related to drug and alcohol use and enhance fishing vessel
safety.
95
BIBLIOGRAPHY
U.S. Code: 14 U.S.C. § 2 (2006) Primary Duties of U.S. Coast Guard 46 U.S.C. § 2103 (2006) Superintendence of the Merchant Marine 36 U.S.C. § 2302 (2006) Penalties for negligent operations and interfering with safe operation 46 U.S.C. §§ 7701-7706 (2006) Suspension and Revocation 46 U.S.C. § 7701 (2006) General 46 U.S.C. § 7702 (2006) Administrative Procedure 46 U.S.C. § 7703 (2006) Bases for Suspension or Revocation 46 U.S.C. § 7704 (2006) Dangerous Drugs as Grounds for Revocation 46 U.S.C. § 7705 (2006) Subpoenas and Oaths 46 U.S.C. § 7706 (2006) Drug Testing Reporting Federal Register: Programs for Chemical Drug and Alcohol Testing of Commercial Vessel Personnel, 53 Fed. Reg. 25,926 – 25,949 (proposed Jul. 8, 1988) (codified at 46 C.F.R. pt. 4 and pt. 16). Programs for Chemical Drug and Alcohol Testing of Commercial Vessel Personnel, 53 Fed. Reg. 47,064 – 47,082 (final Nov. 21, 1988) (codified at 46 C.F.R. pt. 4, and pt. 16). Procedures for Transportation Workplace Drug and Alcohol Testing Programs, 65 Fed. Reg. 79,526 (Dec. 19, 2000) (codified at 49 C.F.R. § 40.87). Procedures for Transportation Workplace Drug and Alcohol Testing Programs, 75 Fed. Reg. 49,850, 49,862 (Aug. 16, 2010) (codified at 49 C.F.R. § 40.87). Code of Federal Regulations: 6 C.F.R. pt. 5 Disclosure of Records and Information
96
33 C.F.R. pt. 20 Rules of Practice, Procedure, and Evidence for Formal Administrative Proceedings of the Coast Guard 33 C.F.R. pt. 95 Operating a Vessel Under the Influence of Alcohol or a Dangerous Drug 46 C.F.R. pt. 4 Marine Casualties 46 C.F.R. pt. 16 Chemical Testing 46 C.F.R. Chapter 1 Subchapter K, pts. 114-142, Small passenger vessels (SPVs) less than 100 gross tons carrying more than 150 Passengers or with overnight accommodations for more than 49 passengers 46 C.F.R. Chapter 1 Subchapter T, pts. 175-185, SPVs under 100 gross tons 49 C.F.R. pt. 40 Procedures for Transportation Workplace Drug and Alcohol Testing Programs Articles: Brudzinski, W. J. (2011). Coast Guard administrative proceedings in drug cases resemble the civil law tradition (2011). Journal of Maritime Law and Commerce, 42(2), 159-183. Brudzinski, W.J. (2010, April 13). Mandatory drug testing of merchant marine personnel. Maritime Executive. Retrieved from http://www.maritime-executive.com. Cabanilla, B.R., Frankenfield, D.L., Fudala, P.J., Lange, W., & Moler, G. (1994). Pre-employment drug screening at the Johns Hopkins Hospital, 1989 and 1991. American Journal of Drug and Alcohol Abuse, 20(1), 35-46. Comer, D.R. (1994). A case against workplace drug testing. Organizational Science, 5(2), 259-267. Dickey, D. H. (2012). Fishing vessel casualties: Using investigations to improve safety. Coast Guard Proceedings of the Marine Safety Council, 69(3), 66-69. Retrieved from http://uscgproceedings.epubxp.com/i/85854/68. Fortner, N.A, Martin, D.M., Esen, S.E., & Shelton, L., (2011). Employee drug testing: Study shows improved productivity and attendance and decreased workers’ compensation and turnover. The Journal of Global Drug Policy and Practice, 5(4), 1-22. Retrieved from http://www.globaldrugpolicy.org/previous.html. French, M.T., Roebuck, M.C., & Alexandre, P.K., (2004). To test or not to test. Social Science Research, 33(1), 45-63. doi:10.1016/S004 9-089X(03)00038-3.
97
Gerber, J.K. & Yacoubian, G.S. (2001). Evaluation of drug testing in the workplace: Study of the construction industry. Journal of Construction Engineering and Management, 127, 438-447. Jacobson, M. (2003). Drug testing in the trucking industry: The effect on highway safety. Journal of Law and Economics, 46, 131-157 (2003). Retrieved from http://works. bepress.com/mireille_jacobson/8/. Levine, M.R. & Rennie, W.P. (2004). Pre-employment urine drug testing of hospital employees: Future questions and review of current literature. Occupational & Environmental Medicine, 6(4), 318-324. doi: 10.1136.oem.2002.006163. Normand, J., Salyards, S.D., & Mahoney, J.J. (1990). An evaluation of pre-employment drug testing. Journal of Applied Psychology, 75(6), 629-639. doi 10.1037/0021-9010.75.6.629. Parish, D.C., (1989). Relation of the pre-employment drug testing result to employment status: A one-year follow-up. Journal of General Internal Medicine, 4(1), 44-47. Rothstein, M.A. (1991). Workplace drug testing: A case study in misapplication of technology. Harvard Journal of Law and Technology, 5, 65-93. Ryan, J., Zwerling, C., & Jones, M. (1992). The effectiveness of pre-employment drug screening in the prediction of employment outcome. Journal of Occupational Medicine, 34(11), 1057-1063. Spivey, P.R. (1997). Representing the mariner accused of drug abuse: A step by step guide. Tulane Maritime Law Journal, 21, 445-469. Wright, J.P. (1989). Drug and alcohol testing of maritime personnel. Journal of Maritime Law and Commerce, 20(4) 541-557. Yamaguchi, R., Johnson, L.D., & O’Malley, P.M. (2003a). Relationship between student illicit drug use and school drug-testing policies. Journal of School Health, 73(4), 159–164. Retrieved from http://monitoringthefuture.org/pubs/text/ryldjpom03.pdf. Zwerling, C., Ryan, J., & Orav, E.J. (1990). The efficacy of pre-employment drug screening for marijuana and cocaine in predicting employment outcome. Journal of the American Medical Association, 264(20) 2639-2643. doi:10.1001/jama.1990.0345 0200047029.
98
U.S. Government Reports: U.S. Department of Defense, Tricare Management Activity. (2008). 2008 DOD Survey of health related behaviors among active duty military. Retrieved from http://www. tricare.mil/tma/studiesEval.aspx. U.S. Department of Education, National Center for Education Evaluation and Regional Assistance. (2010). The effectiveness of mandatory-random student drug testing (NCEE 2010-4025). Retrieved from http://ies.ed.gov/ncee/pubs/20104025/pdf/2010425. pdf. U.S. Coast Guard, Office of Investigations and Analysis. (2011). Analysis of fishing vessel casualties, a review of lost fishing vessels and crew fatalities, 1992-2010. Washington, D.C. Prepared by David H. Dickey. Retrieved from https://homeport.uscg.mil under “Investigations.” Non-Governmetal Reports: Quest Diagnostics Drug Testing Index. (2012). Retrieved from http://www.quest diagnostics.com/home/physicians/health-trends/drug-testing.html. Mehay, S.L, & Pacula, R.L. (1999). The effectiveness of workplace drug prevention policies: Does zero tolerance work? National Bureau of Economic Research (Publication No. 7383). Retrieved from http://www.nber.org/papers/w/7383.pdf. Yamaguchi, R., Johnston, L.D., & O’Malley, P.M. (2003). Drug testing in schools: policies, practices, and association with student drug use. Youth, Education, and Society Occasional Paper 2, University of Michigan, 2003b. Retrieved from http://monitoringthefuture.org/pubs/occpapers/yes-occ_paper02.pdf. Books: Larson, R., Farber, B. (2009). Elementary Statistics (4th ed.). Upper Saddle River, NJ: Pearson Prentice Hall. Moore, D.S., McCabe, G.P., and Craig, B.A. (2009). Introduction to the Practice of Statistics (6th ed.). New York, NY: W.H. Freeman and Company. Rumsey, D.J. (2011). Statistics for Dummies (2nd ed.). Hoboken, NJ: Wiley Publishing, Inc.