Embed Size (px)
Citation preview

Weekly / Vol. 60 / No. 35 September 9, 2011
U.S. Department of Health and Human ServicesCenters for Disease Control and Prevention
Morbidity and Mortality Weekly Report
Chemical Suicides in Automobiles — Six States, 2006–2010
During a 3-month period in 2008 in Japan, 208 persons committed suicide by mixing household chemicals and, while in a confined space, breathing in the resultant poisonous gas (1). The large number of similar suicides is believed to have resulted from the posting of directions for generating poisonous gas on the Internet (1–3). In addition to claiming the suicide victim, lethal gas generated by intentionally mixing household chemicals can leak from confined spaces, triggering evacuations, and exposing bystanders and first responders to injury (2). Chemical suicides similar to those in Japan in 2008 have been reported increasingly in the United States, with the majority occurring inside automobiles (3). To characterize such incidents in the United States, the Agency for Toxic Substances and Disease Registry (ATSDR) analyzed reports of chemical suicides and attempted suicides that occurred in automobiles, using 2006–2009 data from states participating in the Hazardous Substances Emergency Events Surveillance (HSEES) system and 2010 data from states participating in the new National Toxic Substance Incidents Program (NTSIP). This report summarizes the results of that analysis, which found that, during 2006–2010, a total of 10 chemical suicide incidents were reported from six states, resulting in the deaths of nine suicide victims and injuries to four law enforcement officers. When responding to suspected chemical suicide incidents, emergency responders must take precautions to ensure both their safety and the safety of any bystanders in the immediate vicinity.
Fifteen states conducted surveillance for acute hazardous substance releases at some time during 2006–2010. An average of 13 of the states participated in HSEES* during 2006–2009, and nine states (two unfunded) participated in NTSIP† during 2010, the first year of the program. ATSDR uses these surveillance systems to track the public health consequences from acute hazardous materials (HazMat) releases. State health departments obtained data from multiple sources, including
state environmental agencies, police and fire departments, poison control centers, hospitals, local media, the U.S. Coast Guard’s National Response Center, and the U.S. Department of Transportation’s Hazardous Material Incident Reporting System. Both HSEES and NTSIP define a hazardous substance as one that might reasonably be expected to cause adverse health effects in humans. For this analysis, to find potential suicide incidents, open text fields were queried in the comments and synopsis sections of HSEES and NTSIP databases for the following terms: “kill,” “die,” “death,” “intentional,” “suicide,” “car,” “vehicle,” “truck,” and “auto.” A case was defined as a suicide or attempted suicide using mixed chemicals in an automobile. Case reports were read to confirm that the suicide took place inside an automobile and chemicals were mixed.
Ten incidents of chemical suicide or attempted suicide in automobiles were reported: one in 2006, one in 2007, four in 2009, and four in 2010. The 10 incidents occurred in six states (Connecticut, Florida, New York, North Carolina, Utah, and Washington) and resulted in nine deaths of suicide victims (one person began a suicide attempt but aborted the effort)
* Additional information available at http://www.atsdr.cdc.gov/hs/hsees. † Additional information available at http://www.atsdr.cdc.gov/ntsip.
INSIDE1193 Maternal and Infant Outcomes Among Severely Ill
Pregnant and Postpartum Women with 2009 Pandemic Influenza A (H1N1) — United States, April 2009–August 2010
1197 Surveillance for Foodborne Disease Outbreaks — United States, 2008
1203 Respiratory Syncytial Virus — United States, July 2007–June 2011
1207 Vital Signs: Current Cigarette Smoking Among Adults Aged ≥18 Years — United States, 2005–2010
1213 Swine-Origin Influenza A (H3N2) Virus Infection in Two Children — Indiana and Pennsylvania, July–August 2011
1216 QuickStats

The MMWR series of publications is published by the Office of Surveillance, Epidemiology, and Laboratory Services, Centers for Disease Control and Prevention (CDC), U.S. Department of Health and Human Services, Atlanta, GA 30333.Suggested citation: Centers for Disease Control and Prevention. [Article title]. MMWR 2011;60:[inclusive page numbers].
Centers for Disease Control and PreventionThomas R. Frieden, MD, MPH, Director
Harold W. Jaffe, MD, MA, Associate Director for ScienceJames W. Stephens, PhD, Director, Office of Science Quality
Stephen B. Thacker, MD, MSc, Deputy Director for Surveillance, Epidemiology, and Laboratory ServicesStephanie Zaza, MD, MPH, Director, Epidemiology and Analysis Program Office
MMWR Editorial and Production StaffRonald L. Moolenaar, MD, MPH, Editor, MMWR Series
John S. Moran, MD, MPH, Deputy Editor, MMWR SeriesRobert A. Gunn, MD, MPH, Associate Editor, MMWR Series
Teresa F. Rutledge, Managing Editor, MMWR SeriesDouglas W. Weatherwax, Lead Technical Writer-Editor
Donald G. Meadows, MA, Jude C. Rutledge, Writer-Editors
Martha F. Boyd, Lead Visual Information SpecialistJulia C. Martinroe, Stephen R. Spriggs, Terraye M. Starr
Visual Information SpecialistsQuang M. Doan, MBA, Phyllis H. King
Information Technology Specialists
MMWR Editorial BoardWilliam L. Roper, MD, MPH, Chapel Hill, NC, Chairman
Virginia A. Caine, MD, Indianapolis, INJonathan E. Fielding, MD, MPH, MBA, Los Angeles, CA
David W. Fleming, MD, Seattle, WAWilliam E. Halperin, MD, DrPH, MPH, Newark, NJ
King K. Holmes, MD, PhD, Seattle, WADeborah Holtzman, PhD, Atlanta, GA
John K. Iglehart, Bethesda, MDDennis G. Maki, MD, Madison, WI
Patricia Quinlisk, MD, MPH, Des Moines, IAPatrick L. Remington, MD, MPH, Madison, WI
Barbara K. Rimer, DrPH, Chapel Hill, NCJohn V. Rullan, MD, MPH, San Juan, PR
William Schaffner, MD, Nashville, TNAnne Schuchat, MD, Atlanta, GA
Dixie E. Snider, MD, MPH, Atlanta, GAJohn W. Ward, MD, Atlanta, GA
Morbidity and Mortality Weekly Report
1190 MMWR / September 9, 2011 / Vol. 60 / No. 35
and injuries to four law enforcement officers who arrived on the scene. Two of the law enforcement officers experienced respiratory irritation; symptoms were not available for the other two. None of the four law enforcement officers wore personal protective equipment; however, two had received HazMat training.
Of the 10 incidents, nine occurred in residential areas and four resulted in evacuation orders affecting 85 persons. Thirty-two persons were decontaminated. In addition to household cleaners (not otherwise specified), the following chemicals were used in the 10 incidents: ammonium hydroxide, aluminum sulfide, calcium hypochlorite, calcium sulfide, germanium oxide, hydrochloric acid, potassium ferrocyanide, sodium hypochlorite, sulfur, sulfuric acid, and trichloroethylene.
Among the six victims for whom exact age was known, the median age was 31 years (range: 22–69 years); among the other four victims, two were aged <18 years, and two were aged ≥18 years. Seven of the 10 victims were male.
Illustrative Case Reports North Carolina. In 2010, a “detergent suicide” victim
was found deceased in a vehicle. A bucket inside the vehicle contained mixed chemicals that caused acute thiosulfate poisoning. Two law enforcement officers were exposed, one of whom was treated at the hospital. Local emergency responders evacuated the surrounding homes. The regional response team
removed and decontaminated the corpse of the suicide victim before transporting it to the medical examiner.
New York. In 2009, a hiker in a park found a car posted with signs warning of toxic gas and called 911. Inside the car, responders found a deceased person and two buckets of mixed chemicals. A HazMat team, sheriff ’s deputies, and the medical examiner responded as well. The sheriff ’s deputies evacuated hikers and residents within a half-mile of the scene. Some responders had consulted with a nearby county and used techniques learned during a similar HSEES incident that had occurred a few days earlier. Responders vented the car before decontaminating the body. The body was then double-bagged and, to protect the driver, transported by law enforcement officers in the open bed of a pickup truck. Ten HazMat team members and two nearby vehicles were decontaminated at the scene. A hazardous waste disposal service was contracted to remove the chemicals and decontamination fluids for disposal.
Reported by
Jennifer L. McNew, Sherry G. Rigouard, MPH, North Carolina Div of Public Health, Wanda L. Welles, PhD, Rebecca Wilburn, MPH, New York State Dept of Health. Ayana R. Anderson, MPH, Maureen F. Orr, MS, D. Kevin Horton, DrPH, Div of Health Studies, Agency for Toxic Substances and Disease Registry. Corresponding contributor: Ayana R. Anderson, [email protected], 770-488-3906.

Morbidity and Mortality Weekly Report
MMWR / September 9, 2011 / Vol. 60 / No. 35 1191
Editorial Note
Suicide is the 11th leading cause of death in the United States and the third leading cause among persons aged 15–34 years, accounting for 9,418 deaths in this age group in 2007.§ During National Suicide Prevention Week, September 4–10, CDC is encouraging health-care providers, public health practitioners, and others to learn more about strategies for preventing suicide¶ and the availability of the 24-hour National Suicide Prevention Lifeline.**
This analysis of chemical suicides in automobiles was limited to an average of 13 states that participated in HSEES and nine states (two unfunded) that participated in NTSIP during 2006–2010 and identified 10 cases during that 5-year period. The only other published report of chemical suicides in the United States reported 75 chemical suicides during 1999–2010. That report, which identified incidents by using the National Vital Statistics System, the National Association of Medical Examiners listserv, and Google searches, found that, of 30 incidents reported during 2008–2010, two occurred in 2008, 10 in 2009, and 18 in 2010. Of the 30 incidents, 24 (80%) occurred in cars (3).
In this report, two law enforcement officers were injured because they entered the suicide vehicles without adequate personal protective equipment or ventilation. Officers and other responders need to be informed about precautions they must take when responding to a potential chemical suicide. When initially arriving on the scene of a suspected chemical suicide, responders should assess the surroundings for
potential indicators (e.g., posted suicide or warning signs, open containers indicating the presence of household chemicals, and taped doors and windows) (4). Once a proper assessment of the scene has been made, responders should call for assistance from the local HazMat team or other responders who are trained to handle hazardous materials. In addition to assessing the surroundings, first responders can secure the area by ensuring nearby persons are safe and keeping ignition sources away (5,6). First responders always should protect themselves and follow appropriate HazMat guidelines (5,6) to address the situation.
The toxic gases most commonly formed by combining the chemicals in household cleaners are hydrogen sulfide and hydrogen cyanide (4). Hydrogen sulfide is a colorless, toxic gas. Its odor is often described as that of rotten eggs, but even a short exposure can cause olfactory fatigue (i.e., a temporary inability to smell the gas) (1,4). At low doses, exposure to hydrogen sulfide can cause eye and respiratory irritation, headache, dizziness, loss of appetite, and upset stomach (1,2,4). Brief exposures to high concentrations (>500 ppm) of hydrogen sulfide can cause loss of consciousness and death (7). Hydrogen cyanide is a bluish-white liquid or a colorless gas with a faint odor of bitter almonds and a bitter, burning taste (8,9). Hydrogen cyanide can cause changes in respiration depth, confusion, and asphyxia (4).
The findings in this report are subject to at least three limitations. First, because only a total of 15 states conducted surveillance at some time during 2006–2010 (in HSEES, NTSIP, or in both programs), the data might not be generalizable to the entire United States. Second, the number of chemical-assisted suicides described likely is an underestimate because some suicides might not have been reported or might have been missed by the query method of key word searches. Finally, the small number of incidents identified by ATSDR complicates evaluation of chemical suicide trends in the United States.
When handling chemically contaminated victims, safety precautions must be taken to prevent secondary contamination via transfer of hazardous materials (e.g., off-gassing) from victims to bystanders or emergency responders (10). Both victims and responders should be decontaminated at the scene to prevent further chemical-related injuries (4). Additionally, the transport vehicle needs to be well ventilated to protect from accumulation of poison off-gassing from the victim (6,7). Additional measures include warning hospital personnel of the potential for exposure and calling in the local HazMat team. Wearing the appropriate protective gear, the local HazMat team can assist with decontamination and preventing the chemical release from spreading (Box).
What is already known on this topic?
Mixing household chemicals to create lethal levels of toxic gas in a confined space became a popular method of suicide in Japan, and similar suicides have been reported by the news media in the United States; however, little data have been collected systematically.
What is added by this report?
Surveillance data from 15 states during 2006–2010 identified 10 incidents of chemical suicides in automobiles, resulting in nine deaths to suicide victims and four injuries to law enforcement officers.
What are the implications for public health practice?
First responders, health-care providers, and others who might encounter chemical suicides or attempted suicides should be able to recognize them. Protective measures should be used in these situations to prevent injury or death among responders and bystanders.
§ Available at http://www.cdc.gov/ncipc/wisqars/default.htm. ¶ Available at http://www.cdc.gov/violenceprevention/suicide/index.html. ** Additional information available at http://www.suicidepreventionlifeline.org/
default.aspx.
Morbidity and Mortality Weekly Report
1192 MMWR / September 9, 2011 / Vol. 60 / No. 35
7. Agency for Toxic Substances and Disease Registry. Toxic substance portal: medical management guidelines for hydrogen sulfide. Atlanta, GA: Agency for Toxic Substances and Disease Registry; 2011. Available at http://www.atsdr.cdc.gov/mmg/mmg.asp?id=385&tid=67. Accessed September 1, 2011.
8. National Institute for Occupational and Safety Health. NIOSH pocket guide to chemical hazards. Atlanta, GA: US Department of Health and Human Services, CDC, National Institute for Occupational and Safety Health; 2009. Available at http://www.cdc.gov/niosh/npg/npgd0337.html. Accessed September 2, 2011.
9. Agency for Toxic Substances and Disease Registry. Toxic substance portal: hydrogen cyanide. Atlanta, GA: Agency for Toxic Substances and Disease Registry; 2011. Available at http://www.atsdr.cdc.gov/substances/toxsubstance.asp?toxid=249. Accessed September 2, 2011.
10. Horton DK, Berkowitz Z, Kaye WE. Secondary contamination of ED personnel from hazardous materials events, 1995–2001. Am J Emerg Med 2003;21:199–204.
References 1. Morii D, Miyagatani Y, Nakamae N, Murao M, Taniyama K. Japanese
experience of hydrogen sulfide: the suicide craze in 2008. J Occup Med Toxicol 2010;5:28.
2. Truscott A. Suicide fad threatens neighbours, rescuers. CMAJ 2008;179:312–3.
3. Reedy SJ, Schwartz MD, Morgan BW. Suicide fads: frequency and characteristics of hydrogen sulfide suicides in the United States. West J Emerg Med 2011;12:300–4.
4. National Hazardous Materials Fusion Center. Chemical assisted suicide: responder information. Available at http://www.mass.gov/Eeops/docs/dfs/mfa/hazmat_training/chemical_assisted_suicide_responder_info.pdf. Accessed September 1, 2011.
5. US Fire Administration. Hazardous guidelines for first responders. Emmitsburg, MD: Federal Emergency Management Agency, US Fire Administration; 1998.
6. US Department of Transportation. 2008 emergency response guidebook. Washington, DC: US Department of Transportation; 2008.
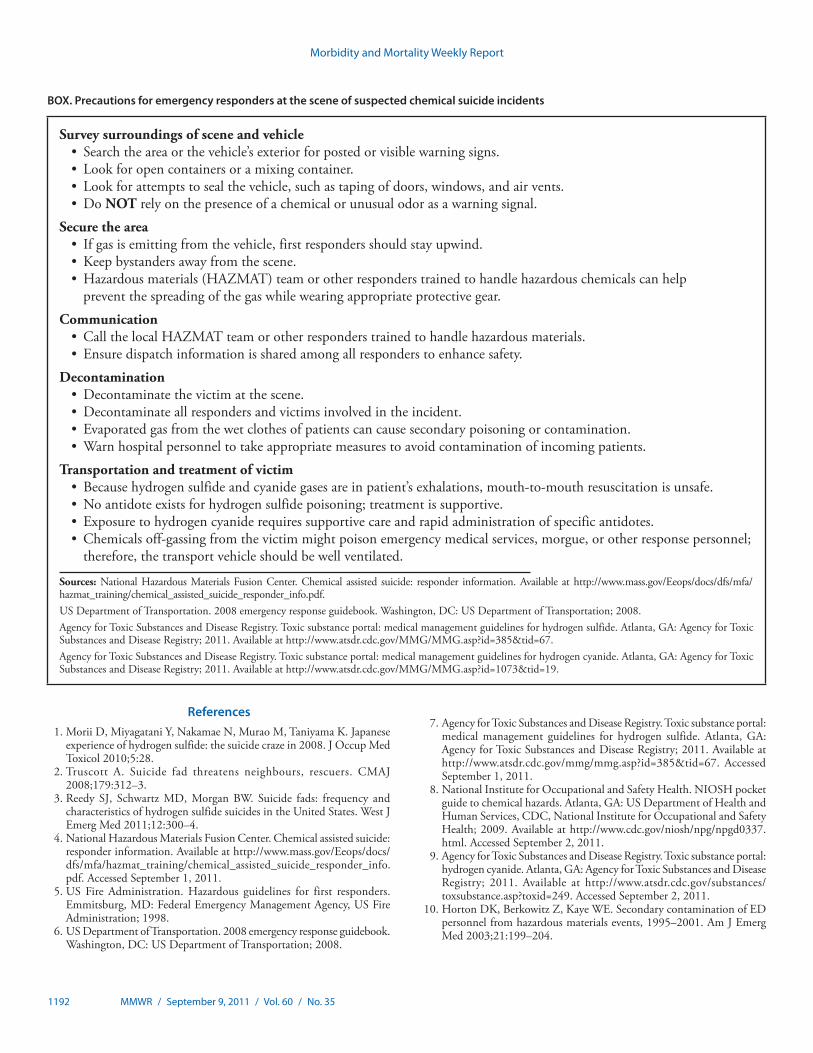
BOX. Precautions for emergency responders at the scene of suspected chemical suicide incidents
Survey surroundings of scene and vehicle • Search the area or the vehicle’s exterior for posted or visible warning signs. • Look for open containers or a mixing container. • Look for attempts to seal the vehicle, such as taping of doors, windows, and air vents. • Do NOT rely on the presence of a chemical or unusual odor as a warning signal.
Secure the area• Ifgasisemittingfromthevehicle,firstrespondersshouldstayupwind.• Keepbystandersawayfromthescene.• Hazardousmaterials(HAZMAT)teamorotherresponderstrainedtohandlehazardouschemicalscanhelp
prevent the spreading of the gas while wearing appropriate protective gear.
Communication • CallthelocalHAZMATteamorotherresponderstrainedtohandlehazardousmaterials.• Ensuredispatchinformationissharedamongallresponderstoenhancesafety.
Decontamination • Decontaminate the victim at the scene. • Decontaminate all responders and victims involved in the incident. • Evaporated gas from the wet clothes of patients can cause secondary poisoning or contamination. • Warn hospital personnel to take appropriate measures to avoid contamination of incoming patients.
Transportation and treatment of victim • Becausehydrogensulfideandcyanidegasesareinpatient’sexhalations,mouth-to-mouthresuscitationisunsafe.• No antidote exists for hydrogen sulfide poisoning; treatment is supportive. • Exposure to hydrogen cyanide requires supportive care and rapid administration of specific antidotes.• Chemicals off-gassing from the victim might poison emergency medical services, morgue, or other response personnel;
therefore, the transport vehicle should be well ventilated.
Sources: National Hazardous Materials Fusion Center. Chemical assisted suicide: responder information. Available at http://www.mass.gov/Eeops/docs/dfs/mfa/hazmat_training/chemical_assisted_suicide_responder_info.pdf. US Department of Transportation. 2008 emergency response guidebook. Washington, DC: US Department of Transportation; 2008. Agency for Toxic Substances and Disease Registry. Toxic substance portal: medical management guidelines for hydrogen sulfide. Atlanta, GA: Agency for Toxic Substances and Disease Registry; 2011. Available at http://www.atsdr.cdc.gov/MMG/MMG.asp?id=385&tid=67. Agency for Toxic Substances and Disease Registry. Toxic substance portal: medical management guidelines for hydrogen cyanide. Atlanta, GA: Agency for Toxic Substances and Disease Registry; 2011. Available at http://www.atsdr.cdc.gov/MMG/MMG.asp?id=1073&tid=19.

Morbidity and Mortality Weekly Report
MMWR / September 9, 2011 / Vol. 60 / No. 35 1193
Pregnant women with influenza are at increased risk for hospitalization and death (1,2). Since 2004, the Advisory Committee on Immunization Practices (ACIP) has recommended inactivated influenza vaccine for all women who are pregnant during influenza season, regardless of trimester (3). Nonetheless, after the 2004 recommendation, estimated annual influenza vaccination coverage among pregnant women was approximately 15%, before increasing to nearly 50% during the 2009 influenza A (H1N1) pandemic (4). Since April 2009, CDC has collaborated with state and local health departments to conduct enhanced surveillance for severe influenza among pregnant and postpartum women. To assess maternal and infant outcomes among severely ill pregnant and postpartum women with 2009 H1N1 during the 2009 H1N1 pandemic, CDC analyzed data for the period April 15, 2009 to August 10, 2010. This report summarizes the results of that analysis, which found that, among 347 severely ill pregnant women, 75 died from 2009 H1N1, and 272 were admitted to an intensive-care unit (ICU) and survived. Women who survived received antiviral treatment sooner after symptom onset than women who died. Pregnant women with severe influenza who delivered during their influenza hospitalization were more likely to deliver preterm and low birth weight infants than those in the general U.S. population; infants born after their mother’s influenza hospitalization discharge were more likely to be small for gestational age. These data document the severe effects of 2009 H1N1 on pregnant women and their infants, emphasize the importance of vaccinating pregnant women against influenza (3,5), and demonstrate the value of prompt administration of antivirals to pregnant women with suspected or confirmed influenza (5,6).
CDC initially requested reporting of all pregnant women with influenza illness who had been reported to state/local health departments with illness onset from April 15, 2009, to August 21, 2009. In October 2009, CDC established the CDC Pregnancy Flu Line as a dedicated, ongoing mechanism for reporting severely ill pregnant and postpartum women with onset during August 21, 2009–August 10, 2010. Surveillance data with illness onset from April 15, 2009, to December 31, 2009, and reported to CDC by January 31, 2010, were reported previously (2). Health departments used existing public health surveillance infrastructure to identify women who were pregnant or postpartum (≤6 weeks) at illness onset, were admitted to an ICU or died, and had laboratory-confirmed
influenza as defined by a positive rapid influenza diagnostic test, real-time reverse transcriptase–polymerase chain reaction, or viral culture. Requested data included demographic and clinical information on infected pregnant women and, for the Flu Line, their newborns. The initial CDC data request elicited responses from 50 of the 53 state and local health departments contacted; the Flu Line received responses from 50 states, three localities, and one territory. Flu Line staff members followed up on incomplete case reports until final outcomes were obtained for mother and infant, when possible. Surveillance mechanisms among states varied. Women were assumed to be infected with 2009 H1N1 when influenza type was not available, based on U.S. virologic surveillance data that suggested nearly all influenza activity during this time was 2009 H1N1 (2,7).
Although the initial data request included pregnant women who were not severely ill with influenza, the Flu Line only included severely ill women, and this analysis of the entire pandemic period (April 15, 2009–August 10, 2010) includes only women with severe illness (i.e., death or ICU admission). Similarly, because data on postpartum women were not requested as part of the initial data request, totals are reported separately for pregnant and postpartum women, and differences in categorical variables for the entire period are presented for pregnant women only. Demographic and clinical factors were compared using Fisher’s exact tests and corresponding p values. Small for gestational age was calculated by comparing the 2005 standard 10th percentiles for birth weight (8) to weight for gestational age at birth as reported in the Flu Line case report.
From April 15, 2009, to August 10, 2010, a total of 347 severely ill pregnant women, including 272 who were admitted to the ICU and survived and 75 pregnant women who died from 2009 H1N1, were reported to the surveillance systems. Fifteen severely ill postpartum women, including nine who died, also were reported.
Of the 307 pregnant women for whom information regarding the presence of underlying medical conditions was available, 153 (49.8%) had underlying conditions. Comparing pregnant women who died with those who were admitted to an ICU and survived, the women who died were significantly more likely to have underlying conditions (61.5%) than those who survived (46.7%) (p=0.04) (Table 1). The underlying conditions (generally indicated by checked boxes on the case
Maternal and Infant Outcomes Among Severely Ill Pregnant and Postpartum Women with 2009 Pandemic Influenza A (H1N1) — United States,
April 2009–August 2010

Morbidity and Mortality Weekly Report
1194 MMWR / September 9, 2011 / Vol. 60 / No. 35
report form) included asthma, pregestational/gestational diabetes, obesity, immune suppression, cancer, pregestational/gestational hypertension, hemoglobinopathy, and chronic lung, autoimmune, neurologic, renal, thyroid, and cardiovascular diseases. No statistically significant differences between the women who died and the ICU survivors were observed by age, race, or trimester of illness onset.
Among women who died, 86.1% received antiviral treatment with a neuraminidase inhibitor, compared with 94.8% of women who survived (p=0.02) (Table 1). Treatment timing was significantly different for women who died, compared with those who survived (p<0.01); only four (7.0%) of the pregnant women who died received treatment with a neuraminidase
inhibitor within 2 days of illness onset, compared with 76 (40.6%) of the women who survived. The Flu Line requested reports of any severe influenza illness with onset after August 21, 2009; however, the first shipments of 2009 H1N1 vaccine did not occur until approximately 2 months after this date, and only 105 (48%) of the 218 Flu Line reports included vaccination status. Of the 105, three women who were admitted to an ICU reported receiving the 2009 H1N1 vaccine at least 2 weeks before onset of illness; none of the women who died were reported to have received the 2009 H1N1 vaccine.
Data on pregnancy outcomes were requested for Flu Line reports only, and pregnancy outcome data were available for 168 (77%) of the 218 Flu Line reports. Of the 168
TABLE 1. Characteristics of pregnant women with 2009 pandemic influenza A (H1N1) severe illness (i.e., ICU admission or death) — United States, April 15, 2009–August 10, 2010
Characteristic
Died (n = 75) Admitted to ICU and survived (n = 272)
p valueNo. (%) No. (%)
Maternal age (yrs)Mean age at illness onset (range) 26.9 (18–43) — 25.9 (16–43) — 0.17*Unknown/Missing 1 — 13 —
Race/Ethnicity 0.89†
White, non-Hispanic 21 (35.6) 88 (36.8)Black, non-Hispanic 12 (20.3) 44 (18.4)Hispanic 20 (33.9) 88 (36.8)Other race 6 (10.2) 19 (8.0)Missing 16 33
Trimester at symptom onset 0.23†
First trimester (0–13 wks) 5 (6.9) 16 (6.5)Second trimester (14–28 wks) 22 (30.6) 103 (41.7)Third trimester (≥29 wks) 45 (62.5) 128 (51.8)Unknown/Missing 3 25
Underlying illness/condition 0.04†
None of the following underlying conditions 25 (38.5) 129 (53.3)Any of the following underlying conditions 40 (61.5) 113 (46.7)Asthma 22 55Obesity 19 39Diabetes (gestational or pregestational) 11 16Other medical conditions§ 19 40Unknown/Missing 10 30
Antiviral medication prescribed 0.02†
No neuraminidase antiviral treatment 10 (13.9) 13 (5.2)Any neuraminidase antiviral treatment¶ 62 (86.1) 238 (94.8)Unknown/Missing 3 21
Total 75 100.0 272 100.0Days from symptom onset until treatment** <0.01†
≤2 4 (7.0) 76 (40.6)3–4 11 (19.3) 47 (25.1)>4 42 (73.7) 64 (34.2)Unknown/Missing 8 72
Total 65 100.0 259 100.0
Abbreviation: ICU = intensive-care unit. * t-test used to assess difference in means between deaths versus ICU admissions. † Fisher’s exact test used to assess differences in proportions for deaths versus ICU admissions. § Including immune suppression, cancer, pregestational/gestational hypertension, hemoglobinopathy, and chronic lung, autoimmune, neurologic, renal, thyroid,
and cardiovascular diseases. ¶ Includes only treatment with a neuraminidase inhibitor (oseltamivir or zanamivir).** Excludes women who received no neuraminidase antiviral treatment.

Morbidity and Mortality Weekly Report
MMWR / September 9, 2011 / Vol. 60 / No. 35 1195
pregnancy outcomes, 148 (88%) were live births, 11 (7%) were spontaneous abortions, seven (4%) were fetal deaths, one was an ectopic pregnancy, and one was a 15-week elective abortion secondary to intrauterine growth restriction. Among 85 liveborn singleton infants born during their mothers’ hospitalization for influenza, 63.6% were born preterm or very preterm (<37 weeks gestation), 4.1% were small for gestational age; 43.8% had low birth weight, 69.4% were admitted to the neonatal intensive care unit, and 29.2% had a low 5-minute Apgar score (defined as ≤6) (Table 2). Of 54 liveborn singleton infants born 5–187 days (median: 85 days) after their mother’s discharge from influenza hospitalization, 20.8% were born preterm, 25.0% were small for gestational age, 19.2% had low birth weight, 22.0% were admitted to the neonatal intensive care unit, and 2.0% had a low 5-minute Apgar score (Table 2).
Reported by
Kimberly Newsome, MPH, Jennifer Williams, MSN, Shannon Way, MPH, Margaret Honein, PhD, Holly Hill, MD, National
Center on Birth Defects and Developmental Disabilities; Sonja Rasmussen, MD, Influenza Coordination Unit, Anne F McIntyre, PhD, Lyn Finelli, DrPH, National Center for Immunization and Respiratory Diseases; Denise Jamieson, MD, William Callaghan, MD, Marianne Zotti, DrPH, National Center for Chronic Disease Prevention and Health Promotion, CDC. Corresponding contributor: Kimberly Newsome, [email protected].
Editorial Note
These data underscore the severe effects of influenza on pregnant women and their infants. Although previous reports have noted similar maternal findings, national influenza pandemic pregnancy data have heretofore not included infant outcomes. Among women who delivered while hospitalized for influenza, 63.6% delivered preterm or very preterm and 43.8% delivered low birth weight infants compared with U.S. averages of 12.3% for preterm birth and 8.2% for low birth weight (9). Similarly, 25.0% of infants born after their mothers’
TABLE 2. Outcomes for live births to pregnant women with 2009 pandemic influenza A (H1N1) severe illness (i.e., ICU admission or death) — United States, April 15, 2009–August 10, 2010
Outcome
Delivery during maternal hospitalization for 2009 H1N1 illness
Delivery after discharge from 2009 H1N1 illness hospitalization
Estimated % in U.S. population No. (%) No. (%)
Gestational age at delivery (wks)Very preterm (<32) 17 (22.1) 0 —Preterm (32–36) 32 (41.6) 10 (20.8)Very preterm and preterm (<37) 49 (63.6; CI = 51.8–74.3) 10 (20.8; CI = 10.5–35.0) 12.3*Term (≥37) 28 (36.4) 38 (79.2) Unknown/Missing 8 — 6 —
Small for gestational age≤10th centile for gestational age† 3 (4.1; CI = 0.0–11.5) 13 (25.0; CI = 14.0–39.0) 10.0† >10th centile for gestational age 70 (95.9) 39 (75.0) Unknown/Missing 12 — 2 —
Birthweight (g)Low (<2,500) 32 (43.8; CI = 32.2 –56.0) 10 (19.2; CI = 9.6–32.5) 8.2*Normal (≥2,500) 41 (56.2) 42 (80.8)Unknown/Missing 12 — 2 —
Admission to neonatal ICUNo admission 22 (30.6) 39 (78.0)Admission 50 (69.4; CI = 57.5–79.8) 11 (22.0; CI = 11.5–36.0) 6.1§
Unknown/Missing 13 — 4 —5-minute Apgar scores
Low (≤6) 21 (29.2; CI = 19.1–41.1) 1 (2.0; CI = 0.1–10.7) 1.6¶
Normal (>6) 51 (70.8) 49 (98.0)Unknown/Missing 13 — 4 —
Total 85** 100.0 54** 100.0
Abbreviations: ICU = intensive-care unit; CI = 95% confidence interval. * Information available at http://www.cdc.gov/nchs/data/nvsr/nvsr59/nvsr59_03.pdf. † As defined by the 2005 natality file. Available at http://www.cdc.gov/nchs/births.htm. § Information available at http://www.cdc.gov/nchs/data/nvsr/nvsr58/nvsr58_05.pdf. ¶ Information available at http://www.cdc.gov/nchs/data/nvsr/nvsr58/nvsr58_24.pdf. ** Total cases reported to the Flu Line (after August 21, 2009) where singleton live birth (multiples excluded) was known and outcome and delivery timing were
known (four live births were missing delivery timing with regard to mother’s influenza hospitalization); infant data were not requested for mothers with symptom onset on or before August 21, 2009.

Morbidity and Mortality Weekly Report
1196 MMWR / September 9, 2011 / Vol. 60 / No. 35
influenza hospitalization discharge were small for gestational age, compared with 10.0% of the general population (8).
The findings in this report are subject to at least four limitations. First, reporting requirements and case identification are not standardized across states and localities. Second, since August 2009, CDC has only collected and this report is only presenting data on severely ill pregnant women, and this analysis is not representative of the burden of influenza illness among all pregnant women. Third, because many women do not know they are pregnant early in pregnancy, illness in the first trimester might be more likely to be underreported. Finally, 49.8% of the pregnant women had underlying medical conditions in addition to severe influenza; although the presence of an underlying medical condition is common among reproductive-aged women (e.g., 34% of reproductive aged women in the United States are obese) (10), the degree to which adverse infant outcomes can be attributed to 2009 H1N1 or to the underlying conditions is unknown.
What is already known on this topic?
Based on data from seasonal influenza and the 2009 H1N1 pandemic, pregnant women are more severely affected with influenza than the general population. During the 2009 H1N1 pandemic, early treatment of pregnant women with antiviral medications was associated with fewer admissions to an intensive-care unit (ICU) and fewer deaths.
What is added by this report?
For the period April 15, 2009–August 10, 2010, CDC received reports on 347 severely ill pregnant women with 2009 H1N1 influenza, including 272 who were admitted to an ICU and survived and 75 who died. Consistent with earlier reports, prompt treatment (i.e., <2 days after onset) with recommended antiviral medications was associated with fewer deaths. Infants born during maternal hospitalization for influenza illness were more likely to be preterm and of lower birth weight than the general population, and infants born after their mothers had been discharged were more likely to be small for gestational age and of lower birth weight.
What are the implications for public health practice?
These data emphasize the importance of influenza vaccination for pregnant women, regardless of pregnancy trimester, and of prompt, empiric treatment with appropriate antiviral medications for pregnant women with suspected or confirmed influenza.
These data reaffirm recommendations that pregnant and postpartum women receive prompt, empiric treatment with antiviral medications for suspected or confirmed influenza (5,6). In addition, the severe impact of 2009 H1N1 influenza among pregnant women and their infants emphasizes the importance of prevention in this group. The cornerstone of influenza prevention among pregnant women remains promotion of influenza vaccination; ACIP recommends vaccination for women regardless of trimester (3). Despite this recommendation and the recent increase in influenza vaccination among pregnant women, coverage remains lower than optimal and increasing vaccination coverage in this group continues to be a key public health priority (5).
Acknowledgments
State and local health department staff members who collected data for CDC on maternal and infant outcomes among severely ill pregnant and postpartum women. Listing available at http://www.cdc.gov/ncbddd/birthdefects/acknowlegements.html.
References 1. Rasmussen SA, Jamieson DJ, Bresee JS. Pandemic influenza and pregnant
women. Emerg Infect Dis 2008;14:95–100. 2. Siston AM, Rasmussen SA, Honein MA, et al. Pandemic 2009 influenza
A (H1N1) virus illness among pregnant women in the United States. JAMA 2010;303:1517–25.
3. CDC. Prevention and control of influenza with vaccines: recommendations of the Advisory Committee on Immunization Practices (ACIP), 2010. MMWR 2010;59(No. RR-8).
4. CDC. Influenza vaccination coverage among pregnant women—United States, 2010–11 influenza season. MMWR 2011;60:1078–82.
5. Rasmussen SA, Kissin DM, Yeung LF, et al. Preparing for influenza after 2009 H1N1: special considerations for pregnant women and newborns. Am J Obstet Gynecol 2011;204:S13–20.
6. CDC. Antiviral agents for the treatment and chemoprophylaxis of influenza: recommendations of the Advisory Committee on Immunization Practices (ACIP). MMWR 2011;60(No. RR-1).
7. CDC. Seasonal influenza: FluView. Atlanta, GA: US Department of Health and Human Services, CDC; 2011. Available at http://www.cdc.gov/flu/weekly. Accessed September 6, 2011.
8. National Center for Health Statistics. User guide to the 2005 natality public use file. Hyattsville, MD: US Department of Health and Human Services, CDC, National Center for Health Statistics; 2005.
9. Hamilton BE, Martin JA, Ventura, MA. Births: preliminary data for 2009. Hyattsville, MD: US Department of Health and Human Services, CDC, National Center for Health Statistics; 2010. Available at http://www.cdc.gov/nchs/data/nvsr/nvsr59/nvsr59_03.pdf. Accessed September 2, 2010.
10. Flegal KM, Carroll MD, Ogden CL, Curtin LR. Prevalence and trends in obesity among US adults, 1999–2008. JAMA 2010;303:235–41.

Morbidity and Mortality Weekly Report
MMWR / September 9, 2011 / Vol. 60 / No. 35 1197
Surveillance for Foodborne Disease Outbreaks — United States, 2008
Foodborne agents cause an estimated 48 million illnesses annually in the United States, including 9.4 million illnesses from known pathogens (1,2). CDC collects data on foodborne disease outbreaks submitted from all states and territories through the Foodborne Disease Outbreak Surveillance System. During 2008, the most recent year for which data are finalized, 1,034 foodborne disease outbreaks were reported, which resulted in 23,152 cases of illness, 1,276 hospitalizations, and 22 deaths. Among the 479 outbreaks with a laboratory-confirmed single etiologic agent reported, norovirus was the most common, accounting for 49% of outbreaks and 46% of illnesses. Salmonella was the second most common, accounting for 23% of outbreaks and 31% of illnesses. Among the 218 outbreaks attributed to a food vehicle with ingredients from only one of 17 defined food commodities (3), the top commodities to which outbreaks were attributed were poultry (15%), beef (14%), and finfish (14%), whereas the top commodities to which outbreak-related illnesses were attributed were fruits and nuts (24%), vine-stalk vegetables (23%), and beef (13%). Outbreak surveillance provides insights into the agents that cause foodborne illness, types of implicated foods, and settings where transmission occurs. Public health, regulatory, and food industry professionals can use this information to target prevention efforts against pathogens and foods that cause the most foodborne disease outbreaks.
Since 1992, CDC has defined a foodborne disease outbreak as the occurrence of two or more similar illnesses resulting from ingestion of a common food. State, local, and territorial health department officials use a standard, Internet-based form to voluntarily submit reports of foodborne outbreaks to CDC. An online toolkit of clinical and laboratory information is available to support investigation and reporting of outbreaks.*
This report includes outbreaks in which the first illness occurred in 2008 and were reported to CDC by June 28, 2011. Data requested for each outbreak include the number of illnesses, hospitalizations, and deaths; the etiologic agent (confirmed or suspected†); the implicated food or foods; and the setting of food preparation and consumption. CDC classifies foods as one of 17 commodities if a single contaminated ingredient is identified or if all ingredients belong to that commodity (3). Outbreaks that could not be assigned to one of the 17 commodities, or for which the report
contained insufficient information for commodity assignment, were not attributed to any commodity. Population-based rates of reported outbreaks were calculated for each state, using U.S. Census estimates of the 2008 state populations.§
Public health officials from 47 states, the District of Columbia, and Puerto Rico reported 1,034 outbreaks; multistate outbreaks involving three additional states (Indiana, Mississippi, and Montana) were reported by CDC (Figure). The number (1,034) of outbreaks was 10% lower than the annual average reported (1,151) for 2003–2007, and the number of outbreak-related illnesses was 5% lower (23,152 versus 24,400) (Table 1). An average of 24 (range: 2–128) outbreaks were reported from each state or territory (Figure). The average rate was 0.53 (range: 0.06–2.20) outbreaks per 100,000 population.
Of the total number of outbreak-related foodborne illnesses, 1,276 (6%) resulted in hospitalization. Salmonella was the most common cause of outbreak-related hospitalizations, causing 62% of hospitalizations reported, followed by Shiga toxin–producing Escherichia coli (STEC) (17%) and norovirus (7%). Outbreaks caused by Clostridium botulinum resulted in the highest proportion of persons hospitalized (90%), followed by Listeria outbreaks (76%). Among the 22 deaths associated with foodborne disease outbreaks in 2008, 20 were attributed to bacterial etiologies (13 Salmonella, three Listeria monocytogenes, three STEC [two O157, one O111], one Staphylococcus), one to norovirus, and one to a mycotoxin.
A single confirmed or suspected etiologic agent was identified in 666 (64%) outbreaks (479 confirmed, 187 suspected) (Table 1). Among the 479 outbreaks with a single confirmed etiologic agent, viruses caused 234 (49%) outbreaks, bacteria caused 212 (44%) outbreaks, chemicals and toxins caused 27 (6%) outbreaks, and parasites caused six (1%) outbreaks. Norovirus was the most common cause of outbreaks and illnesses, accounting for 233 (49%) of the confirmed, single-etiology outbreaks and 7,235 (46%) illnesses. Salmonella was the second most common etiologic agent, causing 110 (23%) confirmed, single-etiology outbreaks and 52% of those caused by bacteria. Among the 108 Salmonella outbreaks with a serotype reported, Enteritidis was the most common serotype, causing 29 (27%) confirmed, single-etiology outbreaks. STEC caused 36 (8%) confirmed, single-etiology outbreaks, of which 35 were caused by serogroup O157.
* The reporting form is available at http://www.cdc.gov/outbreaknet/nors; the toolkit is available at http://www.cdc.gov/outbreaknet/references_resources.
† Definitions are available at http://www.cdc.gov/outbreaknet/references_resources/guide_confirming_diagnosis.html.
§ Available at http://www.census.gov/popest/datasets.html.

Morbidity and Mortality Weekly Report
1198 MMWR / September 9, 2011 / Vol. 60 / No. 35
A food vehicle was reported for 481 (47%) outbreaks, among which the food vehicle could be assigned to one of the 17 commodities in 218 (45%) of the outbreaks (Table 2). The commodities most commonly implicated were poultry (32 outbreaks), beef (31), and finfish (30). The commodities associated with the most outbreak-related illnesses were fruits-nuts (1,755 illnesses), vine-stalk vegetables (1,622), and beef (952). The pathogen-commodity pairs responsible
for the most outbreaks were norovirus in leafy vegetables (18 outbreaks), ciguatoxin in finfish (14), STEC O157 in beef (12), and Salmonella in poultry (11). The pathogen-commodity pairs responsible for the most outbreak-related illnesses were Salmonella in vine-stalk vegetables (1,604 illnesses) and Salmonella in fruits-nuts (1,401).
Seventeen multistate outbreaks (i.e., outbreaks in which the exposure occurred in more than one state) were reported.
FIGURE. Rate of reported foodborne disease outbreaks per 100,000 population* and number of outbreaks,† by affected states and major etiology group§ — Foodborne Disease Outbreak Surveillance System, United States, 2008
* Cutpoints for outbreak rate categories determined using Jenks Natural Breaks Optimization in ArcGIS. Legend differs for each etiology.† Number of reported outbreaks in each state.§ Analysis restricted to outbreaks caused by a single confirmed or suspected etiology. ¶ Includes 17 multistate outbreaks that are assigned as an outbreak to each state involved.
All outbreaks (N = 1,206)¶
0.97–2.20
0.54–0.96
0.30–0.53
0.17–0.29
0.06–0.16
48
33
39
77 94
8
65
6 6226
43
5
47 16
148
8
89
27
26
736
3
3
2
2
11
7
9
128
20
78
57
25
296
7
10
44
15
27
715
144
178
0.16–0.31
0.06–0.15
0.03–0.05
0.003–0.02
No reports
Chemical and toxin (N = 36)
21
5
1
1
1
5
1
11
1 21
411
1
2
0.54–0.87
0.30–0.53
0.17–0.29
0.10–0.16
0.02–0.09
Bacterial (N = 449)¶
512
17
4 1812
75
6 11
57
8
10
25
15
126
9
22
3
3
11
2316
4
4
14
5
7
14
3
7
40
2
12
37
4
48
4 10
2
4
6
2
2
2
15
0.28–0.82
0.19–0.27
0.09–0.18
0.01–0.08
No reports
Viral (N = 355)
3
18
118
26
1 4310
6
2
18
13
11
13
6
12
15
26
4
2813
1
15
1
5 2
3
12
9
42
10
3
1
3

Morbidity and Mortality Weekly Report
MMWR / September 9, 2011 / Vol. 60 / No. 35 1199
TABLE 1. Number and percentage of reported foodborne outbreaks and outbreak-associated illnesses, by etiology* — Foodborne Disease Outbreak Surveillance System, United States, 2008, and 2003–2007 mean annual totals
Etiology
Outbreaks Illnesses Hospitalizations
2008 2003–2007 2008 2003–2007 2008 2003–2007
CE SE
TotalMean annual
total†
CE SE
TotalMean annual
total†
CE SE
TotalMean annual
total†
No (%) No. (%) No. (%) No. (%) No. (%) No. (%)
Bacterial Salmonella§ 110 7 117 (18) 129 (17) 4,883 77 4,960 (27) 3,290 (17) 791 6 797 (66) 369 (49)Clostridium perfringens 21 19 40 (6) 44 (6) 965 444 1,409 (8) 1,815 (9) 3 1 4 (<1) 12 (2)Escherichia coli, Shiga
toxin–producing (STEC)¶36 — 36 (5) 27 (4) 920 — 920 (5) 402 (2) 214 — 214 (18) 115 (15)
Campylobacter** 21 4 25 (4) 22 (3) 604 11 615 (3) 623 (3) 20 5 25 (2) 13 (2)Bacillus cereus 3 12 15 (2) 18 (2) 73 49 122 (1) 138 (1) — 1 1 (<1) — (0)Staphylococcus
enterotoxin††6 8 14 (2) 35 (5) 257 54 311 (2) 472 (2) 12 — 12 (1) 20 (3)
Shigella§§ 6 — 6 (1) 11 (1) 170 — 170 (1) 500 (3) 4 — 4 (<1) 12 (2)Clostridium botulinum 4 — 4 (1) 3 (<1) 10 — 10 (<1) 10 (<1) 9 — 9 (1) 8 (1)Other bacterial 1 2 3 (<1) 15 (2) 64 24 88 (<1) 117 (1) — — — (0) 1 (<1)Listeria¶¶ 3 — 3 (<1) 2 (<1) 33 — 33 (<1) 13 (<1) 25 — 25 (2) 11 (1)Vibrio parahaemolyticus 1 — 1 (<1) 5 (1) 2 — 2 (<1) 109 (1) — — — (0) 1 (<1)Vibrio other — 1 1 (<1) 1 (<1) — 3 3 (<1) 2 (<1) — — — (0) — (0)Escherichia coli,
enterotoxigenic— — — (0) 2 (<1) — — — (0) 125 (1) — — — (0) 1 (<1)
Brucella sp. — — — (0) 1 (<1) — — — (0) 2 (<1) — — — (0) 1 (<1)Yersinia enterocolitica — — — (0) 1 (<1) — — — (0) 3 (<1) — — — (0) 1 (<1)
Total 212 53 265 (40) 316 (41) 7,981 662 8,643 (47) 7,623 (40) 1,078 13 1,091 (91) 566 (75)
Chemical and toxin Scombroid toxin/histamine 10 2 12 (2) 31 (4) 51 4 55 (<1) 125 (1) 1 — 1 (<1) 4 (1)Ciguatoxin 11 3 14 (2) 12 (2) 60 21 81 (<1) 51 (<1) — — — (0) 8 (1)Cleaning agents — 3 3 (<1) — (0) — 14 14 (<1) 1 (<1) — — — (0) — (0)Heavy metals 2 — 2 (<1) 1 (<1) 54 — 54 (<1) 4 (<1) — — — (0) — (0)Other chemical 1 1 2 (<1) 12 (2) 39 3 42 (<1) 147 (1) — 2 2 (<1) 7 (1)Mycotoxins 1 — 1 (<1) 2 (<1) 3 — 3 (<1) 18 (<1) 3 — 3 (<1) 8 (1)Paralytic shellfish poison 1 — 1 (<1) 1 (<1) 3 — 3 (<1) 2 (<1) 3 — 3 (<1) 2 (<1)Plant/herbal toxins 1 — 1 (<1) — (0) 6 — 6 (<1) 3 (<1) 6 — 6 (<1) — (0)Neurotoxic shellfish poison — — — (0) 1 (<1) — — — (0) 4 (<1) — — — (0) 2 (<1)Puffer fish tetrodotoxin — — — (0) — (0) — — — (0) 1 (<1) — — — (0) 1 (<1)Other natural toxins — — — (0) 1 (<1) — — — (0) 4 (<1) — — — (0) 1 (<1)
Total 27 9 36 (5) 63 (8) 216 42 258 (1) 361 (2) 13 2 15 (1) 33 (4)
Parasitic Cyclospora 3 — 3 (<1) 2 (<1) 66 — 66 (<1) 185 (1) 2 — 2 (<1) — (0)Cryptosporidium 2 — 2 (<1) 2 (<1) 32 — 32 (<1) 39 (<1) — — — (0) 1 (<1)Giardia 1 — 1 (<1) 2 (<1) 8 — 8 (<1) 44 (<1) — — — (0) — (0)Trichinella — — — (0) 1 (<1) — — — (0) 1 (<1) — — — (0) — (0)Other parasitic — — — (0) — (0) — — — (0) 4 (<1) — — — (0) — (0)
Total 6 — 6 (1) 7 (1) 106 — 106 (1) 273 (1) 2 — 2 (<1) 3 (<1)
Viral Norovirus 233 123 356 (54) 376 (49) 7,235 1,940 9,175 (50) 10,534 (55) 70 20 90 (7) 117 (15)Hepatitis A 1 — 1 (<1) 5 (1) 22 — 22 (<1) 234 (1) 4 — 4 (<1) 37 (5)Rotavirus — 1 1 (<1) 1 (<1) — 27 27 (<1) 17 (<1) — — — (0) — (0)Other viral — 1 1 (<1) 3 (<1) — 9 9 (<1) 126 (1) — — — (0) 3 (<1)
Total 234 125 359 (54) 385 (50) 7,257 1,976 9,233 (51) 10,911 (57) 74 20 94 (8) 158 (21)
Known etiology*** 479 187 666 (64) 771 (67) 15,560 2,680 18,240 (79) 19,167 (79) 1,167 35 1,202 (94) 759 (88)Unknown etiology††† — — 350 (34) 344 (30) — — 4,262 (18) 4,379 (18) — — 40 (3) 50 (6)Multiple etiologies 11 7 18 (2) 36 (3) 540 110 650 (3) 854 (3) 33 1 34 (3) 52 (6)Total 490 194 1,034 (100) 1,151 (100) 16,100 2,790 23,152 (100) 24,400 (100) 1,200 36 1,276 (100) 861 (100)
Abbreviations: CE = confirmed etiology, SE = suspected etiology. * If at least one etiology was laboratory-confirmed, the outbreak was considered to have a confirmed etiology. If no etiology was laboratory-confirmed, but an etiology was reported based
on clinical or epidemiologic features, the outbreak was considered to have a suspected etiology. † Because of rounding, numbers might not add up to the etiology category total or the known etiology total. § Salmonella serotypes accounting for more than five reported outbreaks include: Enteriditis (30 outbreaks), Typhimurium (18), Heidelberg (eight), and Braenderup (six). ¶ STEC O111 (one confirmed outbreak), STEC O157:H7 (32 confirmed outbreaks), and STEC O157:NM(H-) (three confirmed outbreaks). ** Campylobacter coli (one confirmed outbreak, no suspected outbreaks), Campylobacter jejuni (15 confirmed outbreaks, four suspected outbreaks). †† Staphylococcus aureus (six confirmed outbreaks, five suspected outbreaks) and Staphylococcus unknown (three suspected outbreaks). §§ Shigella sonnei (six confirmed outbreaks, no suspected outbreaks). ¶¶ Listeria monocytogenes (three confirmed outbreaks, no suspected outbreaks). *** The denominator for the etiology percentages is the known etiology total. The denominator for the known etiology, unknown etiology, and multiple etiologies percentages is the total. ††† An etiologic agent was not confirmed or suspected based on clinical, laboratory, or epidemiologic information.

Morbidity and Mortality Weekly Report
1200 MMWR / September 9, 2011 / Vol. 60 / No. 35
Multistate outbreaks involved a median of seven (range: 2–46) states. Nine were caused by Salmonella. The etiologic agent was isolated from an implicated food in six of these outbreaks. The foods in these six outbreaks were cantaloupe, cereal, ground turkey, ground white pepper, jalapeño and serrano peppers (4), and peanut butter and peanut paste (5). Six multistate
outbreaks were caused by STEC O157; STEC was isolated from ground beef in two outbreaks. Two multistate outbreaks were caused by Listeria. One outbreak was caused by Listeria in Mexican-style cheese made from pasteurized milk, the other by Listeria in sprouts.
TABLE 2. Number of reported foodborne disease outbreaks and outbreak-associated illnesses, by etiology* and food commodity — Foodborne Disease Outbreak Surveillance System, United States, 2008
Etiology
Outbreaks (illnesses)
Attributed to a single commodity
Attributed to food vehicle containing >1 commodity
Attributed to unknown commodity Total
BacterialSalmonella† 40 (3,690) 24 (734) 53 (536) 117 (4,960)Clostridium perfringens 20 (897) 12 (226) 8 (286) 40 (1,409)Escherichia coli, Shiga toxin–producing (STEC)§ 21 (427) 5 (98) 10 (395) 36 (920)Campylobacter¶ 17 (538) 2 (6) 6 (71) 25 (615)Bacillus cereus 7 (70) 7 (50) 1 (2) 15 (122)Staphylococcus enterotoxin** 3 (27) 8 (124) 3 (160) 14 (311)Shigella†† 0 (0) 0 (0) 6 (170) 6 (170)Clostridium botulinum 1 (2) 2 (6) 1 (2) 4 (10)Other bacterial 1 (64) 2 (24) 0 (0) 3 (88)Listeria§§ 2 (28) 1 (5) 0 (0) 3 (33)Vibrio parahaemolyticus 1 (2) 0 (0) 0 (0) 1 (2)Vibrio other 0 (0) 0 (0) 1 (3) 1 (3)
Total 113 (5,745) 63 (1,273) 89 (1,625) 265 (8,643)Chemical and toxin
Scombroid toxin/histamine 11 (53) 1 (2) 0 (0) 12 (55)Ciguatoxin 14 (81) 0 (0) 0 (0) 14 (81)Cleaning agents 0 (0) 1 (3) 2 (11) 3 (14)Heavy metals 0 (0) 1 (2) 1 (52) 2 (54)Other chemical 0 (0) 0 (0) 2 (42) 2 (42)Mycotoxins 1 (3) 0 (0) 0 (0) 1 (3)Paralytic shellfish poison 1 (3) 0 (0) 0 (0) 1 (3)Plant/herbal toxins 1 (6) 0 (0) 0 (0) 1 (6)
Total 28 (146) 3 (7) 5 (105) 36 (258)Parasitic
Cyclospora 3 (66) 0 (0) 0 (0) 3 (66)Cryptosporidium 0 (0) 0 (0) 2 (32) 2 (32)Giardia 0 (0) 0 (0) 1 (8) 1 (8)
Total 3 (66) 0 (0) 3 (40) 6 (106)Viral
Norovirus 35 (618) 94 (2,484) 227 (6,073) 356 (9,175)Hepatitis A 1 (22) 0 (0) 0 (0) 1 (22)Rotavirus 0 (0) 1 (27) 0 (0) 1 (27)Other viral 0 (0) 0 (0) 1 (9) 1 (9)
Total 36 (640) 95 (2,511) 228 (6,082) 359 (9,233)Known etiology¶¶ 180 (6,575) 161 (3,791) 325 (7,852) 666 (18,240)Unknown etiology*** 33 (409) 67 (577) 250 (3,276) 350 (4,262)Multiple etiologies 5 (193) 9 (202) 4 (255) 18 (650)Total 218 (7,177) 237 (4,570) 579 (11,383) 1,034 (23,152)
* If at least one etiology was laboratory-confirmed, the outbreak was considered to have a confirmed etiology. If no etiology was laboratory-confirmed, but an etiology was reported based on clinical or epidemiologic features, the outbreak was considered to have a suspected etiology.
† Salmonella serotypes accounting for more than five reported outbreaks included: Enteriditis (30 outbreaks), Typhimurium (18), Heidelberg (eight), and Braenderup (six). § STEC O111 (one confirmed outbreak), STEC O157:H7 (32 confirmed outbreaks), and STEC O157:NM(H-) (three confirmed outbreaks). ¶ Campylobacter coli (one confirmed outbreak, no suspected outbreaks), Campylobacter jejuni (15 confirmed outbreaks, four suspected outbreaks). ** Staphylococcus aureus (six confirmed outbreaks, five suspected outbreaks) and Staphylococcus unknown (three suspected outbreaks). †† Shigella sonnei (six confirmed outbreaks, no suspected outbreaks). §§ Listeria monocytogenes (three confirmed outbreaks, no suspected outbreaks). ¶¶ The denominator for the etiology percentages is the known etiology total. The denominator for the known etiology, unknown etiology, and multiple etiologies
percentages is the total. *** An etiologic agent was not confirmed or suspected based on clinical, laboratory or epidemiologic information.

Morbidity and Mortality Weekly Report
MMWR / September 9, 2011 / Vol. 60 / No. 35 1201
Among the 868 outbreaks with a known single setting where food was consumed, 52% resulted from food consumed in a restaurant or deli, 15% in a private home, and the remainder in other locations.¶ Among the 481 outbreaks for which a food vehicle was identified, 19 (4%) resulted in product recalls.** The recalled foods were beef (five outbreaks), dietary supplements (two), cantaloupe (two), alfalfa sprouts (two), and cereal, cheese, fish, jalapeño and serrano peppers, melon, pancakes, spices, and peanut butter and peanut paste (one each). One beef establishment had two product recalls (6).
Reported by
L. Hannah Gould, PhD, Amie L. Nisler, MPH, Karen M. Herman, MSPH, Dana J. Cole, DVM, PhD, Ian T. Williams, PhD, Barbara E. Mahon, MD, Patricia M. Griffin, MD, Div of Foodborne, Waterborne, and Environmental Diseases, National Center for Emerging and Zoonotic Infectious Diseases; Aron J. Hall, DVM, Div of Viral Diseases, National Center for Immunization and Respiratory Diseases, CDC. Corresponding contributor: L. Hannah Gould, [email protected], 404-639-3315.
Editorial Note
As for the previous 10 years, beef, poultry, and finfish were the commodities associated with the largest number of foodborne outbreaks. As a result of several large multistate outbreaks, vine-stalk vegetables, fruits-nuts, and beef were the commodities with the most outbreak-associated illnesses. The number of STEC O157 and Salmonella Enteritidis outbreaks in 2008 continued to exceed the Healthy People 2010 food safety objective to reduce outbreaks of infections caused by key foodborne bacteria (objective 10-2) (7). The 35 outbreaks caused by STEC O157 was more than triple the Healthy People 2010 target of 11, and the 29 outbreaks attributed to Salmonella serotype Enteritidis exceeded the target of 22 by nearly a third.
Salmonella was the leading cause of hospitalizations and deaths and the cause of more than half of the multistate outbreaks. Two of the most common foods implicated in outbreaks of Salmonella infections have been poultry and eggs or egg products; consequently, several U.S. food safety initiatives have been implemented since the 1960s to limit contamination of these commodities. Recent Food and Drug Administration safety initiatives include additional regulations to improve the safety of shell eggs that went into effect in 2010. In addition, new U.S. Department of Agriculture Food Safety
and Inspection Service performance standards lowered the allowable limit for Salmonella contamination of young chicken and turkey carcasses at processing plants, effective July 2011.††
Norovirus remained the leading cause of outbreaks and illnesses in 2008. Most norovirus outbreaks with an implicated food vehicle were attributed to foods containing more than one commodity; a specific food vehicle was reported in a lower proportion of norovirus outbreaks than in outbreaks attributed to other causes. In norovirus outbreaks caused by a single food commodity, produce commodities that typically are not cooked, (i.e., leafy vegetables), continued to be the leading commodities implicated. Many outbreaks result from contamination of food during preparation and service via unwashed or improperly washed hands of food workers who are shedding norovirus in their stools. This often results in contamination of more than one food item. Contaminated environmental surfaces and infected consumers also lead to transmission of norovirus in food service settings. Additionally, norovirus contamination can occur during food production and processing, resulting in widespread exposure.
The findings in this report are subject to at least four limitations. First, only a small proportion of foodborne illnesses reported each year are identified as associated with outbreaks. The extent to which the distributions of food vehicles and preparation and consumption settings implicated in foodborne disease outbreaks reflect the same sources of infection and settings of sporadic illnesses is difficult to determine (8).
What is already known about this topic?
Surveillance for foodborne disease outbreaks can identify opportunities to prevent and control foodborne diseases, which cause millions of illnesses in the United States each year.
What is added by this report?
Among the 1,034 foodborne disease outbreaks reported in 2008, most of the single, laboratory-confirmed agents of outbreak-associated illnesses were norovirus and Salmonella. The largest numbers of foodborne disease outbreaks were associated with beef, poultry, and fish, and the largest numbers of outbreak-associated illnesses were associated with vine-stalk vegetables, fruits-nuts, and beef.
What are the implications for public health practice?
Public health, regulatory, and food industry professionals can use surveillance data to target prevention efforts against pathogens and foods that cause the most foodborne disease outbreaks.
¶ Additional data on foodborne disease outbreaks and illnesses for the 17 commodity categories and by settings where food was consumed is available at http://www.cdc.gov/outbreaknet/surveillance_data.html.
** Additional information on product recalls is available at http://www.fda.gov/safety/recalls/default.htm and http://www.fsis.usda.gov/fsis_recalls/index.asp.
†† Egg safety final rule, available at http://www.fda.gov/food/foodsafety/product-specificinformation/eggsafety/eggsafetyactionplan/ucm170615.htm; and Food Safety and Inspection Service new performance standards for Salmonella and Campylobacter in young chicken and turkey slaughter establishments; new compliance guides, available at http://www.fsis.usda.gov/oppde/rdad/frpubs/2010-0029.pdf.

Morbidity and Mortality Weekly Report
1202 MMWR / September 9, 2011 / Vol. 60 / No. 35
Second, CDC’s outbreak surveillance database is dynamic; agencies can submit new reports and can change or delete previous reports as new information becomes available. Therefore, the results of this analysis might differ from those published earlier or subsequently. Third, many reported outbreaks had an unknown etiology, an unknown food vehicle, or both, and conclusions drawn from outbreaks with a confirmed or suspected etiology or food vehicle might not apply to outbreaks of unknown etiology or food source. Finally, because of variations in outbreak detection, investigation, and reporting, comparisons with previous years should be made with caution.
Ensuring adequate epidemiologic and regulatory investigative capacity at the state and federal levels is essential to identify outbreak sources and implement timely control measures (9). Public health, regulatory, and food industry professionals use foodborne outbreak surveillance data to target prevention efforts against pathogens and foods that cause the most foodborne disease outbreaks. Additional information on outbreaks, including the Foodborne Outbreak Online Database (FOOD), is available at http://www.cdc.gov/foodborneoutbreaks.
References 1. Scallan E, Hoekstra RM, Angulo FJ, et al. Foodborne illness acquired in
the United States—major pathogens. Emerg Infect Dis 2011;17:1–15. 2. Scallan E, Griffin PM, Angulo FJ, Tauxe RV, Hoekstra RM. Foodborne
illness acquired in the United States—unspecified agents. Emerg Infect Dis 2011;17:16–22.
3. Painter JA, Ayers T, Woodruff R, et al. Recipes for foodborne outbreaks: a scheme for categorizing and grouping implicated foods. Foodborne Pathog Dis 2009;6:1259–64.
4. Barton Behravesh C, Mody RK, Jungk J, et al. 2008 outbreak of Salmonella Saintpaul infections associated with raw produce. N Engl J Med 2011;364:918–27.
5. Cavallaro E, Date K, Medus C, et al. Salmonella Typhimurium infections associated with peanut products. N Engl J Med 2011;365:601–10.
6. CDC. Two multistate outbreaks of Shiga toxin–producing Escherichia coli infections linked to beef from a single slaughter facility—United States, 2008. MMWR 2010;59:557–60.
7. US Department of Health and Human Services. Food safety. Healthy people 2010 (midcourse review). Washington, DC: US Department of Health and Human Services; 2000. Available at http://www.healthypeople.gov/2010/data/midcourse/html/focusareas/fa10toc.htm. Accessed September 1, 2011.
8. CDC. Surveillance for foodborne disease outbreaks—United States, 2007. MMWR 2010;59:973–9.
9. CDC. Assessment of epidemiology capacity in state health departments—United States, 2009. MMWR 2009;58:1373–7.

Morbidity and Mortality Weekly Report
MMWR / September 9, 2011 / Vol. 60 / No. 35 1203
Respiratory Syncytial Virus — United States, July 2007–June 2011
Each year in the United States, an estimated 75,000–125,000 hospitalizations related to respiratory syncytial virus (RSV)occur among children aged <1 year, and RSV infection results in approximately 1.5 million outpatient visits among children aged <5 years (1,2). In the United States, RSV season begins in the fall, peaks in winter, and ends in the late winter and early spring (3). However, the exact timing and duration vary from year to year and by geographic region (4). To describe trends in RSV seasonality, data from the National Respiratory and Enteric Virus Surveillance System (NREVSS) were used to determine the onset, offset, and peak of the July 2010–June 2011 RSV season, and for an aggregate analysis of the four most recent RSV seasons (July 2007–June 2011). During 2010–11, excluding Florida, season onset occurred from mid-November to early January, and offset occurred from mid-March to late April across all 10 U.S. Department of Health and Human Services (HHS) regions. Florida is reported separately because it has an earlier onset and longer duration than the rest of the country (4). During the four seasons from 2007 through 2011, onset among the HHS regions excluding Florida ranged from mid-October to early January, and offset ranged from early February to early May. Information on national and regional patterns can be used by clinicians and public health officials to guide diagnostic testing during respiratory disease outbreaks and determine when to provide RSV immunoprophylaxis for children at high risk for serious complications (5).
NREVSS is a passive, laboratory-based surveillance system that monitors the circulation of RSV and other respiratory and enteric viruses. Participating laboratories report weekly to CDC the number of RSV tests and the proportion that are positive.* For consistency, analysis was restricted to results of antigen detection methods, which were used by 98% of participating laboratories during 2007–2011. Only laboratories that reported for ≥30 weeks during a season, with an average of ≥10 tests per week were included in these analyses. Onset, offset, and duration were calculated based on the percentage of positive RSV tests.† The onset, offset, and peak were calculated at the national level with and without Florida, and for Florida and each of the 10 HHS regions§ individually. Data from Florida,
part of HHS Region 4, were analyzed separately because the season can begin up to 3 months earlier in Florida than in the rest of the country (4).
During July 2010–June 2011, a total of 509 laboratories reported at least 1 week of RSV testing to NREVSS. Of these 509 laboratories, 179 (35.2%) from 42 states met inclusion criteria and reported a total of 320,751 tests, of which 50,860 (15.9%) were positive. National RSV onset occurred the week ending November 20, 2010, and lasted 21 weeks until the week ending April 9, 2011 (Table). The peak week occurred the week ending February 5, 2011. With data from Florida excluded from the analysis, the national RSV season onset occurred 1 week later (week ending November 27, 2010). Onset for the 10 HHS regions ranged from mid-November to early January, and season offset ranged from mid-March to late April. Median RSV season duration was 19 weeks (range: 13–22 weeks) (Table). Region 1 (Boston) had the shortest season, and Region 4 (Atlanta) had the longest season.
During the four reporting seasons from July 2007 to June 2011, the average number of laboratories that met inclusion criteria was 208 (range: 179–240). National RSV onset occurred from mid-October to mid-November, with the onset of each individual season within 3 weeks of the 4-season median (Figure). Offset occurred from mid-March to early April, with each season offset within 2 weeks of the median. National median season duration was 21 weeks (range: 19–22 weeks), and the median peak RSV week occurred in mid-January.
During the 4-season period, among the 10 HHS Regions excluding Florida, RSV season onset began as early as mid-October and lasted as late as early May. Each region had individual season onset and offset dates within 5 weeks on either side of the median onset and offset. The median seasonal durations ranged from 13 to 23 weeks, and median peak RSV activity occurred from mid-December to early February (Figure). In all regions, the most current RSV season (2010–11)
* Surveillance Data, Inc. (SDI), a private company that conducts RSV surveillance with support from MedImmune, Inc. (Gaithersburg, Maryland), also contributes laboratory data to NREVSS.
† As defined by NREVSS, RSV national and regional season onset is the first of 2 consecutive weeks during which the mean percentage of specimens testing positive for RSV antigen is ≥10%. RSV season offset is the last of 2 consecutive weeks during which the mean percentage of positive specimens is ≥10%. Season duration is the number of weeks between season onset and offset, and the peak is the week with the highest proportion of positive RSV tests.
§ The 10 HHS regions (listed by region number and location of the regional headquarters) are Region 1 (Boston): Connecticut, Maine, Massachusetts, New Hampshire, Rhode Island, and Vermont; Region 2 (New York): New Jersey and New York; Region 3 (Philadelphia): Delaware, District of Columbia, Maryland, Pennsylvania, Virginia, and West Virginia; Region 4 (Atlanta): Alabama, Georgia, Kentucky, Mississippi, North Carolina, South Carolina, and Tennessee; Region 5 (Chicago): Illinois, Indiana, Michigan, Minnesota, Ohio, and Wisconsin; Region 6 (Dallas): Arkansas, Louisiana, New Mexico, Oklahoma, and Texas; Region 7 (Kansas City): Iowa, Kansas, Missouri, and Nebraska; Region 8 (Denver): Colorado, Montana, North Dakota, South Dakota, Utah, and Wyoming; Region 9 (San Francisco): Arizona, California, Hawaii, and Nevada; and Region 10 (Seattle): Alaska, Idaho, Oregon, and Washington.

Morbidity and Mortality Weekly Report
1204 MMWR / September 9, 2011 / Vol. 60 / No. 35
TABLE. Summary of 2010–11 respiratory syncytial virus season, by U.S. Department of Health and Human Services Region and in Florida — National Respiratory and Enteric Virus Surveillance System, July 2010–June 2011
HHS Region or state States
2010–11 season
No. of laboratories reporting
Onset week ending
Offset week ending
Season duration (wks)
National All contributing states and DC 179 11/20 4/9 21National without FL All contributing states and DC without FL 157 11/27 4/9 20Florida FL 22 9/18 3/19 27Region 2 (New York) NJ, NY 16 11/13 3/19 19Region 4 (Atlanta)* AL, GA, KY, MS, NC, SC, TN 22 11/13 4/9 22Region 6 (Dallas) AR, LA, NM, OK, TX 26 11/27 3/26 18Region 9 (San Francisco) AZ, CA, HI, NV 25 11/27 4/2 19Region 3 (Philadelphia) DE, DC, MD, PA, VA, WV 17 11/27 4/16 21Region 1 (Boston) CT, ME, MA, NH, RI, VT 6 12/18 3/12 13Region 10 (Seattle) AK, ID, OR, WA 7 12/18 4/2 16Region 5 (Chicago) IL, IN, MI, MN, OH, WI 22 12/18 4/23 19Region 7 (Kansas City) IA, KS, MO, NE 8 1/1 4/9 15Region 8 (Denver) CO, MT, ND, SD, UT, WY 8 1/1 4/30 18
* Excludes data from Florida.
27 29 31 33 35 37 39 41 43 45 47 49 51 1 3 5 7 9 11 13 15 17 19 21 23 25
Jul Aug Sep Oct Nov Dec Jan Feb Mar Apr May Jun
Month and week
National
National without Florida
Region 2 (New York)
Region 6 (Dallas)
Region 4 (Atlanta)†
Florida
Region 9 (San Francisco)
Region 7 (Kansas City)
Region 3 (Philadelphia)
Region 10 (Seattle)
Region 1 (Boston)
Region 5 (Chicago)
Region 8 (Denver)
Onset range and median O�set range and medianMedian peak
FIGURE. Respiratory syncytial virus (RSV) season onset and offset range and median, by U.S. Department of Health and Human Services Region* and in Florida — National Respiratory and Enteric Virus Surveillance System, July 2007–June 2011
* Listed by region number and headquarters city. Region 1 (Boston): Connecticut, Maine, Massachusetts, New Hampshire, Rhode Island, and Vermont. Region 2 (New York): New Jersey and New York. Region 3 (Philadelphia): Delaware, District of Columbia, Maryland, Pennsylvania, Virginia, and West Virginia. Region 4 (Atlanta): Alabama, Georgia, Kentucky, Mississippi, North Carolina, South Carolina, and Tennessee. Region 5 (Chicago): Illinois, Indiana, Michigan, Minnesota, Ohio, and Wisconsin. Region 6 (Dallas): Arkansas, Louisiana, New Mexico, Oklahoma, and Texas. Region 7 (Kansas City): Iowa, Kansas, Missouri, and Nebraska. Region 8 (Denver): Colorado, Montana, North Dakota, South Dakota, Utah, and Wyoming. Region 9 (San Francisco): Arizona, California, Hawaii, and Nevada. Region 10 (Seattle): Alaska, Idaho, Oregon, and Washington. Idaho, Maine, New Mexico, and the District of Columbia did not have any participating laboratories in the four-season (2007–2011) analysis.
† Excludes data from Florida.

Morbidity and Mortality Weekly Report
MMWR / September 9, 2011 / Vol. 60 / No. 35 1205
onset and offset began during the same week or later than the onset during the first year of analysis (2007–08).
Weekly updates showing RSV national, regional, and state trends are available from the NREVSS website at http://www.cdc.gov/surveillance/nrevss. Additional information about Florida RSV trends is available from the Florida Department of Health website at http://www.doh.stat.fl.us/disease_ctrl/epi/rsv/rsv.htm.
Reported by
National Respiratory and Enteric Virus Surveillance System laboratories. Jeffry D. Mutuc, MPH, Gayle E. Langley, MD, Div of Viral Diseases, National Center for Immunization and Respiratory Diseases, CDC. Corresponding contributor: Jeffry D. Mutuc, [email protected], 404-639-2366.
Editorial Note
NREVSS data in this analysis were consistent with previously reported geographic differences in RSV seasonality (3,7); however, a narrow range of onset and offset dates was documented for most regions. Several factors might contribute to regional differences, including type of community (urban versus rural), population density, and weather patterns (6). Furthermore, although differences exist across regions within a given year, studies have shown variations in RSV activity reported by laboratories in the same region, even within short distances of one another (3,7,8). Comparisons between first and last years of analysis show a possible trend in later seasonal onset and offset dates. However, a progressively later onset and offset through the 4-season period was not consistent in all regions. Whether an actual change is occurring is unclear, and continued monitoring of RSV detections is necessary. Timely data are posted on the NREVSS website to alert health professionals and public health officials about the timing of the season.
NREVSS detections have been shown to correlate with RSV hospitalizations (9) and are a reliable measure for identifying RSV activity. Thus, surveillance data have been used to guide timing of RSV immunoprophylaxis with palivizumab. Palivizumab is a monoclonal anti-RSV antibody recommended to be administered as monthly injections during RSV season to children at high risk for severe RSV disease (i.e., select infants with congenital heart disease, chronic lung disease, or compromised immune systems, and those born prematurely) (10). The American Academy of Pediatrics provides guidelines for identifying infants and children likely to benefit from immunoprophylaxis and for timing of RSV immunoprophylaxis by region (10).
Because local activity does not always correspond to national patterns (3,7), NREVSS data can be used to guide the timing of RSV immunoprophylaxis at the local level. In a study using NREVSS data, 5-year median onset and offset dates were calculated for individual laboratories and showed that RSV transmission trends can be local and do not necessarily reflect regional trends (8).
The findings in this report are subject to at least four limitations. First, NREVSS data depend on voluntary reporting, a potential source of bias. Second, the number of participating laboratories that met inclusion criteria for analyses differed each season, which might explain some of the variation. Third, although NREVSS data provide good approximation of regional RSV seasonal characteristics, they might not always reflect RSV activity at the state or county level. Finally, percentage of positive detections reflects test ordering practices and might not directly reflect disease burden (e.g., number of cases or severity of the seasonal outbreak). Despite these limitations, NREVSS continues to play a crucial role in providing epidemiologic data on RSV circulation, guiding diagnostic testing, and helping plan prevention measures. Laboratories wishing to participate in NREVSS should contact CDC at e-mail [email protected].
References 1. Shay DK, Holman RC, Newman RD, et al. Bronchiolitis-associated
hospitalizations among U.S. children, 1980–1996. JAMA 1999; 282:1440–6.
What is already known on this topic?
Respiratory syncytial virus (RSV) is the leading cause of pneumonia and bronchiolitis among infants. In the United States, the season generally begins during the fall and continues through the winter and spring months; however, the exact timing of RSV circulation can vary by location and year. The National Respiratory and Enteric Virus Surveillance System (NREVSS) is a network of laboratories that track RSV trends by calculating the percentage of RSV antigen tests performed each week that are positive.
What is added by this report?
The most recent RSV season began in November 2010 and ended in April 2011; in several regions, the onset and offset was slightly later during the 2010–11 season compared with the first season of analysis (2007–08).
What are the implications for public health practice?
Understanding long-term seasonal trends in RSV activity is helpful for guiding diagnostic testing during respiratory disease outbreaks and timing the use of RSV immunoprophylaxis for reducing RSV-related hospitalizations of children at high risk for serious disease.

Morbidity and Mortality Weekly Report
1206 MMWR / September 9, 2011 / Vol. 60 / No. 35
2. Hall CB, Weinberg GA, Iwane MK, et al. The burden of respiratory syncytial virus infection in young children. N Engl J Med 2009; 360:588–98.
3. Mullins JA, LaMonte AC, Bresee JS, et al. Substantial variability in community RSV season timing. Pediatr Infect Dis J 2003;22:857–62.
4. CDC. Respiratory syncytial virus activity—United States, July 2008–December 2009. MMWR 2010;59:230–3.
5. American Academy of Pediatrics. Respiratory syncytial virus. In: Pickering LK, Baker CJ, Kimberlin DW, Long SS, eds. Red book: 2009 report of the Committee on Infectious Diseases. 28th ed. Elk Grove Village, IL: American Academy of Pediatrics; 2009:560–9.
6. Zachariah P, Shah S, Gao D, Simoes EA. Predictors of the duration of the respiratory syncytial virus season. Pediatr Infect Dis J 2009; 28:772–6.
7. Panozzo CA, Fowlkes AL, Anderson LJ. Variation in timing of respiratory syncytial virus outbreaks: lessons from national surveillance. Pediatr Infect Dis J 2007;26(11 Suppl):S41–5.
8. Panozzo CA, Stockman LJ, Curns AT, Anderson LJ. Use of respiratory syncytial virus surveillance data to optimize the timing of immunoprophylaxis. Pediatrics 2010;126:e116–23.
9. Light M, Bauman J, Mavunda K, et al. Correlation between respiratory syncytial virus (RSV) test data and hospitalization of children for lower respiratory tract illness in Florida. Pediatr Infect Dis J 2008; 27:512–8.
10. American Academy of Pediatrics Committee on Infectious Diseases. Modified recommendations for use of palivizumab for prevention of respiratory syncytial virus infections. Pediatrics 2009;124:1694–701.

Morbidity and Mortality Weekly Report
MMWR / September 9, 2011 / Vol. 60 / No. 35 1207
On September 6, 2011, this report was posted as an MMWR Early Release on the MMWR website (http://www.cdc.gov/mmwr).
Vital Signs: Current Cigarette Smoking Among Adults Aged ≥18 Years — United States, 2005–2010
Abstract
Background: Tobacco use remains the leading cause of preventable morbidity and mortality in the United States. Methods: The 2005–2010 National Health Interview Surveys and the 2010 Behavioral Risk Factor Surveillance System survey were used to estimate national and state adult smoking prevalence, respectively. Current cigarette smokers were defined as adults aged ≥18 years who reported having smoked ≥100 cigarettes during their lifetime and who now smoke every day or some days. Results: In 2010, 19.3% of U.S. adults were current cigarette smokers. Higher smoking prevalence was observed in the Midwest (21.8%) and South (21.0%). From 2005 to 2010, the proportion of smokers declined from 20.9% to 19.3% (p<0.05 for trend), representing approximately 3 million fewer smokers in 2010 than would have existed had prevalence not declined since 2005. The proportion of daily smokers who smoked one to nine cigarettes per day (CPD) increased from 16.4% to 21.8% during 2005–2010 (p<0.05 for trend), whereas the proportion who smoked ≥30 CPD decreased from 12.7% to 8.3% (p<0.05 for trend). Conclusions: During 2005–2010, an overall decrease was observed in the prevalence of cigarette smoking among adults; however, the amount and direction of change has not been consistent year-to-year. Implications for Public Health Practice: Enhanced efforts are needed to accelerate the decline in cigarette smoking among adults. Population-based prevention strategies, such as tobacco taxes, media campaigns, and smoke-free policies, in concert with clinical cessation interventions, can help decrease cigarette smoking and reduce the health burden and economic impact of tobacco-related diseases in the United States.
Introduction Tobacco use remains the single largest preventable cause of
death and disease in the United States. The health consequences of tobacco use include heart disease, multiple types of cancer, pulmonary disease, adverse reproductive effects, and the exacerbation of chronic health conditions (1). Each year, approximately 443,000 persons in the United States die from smoking-related illnesses. In addition, smoking has been estimated to cost the United States $96 billion in direct medical expenses and $97 billion in lost productivity each year (2).
Monitoring tobacco use provides important information about the extent of tobacco use and helps to guide decisions about tobacco control strategies for the overall population and its subgroups.* To assess recent progress toward achieving the Healthy People 2020 objective to reduce the national prevalence of current cigarette smoking to ≤12.0% (objective TU-1),†
this report provides national and state-level estimates from the 2005–2010 National Health Interview Surveys (NHIS) and 2010 Behavioral Risk Factor Surveillance System (BRFSS) survey, respectively.
Methods The NHIS is administered to a nationally representative random
probability sample of noninstitutionalized, civilian U.S. adults aged ≥18 years. The 2010 NHIS included 27,157 respondents, of whom a total of 190 were excluded because of unknown smoking status. In 2010, the overall response rate was 60.8%; response rates for prior NHIS survey years have been reported previously.§ BRFSS is a state-based, random-digit–dialed telephone survey of noninstitutionalized, civilian U.S. adults aged ≥18 years; in 2010, the Council of American Survey and Research Organizations (CASRO) median response rate was 54.6% (ranging from 39.1% in Oregon to 68.8% in Nebraska), and the median cooperation
* Additional information available at: http://www.who.int/tobacco/mpower/mpower_report_full_2008.pdf.
† Additional information available at http://healthypeople.gov/2020/topicsobjectives2020.
§ Additional information available at http://www.cdc.gov/nchs/nhis/quest_data_related_1997_forward.htm.

Morbidity and Mortality Weekly Report
1208 MMWR / September 9, 2011 / Vol. 60 / No. 35
rate was 76.9% (ranging from 56.8% in California to 86.1% in Minnesota).¶
For both surveys, current cigarette smokers were defined as respondents who had smoked ≥100 cigarettes during their lifetime and responded “every day” or “some days” to the question, “Do you now smoke cigarettes every day, some days, or not at all?” Overall and sex-specific estimates of current smoking and number of cigarettes smoked per day (CPD) were determined by age, race/ethnicity, education, poverty status, and U.S. census region. Poverty status was defined using 2009 poverty thresholds published by the U.S. Census Bureau.
NHIS data were adjusted for nonresponse and weighted to provide national smoking prevalence estimates; 95% confidence intervals that account for the survey’s multistage probability sample design were calculated. NHIS results with relative standard error of ≥30% are not reported. Statistical significance of observed differences was assessed using 95% confidence intervals. Data from BRFSS were weighted to adjust for the differential probability of both selection and response.
Using NHIS data, logistic regression was used to analyze temporal changes in national smoking prevalence and CPD (among daily smokers) during 2005–2010, overall and by age, race/ethnicity, education, poverty status, and U.S. census region. These 6-year linear trend analyses were constructed using 2005 as the baseline to enable comparability with previous national trend estimates (3); results were adjusted for sex, age, and race/ethnicity, and the Wald test was used to determine statistical significance (defined as p<0.05).
Direct standardization was used to determine the population impact of the decline in smoking prevalence during 2005–2010. After adjustment for population changes in sex, age, and race/ethnicity, the difference in smoking prevalence from 2005 to 2010 was applied to 2010 U.S. census data to determine the number of additional smokers that would have existed in 2010 had prevalence not declined since 2005.
Results In 2010, an estimated 19.3% (45.3 million) of U.S. adults were
current cigarette smokers; of these, 78.2% (35.4 million) smoked every day, and 21.8% (9.9 million) smoked some days. Prevalence was higher among men (21.5%) than women (17.3%) (Table). Adults aged 25–44 years (22.0%) and 45–64 years (21.1%) had the highest prevalences among age groups. Among racial/ethnic populations, non-Hispanic American Indians/Alaska Natives had the highest prevalence (31.4%), followed by non-Hispanic whites (21.0%) and non-Hispanic blacks (20.6%). Smoking prevalence
generally decreased with increasing education and was higher among adults living below the poverty level (28.9%) than among those at or above the poverty level (18.3%). By region, prevalence was highest in the Midwest (21.8%) and South (21.0%) and lowest in the West (15.9%).** By state, smoking prevalence was lowest in Utah (9.1%) and California (12.1%) and highest in West Virginia (26.8%) and Kentucky (24.8%) (Figure 1).
During 2005–2010, the overall proportion of U.S. adults who were current smokers declined from 20.9% to 19.3% (p<0.05 for trend) (Table), representing approximately 3 million fewer smokers in 2010 than would have existed had prevalence not declined since 2005. However, this decline in prevalence was not uniform across the population; statistically significant reductions were observed only among persons aged 18–24 years or 25–44 years, Hispanics and non-Hispanic Asians, those living at or above the poverty level, and those living in the Northeast or Midwest (p<0.05 for trend). No population group experienced a significant increase in smoking prevalence during 2005–2010.
The mean number of CPD among daily smokers was 16.7 in 2005 and 15.1 in 2010. During 2005–2010, the proportion of daily smokers who smoked one to nine CPD increased from 16.4% to 21.8% (p<0.05 for trend), whereas the proportion who smoked ≥30 CPD declined from 12.7% to 8.3% (p<0.05 for trend) (Figure 2).
Conclusions and Comment The prevalence of current cigarette smoking among U.S. adults
aged ≥18 years declined slightly during 2005–2010, representing approximately 3 million fewer smokers than would have existed had the prevalence continued at the 2005 level. During the same period, an increase was observed in the proportion of daily smokers who smoked one to nine CPD, whereas a corresponding decrease was observed in the proportion who smoked ≥30 CPD. However, cigarette smoking remains widespread; in 2010, approximately one in five U.S. adults (19.3%) were current smokers. Moreover, year-to-year decreases in smoking prevalence have been observed only sporadically in recent years; for example, a slight decrease occurred from 2006 to 2007 but not from 2007 to 2008 (4). If current patterns continue, smoking prevalence is projected to fall to approximately 17% in 2020 (5), and the national Healthy People objective to reduce smoking prevalence to ≤12% will not be met.
¶ Based on CASRO definitions. The response rate is the percentage of persons who completed interviews among all eligible persons, including those who were not successfully contacted. The cooperation rate is the percentage of persons who completed interviews among all eligible persons who were contacted.
** Northeast: Connecticut, Maine, Massachusetts, New Hampshire, New Jersey, New York, Pennsylvania, Rhode Island, and Vermont. Midwest: Illinois, Indiana, Iowa, Kansas, Michigan, Minnesota, Missouri, Nebraska, North Dakota, Ohio, South Dakota, and Wisconsin. South: Alabama, Arkansas, Delaware, District of Columbia, Florida, Georgia, Kentucky, Louisiana, Maryland, Mississippi, North Carolina, Oklahoma, South Carolina, Tennessee, Texas, Virginia, and West Virginia. West: Alaska, Arizona, California, Colorado, Hawaii, Idaho, Montana, Nevada, New Mexico, Oregon, Utah, Washington, and Wyoming.

Morbidity and Mortality Weekly Report
MMWR / September 9, 2011 / Vol. 60 / No. 35 1209
Fuller implementation of evidence-based interventions is needed to accelerate progress toward achieving the Healthy People 2020 objective (6). The World Health Organization has identified specific tobacco control interventions as “best buys” (i.e., cost-effective population-based strategies) to enhance public health.†† These strategies include increasing
the price of tobacco products, implementing smoke-free laws in workplaces and public places, warning about the dangers of tobacco use, and enforcing restrictions on tobacco advertising, promotion, and sponsorship. Sustained implementation of these strategies, in addition to universal access to affordable and effective cessation interventions, would help reduce the national prevalence of tobacco use (6).
Despite an overall decline in smoking during 2005–2010, the findings in this report indicate that previously described
TABLE. Percentage of persons aged ≥18 years who were current cigarette smokers,* by selected characteristics — National Health Interview Survey, United States, 2005 and 2010
Characteristic
2005 2010
Males Females Total Males Females Total
% (95% CI) % (95% CI) % (95% CI) % (95% CI) % (95% CI) % (95% CI)
Age group (yrs)18–24 28.0 (25.0–31.0) 20.7 (18.3–23.1) 24.4 (22.4–26.4) 22.8 (19.9–25.7) 17.4 (15.0–19.8) 20.1 (18.2–22.0)†
25–44 26.8 (25.4–28.2) 21.4 (20.2–22.6) 24.1 (23.1–25.1) 24.3 (22.8–25.8) 19.8 (18.4–21.2) 22.0 (21.0–23.0)† 45–64 25.2 (23.7–26.7) 18.8 (17.7–19.9) 21.9 (21.0–22.8) 23.2 (21.6–24.8) 19.1 (17.9–20.3) 21.1 (20.1–22.1)
≥65 8.9 (7.6–10.2) 8.3 (7.3–9.3) 8.6 (7.8–9.4) 9.7 (8.3–11.1) 9.3 (8.1–10.5) 9.5 (8.6–10.4)Race/Ethnicity§
White, non-Hispanic 24.0 (22.8–25.2) 20.0 (19.1–20.9) 21.9 (21.1–22.7) 22.6 (21.5–23.7) 19.6 (18.6–20.6) 21.0 (20.2–21.8)Black, non-Hispanic 26.7 (23.9–29.5) 17.3 (15.6–19.0) 21.5 (19.9–23.1) 24.8 (22.3–27.3) 17.1 (15.1–19.1) 20.6 (19.1–22.1)Hispanic 21.1 (19.2–23.0) 11.1 (9.8–12.4) 16.2 (15.0–17.4) 15.8 (14.0–17.6) 9.0 (7.8–10.2) 12.5 (11.4–13.6)†
AI/AN, non-Hispanic 37.5 (20.7–54.3) 26.8 (15.5–38.1) 32.0 (22.3–41.7) —¶ — 36.0 (24.1–47.9) 31.4 (22.3–40.5)Asian, non-Hispanic** 20.6 (15.7–25.5) 6.1 (3.7–8.5) 13.3 (10.4–16.2) 14.7 (11.7–17.7) 4.3 (3.0–5.6) 9.2 (7.6–10.8)†
Multiple race, non-Hispanic 26.1 (16.3–35.9) 23.5 (14.8–32.2) 24.8 (17.7–31.9) 28.4 (19.0–37.8) 23.8 (17.1–30.5) 25.9 (20.2–31.6)Education††
0–12 yrs (no diploma) 29.5 (27.2–31.8) 21.9 (20.1–23.7) 25.5 (24.0–27.0) 28.5 (26.1–30.9) 21.8 (19.6–24.0) 25.1 (23.5–26.7)≤8 yrs 21.0 (17.7–24.3) 13.4 (11.1–15.7) 17.1 (15.1–19.1) 20.3 (17.4–23.2) 11.2 (8.5–13.9) 16.2 (14.2–18.2)9–11 yrs 36.8 (33.3–40.3) 29.0 (26.1–31.9) 32.6 (30.3–34.9) 38.3 (34.0–42.6) 29.8 (26.3–33.3) 33.8 (31.3–36.3)12 yrs (no diploma) 30.2 (23.5–36.9) 22.2 (16.9–27.5) 26.0 (21.8–30.2) 22.4 (15.4–29.4) 21.2 (15.7–26.7) 21.7 (17.1–26.3)
GED 47.5 (41.4–53.6) 38.8 (33.6–44.0) 43.2 (39.0–47.4) 46.4 (40.1–52.7) 44.1 (37.6–50.6) 45.2 (40.9–49.5)High school graduate 28.8 (27.0–30.6) 20.7 (19.3–22.1) 24.6 (23.5–25.7) 27.4 (25.2–29.6) 20.6 (18.9–22.3) 23.8 (22.4–25.2)Some college (no degree) 26.2 (24.4–28.0) 19.5 (18.0–21.0) 22.5 (21.4–23.6) 25.1 (22.7–27.5) 21.6 (19.6–23.6) 23.2 (21.6–24.8)Associate degree 26.1 (23.3–28.9) 17.1 (15.0–19.2) 20.9 (19.2–22.6) 21.8 (18.7–24.9) 16.4 (14.1–18.7) 18.8 (17.0–20.6)Undergraduate degree 11.9 (10.5–13.3) 9.6 (8.3–10.9) 10.7 (9.8–11.6) 10.2 (8.8–11.6) 9.5 (8.1–10.9) 9.9 (8.9–10.9)Graduate degree 6.9 (5.3–8.5) 7.4 (6.0–8.8) 7.1 (6.0–8.2) 7.1 (5.3–8.9) 5.4 (4.0–6.8) 6.3 (5.1–7.5)
Poverty status§§
At or above poverty level 23.7 (22.6–24.8) 17.6 (16.7–18.5) 20.6 (19.9–21.3) 20.2 (19.2–21.2) 16.4 (15.6–17.2) 18.3 (17.6–19.0)†
Below poverty level 34.3 (31.1–37.5) 26.9 (24.5–29.3) 29.9 (27.9–31.9) 33.2 (30.3–36.1) 25.7 (23.6–27.8) 28.9 (27.1–30.7)Unspecified 21.2 (19.2–23.2) 16.1 (14.8–17.4) 18.4 (17.2–19.6) 18.8 (15.9–21.7) 13.7 (11.7–15.7) 16.0 (14.3–17.7)
U.S. census region¶¶
Northeast 20.7 (18.6–22.8) 17.9 (16.3–19.5) 19.2 (17.8–20.6) 18.5 (16.5–20.5) 16.3 (14.8–17.8) 17.4 (16.2–18.6)†
Midwest 27.3 (25.3–29.3) 21.3 (19.8–22.8) 24.2 (23.0–25.4) 22.9 (21.2–24.6) 20.8 (18.8–22.8) 21.8 (20.4–23.2)†
South 25.3 (23.6–27.0) 18.5 (17.3–19.7) 21.8 (20.6–23.0) 23.9 (22.3–25.5) 18.3 (17.1–19.5) 21.0 (20.0–22.0)West 20.1 (18.3–21.9) 13.9 (12.6–15.2) 17.0 (16.0–18.0) 18.8 (17.0–20.6) 13.0 (11.8–14.2) 15.9 (14.7–17.1)
Total 23.9 (22.9–24.9) 18.1 (17.4–18.8) 20.9 (20.3–21.5) 21.5 (20.7–22.3) 17.3 (16.5–18.1) 19.3 (18.7–19.9)†
Abbreviations: CI = confidence interval; AI/AN = American Indian/Alaska Native; GED = General Education Development certificate. * Persons who reported smoking at least 100 cigarettes during their lifetime and who, at the time of interview, reported smoking every day or some days. Excludes
296 (2005) and 190 (2010) respondents whose smoking status was unknown. † Linear trend p<0.05 (2005 through 2010). § Excludes 45 (2005) and 36 (2010) respondents of unknown race. ¶ Data not reported because relative standard error ≥30%. ** Does not include Native Hawaiians or Other Pacific Islanders. †† Among persons aged ≥25 years. Excludes 339 (2005) and 119 (2010) persons whose educational level was unknown. §§ Based on reported family income and poverty thresholds published by the U.S. Census Bureau. Family income is reported by the family respondent who might or
might not be the same as the sample adult respondent from whom smoking information is collected. ¶¶ Northeast: Connecticut, Maine, Massachusetts, New Hampshire, New Jersey, New York, Pennsylvania, Rhode Island, and Vermont. Midwest: Illinois, Indiana, Iowa,
Kansas, Michigan, Minnesota, Missouri, Nebraska, North Dakota, Ohio, South Dakota, and Wisconsin. South: Alabama, Arkansas, Delaware, District of Columbia, Florida, Georgia, Kentucky, Louisiana, Maryland, Mississippi, North Carolina, Oklahoma, South Carolina, Tennessee, Texas, Virginia, and West Virginia. West: Alaska, Arizona, California, Colorado, Hawaii, Idaho, Montana, Nevada, New Mexico, Oregon, Utah, Washington, and Wyoming.
†† Additional information available at http://whqlibdoc.who.int/publications/2011/9789240686458_eng.pdf.

Morbidity and Mortality Weekly Report
1210 MMWR / September 9, 2011 / Vol. 60 / No. 35
variations in smoking prevalence persist (3), particularly by race/ethnicity, education, income, and region; thus, interventions focused on reducing tobacco-related disparities remain necessary (6). Although smoking prevalence was found to be lowest among Hispanics and non-Hispanic Asians, previous research indicates that wide variability in smoking prevalence exists among Hispanic and Asian subpopulations (7). In addition, the decline in smoking prevalence observed during 2005–2010 was not uniform across the population, and most subgroups will not meet the Healthy People 2020 target if current trends continue. Although prevalence declined among persons aged 18–44 years during 2005–2010, the reduction was modest when compared with previous declines observed among this age group (4). The slowing in the decline among younger adults is consistent with concurrent trends observed among youths§§ and indicates that smoking among adults will remain an important public health issue for the foreseeable future unless effective tobacco control strategies are fully implemented and sustained.
During 2009–2010, major advances were made in tobacco control. The 2009 Family Smoking Prevention and Tobacco Control Act¶¶ gives the Food and Drug Administration authority to regulate the manufacture, distribution, and marketing of tobacco products. In addition, the Patient
Protection and Affordable Care Act*** provides expanded coverage for evidence-based smoking-cessation treatments for many persons in the United States. Finally, the Children’s Health Insurance Program Reauthorization Act of 2009††† raised the federal tax rate for cigarettes from $0.39 to $1.01 per pack. Increasing the price of cigarettes can prevent initiation among nonsmokers and reduce cigarette consumption, particularly among youths and low-income smokers (8).
Changes observed in CPD among daily smokers during 2005–2010 are consistent with previously reported national declines in cigarette consumption (9). The reasons for this shift are unknown, but might be attributed to the proliferation of smoke-free environments (10), greater public awareness of the dangers of smoking (11), and increased cigarette prices (8). However, even light and intermittent smoking is associated with premature mortality (12), and significant health benefits to smokers from reducing the amount smoked have not been demonstrated (1). No amount of smoking is safe, and the best option for any smoker is to quit completely (1). Cessation advice and assistance using proven methods should be offered to all smokers.§§§
The findings in this report are subject to at least six limitations. First, estimates of smoking were self-reported and not validated by biochemical tests. Although studies of self-reported smoking might yield lower prevalence estimates than studies of serum cotinine (a breakdown product of nicotine) (13), it is unlikely that the degree
§§ Additional information available at: http://www.cdc.gov/mmwr/preview/mmwrhtml/mm5926a1.htm.
¶¶ Additional information available at http://www.fda.gov/tobaccoproducts/default.htm.
FIGURE 1. Percentage of persons aged ≥18 years who were current cigarette smokers,* by state — Behavioral Risk Factor Surveillance System, United States, 2010
* Persons who reported smoking at least 100 cigarettes during their lifetime and who, at the time of the survey, reported smoking cigarettes every day or some days.
22.0–26.819.0–21.916.0–18.913.0–15.99.1–12.9
FIGURE 2. Percentage of daily smokers* aged ≥18 years, by number of cigarettes smoked per day (CPD) and year — National Health Interview Survey, United States, 2005–2010
* Persons who reported smoking at least 100 cigarettes during their lifetime and who, at the time of the survey, reported smoking cigarettes every day.
1–9 CPD10–19 CPD20–29 CPD
≥30 CPD
0
5
10
15
20
25
30
35
40
Perc
enta
ge
2005 2006 2007 2008 2009 2010
Year
*** Additional information available at http://www.dol.gov/ebsa/healthreform. ††† Additional information available at http://www.cms.gov/chipra. §§§ Additional information available at http://www.surgeongeneral.gov/tobacco/
treating_tobacco_use08.pdf.

Morbidity and Mortality Weekly Report
MMWR / September 9, 2011 / Vol. 60 / No. 35 1211
of any underreporting would have changed meaningfully since 2005; thus, underreporting is unlikely to have affected the trends described in this report. Second, questionnaires were administered only in English and Spanish, which might have resulted in imprecise estimates for racial/ethnic populations unable to respond to the survey because of language barriers. Similarly, small samples sizes for certain population groups resulted in less precise estimates. Fourth, neither NHIS nor BRFSS include institutionalized populations and persons in the military, which prevents the generalizability of the results to these groups. Fifth, the 2010 BRFSS data analyzed in this report did not include adults without telephone service (1.7%) or with wireless-only service (24.9%) (14); because adults with wireless-only service are more likely to smoke cigarettes than the rest of the U.S. population (14), state smoking prevalences are likely to be underestimated. However, this limitation did not affect national estimates or trends because they are based on NHIS, which uses household-based sampling. Finally, the 2010 NHIS response rate was 60.8%, and the median response rate for the 2010 BRFSS was 54.6%. Lower response rates increase the potential for bias; however, national estimates from state-aggregated BRFSS data have been shown to be comparable to estimates from NHIS and other surveys with higher response rates (15).
Sustained, adequately funded, comprehensive state tobacco control programs accelerate progress toward reducing the health burden and economic impact of tobacco-related diseases in the United States (6). States that invest more fully in comprehensive
tobacco control programs have seen larger declines in cigarette sales than the United States as a whole, and smoking prevalence among adults and youths has declined faster as spending for tobacco control programs has increased (6). California’s adult smoking prevalence declined approximately 40% during 1998–2006. Similarly, Maine, New York, and Washington have seen 45%–60% reductions in youth smoking with sustained comprehensive statewide programs (6). CDC recommended appropriate annual funding levels for each state comprehensive tobacco control program in 2007 (6). However, in 2010, only North Dakota funded tobacco control programs at this level, whereas 28 states provided less than 25% of CDC-recommended amounts (CDC, unpublished data, 2011). Full implementation of comprehensive tobacco control policies and programs at CDC-recommended funding levels would result in a substantial reduction in tobacco-related morbidity and mortality and billions of dollars in savings from averted medical costs and lost productivity (2,6).
Reported by
Brian King, PhD, Shanta Dube, PhD, Rachel Kaufmann, PhD, Lauren Shaw, MS , Terry Pechacek, PhD, Office on Smoking and Health, National Center for Chronic Disease Prevention and Health Promotion, CDC. Corresponding contributor: Brian King, [email protected], 770-488-5107.
Acknowledgments
National Center for Health Statistics, Public Health Surveillance Program Office, CDC.
References 1. US Department of Health and Human Services. How tobacco smoke
causes disease: the biology and behavioral basis for smoking-attributable disease: a report of the Surgeon General. Atlanta, GA: US Department of Health and Human Services, CDC; 2010. Available at http://www.cdc.gov/tobacco/data_statistics/sgr/2010/index.htm. Accessed August 4, 2011.
2. CDC. Smoking-attributable mortality, years of potential life lost, and productivity losses—United States, 2000–2004. MMWR 2008; 57:1226–8.
3. CDC. Vital Signs: current cigarette smoking among adults aged ≥18 years—United States, 2009. MMWR 2010;59:1135–40.
4. CDC. Cigarette smoking among adults and trends in smoking cessation—United States, 2008. MMWR 2009;58:1227–32.
5. Mendez D, Warner KE. Setting a challenging yet realistic smoking prevalence target for Healthy People 2020: learning from the California experience. Am J Public Health 2008;98:556–9.
6. CDC. Best practices for comprehensive tobacco control programs—2007. Atlanta, GA: US Department of Health and Human Services, CDC; 2007. Available at http://www.cdc.gov/tobacco/stateandcommunity/best_practices/index.htm. Accessed August 4, 2011.
7. Caraballo RS, Yee SL, Gfroerer J, Mirza SA. Adult tobacco use among racial and ethnic groups living in the United States, 2002–2005. Prev Chronic Dis 2008;5:1–9.
8. CDC. Federal and state cigarette excise taxes—United States, 1995–2009. MMWR 2009;58:524–7.
Key Points
• Tobaccouseistheleadingcauseofpreventabledeathand illness in the United States. Approximately half of smokers will die from a smoking-related disease.
• In2010,19.3%ofU.S.adultswerecurrentcigarettesmokers, compared with 20.9% in 2005, representing approximately 3 million fewer smokers than would have existed had no decrease occurred.
• Atthisslowrateofdecline,adultsmokingratesintheUnited States will reach approximately 17% by 2020, substantially higher than the Healthy People 2020 target goal of ≤12%.
• Somedailysmokersappeartobesmokingfewercigarettesper day. However, no amount of smoking is safe, and the best option for any smoker is to quit completely.
• Sustained, adequately funded, comprehensive statetobacco control programs can reduce adult smoking in the United States.
• Additionalinformationisavailableathttp://www.cdc.gov/vitalsigns.
Morbidity and Mortality Weekly Report
1212 MMWR / September 9, 2011 / Vol. 60 / No. 35
9. Pierce JP, White MM, Messer K. Changing age-specific patterns of cigarette consumption in the United States, 1992–2002: association with smoke-free homes and state-level tobacco control activity. Nicotine Tob Res 2009;11:171–7.
10. CDC. State smoke-free laws for worksites, restaurants, and bars—United States, 2000–2010. MMWR 2011;60:472–5.
11. World Health Organization. WHO report on the global tobacco epidemic, 2011: warning about the dangers of tobacco. Geneva, Switzerland: World Health Organization; 2011. Available at http://whqlibdoc.who.int/publications/2011/9789240687813_eng.pdf. Accessed August 4, 2011.
12. Schane RE, Ling PM, Glantz SA. Health effects of light and intermittent smoking: a review. Circulation 2010;121:1518–22.
13. Gorber SC, Schofield-Hurwitz S, Hardt J, Levasseur G, Tremblay M. The accuracy of self-reported smoking: a systematic review of the relationship between self-reported and cotinine-assessed smoking status. Nicotine Tob Res 2009;11:12–24.
14. Blumberg SJ, Luke JV. Wireless substitution: early release of estimates from the National Health Interview Survey, January–June 2010. Hyattsville, MD: US Department of Health and Human Services, CDC, National Center for Health Statistics; 2010. Available at http://www.cdc.gov/nchs/data/nhis/earlyrelease/wireless201012.htm. Accessed August 4, 2011.
15. Nelson DE, Holtzman D, Bolen J, Stanwyck CA, Mack KA. Reliability and validity of measures from the Behavioral Risk Factor Surveillance System (BRFSS). Social Prev Med 2001;46:S3–42.

Morbidity and Mortality Weekly Report
MMWR / September 9, 2011 / Vol. 60 / No. 35 1213
On September 2, 2011, this report was posted as an MMWR Early Release on the MMWR website (http://www.cdc.gov/mmwr).
Influenza A viruses are endemic in many animal species, including humans, swine, and wild birds, and sporadic cases of transmission of influenza A viruses between humans and animals do occur, including human infections with avian-origin influenza A viruses (i.e., H5N1 and H7N7) and swine-origin influenza A viruses (i.e., H1N1, H1N2, and H3N2) (1). Genetic analysis can distinguish animal origin influenza viruses from the seasonal human influenza viruses that circulate widely and cause annual epidemics. This report describes two cases of febrile respiratory illness caused by swine-origin influenza A (H3N2) viruses identified on August 19 and August 26, 2011, and the current investigations. No epidemiologic link between the two cases has been identified, and although investigations are ongoing, no additional confirmed human infections with this virus have been detected. These viruses are similar to eight other swine-origin influenza A (H3N2) viruses identified from previous human infections over the past 2 years, but are unique in that one of the eight gene segments (matrix [M] gene) is from the 2009 influenza A (H1N1) virus. The acquisition of the M gene in these two swine-origin influenza A (H3N2) viruses indicates that they are “reassortants” because they contain genes of the swine-origin influenza A (H3N2) virus circulating in North American pigs since 1998 (2) and the 2009 influenza A (H1N1) virus that might have been transmitted to pigs from humans during the 2009 H1N1 pandemic. However, reassortments of the 2009 influenza A (H1N1) virus with other swine influenza A viruses have been reported previously in swine (3). Clinicians who suspect influenza virus infection in humans with recent exposure to swine should obtain a nasopharyngeal swab from the patient for timely diagnosis at a state public health laboratory and consider empiric neuraminidase inhibitor antiviral treatment to quickly limit potential human transmission (4).
Case Reports Patient A. On August 17, 2011, CDC was notified by
the Indiana State Department of Health Laboratories of a suspected case of swine-origin influenza A (H3N2) infection in a boy aged <5 years. The boy, who had received influenza vaccine in September 2010, experienced onset of fever, cough, shortness of breath, diarrhea, and sore throat on July 23, 2011. He was brought to a local emergency department (ED) where a respiratory specimen later tested positive for influenza A
(H3). The boy was discharged home, but was not treated with influenza antiviral medications. He has multiple chronic health conditions, returned to the ED on July 24, 2011, and was hospitalized for treatment of those health problems, which had worsened. The boy was discharged home on July 27, 2011, and has since recovered from this illness. As part of routine CDC-supported influenza surveillance, the respiratory specimen collected on July 24, 2011, was forwarded to the Indiana State Department of Health Laboratories, where polymerase chain reaction (PCR) testing identified a suspect swine-origin influenza A (H3N2) virus on August 17, 2011. The specimen was forwarded to CDC where the findings were confirmed through genome sequencing on August 19, 2011.
No direct exposure to swine was identified for this child; however, a caretaker reported direct contact with asymptomatic swine in the weeks before the boy’s illness onset and provided care to the child 2 days before illness onset. No respiratory illness was identified in any of the child’s family or close contacts, the boy’s caretaker, or in the family or contacts of the caretaker.
Patient B. On August 24, 2011, CDC was notified by the Pennsylvania Department of Health of a suspected case of swine-origin influenza A (H3N2) virus infection in a girl aged <5 years. The girl, who had received influenza vaccine in September 2010, experienced acute onset of fever, nonproductive cough, and lethargy on August 20, 2011. She was brought to a local hospital ED where a nasopharyngeal swab tested positive for influenza A by rapid influenza diagnostic test. She was not treated with influenza antiviral medications and was discharged home the same day. The girl has completely recovered from this illness.
A nasopharyngeal swab and nasal wash specimen were obtained at the ED and forwarded to the Pennsylvania State Department of Health Bureau of Laboratories for additional testing as part of routine CDC-supported influenza surveillance. On August 23, 2011, the state public health laboratory identified a suspected swine-origin influenza A (H3N2) virus by PCR testing, and both specimens were forwarded to CDC. On August 26, 2011, genome sequencing confirmed the virus as swine-origin influenza A (H3N2). On August 16, 2011, the girl was reported to have visited an agricultural fair where she had direct exposure to swine and other animals. No additional illness in the girl’s family or close contacts has been identified, but illness in other fair attendees
Swine-Origin Influenza A (H3N2) Virus Infection in Two Children — Indiana and Pennsylvania, July–August 2011

Morbidity and Mortality Weekly Report
1214 MMWR / September 9, 2011 / Vol. 60 / No. 35
continues to be investigated. No additional confirmed swine-origin influenza virus infections have been identified thus far.
Epidemiologic and Laboratory Investigations As of September 2, 2011, no epidemiologic link between
patients A and B had been identified, and no additional cases of confirmed infection with the identified strain of swine-origin influenza A (H3N2) virus had been identified. Surveillance data from both states showed low levels of influenza activity at the time of both patients’ illnesses. Case and contact investigations by the county and state human and animal health agencies in Indiana and Pennsylvania are ongoing, and enhanced surveillance for additional human cases is being implemented in both states.
Preliminary genetic characterization of these two influenza viruses has identified them as swine-origin influenza A (H3N2) viruses. Full genome sequences have been posted to publicly available web sites. The viruses are similar, but not identical to each other. Seven of the eight gene segments, including the hemagglutinin (HA) and neuraminidase (NA) genes, are similar to those of swine H3N2 influenza viruses circulating among U.S. pigs since 1998 (2) and previously identified in the eight other sporadic cases of human infection with swine-origin influenza A (H3N2) viruses in the United States since 2009.* The one notable difference from the viruses previously identified in human infections with swine-origin influenza A (H3N2) virus is that these two viruses have a matrix (M) gene acquired from the 2009 influenza A (H1N1) virus, replacing the classical swine M gene present in the prior eight swine-origin influenza A (H3N2) virus infections in humans.
Although reassortment between swine influenza and 2009 influenza A (H1N1) viruses has been reported in pigs in the United States (3), this particular genetic combination of swine influenza virus segments is unique and has not been reported previously in either swine or humans, based on a review of influenza genomic sequences publicly available in GenBank.† Analysis of data submitted to GenBank via the U.S. Department of Agriculture (USDA) Swine Influenza Virus Surveillance Program subsequent to this case identified two additional influenza A (H3N2) isolates from swine containing the M gene from the 2009 influenza A (H1N1) virus. Genome sequencing is underway to completely characterize the genetic composition of these two swine influenza isolates. (USDA Agricultural Research Service and USDA Animal and Plant Health Inspection Service, unpublished data, 2011).
The viruses in these two patients are resistant to amantadine and rimantadine, but are susceptible to the neuraminidase inhibitor drugs oseltamivir and zanamivir. Because these viruses carry a unique combination of genes, no information currently is available regarding the capacity of this virus to transmit efficiently in swine, humans, or between swine and humans.
Reported by
Kumar Nalluswami, MD, Atmaram Nambiar, MD, Perrianne Lurie, MD, Maria Moll, MD, James Lute, PhD, Owen Simwale, MPH, Erica Smith, MPH, Larry Sundberg, MPH, Brian Seiler, Stephen Swanson, Pennsylvania Dept of Health; Nanette Hanshaw, DVM, Craig Shultz, DVM, Erin Moore, DVM, Pennsylvania Dept of Agriculture. Shawn Richards, Mark Glazier, Katie Masterson, Lyndsey Hensler, MS, Indiana State Dept of Health; Cheryl Miller, DVM, Melissa Justice, DVM, Indiana Board of Animal Health. Swine Influenza Virus Team, US Dept of Agriculture. Scott Epperson, MPH, Lynnette Brammer, MPH, Lyn Finelli, DrPH, Susan Trock, DVM, Michael Jhung, MD, Joseph Bresee, MD, Stephen Lindstrom, PhD, Alexander Klimov, PhD, Daniel Jernigan, MD, Nancy Cox, PhD, Influenza Div, National Center for Immunization and Respiratory Diseases; Jeffrey Miller, MD, Div of Applied Sciences, Office of Surveillance, Epidemiology, and Laboratory Svcs, CDC. Corresponding Contributor: Scott Epperson, [email protected], 404-639-3747.
Editorial Note
To detect human infections with animal influenza viruses more effectively, CDC and state and local health departments have strengthened laboratory and epidemiologic procedures to promptly detect sporadic cases such as these. Since 2005, state public health laboratories have had the capability to detect non-human origin–influenza A viruses by PCR testing. From 2005 to 2007, CDC received reports of approximately one human infection with a swine-origin influenza virus each year. In 2007, human infection with a novel influenza A virus, including swine-origin influenza virus infections, became a nationally notifiable condition. Since that time, CDC has received approximately three to five reports a year of human infections with swine-origin influenza viruses. The recent increase in reporting might be, in part, a result of increased influenza testing capabilities in public health laboratories that allows for identification of human and swine-origin influenza viruses, but genetic changes in swine influenza viruses and other factors also might be contributing to this increase (2,5,6). During December 2005–November 2010, before the two cases described in this report, 21 cases of human infection with swine-origin influenza were reported (12 cases with swine-origin influenza A (H1N1) virus infection, eight cases with swine-origin influenza A (H3N2) virus infection, and one case
* Additional information is available at http://www.cdc.gov/flu/weekly/pastreports.htm.
† Available at http://www.ncbi.nlm.nih.gov/genbank.

Morbidity and Mortality Weekly Report
MMWR / September 9, 2011 / Vol. 60 / No. 35 1215
with swine-origin influenza A (H1N2) virus infection). Six of these 21 cases occurred in patients who reported direct exposure to pigs; 12 patients reported being near pigs; human-to-human transmission was suspected in two cases after epidemiologic investigations revealed no reported contact with swine in either case, but contact with ill persons who reported swine exposure was the suspected source of infection; the exposure in one case was unknown (7) (CDC, unpublished data; 2011). Although the vast majority of human infections with animal influenza viruses do not result in human-to-human transmission (8,9), each case should be investigated fully to ascertain whether these viruses are transmitted among humans and to limit further exposure of humans to infected animals, if infected animals are identified. Such investigations require close collaboration between CDC, state and local public health officials, and animal health officials.
The lack of known direct exposure to pigs in one of the two cases described in this report suggests the possibility that limited human-to-human transmission of this influenza virus occurred. Likely transmission of swine-origin influenza A (H3N2) virus from close contact with an infected person has been observed in past investigations of human infections
with swine-origin influenza A virus, but has not resulted in sustained human-to-human transmission. Preliminary evidence from the investigation of the Indiana case shows no ongoing transmission. No influenza illness has been identified, but if additional chains of transmission are identified, rapid intervention is warranted to try to prevent further spread of the virus. Clinicians should consider swine-origin influenza A virus infection as well as seasonal influenza virus infections in the differential diagnosis of patients with febrile respiratory illness who have been near pigs. Clinicians who suspect influenza virus infection in humans with recent exposure to swine should obtain a nasopharyngeal swab from the patient, place the swab in a viral transport medium, contact their state or local health department to facilitate transport and timely diagnosis at a state public health laboratory, and consider empiric neuraminidase inhibitor antiviral treatment (4). CDC requests that state public health laboratories send all suspected swine-origin influenza A specimens to the CDC, Influenza Division, Virus Surveillance and Diagnostics Branch Laboratory.
References 1. Wright PF, Neumann G, Kawaoka Y. Orthomyxoviruses. In: Knipe DM,
Howley PM, eds. Fields virology. Vol. 2. 5th ed. Philadelphia, PA: Lippincott, Williams, and Wilkins; 2007:1692–740.
2. Vincent AL, Ma W, Lager KM, Janke BH, Richt JA. Swine influenza viruses: a North American perspective. Adv Virus Res 2008; 72:127–54.
3. Duchatez MF, Hause B, Stigger-Rosser E, et al. Multiple reassortment between pandemic (H1N1) 2009 and endemic influenza viruses in pigs, United States. Emerg Infect Dis 2011;17:1624–9.
4. CDC. Antiviral agents for the treatment and chemoprophylaxis of influenza: recommendations of the Advisory Committee on Immunization Practices (ACIP). MMWR 2011;60(No. RR-1).
5. Vincent AL, Swenson SL, Lager KM, Gauger PC, Loiacono C, Zhang Y. Characterization of an influenza A virus isolated from pigs during an outbreak of respiratory disease in swine and people during a county fair in the United States. Vet Microbiol 2009;137:51–9.
6. Newman AP, Reisdorf E, Beinemann J, et al. Human case of swine influenza A (H1N1) triple reassortant virus infection, Wisconsin. Emerg Infect Dis 2008;14:1470–2.
7. Shinde V, Bridges CB, Uyeki TM, et al. Triple reassortant swine influenza A (H1) in humans in the United States, 2005–2009. N Engl J Med 2009;25:2616–25.
8. Myers KP, Olsen CW, Gray GC. Cases of swine influenza in humans: a review of the literature. Clin Infect Dis 2007;44:1084–8.
9. Wells DL, Hopfensperger DJ, Arden NH, et al. Swine influenza virus infections. Transmission from ill pigs to humans at a Wisconsin agricultural fair and subsequent probable person-to-person transmission. JAMA 1991;265:478–81.
What is already known on this topic?
During December 2005–November 2010, 21 cases of human infection with swine-origin influenza were reported, including 12 cases with swine-origin influenza A (H1N1) virus infection, eight cases with swine-origin influenza A (H3N2) virus infection, and one case with swine-origin influenza A (H1N2) virus infection.
What is added by this report?
This report describes two cases of febrile respiratory illness caused by swine-origin influenza A (H3N2) viruses identified on August 19 and August 26, 2011. The viruses identified in these cases are unique in that one of the eight gene segments (matrix [M] gene) is from the 2009 influenza A (H1N1) virus.
What are the implications for public health practice?
Non-human influenza virus infections rarely result in human-to-human transmission, but the implications of sustained ongoing transmission between humans is potentially severe; therefore, prompt and thorough identification and investigation of these sporadic human infections with non-human influenza viruses are needed to reduce the risk for sustained transmission.

Morbidity and Mortality Weekly Report
1216 MMWR / September 9, 2011 / Vol. 60 / No. 35
* Based on responses to the following question: “Would you say your health in general is excellent, very good, good, fair, or poor?” Health status data were obtained by asking respondents to assess their own health and that of other family members living in the same household.
† Persons of Hispanic ethnicity might be of any race or combination of races. § Estimates are based on household interviews of a sample of the U.S. civilian, noninstitutionalized population.
Estimates are age adjusted using the projected 2000 U.S. standard population as the standard population and using four age groups: 18–44 years, 45–64 years, 65–74 years, and ≥75 years.
¶ 95% confidence interval.
During 2009, nearly two thirds (65%) of non-Hispanic white adults assessed their health as excellent or very good, compared with less than half (49%) of non-Hispanic black adults. Approximately 52% of Hispanic adults were in excellent or very good health. Among Hispanic subpopulations, the percentage ranged from 50% of Mexican adults to 58% of Central or South American adults and 59% of other Hispanic adults.
Source: National Health Interview Survey, 2009 data. Available at http://www.cdc.gov/nchs/nhis.htm.
0
10
20
30
40
50
60
70
80
90
100
White,non-
Hispanic
Black,non-
Hispanic
Hispanic Mexican Puerto Rican Cuban Centralor SouthAmerican
OtherHispanic
Perc
enta
ge
¶
Race and Hispanic subpopulation
QuickStats
FROM THE NATIONAL CENTER FOR HEALTH STATISTICS
Percentage of Adults Aged ≥18 Years with Self-Reported Excellent or Very Good Health,* by Race and Hispanic Subpopulation† — National Health
Interview Survey, United States, 2009§

Morbidity and Mortality Weekly Report
MMWR / September 9, 2011 / Vol. 60 / No. 35 1217
TABLE I. Provisional cases of infrequently reported notifiable diseases (<1,000 cases reported during the preceding year) — United States, week ending September 3, 2011 (35th week)*
DiseaseCurrent
weekCum 2011
5-year weekly
average†
Total cases reported for previous yearsStates reporting cases
during current week (No.)2010 2009 2008 2007 2006
Anthrax — — 0 — 1 — 1 1Arboviral diseases§, ¶:
California serogroup virus disease — 33 4 75 55 62 55 67Eastern equine encephalitis virus disease — 1 0 10 4 4 4 8Powassan virus disease — 12 0 8 6 2 7 1St. Louis encephalitis virus disease — 1 1 10 12 13 9 10Western equine encephalitis virus disease — — — — — — — —
Babesiosis 19 384 0 NN NN NN NN NN NY (17), PA (1), TN (1)Botulism, total — 63 3 112 118 145 144 165
foodborne — 6 1 7 10 17 32 20infant — 49 1 80 83 109 85 97other (wound and unspecified) — 8 1 25 25 19 27 48
Brucellosis 2 54 3 115 115 80 131 121 NE (1), FL (1)Chancroid — 11 0 24 28 25 23 33Cholera — 22 0 13 10 5 7 9Cyclosporiasis§ 3 125 2 179 141 139 93 137 FL (2), TN (1)Diphtheria — — — — — — — —Haemophilus influenzae,** invasive disease (age <5 yrs):
serotype b — 5 0 23 35 30 22 29nonserotype b — 76 2 200 236 244 199 175unknown serotype — 165 2 223 178 163 180 179
Hansen disease§ 1 33 2 98 103 80 101 66 OH (1)Hantavirus pulmonary syndrome§ — 17 1 20 20 18 32 40Hemolytic uremic syndrome, postdiarrheal§ 1 98 8 266 242 330 292 288 IA (1)Influenza-associated pediatric mortality§,†† 1 111 1 61 358 90 77 43 AZ (1)Listeriosis 2 346 22 821 851 759 808 884 NY (1), PA (1)Measles§§ 3 181 1 63 71 140 43 55 MN (3)Meningococcal disease, invasive¶¶:
A, C, Y, and W-135 — 130 3 280 301 330 325 318serogroup B — 67 2 135 174 188 167 193other serogroup — 7 0 12 23 38 35 32unknown serogroup 1 283 6 406 482 616 550 651 FL (1)
Novel influenza A virus infections*** — 4 0 4 43,774 2 4 NNPlague — 1 0 2 8 3 7 17Poliomyelitis, paralytic — — — — 1 — — —Polio virus Infection, nonparalytic§ — — — — — — — NNPsittacosis§ 1 2 0 4 9 8 12 21 PA (1)Q fever, total§ 2 67 3 131 113 120 171 169
acute 2 49 2 106 93 106 — — MD (1), CA (1)chronic — 18 0 25 20 14 — —
Rabies, human — 1 — 2 4 2 1 3Rubella††† — 3 0 5 3 16 12 11Rubella, congenital syndrome — — — — 2 — — 1SARS-CoV§ — — — — — — — —Smallpox§ — — — — — — — —Streptococcal toxic-shock syndrome§ — 83 1 142 161 157 132 125Syphilis, congenital (age <1 yr)§§§ — 128 9 377 423 431 430 349Tetanus — 5 1 26 18 19 28 41Toxic-shock syndrome (staphylococcal)§ — 57 2 82 74 71 92 101Trichinellosis — 8 0 7 13 39 5 15Tularemia 4 77 3 124 93 123 137 95 ND (2), NE (1), OK (1)Typhoid fever 5 237 13 467 397 449 434 353 NY (1), MD (1), NC (1), FL (1), CA (1)Vancomycin-intermediate Staphylococcus aureus§ 2 43 1 91 78 63 37 6 NYC (1), OH (1)Vancomycin-resistant Staphylococcus aureus§ — — 0 2 1 — 2 1Vibriosis (noncholera Vibrio species infections)§ 15 417 22 846 789 588 549 NN NYC (1), MD (1), VA (2), FL (6), TN (1), WA (4)Viral hemorrhagic fever¶¶¶ — — — 1 NN NN NN NNYellow fever — — — — — — — —
See Table 1 footnotes on next page.
Notifiable Diseases and Mortality Tables

Morbidity and Mortality Weekly Report
1218 MMWR / September 9, 2011 / Vol. 60 / No. 35
Notifiable Disease Data Team and 122 Cities Mortality Data Team
Jennifer WardDeborah A. Adams Rosaline DharaWillie J. Anderson Pearl C. SharpLenee Blanton Michael S. Wodajo
* Ratio of current 4-week total to mean of 15 4-week totals (from previous, comparable, and subsequent 4-week periods for the past 5 years). The point where the hatched area begins is based on the mean and two standard deviations of these 4-week totals.
FIGURE I. Selected notifiable disease reports, United States, comparison of provisional 4-week totals September 3, 2011, with historical data
420.250.125 1
Beyond historical limits
DISEASE
Ratio (Log scale)*
DECREASE INCREASECASES CURRENT
4 WEEKS
Hepatitis A, acute
Hepatitis B, acute
Hepatitis C, acute
Legionellosis
Measles
Mumps
Pertussis
Giardiasis
Meningococcal disease
841
57
90
43
194
5
7
15
577
0.5
TABLE I. (Continued) Provisional cases of infrequently reported notifiable diseases (<1,000 cases reported during the preceding year) — United States, week ending September 3, 2011 (35th week)*
—: No reported cases. N: Not reportable. NN: Not Nationally Notifiable. Cum: Cumulative year-to-date counts. * Case counts for reporting years 2010 and 2011 are provisional and subject to change. For further information on interpretation of these data, see http://www.cdc.gov/osels/ph_surveillance/
nndss/phs/files/ProvisionalNationa%20NotifiableDiseasesSurveillanceData20100927.pdf. † Calculated by summing the incidence counts for the current week, the 2 weeks preceding the current week, and the 2 weeks following the current week, for a total of 5 preceding years.
Additional information is available at http://www.cdc.gov/osels/ph_surveillance/nndss/phs/files/5yearweeklyaverage.pdf. § Not reportable in all states. Data from states where the condition is not reportable are excluded from this table except starting in 2007 for the arboviral diseases, STD data, TB data, and
influenza-associated pediatric mortality, and in 2003 for SARS-CoV. Reporting exceptions are available at http://www.cdc.gov/osels/ph_surveillance/nndss/phs/infdis.htm. ¶ Includes both neuroinvasive and nonneuroinvasive. Updated weekly from reports to the Division of Vector-Borne Infectious Diseases, National Center for Zoonotic, Vector-Borne, and
Enteric Diseases (ArboNET Surveillance). Data for West Nile virus are available in Table II. ** Data for H. influenzae (all ages, all serotypes) are available in Table II. †† Updated weekly from reports to the Influenza Division, National Center for Immunization and Respiratory Diseases. Since October 3, 2010, 115 influenza-associated pediatric deaths
occurring during the 2010-11 influenza season have been reported. §§ Of the three measles cases reported for the current week, one was imported, and two were indigenous. ¶¶ Data for meningococcal disease (all serogroups) are available in Table II. *** CDC discontinued reporting of individual confirmed and probable cases of 2009 pandemic influenza A (H1N1) virus infections on July 24, 2009. During 2009, four cases of human infection
with novel influenza A viruses, different from the 2009 pandemic influenza A (H1N1) strain, were reported to CDC. The four cases of novel influenza A virus infection reported to CDC during 2010, and the four cases reported during 2011, were identified as swine influenza A (H3N2) virus and are unrelated to the 2009 pandemic influenza A (H1N1) virus. Total case counts are provided by the Influenza Division, National Center for Immunization and Respiratory Diseases (NCIRD).
††† No rubella cases were reported for the current week. §§§ Updated weekly from reports to the Division of STD Prevention, National Center for HIV/AIDS, Viral Hepatitis, STD, and TB Prevention. ¶¶¶ There was one case of viral hemorrhagic fever reported during week 12 of 2010. The one case report was confirmed as lassa fever. See Table II for dengue hemorrhagic fever.

Morbidity and Mortality Weekly Report
MMWR / September 9, 2011 / Vol. 60 / No. 35 1219
TABLE II. Provisional cases of selected notifiable diseases, United States, weeks ending September 3, 2011, and September 4, 2010 (35th week)*
Reporting area
Chlamydia trachomatis infection Coccidioidomycosis Cryptosporidiosis
Current week
Previous 52 weeks Cum 2011
Cum 2010
Current week
Previous 52 weeks Cum 2011
Cum 2010
Current week
Previous 52 weeks Cum 2011
Cum 2010Med Max Med Max Med Max
United States 12,431 25,769 31,142 863,792 866,066 76 324 567 11,687 NN 198 134 391 5,113 6,111New England 799 854 2,043 29,396 27,355 — 0 1 1 NN — 5 55 245 383
Connecticut 213 219 1,557 6,715 7,172 — 0 0 — NN — 0 49 49 77Maine† — 59 100 2,086 1,700 — 0 0 — NN — 1 4 34 76Massachusetts 466 408 860 15,030 13,780 — 0 0 — NN — 3 7 89 119New Hampshire 9 53 81 1,823 1,577 — 0 1 1 NN — 1 5 43 45Rhode Island† 89 76 154 2,773 2,284 — 0 0 — NN — 0 1 1 15Vermont† 22 26 84 969 842 — 0 0 — NN — 1 4 29 51
Mid. Atlantic 1,382 3,338 5,069 105,433 113,466 — 0 1 3 NN 28 17 38 616 585New Jersey — 521 908 17,533 17,622 — 0 0 — NN — 1 4 20 30New York (Upstate) 665 715 2,099 24,033 22,547 — 0 0 — NN 15 4 13 144 138New York City — 1,102 2,612 29,549 41,652 — 0 0 — NN — 2 6 45 58Pennsylvania 717 961 1,240 34,318 31,645 — 0 1 3 NN 13 9 26 407 359
E.N. Central 815 3,980 7,039 130,110 137,712 — 0 5 37 NN 91 32 108 1,374 1,738Illinois 19 1,080 1,320 32,853 40,598 — 0 0 — NN — 3 23 120 240Indiana 192 468 3,376 17,831 13,268 — 0 0 — NN — 4 14 166 204Michigan 420 930 1,405 31,654 33,678 — 0 3 22 NN 2 5 13 206 243Ohio 184 1,002 1,134 33,652 34,528 — 0 3 15 NN 89 9 67 621 312Wisconsin — 450 559 14,120 15,640 — 0 0 — NN — 8 61 261 739
W.N. Central 214 1,450 1,668 47,816 48,504 — 0 2 6 NN 45 19 103 865 1,313Iowa 12 211 255 7,031 7,068 — 0 0 — NN 1 7 21 258 286Kansas 21 195 288 6,709 6,555 — 0 0 — NN 1 0 4 13 83Minnesota — 284 368 7,876 10,459 — 0 0 — NN — 0 21 — 308Missouri 164 533 759 18,598 17,388 — 0 0 — NN 40 4 59 323 384Nebraska† — 106 218 4,061 3,395 — 0 2 6 NN 3 4 26 142 152North Dakota — 43 90 1,336 1,529 — 0 0 — NN — 0 9 16 16South Dakota 17 63 93 2,205 2,110 — 0 0 — NN — 1 13 113 84
S. Atlantic 4,085 5,169 6,616 183,231 174,071 — 0 2 3 NN 14 21 57 787 737Delaware 85 83 220 2,854 2,830 — 0 0 — NN — 0 1 7 5District of Columbia 139 107 180 3,539 3,560 — 0 0 — NN — 0 1 5 2Florida 815 1,492 1,706 51,225 50,757 — 0 0 — NN 6 8 23 309 273Georgia 312 979 2,384 34,567 29,829 — 0 0 — NN 6 5 11 198 194Maryland† 349 448 1,125 15,153 16,158 — 0 2 3 NN 1 1 6 46 29North Carolina 1,175 786 1,477 31,924 30,018 — 0 0 — NN — 0 17 36 64South Carolina† 458 523 946 18,900 17,527 — 0 0 — NN 1 2 8 85 79Virginia† 648 655 965 22,283 20,915 — 0 0 — NN — 2 8 85 78West Virginia 104 78 121 2,786 2,477 — 0 0 — NN — 0 5 16 13
E.S. Central 515 1,794 3,314 62,241 62,060 — 0 0 — NN 2 7 20 198 209Alabama† — 528 1,564 17,914 17,775 — 0 0 — NN — 3 14 84 98Kentucky 207 267 2,352 10,565 10,546 — 0 0 — NN — 1 4 28 56Mississippi — 398 614 13,479 14,728 — 0 0 — NN 1 0 2 20 12Tennessee† 308 593 795 20,283 19,011 — 0 0 — NN 1 1 6 66 43
W.S. Central 2,587 3,342 4,338 119,008 119,330 — 0 1 1 NN 1 7 62 260 283Arkansas† 275 315 440 11,044 10,384 — 0 0 — NN — 0 3 11 22Louisiana 46 526 1,052 15,616 17,227 — 0 1 1 NN — 0 9 35 45Oklahoma 436 224 850 7,384 9,808 — 0 0 — NN 1 2 34 61 61Texas† 1,830 2,400 3,107 84,964 81,911 — 0 0 — NN — 4 28 153 155
Mountain 507 1,649 2,155 57,637 56,077 70 249 432 9,316 NN 5 12 30 415 422Arizona 155 512 698 17,450 18,370 68 247 427 9,200 NN — 1 4 27 26Colorado — 412 848 15,504 12,972 — 0 0 — NN — 3 12 114 94Idaho† — 75 235 2,619 2,736 — 0 0 — NN 3 2 9 84 71Montana† 32 61 88 2,193 2,048 — 0 2 3 NN 2 1 6 53 34Nevada† 222 199 380 7,313 6,848 2 1 5 66 NN — 0 7 3 24New Mexico† 78 198 1,183 6,939 7,310 — 0 4 34 NN — 3 12 87 100Utah 20 132 175 4,403 4,402 — 0 2 10 NN — 1 5 27 54Wyoming† — 38 90 1,216 1,391 — 0 2 3 NN — 0 5 20 19
Pacific 1,527 3,845 6,559 128,920 127,491 6 53 142 2,320 NN 12 11 29 353 441Alaska — 109 157 3,680 4,208 — 0 0 — NN — 0 3 7 2California 969 2,920 5,763 99,211 97,368 6 53 142 2,315 NN 9 6 19 213 233Hawaii — 108 138 3,230 4,152 — 0 0 — NN — 0 0 — 1Oregon 244 267 524 9,212 7,597 — 0 1 5 NN 2 2 11 82 144Washington 314 423 522 13,587 14,166 — 0 0 — NN 1 1 9 51 61
TerritoriesAmerican Samoa — 0 0 — — — 0 0 — NN N 0 0 N NC.N.M.I. — — — — — — — — — NN — — — — —Guam — 6 81 189 615 — 0 0 — NN — 0 0 — —Puerto Rico 122 96 349 3,641 4,209 — 0 0 — NN N 0 0 N NU.S. Virgin Islands 1 16 27 539 385 — 0 0 — NN — 0 0 — —
C.N.M.I.: Commonwealth of Northern Mariana Islands.U: Unavailable. —: No reported cases. N: Not reportable. NN: Not Nationally Notifiable. Cum: Cumulative year-to-date counts. Med: Median. Max: Maximum.* Case counts for reporting year 2010 and 2011 are provisional and subject to change. For further information on interpretation of these data, see http://www.cdc.gov/osels/ph_surveillance/
nndss/phs/files/ProvisionalNationa%20NotifiableDiseasesSurveillanceData20100927.pdf. Data for TB are displayed in Table IV, which appears quarterly.† Contains data reported through the National Electronic Disease Surveillance System (NEDSS).

Morbidity and Mortality Weekly Report
1220 MMWR / September 9, 2011 / Vol. 60 / No. 35
TABLE II. (Continued) Provisional cases of selected notifiable diseases, United States, weeks ending September 3, 2011, and September 4, 2010 (35th week)*
Reporting area
Dengue Virus Infection†
Dengue Fever§ Dengue Hemorrhagic Fever¶
Current week
Previous 52 weeks Cum 2011
Cum 2010
Current week
Previous 52 weeks Cum 2011
Cum 2010Med Max Med Max
United States — 3 37 75 528 — 0 2 — 7New England — 0 3 1 5 — 0 0 — —
Connecticut — 0 0 — — — 0 0 — —Maine** — 0 2 — 3 — 0 0 — —Massachusetts — 0 0 — — — 0 0 — —New Hampshire — 0 0 — — — 0 0 — —Rhode Island** — 0 1 — — — 0 0 — —Vermont** — 0 1 1 2 — 0 0 — —
Mid. Atlantic — 1 14 22 180 — 0 1 — 4New Jersey — 0 3 — 22 — 0 0 — —New York (Upstate) — 0 2 — 28 — 0 1 — 2New York City — 0 10 10 112 — 0 1 — 2Pennsylvania — 0 2 12 18 — 0 0 — —
E.N. Central — 0 6 6 50 — 0 0 — 1Illinois — 0 2 1 13 — 0 0 — —Indiana — 0 1 1 11 — 0 0 — —Michigan — 0 2 2 8 — 0 0 — —Ohio — 0 1 — 13 — 0 0 — —Wisconsin — 0 2 2 5 — 0 0 — 1
W.N. Central — 0 6 3 21 — 0 1 — —Iowa — 0 1 2 1 — 0 0 — —Kansas — 0 1 1 3 — 0 0 — —Minnesota — 0 1 — 12 — 0 0 — —Missouri — 0 1 — 4 — 0 0 — —Nebraska** — 0 6 — — — 0 0 — —North Dakota — 0 0 — 1 — 0 0 — —South Dakota — 0 0 — — — 0 1 — —
S. Atlantic — 1 10 23 186 — 0 1 — 1Delaware — 0 0 — — — 0 0 — —District of Columbia — 0 0 — — — 0 0 — —Florida — 1 8 19 144 — 0 1 — 1Georgia — 0 2 3 9 — 0 0 — —Maryland** — 0 0 — — — 0 0 — —North Carolina — 0 1 1 6 — 0 0 — —South Carolina** — 0 1 — 13 — 0 0 — —Virginia** — 0 2 — 12 — 0 0 — —West Virginia — 0 0 — 2 — 0 0 — —
E.S. Central — 0 1 — 5 — 0 0 — —Alabama** — 0 1 — 2 — 0 0 — —Kentucky — 0 0 — 2 — 0 0 — —Mississippi — 0 0 — — — 0 0 — —Tennessee** — 0 0 — 1 — 0 0 — —
W.S. Central — 0 2 5 24 — 0 0 — 1Arkansas** — 0 0 — — — 0 0 — 1Louisiana — 0 1 2 4 — 0 0 — —Oklahoma — 0 1 — 4 — 0 0 — —Texas** — 0 1 3 16 — 0 0 — —
Mountain — 0 2 3 16 — 0 0 — —Arizona — 0 2 2 6 — 0 0 — —Colorado — 0 0 — — — 0 0 — —Idaho** — 0 1 — 2 — 0 0 — —Montana** — 0 1 — 3 — 0 0 — —Nevada** — 0 0 — 4 — 0 0 — —New Mexico** — 0 0 — 1 — 0 0 — —Utah — 0 1 1 — — 0 0 — —Wyoming** — 0 0 — — — 0 0 — —
Pacific — 0 7 12 41 — 0 0 — —Alaska — 0 0 — 1 — 0 0 — —California — 0 5 2 28 — 0 0 — —Hawaii — 0 4 5 — — 0 0 — —Oregon — 0 0 — — — 0 0 — —Washington — 0 2 5 12 — 0 0 — —
TerritoriesAmerican Samoa — 0 0 — — — 0 0 — —C.N.M.I. — — — — — — — — — —Guam — 0 0 — — — 0 0 — —Puerto Rico — 21 453 473 7,719 — 0 14 5 182U.S. Virgin Islands — 0 0 — — — 0 0 — —
C.N.M.I.: Commonwealth of Northern Mariana Islands.U: Unavailable. —: No reported cases. N: Not reportable. NN: Not Nationally Notifiable. Cum: Cumulative year-to-date counts. Med: Median. Max: Maximum. * Case counts for reporting year 2010 and 2011 are provisional and subject to change. For further information on interpretation of these data, see http://www.cdc.gov/osels/ph_surveillance/
nndss/phs/files/ProvisionalNationa%20NotifiableDiseasesSurveillanceData20100927.pdf. Data for TB are displayed in Table IV, which appears quarterly. † Updated weekly from reports to the Division of Vector-Borne Infectious Diseases, National Center for Zoonotic, Vector-Borne, and Enteric Diseases (ArboNET Surveillance). § Dengue Fever includes cases that meet criteria for Dengue Fever with hemorrhage, other clinical and unknown case classifications. ¶ DHF includes cases that meet criteria for dengue shock syndrome (DSS), a more severe form of DHF. ** Contains data reported through the National Electronic Disease Surveillance System (NEDSS).

Morbidity and Mortality Weekly Report
MMWR / September 9, 2011 / Vol. 60 / No. 35 1221
TABLE II. (Continued) Provisional cases of selected notifiable diseases, United States, weeks ending September 3, 2011, and September 4, 2010 (35th week)*
Reporting area
Ehrlichiosis/Anaplasmosis†
Ehrlichia chaffeensis Anaplasma phagocytophilum Undetermined
Current week
Previous 52 weeks Cum 2011
Cum 2010
Current week
Previous 52 weeks Cum 2011
Cum 2010
Current week
Previous 52 weeks Cum 2011
Cum 2010Med Max Med Max Med Max
United States 11 7 109 520 517 10 16 42 379 1,367 2 1 13 69 73New England — 0 2 4 3 — 2 15 105 67 — 0 1 1 2
Connecticut — 0 0 — — — 0 6 — 25 — 0 0 — —Maine§ — 0 1 1 2 — 0 2 12 13 — 0 0 — —Massachusetts — 0 0 — — — 0 10 49 — — 0 0 — —New Hampshire — 0 1 2 1 — 0 4 11 11 — 0 1 1 2Rhode Island§ — 0 1 1 — — 0 10 30 17 — 0 0 — —Vermont§ — 0 0 — — — 0 1 3 1 — 0 0 — —
Mid. Atlantic 2 1 7 43 71 7 4 27 187 188 — 0 2 7 8New Jersey — 0 1 — 46 — 0 3 — 57 — 0 0 — 1New York (Upstate) 2 0 7 39 19 7 3 25 161 121 — 0 2 7 5New York City — 0 1 4 5 — 0 5 24 10 — 0 0 — —Pennsylvania — 0 1 — 1 — 0 1 2 — — 0 1 — 2
E.N. Central — 0 3 21 36 — 1 9 10 425 2 0 4 33 40Illinois — 0 2 11 12 — 0 1 3 5 — 0 1 2 3Indiana — 0 0 — — — 0 0 — — 2 0 3 26 14Michigan — 0 2 4 2 — 0 1 — 2 — 0 2 3 —Ohio — 0 1 6 6 — 0 1 4 2 — 0 1 1 —Wisconsin — 0 1 — 16 — 0 9 3 416 — 0 1 1 23
W.N. Central — 1 17 132 113 — 1 20 26 620 — 0 11 14 8Iowa N 0 0 N N N 0 0 N N N 0 0 N NKansas — 0 1 2 6 — 0 1 1 1 — 0 0 — —Minnesota — 0 12 — — — 0 20 1 609 — 0 11 — —Missouri — 0 17 129 106 — 0 7 23 10 — 0 7 13 8Nebraska§ — 0 1 — 1 — 0 0 — — — 0 1 1 —North Dakota N 0 0 N N N 0 0 N N N 0 0 N NSouth Dakota — 0 1 1 — — 0 1 1 — — 0 0 — —
S. Atlantic 8 3 33 184 198 3 1 8 40 47 — 0 1 5 4Delaware — 0 2 14 16 — 0 1 1 4 — 0 0 — —District of Columbia N 0 0 N N N 0 0 N N N 0 0 N NFlorida — 0 3 13 8 3 0 1 7 2 — 0 0 — —Georgia — 0 3 16 19 — 0 2 7 1 — 0 1 1 1Maryland§ — 0 3 19 18 — 0 2 3 12 — 0 0 — 2North Carolina 8 0 17 55 68 — 0 6 17 19 — 0 0 — —South Carolina§ — 0 1 1 4 — 0 1 — — — 0 0 — —Virginia§ — 1 13 66 63 — 0 2 5 9 — 0 1 3 1West Virginia — 0 1 — 2 — 0 0 — — — 0 1 1 —
E.S. Central 1 0 7 56 76 — 0 2 10 18 — 0 1 6 8Alabama§ — 0 1 — 10 — 0 1 3 7 N 0 0 N NKentucky — 0 2 9 12 — 0 0 — — — 0 0 — 1Mississippi — 0 1 3 3 — 0 0 — 2 — 0 0 — 1Tennessee§ 1 0 5 44 51 — 0 1 7 9 — 0 1 6 6
W.S. Central — 0 87 80 19 — 0 9 — 2 — 0 0 — 1Arkansas§ — 0 11 34 4 — 0 2 — — — 0 0 — —Louisiana — 0 0 — 1 — 0 0 — — — 0 0 — —Oklahoma — 0 82 45 11 — 0 7 — 2 — 0 0 — —Texas§ — 0 1 1 3 — 0 1 — — — 0 0 — 1
Mountain — 0 0 — — — 0 0 — — — 0 1 3 —Arizona — 0 0 — — — 0 0 — — — 0 1 3 —Colorado N 0 0 N N N 0 0 N N N 0 0 N NIdaho§ N 0 0 N N N 0 0 N N N 0 0 N NMontana§ N 0 0 N N N 0 0 N N N 0 0 N NNevada§ N 0 0 N N N 0 0 N N N 0 0 N NNew Mexico§ N 0 0 N N N 0 0 N N N 0 0 N NUtah — 0 0 — — — 0 0 — — — 0 0 — —Wyoming§ — 0 0 — — — 0 0 — — — 0 0 — —
Pacific — 0 1 — 1 — 0 1 1 — — 0 0 — 2Alaska N 0 0 N N N 0 0 N N N 0 0 N NCalifornia — 0 1 — 1 — 0 0 — — — 0 0 — 2Hawaii N 0 0 N N N 0 0 N N N 0 0 N NOregon — 0 0 — — — 0 1 1 — — 0 0 — —Washington — 0 0 — — — 0 0 — — — 0 0 — —
TerritoriesAmerican Samoa N 0 0 N N N 0 0 N N N 0 0 N NC.N.M.I. — — — — — — — — — — — — — — —Guam N 0 0 N N N 0 0 N N N 0 0 N NPuerto Rico N 0 0 N N N 0 0 N N N 0 0 N NU.S. Virgin Islands — 0 0 — — — 0 0 — — — 0 0 — —
C.N.M.I.: Commonwealth of Northern Mariana Islands.U: Unavailable. —: No reported cases. N: Not reportable. NN: Not Nationally Notifiable. Cum: Cumulative year-to-date counts. Med: Median. Max: Maximum.* Case counts for reporting year 2010 and 2011 are provisional and subject to change. For further information on interpretation of these data, see http://www.cdc.gov/osels/ph_surveillance/
nndss/phs/files/ProvisionalNationa%20NotifiableDiseasesSurveillanceData20100927.pdf. Data for TB are displayed in Table IV, which appears quarterly.† Cumulative total E. ewingii cases reported for year 2010 = 10, and 11 cases reported for 2011.§ Contains data reported through the National Electronic Disease Surveillance System (NEDSS).

Morbidity and Mortality Weekly Report
1222 MMWR / September 9, 2011 / Vol. 60 / No. 35
TABLE II. (Continued) Provisional cases of selected notifiable diseases, United States, weeks ending September 3, 2011, and September 4, 2010 (35th week)*
Reporting area
Giardiasis GonorrheaHaemophilus influenzae, invasive†
All ages, all serotypes
Current week
Previous 52 weeks Cum 2011
Cum 2010
Current week
Previous 52 weeks Cum 2011
Cum 2010
Current week
Previous 52 weeks Cum 2011
Cum 2010Med Max Med Max Med Max
United States 178 288 549 9,254 13,026 3,039 5,816 7,484 194,627 203,541 20 64 141 2,182 2,083New England 7 25 50 776 1,121 145 102 206 3,535 3,611 — 4 12 138 124
Connecticut — 4 12 131 201 69 43 150 1,504 1,632 — 1 6 37 25Maine§ 7 3 11 106 131 — 3 17 146 123 — 0 2 15 9Massachusetts — 12 22 343 485 59 48 80 1,539 1,531 — 2 6 62 66New Hampshire — 2 6 66 125 4 2 7 87 102 — 0 2 10 8Rhode Island§ — 1 10 39 49 10 7 16 224 177 — 0 2 9 10Vermont§ — 2 8 91 130 3 0 8 35 46 — 0 3 5 6
Mid. Atlantic 51 57 106 1,833 2,172 294 719 1,121 23,454 23,363 6 13 32 483 396New Jersey — 6 20 132 314 — 125 205 4,482 3,755 — 2 7 71 71New York (Upstate) 31 21 72 666 741 119 114 271 3,790 3,630 2 3 18 130 105New York City 4 17 28 548 611 — 231 497 6,336 7,948 — 3 6 106 65Pennsylvania 16 16 27 487 506 175 263 364 8,846 8,030 4 4 11 176 155
E.N. Central 22 47 99 1,479 2,256 236 1,023 2,091 33,976 37,674 2 11 22 378 338Illinois — 9 16 260 519 5 265 369 8,186 10,337 — 3 10 112 117Indiana — 6 14 181 278 41 114 1,018 4,296 3,730 — 2 7 70 67Michigan 3 10 25 304 468 133 235 490 8,020 9,351 — 1 4 44 24Ohio 19 16 29 530 556 57 319 390 10,622 10,975 2 2 7 106 83Wisconsin — 7 35 204 435 — 94 127 2,852 3,281 — 1 5 46 47
W.N. Central 20 24 73 718 1,414 51 300 363 9,963 9,754 5 4 10 111 151Iowa 5 5 15 177 200 1 38 57 1,258 1,184 — 0 0 — 1Kansas — 2 7 62 160 2 40 57 1,348 1,387 — 0 2 15 16Minnesota — 0 33 — 552 — 38 62 1,088 1,452 — 0 5 — 53Missouri 10 8 26 276 260 48 150 183 4,998 4,549 2 1 5 59 58Nebraska§ 4 4 11 134 157 — 24 49 793 781 1 1 3 25 14North Dakota 1 0 12 22 15 — 4 8 125 137 2 0 6 11 9South Dakota — 1 6 47 70 — 11 20 353 264 — 0 1 1 —
S. Atlantic 41 56 127 1,771 2,600 1,096 1,463 1,862 48,952 51,723 5 15 31 527 536Delaware 2 0 2 20 23 10 17 48 551 655 — 0 2 3 5District of Columbia — 1 3 26 41 34 37 69 1,283 1,396 — 0 1 — 3Florida 29 24 75 800 1,397 274 377 486 13,106 13,655 4 5 12 171 128Georgia — 13 51 498 512 84 313 874 10,436 10,297 — 3 7 100 119Maryland§ 5 4 11 167 196 70 118 246 3,626 4,706 — 2 5 59 45North Carolina N 0 0 N N 364 267 468 10,333 10,043 1 1 8 54 92South Carolina§ 4 2 9 73 102 134 145 257 5,302 5,377 — 1 5 53 67Virginia§ 1 7 32 165 306 109 110 185 3,763 5,257 — 2 8 73 61West Virginia — 0 8 22 23 17 15 29 552 337 — 0 9 14 16
E.S. Central — 4 11 105 128 120 495 1,007 16,838 16,830 — 3 11 135 123Alabama§ — 4 11 105 128 — 160 410 5,416 5,184 — 1 4 40 21Kentucky N 0 0 N N 61 69 712 2,882 2,742 — 0 4 19 24Mississippi N 0 0 N N — 118 197 3,681 4,131 — 0 3 12 10Tennessee§ N 0 0 N N 59 142 189 4,859 4,773 — 2 5 64 68
W.S. Central 1 6 17 164 261 772 912 1,319 30,674 32,719 1 3 26 99 97Arkansas§ — 3 9 79 74 68 95 138 3,304 3,171 1 0 3 24 14Louisiana 1 3 12 85 125 107 144 372 4,416 5,321 — 1 4 36 20Oklahoma — 0 0 — 62 143 61 254 2,128 2,882 — 1 19 38 56Texas§ N 0 0 N N 454 597 867 20,826 21,345 — 0 4 1 7
Mountain 7 26 58 816 1,204 85 192 253 6,795 6,471 1 5 12 187 224Arizona 2 3 8 86 104 34 69 110 2,570 2,172 1 2 6 74 82Colorado — 12 23 380 485 — 45 89 1,436 1,835 — 1 5 44 66Idaho§ 3 3 9 100 143 — 2 14 82 77 — 0 2 14 12Montana§ 2 2 5 47 76 — 1 4 48 76 — 0 1 2 2Nevada§ — 1 8 35 67 49 33 103 1,389 1,255 — 0 2 12 5New Mexico§ — 1 6 54 73 2 28 98 1,089 795 — 1 4 27 27Utah — 3 13 97 222 — 4 9 158 236 — 0 3 13 25Wyoming§ — 0 5 17 34 — 0 3 23 25 — 0 1 1 5
Pacific 29 49 128 1,592 1,870 240 616 791 20,440 21,396 — 4 10 124 94Alaska — 2 7 56 68 — 20 34 652 903 — 0 3 19 17California 21 32 67 1,078 1,146 176 498 695 16,815 17,480 — 0 6 29 16Hawaii — 0 4 23 42 — 13 26 417 492 — 0 3 17 16Oregon 4 7 20 212 331 21 24 40 883 683 — 2 6 56 40Washington 4 8 57 223 283 43 52 86 1,673 1,838 — 0 2 3 5
TerritoriesAmerican Samoa — 0 0 — — — 0 0 — — — 0 0 — —C.N.M.I. — — — — — — — — — — — — — — —Guam — 0 1 — 2 — 0 17 6 55 — 0 0 — —Puerto Rico — 1 7 26 59 4 6 14 221 198 — 0 0 — 1U.S. Virgin Islands — 0 0 — — — 2 7 83 99 — 0 0 — —
C.N.M.I.: Commonwealth of Northern Mariana Islands.U: Unavailable. —: No reported cases. N: Not reportable. NN: Not Nationally Notifiable. Cum: Cumulative year-to-date counts. Med: Median. Max: Maximum.* Case counts for reporting year 2010 and 2011 are provisional and subject to change. For further information on interpretation of these data, see http://www.cdc.gov/osels/ph_surveillance/
nndss/phs/files/ProvisionalNationa%20NotifiableDiseasesSurveillanceData20100927.pdf. Data for TB are displayed in Table IV, which appears quarterly.† Data for H. influenzae (age <5 yrs for serotype b, nonserotype b, and unknown serotype) are available in Table I.§ Contains data reported through the National Electronic Disease Surveillance System (NEDSS).

Morbidity and Mortality Weekly Report
MMWR / September 9, 2011 / Vol. 60 / No. 35 1223
TABLE II. (Continued) Provisional cases of selected notifiable diseases, United States, weeks ending September 3, 2011, and September 4, 2010 (35th week)*
Hepatitis (viral, acute), by type
Reporting area
A B C
Current week
Previous 52 weeks Cum 2011
Cum 2010
Current week
Previous 52 weeks Cum 2011
Cum 2010
Current week
Previous 52 weeks Cum 2011
Cum 2010Med Max Med Max Med Max
United States 11 22 74 722 1,069 14 48 167 1,533 2,191 5 17 39 633 554New England — 1 4 37 78 — 1 8 45 42 — 1 4 40 38
Connecticut — 0 3 9 20 — 0 4 10 16 — 1 3 25 24Maine† — 0 2 4 7 — 0 2 5 11 — 0 2 6 2Massachusetts — 0 2 16 42 — 0 6 29 8 — 0 2 5 12New Hampshire — 0 1 — — — 0 1 1 5 N 0 0 N NRhode Island† — 0 1 3 9 U 0 0 U U U 0 0 U UVermont† — 0 2 5 — — 0 0 — 2 — 0 1 4 —
Mid. Atlantic 2 4 12 137 172 2 5 12 178 210 — 1 6 55 73New Jersey — 1 4 18 50 — 1 4 32 57 — 0 4 1 16New York (Upstate) 2 1 4 33 36 1 1 9 32 34 — 0 4 31 35New York City — 1 6 47 51 — 1 5 54 64 — 0 0 — 3Pennsylvania — 1 3 39 35 1 2 4 60 55 — 0 3 23 19
E.N. Central — 4 9 124 133 — 5 36 222 357 — 3 12 121 65Illinois — 1 3 29 35 — 1 6 48 92 — 0 1 5 —Indiana — 0 3 11 11 — 1 3 31 52 — 0 5 44 24Michigan — 1 6 51 46 — 1 6 59 94 — 2 7 67 27Ohio — 1 5 28 27 — 1 30 69 82 — 0 1 4 8Wisconsin — 0 2 5 14 — 0 3 15 37 — 0 1 1 6
W.N. Central 1 1 25 32 55 — 2 16 91 78 — 0 6 6 11Iowa — 0 3 4 6 — 0 1 7 12 — 0 0 — —Kansas — 0 2 3 10 — 0 2 9 5 — 0 1 2 —Minnesota — 0 22 9 13 — 0 15 9 6 — 0 6 2 6Missouri — 0 1 10 15 — 2 5 54 45 — 0 1 — 3Nebraska† 1 0 4 4 10 — 0 3 11 9 — 0 1 2 2North Dakota — 0 3 — — — 0 0 — — — 0 0 — —South Dakota — 0 2 2 1 — 0 1 1 1 — 0 0 — —
S. Atlantic 6 5 13 150 234 4 12 33 396 605 — 4 11 153 125Delaware — 0 1 2 6 — 0 1 — 20 U 0 0 U UDistrict of Columbia — 0 0 — 1 — 0 0 — 3 — 0 0 — 2Florida 3 1 6 47 91 3 4 11 137 201 — 1 5 35 36Georgia — 1 4 31 26 — 2 8 60 122 — 1 3 26 15Maryland† 1 0 4 20 14 1 1 4 39 44 — 1 2 27 18North Carolina 2 0 3 17 39 — 2 12 77 69 — 1 7 39 30South Carolina† — 0 2 9 22 — 1 4 22 40 — 0 1 1 1Virginia† — 0 4 16 33 — 1 7 42 64 — 0 2 9 9West Virginia — 0 5 8 2 — 0 18 19 42 — 0 6 16 14
E.S. Central 1 0 6 33 30 3 9 14 280 238 2 3 8 110 103Alabama† — 0 2 1 5 — 2 4 63 45 — 0 1 7 5Kentucky — 0 6 7 13 1 2 6 77 84 2 1 6 45 70Mississippi — 0 1 6 2 — 1 3 31 22 U 0 0 U UTennessee† 1 0 5 19 10 2 4 7 109 87 — 1 5 58 28
W.S. Central 1 3 15 68 86 5 7 67 186 361 2 2 11 61 50Arkansas† — 0 1 — 1 — 1 4 28 44 — 0 0 — 1Louisiana — 0 1 2 5 — 1 4 22 41 — 0 2 5 2Oklahoma — 0 4 3 1 3 1 16 46 64 — 1 10 33 18Texas† 1 2 11 63 79 2 4 45 90 212 2 0 3 23 29
Mountain — 2 5 49 115 — 2 5 54 98 — 1 4 38 44Arizona — 0 2 13 50 — 0 3 12 16 U 0 0 U UColorado — 0 2 17 31 — 0 3 15 34 — 0 3 13 9Idaho† — 0 1 6 6 — 0 1 2 6 — 0 2 7 8Montana† — 0 1 2 4 — 0 0 — — — 0 1 3 2Nevada† — 0 3 5 11 — 0 3 16 31 — 0 1 5 4New Mexico† — 0 1 3 3 — 0 2 5 3 — 0 1 7 11Utah — 0 2 1 7 — 0 1 4 7 — 0 1 1 10Wyoming† — 0 1 2 3 — 0 1 — 1 — 0 1 2 —
Pacific — 3 15 92 166 — 3 25 81 202 1 1 12 49 45Alaska — 0 1 2 1 — 0 1 4 2 U 0 0 U UCalifornia — 2 15 64 131 — 1 22 32 137 — 0 4 19 19Hawaii — 0 2 7 6 — 0 1 5 3 U 0 0 U UOregon — 0 2 4 14 — 0 4 24 32 — 0 3 12 11Washington — 0 4 15 14 — 0 4 16 28 1 0 5 18 15
TerritoriesAmerican Samoa — 0 0 — — — 0 0 — — — 0 0 — —C.N.M.I. — — — — — — — — — — — — — — —Guam — 0 5 8 4 — 0 8 28 56 — 0 8 10 44Puerto Rico — 0 2 4 11 — 0 3 6 15 N 0 0 N NU.S. Virgin Islands — 0 0 — — — 0 0 — — — 0 0 — —
C.N.M.I.: Commonwealth of Northern Mariana Islands.U: Unavailable. —: No reported cases. N: Not reportable. NN: Not Nationally Notifiable. Cum: Cumulative year-to-date counts. Med: Median. Max: Maximum.* Case counts for reporting year 2010 and 2011 are provisional and subject to change. For further information on interpretation of these data, see http://www.cdc.gov/osels/ph_surveillance/
nndss/phs/files/ProvisionalNationa%20NotifiableDiseasesSurveillanceData20100927.pdf. Data for TB are displayed in Table IV, which appears quarterly.† Contains data reported through the National Electronic Disease Surveillance System (NEDSS).
Morbidity and Mortality Weekly Report
1224 MMWR / September 9, 2011 / Vol. 60 / No. 35
TABLE II. (Continued) Provisional cases of selected notifiable diseases, United States, weeks ending September 3, 2011, and September 4, 2010 (35th week)*
Reporting area
Legionellosis Lyme disease Malaria
Current week
Previous 52 weeks Cum 2011
Cum 2010
Current week
Previous 52 weeks Cum 2011
Cum 2010
Current week
Previous 52 weeks Cum 2011
Cum 2010Med Max Med Max Med Max
United States 62 53 128 1,781 2,134 259 361 1,559 18,706 23,195 19 27 114 839 1,127New England — 4 16 112 166 3 75 280 3,175 6,989 — 2 20 50 77
Connecticut — 1 6 25 25 — 34 169 1,424 2,391 — 0 20 6 2Maine† — 0 3 6 7 — 11 58 316 423 — 0 1 2 5Massachusetts — 2 9 58 89 — 17 71 494 2,767 — 1 5 33 60New Hampshire — 0 5 8 15 — 11 57 454 1,033 — 0 2 2 2Rhode Island† — 0 4 9 23 1 1 35 109 110 — 0 4 2 6Vermont† — 0 1 6 7 2 5 61 378 265 — 0 1 5 2
Mid. Atlantic 32 13 53 491 536 229 150 1,144 12,187 8,197 1 7 22 174 342New Jersey — 2 18 48 89 — 51 547 4,807 2,901 — 0 6 8 78New York (Upstate) 18 5 19 177 163 111 35 214 2,317 1,805 1 1 6 27 51New York City — 3 17 86 93 — 2 18 38 529 — 3 13 101 173Pennsylvania 14 5 19 180 191 118 62 473 5,025 2,962 — 1 4 38 40
E.N. Central 11 10 49 429 480 2 22 82 885 3,264 1 3 7 96 118Illinois — 1 6 48 117 — 1 18 86 116 — 1 4 38 48Indiana — 1 5 57 40 — 0 14 69 74 — 0 2 6 9Michigan — 2 13 93 121 — 1 9 62 80 1 0 4 17 21Ohio 11 4 34 230 154 2 1 9 38 22 — 1 4 30 31Wisconsin — 0 5 1 48 — 17 63 630 2,972 — 0 2 5 9
W.N. Central 1 2 9 52 82 4 3 39 82 1,835 — 1 45 21 49Iowa — 0 2 7 13 — 0 11 62 76 — 0 3 13 10Kansas — 0 2 4 7 — 0 2 7 10 — 0 2 6 8Minnesota — 0 8 — 23 — 0 35 — 1,728 — 0 45 — 3Missouri — 1 5 35 23 — 0 1 — 4 — 0 2 — 13Nebraska† 1 0 1 3 8 — 0 2 7 8 — 0 1 2 13North Dakota — 0 1 1 3 4 0 10 4 8 — 0 1 — —South Dakota — 0 2 2 5 — 0 1 2 1 — 0 1 — 2
S. Atlantic 17 9 22 292 361 21 57 160 2,171 2,645 15 8 20 291 299Delaware — 0 1 6 12 2 11 43 578 514 — 0 1 3 2District of Columbia — 0 3 9 14 — 0 5 11 31 — 0 1 5 10Florida 9 3 7 105 113 5 2 8 81 51 4 2 7 74 88Georgia — 1 4 26 41 — 0 2 13 9 — 1 7 55 53Maryland† 5 1 6 47 80 10 18 103 719 1,125 8 1 8 70 62North Carolina 3 1 7 47 39 3 0 8 49 60 3 0 6 33 32South Carolina† — 0 2 11 10 — 0 3 16 27 — 0 1 2 3Virginia† — 1 9 35 43 1 18 76 656 747 — 1 8 49 48West Virginia — 0 2 6 9 — 0 14 48 81 — 0 1 — 1
E.S. Central — 2 10 100 97 — 1 3 31 35 1 0 3 21 23Alabama† — 0 2 10 12 — 0 2 7 1 — 0 1 3 5Kentucky — 0 3 21 19 — 0 1 — 4 — 0 1 6 6Mississippi — 0 3 10 11 — 0 1 1 — — 0 1 1 2Tennessee† — 1 8 59 55 — 0 3 23 30 1 0 3 11 10
W.S. Central 1 3 13 78 112 — 1 29 25 76 — 1 18 24 65Arkansas† — 0 2 7 14 — 0 0 — — — 0 1 3 4Louisiana — 0 3 13 5 — 0 1 1 3 — 0 1 1 2Oklahoma — 0 3 7 11 — 0 0 — — — 0 1 3 4Texas† 1 2 11 51 82 — 1 29 24 73 — 1 17 17 55
Mountain — 2 5 58 125 — 0 4 23 21 — 1 4 46 43Arizona — 1 3 20 43 — 0 2 6 2 — 0 4 18 20Colorado — 0 2 4 23 — 0 1 1 2 — 0 3 16 13Idaho† — 0 1 4 4 — 0 2 2 8 — 0 1 2 1Montana† — 0 1 — 4 — 0 2 5 1 — 0 1 1 2Nevada† — 0 2 11 18 — 0 1 3 — — 0 2 6 3New Mexico† — 0 1 5 6 — 0 2 4 5 — 0 1 2 1Utah — 0 2 12 20 — 0 1 1 3 — 0 1 1 3Wyoming† — 0 1 2 7 — 0 1 1 — — 0 0 — —
Pacific — 5 21 169 175 — 3 11 127 133 1 4 10 116 111Alaska — 0 0 — 2 — 0 2 5 5 — 0 2 4 3California — 4 15 147 147 — 3 9 106 83 — 2 10 81 77Hawaii — 0 1 1 1 N 0 0 N N — 0 1 5 2Oregon — 0 2 9 10 — 0 2 10 38 — 0 4 11 8Washington — 0 6 12 15 — 0 4 6 7 1 0 5 15 21
TerritoriesAmerican Samoa N 0 0 N N N 0 0 N N — 0 1 1 —C.N.M.I. — — — — — — — — — — — — — — —Guam — 0 1 — — — 0 0 — — — 0 0 — —Puerto Rico — 0 1 — 1 N 0 0 N N — 0 1 — 4U.S. Virgin Islands — 0 0 — — — 0 0 — — — 0 0 — —
C.N.M.I.: Commonwealth of Northern Mariana Islands.U: Unavailable. —: No reported cases. N: Not reportable. NN: Not Nationally Notifiable. Cum: Cumulative year-to-date counts. Med: Median. Max: Maximum.* Case counts for reporting year 2010 and 2011 are provisional and subject to change. For further information on interpretation of these data, see http://www.cdc.gov/osels/ph_surveillance/
nndss/phs/files/ProvisionalNationa%20NotifiableDiseasesSurveillanceData20100927.pdf. Data for TB are displayed in Table IV, which appears quarterly.† Contains data reported through the National Electronic Disease Surveillance System (NEDSS).

Morbidity and Mortality Weekly Report
MMWR / September 9, 2011 / Vol. 60 / No. 35 1225
TABLE II. (Continued) Provisional cases of selected notifiable diseases, United States, weeks ending September 3, 2011, and September 4, 2010 (35th week)*
Reporting area
Meningococcal disease, invasive† All serogroups Mumps Pertussis
Current week
Previous 52 weeks Cum 2011
Cum 2010
Current week
Previous 52 weeks Cum 2011
Cum 2010
Current week
Previous 52 weeks Cum 2011
Cum 2010Med Max Med Max Med Max
United States 1 14 53 487 554 4 7 47 191 2,346 100 310 2,925 8,679 13,775New England — 0 3 23 14 — 0 1 5 23 1 8 24 282 336
Connecticut — 0 1 3 2 — 0 0 — 11 — 1 8 30 72Maine§ — 0 1 3 3 — 0 1 — 1 1 2 8 85 34Massachusetts — 0 2 11 4 — 0 1 3 8 — 4 13 99 185New Hampshire — 0 1 1 — — 0 0 — 3 — 1 7 41 10Rhode Island§ — 0 1 — — — 0 1 1 — — 1 4 17 24Vermont§ — 0 3 5 5 — 0 1 1 — — 0 3 10 11
Mid. Atlantic — 1 6 56 56 — 1 23 23 2,039 25 36 125 981 887New Jersey — 0 1 3 17 — 0 2 8 335 — 2 10 76 114New York (Upstate) — 0 4 18 9 — 0 3 5 655 20 12 81 411 306New York City — 0 3 22 14 — 0 22 9 1,030 — 0 19 38 53Pennsylvania — 0 2 13 16 — 0 16 1 19 5 15 70 456 414
E.N. Central — 2 7 65 94 — 1 7 50 44 15 63 198 1,794 3,132Illinois — 0 3 20 19 — 1 3 30 15 — 15 50 458 549Indiana — 0 2 9 21 — 0 1 — 3 — 5 26 126 447Michigan — 0 4 7 15 — 0 1 7 16 4 22 57 479 887Ohio — 1 2 20 23 — 0 5 11 9 11 18 80 516 987Wisconsin — 0 2 9 16 — 0 1 2 1 — 9 26 215 262
W.N. Central — 1 4 33 39 — 0 4 27 79 2 24 501 771 1,316Iowa — 0 1 8 8 — 0 1 5 37 — 6 36 126 356Kansas — 0 1 2 6 — 0 1 4 4 — 2 10 68 122Minnesota — 0 2 — 3 — 0 4 1 4 — 0 469 295 392Missouri — 0 2 12 16 — 0 3 9 9 1 6 43 197 270Nebraska§ — 0 2 8 5 — 0 1 4 23 1 1 13 39 117North Dakota — 0 1 1 1 — 0 3 4 — — 0 10 36 32South Dakota — 0 1 2 — — 0 0 — 2 — 0 3 10 27
S. Atlantic 1 2 8 98 101 2 0 3 19 45 31 31 106 918 1,144Delaware — 0 1 1 — — 0 0 — — — 0 5 21 9District of Columbia — 0 1 1 1 — 0 0 — 3 — 0 2 3 5Florida 1 1 5 38 45 — 0 2 5 8 17 6 17 228 217Georgia — 0 1 11 8 — 0 2 4 2 1 3 13 120 172Maryland§ — 0 1 10 6 — 0 1 1 9 4 2 6 51 90North Carolina — 0 3 13 12 2 0 2 7 7 6 3 35 127 221South Carolina§ — 0 1 9 10 — 0 0 — 4 1 3 25 95 255Virginia§ — 0 2 10 17 — 0 2 2 10 2 7 41 221 140West Virginia — 0 3 5 2 — 0 0 — 2 — 0 41 52 35
E.S. Central — 0 3 20 28 — 0 1 3 9 7 9 28 240 533Alabama§ — 0 2 9 5 — 0 1 1 6 — 3 11 89 149Kentucky — 0 2 2 12 — 0 0 — 1 3 1 16 55 173Mississippi — 0 1 2 3 — 0 1 2 — — 1 10 22 54Tennessee§ — 0 2 7 8 — 0 1 — 2 4 2 10 74 157
W.S. Central — 1 12 39 59 1 1 15 47 59 14 24 297 617 2,022Arkansas§ — 0 1 8 5 — 0 1 1 5 1 1 16 38 161Louisiana — 0 2 8 12 — 0 2 — 5 — 0 3 15 29Oklahoma — 0 2 7 14 — 0 1 1 — 2 0 92 25 31Texas§ — 0 10 16 28 1 1 14 45 49 11 20 187 539 1,801
Mountain — 1 4 34 44 1 0 4 7 14 4 43 100 1,216 941Arizona — 0 1 10 11 — 0 0 — 5 3 14 29 503 292Colorado — 0 1 8 15 — 0 1 3 7 — 9 63 281 139Idaho§ — 0 1 4 5 1 0 1 2 — 1 2 15 94 122Montana§ — 0 2 3 1 — 0 0 — — — 2 16 70 36Nevada§ — 0 1 1 8 — 0 1 — — — 0 5 18 21New Mexico§ — 0 1 1 3 — 0 2 2 — — 3 10 81 86Utah — 0 2 7 1 — 0 1 — 2 — 5 16 164 236Wyoming§ — 0 1 — — — 0 1 — — — 0 2 5 9
Pacific — 3 26 119 119 — 0 3 10 34 1 70 1,710 1,860 3,464Alaska — 0 1 2 1 — 0 1 1 1 — 0 6 19 27California — 2 17 86 76 — 0 3 3 22 — 57 1,569 1,340 2,960Hawaii — 0 1 4 1 — 0 1 2 3 — 1 9 64 57Oregon — 0 3 15 24 — 0 1 4 2 1 5 11 179 212Washington — 0 8 12 17 — 0 1 — 6 — 9 131 258 208
TerritoriesAmerican Samoa — 0 0 — — — 0 0 — — — 0 0 — —C.N.M.I. — — — — — — — — — — — — — — —Guam — 0 0 — — — 2 9 12 432 — 0 14 31 2Puerto Rico — 0 1 — 1 — 0 1 1 1 — 0 1 2 1U.S. Virgin Islands — 0 0 — — — 0 0 — — — 0 0 — —
C.N.M.I.: Commonwealth of Northern Mariana Islands.U: Unavailable. —: No reported cases. N: Not reportable. NN: Not Nationally Notifiable. Cum: Cumulative year-to-date counts. Med: Median. Max: Maximum.* Case counts for reporting year 2010 and 2011 are provisional and subject to change. For further information on interpretation of these data, see http://www.cdc.gov/osels/ph_surveillance/
nndss/phs/files/ProvisionalNationa%20NotifiableDiseasesSurveillanceData20100927.pdf. Data for TB are displayed in Table IV, which appears quarterly.† Data for meningococcal disease, invasive caused by serogroups A, C, Y, and W-135; serogroup B; other serogroup; and unknown serogroup are available in Table I.§ Contains data reported through the National Electronic Disease Surveillance System (NEDSS).

Morbidity and Mortality Weekly Report
1226 MMWR / September 9, 2011 / Vol. 60 / No. 35
TABLE II. (Continued) Provisional cases of selected notifiable diseases, United States, weeks ending September 3, 2011, and September 4, 2010 (35th week)*
Reporting area
Rabies, animal Salmonellosis Shiga toxin-producing E. coli (STEC)†
Current week
Previous 52 weeks Cum 2011
Cum 2010
Current week
Previous 52 weeks Cum 2011
Cum 2010
Current week
Previous 52 weeks Cum 2011
Cum 2010Med Max Med Max Med Max
United States 34 56 119 1,712 3,114 655 931 1,703 27,909 33,568 59 98 264 3,016 3,425New England 6 3 13 121 220 2 29 351 1,254 1,820 — 2 36 131 163
Connecticut — 0 9 28 101 — 0 330 330 491 — 0 36 36 60Maine§ 5 1 3 46 43 2 2 8 89 83 — 0 3 22 12Massachusetts — 0 0 — — — 17 41 554 927 — 1 10 44 60New Hampshire — 0 3 15 15 — 3 8 112 135 — 0 3 17 18Rhode Island§ — 0 4 15 23 — 1 62 128 136 — 0 2 4 2Vermont§ 1 1 3 17 38 — 1 5 41 48 — 0 3 8 11
Mid. Atlantic 7 13 29 425 770 59 93 201 3,219 4,049 18 9 24 362 384New Jersey — 0 0 — — — 12 40 322 839 — 1 6 36 86New York (Upstate) 7 7 20 247 367 33 25 66 891 950 10 4 12 141 125New York City — 0 4 9 134 4 21 46 737 909 — 1 6 57 50Pennsylvania — 6 17 169 269 22 32 108 1,269 1,351 8 3 15 128 123
E.N. Central 6 2 14 117 198 42 89 161 2,842 4,225 8 12 30 455 616Illinois 4 1 6 40 99 — 28 57 941 1,424 — 2 7 76 117Indiana — 0 4 10 — — 11 23 308 552 1 2 7 80 99Michigan 1 1 6 38 58 3 14 49 504 668 — 2 14 105 117Ohio 1 0 3 29 41 39 21 47 820 938 7 2 10 120 109Wisconsin N 0 0 N N — 9 40 269 643 — 2 12 74 174
W.N. Central 3 2 40 55 203 61 47 86 1,520 2,064 13 13 40 485 636Iowa — 0 2 — 22 2 9 20 299 375 — 2 15 129 129Kansas — 0 4 21 48 8 7 20 269 305 2 1 8 65 51Minnesota — 0 34 — 25 — 0 21 — 542 — 0 11 — 212Missouri — 0 2 — 56 38 16 41 643 544 7 4 14 173 169Nebraska§ 3 0 3 26 42 5 4 13 163 165 — 2 7 75 50North Dakota — 0 6 8 10 8 0 15 30 26 4 0 10 10 5South Dakota — 0 0 — — — 3 17 116 107 — 1 4 33 20
S. Atlantic 8 19 75 744 815 321 279 707 8,456 8,814 8 14 29 432 455Delaware — 0 0 — — 1 3 10 109 116 — 0 2 11 4District of Columbia — 0 0 — — — 1 4 38 76 — 0 1 3 8Florida — 0 66 66 121 162 107 226 3,330 3,605 3 3 15 92 138Georgia — 0 0 — — 37 42 121 1,522 1,749 — 2 8 81 72Maryland§ — 6 14 204 258 33 18 51 610 730 — 1 8 29 64North Carolina — 0 0 — — 68 33 251 1,250 825 5 2 11 84 44South Carolina§ N 0 0 N N 18 30 99 889 885 — 0 4 12 17Virginia§ — 11 27 411 383 2 21 68 666 695 — 3 9 117 94West Virginia 8 0 30 63 53 — 0 14 42 133 — 0 4 3 14
E.S. Central — 2 7 75 135 42 60 168 2,192 2,347 1 5 22 196 173Alabama§ — 1 7 51 56 — 16 57 555 610 — 1 15 65 37Kentucky — 0 2 10 15 13 9 32 271 361 1 1 5 29 40Mississippi — 0 1 1 — 10 21 61 757 728 — 0 12 17 11Tennessee§ — 0 4 13 64 19 17 50 609 648 — 2 11 85 85
W.S. Central — 1 31 53 591 65 133 515 3,556 4,059 2 7 151 214 195Arkansas§ — 0 10 41 22 26 14 43 487 423 — 1 3 28 40Louisiana — 0 0 — — — 15 52 505 848 — 0 2 6 13Oklahoma — 0 20 12 38 31 11 95 407 378 2 1 55 38 16Texas§ — 0 30 — 531 8 87 381 2,157 2,410 — 6 95 142 126
Mountain 2 0 5 22 46 8 48 90 1,571 1,964 5 11 30 363 426Arizona N 0 0 N N 2 14 39 478 647 — 2 14 61 42Colorado — 0 0 — — — 10 23 365 409 — 3 11 82 161Idaho§ — 0 2 2 7 1 3 8 106 114 1 3 6 69 52Montana§ N 0 0 N N 2 2 10 91 72 3 1 5 32 28Nevada§ — 0 2 4 5 3 3 11 96 220 — 0 7 26 25New Mexico§ 2 0 1 10 9 — 6 19 190 215 — 1 6 27 32Utah — 0 2 6 7 — 6 15 201 243 — 1 7 53 68Wyoming§ — 0 4 — 18 — 1 9 44 44 1 0 3 13 18
Pacific 2 3 15 100 136 55 107 288 3,299 4,226 4 13 46 378 377Alaska — 0 2 9 11 — 1 6 41 62 — 0 1 1 1California 2 3 10 84 112 41 77 232 2,530 3,074 2 8 36 247 161Hawaii — 0 0 — — — 6 14 220 233 — 0 1 5 27Oregon — 0 2 7 13 1 6 14 159 392 — 1 11 48 65Washington — 0 14 — — 13 12 42 349 465 2 2 16 77 123
TerritoriesAmerican Samoa N 0 0 N N — 0 0 — 2 — 0 0 — —C.N.M.I. — — — — — — — — — — — — — — —Guam — 0 0 — — — 0 3 6 8 — 0 0 — —Puerto Rico 1 0 6 24 33 — 6 25 118 389 — 0 0 — —U.S. Virgin Islands — 0 0 — — — 0 0 — — — 0 0 — —
C.N.M.I.: Commonwealth of Northern Mariana Islands.U: Unavailable. —: No reported cases. N: Not reportable. NN: Not Nationally Notifiable. Cum: Cumulative year-to-date counts. Med: Median. Max: Maximum.* Case counts for reporting year 2010 and 2011 are provisional and subject to change. For further information on interpretation of these data, see http://www.cdc.gov/osels/ph_surveillance/
nndss/phs/files/ProvisionalNationa%20NotifiableDiseasesSurveillanceData20100927.pdf. Data for TB are displayed in Table IV, which appears quarterly.† Includes E. coli O157:H7; Shiga toxin-positive, serogroup non-O157; and Shiga toxin-positive, not serogrouped.§ Contains data reported through the National Electronic Disease Surveillance System (NEDSS).

Morbidity and Mortality Weekly Report
MMWR / September 9, 2011 / Vol. 60 / No. 35 1227
TABLE II. (Continued) Provisional cases of selected notifiable diseases, United States, weeks ending September 3, 2011, and September 4, 2010 (35th week)*
Spotted Fever Rickettsiosis (including RMSF)†
Reporting area
Shigellosis Confirmed Probable
Current week
Previous 52 weeks Cum 2011
Cum 2010
Current week
Previous 52 weeks Cum 2011
Cum 2010
Current week
Previous 52 weeks Cum 2011
Cum 2010Med Max Med Max Med Max
United States 122 232 742 6,882 9,396 3 2 15 117 106 36 24 245 1,110 1,103New England — 3 29 131 276 — 0 0 — — — 0 1 3 2
Connecticut — 0 28 28 69 — 0 0 — — — 0 0 — —Maine§ — 0 4 19 5 — 0 0 — — — 0 1 — 1Massachusetts — 2 13 76 181 — 0 0 — — — 0 1 1 —New Hampshire — 0 2 1 9 — 0 0 — — — 0 1 1 1Rhode Island§ — 0 4 4 11 — 0 0 — — — 0 1 1 —Vermont§ — 0 1 3 1 — 0 0 — — — 0 0 — —
Mid. Atlantic 14 14 74 440 1,256 1 0 2 11 2 — 1 5 24 74New Jersey — 2 10 51 288 — 0 0 — 1 — 0 3 — 44New York (Upstate) 9 3 18 155 151 1 0 1 3 1 — 0 2 5 9New York City 1 4 14 154 225 — 0 0 — — — 0 2 10 9Pennsylvania 4 3 56 80 592 — 0 2 8 — — 0 3 9 12
E.N. Central 8 16 40 493 1,227 — 0 2 4 3 3 1 6 62 66Illinois — 5 10 115 712 — 0 1 — 2 — 0 2 22 29Indiana§ — 1 4 40 46 — 0 0 — 1 2 0 4 30 18Michigan 1 3 10 110 183 — 0 1 1 — — 0 1 — 1Ohio 7 5 27 228 229 — 0 2 3 — 1 0 2 10 12Wisconsin — 0 4 — 57 — 0 0 — — — 0 1 — 6
W.N. Central 1 9 38 215 1,696 1 0 7 23 11 3 4 30 252 214Iowa — 0 4 12 39 — 0 0 — — — 0 2 4 5Kansas§ — 2 12 38 195 — 0 0 — — — 0 0 — —Minnesota — 0 4 — 39 — 0 0 — — — 0 2 — —Missouri 1 5 18 153 1,390 — 0 4 16 8 3 4 30 246 206Nebraska§ — 0 10 8 26 — 0 3 5 3 — 0 1 2 2North Dakota — 0 0 — — 1 0 1 2 — — 0 0 — 1South Dakota — 0 2 4 7 — 0 0 — — — 0 0 — —
S. Atlantic 80 68 133 2,506 1,574 1 1 7 62 67 23 6 50 304 337Delaware§ — 0 1 3 36 — 0 1 1 1 — 0 4 15 16District of Columbia — 0 2 10 24 — 0 1 1 — — 0 1 1 —Florida§ 65 42 98 1,805 684 — 0 1 3 2 1 0 2 7 7Georgia 7 12 26 370 499 — 0 5 36 48 — 0 0 — —Maryland§ 5 2 5 65 89 — 0 1 2 — — 0 3 18 33North Carolina 2 4 36 149 104 1 0 4 11 12 22 1 41 162 173South Carolina§ 1 1 4 36 49 — 0 1 5 1 — 0 2 15 12Virginia§ — 2 8 64 88 — 0 1 3 3 — 2 8 83 96West Virginia — 0 66 4 1 — 0 0 — — — 0 1 3 —
E.S. Central 2 13 29 371 498 — 0 3 4 16 6 5 18 237 310Alabama§ — 4 15 116 109 — 0 1 — 4 — 0 5 28 58Kentucky 1 1 6 35 185 — 0 1 1 6 — 0 0 — —Mississippi — 2 9 101 36 — 0 0 — 1 — 0 4 9 17Tennessee§ 1 4 14 119 168 — 0 2 3 5 6 4 18 200 235
W.S. Central 3 60 503 1,632 1,686 — 0 8 3 1 — 2 235 197 91Arkansas§ — 2 7 48 39 — 0 2 2 — — 0 37 170 56Louisiana — 5 19 154 180 — 0 0 — — — 0 1 3 2Oklahoma 2 2 161 66 193 — 0 5 1 — — 0 202 21 17Texas§ 1 49 338 1,364 1,274 — 0 1 — 1 — 0 5 3 16
Mountain 10 15 32 474 501 — 0 5 10 2 1 0 6 31 8Arizona 5 6 19 162 269 — 0 4 10 — — 0 6 18 —Colorado§ — 2 7 58 63 — 0 1 — — — 0 1 2 —Idaho§ 1 0 3 14 18 — 0 0 — — — 0 1 1 3Montana§ 1 1 15 115 7 — 0 0 — 2 — 0 1 1 1Nevada§ 3 0 6 17 22 — 0 0 — — — 0 0 — —New Mexico§ — 3 9 74 90 — 0 0 — — — 0 1 1 1Utah — 1 4 32 32 — 0 0 — — — 0 1 1 3Wyoming§ — 0 1 2 — — 0 0 — — 1 0 2 7 —
Pacific 4 21 63 620 682 — 0 2 — 4 — 0 0 — 1Alaska — 0 2 5 1 N 0 0 N N N 0 0 N NCalifornia 4 17 59 498 538 — 0 2 — 4 — 0 0 — —Hawaii — 1 3 37 36 N 0 0 N N N 0 0 N NOregon — 1 4 27 40 — 0 0 — — — 0 0 — 1Washington — 1 8 53 67 — 0 1 — — — 0 0 — —
TerritoriesAmerican Samoa — 1 1 1 1 N 0 0 N N N 0 0 N NC.N.M.I. — — — — — — — — — — — — — — —Guam — 0 1 1 5 N 0 0 N N N 0 0 N NPuerto Rico — 0 1 — 4 N 0 0 N N N 0 0 N NU.S. Virgin Islands — 0 0 — — — 0 0 — — — 0 0 — —
C.N.M.I.: Commonwealth of Northern Mariana Islands.U: Unavailable. —: No reported cases. N: Not reportable. NN: Not Nationally Notifiable. Cum: Cumulative year-to-date counts. Med: Median. Max: Maximum.* Case counts for reporting year 2010 and 2011 are provisional and subject to change. For further information on interpretation of these data, see http://www.cdc.gov/osels/ph_surveillance/
nndss/phs/files/ProvisionalNationa%20NotifiableDiseasesSurveillanceData20100927.pdf. Data for TB are displayed in Table IV, which appears quarterly.† Illnesses with similar clinical presentation that result from Spotted fever group rickettsia infections are reported as Spotted fever rickettsioses. Rocky Mountain spotted fever (RMSF) caused
by Rickettsia rickettsii, is the most common and well-known spotted fever.§ Contains data reported through the National Electronic Disease Surveillance System (NEDSS).

Morbidity and Mortality Weekly Report
1228 MMWR / September 9, 2011 / Vol. 60 / No. 35
TABLE II. (Continued) Provisional cases of selected notifiable diseases, United States, weeks ending September 3, 2011, and September 4, 2010 (35th week)*
Streptococcus pneumoniae,† invasive disease
Reporting area
All ages Age <5 Syphilis, primary and secondary
Current week
Previous 52 weeks Cum 2011
Cum 2010
Current week
Previous 52 weeks Cum 2011
Cum 2010
Current week
Previous 52 weeks Cum 2011
Cum 2010Med Max Med Max Med Max
United States 86 298 937 9,675 10,625 7 23 101 702 1,307 99 254 363 8,164 9,098New England — 17 79 541 594 — 1 5 29 76 5 8 18 245 317
Connecticut — 6 49 235 246 — 0 3 6 22 5 1 8 39 59Maine§ — 2 13 92 84 — 0 1 3 6 — 0 3 11 16Massachusetts — 0 3 21 53 — 0 3 8 37 — 5 11 145 201New Hampshire — 2 8 72 79 — 0 1 5 4 — 0 3 13 14Rhode Island§ — 2 8 70 73 — 0 1 2 4 — 0 7 32 25Vermont§ — 1 6 51 59 — 0 2 5 3 — 0 2 5 2
Mid. Atlantic 3 33 81 964 1,095 — 3 27 83 165 9 29 46 931 1,153New Jersey — 13 35 452 491 — 1 4 28 41 — 5 12 134 159New York (Upstate) — 2 10 59 107 — 1 9 33 81 3 3 20 124 93New York City 3 14 42 453 497 — 0 14 22 43 — 15 31 440 652Pennsylvania N 0 0 N N N 0 0 N N 6 7 13 233 249
E.N. Central 9 66 113 2,089 2,154 — 4 10 116 195 6 30 48 991 1,329Illinois N 0 0 N N N 0 0 N N 5 13 22 405 633Indiana — 15 32 458 486 — 0 4 20 41 1 3 8 109 127Michigan 4 15 29 468 494 — 1 4 25 59 — 5 10 159 178Ohio 5 26 45 862 834 — 2 7 59 68 — 9 21 286 357Wisconsin — 9 24 301 340 — 0 3 12 27 — 1 4 32 34
W.N. Central 28 4 35 124 558 2 0 5 9 77 1 7 18 196 221Iowa N 0 0 N N N 0 0 N N — 0 2 12 15Kansas N 0 0 N N N 0 0 N N 1 0 3 17 13Minnesota — 0 24 — 420 — 0 5 — 62 — 3 10 80 83Missouri N 0 0 N N N 0 0 N N — 2 9 81 103Nebraska§ 3 2 9 81 93 1 0 2 8 13 — 0 2 5 5North Dakota 25 0 18 43 45 1 0 1 1 2 — 0 1 1 —South Dakota N 0 0 N N N 0 0 N N — 0 1 — 2
S. Atlantic 26 72 170 2,694 2,887 4 7 22 201 365 35 64 178 2,139 2,065Delaware — 1 6 35 27 — 0 1 — — 2 0 4 15 4District of Columbia — 1 3 28 53 — 0 1 4 7 1 3 8 116 99Florida 13 23 68 968 1,069 1 3 13 88 146 2 23 37 760 741Georgia 8 22 54 716 916 3 2 7 50 112 14 12 130 409 439Maryland§ 3 10 32 389 369 — 1 4 26 42 3 8 18 302 196North Carolina N 0 0 N N N 0 0 N N 9 7 19 248 287South Carolina§ 2 8 25 329 364 — 0 3 20 42 4 4 10 144 98Virginia§ N 0 0 N N N 0 0 N N — 4 16 143 197West Virginia — 0 48 229 89 — 0 6 13 16 — 0 2 2 4
E.S. Central 3 19 36 634 722 — 1 4 39 69 2 15 34 466 600Alabama§ N 0 0 N N N 0 0 N N — 4 11 118 169Kentucky N 0 0 N N N 0 0 N N 2 2 16 76 90Mississippi N 0 0 N N N 0 0 N N — 3 16 113 151Tennessee§ 3 19 36 634 722 — 1 4 39 69 — 5 11 159 190
W.S. Central 16 31 368 1,288 1,305 1 4 30 122 174 26 35 59 1,148 1,399Arkansas§ — 3 26 158 121 — 0 3 12 12 7 3 10 133 152Louisiana 1 3 11 116 72 — 0 2 10 17 — 8 27 241 348Oklahoma N 0 0 N N N 0 0 N N 2 1 6 36 61Texas§ 15 25 333 1,014 1,112 1 3 27 100 145 17 22 33 738 838
Mountain 1 32 72 1,228 1,232 — 3 8 93 170 2 12 23 372 390Arizona 1 12 45 591 596 — 1 5 44 77 — 4 8 150 151Colorado — 11 23 375 367 — 0 4 26 51 — 2 8 72 85Idaho§ N 0 0 N N N 0 0 N N — 0 2 6 2Montana§ N 0 0 N N N 0 0 N N — 0 1 4 3Nevada§ N 0 0 N N N 0 0 N N 2 3 9 90 69New Mexico§ — 3 13 169 115 — 0 2 11 14 — 1 4 43 31Utah — 2 8 74 143 — 0 3 12 25 — 0 4 7 49Wyoming§ — 0 15 19 11 — 0 1 — 3 — 0 0 — —
Pacific — 3 11 113 78 — 0 2 10 16 13 51 66 1,676 1,624Alaska — 3 11 111 78 — 0 2 9 16 — 0 1 1 3California N 0 0 N N N 0 0 N N 11 41 57 1,367 1,381Hawaii — 0 3 2 — — 0 1 1 — — 0 5 8 27Oregon N 0 0 N N N 0 0 N N — 3 10 111 47Washington N 0 0 N N N 0 0 N N 2 5 13 189 166
TerritoriesAmerican Samoa N 0 0 N N N 0 0 N N — 0 0 — —C.N.M.I. — — — — — — — — — — — — — — —Guam — 0 0 — — — 0 0 — — — 0 0 — —Puerto Rico — 0 0 — — — 0 0 — — 2 4 13 146 158U.S. Virgin Islands — 0 0 — — — 0 0 — — — 0 0 — —
C.N.M.I.: Commonwealth of Northern Mariana Islands.U: Unavailable. —: No reported cases. N: Not reportable. NN: Not Nationally Notifiable. Cum: Cumulative year-to-date counts. Med: Median. Max: Maximum.* Case counts for reporting year 2010 and 2011 are provisional and subject to change. For further information on interpretation of these data, see http://www.cdc.gov/osels/ph_surveillance/
nndss/phs/files/ProvisionalNationa%20NotifiableDiseasesSurveillanceData20100927.pdf. Data for TB are displayed in Table IV, which appears quarterly.† Includes drug resistant and susceptible cases of invasive Streptococcus pneumoniae disease among children <5 years and among all ages. Case definition: Isolation of S. pneumoniae from
a normally sterile body site (e.g., blood or cerebrospinal fluid).§ Contains data reported through the National Electronic Disease Surveillance System (NEDSS).

Morbidity and Mortality Weekly Report
MMWR / September 9, 2011 / Vol. 60 / No. 35 1229
TABLE II. (Continued) Provisional cases of selected notifiable diseases, United States, weeks ending September 3, 2011, and September 4, 2010 (35th week)*
West Nile virus disease†
Reporting area
Varicella (chickenpox) Neuroinvasive Nonneuroinvasive§
Current week
Previous 52 weeks Cum 2011
Cum 2010
Current week
Previous 52 weeks Cum 2011
Cum 2010
Current week
Previous 52 weeks Cum 2011
Cum 2010Med Max Med Max Med Max
United States 74 273 367 8,059 10,446 — 1 71 85 379 — 0 37 50 295New England — 22 46 667 734 — 0 2 1 9 — 0 1 — 4
Connecticut — 5 16 169 222 — 0 1 1 5 — 0 1 — 3Maine¶ — 5 16 135 132 — 0 0 — — — 0 0 — —Massachusetts — 6 18 260 197 — 0 1 — 3 — 0 0 — 1New Hampshire — 0 9 9 90 — 0 0 — 1 — 0 0 — —Rhode Island¶ — 1 6 29 23 — 0 0 — — — 0 0 — —Vermont¶ — 2 10 65 70 — 0 0 — — — 0 0 — —
Mid. Atlantic 8 35 71 1,401 1,154 — 0 15 6 90 — 0 10 3 45New Jersey — 12 54 783 411 — 0 3 — 12 — 0 6 1 4New York (Upstate) N 0 0 N N — 0 5 1 43 — 0 1 2 28New York City — 0 0 — — — 0 5 4 24 — 0 1 — 8Pennsylvania 8 19 41 618 743 — 0 3 1 11 — 0 2 — 5
E.N. Central 20 68 118 1,874 3,384 — 0 15 10 34 — 0 7 4 16Illinois 1 17 31 476 871 — 0 10 4 15 — 0 4 — 7Indiana¶ 2 4 18 162 254 — 0 2 3 2 — 0 1 — 5Michigan 5 20 38 615 1,003 — 0 6 1 16 — 0 1 — 2Ohio 12 20 58 620 896 — 0 1 2 1 — 0 3 4 1Wisconsin — 0 22 1 360 — 0 0 — — — 0 1 — 1
W.N. Central — 9 42 239 597 — 0 3 4 24 — 0 7 7 59Iowa N 0 0 N N — 0 1 — 2 — 0 1 — 3Kansas¶ — 4 15 77 248 — 0 1 — 2 — 0 2 — 11Minnesota — 0 0 — — — 0 1 — 3 — 0 1 — 4Missouri — 5 24 105 286 — 0 1 — 3 — 0 1 1 —Nebraska¶ — 0 5 3 8 — 0 1 3 8 — 0 7 4 18North Dakota — 0 10 31 32 — 0 0 — 2 — 0 1 2 7South Dakota — 1 7 23 23 — 0 1 1 4 — 0 1 — 16
S. Atlantic 23 36 64 1,218 1,514 — 0 6 11 23 — 0 3 6 16Delaware¶ — 0 3 6 25 — 0 0 — — — 0 0 — —District of Columbia — 0 2 12 16 — 0 1 — 2 — 0 1 — 2Florida¶ 18 15 38 616 723 — 0 4 8 6 — 0 1 1 1Georgia N 0 0 N N — 0 1 — 4 — 0 1 2 8Maryland¶ N 0 0 N N — 0 3 1 8 — 0 2 3 4North Carolina N 0 0 N N — 0 0 — — — 0 0 — —South Carolina¶ — 0 9 12 75 — 0 1 — — — 0 0 — —Virginia¶ 5 8 25 293 369 — 0 1 2 3 — 0 0 — 1West Virginia — 7 32 279 306 — 0 0 — — — 0 0 — —
E.S. Central — 5 15 174 207 — 0 3 14 4 — 0 2 8 8Alabama¶ — 5 14 163 200 — 0 0 — 1 — 0 0 — 2Kentucky N 0 0 N N — 0 1 — — — 0 0 — 1Mississippi — 0 3 11 7 — 0 3 12 2 — 0 2 8 3Tennessee¶ N 0 0 N N — 0 1 2 1 — 0 0 — 2
W.S. Central 22 43 258 1,612 2,016 — 0 12 8 61 — 0 2 5 15Arkansas¶ 1 3 17 134 143 — 0 2 — 4 — 0 1 — —Louisiana — 2 6 52 53 — 0 3 2 13 — 0 1 2 6Oklahoma N 0 0 N N — 0 1 — — — 0 0 — —Texas¶ 21 39 247 1,426 1,820 — 0 11 6 44 — 0 2 3 9
Mountain 1 19 65 797 758 — 0 18 18 91 — 0 10 11 97Arizona 1 3 50 376 — — 0 13 14 61 — 0 5 6 45Colorado¶ — 4 31 155 281 — 0 5 — 19 — 0 5 2 42Idaho¶ N 0 0 N N — 0 1 1 — — 0 0 — 1Montana¶ — 2 28 104 156 — 0 0 — — — 0 0 — —Nevada¶ N 0 0 N N — 0 2 3 — — 0 1 2 2New Mexico¶ — 1 2 26 84 — 0 6 — 10 — 0 1 — 3Utah — 4 26 128 224 — 0 1 — — — 0 1 — —Wyoming¶ — 0 3 8 13 — 0 1 — 1 — 0 1 1 4
Pacific — 2 6 77 82 — 0 7 13 43 — 0 4 6 35Alaska — 1 4 37 31 — 0 0 — — — 0 0 — —California — 0 3 7 26 — 0 7 13 43 — 0 3 6 34Hawaii — 1 4 33 25 — 0 0 — — — 0 0 — —Oregon N 0 0 N N — 0 0 — — — 0 0 — —Washington N 0 0 N N — 0 1 — — — 0 1 — 1
TerritoriesAmerican Samoa N 0 0 N N — 0 0 — — — 0 0 — —C.N.M.I. — — — — — — — — — — — — — — —Guam — 0 4 16 19 — 0 0 — — — 0 0 — —Puerto Rico — 5 21 107 438 — 0 0 — — — 0 0 — —U.S. Virgin Islands — 0 0 — — — 0 0 — — — 0 0 — —
C.N.M.I.: Commonwealth of Northern Mariana Islands.U: Unavailable. —: No reported cases. N: Not reportable. NN: Not Nationally Notifiable. Cum: Cumulative year-to-date counts. Med: Median. Max: Maximum.* Case counts for reporting year 2010 and 2011 are provisional and subject to change. For further information on interpretation of these data, see http://www.cdc.gov/osels/ph_surveillance/
nndss/phs/files/ProvisionalNationa%20NotifiableDiseasesSurveillanceData20100927.pdf. Data for TB are displayed in Table IV, which appears quarterly.† Updated weekly from reports to the Division of Vector-Borne Infectious Diseases, National Center for Zoonotic, Vector-Borne, and Enteric Diseases (ArboNET Surveillance). Data for California
serogroup, eastern equine, Powassan, St. Louis, and western equine diseases are available in Table I.§ Not reportable in all states. Data from states where the condition is not reportable are excluded from this table, except starting in 2007 for the domestic arboviral diseases and influenza-
associated pediatric mortality, and in 2003 for SARS-CoV. Reporting exceptions are available at http://www.cdc.gov/osels/ph_surveillance/nndss/phs/infdis.htm. ¶ Contains data reported through the National Electronic Disease Surveillance System (NEDSS).

Morbidity and Mortality Weekly Report
1230 MMWR / September 9, 2011 / Vol. 60 / No. 35
TABLE III. Deaths in 122 U.S. cities,* week ending September 3, 2011 (35th week)
Reporting area
All causes, by age (years)
P&I† Total
Reporting area (Continued)
All causes, by age (years)
P&I† Total
All Ages ≥65 45–64 25–44 1–24 <1
All Ages ≥65 45–64 25–44 1–24 <1
New England 508 351 110 24 11 12 55 S. Atlantic 1,170 731 305 77 35 21 53Boston, MA 130 84 32 8 2 4 13 Atlanta, GA 135 73 40 14 8 — 1Bridgeport, CT 32 23 5 2 1 1 3 Baltimore, MD 155 93 47 9 4 2 10Cambridge, MA 15 12 3 — — — — Charlotte, NC 123 78 29 10 3 3 4Fall River, MA 27 20 7 — — — 1 Jacksonville, FL 114 80 27 5 1 1 7Hartford, CT 48 36 7 — 2 3 7 Miami, FL 104 66 29 4 5 — 7Lowell, MA 26 19 5 2 — — 3 Norfolk, VA 42 25 11 2 1 3 4Lynn, MA 10 6 4 — — — 1 Richmond, VA 52 26 16 6 1 2 3New Bedford, MA 16 13 2 1 — — 2 Savannah, GA 67 44 19 4 — — 3New Haven, CT 40 24 6 4 4 2 6 St. Petersburg, FL 44 31 10 1 1 1 2Providence, RI 50 33 15 1 — 1 2 Tampa, FL 190 136 34 15 3 2 4Somerville, MA 2 — 1 1 — — — Washington, D.C. 125 67 36 7 8 7 5Springfield, MA 28 14 10 2 1 1 2 Wilmington, DE 19 12 7 — — — 3Waterbury, CT 30 25 3 2 — — 5 E.S. Central 827 533 206 50 23 15 58Worcester, MA 54 42 10 1 1 — 10 Birmingham, AL 195 114 58 14 5 4 18
Mid. Atlantic 1,619 1,118 369 80 29 22 62 Chattanooga, TN 82 55 19 4 4 — 3Albany, NY 56 36 15 2 2 1 — Knoxville, TN 100 67 26 4 3 — 8Allentown, PA 25 20 5 — — — — Lexington, KY 42 27 10 2 2 1 3Buffalo, NY 87 55 20 5 4 3 6 Memphis, TN 183 120 38 13 6 6 13Camden, NJ 30 20 4 4 1 1 — Mobile, AL 56 40 14 2 — — 4Elizabeth, NJ 7 6 — 1 — — — Montgomery, AL 22 17 4 — — 1 1Erie, PA 46 33 10 3 — — — Nashville, TN 147 93 37 11 3 3 8Jersey City, NJ 15 11 1 3 — — 1 W.S. Central 1,106 697 283 52 45 29 49New York City, NY 878 614 199 42 12 10 25 Austin, TX 86 52 23 5 5 1 3Newark, NJ 24 11 8 2 3 — 1 Baton Rouge, LA 58 33 10 9 6 — —Paterson, NJ 18 11 4 1 1 1 — Corpus Christi, TX 44 27 13 2 1 1 5Philadelphia, PA 128 87 35 6 — — 11 Dallas, TX 178 94 54 8 12 10 8Pittsburgh, PA§ 47 27 15 2 1 2 2 El Paso, TX 82 50 22 5 1 4 2Reading, PA 32 22 6 1 2 1 — Fort Worth, TX U U U U U U URochester, NY 83 60 16 2 2 3 3 Houston, TX 236 152 65 6 3 10 4Schenectady, NY 24 20 4 — — — 6 Little Rock, AR U U U U U U UScranton, PA 21 13 7 1 — — 2 New Orleans, LA U U U U U U USyracuse, NY 31 26 3 1 1 — 3 San Antonio, TX 216 148 47 11 8 2 11Trenton, NJ 30 19 10 1 — — 1 Shreveport, LA 61 46 11 1 2 1 5Utica, NY 14 13 — 1 — — 1 Tulsa, OK 145 95 38 5 7 — 11Yonkers, NY 23 14 7 2 — — — Mountain 1,047 693 257 51 20 24 58
E.N. Central 1,881 1,272 428 104 38 39 107 Albuquerque, NM 122 87 27 3 2 3 13Akron, OH 41 25 7 9 — — 1 Boise, ID 58 47 8 1 1 1 —Canton, OH 27 20 6 1 — — 3 Colorado Springs, CO 68 49 14 3 1 1 —Chicago, IL 231 154 52 15 10 — 8 Denver, CO 81 51 17 7 2 4 5Cincinnati, OH 96 58 25 6 6 1 5 Las Vegas, NV 248 159 69 10 5 4 20Cleveland, OH 261 192 54 9 1 5 13 Ogden, UT 37 31 5 — 1 — 2Columbus, OH 240 164 50 15 5 6 29 Phoenix, AZ 179 91 61 14 6 6 12Dayton, OH 130 90 25 8 — 7 5 Pueblo, CO 33 24 8 1 — — —Detroit, MI 148 69 63 11 4 1 4 Salt Lake City, UT 98 59 25 8 2 4 4Evansville, IN 54 37 12 3 1 1 4 Tucson, AZ 123 95 23 4 — 1 2Fort Wayne, IN 60 44 12 2 — 2 2 Pacific 1,641 1,118 355 91 46 30 118Gary, IN 12 7 3 2 — — — Berkeley, CA 8 6 2 — — — —Grand Rapids, MI 36 27 3 2 1 3 1 Fresno, CA 121 81 26 8 4 2 7Indianapolis, IN 113 73 28 5 5 2 11 Glendale, CA 32 25 7 — — — 4Lansing, MI 35 18 14 2 1 — 1 Honolulu, HI 67 44 14 6 — 3 12Milwaukee, WI 72 49 17 2 — 4 4 Long Beach, CA 73 48 16 4 3 2 8Peoria, IL 57 37 14 3 1 2 6 Los Angeles, CA 236 155 56 13 7 5 26Rockford, IL 60 44 14 1 — 1 5 Pasadena, CA 16 14 1 — 1 — 1South Bend, IN 57 49 2 4 — 2 2 Portland, OR 92 63 22 4 1 1 2Toledo, OH 98 69 21 3 3 2 3 Sacramento, CA 225 148 52 16 7 2 18Youngstown, OH 53 46 6 1 — — — San Diego, CA 151 104 33 8 3 3 5
W.N. Central 518 332 122 37 11 16 40 San Francisco, CA 110 74 24 6 6 — 10Des Moines, IA 85 61 17 6 1 — 10 San Jose, CA 185 134 37 6 2 6 11Duluth, MN 21 16 3 1 — 1 2 Santa Cruz, CA 24 18 4 2 — — 2Kansas City, KS 28 18 7 2 1 — 2 Seattle, WA 124 74 27 14 5 4 4Kansas City, MO 82 48 14 9 6 5 4 Spokane, WA 57 39 14 — 2 2 5Lincoln, NE 37 30 6 1 — — 1 Tacoma, WA 120 91 20 4 5 — 3Minneapolis, MN 53 25 20 4 1 3 6 Total¶ 10,317 6,845 2,435 566 258 208 600Omaha, NE 89 63 20 5 — 1 7St. Louis, MO 13 3 5 3 1 1 —St. Paul, MN 54 37 12 3 — 2 4Wichita, KS 56 31 18 3 1 3 4
U: Unavailable. —: No reported cases.* Mortality data in this table are voluntarily reported from 122 cities in the United States, most of which have populations of >100,000. A death is reported by the place of its occurrence and
by the week that the death certificate was filed. Fetal deaths are not included.† Pneumonia and influenza.§ Because of changes in reporting methods in this Pennsylvania city, these numbers are partial counts for the current week. Complete counts will be available in 4 to 6 weeks.¶ Total includes unknown ages.


U.S. Government Printing Office: 2011-723-011/21071 Region IV ISSN: 0149-2195
The Morbidity and Mortality Weekly Report (MMWR) Series is prepared by the Centers for Disease Control and Prevention (CDC) and is available free of charge in electronic format. To receive an electronic copy each week, visit MMWR’s free subscription page at http://www.cdc.gov/mmwr/mmwrsubscribe.html. Paper copy subscriptions are available through the Superintendent of Documents, U.S. Government Printing Office, Washington, DC 20402; telephone 202-512-1800.
Data presented by the Notifiable Disease Data Team and 122 Cities Mortality Data Team in the weekly MMWR are provisional, based on weekly reports to CDC by state health departments. Address all inquiries about the MMWR Series, including material to be considered for publication, to Editor, MMWR Series, Mailstop E-90, CDC, 1600 Clifton Rd., N.E., Atlanta, GA 30333 or to [email protected].
All material in the MMWR Series is in the public domain and may be used and reprinted without permission; citation as to source, however, is appreciated.
Use of trade names and commercial sources is for identification only and does not imply endorsement by the U.S. Department of Health and Human Services.
References to non-CDC sites on the Internet are provided as a service to MMWR readers and do not constitute or imply endorsement of these organizations or their programs by CDC or the U.S. Department of Health and Human Services. CDC is not responsible for the content of these sites. URL addresses listed in MMWR were current as of the date of publication.
Morbidity and Mortality Weekly Report


![Psychopathic Suicides [solo cello]](https://img.pdfslide.us/doc/110x75/577cdb691a28ab9e78a81e65/psychopathic-suicides-solo-cello.jpg)
