Embed Size (px)
Citation preview
ISSN: 0973-4945; CODEN ECJHAO
E-Journal of Chemistry
http://www.e-journals.net 2009, 6(S1), S329-S341
Chemical Studies on the Removal of
Iron from Crude Phosphoric Acid Using an
Organosilicon Compound
M H. SOLIMAN*, H S.GADO
§ and M N. KOURAIM
§
*Chemistry Department,
Faculty of Science, Helwan University, Helwan, Egypt. §Nuclear Materials Authority. P.O. Box 530, El Maddi, Cairo, Egypt.
Received 28 April 2009; Accepted 6 June 2009
Abstract: A new adsorbent has been developed to reduce the concentration of
iron in crude Egyptian phosphoric acid. This adsorbent has been formed by the
treatment of silicate compound derived from clay mineral with π organic
acceptor ligand to carry out the exchange of ions as well as complexation with
iron. Several parameters (shaking time, temperature, sorbent mass, and batch
factor) have been studied. The adsorption of iron from crude phosphoric acid was
investigated. The various methods to characterize the adsorption of iron on
organosilicon compound (OSC) were collectively evaluated in this study.
According to the Langmiur model, the maximum monomolecular capacity (Qº) is
122 mg/g and 122 mg/g with Freundlich model for an initial iron concentration
of 2.37% contained in crude phosphoric acid. Characterization studies such as
x-ray diffraction, infrared spectroscopy and electron scanning microscope
were investigated to substantiate the nature of iron-OSC complexes.
Keywords: Chemical studies, Organosilicon compound, Crude phosphoric acid and Adsorption.
Introduction
The wet-process involves reaction of phosphate rock with an acid (mainly sulfuric acid) to
produce crude phosphoric acid which contains a variety of impurities, that vary according to
the original of minerals. Many of these impurities particularly the solid ores are removed
from the acid by techniques such as clarification. The presence of these impurities affects
the quantity and the quality of the product. For this reason, about 95% of the acid produced
by the wet-process is directly used as fertilizers and excluded from the use in non-fertilizer
applications1. Many research techniques have been investigated for purifying phosphoric acid,
such as: liquid-liquid extraction2-9
, solid–liquid extraction10
, crystallization, concentration or
S330 M. H. SOLIMAN et al.
addition of additives11
and by membrane process12
.The use of these techniques were limited
due to a number of disadvantages such as: i) limited efficiency; ii) high costs of organic
solvents and resins (more often not regenerable); iii) difficulty in recovering all the solvent
from both the raffinate and the purified acid, due to its granular structure, insolubility in
acids, chemical stability, high mechanical strength, and its local availability at almost low
cost. The advantages in the application of organosilicon compound (OSC) are: i) no need to
regenerate them; ii) their low production costs and waste minimization. In this work, a new
material is proposed to achieve the reduction of iron impurities from Egyptian crude
phosphoric acid (P2O5 = 40.2%). The initial concentration of iron in crude phosphoric acid
was 2.37%. This technique is based on the adsorption of iron on the surface of the OSC. In
this study, factors affecting the sorption process are investigated in the mode operation of
batch process.
Experimental
The starting material for this work is a commercial wet-process phosphoric acid (P2O5 = 40.2%),
which is kindly supplied by Abu-Zaabal Company, Cairo, Egypt. Some characteristics of the
acid are given in Tables 1 & 2.
Table 1. Physical characteristics of the crude phosphoric acid.
Character Value
Optical density (Absorbance) 1.4
PH 0.6
Density 1.54 kg/L
Viscosity 13.6 CP
Electromotive force 450 mv
Total solids 2%
Table 2. Chemical properties of the crude phosphoric acid.
Component Value, % Component Value, ppm
P2O5 40 Cd 15
Fe2O3 2.2 Co 40
Al2O3 0.66 Cr 120
SiO2 0.98 Ni 42
F 0.85 Pb 20
MgO 0.5 Zn 200
CaO 0.3 V 35
SO4 1.3 As 7
FeO 0.19 Mn 800
Total Fe as Fe2O3 2.37 Na2O 450
Organic matter 0.51 K2O 200
U 55 (ppm)
Preparation of OSC
Organosilicon compound was prepared by the following procedure. The silicon compound
was derived from clay minerals using caustic soda and potassium thiosulfate with ratio 3:1:1.5
w/w. Potassium thiosulfate used as initiator for the polymerization of silicate. 2.5 g of the
derived silicon mixed with 1 g of acetyl trimethyl ammonium bromide as inert electrolyte for
enhancement of the adsorption process, in addition to 3 g of NaOH in 30 mL of water.
Chemical Studies on the Removal of Iron S331
The mixtures were shaked vigorously with 0.01 molar of a π acceptor ligand. The organosilicon
compound obtained was washed several times with distilled water until pH becomes neutral.
Some characteristics of the silicate compounds, OSC before and after adsorption of iron are
given in Table 3. The π acceptor ligand is a poly dentate ligand which contains mainly thio,
cyano and carboxylic ester groups as shown in IR spectrum. The reagents used in the chemical
analysis are of analytical grade. Double distilled water was used in all preparations.
Table 3. Chemical composition of silicate compound, OSC before and after adsorption of iron
OSC after OSC before Silicate compound Component
31.76 64.63 61.65 SiO2
0.53 0.41 1.02 TiO2
13.75 19 26 Al2O3
48..36 1.5 6.74 Fe2O3
0.51 0.27 0.59 CaO
0.44 12 0.75 K2O
0.34 0.36 1.22 SO3
3 1.21 2.12 MgO
98.69 99.38 100 Total
Spectrophotometric determination of iron
Iron was determined spectrophotometrically by complexation with 1,10 phenanthroline in
the presence of hydroxylamine hydrochloride and in the presence of sodium acetate as a
buffer solution as follows. In a 25 mL measuring flask to a micro sample containing iron,
2 mL of 10% hydroxylamine hydrochloride, 4 mL of sodium acetate (10%) and 5 mL of
1.10 phenanthroline was added to the mark and dissolved with distilled water. The
absorbance was then measured at 512 nm using all constituents without iron as blank
solution13
.
Qualitative analysis of OSC before and after adsorption of iron
Identification of the OSC before and after adsorption of iron was carried out using the infrared
(IR) recording spectrometer. To accomplish this, one mg of OSC before and after adsorption of
iron was mixed with 200 mg of dried KBr. Compression disk was then made by compressing the
mixture for 5 min at 20000 Lbs/cm2. Analysis of the OSC before and after adsorption of iron by
electron microscope was carried out according to the following method. A small quantity of each
sample was shaken in a test tube with distilled water to obtain a suspension. A drop of this
suspension was placed on a coated microscope slide. A further drop was spread on a clean glass
slide and a direct platinum carbon replica formed. New tensile fracture surfaces were replaced
with carbon and shadowed with gold palladium then electron microscope photos were taken.
Adsorption studies
In the present work the adsorption system was studied by batch process. The factors affecting
the adsorption process, e.g. shaking time, batch factor, sorbent mass and temperature were
studied. In all cases 10 mL of the crude acid was contacted with known weights of the
adsorbate in a stoppered glass bottles. The conditions of each experiment were adjusted and
the bottles were shaken using a thermostatic shaker to achieve equilibrium concentration. Each
mixture was filtered and the samples were analyzed for organic matter and iron using UV-Vis
spectrophotometer. The Langmuir isotherm is represented by the following equation:
1/qe = (1/qº) + (1/ bq
º) (1/Ce) (1)
S332 M. H. SOLIMAN et al.
Where Ce is the equilibrium concentration (mg/L), qe is the amount adsorbed at equilibrium
time (mg/g) and q◦ and b are Langmuir constants related to adsorption capacity and energy of
adsorption, respectively. These can be calculated from the 1/qe vs. 1/Ce plot by the relationships:
q◦ = intercept−1
and b = slope−1
× intercept. The favorable nature of adsorption can be expressed
in terms of a dimensionless separation factor of equilibrium parameter, which is defined by:
R L = 1/ (1 + bCo) (2)
Where, b is the Langmuir constant and Co is the initial concentration of the adsorbate in
solution.
Freundlich equation is presented as:
q e = Kf Ce1/n
(3)
Rearranging gives:
log q e = logKf + 1/n logCe (4)
Hence, a plot of log qe vs. log Ce enables the constant Kf and exponent ‘n’ to be determined.
Batch experiments
The factors affecting the adsorption process, e.g. shaking time, batch factor and sorbent
mass were studied. In all cases, 10 mL of green acid was contacted with fixed amount of
OSC in stoppered glass bottles. The conditions of each experiment were adjusted and the
bottles were shaken using a thermostatic shaker to achieve equilibrium concentration. Each
mixture was filtered and the samples were analysed for iron using a Shimadzu model 160 A
double-beam UV spectrophotometer. Matched 10 mm quartz absorption cells were used. In
all cases, the difference between the initial concentration (Co) and the equilibrium
concentration (Ce) was calculated and used to determine the adsorptive capacity (qe) as
follows. qe = V (Co−Ce)/m, where V is the total volume of solute solution (mL); m is the
mass of sorbent used (g), Co is the initial concentration of the solute (mg/L) and Ce is the
residual concentration of the solute (mg/L). Adsorption isotherms of iron were determined
by shaking various amounts OSC with constant volume of green acid (10 mL) until
equilibrium is reached. The residual concentration was determined as described above.
Results and Discussion
Effect of OSC dose
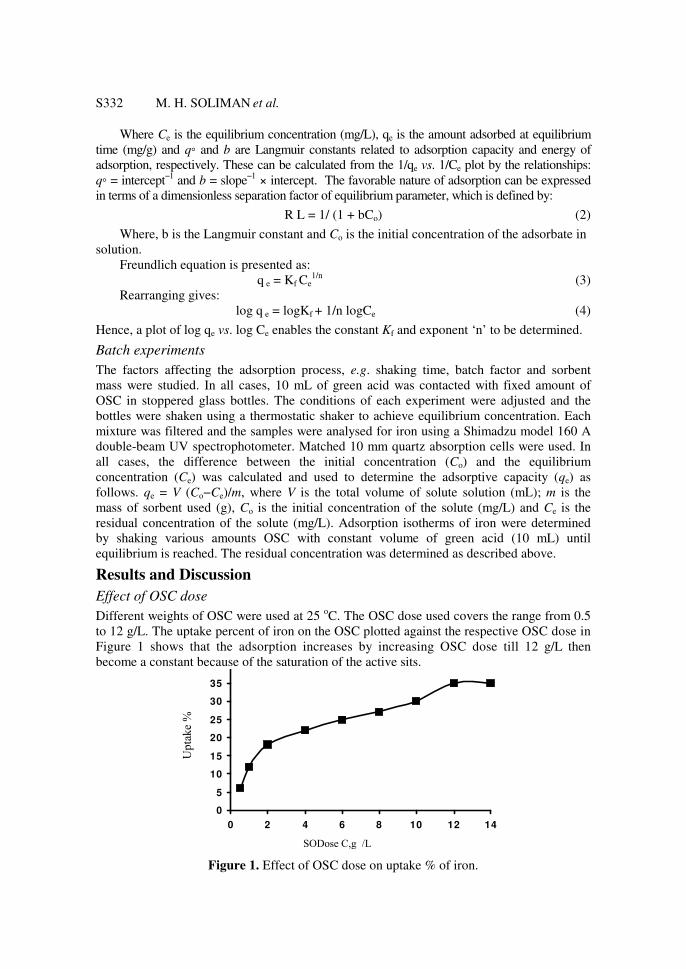
Different weights of OSC were used at 25 oC. The OSC dose used covers the range from 0.5
to 12 g/L. The uptake percent of iron on the OSC plotted against the respective OSC dose in
Figure 1 shows that the adsorption increases by increasing OSC dose till 12 g/L then
become a constant because of the saturation of the active sits.
Figure 1. Effect of OSC dose on uptake % of iron.
0
5
10
15
20
25
30
35
40
0 2 4 6 8 10 12 14
%eUptak
L /g ,Dose CSO
Temp. oC
% Uptake
Chemical Studies on the Removal of Iron S333
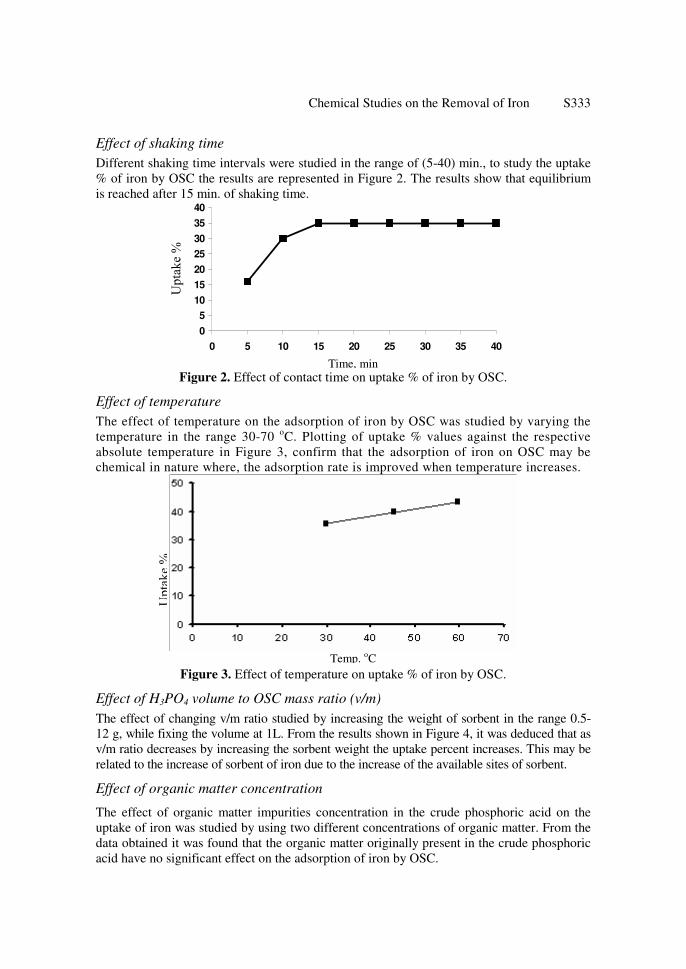
Effect of shaking time
Different shaking time intervals were studied in the range of (5-40) min., to study the uptake
% of iron by OSC the results are represented in Figure 2. The results show that equilibrium
is reached after 15 min. of shaking time.
Figure 2. Effect of contact time on uptake % of iron by OSC.
Effect of temperature
The effect of temperature on the adsorption of iron by OSC was studied by varying the
temperature in the range 30-70 oC. Plotting of uptake % values against the respective
absolute temperature in Figure 3, confirm that the adsorption of iron on OSC may be
chemical in nature where, the adsorption rate is improved when temperature increases.
Figure 3. Effect of temperature on uptake % of iron by OSC.
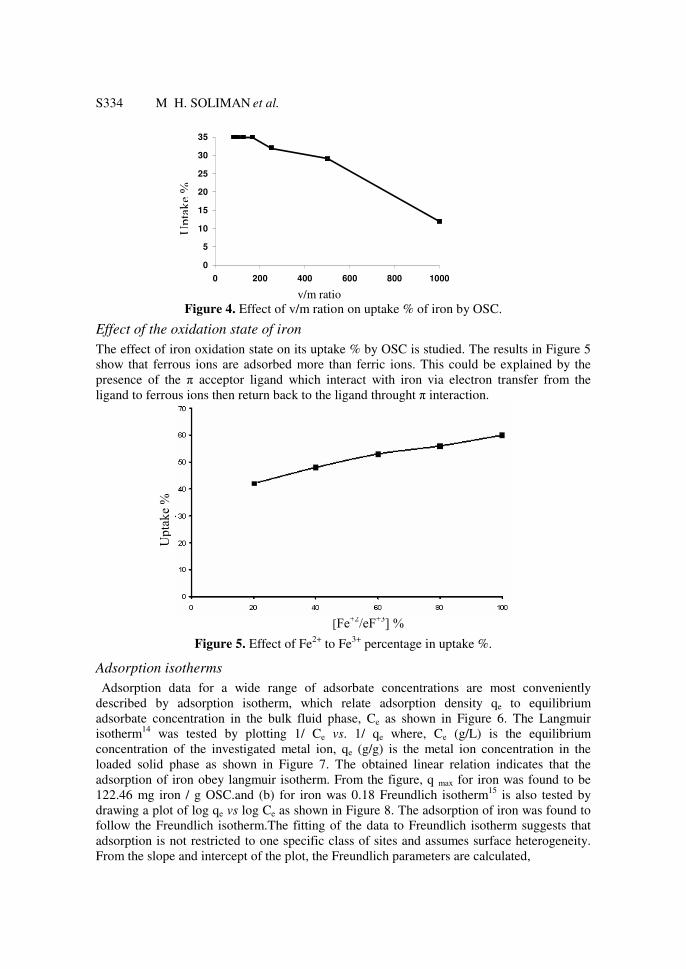
Effect of H3PO4 volume to OSC mass ratio (v/m)
The effect of changing v/m ratio studied by increasing the weight of sorbent in the range 0.5-
12 g, while fixing the volume at 1L. From the results shown in Figure 4, it was deduced that as
v/m ratio decreases by increasing the sorbent weight the uptake percent increases. This may be
related to the increase of sorbent of iron due to the increase of the available sites of sorbent.
Effect of organic matter concentration
The effect of organic matter impurities concentration in the crude phosphoric acid on the
uptake of iron was studied by using two different concentrations of organic matter. From the
data obtained it was found that the organic matter originally present in the crude phosphoric
acid have no significant effect on the adsorption of iron by OSC.
0
5
10
15
20
25
30
35
40
0 5 10 15 20 25 30 35 40
% Uptake
Time, min
] %3+
eF/2+
eF [
% Uptake
S334 M H. SOLIMAN et al.
v/m ratio
Figure 4. Effect of v/m ration on uptake % of iron by OSC.
Effect of the oxidation state of iron
The effect of iron oxidation state on its uptake % by OSC is studied. The results in Figure 5
show that ferrous ions are adsorbed more than ferric ions. This could be explained by the
presence of the π acceptor ligand which interact with iron via electron transfer from the
ligand to ferrous ions then return back to the ligand throught π interaction.
Figure 5. Effect of Fe2+
to Fe3+
percentage in uptake %.
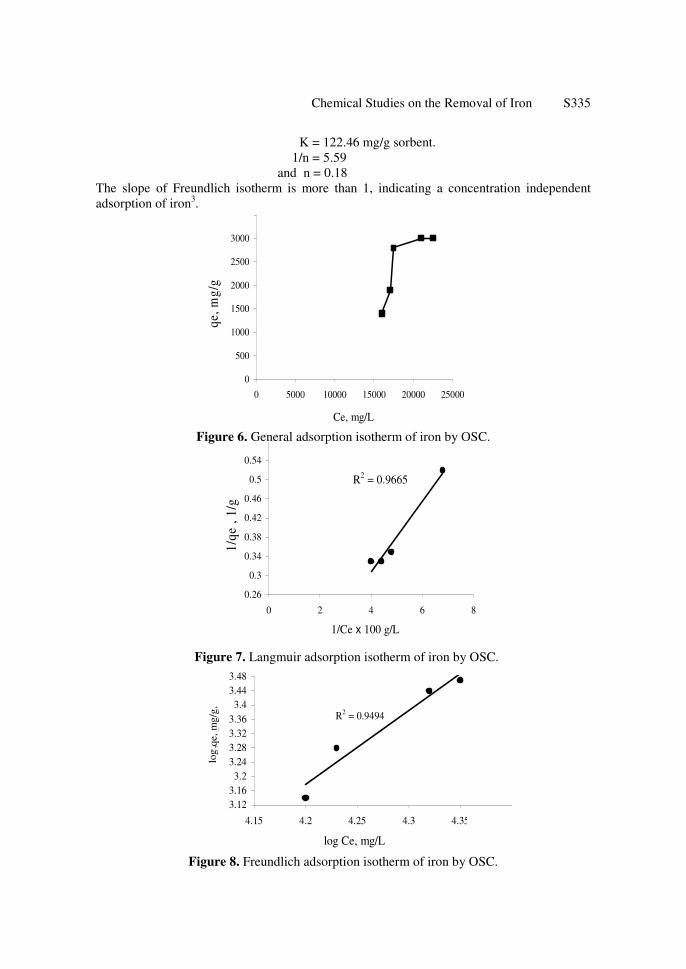
Adsorption isotherms
Adsorption data for a wide range of adsorbate concentrations are most conveniently
described by adsorption isotherm, which relate adsorption density qe to equilibrium
adsorbate concentration in the bulk fluid phase, Ce as shown in Figure 6. The Langmuir
isotherm14
was tested by plotting 1/ Ce vs. 1/ qe where, Ce (g/L) is the equilibrium
concentration of the investigated metal ion, qe (g/g) is the metal ion concentration in the
loaded solid phase as shown in Figure 7. The obtained linear relation indicates that the
adsorption of iron obey langmuir isotherm. From the figure, q max for iron was found to be
122.46 mg iron / g OSC.and (b) for iron was 0.18 Freundlich isotherm15
is also tested by
drawing a plot of log qe vs log Ce as shown in Figure 8. The adsorption of iron was found to
follow the Freundlich isotherm.The fitting of the data to Freundlich isotherm suggests that
adsorption is not restricted to one specific class of sites and assumes surface heterogeneity.
From the slope and intercept of the plot, the Freundlich parameters are calculated,
0
5
10
15
20
25
30
35
0 200 400 600 800 1000
V/M ratio
% Uptake
Chemical Studies on the Removal of Iron S335
K = 122.46 mg/g sorbent.
1/n = 5.59
and n = 0.18
The slope of Freundlich isotherm is more than 1, indicating a concentration independent
adsorption of iron3.
0
500
1000
1500
2000
2500
3000
3500
0 5000 10000 15000 20000 25000
Ce, mg/L
qe,
mg
/g
Figure 6. General adsorption isotherm of iron by OSC.
R2 = 0.9665
0.26
0.3
0.34
0.38
0.42
0.46
0.5
0.54
0 2 4 6 8
1/Ce x 100 g/L
1/q
e ,
1/g
Figure 7. Langmuir adsorption isotherm of iron by OSC.
R2 = 0.9494
3.12
3.16
3.2
3.24
3.28
3.32
3.36
3.4
3.44
3.48
4.15 4.2 4.25 4.3 4.35
log Ce, mg/L
log
qe,
mg
/gm
Figure 8. Freundlich adsorption isotherm of iron by OSC.
lo
g
qe,
mg
/g,
S336 M H. SOLIMAN et al.
Sorption mechanism
Sorption of iron onto OSC can be understood in terms of hydrophilic surface containing
mainly K which works as ion exchanger for K ions and complex formation with
deprotonated sulfide groups as a ligand16
as well as cyanide group coordinated with iron
via charge transfer from iron to the π molecular orbital of cyanide group. Uptake of iron
was shown to be accompanied by a stoichiometric replacement of K from the exchange
sites17,18
. To substantiate the nature of OSC iron complexes, classical x-ray
diffractometry, in conjunction with and complementary with infrared spectroscopy are
investigated. Also electron scanning microscope is singularly suited for the study of OSC-
iron interactions.
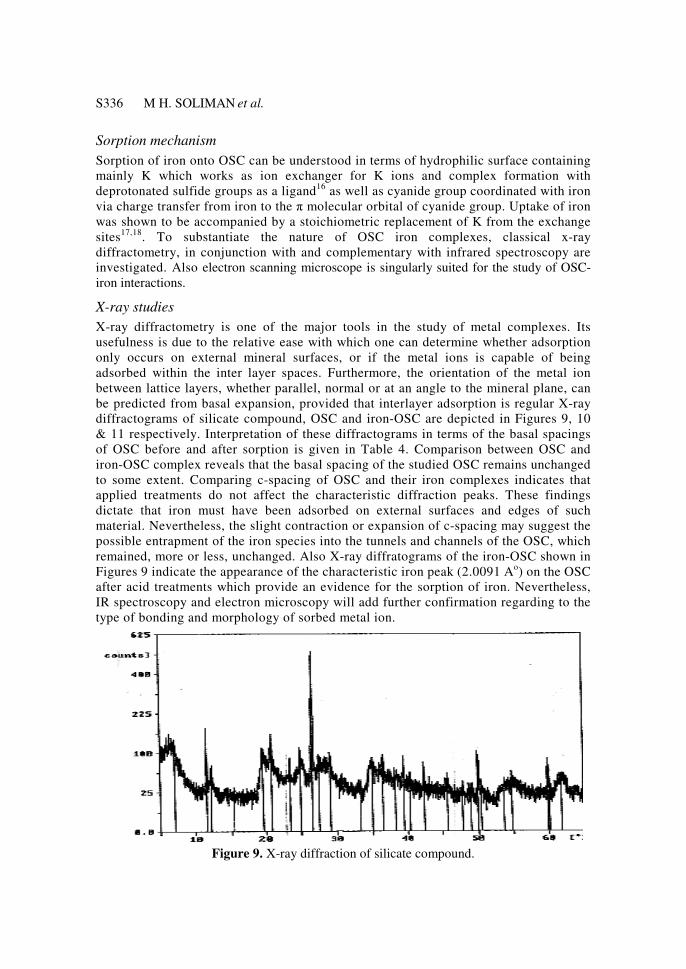
X-ray studies
X-ray diffractometry is one of the major tools in the study of metal complexes. Its
usefulness is due to the relative ease with which one can determine whether adsorption
only occurs on external mineral surfaces, or if the metal ions is capable of being
adsorbed within the inter layer spaces. Furthermore, the orientation of the metal ion
between lattice layers, whether parallel, normal or at an angle to the mineral plane, can
be predicted from basal expansion, provided that interlayer adsorption is regular X-ray
diffractograms of silicate compound, OSC and iron-OSC are depicted in Figures 9, 10
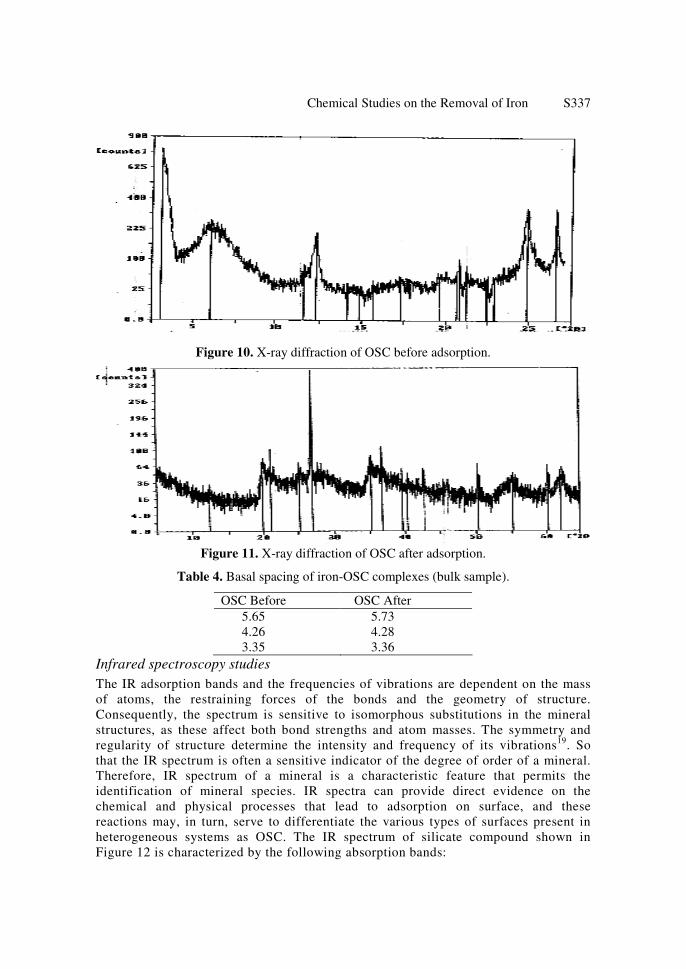
& 11 respectively. Interpretation of these diffractograms in terms of the basal spacings
of OSC before and after sorption is given in Table 4. Comparison between OSC and
iron-OSC complex reveals that the basal spacing of the studied OSC remains unchanged
to some extent. Comparing c-spacing of OSC and their iron complexes indicates that
applied treatments do not affect the characteristic diffraction peaks. These findings
dictate that iron must have been adsorbed on external surfaces and edges of such
material. Nevertheless, the slight contraction or expansion of c-spacing may suggest the
possible entrapment of the iron species into the tunnels and channels of the OSC, which
remained, more or less, unchanged. Also X-ray diffratograms of the iron-OSC shown in
Figures 9 indicate the appearance of the characteristic iron peak (2.0091 Ao) on the OSC
after acid treatments which provide an evidence for the sorption of iron. Nevertheless,
IR spectroscopy and electron microscopy will add further confirmation regarding to the
type of bonding and morphology of sorbed metal ion.
Figure 9. X-ray diffraction of silicate compound.
Chemical Studies on the Removal of Iron S337
Figure 10. X-ray diffraction of OSC before adsorption.
Figure 11. X-ray diffraction of OSC after adsorption.
Table 4. Basal spacing of iron-OSC complexes (bulk sample).
OSC Before OSC After
5.65 5.73
4.26 4.28
3.35 3.36
Infrared spectroscopy studies
The IR adsorption bands and the frequencies of vibrations are dependent on the mass
of atoms, the restraining forces of the bonds and the geometry of structure.
Consequently, the spectrum is sensitive to isomorphous substitutions in the mineral
structures, as these affect both bond strengths and atom masses. The symmetry and
regularity of structure determine the intensity and frequency of its vibrations19
. So
that the IR spectrum is often a sensitive indicator of the degree of order of a mineral.
Therefore, IR spectrum of a mineral is a characteristic feature that permits the
identification of mineral species. IR spectra can provide direct evidence on the
chemical and physical processes that lead to adsorption on surface, and these
reactions may, in turn, serve to differentiate the various types of surfaces present in
heterogeneous systems as OSC. The IR spectrum of silicate compound shown in
Figure 12 is characterized by the following absorption bands:
S338 M H. SOLIMAN et al.
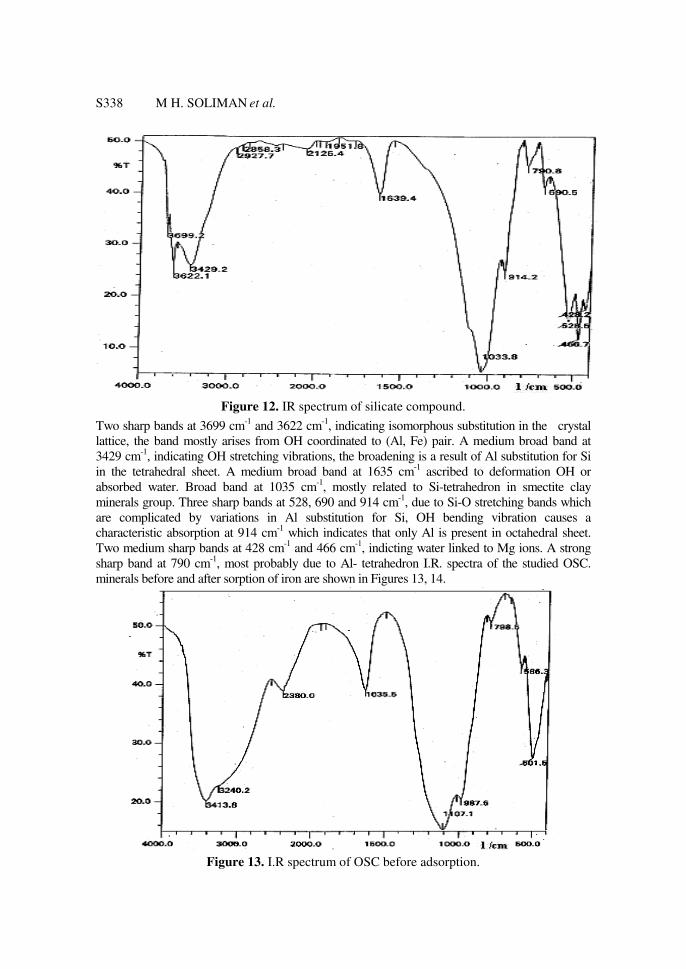
Figure 12. IR spectrum of silicate compound.
Two sharp bands at 3699 cm-1 and 3622 cm
-1, indicating isomorphous substitution in the crystal
lattice, the band mostly arises from OH coordinated to (Al, Fe) pair. A medium broad band at
3429 cm-1, indicating OH stretching vibrations, the broadening is a result of Al substitution for Si
in the tetrahedral sheet. A medium broad band at 1635 cm-1 ascribed to deformation OH or
absorbed water. Broad band at 1035 cm-1, mostly related to Si-tetrahedron in smectite clay
minerals group. Three sharp bands at 528, 690 and 914 cm-1, due to Si-O stretching bands which
are complicated by variations in Al substitution for Si, OH bending vibration causes a
characteristic absorption at 914 cm-1 which indicates that only Al is present in octahedral sheet.
Two medium sharp bands at 428 cm-1 and 466 cm
-1, indicting water linked to Mg ions. A strong
sharp band at 790 cm-1, most probably due to Al- tetrahedron I.R. spectra of the studied OSC.
minerals before and after sorption of iron are shown in Figures 13, 14.
Figure 13. I.R spectrum of OSC before adsorption.
Chemical Studies on the Removal of Iron S339
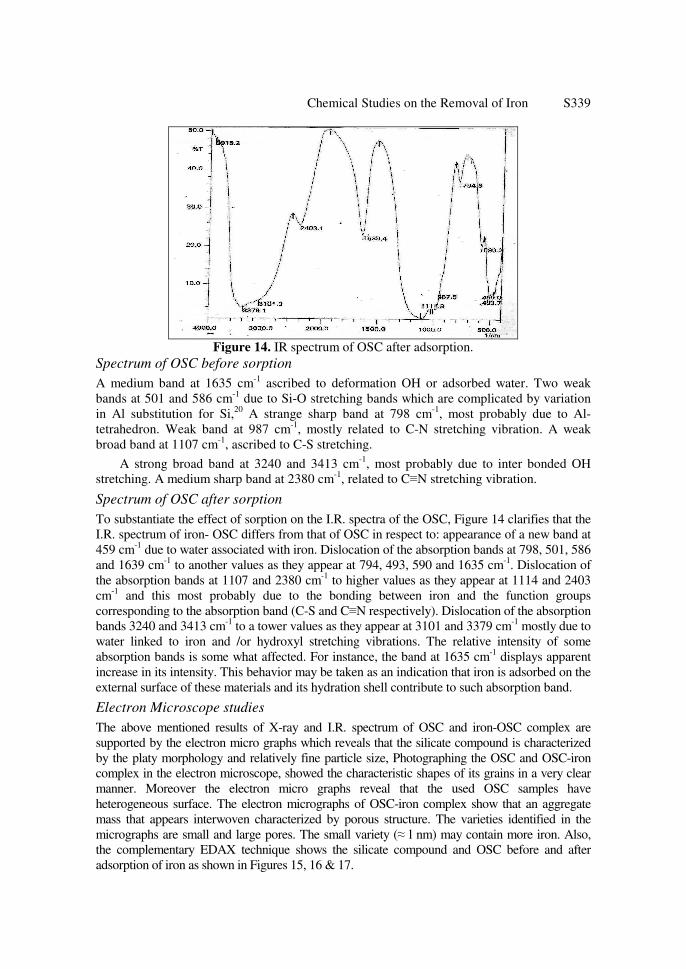
Figure 14. IR spectrum of OSC after adsorption.
Spectrum of OSC before sorption
A medium band at 1635 cm-1
ascribed to deformation OH or adsorbed water. Two weak
bands at 501 and 586 cm-1
due to Si-O stretching bands which are complicated by variation
in Al substitution for Si,20
A strange sharp band at 798 cm-1
, most probably due to Al-
tetrahedron. Weak band at 987 cm-1
, mostly related to C-N stretching vibration. A weak
broad band at 1107 cm-1
, ascribed to C-S stretching.
A strong broad band at 3240 and 3413 cm-1
, most probably due to inter bonded OH
stretching. A medium sharp band at 2380 cm-1
, related to C≡N stretching vibration.
Spectrum of OSC after sorption
To substantiate the effect of sorption on the I.R. spectra of the OSC, Figure 14 clarifies that the
I.R. spectrum of iron- OSC differs from that of OSC in respect to: appearance of a new band at
459 cm-1
due to water associated with iron. Dislocation of the absorption bands at 798, 501, 586
and 1639 cm-1
to another values as they appear at 794, 493, 590 and 1635 cm-1
. Dislocation of
the absorption bands at 1107 and 2380 cm-1
to higher values as they appear at 1114 and 2403
cm-1
and this most probably due to the bonding between iron and the function groups
corresponding to the absorption band (C-S and C≡N respectively). Dislocation of the absorption
bands 3240 and 3413 cm-1
to a tower values as they appear at 3101 and 3379 cm-1
mostly due to
water linked to iron and /or hydroxyl stretching vibrations. The relative intensity of some
absorption bands is some what affected. For instance, the band at 1635 cm-1
displays apparent
increase in its intensity. This behavior may be taken as an indication that iron is adsorbed on the
external surface of these materials and its hydration shell contribute to such absorption band.
Electron Microscope studies
The above mentioned results of X-ray and I.R. spectrum of OSC and iron-OSC complex are
supported by the electron micro graphs which reveals that the silicate compound is characterized
by the platy morphology and relatively fine particle size, Photographing the OSC and OSC-iron
complex in the electron microscope, showed the characteristic shapes of its grains in a very clear
manner. Moreover the electron micro graphs reveal that the used OSC samples have
heterogeneous surface. The electron micrographs of OSC-iron complex show that an aggregate
mass that appears interwoven characterized by porous structure. The varieties identified in the
micrographs are small and large pores. The small variety (≈ l nm) may contain more iron. Also,
the complementary EDAX technique shows the silicate compound and OSC before and after
adsorption of iron as shown in Figures 15, 16 & 17.
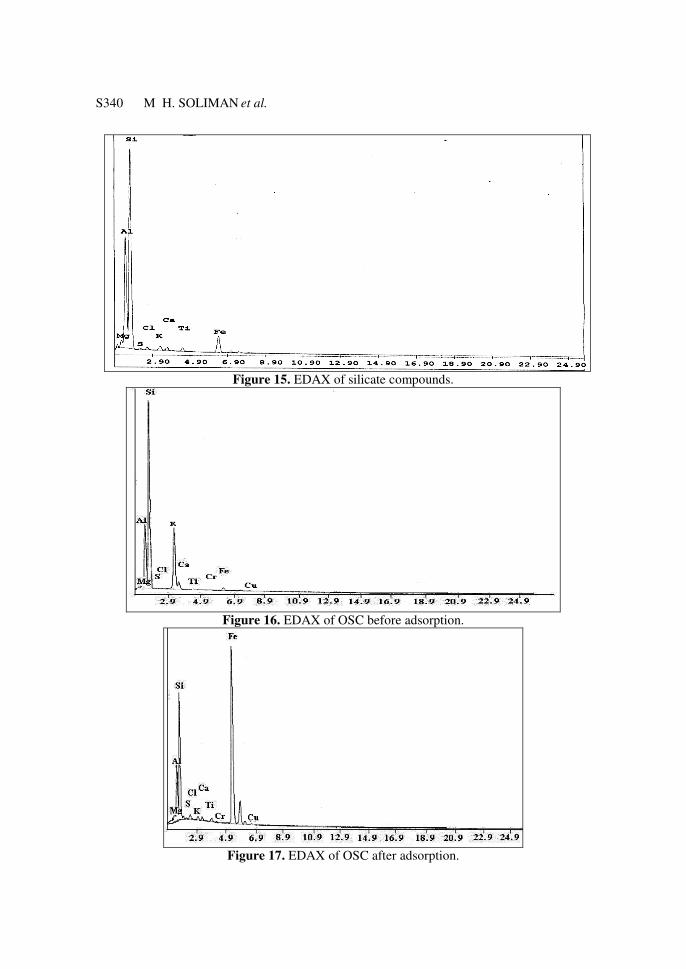
S340 M H. SOLIMAN et al.
Figure 15. EDAX of silicate compounds.
Figure 16. EDAX of OSC before adsorption.
Figure 17. EDAX of OSC after adsorption.
Chemical Studies on the Removal of Iron S341
Conclusions
Iron could be removed efficiently from phosphoric acid produced at Abu-Zaabal Company,
Egypt, using organosilicon compound. The uptake of iron increases in reducing conditions.
12 g of OSC is optimal for the removal of about 60% of iron content of the acid.
Optimization studies with separating funnel indicate that a time of 15 min is sufficient for
reaching equilibrium. The uptake of iron is an endothermic process.
References
1 Harvinderpal S L and Mishra R V, Hydrometallurgy, 2004, 73, 63.
2 Awwad N S, El-Reefy S A and Aly H F Proc. 6th
Arab Conf Peac Uses Atomic
Energy, Cairo, Egypt, 14 December, 2002.
3 El-Reefy S A and Awwad N S Arab, J Nucl Sci Appl., 1997, 30, 281.
4 El-Reefy SA, Awwad NS and Aly H F, J Chem Tech Biotechnol., 1997, 69, 271.
5 Awwad N S, El-Reefy S A and Aly H F, Int Eighth Conf of Nucl Sci Appl., Cairo,
Egypt, 7-12 February, 2004.
6 Ahmed H, Diamonta H, Chaker C and Abdelhamid R, Sep Purif Technol., 2007, 55, 212.
7 Glauco C D, Jose W S, Jo D and Julio C A, Minerals Engineering, 2008, 21, 416.
8 Beata P, Wladyslaw W, Michal J W, Physicochemical Problems of Mineral
Processing, 2005, 39, 89.
9 Hannachi A, Habaili D, Chtara C and Ratel A, Sep Purif Technol., 2007, 55, 212.
10 Daifullah A A M, Awwad N S and El-Reefy S A, Chem Eng Process, 2004, 43, 193.
11 Mohammed K and Hussein K, Hydrometallurgy, 2000, 58, 215.
12 Myriam B C, Mohamed B A and Gerald P, Sep Purif Technol., 2006, 51, 285.
13 Marczenko Z, Spectrophotometric Determination of the Elements Wiley, New York, 1986.
14 Langmuir I., J Am Chem Soc., 1918, 40,1361.
15 Freundlich H, Methuen and Co Ltd., London, 1926.
16 El-Kamash A M, El-Sayed A A and Aly H F, J Radioanal Nucl Chem., 2002, 253, 489.
17 Abdel Aal EA, Ibrahim I, Mahmoud, M H H, El-Barbary T A and Ismail A K, Miner
Metall., 1999, 16, 3.
18 Schindler P W, Fürst B, Dick R and Wolf P U, J Colloid and Interface Science, 1976,
55, 469.
19 Nyquist R A, Putzig C L and Leugers M A, Infrared Spectra, Academic Press, UK, 1977.
20 White J L, Soil Sci., 1971, 112, 22.

Submit your manuscripts athttp://www.hindawi.com
Hindawi Publishing Corporationhttp://www.hindawi.com Volume 2014
Inorganic ChemistryInternational Journal of
Hindawi Publishing Corporation http://www.hindawi.com Volume 2014
International Journal ofPhotoenergy
Hindawi Publishing Corporationhttp://www.hindawi.com Volume 2014
Carbohydrate Chemistry
International Journal of
Hindawi Publishing Corporationhttp://www.hindawi.com Volume 2014
Journal of
Chemistry
Hindawi Publishing Corporationhttp://www.hindawi.com Volume 2014
Advances in
Physical Chemistry
Hindawi Publishing Corporationhttp://www.hindawi.com
Analytical Methods in Chemistry
Journal of
Volume 2014
Bioinorganic Chemistry and ApplicationsHindawi Publishing Corporationhttp://www.hindawi.com Volume 2014
SpectroscopyInternational Journal of
Hindawi Publishing Corporationhttp://www.hindawi.com Volume 2014
The Scientific World JournalHindawi Publishing Corporation http://www.hindawi.com Volume 2014
Medicinal ChemistryInternational Journal of
Hindawi Publishing Corporationhttp://www.hindawi.com Volume 2014
Chromatography Research International
Hindawi Publishing Corporationhttp://www.hindawi.com Volume 2014
Applied ChemistryJournal of
Hindawi Publishing Corporationhttp://www.hindawi.com Volume 2014
Hindawi Publishing Corporationhttp://www.hindawi.com Volume 2014
Theoretical ChemistryJournal of
Hindawi Publishing Corporationhttp://www.hindawi.com Volume 2014
Journal of
Spectroscopy
Analytical ChemistryInternational Journal of
Hindawi Publishing Corporationhttp://www.hindawi.com Volume 2014
Journal of
Hindawi Publishing Corporationhttp://www.hindawi.com Volume 2014
Quantum Chemistry
Hindawi Publishing Corporationhttp://www.hindawi.com Volume 2014
Organic Chemistry International
Hindawi Publishing Corporationhttp://www.hindawi.com Volume 2014
CatalystsJournal of
ElectrochemistryInternational Journal of
Hindawi Publishing Corporation http://www.hindawi.com Volume 2014


![J. Braz. Chem. Soc. Article 0103 - 5053 $6.00+0static.sites.sbq.org.br/jbcs.sbq.org.br/pdf/v26n12a22.pdf · X-ray powder diffraction (XPD) and scanning electron microscope (SEM)]](https://img.pdfslide.us/doc/110x75/60a2442c878776424e333bad/j-braz-chem-soc-article-0103-5053-600-x-ray-powder-diffraction-xpd-and.jpg)