Embed Size (px)
Citation preview

CHEMICAL OPTIMIZATION OF IN SITU EMPLACEMENT OF
NANO-PARTICULATE IRON SULFIDE IN POROUS MEDIA
by
Jun Hee Lee
A dissertation submitted in partial fulfillment
of the requirements for the degree of Doctor of Philosophy
(Environmental Engineering) in The University of Michigan
2009
Doctoral Committee:
Associate Professor Terese M. Olson, Chair Professor Kim F. Hayes Associate Professor Udo Becker Associate Professor Avery H. Demond

© Jun Hee Lee 2009

ii
To my parents,
Kyung Sue,
Jaewon and Jenna

iii
Acknowledgement
I am greatly thankful to my God for preparing my way and being with me all the times.
Financial support for this research was provided by funds from Department of Defense,
Strategic Environmental Research and Development Project (SERDP) Project CU-1375
and Rackham Graduate School Research Grant.
I would like to thank all my dissertation committee members: Dr. Hayes, Dr. Demond,
and Dr. Becker for their times and assistance and especially to Dr. Olson who always
inspired me and taught me so much. I would like to thank to Tom Yavaraski for help in
performing in iron analysis and other support in the experiments. I would also like to
thank my colleagues, Dr. Sung Pil Hyun, Dr. Hoon Young Jeong, Dr. Tanya Gallegos,
Monica Higgins, and Young Soo Han for discussions on this work.
Finally, thanks to my family; to my mother who keeps on praying for me, to my father
whom I completely rely on, to my Jae Won and Jenna who are the source of my pleasure,
and my Kyung Sue, without you I would not be here.

iv
Table of Contents
Dedication………………………………………………………………………....………ii Acknowledgement……………………………………………………………….…...…..iii List of Figures……………………………………………….……………………………vi List of Tables…………..……………………………………………………………......viii Abstract ………………………………………………………………………..…...…….ix
Chapter 1 Introduction .................................................................................................... 1
1.1 Objectives of Research ....................................................................................... 5
1.2 Dissertation Organization ................................................................................... 6
Chapter 2 Background .................................................................................................... 8
2.1 Permeable Reactive Barriers (PRBs) .................................................................. 8
2.2 Characteristics of FeS ....................................................................................... 14
2.3 Stability of Suspensions.................................................................................... 26
2.4 Colloid Filtration............................................................................................... 28
2.5 Remobilization of Deposited Colloids in Porous Media .................................. 30
Chapter 3 General Methods, Materials, and Characterization....................................... 35
3.1 FeS Synthesis .................................................................................................... 35
3.2 Structure Characterization of FeS using X-ray Diffraction .............................. 36
3.3 Size Analysis of FeS using Photon Correlation Spectroscopy ......................... 37
3.4 Quartz sand ....................................................................................................... 38
3.5 Buffers............................................................................................................... 40
3.6 Iron Analysis..................................................................................................... 41
Chapter 4 Aggregation Kinetics of FeS Suspensions.................................................... 42
4.1 Introduction....................................................................................................... 42

v
4.2 Theory ............................................................................................................... 44
4.3 Methods and Materials...................................................................................... 48
4.4 Results and Discussion ..................................................................................... 50
4.5 Conclusions....................................................................................................... 60
Chapter 5 Chemical Optimization of FeS Deposition on Granular Quartz Sand ......... 62
5.1 Introduction....................................................................................................... 62
5.2 Theory ............................................................................................................... 63
5.3 Methods and Materials...................................................................................... 67
5.4 Results and Discussion ..................................................................................... 70
5.5 Chemical Optimization Conclusions for FeS Deposition................................. 81
Chapter 6 Release of Deposited FeS ............................................................................. 83
6.1 Introduction....................................................................................................... 83
6.2 Methods and Materials...................................................................................... 85
6.3 Results and Discussion ..................................................................................... 88
6.4 Conclusions....................................................................................................... 98
Chapter 7 Conclusions and Recomendations .............................................................. 100
7.1 Conclusions..................................................................................................... 100
7.2 Recommendations for Future Study ............................................................... 105
Appendix Modeling of FeS Dissolution in a Fixed Bed.............................................. 106
Bibliography ................................................................................................................... 110

vi
List of Figures
Figure 2.1 Schematic of a permeable reactive barrier (USEPA, www.epa.gov).................9
Figure 2.2 Sketch of mackinawite structure (Wolthers et al., 2003) .................................17
Figure 2.3 Schematic diagrams for double layer and electrical potential of a charged colloidal particle.................................................................................22
Figure 2.4 Zeta potential of quartz as a function of pH at an ionic strength of 0.01 M. 23
Figure 2.5 Zeta potential measurement for mackinawite, quartz sand, and ferrihydrite in 0.001 M NaCl background electrolyte. (Gallegos, 2007).........24
Figure 2.6 Surface titration of disordered mackinawite (Wolthers, et al., 2005) ..............24
Figure 2.7 Surface complexes proposed for saturated FeS solutions at 0.053 M of ionic strength by Wolthers et al. (2005)...........................................................26
Figure 2.8 Typical net interaction curve between charged colloids as a function of particle separation distance for the case of a net repulsive energy barrier. (Zeta-Meter Inc., www.zeta-meter.com).............................................27
Figure 2.9 Particle capture mechanisms in depth filtration ...............................................29
Figure 3.1 XRD analysis of synthesized FeS nano-particles.............................................37
Figure 3.2 Typical size distribution of Dry #1 (65) quartz sand (US Silica, Pacific, MO) .................................................................................................................40
Figure 4.1 Initial aggregation rates of nanoparticulate FeS at various pH at a constant ionic strength of 0.05 M. ...................................................................50
Figure 4.2 Stability ratios as a function of pH at a constant ionic strength of 0.05 M.. 54
Figure 4.3 Semi-logarithmic plot of stability ratios of mackinawite as a function of ionic strength at pH 8.3 with 0.01 M borate buffer. ....................................57
Figure 4.4 FeS suspension stability as a function of buffer concentration ........................59
Figure 5.1 Schematic of column apparatus used in FeS deposition experiments..............68

vii
Figure 5.2 Sequential photographs of the column illustrating the progressive hydraulic extrusion of the sand bed (from left to right) for sectional analysis of the specific deposit concentration of FeS on the sand.................. 69
Figure 5.3 Visual breakthrough behavior of 1 g L-1 FeS suspension in columns containing clean quartz sand without pH adjustment (pH = 10.3) and no added salt. .................................................................................................. 71
Figure 5.4 Deposition experiments of 1 g L-1 FeS suspension at various pH, pH 8.3 to 10.3 at an ionic strength of 0.05M. ....................................................... 75
Figure 5.5 Deposition experiments of 1 g L-1 FeS suspension at various values of pH, pH 6.5 to 10.3 with ionic strength of 0.05M............................................ 77
Figure 5.6 Deposition experiments of 1 g L-1 FeS suspension at pH 8.2 with ionic strength of 0.075M.......................................................................................... 80
Figure 6.1 Fe release profiles; 1g L-1 FeS particles injected at pH 8.3 and ionic strength of 0.025 M......................................................................................... 89
Figure 6.2 Effluent dissolved iron concentrations as a function of pH at constant ionic strength of 0.01 M and Darcy velocity of 0.024 cm sec-1...................... 92
Figure 6.3 Particulate iron release as a function of pH at a constant ironic strength of 0.01 M......................................................................................................... 94
Figure 6.4 Ionic strength effect on FeS release at acidic pH. ........................................... 96
Figure 6.5 FeS release at different fluid velocities. .......................................................... 97
Figure A.1 Film model for mass transfer from solid surface to bulk fluid..................... 106

viii
List of Tables
Table 2.1 Solubility constants for mackinawite.................................................................33
Table 3.1 Typical size distribution of Dry #1 (65) quartz sand (US Silica, Missouri) ..........................................................................................................39
Table 4.1 The stability ratios of FeS nanoparticles as a function of suspension composition: pH, ionic strength, and buffer concentration..............................52
Table 5.1 Variables used in sample calculation for deposition rates using clean bed filtration theory with negligible repulsive barrier .....................................73
Table 5.2 Summary of deposition rates at various pH and ionic strength .........................82
Table 6.1 Iron elution using columns of FeS-coated sand obtained by prior filtration in flow-through columns...................................................................89

ix
ABSTRACT
CHEMICAL OPTIMIZATION OF IN SITU EMPLACEMENT OF
NANO-PARTICULATE IRON SULFIDE IN POROUS MEDIA
by
Jun Hee Lee
Chair: Terese M. Olson
Chemical optimization of an alternative construction method for permeable
reactive barriers (PRBs) was investigated. Conventional trench-and-fill construction
methods of PRBs are limited to shallow and thin aquifers, and hindered by the presence
of a highly consolidated aquitard, subsurface utilities, or aboveground structures. In situ
emplacement of reactive materials by direct injection technique offers a potential cost
effective method to overcome these obstacles. The feasibility is largely expected to
depend on whether sufficient coverage of the sand by FeS can be obtained without
plugging the inlet region. Optimal deposition rates of FeS nanoparticle were established
by modulating the chemistry of influent FeS suspensions. Such optimal conditions can be
obtained when electrostatic interactions between FeS particles are sufficiently
unfavorable while interaction between FeS particles and the quartz sand are sufficiently

x
favorable. These optimum conditions were obtained at neutral pH, pH 6.5 to 8.3, and
relatively low ionic strength, 0.025 M. At these conditions 3.4 × 10⁻⁶ mole FeS on
average was deposited per gram of sand.
To better understand the surface charge characteristics of FeS, aggregation rates
studies were performed as a function of solution chemistry. The stability of FeS
suspension gradually increased as pH increased in the neutral pH region, suggesting that
the FeS surface becomes more negatively charged as pH increases. The stability sharply
increased between pH 8.3 and 9.0, which can be explained by the hypothesis that FeS has
multiple surface functional groups.
Loss rates of FeS coating were investigated to evaluate the longevity of FeS-type
PRBs as a function of solution chemistry. Over the pH range tested, pH 5.5 to 10.0,
particulate iron detachment due to repulsive interactions was not observed on FeS pre-
coated sands. When FeS was deposited by direct injection, however, detachment by
repulsion appeared to explain greater FeS loss at more alkaline pH. In the range of pH 5.5
to 7.5, the dissolution rates of FeS increased as pH decreases, achieving steady-state
effluent concentrations of 6.1 mg L-1 as Fe at pH 5.5. Excessive iron loss rates at
relatively acidic pH might significantly shorten the long term operation of FeS-type
PRBs.
1
Chapter 1
Introduction
Contamination of subsurface aquifers threatens many groundwater supplies in the
United States and remediation of these sites often proves to be a costly long term project.
Among the many remediation approaches that have been tried, permeable reactive
barriers (PRBs) are one of the most promising techniques (Gavaskar, 1999; Day et al.,
1999). A PRB is in situ remediation technique in which a zone of reactive material is
placed in the flow path of the contaminant plume. The contaminants are subsequently
treated or sequestered as they flow through the reactive material. PRBs are generally
considered to be cost effective due to low operation and maintenance costs resulting from
the in situ and passive nature of the remedial system, although there are uncertainties
regarding the design life of reactive materials (Interstate Technology & Regulatory
Council (ITRC), 2005; United States Environmental Protection Agency (USEPA), 2002).
In comparison to pump-and-treat systems that have well documented cost information,
PRB systems are cost effective if PRB functions for more than 10 years before
replacement or rejuvenation of reactive materials is necessary (ITRC, 2005). The longer a
PRB functions, the more cost effective it is. PRB systems, however, typically require

2
higher construction costs than conventional pump-and-treat methods. Construction costs
are the largest cost factor including reactive media, emplacement, waste disposal, health
and safety, and site restoration (ITRC, 2005). The emplacement method, therefore, can
significantly impact the cost-effectiveness of a PRB.
Conventional methods of constructing reactive barriers employ relatively costly
trench-and-fill methods, which involve soil excavation and then backfilling with the
reactive material. Trench-and-fill methods also have significant limitations. Excavation
of the trench can be relatively costly and applications are limited to depths of
approximately 20 m or less (Cantrell and Kaplan, 1997). The presence of highly
consolidated aquitards, subsurface utilities, or aboveground structures can also be
obstacles to a trench-and-fill installation approach. To overcome these obstacles, an
alternative emplacement method was tested in this research. This method involves
injecting a colloidal suspension of the reactive material into the aquifer and allowing the
particles to deposit on existing granular media.
The feasibility of direct injection of reactive materials into the subsurface to
remediate contaminated aquifers has recently been demonstrated by several researchers.
Various reactive materials i.e. zero valent iron, bimetallic nanoparticles, and
functionalized titanium oxides, were examined using either emulsification or particle
surface modification approaches in laboratory and small scale field experiments (Cantrell
et al., 1997; Elliot and Zhang, 2001; Schrick et al., 2004; Saleh et al., 2007). These
successful attempts of direct injection technique into subsurface environments drive us to

3
study further for a promising alternative installation method of PRBs that can be applied
at greater depths, less affected by the geological obstacles and structures.
Particles injection methods, however, introduce the risk of plugging the injection
zone if particle deposition rates are too high. For successful emplacement the injection
conditions must achieve sufficient but relatively uniform coating, to minimize the loss of
permeability. For colloidal suspensions with ionized surface groups, filtration rates
depend in part on the electrostatic forces between colloids and packed bed media, which
are a function of the solution and surface chemistry of the colloids and bed media.
Suspension stability with respect to aggregation, another necessary condition to avoid
plugging in the injection zone, also depends on particle interaction forces. In this
research, nanosized iron sulfide particles were investigated as a potential reactive media
and experiments were conducted to determine the optimal solution conditions for particle
deposition. The effect of geochemical conditions on the loss of iron sulfide coatings was
also examined.
Iron sulfide minerals have been recognized as an effective reagent in terms of
their reactivity with a wide variety of common contaminants and high adsorptive capacity
due to its high reactive surface and large surface area. A number of laboratory scale
studies have shown that the mineral mackinawite, a ferrous monosulfide FeS, can be used
to treat a variety of contaminants, including redox metals, non-redox metals, and
chlorinated organic compounds. For example, FeS can remove non-redox metals by
precipitation of highly insoluble metal sulfide phases (Cole el al., 2000). Mackinawite is
also an effective reductant so that oxidized forms of metals, i.e. hexavalent chromium,
4
are reduced and subsequently removed by adsorption or formation of mixed-metal sulfide
phases (Patterson et al., 1997; Chung, 1989). FeS has demonstrated abiotic reducing
potential for the dechlorination of chlorinated organic contaminants, for example,
tetrachloroethylene (PCE) and trichloroethylene (TCE) transform to acetylene and cis-
1,2-dichloroethylene (cis-DCE) by abiotic reductive dechlorination (Butler and Hayes,
1997, 1998; Jeong and Hayes, 2003). An attractive property of this mineral for
remediation purposes, is its large surface area. Freshly synthesized FeS particles in the
literature are typically a few nanometers in size and have a large surface area and highly
reactive surfaces (Wolthers et al., 2003; Jeong et al., 2008; Ohfugi and Rickard, 2006).
The mean specific surface area (SSA) has been reported range between ~220 and ~424
m2 L-1 with average diameters of 2 to 10.8 nm.
The surface charge characteristics of FeS particles are important for a mechanistic
understanding of FeS deposition on porous media. However, estimates of the point of
zero charge (pHpzc) and surface potential pH dependence of FeS (nanoparticulate
mackinawite) are inconsistent in the literature (Bebie et al., 1998; Wolthers et al. 2005;
Gallegos, 2007). It was hypothesized that the dissolution of FeS may interfere with
conventional electrokinetic-based estimates of its surface potential and an alternative
indirect approach to examining FeS surface charge was undertaken instead. In this
dissertation a qualitative understanding of the pH dependence of FeS surface charge was
obtained by quantitatively measuring the initial aggregation rates of FeS suspensions as a
function of pH.

5
The feasibility of FeS as a reactive PRB material will depend, in part, on its
longevity once it is emplaced. FeS particles deposited on the surface of subsurface grain
may detach and remobilize, for example, during the operation of a PRB. FeS dissolution
may also lead to loss of the reactive media. In this research the loss rates and mechanisms
of previously deposited FeS were examined as a function of solution chemistry.
1.1 Objectives of Research
This research focused on the chemical optimization of iron sulfide nanoparticles
deposition in porous media to meet the goals of constructing PRBs. The optimal
deposition rates can be controlled by changing surface chemistry of iron sulfide by
modulating suspension chemistry. Thus the primary objectives of this research are as
follows;
FeS suspension stability characterization
Indirect characterizations of the surface charge of FeS were obtained by
examining the stability of suspensions as a function of solution chemistry. Initial
aggregation rates were quantitatively measured as a function of pH, ionic strength, and
buffer concentrations.
Chemical optimization for emplacement of nano-sized FeS particles in porous media
The feasibility of in situ colloid injection methods to generate an iron sulfide-type
PRB was investigated by establishing the chemical conditions necessary to generate an

6
FeS-coated quartz sand media. Model bed materials and synthetic nano-sized FeS were
used to obtain a mechanistic understanding of the optimal conditions for FeS deposition.
FeS release tests from FeS-coated sand
Deposited FeS particles on sand surfaces can be released by dissolution or
detachment under varying chemical conditions. In order to examine the longevity of a
FeS-type barrier, iron and particle release rates as a function of pore water chemistry
were examined. Model packed beds of FeS-coated sand were used to evaluate the
mechanisms of iron release as a function of solution chemistry. Separation steps were
conducted to distinguish the particulate or dissolved states of iron in the column effluent.
1.2 Dissertation Organization
Chapter 1 of the dissertation provides a brief description of this research. Chapter
2 contains a review of relevant literature, including the characteristics of iron sulfide as a
reactive material, background regarding PRBs and emplacement techniques, surface
properties of colloids affecting deposition and release rates, i.e., electrostatic properties of
colloids, and models of colloid filtration in granular media. Chapter 3 discusses the
methodologies and materials commonly used in this research, i.e., synthesis of
mackinawite and iron analysis. Methodologies for specific experimental tasks are
discussed in their own chapters. Chapter 4 presents the experimental findings of the
stability of iron sulfide nanoparticles as a function of solution chemistry. Chapter 5
discusses the results of column tests that were designed to ascertain optimal chemical

7
conditions for colloidal FeS deposition on granular quartz bed media. Chemical control
of colloid deposition rates were exerted by varying the solution pH and ionic strength,
and thus the resulting electrostatic forces between the FeS particles and sand surfaces.
Chapter 6 contains the results of iron release experiments, in which columns of FeS-
coated sand were eluted with particle-free solution at varying pH, ionic strength and
buffer content, while particulate and dissolved concentrations in the column effluent were
monitored. Mechanistic interpretations of the observed rates of FeS dissolution and
detachment of deposited FeS particles are provided. Chapter 7 provides a summary of the
conclusions and implications of this research and suggested future research to advance
PRB technologies.

8
Chapter 2
Background
2.1 Permeable Reactive Barriers (PRBs)
Permeable Reactive Barrier (PRB) technologies are increasingly being applied to
remediate contaminated groundwater. A PRB typically consists of a zone of reactive
media placed perpendicular to groundwater flow as shown in Figure 2.1. As groundwater
flows through the zone, targeted contaminants are either sequestered or degraded by the
barrier. A number of reactive materials are used to treat various targeted contaminants;
zero valent iron, ferric oxides, granular activated carbon, apatite, bone char, zeolites,
peat, humate, limestone, calcium polysulfide, compost, and others. Among these, zero
valent iron is the most frequently used reactive media since it can treat a variety of
contaminants; chlorinated organic compounds, metals, chlorinated solvent, and
radionuclides. There have been as many as 200 PRB applications worldwide since their
initial use in the mid 1990s (ITRC, 2005). Among those, about 60% are iron based. In the
United States, there have been 67 full scale iron based PRB sites. Although some of the
applications have had significant problems with permeability and hydraulics, these
problems have typically resulted from the construction techniques or inadequate site

9
characterization rather than chemical precipitation and clogging of reactive media (ITRC
2005; Henderson and Demond, 2007).
Figure 2.1 Schematic of a permeable reactive barrier (USEPA, www.epa.gov)
As a passive, in situ approach to treatment, PRBs represent a less energy intensive
alternative to conventional ex situ methods, such as pump-and-treat or excavate-and-treat.
This is particularly the case of sites contaminated with residual or pools of dense non-
aqueous phase liquids (DNAPLs), given the long term nature of cleanup projects at such
sites. Remediation by pump-and-treat is often projected to require hundreds of years. The
National Research Council (1994) extensively investigated 77 sites within the US where
full scale pump-and-treat was being used. 67 of the 77 reviewed sites have not reached
cleanup goals. Compared to other in situ remediation strategies, such as natural

10
attenuation, PRBs offer the advantage of plume containment and can be applied to
address more refractory contaminants.
2.1.1 Trench-and-Fill Excavation Limitations
Despite the advantages offered by PRBs, limitations exist in terms of the current
configurations and materials that are used to employ them. Most PRB installations are
constructed by ‘trench-and-fill’ methods, in which the subsurface zone is excavated and
then backfilled with the reactive media (Day et al., 1999, Gavaskar, 1999). Although
trench-and-fill methods are effective, the method is limited to shallow aquifers less than
20 meters in depth and thin aquifers (Cantrell and Kaplan, 1997a). USEPA (2002)
reported a cost analysis of PRB implementation based on 22 field installations. The
construction cost is accounted for 75.9 % of the total cost on average. The deeper and
wider the contaminated aquifer was, the more costly is the PRB was to construct. The
presence of a highly consolidated aquitard, subsurface utilities or aboveground structures
can also be an obstacle to install a trench-and-fill barrier. Some exploratory research has
begun to develop alternate construction methods that could extend PRB applications. One
such method is in situ emplacement, in which the reactive media is injected as a colloidal
suspension into a target zone and deposited on aquifer grain surfaces. These methods are
reviewed herein and the feasibility of colloidal injection is investigated in this research.
2.1.2 Limitations of Zero Valent Iron Media
The development of alternate reactive materials could also help to extend PRB
use and longevity. Zero valent iron, the most commonly used reactive media, is versatile

11
in terms of the wide range of contaminants it can remove. Upon corrosion of ZVI,
however, increases in pH occur, often with the simultaneous precipitation of a variety of
metal oxides and carbonates. These phases can eventually lead to excessive reductions in
hydraulic conductivity (plugging) and reduced reactivity. An alternate medium that has
been considered by various researchers because of its versatile reactivity with many
contaminants is mackinawite, FeS (Butler and Hayes, 1998, 1999; Jeong and Hayes
2003; Liu et al., 2008). Preliminary thermodynamic modeling of the amount of
precipitate formation in a FeS barrier has also suggested that slower losses of hydraulic
conductivity may be obtained with FeS media relative to ZVI (Henderson and Demond,
unpublished data). FeS is also produced as a corrosion product in some ZVI barriers
(Hansson et al., 2006) and so its behavior is of interest. In this research, FeS particles are
examined for their potential use in PRBs constructed by in situ emplacement methods.
2.1.3 In Situ Emplacement of Colloids in Porous Media by Injection
The feasibility of direct emplacement of nanoparticulate FeS as a potential PRB
construction technique was investigated in this research. Several researchers have studied
direct injection techniques to emplace a variety of reactive materials into a subsurface
aquifer (Cantrell 1997 a,b; Mattigod, 2005; Zhang 2003; Elliott and Zhang, 2001; Schrick
et al., 2004). These studies include a mixture of laboratory and field-scale investigations.
Cantrell et al. (1997 a,b) showed successful injection of a suspension containing 1
to 3 µm ZVI particles in coarse sand column tests with the addition of a shear-thinning
fluid to increase the fluid viscosity in porous media. The colloidal particles with shear-

12
thinning fluid resulted in more even deposition through the column length at relatively
higher injection rates and lower colloidal suspension concentration of zerovalent iron
minerals. The shear-thinning fluids served to reduce the significant sedimentation
velocity of these relatively large and dense colloids.
Elliott and Zhang (2001) performed a field demonstration application of
bimetallic (Fe/Pd) nanoparticles (100-200 nm in diameter) to treat chlorinated
compounds, i.e. trichloroethene (TCE), at a well characterized contaminated site. In situ
injections of 0.75 – 1.5 g L-1 of bimetallic nanoparticle suspension were performed by
gravitational feeding at an injection well. Iron and TCE concentrations were monitored at
an injection well and three down gradient monitoring wells spaced 1.5 m apart for 4
weeks. Approximately 45 to 96% reductions in TCE concentration were observed
between the injection well and the furthest monitoring well (4.5 m distance). Iron
concentrations in the wells after 3 weeks of injection were 32 and 10 mg L-1 at the
injection well and monitoring wells, respectively, while background iron concentrations
were less than 1 mg L-1. There were no significant changes in hydraulic conductivity after
6 weeks of injection.
Researchers have also studied direct injection methods to remediate contaminated
subsurface aquifers using other materials such as vegetable oils and functionalized
titanium oxide nanoparticles. Mattigod et al. (2005) injected functionalized TiO2
nanoparticles into lab scale sand columns to evaluate their injectability into a porous
medium. TiO2 particles with diameters between 40 – 60 nm, were coated with an
organosilane monolayer possessing terminal ethylenediamine (EDA) ligands, and then

13
treated with Cu(II) to bind a cationic Cu-EDA complex to the nanoparticle surface. A 60
wt % suspension of this sorbent with 2% of ammonium carboxylate dispersant was
injected into the silica sand column. The sorbents were uniformly deposited through the
column without a significant increase in inlet pressure.
Coulibaly and Bordon (2004) investigated the injection of edible soybean oil to
construct a PRB reactive zone using laboratory column tests. The edible oil served as an
organic substrate to stimulate anaerobic biodegradation. They found that properly
prepared oil emulsions could be distributed through sand columns without excessive loss
of permeability. Key factors in generating the desired droplet were the oil-water
interfacial tension and the mixing energy input. It was necessary that the oil droplets (1)
be sufficiently stable, (2) be significantly smaller than the pore size of the sediment to
avoid clogging pore path, and (3) have a low to moderate tendency to stick to each other
and the aquifer sediments. It was also found that greater differences in zeta potential
between the droplets and sand/clay grains reduced the potential for droplets to stick to the
grain surfaces.
In this research the feasibility and the chemical optimization of direct injection of
iron sulfide nanoparticles was investigated using model quartz sand columns without the
addition of additives, i.e., surfactants or shear thinning fluids. Chemical optimization was
investigated by manipulating the pH and ionic strength of pore water to achieve uniform
and maximum deposition through the column media.
14
2.2 Characteristics of FeS
2.2.1 Reactivity of FeS
A number of materials have been proposed for reactive media of PRBs: iron
minerals, modified zeolites, peat moss, chitosan, titanium oxide, apatite, limestone, coal,
activated carbon, and etc (Scherer et al., 2000). Among these, iron minerals are common
reactive materials for PRBs. Zerovalent iron (ZVI) have been widely studied and used
from laboratory scale to full scale field installment (Blowes et al. 2000; Arnold and
Roberts, 2000; Matheson and Tratnyek, 1994). Iron sulfide minerals such as mackinawite
are also known for their ability to scavenge trace metals (Coles et al., 2000; Patterson and
Fendorf, 1997) and to reductively dechlorinate chlorinated organic compounds (Butler
and Hayes, 1998 and 1999, Jeong and Hayes, 2003) in anaerobic environments.
In this research, nanosized iron monosulfide (FeS, Mackinawite) particles are
examined as a reactive material for permeable reactive barriers. Although zerovalent iron
(ZVI) has been intensively studied for the last decade as a reactive material for PRB
application, iron sulfide minerals are a potentially effective alternative of reactive
material in terms of their (1) reactivity with a wide variety of common contaminants
(Butler and Hayes, 1998 and 1999; Jeong and Hayes, 2003; Coles, 2000; Patterson,
1997), (2) high adsorptive capacity due to its high reactive surface and large surface area
(Wolthers et al., 2005; Jeong and Hayes, 2003), and (3) potential for microbially
mediated regeneration under sulfide reducing environment (Hansson et al., 2006).

15
Iron monosulfide (FeS) has been recognized as an effective reactive material for
the removal of various forms of contaminants such as chlorinated organic compounds,
redox metals, and non-redox metals. FeS has a high metal ‘exchange’ capacity for non-
redox metals (Coles et al., 2000). These metal ‘exchange’ reactions, however, may be
more accurately described as the precipitation of highly insoluble metal sulfide phases as
follows:
2 2( ) ( )S SFeS Pb PbS Fe+ ++ → + (2.1)
2 2( ) ( )S SFeS Cd CdS Fe+ ++ → + (2.2)
FeS is also an effective reductant so that oxidized forms of some metals are
reduced and subsequently removed by adsorption or formation of mixed-metal sulfide
phases (Patterson, 1997). Hexavalent chromium is more soluble and mobile than Cr(III)
compounds. Cr(VI) is negatively charged and does not tend to not absorb to negatively
charged mineral surfaces. Since Cr(VI) is very soluble, removal of chromium by
precipitation requires that it first be reduced to Cr(III), which readily precipitates as
Cr(OH)3(s). FeS can sequester Cr(VI) by a single step combining reduction and
precipitation shown in equation 2.3 (Chung, 1989).
22 7 2 3( ) 3( )2 7 2 ( ) 2 ( ) 2 2S SCr O FeS H O Cr OH Fe OH S OH− −+ + → + + + (2.3)
FeS has demonstrated abiotic reducing potential for the dechlorination of
chlorinated organic contaminants such as tetrachloroethylene (PCE) and trichloroethylene
(TCE) (Butler and Hayes, 1998 and 1999; Jeong and Hayes, 2003). Butler and Hayes
(1999) reported that PCE and TCE transformed to acetylene and cis-1,2-dichloroethylene

16
(cis-DCE) by abiotic reductive dechlorination by FeS. The reported pseudo first-order
rate constants for TCE and PCE transformation by FeS at pH 8.3 were (1.49 ± 0.14) ×
10-3 h-1 and (5.7 ± 1.0) × 10-4 h-1, respectively. These rate constants were an order of
magnitude smaller than those for dechlorination by ZVI (Matheson, 1994; Liu et al.,
2006). The dechlorination rate constants for TCE by ZVI were 0.011 to 0.084 h-1 under
various test conditions, i.e. ZVI surface treatment by acid washing and various ferrous
iron concentrations. This slower dechlorination rate may be caused by slower electron
transfer rates of ferrous sulfide than zerovalent iron.
Many researchers (Liou et al., 2006; Choe et. al, 2000; Li and Zhang, 2006) have
recently employed nanoscale ZVI particles to take advantage of the large surface area and
high surface reactivity that it offers for many target contaminants. Liou et. al. (2006)
reported that smaller grained ZVI would have greater reactivity due to its large specific
surface area (SSA) through nitrate reduction kinetic experiments. Their laboratory
synthesized nanoscale ZVI, having an average diameter of 9.5 nm, 56.67 m2 g-1 SSA, and
up to 8.6 times greater nitrate reduction rate constants compared to 45 nm nanoscale ZVI,
which had 16.16 m2/g of SSA.
Furthermore, in situ synthesized FeS particles have smaller size than ZVI.
Synthetic iron monosulfide has a tetragonal mackinawite structure which forms tabular
crystals (Vaughan and Craig, 1978; Wolthers et al. 2003, see Figure 2.2). Ohfuji and
Rickard (2006) estimated particle sizes of mackinawite from 2 to 5.7 nm (3.6nm in
average) in thickness (the direction parallel to the c axis) and from 3 to 11 nm (5.6nm in
average) in length using high resolution transmission electron microscopic (HSTEM)

17
study. The mean specific surface area by calculation based on particle size was 380 ± 10
m2 g-1 which agrees with Wolthers et al. (2003), 350 m2 g-1. However, this value is much
higher than previously reported values, 7 to 80 m2 g-1, based on BET and conventional
TEM studies (Taylor et al., 1979; Benning et al., 2000; Widler and Seward, 2002). The
lower SSA may result from the aggregation of the mackinawite particles. The large SSA
values are a result of the layered structure of mackinawite and the high internal surface
area between the layers (see Figure 2.2). However, the separation distance between Fe-Fe
layers is as small as 0.5 nm, and the internal surface area may not be available for
sorption of contaminants if the interlayer spacing is not extendable.
Figure 2.2 Sketch of mackinawite structure (Wolthers et al., 2003). Mackinawite possesses a tetragonal layer structure, where the Fe atoms are linked in a tetrahedral coordination to four equidistant S atoms. Fe-Fe layers are separated by ca. 0.5 nm.
18
2.2.2 Metastability of Mackinawite
Among various iron sulfide minerals such as troilite (FeS), pyrrhotite (FeS),
greigite (Fe3S4), pyrite (FeS2), and marcasite (FeS2), mackinawite (FeS) is the first
precipitated iron sulfide in the reaction of sulfide and ferrous iron (Schoonen and Barnes,
1991; Wilkin and Barnes, 1996; Benning et. al., 2000; Hunger and Benning, 2007).
Mackinawite is commonly referred to as amorphous FeS or poorly crystalline iron
sulfide. During aging, less crystalline mackinawite can be transformed into more stable
and more crystalline iron sulfides such as pyrite.
Schoonen and Barnes (1991) showed that mackinawite is a precursor for the
formation of pyrite and marcasite which are the most stable forms of iron sulfides. Their
aging experiments upon mixing of ferrous iron (FeCl2 or Mohr’s salt) and hydrogen
sulfide (NaSH or Na2S4) at 65oC showed that sulfidation of the precursor proceeds
progressively through the formation of more sulfur-rich FeS phases as follows:
Amorphous FeS Mackinawite Greigite Pyrite/Marcasite
(FeS) (FeS) (Fe3S4) (FeS2)
This conversion occurs at a significant rate only in the presence of intermediate
sulfur species, such as zerovalent sulfur, polysulfides, polythionates, or thiosulfate. If
there is no sulfur contributor even if hydrogen sulfide or bisulfide present, no significant
FeS2 formed. These results suggest that the conversion rates from amorphous FeS to iron
disulfide depend on the solution redox state and pH. More oxidizing solutions favor the
formation of important sulfur intermediates. When the molar Fe/SH ratio was less than

19
unity, greigite never formed due to an excess of reduced sulfur species. In neutral to
alkaline pH experiments, the formation rates of FeS2 from FeS were slowed than acidic
experiments due to the low solubility of Fe (II).
Benning et al. (2000) also demonstrated that the transformation of mackinawite to
pyrite occurs only in slightly oxidizing environments in experiments at low temperature
(25 – 100 oC). Mackinawite was stable for 4 months in reduced sulfur solution. The
conversion to pyrite occurred only after oxidation was induced, and the rate of
transformation increased as the oxidation degree increases.
Wilkin and Barnes (1996), in contrast, postulated that the conversion of
mackinawite to pyrite proceeds via iron loss, not by sulfur addition, based on sulfur
isotopic experiments. The composition of δ34S in the formed pyrite and the precursor
mackinawite was the same as in the presence of a variety of sulfur species, i.e. H2S, HS-,
Sx2-, S2O3
2-, SO32-, colloidal elemental sulfur, and the organic sulfur species at neutral pH
at 70oC. They concluded that a key factor governing pyrite formation is the near-surface
oxidation state of iron monosulfides. Oxidized iron monosulfides, by air exposure prior to
aging in sulfide solution, were converted to pyrite in the absence of intermediate sulfur
species, even in excess of sulfide.
In summary, based on the available literature, the conversion of FeS to pyrite
proceeds either by addition of excess sulfur from solution (equation 2.4, Schoonen and
Barnes, 1991) or by loss of ferrous iron from surface (equation 2.5, Wilkin and Barnes,

20
1996). In both pathways, the transformations are more favorable as solution conditions
become more oxidizing.
3 4 22 22 43 3
2e eFeS Fe S FeS
S S
− −
− −
− −⎯⎯⎯→ ⎯⎯⎯⎯→+ +
(2.4)
3 4 22 22 24 2e eFeS Fe S FeSFe Fe
− −
+ +
− −⎯⎯⎯⎯→ ⎯⎯⎯⎯→− −
(2.5)
This metastable nature of FeS may significantly affect its reactivity in a PRB.
Weerasooriya and Dharmasena (2001) and Lee and Batchelor (2002), for example, have
both demonstrated that FeS2 is significantly less efficient in degrading TCE than FeS.
Such reactivity comparisons in terms of metal and trace element removal, however, are
not available. In addition, the metastability of FeS can interfere with analytical
characterizations of its properties and these interferences may contribute to the wide
range of reported literature values for some of its properties.
2.2.3 Surface Charge Characteristics of Mackinawite and Quartz Sand
An understanding of the surface charge characteristics of iron sulfide is crucial to
understanding the aggregation rates of FeS suspensions or their deposition rates on
porous media since both processes are governed by the electrostatic forces between
interacting surfaces. The net interaction force between two charged surfaces is
determined by the balance of either repulsive or attractive coulombic forces and attractive
van der Waals forces between them. Only the coulombic interaction forces, however, are
a function of solution chemistry. Coulombic interaction forces between like colloidal

21
particles in a suspension are naturally repulsive, except when the surface is uncharged.
The coulombic interaction force between a colloidal particle and filter grain surface is
either repulsive or attractive, depending on whether their surface charges are similar or
dissimilar in sign, respectively. Both FeS and quartz sand are ionizable surfaces for
which protons are potential-determining. The surface charge of both minerals, therefore,
is pH dependent.
Near a charged surface, the ions in solution re-distribute themselves into what is
referred to as an electrical double-layer, consisting of a compact Stern layer and a diffuse
layer (see Figure 2.3A). Within this electrical double layer counter ions (opposite charge
of the surface) are in higher concentration than the bulk solution while co-ions (same
charge as the surface) are at lower concentration. The surface potential of such an
interface represents the electrical work required to bring a co-ion from the bulk solution
to the surface. The electrostatic interaction forces between particles can be modulated
chemically by changing the surface potential or screening the surface charge such as by
adding salt (see Figure 2.3B). Although surface potentials cannot be directly measured in
aqueous systems, electrokinetics techniques for colloidal particles, such as
electrophoresis, provide estimates of the potential at the plane of shear, or ‘zeta
potential’. This parameter is often used to characterize the coulombic state of a charged
interface.

22
Figure 2.3 Schematic diagrams for double layer and electrical potential of a charged colloidal particle. (A) The left view shows the change in charge density around colloid. The right shows the distribution of positive and negative ions around the charged colloid. (B) The relationship between zeta potential and surface potential depend on the ion concentrations in solution. (Zeta-Meter Inc., www.zeta-meter.com)
For surfaces such as FeS and silica sand, surface potentials are a function of pH.
The surface charge of quartz monotonically becomes more negative at pH greater than 2
(see Figure 2.4). The surface potential of mackinawite is less understood, however, since
the literature data are not in close agreement. Gallegos (2007) found, based on
electrokinetic measurements, that charge reversal of the FeS surface occurs near pH 5 and
thus it was negatively charged at pH > 5. Figure 2.5 presents the reported FeS zeta
potential as a function of pH from this study. Potentiometric titrations were used by other
researchers (Wolthers et al., 2005) to estimate the point of zero charge (pHPZC) of the FeS
surface, at which the net surface charge density at the shear plane on a surface becomes
zero. They reported that the pHpzc is pH 7.5, and these results are presented in Figure 2.6.

23
This alkaline pHPZC is in disagreement with pH isoelectric points (pHiep) of various metal
sulfides reported by others. Bebie et al. (1998) investigated the surface charge
development on a variety of metal sulfides such as sphalerite (ZnS), galena (PbS),
chalcopyrite (CuFeS2), pyrrhotite (FeS), pyrite (FeS2), vaesite (NiS2), cattierite (CoS2),
and hauerite (MnS2) based on an electrokinetic study, i.e. electrophoresis. The isoelectric
points of these metal sulfides are expected to be between pH 0.6 and 3.3. Widler and
Seward (2002) also reported the potentiometrically determined pHPZC of pH 2.9 for a
very crystalline mackinawite aged at 130oC for 20 hours. This disagreement of the point
of zero charge of mackinawite may result from different synthesis methods, the high
solubility of FeS at acidic pH, or the metastability of FeS.
Figure 2.4 Zeta potential of quartz as a function of pH at an ionic strength of 0.01 M. Different curves represent different quartz cleaning methods. (Litton and Olson, 1993)

24
-60
-40-20
0
2040
60
80100
120
1 3 5 7 9 11
pH
Zeta
Pot
entia
l (m
V)
Quartz SandMackinawiteFerrihydrite
Figure 2.5 Zeta potential measurement for mackinawite, quartz sand, and ferrihydrite in 0.001 M NaCl background electrolyte. (Gallegos, 2007)
Figure 2.6 Surface titration of disordered mackinawite (Wolthers, et al., 2005)

25
2.2.4 Surface Functional Groups of FeS Nanoparticles
Surface functional groups on FeS surfaces determine the surface potentials and
reactivity of iron sulfide. Although it is a generally accepted hypothesis that metal
sulfides have multiple types of surface functional groups, detailed surface spectroscopic
data to support this hypothesis is not yet available. Two suggested surface functional
groups at iron sulfide surface are iron hydroxyl (≡FeOH0) and sulfide (≡SH0) functional
groups (Bebie et al., 1998). Theoretically, however, there are a number of possible
functional groups on the surface of FeS as follows (Wolthers, 2005; Bebie et al., 1998):
≡Fe+ + SH- ↔ ≡FeSH (2.6)
≡Fe+ + OH- ↔ ≡FeOH (2.7)
≡S- + H+ ↔ ≡SH (2.8)
≡S- + Fe2+ ↔ ≡SFe+ (2.9)
≡SFe+ + SH- ↔ ≡SFeSH (2.10)
≡SFe+ + S2- ↔ ≡SFeS- (2.11)
Wolthers et al. (2005) suggested that the FeSH+ complex should be dominant over
the FeOH+ complex (see Figure 2.7) in solutions saturated with FeS at pH<10. Figure 2.7
shows the reversal of surface charge at pH 7.5, which is consistent with the pHPZC ~ 7.5
they reported. Since the pHPZC is uncertain, however, the functional group distribution is
as well.

26
Figure 2.7 Surface complexes proposed for saturated FeS solutions at 0.053 M of ionic strength by Wolthers et al. (2005)
2.3 Stability of Suspensions
Although the aggregation kinetics of FeS nanoparticles has not been specifically
studied, colloidal particle aggregation in suspension can be generally controlled by
adjusting the surface charge of particles and/or suspension chemistry. Aggregation rates
of colloidal particles are commonly described by classical DLVO theory (named after
two independent groups who developed the framework, Derjaguin, Landau, Verway, and
Overbeek, Derjaguin and Landau, 1941; Verwey and Overbeek, 1948), which explains
the balance of electrostatic repulsion and van der Waals attraction forces between
particles.

27
In order to avoid high deposition rates of FeS particles at the point of injection
and consequently reductions in hydraulic conductivity or plugging during FeS
emplacement by injection, influent FeS suspensions must be sufficiently stable with
respect to aggregation. The net repulsive energy, in other words, the interaction energy
barrier, between colloids should be sufficiently large (see Figure 2.8).
Figure 2.8 Typical net interaction curve between charged colloids as a function of particle separation distance for the case of a net repulsive energy barrier. (Zeta-Meter Inc., www.zeta-meter.com)
The repulsive energy barrier can be controlled by modifying solution chemistry
such as ionic strength and pH (Mylon et al., 2004), or directly changing the surface
charge of colloids by adding surface active materials to specifically adsorb on to the
colloid surface. Shear thinning materials can also be used to prevent the particles from
aggregating, settling or precipitating from suspension.

28
Mylon et al. (2004) studied the aggregation kinetics of hematite nanoparticles (43
± 3 nm) by adjusting ionic strength using NaCl and CaCO3. In both of background
electrolytes, the zeta potentials of hematite colloids decreased (i.e., became less negative)
as ionic strength increased. The rate of change in the mean aggregate radii increased with
ionic strength until a maximum aggregation rate was reached. The minimum cation
concentration required for diffusion limited aggregation, i.e., the critical coagulation
concentration (CCC), is commonly to be correlated with colloid release. CCC for NaCl
and CaCO3 was 30 mM and 2.4 mM, respectively.
In this research the aggregation rates of FeS nanoparticulates were examined to
understand their stability in aqueous suspensions as a function of pH and ionic strength.
Photon correlation spectroscopy (PCS) was utilized to measure changes in aggregate radii
in time. Detailed is discussed in chapter 4.
2.4 Colloid Filtration
Under conditions in which migrating colloids are filtered through granular bed
media, high rates of deposition quickly lead to plugging at the point of injection. In order
to avoid plugging or loss of permeability, the deposition rates must be optimized. Several
factors affect the deposition rate of colloids, among which are colloidal properties such as
size, shape, density, aggregation state and surface charge, and fluid properties such as
viscosity, density and velocity, and bed grain properties such as grain size, shape and
surface charge (Ward, 1987).

29
2.4.1 Filtration Theory
For colloidal particles which are much smaller than the pores of the medium,
depth filtration is a dominant process. In this concept of filtration, the migrating particles
in porous media can be captured on surface of the media by collision mechanisms.
Particle deposition rates depend on the rate of physical contact with the granular media,
and the rate of successful attachment. For submicron-sized particles, the frequency of
colloidal encounter with a grain is diffusion controlled. Figure 2.9 shows conceptual
diagrams of mechanisms of particle capture in depth filters. Figure 2.9.C illustrates
particles captured on a single media by diffusion. More detail filtration theory will be
discussed in Section 5.2 later.
Figure 2.9 Particle capture mechanisms in depth filtration
The rate of successful attachment depends on the net interaction energy profile as
a function of separation distance from the collector as electrical double layers overlap.
The deposition rates of particles, therefore, are affected by electrokinetics of both the

30
migrating colloids and the porous media. The deposition rates can be increased if
repulsive forces are decreased. In order to achieve colloid penetration and more uniform
deposition conditions over practical PRB thicknesses, therefore, it is essential to establish
sufficiently favorable deposition conditions between FeS particles and the porous media
surface while sufficiently unfavorable interaction between FeS particles. Unfavorable
deposition conditions arise when repulsive interaction forces between negatively charged
particles and granular media are sufficiently large. In contrast, favorable deposition
conditions are enhanced if the repulsive forces between the particles and the porous
media are minimized.
2.5 Remobilization of Deposited Colloids in Porous Media
Despite the advantages PRB processes offer, there is uncertainty about their
effectiveness over relatively long operation periods due to their relatively short history of
field application. In PRBs constructed by in situ emplacement of injected colloids, the
eventual loss of the reactive colloids by detachment or dissolution could limit the service
life of the barrier. Even FeS-type PRBs constructed by trench-and-fill approaches, for
example by using FeS-coated sand, could have reduced service lives if significant losses
of the coating occur. The factors that are likely to control FeS loss are discussed in the
following sections.

31
2.5.1 Detachment of Reactive Particles by Repulsive Interaction Forces
Release of colloidal particles is largely controlled by the solution chemistry of
pore water and hydrodynamics of the flow field (Ryan and Elimelech, 1996; Khilar and
Fogler, 1998; Grolimund and Borkovec, 1999, 2006; Abadzic and Ryan, 2001). The pH
and ionic strength of pore water are thought to be major factors that affect particle
mobilization. A number of experiments have demonstrated that the release of subsurface
colloidal particles, i.e. clays, is enhanced under low ionic strengths of pore water
conditions (Ryan and Gschwend, 1994; Roy and Dzombak, 1996; Grolimund and
Borkovec, 2006). The release of particles is generally governed by DLVO theory by
which the balance of forces between colloidal particles and aquifer grains is described in
terms of electrostatic repulsion and the van der Waals attraction forces within the double
layer. A decrease in ionic strength causes changes in net potential by expansion of the
double layer around like-charged colloids and aquifer grains. If the net interaction energy
is repulsive, the particles may be released. In addition, many researchers reported that
pore water containing monovalent ions causes more release than divalent ions for a
particular ionic strength (Khilar and Fogler, 1998; Roy and Dzombak, 1996).
The release of colloidal particles is generally enhanced with an increase in pH due
to the greater development of negative charge on the colloid and grain surface (Khilar
and Fogler, 1998; Bunn et al., 2002). However, pH effects on electrostatic forces between
colloids and grains may be less sensitive than that of ionic strength (Grolimund and
Borkovec, 1999), unless the pH changes by several orders of magnitude or a charge
reversal of the particles occurs.

32
2.5.2 Particle Loss by Dissolution
The solubility of mackinawite has been investigated by many researchers since
Berner (1967) first reported its thermodynamic stability, although the values in the
literatures are also not in close agreement. The dissolution reactions of mackinawite are
generally described as a function of pH according to equations 2.12 and 2.13:
22 ( ) 2 aqFeS H Fe H S+ ++ + (2.12)
2 FeS H Fe HS+ + −+ + (2.13)
The dominant form of sulfide is as a function of pH due to acid dissociation, and
the first equilibrium constant in aqueous solution is 10-6.98 (Suleimenov and Seward,
1997) as follows:
2 ( ) aqH S H HS+ −+ log Ka1 = -6.98 (2.14)
Under acidic pH conditions, equation (2.12) will govern the solubility of FeS and
equation (2.13) controls it at alkaline pH. The reported solubility constants for
mackinawite are summarized based on the equation (2.13) in Table 2.1. From this review
of the literature, it appears that there is more than an order of magnitude range in the
reported solubility of FeS. For example, a factor of 20 difference in the equilibrium
dissolved iron concentration is predicted with the highest and lowest solubility constants
at pH 5 and [H2S] = 10-4 M.

33
Table 2.1 Solubility constants for mackinawite
pKsp pH tested Temperature Reference
3.00 ± 0.12 3.1 – 7.9 20 oC Davison et al., 1999
3.89 to 3.99 3.3 –12 25 oC Benning et al., 2000
2.11 ± 0.27 6 –8 25 oC Wolthers et al., 2005
3.48 ± 0.25 3.16 –9.66 23 oC Rickard, 2006 2 sppK p Fe p HS pH+ −= + −
This difference of solubility constants might be due to its metastable nature. The
state of mackinawite used in various research studies may differ since it ages relatively
quickly to more crystalline forms, and can further be transformed to more stable iron
sulfides, i.e., greigite and pyrite, in the presence of aqueous oxidant species. Also the
transformation rate to more stable iron sulfides can increase under more acidic pH
conditions since one of the conversion mechanisms, to greigite from mackinawite, is the
iron loss pathway (Wilkin and Barnes, 1996, see equation 2.5). Accurate experimental
measurements of the solubility of mackinawite can be hindered if surface corrosion of
mackinawite occurs since the solubility of greigite is much less than that of mackinawite
(Berner, 1967; Benning et al., 2000; Rickard and Morse, 2005). Also Gallegos (2007)
postulated that the solubility of FeS is significantly sensitive to the oxidation state of
solution.

34
Rickard (2006) recently reported that an aqueous FeS cluster complex is the
dominant dissolved species at alkaline pH. The aqueous FeS clusters (FenSn 4H2O, where
n = 2 or 4) are independent of pH, with a formation constant, log K, of -5.7.
The dissolution of FeS, therefore, at relatively acidic pH conditions may be an
important process limiting the longevity of PRBs. In this study, FeS release rates from
model quartz sand were investigated under varying pore water chemistry, i.e. ionic
strength and pH, to examine the longevity of FeS sand coatings.
35
Chapter 3
General Methods, Materials, and Characterization
In this chapter general experimental methods and materials used throughout the
dissertation are discussed. Specific experimental methods and materials that were
employed in each of the FeS stability, deposition, and release studies are discussed
separately in Chapters 4, 5, and 6, respectively. All sample preparations were performed
in an anaerobic chamber (4 ± 1 % hydrogen gas + 96 ± 1% nitrogen gas) where other
conditions are not noted. All chemicals used were reagent grade. Deoxygenated and
deionized water was prepared by boiling of deionized water (18 MOhm cm) from a
Millipore Milli-Q system (Billerica, MA) to remove dissolved oxygen. Then the boiled
water was cooled in a water bath while bubbling high purity (99.99%) nitrogen gas to
prevent the dissolution of atmospheric oxygen until the temperature dropped to about
50oC. The warm, deoxygenated Milli-Q water was then stored in the glovebox for at least
24 hours before use.
3.1 FeS Synthesis
Nanoparticulate mackinawite (FeS) was synthesized by a precipitation method in
which FeCl2·4H2O and Na2S·9H2O (Fisher Scientific, Certified ACS) solutions were
36
reacted in an anoxic chamber following the method of Butler and Hayes (1998). 1.2 liters
of 1.1 M Na2S were slowly added to 2.0 L of 0.57 M FeCl2. The resulting slurry was
mixed on a magnetic stir plate for 4 days to age the particles. Upon aging, the pH of the
suspension increased from 8 to 11. The 4 day aged FeS particles were in equilibrium with
the solution at a pH of 11.3. The aged suspension was decanted into polypropylene
centrifuge bottles that were tightly sealed and centrifuged at 11,000 rpm for 15 min. The
supernatant was discarded. Fresh deoxygenated water was added, and the bottles were
shaken, equilibrated, and re-centrifuged a total of eight times over 2-3 days. The FeS was
then freeze-dried under vacuum for 5 ± 1 days. The freeze-dried FeS particles were
stored in airtight vials in the anoxic chamber until used. All synthesis procedures were
conducted in an anaerobic chamber except during the short periods of centrifugation and
freeze drying.
3.2 Structure Characterization of FeS using X-ray Diffraction
X-ray diffraction analyses were conducted to verify that the synthetic iron sulfide
powder was crystalline mackinawite. Prior to analysis, the freeze dried FeS particles were
crushed to a fine powder using an agate mortar and pestle. The diffraction patterns were
obtained from a Rigaku (The Woodlands, Texas) 12 kW rotating anode generator at 40
kV and 100 mV with a Cu Kα radiation source. Spectra were collected over a 2-theta
range of 0 to 95 degrees and analyzed using JADE analysis software (Materials Data Inc.,
CA). As shown in Figure 3.1, the spectra were consistent with the reported peak

37
reflections of mackinawite at 17.62o, 30.06
o, 34.47
o, 38.96
o, 50.43
o and 59.09
o (Kouvo et
al., 1963). The red line in Figure 3.1 shows the reported XRD peaks for mackinawite.
Figure 3.1 XRD analysis of synthesized FeS nano-particles
3.3 Size Analysis of FeS using Photon Correlation Spectroscopy
Photon correlation spectroscopy (PCS) was used to characterize the size of the
synthetic FeS particles. This technique relies on dynamic light scattering measurements
of Brownian, submicron particles in a suspension. Since particle diffusion rates are
determined by their size, size information is obtained from the measured rates of
fluctuation of the scattered light. The lower size limit by this technique is a few
nanometers, depending on the difference in the refractive index of the solvent and the
particle. The method requires that light be scattered only once, and to minimize multiple
scattering, dilute suspensions are required. For this reason, the technique could not be

38
applied to suspensions at the concentrations used in the deposition experiments (1 g L-1
FeS). Size determinations of 20 mg L-1 suspensions were performed instead.
The PCS instrument (Model N4 Submicron Particle Size Analyzer, Coulter,
Fullerton, CA) was installed in an anaerobic chamber to conduct the size measurements
in order to minimize oxidation. Stock suspensions of freeze-dried FeS (1 g L-1) were
dispersed by vigorously mixing with a magnetic stirrer for 24 hours prior to the
measurement. With dispersing times shorter than 24 hours, the size analysis indicated that
the particles are significantly aggregated and not well dispersed as single nanosized
particles. The conductivity of the stock suspension was 92 µS cm-1, which is
approximately equivalent to 7 × 10⁻⁴ M KCl. The dispersed stock suspension was then
further diluted to 20 mg L-1 just prior to PCS analysis. The sample pH was 7.5 and
suspension remained stable for several days at these conditions. The samples were
measured at 90 degree of scattering angle for 200 seconds of acquisition time with weight
distribution analysis mode. Results of the PCS analyses indicated that the FeS colloidal
suspensions had a mean diameter of 3 nm. Since this value is close to the detection limit
of the instrument, the mean diameter may be slightly over-estimated by the method.
3.4 Quartz sand
Since the objective of this study was to characterize the nature of the interaction
forces between the FeS colloids and granular porous media, a relatively well-
characterized granular media, clean quartz sand, was selected in order to better
understand the surface charge characteristics of the FeS surface. Clean quartz surfaces

39
have a negative surface potential over ambient groundwater pH conditions, repulsive
electrostatic forces between the sand and FeS particles would be expected, therefore, if
the surface of the FeS was negatively charged as well.
The quartz sand (#1 Dry (65), U.S. Silica, Pacific, MO) had a mean grain
diameter ranging from 150-210 μm (typical size range of 75 to 600 μm) and a relatively
round shape. Typical size distribution is shown in Table 3.1 and Figure 3.2. The sand was
used without further size grading since mechanical sieving is known to impart impurities
on the surface of quartz sand that are difficult to remove (Litton and Olson, 1993). Prior
to use in the column experiments, the sand was cleaned by sequential rinses of dithionite
and hydrogen peroxide to remove surface metal oxides and organic matter (American
Society of Agronomy and Soil Science Society of America, 1982).
Table 3.1 Typical size distribution of Dry #1 (65) quartz sand (US Silica, Missouri) Typical Values USA Standard Sieve Size
% Retained % Passing Mesh Millimeters Individual Cumulative Cumulative
20 0.850 0.0 0.0 100.0 30 0.600 0.1 0.1 99.9 40 0.425 4.5 4.6 95.4 50 0.300 15.0 19.6 80.4 70 0.212 31.0 50.6 49.4
100 0.150 34.0 84.6 15.4 140 0.106 13.0 97.6 2.4 200 0.075 2.3 99.9 0.1 270 0.053 0.1 100.0 0.0
Pan Pan 0.0

40
Figure 3.2 Typical size distribution of Dry #1 (65) quartz sand (US Silica, Pacific, MO)
3.5 Buffers
In both the FeS deposition and release studies, chemical buffers were used to
maintain the pH of FeS suspensions and electrolytes. The synthesized mackinawite
equilibrates with hydrogen and sulfide ions in suspension, and the time for equilibrium is
extremely long for open systems or at low H2S(g) partial pressure. Thus, the buffers were
used to minimize unexpected pH changes over long equilibration periods due to
processes such as oxidation, aging, or phase change. Borate or boric acid buffer was used
over the pH range of 8.2 to 10.0. MOPS (3-(N-Morpholino)propanesulfonic acid, sodium
salt) buffer was used for pH 6.5 to 7.5. Acetate buffer was used for pH 5 to 5.9. Desired
concentrations of buffers and ionic strengths were calculated by MINEQL+ (Version 4.5,
41
Environmental Research Software, Hallowell, ME). Effects of buffers on the stability of
FeS particles were tested in Chapter 4.
3.6 Iron Analysis
Iron sulfide suspensions were acidified to a 2% nitric acid concentration prior to
analyses using concentrated trace metal nitric acid (approximately 70% HNO3, Fisher
Scientific). 1/35 of the sample volume of the 70 % nitric acid was added to FeS sample
suspension. The acidified FeS suspension was completely dissolved using a vortex mixer
before further dilution. The acidified solution was further diluted to an appropriate
concentration for iron analysis using 2% HNO3 using a colorimetric method (AWWA,
APHA, WEP, 1995) or Ion Coupled Plasma – Mass Spectroscopy (ICP-MS, Perkin
Elmer, Waltham, MA)

42
Chapter 4
Aggregation Kinetics of FeS Suspensions
4.1 Introduction
A study of the self interaction dynamics of FeS particles in suspension provides
both a direct determination of the solution conditions that favor their stability with
respect to aggregation and an indirect method of probing their surface charge
characteristics as a function of solution chemistry. As the surface charge on an FeS
colloid increases, whether negatively or positively, the interaction forces between the
particles become more repulsive, resulting in a more slowly aggregating (i.e., stable)
suspension. Because of the known pH-dependent surface charge of metal sulfides, FeS
aggregation rates were studied here as a function of pH.
The few attempts to characterize the surface charge-pH dependence of
mackinawite have not yielded a precise estimate of its pH point of zero charge, pHpzc,
(Mullet et al., 2004; Wolthers, et al., 2005; Gallegos, 2007). The analytical approach and
mackinawite synthesis methods used by these researchers vary, however. Mullet et al.
(2004) carried out electrokinetic measurements (electrophoretic mobility) with synthetic
mackinawite, which was aged for 24 hours and freeze dried for storage prior to use over

43
the range of pH 4 – 10. The zeta potential was negative over the entire pH range tested
and thus, the pHiep was less than 4. Wolther et al. (2005) conducted potentiometric
titrations with freshly precipitated FeS to estimate its surface charge, over the pH range
of 6 to 8.The pHPZC estimated was near 7.5. The analysis of their titration data required
complex corrections and speciation assumptions to account for the significant solubility
of FeS in this pH range. Gallegos (2007) performed electrokinetic analyses and reported
zeta potentials (potential at the plane of shear) over the pH range of 4 to 6. The
suspensions were also aged longer than those studied by the Wolthers group. These
experiments suggested the pHPZC of FeS was near 5. The significant solubility of FeS in
this pH range, however, can be expected to confound measurements of its electrokinetic
velocity. The resulting increases in solution ionic strength with dissolution, for example,
would also contribute to a reduction in the electrokinetic mobility of colloidal FeS.
Nevertheless, Gallegos’ estimate of the pHPZC is more consistent with the surface acidity
reported for metal sulfides generally. Iron sulfide mineral surfaces such as pyrite (FeS2)
and pyrrhotite (FeS) were negatively charged above pH value of 2 and 3.3, respectively
(Bebie et al., 1998). These investigators also demonstrated that the addition of soluble
ferrous iron, resulted in an alkaline shift in their isoelectric points. An even greater
alkaline shift would be expected for mackinawite, since it is even more soluble than
pyrrhotite. The pHPZC estimated by Gallegos, therefore is consistent with that prediction.
Aggregation kinetic studies of FeS suspensions were visually conducted by
Gallegos (2007). Noticeable aggregation and settling were observed in these experiments
as the pH approached pH 5 (starting from more alkaline pH). FeS particle aggregation,

44
however, has not been quantitatively studied. In this research the temporal changes in
light scattering of nanoparticulate FeS suspensions, as measured by photon correlation
spectrometry (PCS), were quantitatively related to the change in FeS particle size with
time over the pH range of 6.5 to 9. The theoretical basis for these relationships and the
approach used to analyze the PCS data sets are outlined here.
4.2 Theory
For initially monodisperse suspensions, i.e., suspensions consisting of particles of
all the same type and diameter, the aggregation kinetics can be expressed by as a second-
order decay process (von Smoluchowski, 1916):
211
dN k Ndt
= − ( 4.1)
where N is the number concentration of singlet particles and k11 is the rate constant for
doublet formation. The rate constant, k11, depends on the frequency of collisions and the
efficiency with which collisions successfully produce a doublet. Namely,
11 11k β α= ( 4.2)
where β11 is the collision frequency function between two singlets, and α is the
dimensionless sticking coefficient. For nano-sized colloids, the collision frequencies are
governed by their Brownian motion. von Smoluchowski (1916) derived the following
relationship for the collision frequency of two identical particles due to Brownian
diffusion:

45
83
Bsmol
K Tkμ
= ( 4.3)
where KB is the Boltzmann constant, T is the absolute temperature, and µ is the viscosity
of the medium. For a monodisperse suspension, the Smoluchowski constant is
independent of particle size and depends only on fluid properties. Under conditions when
all collisions successfully produce an aggregate, i.e., α is unity, then k11 = ksmol, and
aggregation proceeds at its maximum rate. This condition is referred to as diffusion-
limited colloid aggregation (DLCA).
Electrostatic repulsive forces between interacting particles can reduce the
aggregation efficiency of collisions, wherein α < 1. These conditions are often referred to
as reaction-limited colloid aggregation (RLCA). The relationship of α to solution
composition and surface properties is typically described in terms of classical DLVO
theory. This theory describes the balance between the repulsive coulombic energy, VR,
and attractive van der Waals energy, VA, of two interacting charged spheres. The
relationship between α and the net interaction energy, VT = VR + VA, is expressed
according to the theory as:
∫∞
==a
BT rdrTKVaW
22)/exp(21
α ( 4.4)
where W is the stability ratio, a is the radii of interacting particles and r is the distance
between the centers of interacting particles.

46
The VA contribution to VT, is independent of solution composition. The solution
chemistry dependent term, VR, for two interacting spheres is:
)2(22
0
4tanh)(64 δϕδ
κ−Κ−
⎥⎦
⎤⎢⎣
⎡+= H
B
dBR e
TKze
raTnK
V ( 4.5)
where, no is ion number concentration, δ is the depth of the stern layer, and H is the
distance of the interacting particles at closest approach (H = r – 2a).
Since H+ is a potential-determining ion for the FeS surface, the pH affects the
magnitude of its zeta potential and therefore VR. The second effect of solution
composition on VR is revealed through the parameter, κ in equation 4.6. Solution ionic
strength controls the characteristic thickness of the electrical double layer, also known as
the DeBye length, 1/ κ. κ is related to the ionic strength as follows:
IRTF
2/1
0
22000⎟⎟⎠
⎞⎜⎜⎝
⎛=
εεκ ( 4.6)
where κ is in m-1, F is Faraday’s constant, ε0 is permittivity in vacuum, ε is the relative
dielectric permittivity and I is the ionic strength (=½ΣCiZi2 where Ci is the ionic
concentration in mol L-1).
The approach to obtain experimental estimates of the attachment efficiency at a
particular solution condition, was to first determine initial rates of aggregation (after
significant doublet formation, the suspension is no longer monodisperse) and the rate
constant, k11. Based on theoretical estimates of ksmol, α can be calculated as:

47
11
smol
kk
α = ( 4.7)
In aggregation studies, it is conventional to express the stability of a suspension in terms
of the symbol, W, which is the inverse of α and known as the stability ratio,
1Wα
= ( 4.8)
or 11
smolkWk
= ( 4.9)
Large values of W correspond to stable suspensions, whereas α approaches zero. For
unstable suspensions aggregating at DLCA conditions, W = 1.
When light scattering intensity measurements and initial aggregation rates are
monitored to study RLCA kinetics, the aggregation rate constant can be estimated as
follows (Virden and Berg, 1992):
2111
00 0 2 2 1
2 ( )1( )
h
th h
rI q drkr n I q r r dt =
⎛ ⎞= ⎜ ⎟⋅ − ⎝ ⎠ ( 4.10)
where r0 is the radius of particles at t = 0, n0 is the particle number concentration at t = 0,
I1(q) and I2(q) are the scattered intensity of singlet and doublet, respectively, q =
(4π/λ)sin(θ/2) is the magnitude of the scattering vector, where λ is the wavelength of the
light in the medium and θ is the scattering angle, and rh1 and rh2 are the hydrodynamic
radii of the singlet and doublet, respectively.
Based on the Rayleigh-Gans-Debye theory (RGD), Virden and Berg (1992)
demonstrated the ratio of the intensity of singlet and doublet can be obtained as:

48
02
1 0
sin(2 )( ) 1 2 ( ) 2
r qI qI q r q
= + when 2 1 1d mπλ
− ( 4.11)
where d is the longest linear dimension through the particle and m = nparticle/nmedium is the
ratio of the complex refractive index of the particle to the refractive index of the
surrounding medium. This equation is valid when the particle diameter is appropriately
small. Mackinawite suspensions used here meet this criterion; the longest linear
dimension of the FeS particle is 5.6 nm on average, and the wavelength of helium-neon
laser of the instrument used in the research is 632.8 nm. The refractive indices for water
and mackinawite are 1.333 and 2.5-2.8 at 20oC, respectively (Kyprianidou-Leodidou et
al., 1997). From the experimental initial growth rates, (dr/dt)t=0, the aggregation rate
constant for slow aggregation can be obtained by substituting equation 4.11 into 4.10
which yields:
1100 0 t
drkr n dtβ
=
⎛ ⎞= ⎜ ⎟⋅ ⎝ ⎠ ( 4.12)
where 0 2
0 0 2 1
22 sin(2 )
h
h h
r q rr q r q r r
β =+ −
( 4.13)
4.3 Methods and Materials
All aggregation experiments were conducted in an anoxic chamber. Photon
correlation spectroscopy (PCS) by N4 Submicron Particle Size Analyzer (Coulter, The
Woodlands, TX) was utilized to measure the change of particle sizes over time. Particle
free deoxygenated/deionized water was prepared by filtering deoxygenated/deionized

49
water (18MΩ·cm, see chapter 3) with 0.1 µm syringe filters (GE Healthcare, Piscataway,
NJ). 2 g L-1 of FeS suspensions were prepared using deoxygenated/deionized water
(18MΩ·cm) and freeze dried FeS. The suspensions were completely re-dispersed on a
magnetic stirrer for 4 days, and then filtered twice with 0.1 µm syringe filters (GE) to
remove any undesired impurities or possible large FeS aggregates. The filtered stock
suspensions had particle concentrations in the range of 60.0 to 80.9 mg FeS L-1 and a pH
of 9.4 ± 0.3. Sample suspensions were prepared by adding proper amounts of buffers and
salt solution (KCl) with the stock suspension. The desired ionic strength of solutions
includes contributions of the buffer and additional salt. The added salt concentration to
maintain the desired ionic strength was determined using MINEQL+. The pH was
adjusted using MOPS for pH < 8 and borate for pH > 8. Potassium chloride was added to
obtain the desired ionic strength. The sample particle concentrations used in PCS
measurement were 13 ± 1 mg L-1 in FeS concentration and 40 ± 10 nm of mean diameter
based on the scattered light intensity by PCS analysis. The equivalent particle number
concentration was (6.49 ± 0.71) × 1010 cm-3. All plastic wares, i.e., cuvettes and sample
tubes, were rendered dust free by rinsing with filtered deoxygenated/deionized water
(0.01 µm syringe filters). All solutions including buffers and salt were also filtered prior
to use. The particle size changes were monitored until particles grew to approximately
250 nm in diameter. Most tests were replicated at least twice.

50
4.4 Results and Discussion
The changes in FeS aggregate diameter were measured over time at various pH
and ionic strength using PCS. Figure 4.1 shows the aggregation rates of FeS as a function
of pH at a constant ionic strength of 0.05 M. The initial aggregation rates clearly decrease
as pH increases. The diameter of the aggregates was measured until they attained an
aggregate size of about 250 nm. A complete experiment required 40 to 90 minutes over
the pH range of 6.5 to 8.3 and an ionic strength of 0.05 M. At pH 9 and an ionic strength
of 0.05 M, the total PCS measurement time was about 7 hours to attain a particle size of
about 200 nm (complete data not shown in Figure 4.1). The data acquisition time for a
Figure 4.1 Initial aggregation rates of nanoparticulate FeS at various pH at a constant ionic strength of 0.05 M. The diameter of mackinawite were measured over time using Photon Correlation Spectroscopy

51
reading was 100 seconds for most samples. Over the course of an entire aggregation
experiment, the suspensions were stable and no discoloration was observed due to the
possible oxidation of FeS. For the fastest coagulation condition considered, ionic strength
of 0.1 M at pH 8.3, in which the stability ratio (W) was 5.5 ± 0.3, and particles grew to a
size of 300 nm in 3 minutes. In this case, particle size was measured every 30 seconds. At
an ionic strength of 0.025 M, the particle coagulation rate was extremely slow.
Approximately 120 hours were required to grow the particles to 190 nm. Over such long
periods, the particles might undergo other reactions, such as oxidation, although no visual
evidence of any precipitation or color change was observed.
The stability ratios (W) were calculated from the slopes, (dr/dt)t=0, of the initial
aggregation rate tests based on equations 4.12, 4.13 and 4.9. Table 1 summarizes the
slope data and the stability ratios at various chemical conditions. For the pH 8.3 and ionic
strength of 0.05 M suspension, the initial particle coagulation rate, (dr/dt)t=0, was
determined to be 1.21 nm min-1 in average from Figure 4.1. The initial particle
concentration was 13.7 mg L-1, and the initial particle size was 43.7 nm in diameter.
From these data the initial particle number concentration, n0, was calculated with a
typical value of the mackinawite density, 4.5 g cm-1. β was estimated from equation 4.13
as follows:
0 2
0 0 2 1
22 sin(2 )
h
h h
r q rr q r q r r
β =+ −
= 1.9
where q = (4π/λ)sin(θ/2) = 0.0169
and λ = 632.8 nm and θ = 90o for a PCS light source of 4 mV helium-neon laser

52
Table 4.1 The stability ratios of FeS nanoparticles as a function of suspension composition: pH, ionic strength, and buffer concentration.
Sample ID pH Ionic
Strength (mM)
MOPS (mM)
Borate (mM)
HCl (mM)
(dr/dt)t=0 (nm/min) W (±σ)
65-50 6.48 50 10 0 0 2.7 (±0.16) 119 (±7.2)
70-50 6.99 50 10 0 0 2.0 (±0.14) 164 (±12.0)
75-50 7.48 50 10 0 0 1.5 (±0.11) 201 (±13.9)
83-50 8.32 50 0 10 0 1.2 (±0.12) 267 (±26.3)
90-50 9.03 50 0 10 0 0.33 (±0.018) 976 (±51.2)
65-50A 6.75 50 0 0 0.167 2.7 (±0.075) 119 (±3.3)
70-50A 7.06 50 0 0 0.125 2.3 (±0.13) 137 (±7.6)
75-50A 7.50 50 0 0 0.094 1.8 (±0.039) 181 (±3.9)
83-50A 8.12 50 0 0 0.070 0.94 188
83-50A1 8.41 50 0 0 0.076 1.0 250
90-50A 8.97 50 0 0 0.031 0.40 (±0.006) 802 (±12.1)
83-100 8.28 100 0 10 0 39 (±2.2) 5.5 (±0.3)
83-75 8.30 75 0 10 0 10 (±0.091) 20.6 (±0.2)
83-45 8.31 45 0 10 0 0.37 (±0.015) 585 (±24.2)
83-40 8.32 40 0 10 0 0.15 1423
83-35 8.29 35 0 10 0 0.075 2884
83-25 8.29 25 0 10 0 0.009 (±0.0004) 33769 (±1295)
70-50M5 7.00 50 5 0 0 1.7 (±0.0075) 128 (±0.6)
70-50M15 6.96 50 15 0 0 1.3 (±0.058) 166 (±7.6)
70-50M20 6.96 50 20 0 0 0.98 (±0.053) 218 (±11.8)
70-50M50 6.98 50 50 0 0 0.17 (±0.0085) 1258.5 (±63.2)
83-50B15 8.40 50 0 15 0 0.62 343
83-50B20 8.38 50 0 20 0 0.61 347
83-50B25 NM* 50 0 25 0 0.52 409
83-50B44 8.35 50 0 44 0 0.47 457
* NM is not measured

53
The rate constant obtained using equation 4.5 is:
1100 0 t
drkr n dtβ
=
⎛ ⎞= ⎜ ⎟⋅ ⎝ ⎠= 2.49 × 10⁻¹⁴ cm3 sec-1
Therefore, the stability ratio is
11
1 267.2smolkWkα
= = =
where 43
Bsmol
K Tkμ
= = 6.63 × 10⁻¹² cm3 sec-1 at 28oC
Most samples were 2 – 3 times replicated, and the standard deviations of the initial
aggregation rates and the stabilities are also reported in Table 4.1.
4.4.1 FeS Stability as a Function of pH
The pH dependence of the FeS suspension stability ratios tabulated in Table 4.1 is
graphically presented in Figure 4.2. Over the pH range studied, the stability of FeS
monotonically increases as pH increases, suggesting the FeS surface is negatively
charged in the pH range tested. In the case of a positively charged surface, the charge
density would be expected to decrease with increasing pH. Thus, the pHPZC of
mackinawite must be less than pH 6.5.
The sensitivity of FeS suspension stability to pH varied over the pH range studied.
Buffer concentrations of 0.01 M were used to maintain the pH of suspensions; MOPS
buffer for 6.5 < pH < 7.5, and borate buffer for 8.2 < pH < 9.0. In the region of pH 6.5 –
8.3, the stability ratios gently increased from 119 (±7.2) to 267 (±26). Bebie and
coworkers (1998) showed that all metal sulfides are negatively charged above their pHPZC,

54
0.6 to 3.3, and their surface potential gradually increased in the neutral pH region. Also
the zeta potential of the iron sulfides is weakly negative, -20 to -40 mV (Bebie et al.,
1998), compared to iron oxides which easily go down to -100 mV (Kallay et al., 2005;
Preocanin et al., 2006) which results in relatively low stability ratios. This may explain
the relatively low and pH-insensitive stability of FeS suspensions in this pH region.
Figure 4.2 Stability ratios as a function of pH at a constant ionic strength of 0.05 M. Diamond markers present FeS suspensions in which the pH was adjusted with hydrochloric acid. Triangular markers represent suspensions in which the pH was adjusted with 0.01 M buffers: borate buffer for pH > 8, MOPS buffer for pH < 8. Red error bars indicate one standard deviation based on 2 to 3 replicates. Error bars where not visible, are smaller than the symbols.

55
A much more sensitive pH dependence of suspension stability is observed at more
alkaline conditions. The stability ratio increased sharply between pH 8.3 and 9.0. These
results appear to disagree with the pH independence of FeS electrophoretic mobilities
reported by Mullet et al. (2004) over the pH range of 4 to 10, although such a large range
of pH insensitive surface charge has not been reported in other studies. Possible
explanations for the pronounced increase in observed stability in this study could involve
either extensive deprotonation of surface functional groups or oxidation of the surface to
form iron hydroxide phases. It should be pointed out, however, that in the preparation of
FeS suspensions for all of the stability experiments, the original stock suspensions were
dispersed for four days at somewhat alkaline conditions (pH = 9.4±0.3) before adjusting
the pH and measuring aggregation rates. If oxidation near pH 9 was relatively rapid, it is
unlikely that the effect would have been reversible and hence the particles should likely
have behaved as iron hydroxides. It is unlikely that a fresh iron hydroxide phase, however,
would be negatively charged at pH values as low as 6.5. Based on this reasoning, the
deprotonation of surface functional groups is a more likely mechanism to explain the
increase in stability at pH > 8.3.
Experimental determinations of FeS aggregation rates at pH < 6.5 were attempted,
however, the dissolution of FeS was thought to interfere with the measurements in this
pH range. The experimental data was characterized by considerably more scatter and a
lack of reproducibility. These sample suspensions were also discolored after a few hours.
The solubility of FeS begins to increase as pH decreases below pH 6.5 while its solubility

56
at neutral and alkaline pH is not pH dependent and the soluble iron concentration is quite
low. For example, according to Richard (2006), the dissolved iron concentration is 10-5.7
M above pH 7. Thus, the dilute FeS suspension of about 13 mg L-1 (10-3.8 M) employed
in this experiment and the increased phase change rates to greigite by iron loss
mechanism hindered accurate measurement of particle coagulation rates at acidic pH.
Aggregation rates were also studied in a buffer-less system in which the pH was
adjusted using only hydrochloric acid. The stabilities of the suspensions that were pH
adjusted using hydrochloric acid was slightly less than that of the pH buffered
suspensions, but statistically not significant at this buffer concentration (0.01 M). Buffer
effects on the stability along with buffer concentrations will be discussed later in this
chapter.
4.4.2 Effect of Ionic Strength
The dependence of stability ratio on the ionic strength of the FeS suspension was
also examined at pH 8.3. Figure 4.3 showed a sharp decrease in W from 33,800 (±1300)
to 5.5 (±0.3) as the ionic strength increased from 0.025 M to 0.1 M. This decrease would
be expected by a simple calculation of Debye length, κ -1 (see equation 4.6). The
characteristic thickness of double layer was decreased from 1.93 to 0.96 nm with the
increase of the ionic strength from 0.025 to 0.1 M. The net effect of double layer
compression is to reduce the net interaction energy barrier, VT, and thus W (see equations
4.6). As a rule of thumb, energy barriers greater than 15kBT, or so, are sufficient to
stabilize a suspension such that 1 in ~106 (W = 106) collisions are effective (Stumm and

57
Morgan, 1996). At pH ≤ 8.3, the interaction energy barriers between FeS particles are
probably smaller than this value for the range of ionic strengths used in this study.
Figure 4.3 Semi-logarithmic plot of stability ratios of mackinawite as a function of ionic strength at pH 8.3 with 0.01 M borate buffer. Error bars are smaller than symbols.
4.4.3 Effects of Buffers on FeS Stability
With the addition of buffers to a suspension, there is a general concern that
specific adsorption of buffer ion species could change the surface charge of the colloids
being studied. In these aggregation studies, the pH buffers used were MOPS (3-(N-

58
Morpholino)-propanesulfonic acid, MW = 209.3) for the pH range 6.5 to 7.5 and boric
acid (B(OH)3, MW = 61.8) for pH 8.2 to 9.0. The effects of buffer concentration on FeS
suspension stability were studied at a constant pH and ionic strength for each of the two
buffer systems. Aggregation rates were also studied in buffer-less solutions in which the
pH was adjusted with only hydrochloric acid.
Buffer effects on the particle stability are shown in Figure 4.4a and Figure 4.4b
for the MOPS and borate buffers, respectively. In general there is an increase in particle
stability with increasing buffer concentration. In the case of the MOPS system at pH 7,
stability ratios increased only slightly from 131 ± 7.3 in the absence of buffer, to 218 ±
12 at 20 mM MOPS, but W then increased sharply to 1258 ± 63 at 50 mM MOPS. This
might be explained by adsorption of high molecular weight organic compound to the
surface of FeS (Joanny et al., 1979; Liang and Morgan, 1990; Zherenkova et al., 1998).
MOPS buffer has molecular weight of 209.26. It should be pointed out, however, that if
the FeS particle concentrations were larger than those used here, the sorbed concentration
of MOPS would decrease, and the effect of MOPS on particle surface charge would
likely diminish as well.
For the inorganic borate buffer, the stability of FeS gradually increased as the
borate concentration increased at pH 8.3 and I = 0.05 M. W increased by a factor of 2,
from 219 to 457, over the buffer concentration range tested, 0 to 0.044 M, respectively.
MOPS affected the stability of FeS more than the borate at high concentrations.

59
Figure 4.4 FeS suspension stability as a function of buffer concentration; (a) W as a function of MOPS buffer concentration at pH 7.0 and 0.05 M ionic strength. (b) W as a function of borate buffer concentration at pH 8.3 and 0.05 M ionic strength.

60
4.5 Conclusions
In this research, the stability of nanoparticulate mackinawite suspensions was
characterized as a function of solution chemistry under anaerobic condiitons. The results
demonstrate that the surface of mackinawite is negatively charged above pH 6.5 and thus
its pHPZC must be lower than pH 6.5. The stability is relatively pH-insensitive in the
neutral pH range, pH 6.5 to 8.3. Values of the stability ratios (W) are relatively small and
range from 120 to 270 as pH increases from 6.5 to 8.3. These W values suggest that 1 in
120 to 270 collisions result in the formation of an aggregate. By inference, the surface
charge of FeS in this pH region becomes only slightly more negative as pH increases.
The surface of FeS becomes sharply more negatively charged, however, between pH 8.3
and 9.0 in which the stability ratio increases from 270 to 980 at an ionic strength of 0.05
M. The presence of functional groups with varying acidity on the mackinawite surface is
hypothesized to account for these pH regimes of weak and strong surface charge.
If MOPS is used as a pH buffer, the stability of FeS suspensions sharply increases
as the MOPS concentration exceeds 0.02 M. This may be due to specific adsorption of
this relatively high molecular weight organic compound on the particle surface, resulting
in greater repulsive interactions between particles. The FeS stability is relatively
insensitive to the presence of MOPS, however, below 0.015 M. Therefore, a careful
selection of MOPS concentration is required to minimize specific adsorption effects of
MOPS. Since the FeS particle concentrations were relatively dilute in these aggregation
studies compared to the suspension concentrations that would be required for in situ
emplacement systems, adsorption effects of MOPS might be negligible in such an

61
application. The stability of FeS increased only slightly as borate concentrations were
increases.
Salt concentration strongly affects FeS stability. The stability of FeS suspension
approaches unity at an ionic strength of 0.1 M and pH of 8.3. However, the suspension
was significantly stable at an ionic strength of 0.025 M, as the stability ratio was more
than 30,000. The sensitivity of FeS stability to ionic strength is expected in terms of
classical electrical double layer compression. In order for FeS particles to penetrate the
porous media without clogging at the injection point, the particles must stable themselves.
The stability ratio must be sufficiently large, at least larger than hundreds. Therefore the
FeS deposition tests were tested in the range of ionic strength 25 to 50 mM.

62
Chapter 5
Chemical Optimization of FeS Deposition on Granular Quartz Sand
5.1 Introduction
In this chapter the feasibility of in situ emplacement of FeS nanoparticles by
direct injection into porous media is evaluated. These particle filtration experiments were
conducted at the bench scale, in which columns of well defined granular quartz were used
as the bed material. Although actual aquifer mineralogy will be more geochemically
complex than the media used here, the motivation of these experiments was to
demonstrate that the FeS deposition rates could be chemically controlled and optimized,
and to improve our understanding of FeS-bed media interactions.
To successfully inject and emplace iron sulfide nanoparticles in porous media,
deposition rates of the particles must be rapid enough to obtain coatings with sufficient
reactive area, but plugging by high rates of deposition at the injection point must be
prevented. In this set of experiments, the optimal deposition rates were evaluated by
modulating the chemistry of nanoparticulate iron sulfide suspensions. It was
hypothesized that optimal deposition conditions can be achieved when the interaction
force between particle and porous media surfaces is sufficiently favorable to obtain good

63
coverage, while the interaction between suspended particles is sufficiently unfavorable.
Favorable interactions between suspended particles would lead to rapid aggregation and
plugging at the injection point. In addition, injected particles can be deposited on the
surface of previously deposited FeS particles if particle-particle interactions are favorable,
which again would promote plugging at the injection point.
It is envisioned that in situ emplacement of FeS would be most applicable in
zones of relatively high permeability, such as sandy aquifers. Natural sand sediments are
likely to have a wide variability of surface mineral coatings, however, such as metal
oxides, carbonate minerals, aluminosilicates, clay particles, and organic matter, and often
combinations thereof. Inevitably, these site-specific coatings will have an important
influence on the mobility of suspended particles as they flow through the media. Despite
the recognized complexity and variability of natural sands, there is a need to select bed
materials that would more easily allow a mechanistic interpretation of the factors
controlling FeS particle deposition. For this reason, a decision was made to use a well
characterized clean quartz sand as the bed media. The results of those laboratory scale
packed column tests are discussed in this Chapter.
5.2 Theory
The particle deposition rates in granular media depend on the rate of physical
contact with the media and the rate of successful attachment. Yao et al. (1971) developed
a clean bed filtration model based on earlier air filtration models of Friedlander (1958).

64
This classical filtration model was developed by considering particle deposition on a
single spherical filter media (a collector). This theory assumes no interaction of colloids
with previously deposited colloids such that the steady state deposition rates are given by:
Cd
fdLdC αη)1(
23 −
−= ( 5.1)
where C is the local concentration of suspended colloid, L is the bed depth, f is the bed
porosity, d is the filter media diameter. α is the attachment efficiency factor which
reflects the chemistry of the system shown as equation 4.7 – 4.9. η is the collection
efficiency of the media which is the ratio of the rate at which particles strike the collector
divided by the rate at which particles flux toward the media. According to Yao et al., the
collection efficiency, η, by diffusion can be estimated as:
3/2
0
9.0 ⎟⎟⎠
⎞⎜⎜⎝
⎛=
υμη
ddkT
pD ( 5.2)
2
23
⎟⎟⎠
⎞⎜⎜⎝
⎛=
dd p
Iη
( 5.3)
0
2
18)(
μυρρ
η ppG
gd−=
( 5.4)
where, Dη , Iη , and Gη represent single collector efficiency when the sole transport
mechanism is diffusion, interception, and inertia, respectively (see Figure 2.9). k is
Boltzmann’s constant, T is the absolute temperature, µ is viscosity of fluid, dp is the
particle diameter, d is the media diameter, and oυ is the pore velocity. The collection
efficiency can be estimated by the sum of the equation 5.2 to 5.4, GID ηηηη ++= .

65
For the FeS nanoparticles, Dηη = because the deposition rates solely depends on
diffusion for small particles less than 1 µm. FeS particles have diameters ranging from 2
to 10 nm, thus only diffusion controls their physical collection. When the FeS suspension
becomes more unstable, i.e., at low pH, high ionic strength and/or high particle
concentration, however, the particles aggregate appreciably, and the size distribution will
broaden to include much larger particles. Under such conditions the particle deposition
rates might be controlled by other mechanisms, i.e., interception and sedimentation.
Other researchers (Fitzpatrick and Spielman, 1973) showed that the filtration theory can
successfully describe in favorable particle deposition rates in model porous media, i.e.,
latex suspension and well glass beads.
The system at more complicated conditions, however, cannot be predicted by the
simple clean bed filtration model, i.e., unfavorable chemical conditions, and
heterogeneous and complex natural porous media (Grolimund et al., 1998; Kuhnen et al.,
2000; Tufenkji and Elimelech, 2004; Kulkarni et al., 2005). Mechanistic descriptions of
the deposition behavior under these conditions have not been elucidated. The deposition
rates may be affected by previously deposited particles. Heterogeneous surface properties
on colloids and distributed interaction energies between colloids and collectors may be
possible causes of this observation. Interactions between the injected particles and the
previously deposited particles may alter the deposition behavior. Heterogeneity of quartz
sand, even after cleaning, may cause non-uniform coverage of colloids. At high
aggregation rates of suspension, the injected particles can be deposited on the previously
deposited particles. The most common approaches to modeling this filtration behavior are

66
based on empirical macroscopic physical models (Iwasaki, 1937). Such models described
the rate of particle removal per unit depth of filter as proportional to the local
concentration of suspended solids;
SSSS C
LC
λ=∂∂
− ( 5.5)
where CSS is the concentration of suspended solids at any time and depth in the filter, L is
the depth of the filter, and λ is the filter coefficient, which varies with time and depth in
the filter.
In the porous media, the deposited (filtered) particles on the filter media are
related to the rate of particle removal from suspension. The mathematical mass balance of
migrating suspended solids is represented as follows (Weber Jr., W., 1972);
tC
tLC SS
ddSS
∂∂
Ω−+∂Ω∂
=∂∂
)(ευ ( 5.6)
where υ is superficial velocity, Ωd is volume of specific deposit per unit volume of filter,
and ε is porosity of the clean bed. A general relationship between the filter coefficient, λ,
and specific deposit, Ωd, has been developed by Ives (1969). It is based on the hypothesis
that the filter coefficient is a function of the changing specific filter surface available for
deposition and the increasing interstitial velocity. At the initial stage of a filter run, the
specific surface is represented by a porous bed of individual filter media. As the media is
coated with deposited particles, the specific surface and the filter coefficient increase. As
the deposit continues accumulating, however, the flow paths tend to straighten and the
specific surface is represented by an assembly of individual cylindrical capillaries. The

67
specific surface decreases as the capillaries become smaller, and the filter coefficient
decreases. The interstitial velocity increases as the deposits accumulates, and the filter
coefficient decreases.
5.3 Methods and Materials
5.3.1 Column Apparatus for FeS Deposition Tests
A 2.6 cm-diameter and 25 cm-long glass column was used in the FeS deposition
experiments. Clean quartz sand was packed with a dry packing method and the porosity
was 0.34±0.01. The dry packed column was pre-equilibrated by processing 10 pore
volumes of particle-free electrolyte solution which has the same composition as influent
FeS suspension expect FeS particles. Figure 5.1 shows the schematic diagram of the
column experiment. Influent suspensions of 1 g L-1 FeS were pumped into the quartz bed
in an upflow direction using an HPLC pump (Series I, Lab Alliance, State College, PA)
at 3 mL min-1. Ten pore volumes of the suspension were injected to the pre equilibrated
quartz packed column during the deposition experiment. Effluent fractions were collected
in 15mL polypropylene tubes using an automatic fraction collector. Since the column
length and influent suspension concentrations were the same in all of the deposition
experiments, the breakthrough and specific deposit concentration profiles of FeS in the
bed are intercomparable.

68
Figure 5.1 Schematic of column apparatus used in FeS deposition experiments
5.3.2 FeS Suspension
One gram of freeze-dried FeS was re-dispersed in 1 liter of deoxygenated
deionized water for each column experiment. The suspensions were mixed with a stirrer
for 48 hours in an anaerobic chamber before adding pH buffers and salt. The 1 g L-1 FeS
suspension without the addition of chemical has an alkaline pH of 10.3 and a
conductivity of 92 µS cm-1 which is equivalent to 0.71 mM of KCl. The mean size of the
FeS particles after dilution of the suspension was 2 – 4 nm. Borate (0.0125 M) and
MOPS (0.015 M) buffers were used to adjust the suspension over the range of pH 8.3 to
9.0, and pH 6.5 to 7.5, respectively. Sodium chloride (NaCl) was used to adjust the ionic
strength as necessary. Calculations of the concentration of NaCl needed to achieve the
desired ionic strength were performed with MINEQL+, in which the contributions of the
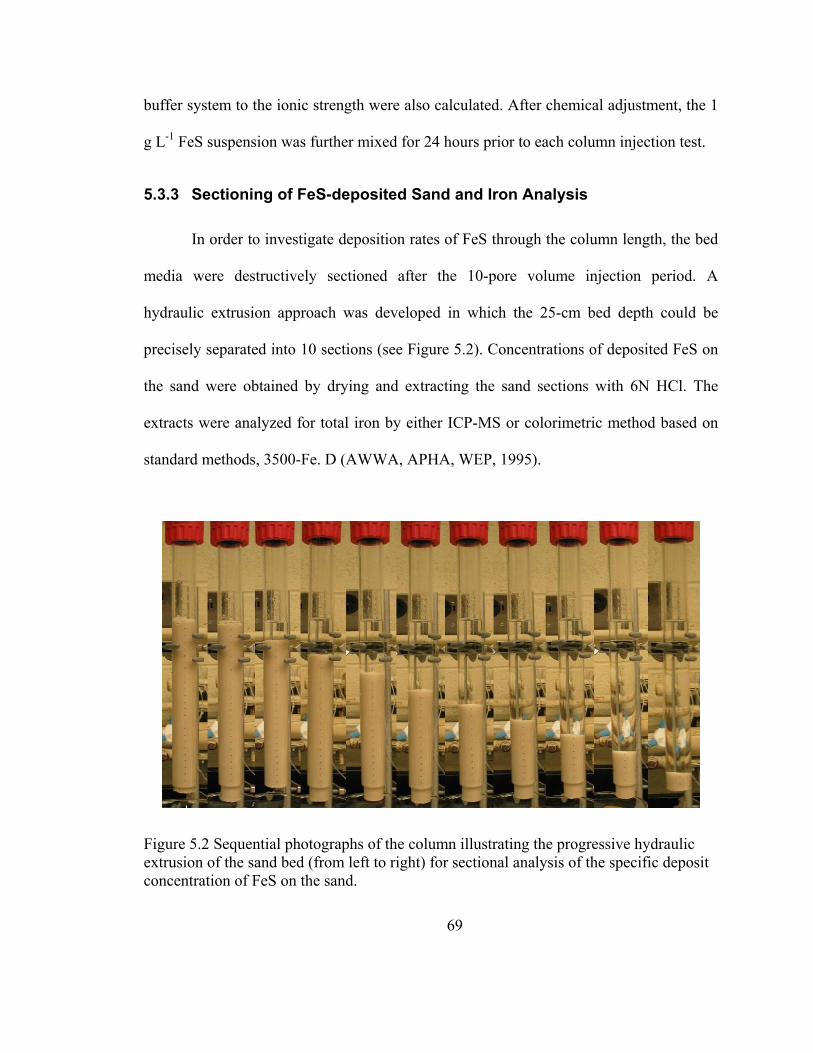
69
buffer system to the ionic strength were also calculated. After chemical adjustment, the 1
g L-1 FeS suspension was further mixed for 24 hours prior to each column injection test.
5.3.3 Sectioning of FeS-deposited Sand and Iron Analysis
In order to investigate deposition rates of FeS through the column length, the bed
media were destructively sectioned after the 10-pore volume injection period. A
hydraulic extrusion approach was developed in which the 25-cm bed depth could be
precisely separated into 10 sections (see Figure 5.2). Concentrations of deposited FeS on
the sand were obtained by drying and extracting the sand sections with 6N HCl. The
extracts were analyzed for total iron by either ICP-MS or colorimetric method based on
standard methods, 3500-Fe. D (AWWA, APHA, WEP, 1995).
Figure 5.2 Sequential photographs of the column illustrating the progressive hydraulic extrusion of the sand bed (from left to right) for sectional analysis of the specific deposit concentration of FeS on the sand.

70
5.4 Results and Discussion
5.4.1 Feasibility of Emplacement of FeS on Quartz Sand by Injection
To validate that chemical control of FeS particle filtration rates was possible,
deposition experiments were conducted at an alkaline pH and minimum ionic strength. In
these initial experiments, one gram of dried FeS was dispersed in a liter of deoxygenated,
deionized (DI) water. The resulting pure FeS suspension has a pH of 10.3. At this pH
condition, FeS particles are negatively charged and repulsive interaction forces between
the particles and the sand should be present since the quartz is also negatively charged at
this pH condition. The conductivity was 92 µS cm-1, which equivalent to the conductivity
of a 7.1 × 10⁻⁴ M KCl solution. In this initial experiment, the effluent or the deposited
FeS concentrations were not made quantitatively, rather the goal was to determine if the
expected rapid breakthrough of particles was visually observable. Sequential photographs
of the column were taken over the course of the injection. A total ten pore volumes of the
pure 1 g L-1 FeS suspension were introduced to a 25 cm-long model quartz sand column
at 3 mL min-1.
At this pH, and without salt addition, rapid breakthrough of FeS was observed
after one to two pore volumes. Photographs showing the progression of the FeS particle
‘front’ in the injection experiments are shown in Figure 5.3. Figure 5.3 shows a sequence
of the injection experiment of the pure FeS suspension. Columns 1 through 6 in this
Figure show a progression of the front during the first pore volume, which indicates rapid
breakthrough. The seventh column photo was taken immediately after 10 pore volumes

71
of the suspension were introduced. The entire length of the colujmn appeared dark after
10 pore volumes, due to the high concentration of FeS in the pore liquid. An additional 2
pore volumes of particle-free deoxygenated DI water was injected to subsequently wash
out the FeS suspension in the pore liquid in order to visualize the extent of particle
deposition. The sand was visibly but slightly discolored relative to the clean column (see
column photo (8) in Figure 5.3).
Figure 5.3 Visual breakthrough behavior of 1 g L-1 FeS suspension in columns containing clean quartz sand without pH adjustment (pH = 10.3) and no added salt. Columns (1)-(6): progression during 1st pore volume of FeS suspension injection; Column (7): after 10 pore volumes; Column (8): after injecting additional 2 pore volumes of particle-free DI water
(1) (2) (3) (4) (5) (6) (7) (8)

72
The nearly unretarded breakthrough and slight FeS coverage of the sand indicates
significant repulsive interactions must exist between the FeS colloids and the sand. If
repulsive interactions did not exist, most of injected FeS nanoparticles injected would be
deposited through the column, a claim which can be demonstrated by calculations using
the traditional clean bed filtration theory (Yao et al., 1971, equation 5.1). Assuming no
interaction of colloids with previously deposited colloids, the hypothetical steady state
effluent concentration can be calculated for the case when particle-grain interactions are
completely favorable and simply diffusion-limited, i.e., attachment efficiency, α, was
unity in Equation 4.7, and the collection efficiency parameter, η, is approximated by the
diffusion-limited collection rate, Dη , of Equation 5.2. This calculation, using the values
of parameters given in Table 5.1, yields a normalized effluent breakthrough concentration,
C/C0, of 1.3 × 10⁻²⁰. These calculations demonstrate that without repulsive interactions,
particle breakthrough concentrations would not be visually detectable. In the preliminary
experiment shown in Figure 5.3, however, breakthrough effluent concentrations were
visually similar to the influent particle concentration, suggesting that FeS nanoparticle
interactions with the sand were unfavorable at these solution conditions.
The pH 10.3 experiment in which FeS suspensions were injected resulted in rapid
breakthrough and significantly low FeS coverage on the sand. This result suggests that
significant electrostatic repulsive interactions exist between the sand and the colloids.
Since sand and FeS particle surface charge are a function of solution chemistry, i.e., pH
and ionic strength, more favorable interactions can be achieved by reducing the repulsive
forces with changes in solution chemistry. Self interactions between colloids, however,

73
Table 5.1 Variables used in sample calculation for deposition rates using clean bed filtration theory with negligible repulsive barrier
Variables Values
Porosity, f 0.34
Mean sand diameter, d (m) 2 × 10⁻⁴
Column depth, L (m) 0.25
Particle diameter, dp (m) 1 × 10⁻⁸
Temperature, T (K) 298
Water viscosity, µ (kg/m·s) 8.91 × 10⁻⁴
Velocity, v (m/s) 2.77 × 10⁻⁴
Boltzmann constant, k (m2·kg/s2·K) 1.38 × 10⁻²³
Collision efficiency, α 1
Contact efficiency, µ 3.70 ×10⁻²
must be significantly unfavorable to prevent aggregation and plugging in the inlet region.
The optimal conditions of FeS deposition rates on the sand can be achieved if the
interactions between the colloids and the sand are sufficiently favorable while the
interactions between the colloids themselves are sufficiently unfavorable. Subsequent
experiments were performed to quantitatively ascertain the optimal pH and ionic strength
and optimal deposition conditions.
5.4.2 Chemical Optimization of Deposition of Colloidal FeS
FeS deposition experiments were conducted at varying pH conditions from pH 6.5
to 10.3, and three ionic strengths, 0.025 M, 0.05 M, and 0.077 M of the 1 g L-1 particle

74
suspension. 0.0125 M Borate buffer solutions were used to buffer the pH 8.3 and 9.0
experiments. 0.036 M organic MOPS buffer was used to adjust pH of FeS suspension to
6.5 and 7.5. This MOPS concentration was the minimum concentration needed to buffer
the desired pH with a 1 gL-1 FeS suspension. Most of the column tests were duplicated.
The resulting profiles of deposited FeS concentrations after 10 pore volumes, as well as
effluent iron breakthrough concentrations were measured at three ionic strengths, and at a
series of pH conditions for each of those ionic strengths.
FeS deposition at 0.05 M ionic strength
As the visual FeS deposition experiment in Figure 5.3 demonstrated, very little
FeS retention was noted at the most unfavorable deposition conditions (pH 10.3, no salt).
In the presence of 0.05 M NaCl, however, an appreciable and relatively uniform FeS
deposition was observed over the entire length of the column as shown in Figure 5.4 (a),
with a mean FeS deposit concentration of 5.1 ×10⁻⁶ mol Fe g-1 sand (see Table 5.2). The
effluent breakthrough curve (see Figure 5.4 (b)) approached 80% of the influent
concentration of particles after 3 to 4 pore volumes, suggesting that there is an apparent
unfavorable deposition condition between the FeS nanoparticles and quartz sand as well
as repulsive interaction forces between the deposited and suspended FeS particles.
At an ionic strength of 0.05 M, the deposition and breakthrough of 1 g L-1 FeS
suspensions were further examined in duplicate at relatively alkaline pH 9.0 and 8.3. At
these alkaline and moderate ionic strength conditions, FeS deposition profiles exhibited
highly uneven distributions throughout the length of column. Furthermore, the profiles

75
Figure 5.4 Deposition experiments of 1 g L-1 FeS suspension at various pH, pH 8.3 to 10.3 at an ionic strength of 0.05M. (a) Deposited FeS concentration profiles after injection of 10 pore volumes of 1 g L-1 FeS, (b) Effluent breakthrough curves during the injection of FeS suspension

76
show an accumulation of particles near the inlet. This accumulation is likely due to
relatively favorable FeS particle-particle interactions at this ionic strength and pH. Figure
5.4b presents the corresponding breakthrough curves during particle injection. The
effluent iron concentrations reached a maximum at 40 and 50 % of the influent
suspension concentration at pH 8.3 and 9.0, respectively. The incomplete breakthrough
suggests that the amount of FeS deposition should continue to increase over longer
injection periods. The pH effect, therefore, was to increase FeS deposition rates as pH
decreases. These results are consistent with the stability study findings of FeS suspension
in Chapter 4, in which FeS particle stability was found to monotonically increase with pH
over the same pH range. Additional experiments were therefore conducted at a lower
ionic strength, 0.025 M, to investigate whether more uniform deposition through the
column is possible. In addition, near neutral pH (pH 6.5 and 7.5) conditions were
employed to see if greater deposition rates can be achieved due to more favorable
interactions between the particles and the sand.
FeS deposition at 0.025 M ionic strength
At a lower ionic strength of 0.025 M, it was possible to consider a wider range of
pH conditions (pH 6.5 to 10.3) since the FeS suspensions were then sufficiently stable at
the lower end of this pH range. The deposition profiles and effluent breakthrough
behavior of FeS suspensions in these column experiments are presented in Figure 5.5. In
Figure 5.5 (a) two groups of deposition profiles are evident; at neutral pH, pH 6.5 to 8.3,
deposition rates were similar, while they were significantly higher than those obtained

77
Figure 5.5 Deposition experiments of 1 g L-1 FeS suspension at various values of pH, pH 6.5 to 10.3 with ionic strength of 0.05M. (a) Deposited FeS concentration profiles after 10 pore volume injection of 1 g L-1 FeS, (b) Effluent breakthrough curves during injection of FeS suspension

78
under alkaline pH, 9.0 and 10.3. The sharper sensitivity of FeS deposition rates to pH
between pH 8.3 and 9.0 is similar to the pH range at which the stability of FeS
suspensions becomes increasing sensitive to pH as discussed in Section 4.4.1. The
deposition profiles are further evidence that the surface charge of FeS is insensitive to pH
in the neutral pH region and that there is a pronounced increase in surface ionization of
the FeS surface at a pH > 7.5.
The deposited FeS profile near the column inlet at pH 6.5 reveals slightly lower
coverage than the profile at pH 7.5, although it was expected to be higher based on the
stability studies. Given that the solubility of FeS is significantly higher at pH 6.5 relative
to pH 7.5 (Richard, 2006), these trends may be related to FeS dissolution. Since the
influent suspensions are saturated, however, the exact role of dissolution is unclear.
Dissolution may, for example, change the particle size distribution of the influent
suspension and thereby affect the rates of deposition near the inlet. It should be noted that
the net effect of lower particle coverage near the inlet would be a decreased risk of
plugging. In a field application, these injection conditions could therefore be
advantageous.
The breakthrough curves (Figure 5.5 b) also indicate that FeS particles at alkaline
pH were less favorably attached to the quartz grain surface. The effluent concentrations
(C) at alkaline pH, 9.0 and 10.3, more rapidly approached the influent concentration (C0)
after the injection of two pore volumes of the FeS suspension while the effluent
concentrations at neutral pH, 6.5 to 8.3, approached the initial concentration (C0) after the
injection of three pore volumes. Since the breakthrough concentration approached the

79
influent concentration, further significant FeS deposition would not be expected if the
injection period was increased.
FeS deposition at 0.077 M ionic strength
Additional deposition tests at higher ionic strength were performed to establish
conditions leading to plugging in the injection region of column. Because of the
insensitivity of FeS deposition to pH over the neutral pH range, only on pH condition was
considered, pH 8.2. Ten pore volumes of 1g L-1 FeS suspension, adjusted to pH 8.2 using
0.0125M borate buffer and achieved by the total ionic strength of 0.077 M based on
MINEQL+ analysis with an addition of 0.05M NaCl, was injected through the column at
3 mL min-1.
Figure 5.6(a) shows a high deposition rates at the injection point as high as 8 ×
10-5 mole Fe per gram sand, and a considerably less uniform Fe deposition profile than
those at lower ionic strengths. Figure 5.6(b) indicates the breakthrough curve reached a
plateau after 2 pore volumes were injected, followed by a decrease in effluent FeS
concentration until 6 pore volumes were introduced, followed by no penetration of FeS
particles after the injection of 7 pore volumes. This breakthrough curve and deposition
profile suggest that favorable or near favorable deposition conditions exist between FeS
and the previously deposited FeS particles, since almost all of the particles were retained
in the column after 7 pore volumes were injected. By the seventh pore volume, deposited
particles were sufficiently numerous as to retain all of the approaching particles. At this
ionic strength of 0.077 M and pH 8.2, significant plugging was also observed at the
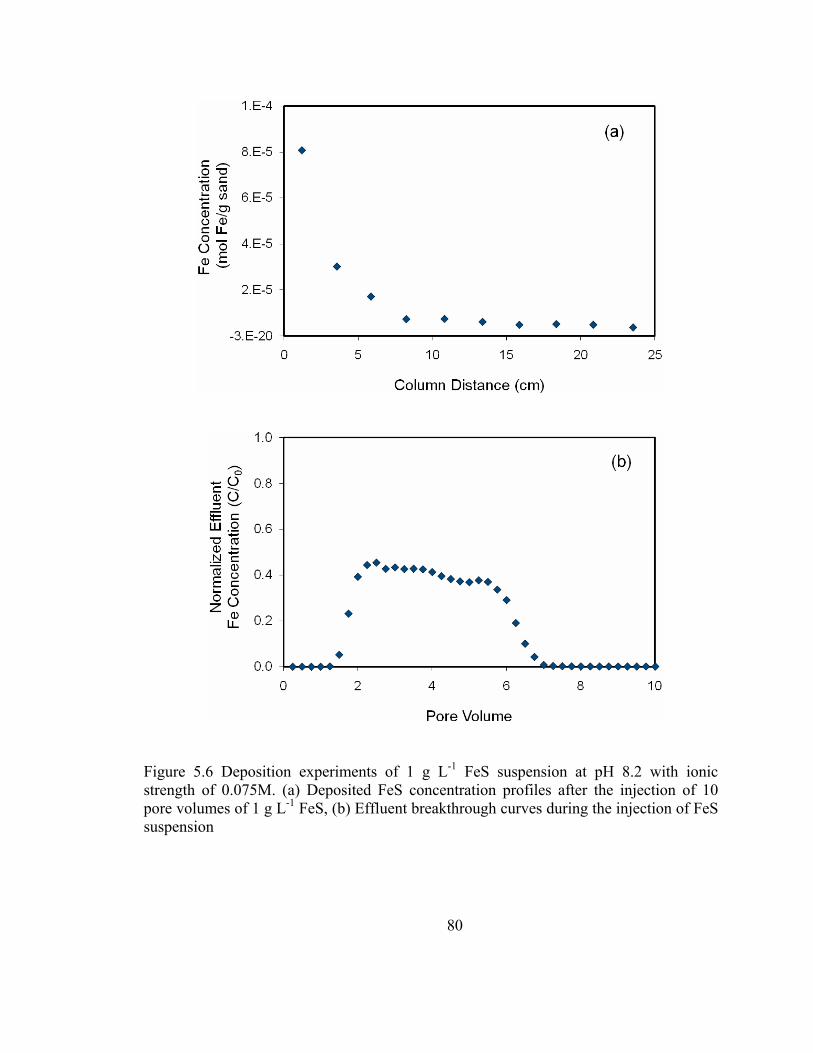
80
Figure 5.6 Deposition experiments of 1 g L-1 FeS suspension at pH 8.2 with ionic strength of 0.075M. (a) Deposited FeS concentration profiles after the injection of 10 pore volumes of 1 g L-1 FeS, (b) Effluent breakthrough curves during the injection of FeS suspension
81
injection region of the column due to the sufficiently favorable interactions between the
particles and the previously deposited particles. An increase in back pressure was noted
during the experiment.
5.5 Chemical Optimization Conclusions for FeS Deposition
Based on sectional measurements of deposited FeS in each of the column
experiments, the average coverage and variance of the deposited FeS after 10 pore
volumes was calculated to assess the optimal solution conditions for uniformity and
maximum coverage. A summary of these calculations is presented in Table 5.2. As the
normalized standard deviations for the data indicate, the greatest uniformity of coverage
was obtained at the lowest ionic strength, 0.025 M and greater spatial differences in
coverage were observed with increasing ionic strength. Neutral pH conditions lead to the
greatest FeS particle deposition rates, an average of 3 × 10⁻⁶ mole iron per gram of sand,
and therefore would represent optimal injection conditions. Experiments conducted at
these optimal deposition conditions are shown in boldface type in Table 5.2. Due to the
high solubility of FeS at pH < 6.5, more acidic conditions than the pH range suggested
here would be problematic.
Both the stability and deposition rates of FeS suspensions in sand columns were
relatively independent of pH over a range that is typical of many natural aquifer pH
conditions (pH 6.5 - 8.3). This finding is likely to be helpful in terms of implementing
injections of FeS suspensions at a field site, since it suggests that pH adjustment of the
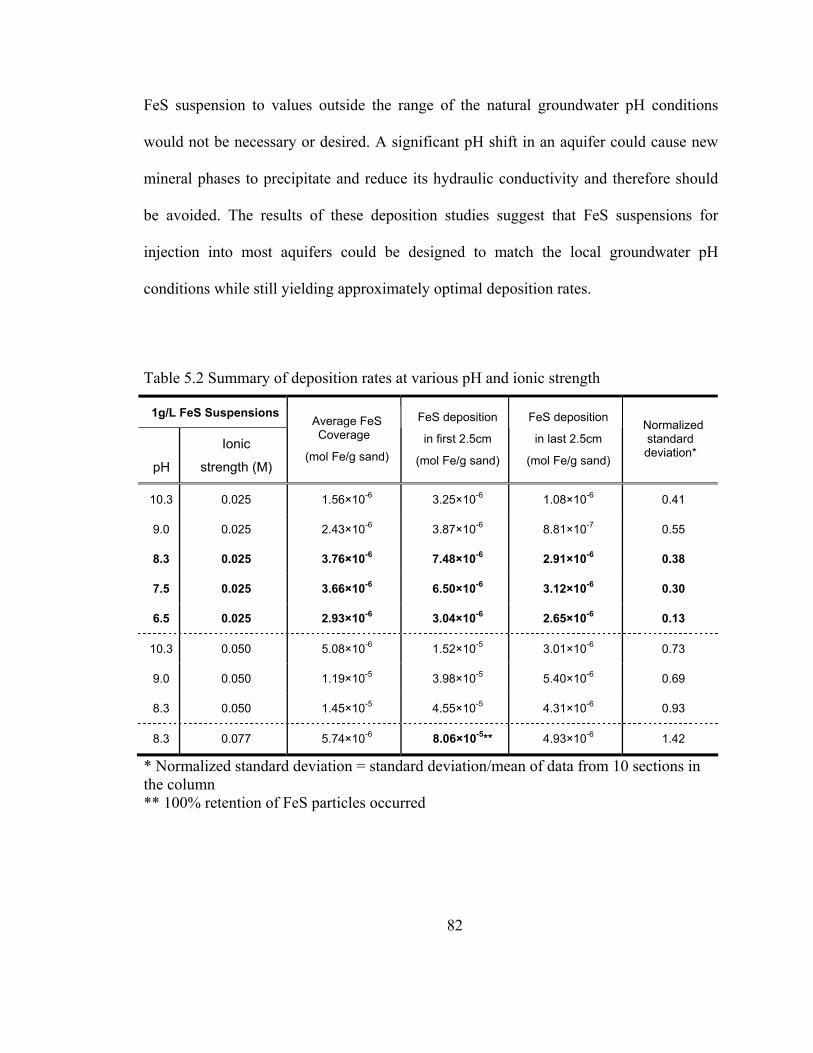
82
FeS suspension to values outside the range of the natural groundwater pH conditions
would not be necessary or desired. A significant pH shift in an aquifer could cause new
mineral phases to precipitate and reduce its hydraulic conductivity and therefore should
be avoided. The results of these deposition studies suggest that FeS suspensions for
injection into most aquifers could be designed to match the local groundwater pH
conditions while still yielding approximately optimal deposition rates.
Table 5.2 Summary of deposition rates at various pH and ionic strength
1g/L FeS Suspensions
pH
Ionic
strength (M)
Average FeS Coverage
(mol Fe/g sand)
FeS deposition
in first 2.5cm
(mol Fe/g sand)
FeS deposition
in last 2.5cm
(mol Fe/g sand)
Normalized standard deviation*
10.3 0.025 1.56×10⁻⁶ 3.25×10⁻⁶ 1.08×10⁻⁶ 0.41
9.0 0.025 2.43×10⁻⁶ 3.87×10⁻⁶ 8.81×10⁻⁷ 0.55
8.3 0.025 3.76×10⁻⁶ 7.48×10⁻⁶ 2.91×10⁻⁶ 0.38
7.5 0.025 3.66×10⁻⁶ 6.50×10⁻⁶ 3.12×10⁻⁶ 0.30
6.5 0.025 2.93×10⁻⁶ 3.04×10⁻⁶ 2.65×10⁻⁶ 0.13
10.3 0.050 5.08×10⁻⁶ 1.52×10⁻⁵ 3.01×10⁻⁶ 0.73
9.0 0.050 1.19×10⁻⁵ 3.98×10⁻⁵ 5.40×10⁻⁶ 0.69
8.3 0.050 1.45×10⁻⁵ 4.55×10⁻⁵ 4.31×10⁻⁶ 0.93
8.3 0.077 5.74×10⁻⁶ 8.06×10⁻⁵** 4.93×10⁻⁶ 1.42
* Normalized standard deviation = standard deviation/mean of data from 10 sections in the column ** 100% retention of FeS particles occurred

83
Chapter 6
Release of Deposited FeS
6.1 Introduction
An important factor that could limit the useful design life of PRBs that contain
nanoparticulate FeS as the reactive media is gradual loss mechanisms of the FeS. The
cost-effectiveness of the technology would be significantly reduced if frequent
reinstallation or rejuvenation of the reactive material was required in order to replace lost
FeS. These considerations would be the case whether the PRB was constructed by in situ
emplacement of injected particles or trench-and-fill approaches. In addition,
remobilization of the reactive materials could seriously degrade the treatment
performance of the PRB if sequestered contaminants are also remobilized. An
understanding of the release mechanisms of nanoparticulate iron sulfide coatings in
porous media will be critical, therefore, to FeS-type PRB applications. Two important
FeS release mechanisms include particle detachment and FeS dissolution. Since it was
hypothesized that hydrogeochemical solution conditions would control the rates and
relative importance of these two release mechanisms, the experiments described in this
Chapter were designed to study FeS release as a function of solution chemistry.

84
The rate of particle detachment from the surface of a granular packed bed is
governed in part by the interaction forces between the particles and the subsurface grain,
which are a function of pH and solution ionic strength of the suspension. The detachment
rate is reported to increase as the pH increases when both of the particles and the
subsurface grain are negatively charged, such as in the case of iron sulfides and quartz in
neutral to alkaline pH conditions, since the interacting surfaces become even more
negatively charged as the pH increases (Ryan and Elimelech, 1996; Sen and Khilar,
2006). In response to variations in ionic strength, particle detachment rates can generally
be expected to decrease as the ionic strength increases due to a decrease in repulsive
interaction forces between the colloid and grain surfaces (Kallay, 1986; Ryan and
Gschwend, 1994; Roy and Dzomback, 1996).
Iron sulfide dissolution may be another significant loss mechanism, especially at
acidic pH conditions. Literature values of the solubility of mackinawite suggest it is a
relatively soluble metal sulfide at acidic pH, although the equilibrium constants are not in
close agreement (see Table 2.1). In this research the mechanisms of FeS loss were
investigated, by distinguishing iron loss due to dissolution from loss by particle
detachment as a function of pH and ionic strength. In conjunction with the experimental
results, mathematical modeling was proposed to characterize the dissolution kinetics
where dissolution is shown to be a significant mechanism of FeS particle release. A
mathematical model was employed to simulate the transport and dissolution of iron and
assess whether FeS dissolution is limited by mass transfer. In order to test the mass
transfer limitation, effects of flow rate variations were also tested. The results of these

85
experiments and modeling further helped to characterize the solubility of FeS. A pH
range of 5.5 to 10 and an ionic strength range of 0.001 to 0.1 M were considered in order
to bracket the range of natural groundwater conditions.
6.2 Methods and Materials
The method of FeS application to sand, say by in situ injection or by precoating
the sand for trench-and-fill use, is likely to effect the loss rate of FeS from the sand. Iron
release experiments from coatings obtained by particle filtration and batch application on
sand were compared in this study, although due to the difficulty in analyzing the former
systems, more extensive studies were conducted with batch-coated FeS sand columns.
The primary complexity introduced with coatings generated by particle deposition was an
inability to characterize the spatially non-uniform FeS content of the sand as an initial
starting condition of FeS release experiments.
6.2.1 FeS Release Tests using Deposited FeS Sand
Release of FeS was initially studied in sand columns where the FeS coating was
deposited from flow-through suspensions. This column experiment was conducted
outside a glovebox using the same systems described in Section 5.3.1. The FeS-coated
sand was prepared by injecting suspension into a clean sand column under one of the
same conditions in which deposition had previously been studied. This condition
corresponded to a pH 8.3, 0.025 M ionic strength solution, which yields a relatively
uniform deposition profile in earlier experiments, as shown in Figure 5.5. Based on the

86
previous estimates of the average FeS coverage for these conditions in Table 5.2,
approximately 3.76 × 10⁻⁶ mol FeS per gram of sand would be expected by these FeS
injection procedures.
Using the same starting column, FeS release was studied by sequentially reducing
the pH of the particle-free influent solution (in 11 pore volume increments), while
maintaining the ionic strength at 0.025 M. In the first stage, pH 8.3 particle-free
electrolyte solution was injected in the FeS-coated sand column for eleven pore volumes,
followed by an additional eleven pore volumes of pH 7.5 electrolyte solution, and finally
pH 6.5 electrolyte was injected over another eleven pore volumes.
6.2.2 FeS Release Tests using FeS Pre-coated Sand
The FeS pre-coated sand was prepared according to a method developed by Han
(2009) that included mixing of 50 grams clean quartz sand (Chapter 3.4) and 30 mL of
3.70 ± 0.05 g L-1 of well-dispersed FeS suspension in 50 mL polypropylene air tight
centrifuge tubes. The mixture of sand and FeS was acidified by adding 3.8 mL of 1 N
hydrochloric acid. The tubes were mounted on tube rotators and mixed for 48 hours. The
pH of the slurry at the end of mixing was about 5.2. It was then filtered using 45 µm
filters to remove excessive water, and the bottom portion of filtered sand on the filter
membrane was discarded to avoid the incorporation of FeS particles remained in
suspension. The wet FeS coated sand was spread on a plastic plate and air-dried in the
glovebox for 72 hours. The completely dried FeS-coated sand was stored in airtight

87
bottles until used. An average coating of 2.02 ± 0.056 mg FeS per gram of sand was
obtained by this procedure.
The release tests were carried out in an anoxic glovebox to avoid the oxidation of
the effluent samples before separation of the particulate FeS from dissolved iron. The FeS
pre-coated sand was packed into a 16 mm-diameter and 100 mm-long glass column for
these experiments. The FeS pre-coated sand was dry-packed and the resulting porosity
was 0.32±0.01. The dried packed column was saturated by processing 25 pore volumes
of an electrolyte solution through the column at 2.95 ± 0.05 mL min-1 prior to the release
tests. The conditioning electrolyte was a pH 9 solution containing only 3.5 mM total
borate buffer. The ionic strength was 5 mM, due only to the buffer, based on a
MINEQL+ calculation. Iron concentrations in the effluent over the course of conditioning
were less than detection limit, ~50 µg L-1 as Fe.
After the column conditioning period, deoxygenated particle-free electrolytes of
the desired ionic strength were introduced and total and dissolved iron concentration in
the effluent were monitored. These solutions were pumped into the packed bed using a
peristaltic pump (Masterflex, Vernon Hills, IL) at a nominal flow rate of 2.9 ± 0.05 mL
min-1. To examine the effect of flow rate, an additional experiment were conducted at a
slower flow rate of 0.3 mL min-1. Effluent samples were collected in 15 mL
polypropylene tube using an automatic fraction collector (Frac-100, Amersham
Biosciences, Uppsala, Sweden). Effluent sample fractions contained 1 to 2 pore volumes.
The electrolyte solutions were buffered with 0.01 M borate buffer for pH 9.0 and 10.0,

88
0.01 M MOPS buffer for pH 6.5 and 7.5, and 0.01 M acetate buffer for pH 5.5 electrolyte
conditions. Effluent samples were filtered using 0.02 µm syringe filters (Whatman,
Florham, NJ) to separate dissolved iron from particulate FeS particles. The filtration step
was performed immediately upon collection of a fraction to minimize the loss of
suspended particulate FeS by further dissolution prior to separation.
6.3 Results and Discussion
6.3.1 FeS Release Tests with FeS-coated Sand by deposition
At initial stage of FeS release studies, FeS coating sand was obtained from
deposition of FeS particles by flow the FeS suspensions through clean quartz sand
columns which is the same method employed in FeS deposition studies in Chapter 5.
Initially, a total of 34.4 mg of iron was deposited through the sand column based on
previously determined values from deposition tests. Based on the mass of iron released in
each stage of the elution experiment, 31.2 mg of iron remained in the column after the
completion of the release test, as shown in Table 6.1. The retained iron mass represents
about 90% of the initially deposited iron. Since a relative small fraction of the total iron
was eluted over each of the 11 pore volume injection periods, the iron loss in any one
period was unlikely to have affected subsequent elutions.
Figure 6.1 presents the iron release profiles over the total injection of 33 pore
volumes, showing the three different pH stages of the elution test. Comparing the profiles

89
Table 6.1 Iron elution using columns of FeS-coated sand obtained by prior filtration in flow-through columns
* Initial FeS mass was assumed to be same as previously determined value from deposition test at pH 8.3, 0.025 M ionic strength conditions.
** Percentage refers to the mass of released or retained iron divided by initial iron mass times 100
Figure 6.1 Fe release profiles; 1g L-1 FeS particles injected at pH 8.3 and ionic strength of 0.025 M. After the injection completed, 11 pore volumes of electrolyte of pH 8.3 solution was injected to release the deposited FeS particles following by 11 pore volumes of each pH 7.5 and 6.5 electrolyte in sequence.
Fe released
Initial condition*
(Fe deposited) pH 8.2 pH 7.5 pH 6.5 Fe remained
Fe mass 34.35 mg 0.84 mg 0.64 mg 1.69 mg 31.17 mg
Percentage** 2.4% 1.9% 4.9% 90.7%

90
at pH 8.3 and 7.5, the steady-state iron concentrations appear to decrease as pH is
decreased from pH 8.3 to ph 7.5. This decrease in eluted iron as pH decreases might be
due to the increased electrostatic repulsion between the particles and the sand grains as
other researchers have observed (Khilar and Fogler, 1998; Grolimund and Borkovec,
1999). When the pH is decreased further to pH 6.5, however, higher total steady-state
iron concentrations were measured in the effluent. It was initially hypothesized that the
increased release of iron at low pH was due to FeS dissolution. Since only total iron
concentrations were measured in the effluent samples, it was not possible to distinguish
the forms of iron that were released. In view of the need to conduct the experiments in an
anaerobic chamber to preserve effluent samples for further processing that enable
measurements of both particulate and dissolved iron concentrations, subsequent release
experiments were conducted in shorter columns (sized to fit in an anaerobic chamber).
Based on literature values of the solubility constants of mackinawite (see Table
2.1), the calculated (using MINEQL+) range of expected total dissolved iron
concentrations at pH 6.5 (0.78 – 5.2 mg L-1 as Fe) were much higher than its solubility at
pH 7.5 (0.21 – 0.75 mg L-1 as Fe). These calculations support the hypothesis that
dissolution of FeS can be appreciable at pH 6.5.
6.3.2 FeS Release Tests with FeS Pre-coated Sand
The two different mechanisms of iron release, particle detachment and
dissolution, were further examined using FeS pre-coated sand in packed columns. A
smaller column (16mm in dia. × 100mm in length) than that used in deposition tests was

91
used to perform the tests in anoxic glove box for successful separation of dissolved iron
from particulate in the effluent.
Release of dissolved iron
Dissolved iron concentrations in the effluent were measured as a function of pH
over the range of pH 5.5 to 10.0 and a Darcy velocity of 0.024 cm sec-1. Above pH 9, iron
release was not observed, and the measured total iron concentrations were below the
detection limit, ~50 µg L-1 as Fe. At neutral to acidic pH conditions, the dissolved iron
concentrations tended to increase as the influent pH decreased, as shown in Figure 6.2.
This result is consistent with the literature with respect to the increase in solubility of FeS
below around pH 6.5 (Gallegos, 2007; Richard, 2006).
Unlike the elution experiments in Figure 6.1, steady-state effluent breakthrough
iron concentrations were not achieved even after processing 60 pore volumes in the pre-
FeS coated sand experiments. This slow approach to steady state might be explained by
phase changes that occur over the course of the injection of electrolyte solution.
Mackinawite oxidizes to other iron sulfur minerals, such as greigite or green rust, under
more oxidizing conditions (Schoonen and Barnes, 1991; Wilkin and Barnes, 1996;
Benning et al., 2000). At the initial conditions of the test, the oxidation state of pore water
in the FeS coated-sand column is likely to be more reduced than the particle free
electrolyte influent solutions even though these solutions were deoxygenated, since the
pore water pe in the column prior to the elution experiment was controlled by the FeS
coating. As electrolyte solution is injected, a higher pore water pe, especially near the

92
Figure 6.2 Effluent dissolved iron concentrations as a function of pH at constant ionic strength of 0.01 M and Darcy velocity of 0.024 cm sec-1. Effluents were filtered using a 0.01 µm filters to remove particulate iron.

93
influent end of the column, could cause oxidation of the FeS. The effluent dissolved iron
concentration at pH 5.5 at near steady-state, 4.4 mg L-1, was slightly lower than that
calculated by MINEQL+ using the lowest mackinawite solubility constant in the
literature, 6.4 mg L-1 as Fe. A lower iron solubility would be expected if mackinawite
became extensively oxidized. Griegite and other iron sulfides mineral have lower
solubilities than mackinawite (Berner, 1967; Benning et al., 2000; Rickard and Morse,
2005).
Release of particulate iron
In addition to the dissolved iron concentration measurements in the experiment
described above, effluent samples were also analyzed for their total iron content. The
differences between total and dissolved iron concentrations were then calculated to
estimate the particulate iron content of the samples. Effluent particulate FeS
concentrations are plotted versus pore volume of electrolyte injected in Figure 6.3. Over
the range of pH tested, particulate release was a maximum at pH 6.5. The release rate at
pH 7.5 was smaller than that at pH 6.5. The effluent particulate iron concentrations, like
the eluted dissolved iron concentration, were slow to achieve steady values. Although it
was expected that electrostatic forces might control particulate release rates, the release
of particulate FeS due to the repulsive interaction forces does not appear to explain the
enhanced release of FeS at acidic pH conditions. At even more alkaline pH, pH 9 and 10,
the total iron concentrations, both of particulate and dissolved iron, were below the
detection limit of 50 µg L-1. The complex pH dependence of particulate iron release may
be the result of dissolution-driven, not repulsive, detachment. If the FeS coating, as a

94
Figure 6.3 Particulate iron release as a function of pH at a constant ironic strength of 0.01 M. Particulate concentration was calculated by subtracting dissolved iron (filtered) from total iron concentration in the effluent. Small embedded picture shows expanded y-axis scale.

95
result of the batch coating process, exhibited a fine structure in which particulate
fragments of the coating could be shed as portions dissolve, acidic conditions could
promote particle release. At sufficiently acidic pH, the particles released by this
dissolution-driven mechanism may themselves dissolve before exiting the column. Such
a mechanism could explain why maximum rates of FeS particle release were observed at
pH 6.5. Although detachment of FeS particles by repulsive interaction forces does not
appear to significantly explain particle release in the batch-coated sand columns, it may
be more important when FeS is applied by deposition in a flow-through packed bed.
Unlike the batch-coated sand, the rates of detachment of FeS applied by deposition
appeared to increase as pH was increased above pH 7.5. The drying step in the batch-
coating process of the sand may cause particles on the sand surface to aggregate as the
solvent evaporates, rendering them less able to detach.
Effect of ionic strength
Using batch-coated FeS sand, iron release was also examined at a higher ionic
strength of 0.1 M over the pH range of 5.5 to 10.0. Over the entire range of pH conditions
tested, no particulate iron was observed. Figure 6.4 compares the effluent iron
concentrations at the two different ionic strengths, 0.01 and 0.1 M, at pH 5.5. The filled
markers are total iron concentrations, and the unfilled symbols are dissolved iron
concentrations. At higher salt concentrations the dissolved iron concentrations were
similar to the total iron concentrations. Although particulate release was evident at low

96
ionic strength, it is likely that any particles generated by the hypothesized dissolution-
driven process would be re-deposited readily at the higher ionic strength of 0.1 M.
Figure 6.4 Ionic strength effect on FeS release at acidic pH. Filled markers are total iron concentrations, and unfilled symbols are dissolved iron concentrations. At high ionic strength, I = 0.1 M, no particulate iron was observed in effluent.
Effect of flow rates
When the flow rate of the eluent was reduced by an approximate order of
magnitude, 2.9 mL min-1 to 0.3 mL min-1, the total rate of FeS release increased and the
steady-state effluent concentration of dissolved iron was achieved earlier at slow flow
rates as shown in Figure 6.5. Calculations based on a simple mathematical transport
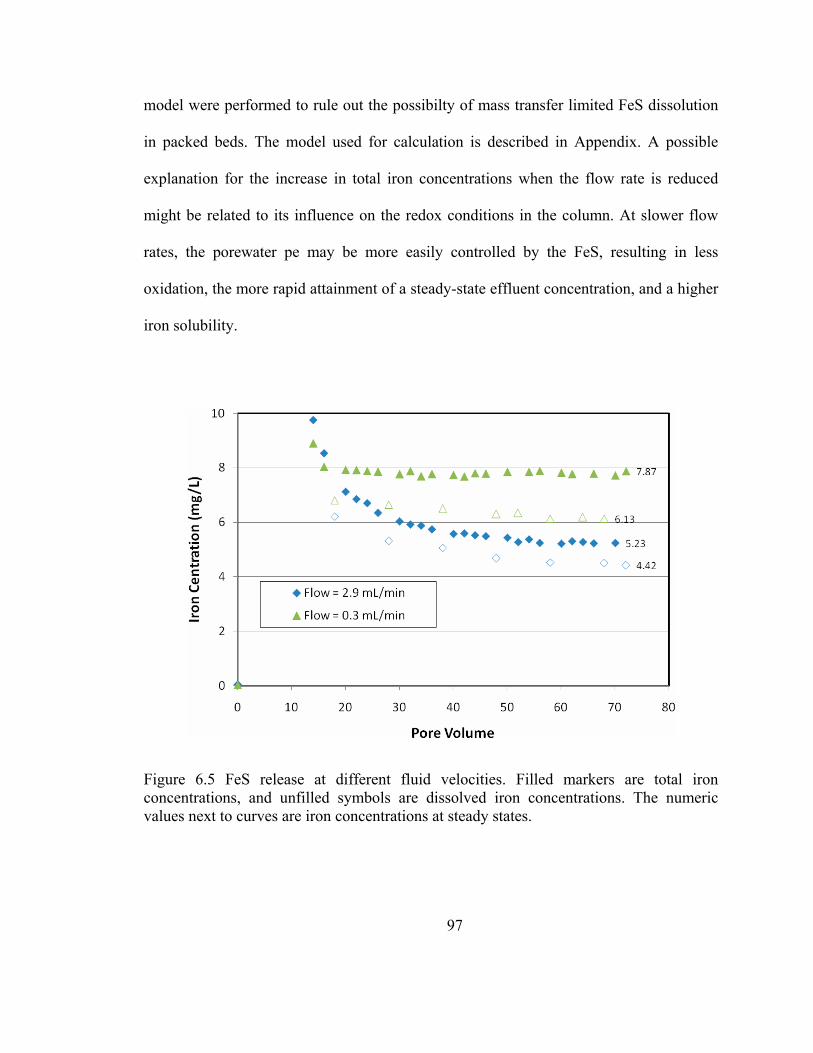
97
model were performed to rule out the possibilty of mass transfer limited FeS dissolution
in packed beds. The model used for calculation is described in Appendix. A possible
explanation for the increase in total iron concentrations when the flow rate is reduced
might be related to its influence on the redox conditions in the column. At slower flow
rates, the porewater pe may be more easily controlled by the FeS, resulting in less
oxidation, the more rapid attainment of a steady-state effluent concentration, and a higher
iron solubility.
Figure 6.5 FeS release at different fluid velocities. Filled markers are total iron concentrations, and unfilled symbols are dissolved iron concentrations. The numeric values next to curves are iron concentrations at steady states.

98
6.4 Conclusions
The loss of iron sulfide coatings from quartz sand can occur by multiple
mechanisms; particle detachment by repulsive forces between particles and particle and
media surface, and mineral dissolution. Dissolution appeared to be the dominant
mechanism of FeS loss under acidic pH conditions. The dissolution rate of FeS from
coated sands column increased as pH decreased, a trend that is consistent with reported
studies of FeS solubility (Davison et al, 1999; Benning et al, 2000; Richards, 2006). The
dissolution rate, however, does not reach steady state even after injecting more than 60
pore volumes, nor does the observed iron solubility in the effluent match the solubility
reported in the literature. It was hypothesized that the slow approach to steady-state was
an indication of slow oxidation of FeS in the column. The oxidation rate, however, is
reduced when the flow rate is slowed. The FeS-type PRBs may undergo relatively fast
corrosion under the faster flow rate. The dissolution rates under acidic pH conditions are
relatively significant. A simple calculation of FeS loss by dissolution was performed in
the case of a hypothetical FeS-type PRB; the calculation was based on the following
assumptions: a coating containing 2 mg FeS coated per gram sand, a Darcy velocity of
1×10⁻³ cm sec, and an FeS barrier thickness of 5 meters. The loss of iron sulfide per year
will be 2.4, 5.2, and 11.9% at pH 7.5, 6.5, and 5.5, respectively. The higher rates of
dissolution at pH < 6, may preclude their use in acidic aquifers.
99
Particulate FeS was released at low ionic strengths at neutral to acidic pH
conditions when the sand was batch-coated with the FeS. Particle detachment by
repulsive interaction forces did not appear to be an important mechanism of FeS loss,
however, for the FeS batch-coated sand. Repulsive interaction forces may, however,
more significantly contribute to iron loss if the deposited FeS were applied by injection.
In batch-coated sand, the release of FeS particles was hypothesized to be due to the
release of coating fragments as the coating dissolves.

100
Chapter 7
Conclusions and Recommendations
7.1 Conclusions
The feasibility of in situ emplacement of nanoparticulate iron monosulfide (FeS,
mackinawite) by direct injection techniques was investigated. The deposition rates of the
nanoparticles in porous media largely depend on the surface chemistry of the interacting
colloids and filter media, which can be modulated by solution chemistry. To understand
the surface characteristics of mackinawite, the stability of FeS suspensions was
investigated by monitoring the initial aggregation kinetics. This study of the self
interaction dynamics of FeS particles in suspension provided both a direct determination
of the solution conditions that favor their stability with respect to aggregation and an
indirect evaluation of their surface charge characteristics as a function of solution
chemistry.
The iron sulfide particles used herein are negatively charged over the pH range
studied, pH 6.5 to 9.0. The sensitivity of FeS suspension aggregation rates to pH varied
over the pH range tested. Between pH 6.5 and 8.3, the FeS stability gently increased as
pH increased, suggesting that the surface of FeS is negatively charged and becomes

101
slightly more negative with an increase of pH. The stability ratios were relatively low:
120 and 270 at pH 6.5 and 8.3, respectively. These low stability ratios indicate that the
surface of FeS is relatively weakly charged. This finding is in agreement with the
behavior of other metal sulfide minerals which are weakly negatively charged above their
pHPZC, pH 0.6 – 3.3 and whose surface potential gradually increases in the neutral pH
region (Bebie et al., 1998). At more alkaline pH conditions, the stability was much more
sensitive to pH. The stability sharply increased between pH 8.3 and 9.0. This behavior
might be explained by the extensive deprotonation of surface functional groups at this
pH, although the surface functional groups of FeS are not well characterized. The
monotonic increase of the stability indicated that the pHPZC must be below pH 6.5. Some
limitations exist in the measurement of the aggregation rates at acidic pH conditions,
pH<6.5, due to the increased solubility of FeS. At alkaline pH conditions, pH>9, the
aggregation rates are quite slow, requiring measurement times in excess of a week. Over
such a long measurement time, FeS might undergo other reactions, such as oxidation.
These limitations hindered the estimation of FeS aggregation rates at more alkaline or
more acidic pH conditions.
The stability of FeS suspensions was much more sensitive to the ionic strength of
the suspension. The stability ratio, W, sharply decreased from 33,800 to 5.5 as the ionic
strength increased from 0.025 to 0.1 M at pH 8.3. To obtain sufficient penetration of FeS
particles in a sandy porous media and prevent clogging the injection zone, the particles
must be stable themselves. This criterion requires that the stability ratio be greater than a
few hundred. FeS deposition tests, therefore, were tested in the range of ionic strength 25
102
to 50 mM. MOPS buffer used in this research. The MOPS buffer system exerted a
significant effect on the stability of FeS particles at concentration above 0.02 M, This
result, however applies to experiments with relatively dilute concentrations of FeS
particles, about 13 mg L-1; the adsorption effects of MOPS is probably negligible in
deposition studies where the FeS particle concentration was almost a hundred-fold
higher, i.e., approximately 1000 mg L-1. Careful selection of the MOPS concentration,
therefore, is required to minimize specific adsorption effects.
The feasibility of in situ emplacement of FeS nanoparticles in porous media was
evaluated using a model packed bed column of clean quartz sand. The influent
suspension of 1 g L-1 FeS particles was quite stable in the absence of any added reagents
due to its high pH of 10.3 and low conductivity of 92 µS cm-1 which is equivalent to 0.71
mM of KCl. At this high pH and low ionic strength, the deposition rate was also
relatively slow due to the significant repulsive forces between the FeS particle and quartz
media, as well as between FeS particles. The deposition rates are probably increased as
pH decreased over the pH range studied, 6.5 < pH < 10.3. The observed variations in
sensitivity of FeS deposition rates to pH was consistent with pH dependence of FeS
particle aggregation rates. Both deposition and aggregation rates were insensitive to pH
over the pH region of neutral to relatively alkaline pH, and more pH-sensitive at alkaline
pH, between pH 8.3 to 10.3. The FeS coverage on the sand was greater by more than
two-fold in the neutral pH region, below pH 8.3, than that at pH 10.3 at an ionic strength
of 0.025 M. The coverage of deposited FeS particles on quartz sand increased only
slightly as the pH decreased from 8.3 to 7.5. However, the average coverage slightly

103
decreased as the pH further decreased to pH 6.5. This might be due in a complex manner
to the increased dissolution of FeS at this pH, perhaps by changing the particle size
distribution.
The deposition rates are particularly sensitive to the ionic strength of the FeS
suspension. At an ionic strength of 0.05 M, the deposition profiles along the length of the
column were relatively less uniform than the profiles obtained at 0.025 M. The non-
uniformity also increased as pH decreased. Since FeS coverage on the quartz column was
relatively uniform at an ionic strength of 0.025 M over the entire pH range tested, pH 6.5
to 10.3, deposition at this ionic strength is considered the optimal solution condition for
in situ deposition. The pH dependence of FeS deposition rates on natural sands is likely
to vary based on the type of mineral coatings on the sand. These variations would have to
be characterized on a site-specific basis. The optimal design pH range for injection,
therefore, could be more restrictive than the range found in this study, depending on these
natural variations.
Two different mechanisms can contribute to the gradual loss of FeS particles over
the long operation of a PRB, particle detachment and dissolution. These FeS loss
mechanisms were investigated as a function of solution chemistry and flow rate. The loss
of FeS particles by detachment due to repulsive forces was not significant on FeS pre-
coated sand. No particulate iron was detected in the effluent when multiple pore volumes
of an alkaline, particle-free electrolyte solution were introduced. Iron sulfide particle
detachment was expected to increase as the solution pH increased as a result of increased
repulsive forces since both surfaces of FeS particles and quartz sand become more

104
negatively charged. This mechanism might be more important in FeS-coated sand
generated by direct injection. Consistent with the expected effect of greater repulsion,
more iron release was observed at pH 8.3 than at pH 7.5 in the experiment when the FeS
was applied to the sand by direct injection.
FeS dissolution was the dominant mechanism of FeS loss at relatively acidic
values of pH. The dissolved iron concentrations increased as the pH of the eluent
electrolyte solution decreased from 7.5 to 5.5. The dissolution rate was significantly rapid
at relatively acidic pH. At pH 5.5, for example, 12% of the initially installed FeS could be
lost per year in a 5 meter-thick PRB zone, with and assumed 2 mg FeS per gram of sand
coating, and a groundwater flow velocity of 10-3 cm sec-1. The dissolution rate of FeS,
however, is slightly lower than the rate predicted from literature values of mackinawite
solubility. This might be due to the corrosion of mackinawite to more stable metal
sulfides, i.e., greigite and pyrite, which are also less soluble iron sulfides, or other phases
such as green rust. The oxidation of mackinawite occurs in a slightly oxidized
environment. Since the apparent release of iron decreased slowly with time, it is
hypothesized that corrosion results in a gradually slower loss of the coating due to
dissolution. At slower flow rates, a more rapid steady-state iron release was observed.
More reducing conditions are likely to be established in the pore water as the particle-free
solution passes through the FeS-coated sand at slow flow rates. The groundwater flow
rate is expected to have an important effect on the redox potential in a barrier, and in the
case of FeS-type PRBs, the flow rate could determine whether the reactive media is lost
more quickly due to corrosion or by dissolution.

105
7.2 Recommendations for Future Study
The findings in this work demonstrated the feasibility of nanoparticulate FeS
deposition onto clean sand media by controlling solution chemistry within a range of pH,
6.5 to 8.3, and ionic strength, 0.025 to 0.05 M. Natural sand media in an existing
contaminated aquifer, however, likely to have a wide variety of surface mineral coatings,
such as oxides carbonate minerals, aluminosilicates, clay particles, and organic matter.
For further field implementation, feasibility studies of FeS deposition onto natural sand
media are also needed to demonstrate the effectiveness of the colloidal emplacement
technique. Surface minerals on natural sand grains are expected to exert an important
influence on the attachment rate of colloidal FeS. These surface minerals, for example,
may be positively charged metal oxides, and would then represent more favorable sites
for negatively charged FeS. Future experiments to examine the role of various common
mineral coatings on FeS deposition are recommended to improve the design of FeS-type
PRBs installation methods.
Additional studies are also necessary to examine the wider effects of natural
corrosion processes on the treatment efficiency of FeS-type PRBs. Mackinawite
corrosion products, such as greigite, may provide additional treatment depending on the
contaminants involved. A greater understanding of all the effects of FeS corrosion will be
necessary to predict the longevity of FeS-type PRBs.

106
Appendix
Modeling of FeS Dissolution in a Fixed Bed
An interface transport model in a fixed bed was employed to estimate the
solubility of iron sulfide particles. The solubility of FeS may play an important role in
particle loss of FeS-type PRBs especially at acidic pH condition. The dissolved iron
concentration in the effluent can be simulated by a film model in which the iron
dissolution rate is limited by diffusive mass transfer through a quiescent microscale
domain (i.e. film). Figure A.1 shows the film theory that diffusive mass transfer occurs in
the film from solid surface to bulk fluid by concentration gradient.
Figure A.1 Film model for mass transfer from solid surface to bulk fluid

107
The diffusive iron mass transfer through the film can be illustrated by diffusional
flux as following:
( ) ( )S B ll l S B f S B
C C DdCN D D C C k C Cdy δ δ
−⎛ ⎞= = = − = −⎜ ⎟⎝ ⎠
(A.1)
where, lf
Dkδ
= (A.2)
N is flux of dissolved iron (Fe2+) from surface to bulk solution by diffusion, Dl is
diffusivity of ferrous iron, δ is the film thickness, fk is the film mass transfer coefficient,
SC is the iron concentration on the surface of FeS particle at the equilibrium by the
solubility, and CB is the iron concentration in the bulk fluid.
If we assume that the iron dissolution rate is limited by the mass transfer, the
dissolution rate can be determined by the concentration difference between the CS and
CB. The equilibrium concentration of dissolved iron (CS) at the surface of FeS solid will
be a fitting parameter as a function of pH by varying the velocity (or flow rate) of pore
water. The fitted equilibrium iron concentrations as a function of pH will be utilized to
estimate the solubility of FeS.
The mass transfer coefficient, kf, depends on velocity in the vicinity of the
interface and upon the film thickness (sees equation A.2). Although the film thickness
may not be measured directly, it is inversely proportional to turbulence at the phase
interface. The film thickness, δ, decreases and the mass transfer coefficient increases with

108
bulk turbulence. The mass transfer coefficient can be estimated by dimensionless
parameters, i.e. Sherwood number as following.
f cSh
l
K LN
D= (A.3)
where Lc is a characteristic length. Several mass transfer correlations have been reported
for liquids in fixed beds (Wilson and Geankoplis, 1966, eq. (A.4); Williamson et al.,
1963, eq. (A.5); Gnielinski, 1978, eq. (A.6)). In the correlations, the Sherwood number is
related to Reynolds number, NRe=dpvρ/µ, and Schmidt number, NSc=µ/ρDl, where dp is
the particle diameter, v is the fluid velocity, ρ is the fluid density, and µ is the fluid
viscosity. The flow velocity in a fixed bed is directly related in mass transfer coefficient
and thus it is would be a variable in this proposed modeling.
0.333 0.333Re Re
1.09 for 0.0016< 55, and 950 70,000Sh Sc ScB
N N N N Nε
= < < < (A.4)
0.34 0.42Re Re2.4 for 0.08 < 125, and 150 1300Sh Sc ScN N N N N= < < < (A.5)
0.5 0.333Re B Re(2 0.644 )[1+1.5(1- )] for 100Sh ScN N N Nε= + < (A.6)
The mass balance model for a fixed bed can be described as following one
dimensional advection – diffusion model:
RzCD
zCv
tC
dz +∂∂
+∂∂
−=∂∂
2
2
(A.7)

109
where vz is the flow velocity and Dd is the dispersion coefficient which can be estimated
by an transient experiment using an inert trace. The reaction rate term, R, can account for
diffusive iron mass transfer through the film on surface of solid.
( ) ( )( )s R f S s RR N a k C C a° °= = − (A.8)
where ( )s Ra° is the specific interfacial area per unit volume of system.
In this modeling, several assumptions were necessary to facilitate the model. (1)
The initial concentration of deposited FeS particles on the quartz is homogeneous through
the column length. (2) Size and number of the coated FeS particle does not change by
dissolution. (3) The concentration of dissolved iron at the surface of FeS will be assumed
to be an equilibrium concentration with solution pH.

110
Bibliography
American Society of Agronomy; Soil Science Society of America, Methods of soil analysis, 1982, 2nd edition, Madison, WI
Abadzic, S.D.; Ryan, J.N., Particle release and permeability reduction in a natural zeolite (Clinoptilolite) and sand porous medium, Environmental Science & Technology, 2001, 35, 4502-4508
Arnold, W.A.; Roberts, A.L., Pathways and kinetics of chlorinated ethylene and chlorinated Acetylene reaction with Fe(0) particles, Environmental Science & Technology, 2000, 34, 1794-1805
AWWA; APHA; WEF, Standard methods for the examination of water and wastewater, American Public Health Association, New York, 19th edition, 1995
Bebie, J.; Schoonen, M.A.A.; Fuhrmann, M.; Strongin, D.R., Surface charge development on transition metal sulfides: an electrokinetic study, Geochemica et Cosmochimica Acta, 1998, 62, 633-642
Benning L.G.; Wilkin, R.T.; Barnes, H.L., Reaction pathways in the Fe-S system below 100oC, Chemical Geology, 2000, 167, 25-51
Bitea, C.; Walther, C.; Kim, J.I.; Geckeis, H.; Rabung, T.; Scherbaum, F.J.; Cacuci, D.G., Time-resolved observation of ZrO2-colloid agglomeration, Colloids and Surfaces A, 2003, 215, 55-66
Blowes, D.W.; Ptacek, C.J.; Jambor, J.L., In-situ remediation of Cr(VI)-contaminated groundwater using permeable reactive walls: laboratory studies, Environmental Science and Technology, 1997, 31 (12), 3348 - 3357
Blowes, D.W.; Ptacek, C.J.; Benner, S.G.; McRae, C.W.T.; Bennett, T.A.; Puls, R.W., Treartment of inorganic contaminants using permeable reactive barriers, Journal of Contaminant Hydrology, 2000, 45, 123-137

111
Bunn, R.A.; Magelky, R.D.; Ryan, J.N.; Elimelech, M., Mobilization of natural colloids form an iron oxide-coated sand aquifer: Effect of pH and ionic strength, Environmental Science and Technology, 2002, 36, 314-322
Burner R.A., Thermodynamic stability of sedimentary iron sulfides, American Journal of Science, 1967, 265, 773-785
Butler, E.C.; Hayes. K.F., Effects of solution composition and pH on the reductive dechlorination of hexachloroethane by iron sulfide. Environmental Science and Technology, 1998, 32 (9), 1276-1284
Butler, E. C.; Hayes, K.F., Kinetics of the transformation of trichloroethylene and tetrachloroethylene by iron sulfide. Environmental Science and Technology, 1999, 33 (12), 2021-2027
Cantrell, K.J.; Kaplan, D.I., Zero-valent iron colloid emplacement in sand columns, Journal of Environmental Engineering, 1997, 123, 499-505
Cantrell, K.J.; Kaplan, D.I.; Gillmore, T.J., Injection of colloidal Fe0 particles in sand with shear-thinning fluids, Journal of Environmental Engineering, 1997, 123, 786-791
Choe, S.; Chang, Y.; Hwang, K.; Khim, J., Kinetics of reductive denitrification by nanoscale zero-valent iron, Chemosphere, 2000, 40, 1307-1311.
Chung, N.K., Chemical precipitation in H.M. Freeman, Standard handbook of harzardous waste treatment and disposal, McGraw-Hill, New York, 1989.
Coles, C.A.; Ramachandra Rao, S.; Yong, R.N., Lead and cadmium interactions with Mackinawite: Retention mechanisms and the role of pH, Environmental Science and Technology, 2000, 34 (6), 996-1000
Coulibaly, K.M.; Borden, R.C., Impact of edible oil injection on the permeability of aquifer sands, Journal of contaminant hydrology, 2004, 71, 219-237
Davison, W.; Philips, N.; Tabner B., Soluble iron sulfide species in natural waters: Reappraisal of their stoichiometry and stability constants, Aquatic Sciences, 1999, 61, 23-43
Day, S.R.; O’Hannesin, S.F., Marsden, L., Geotechnical techniques for the construction of reactive barriers, Journal of Hazardous Materials, 1999, B67, 285-297
Derjaguin, B.V.; Landau, L., Theory of the stability of strongly charged lyophobic sols and of the adhesion of strongly charged particles in solution of electrolytes, Acta Physicochimica (URSS), 1941, 14, 633

112
Elliott, D.W.; Zhang, W., Field assessment of nanoscale bimetallic particles for groundwater treatment, Environmental Science and Technology, 2001, 35, 4922-4926
Fitzpatrick, J.A. and Spielman, L.A., Filtration of aqueous latex suspension through beds of glass spheres, Journal of colloid and interface science, 1973, 43, 350-369
Friedlander, S.K., Theory of aerosol filtration, Industrial & Engineering Chemistry, 1958, 50(8), 1161-1164
Gallegos, T., Dissertation (Ph.D.), Sequestration of As(III) by synthetic mackinawite under anoxic conditions, University of Michigan, 2007
Gavaskar, A.R., Design and construction techniques for permeable reactive barriers, Journal of Hazardous Materials, 1999, 68, 41-71
Grolimund, D.; Elimelech, M.; Borkovec, M.; Barmettler, K.; Kretzschmar, R.; and Sticher, H., Transport of in situ mobilized colloidal particles in packed soil column, Environmental Science & Technology, 1998, 32, 3562-3569
Grolimund, D.; Borkovec, M., Long-term release kinetics of colloidal particles from natural porous media, Environmental Science & Technology, 1999, 33, 4054-4060
Grolimund, D.; Borkovec, M., Release of colloidal particles in natural porous media by monovalent and divalent cations, Journal of Contaminant Hydrology, 2006, 87, 155-175
Han, Y.S., Dissertation (Ph.D.), Iron sulfide-coated sand for remediation of arsenic (III) - contaminated anoxic groundwater, University of Michigan, 2009
Hansson, E.B., Odziemkowski, M.S.; Gillham, R.W., Formation of poorly crystalline iron monosulfides: Surface redox reactions on high purity iron, spectroelectrochemical studies, Corrosion Science, 2006, 48, 3767-3783
Hanus, L.H.; Sooklal, K.; Murphy, C.J.; Ploehn, H.J., Aggregation kinetics of dendrimer-stabilized CdS nanoclusters, Lanmuir, 2000, 16, 2621-2626
He, Y.T.; Wilson, J.T.; Wilkin R.T., Transformation of reactive minerals in a permeable reactive barrier (biowall) used to treat TCE in groundwater, Environmental Science and Technology, 2008, 42(17), 6690-6696
Henderson, A.D. and Demond, A.H., Long-term performance of zero-valent iron permeable reactive barriers: A critical review, Environmental Engineering Science, 2007, 24, 401-423

113
Henderson, A.D. and Demond, A.H., Unpublished data, Department of Civil and Environmental Engineering, University of Michigan.
Hunger, S; Benning, L.G.; Greigite: a true intermediate on the polysulfide pathway to pyrite, Geochemical Transactions, 2007, v. 8 :1, doi:10.1186/1467-4866-8-1
Hunter, R.J. Foundation of Colloid Science, 2nd Ed., Oxford, New York, 2001
Interstate Technology & Regulatory Council, Permeable Reactive Barriers Team, Permeable reactive barriers: Lessons learned/New directions, 2004
Ives, K.J. and Sholji, I., Research on Variables Affecting Filtration, Journal of the Sanitary Engineering Division, American Society of Civil Engineering, 1965, 91, SA4, 1
Iwasaki, T., Some Notes on Sand Filtration, Journal of American Water Works Association, 1937, 29, 1591
Joanny, J.F.; Leibler, L.; De Gennes, P.G., Effects of polymer solutions on colloid stability, Journal of Polymer Science: Polymer Physics Edition, 1979, 17(6) 1073-1084
Jeong, H.; Hayes, K., Impact of transition metals on reductive dechlorination rate of hexachlorothylene by Mackinawite. Environmental Science and Technology, 2003, 37 (20), 4650-4655
Kamolpornwijit, W.; Liang, L.; West, O.R.; Moline, G.R.; Sullivan, A.B., Preferential flow path development and its influence on long-term PRB performance: column study, Journal of Contaminant Hydrology, 2003, 66, 161-178
Kallay, N.; Biškup, B.; Tomič, M.; Matijevič, E., Particle adhesion and removal in model systems, X. The effect of electrolytes on particle detachment, Journal of colloid and interface sciences, 1986, 114(2), 357-362
Kallay, N.; Dojnović, Z.; Čop, A.; Surface potential at the hematite-water interface, Journal of Colloid and Interface Science, 2005, 286, 610-614
Khilar, K.C.; Fogler, H.S., Migration of fines in porous media, Dordrecht, Netherlands, Kluwer Academic Publishers, 1998, Chapter 3
Klausen, J.; Ranke, J.; Schwarzenbach, R.P., Influence of solution composition and column aging on reduction of nitroaromatic compounds by zero-valent iron, Chemosphere, 2001, 44, 511-517
Kouvo, O.; Long, J.V.P.; Vuorelainen, Y., A tetragonal iron sulfide, American Mineralogist, 1963, 48, 511-514

114
Kouznetsova, I.; Bayer, P.; Ebert, M.; Finkel, M., Modeling the long-term performance of zero-valent iron using a spatio-temporal approach for iron aging, Journal of Contaminant Hydrology, 2007, 90, 58-80
Kuhnen, F.; Barmettler, K.; Bhattacharjee, S.; Elimelech, M.; Kretzschmar, R., Transport of iron oxide colloids in packed quartz sand media: monolayer and multilayer deposition, Journal of Colloid and Interface Science, 2000, 231, 32-41
Kulkarni, R.; Sureshkumar, R.; Biswas, R., Hierarchical approach to model multilayer colloidal deposition in porous media, Environmental Science and Technology, 2005, 39, 6361-6370
Kyprianidou-Leodidou, T.; Althaus, H.J.; Wyser, Y.; Vetter, D.; Büchler, M., Caseri, W.; Suter, U.W., High refractive index materials of iron sulfides and poly(ethylene oxide), Materials Research Society, 1997, 12, 2198-2206
Lee, W.J.; Batchelor, B., Abiotic reductive dechlorination of chlorinated ethylenes by iron-bearing soil minerals. 1. pyrite and magnetite, Environmental Science and Technology, 2002, 36, 5147-5154
Li, X.; Zhang, W., Sequestration of metal cations with zerovalent iron nanoparticles – a study with high resolution X-ray photoelectron spectroscopy (HR-XPS), journal of physical chemistry, 2007, 111, 6939-6946.
Li, X.; Brown, D.G., Zhang, W., Stability of biosolids with nanoscale zero-valent iron (nZVI), Journal of Nanoparticle Research, 2007, 9, 233-243
Liang, L.Y.; Morgan J.J., Chemical aspects of iron oxide coagulation in water: Laboratory studies and implications for natural systems, Aquatic Sciences, 1990, 52(1), 1015-1621
Liang, L.Y.; Sullivan, A.B.; West. O.R.; Moline, G.R.; Kamolpornwijit, W., Predicting the precipitation of mineral phases in permeable reactive barriers, Environmental Engineering Science, 2003, 20, 635-653
Liang, L.Y.; Moline, G.R.; Kamolpornwijit, W.; West, O.R., Influence of hydrogeochemical processes on zero-valent iron reactive barrier performance: a field investigation, Journal of Contaminant Hydrology, 2005, 78, 291-312
Lin, M.Y.; Lindsay, H.M.; Weitz, D.A.; Ball, R.C.; Klein, R., Meakin, P., Universality in colloid aggregation, Nature, 1989, 339, 360-362
Liou, Y.H.; Lo, S.; Kuan, W.H.; Lin, C.; Weng, S.C., Effect of precursor concentration on the characteristics of nanoscale zerovalent iron and its reactivity of nitrate, Water Research, 2006, 40, 2485-2492
115
Litton, G.M.; Olson, T.M., Colloid deposition rates on silica bed media and artifacts related to collector surface preparation methods, Environmental Science and Technology, 1993, 27, 185-193
Liu, C.C.; Tseng, D.H.; Wang, C.Y., Effects of ferrous ions on the reductive dechlorination of trichloroethylene by zero-valent iron, Journal of Hazardous Materials, 2006, B136, 706-713
Liu, J.; Valsaraj, K.T.; Devai, I.; DeLaune, R.D., Immobilization of aqueous Hg(II) by mackinawite (FeS), Journal of Hazardous Materials, 2008, 157, 432-440
Liu, Y. and Lowry, G.V., Effect of particle age (Fe0 content) and solution pH on NZVI reactivity: H2 evolution and TCE dechlorination, Environmental Science and Technology, 2006, 40, 6085-6090
Livens, F.R.; Jones, M.J.; Hynes, A.J.; Charnock, J.M.; Mosselmans, F.W.; Hennig, C.; Steele, H.; Collison, D.; Vaughan, D.J.; Pattrick, R.A.D.; Reed, W.A.; Moyes, L.N, X-ray adsorption spectroscopy studies of reactions of technetium, uranium and neptunium with mackinawite, Journal of Environmental Radioactivity, 2004, 74, 211-219
Matheson, L.J.; Tratnyek, P.G., Reductive dechlorination of chlorinated methanes by iron iron metal, Environmental Science and Technology, 1994, 28, 2045-2053
Mattigod, S.V.; Fryxell G.E.; Alford, K.; Gilmore, T.; Parker, K.; Serne, J.; Engelhard, M., Functionalized TiO2 nanoparticles for use for in situ anion immobilization, Environmental Science and Technology, 2005, 39, 7306-7310
Mayer, K.U.; Blowes, D.W.; Frind, E.O., Reactive transport modeling of an in situ reactive barrier for the treatment of hexavalent chromium and trichloroethylene in groundwater, Water Resourses Research, 2001, 37, 3091-3103
Mylon, S.E.; Chen, K.L.; Elimelech, M., Influence of natural organic matter and ionic composition on the kinetics and structure of Hematite colloid aggregation: Implication to iron depletion in estuaries, Langmuir, 2004, 20, 9000-9006
Mullet, M.; Boursiquot S.; Ehrhardt, J.J., Removal of hexavalent chromium from solution by Mackinawite, tetragonal FeS, Colloids and Surfaces A: Physicochemical and Engineering Aspects, 2004, 224, 77-85
National Research Council, Alternatives for ground water cleanup, National Academy Press, Washington, D.C., 1994, 80-124
Noubactep, C.; Schoner, A.; Meinrath, G., Mechanism of uranium removal from the aqueous solution by elemental iron, Journal of Hazardous Materials, 2006, B132, 202-212

116
Ohfugi, H.; Rickard, D.; High resolution transmission electron microscopic study of synthetic nanocrystalline mackinawite, Earth and Planetary Science Letters, 2006, 241, 227-233
Patterson, R.R.; Fendorf, S., Reduction of hexavalent chromium by amorphous iron sulfide. Environmental Science and Technology. 1997, 31 (7) 2039-2044
Phenrat, T.; Saleh, N.; Sirk K.; Tilton, R.D.; Lowry, G.V., Aggregation and sedimentation of aqueous nanoscale zerovalent iron dispersions, Environmental Science and Technology, 2007, 41, 284-290
Philips, D.H.; Gu, B.; Watson, D.B.; Roh, Y.; Liang, L.; Lee, S.Y., Performance evaluation of a zerovalent iron reactive barrier: mineralogical characteristics, Environmental Sciences and Technology, 2000, 34, 4169-4176
Rickard, D.; Morse, J.W., Acid volatile sulfide (AVS), Marine Chemistry, 2005, 97, 141-197
Rickard, D., The solubility of FeS, Geochemica et Cosmochimica Acta, 2006, 70, 5779-5789
Rickard, D.; Luther, G.W., Chemistry of iron sulfides, Chemical Reviews, 2007, 107, 514-562
Ritter, K.; Odziemkowski, M.S.; Gillham, R.W., An in situ study of the role of surface films on granular iron in the permeable iron wall technology, Journal of Contaminant Hydrology, 2002, 55, 87-111
Roy, S.B.; Dzombak, D.A., Colloid release and transport processes in natural and model porous media, Colloids and Surfaces A: Physicochemical and Engineering Aspects, 1996, 107, 245-262
Ryan, J.N.; Elimelech, M., Review, Colloid mobilization and transport in groundwater, Colloid and Surfaces, A: Physicochemical and Engineering Aspect, 1996, 107, 1-56
Ryan, J.N.; Gschwend, P.M., Effects of ionic strength and flow rate on colloid release: relating kinetics to intersurface potential energy, Journal of Colloid and Interface Science, 1994, 164, 21-34
Saleh, N.; Sirk, K.; Liu, Y.; Phenrat, T.; Dufour, B.; Matyjaszewski, K.; Tilton, R.D.; Lowry, G.V., Surface modifications enhance nanoiron transport and NAPL targeting in saturated porous media, Environmental Engineering Science, 2007, 24, 45-57
117
Scherer, M.M.; Richter, S.; Valentine, R.L.; Alvares, P.J.J., Chemistry and microbiology of permeable reactive barrier for in situ groundwater cleanup, Critical reviews in Environmental Science and Technology, 2000, 30, 363-411
Schoonen, M.A.A.; Barnes, H.L.; Reaction forming pyrite and marcasite from solution: II. Via FeS precursors below 100oC, Geochemica et Cosmochimica Acta, 1991, 55, 1505-1514
Schrick, B.; Hydutsky, B.W.; Blough, J.L.; Mallouk, T.F., Delivery vehicles for zerovalent metal nanoparticles in soil and groundwater, Chemistry of Materials, 2004, 16, 2187-2193
Sen, T.K.; Khilar, K.C., Review on subsurface colloids and colloid-associated contaminant transport in saturated porous media, Advances in Colloids and Interface Science, 2006, 119, 71-96
Shen, C.Y.; Li, B.G.; Huang, Y.F.; Jin, Y., Kinetics of coupled primary- and secondary-minimum deposition of colloids under unfavorable chemical conditions, Environmental Science and Technology, 2007, 41, 6976-6982
Smoluchowski, M., Drei Vortrage, Physik, Zeitschr, XVII, 1916, 557
Stumm, W; Morgan, J.J., Aquatic chemistry: chemical equilibria and rates on natural waters, New York, Wiley, 3rd edition, 1996
Suleimenov, O.M.; Seward, T.M., A spectrophotometric study of hydrogen sulphide ionisation in aqueous solution to 350oC, Geochimica et Cosmochimica Acta, 1997, 61(24), 5187-5198
Taylor, P.; Rummery, T.E.; Owen, D.G., On the conversion of mackinawite to greigite, Journal of Inorganic and Nuclear Chemistry, 1979, 41, 595-596
Tufenkji, N. and Elimelech, M., Deviation from the classical colloid filtration theory in the presence of repulsive DLVO interactions, Langmuir, 2004, 20, 10818-10828
United States Environmental Protection Agency, 2002, Economic Analysis of the implementation of permeable reactive barriers for remediation of contaminated ground water, 2002
United States Environmental Protection Agency, Field applications of in situ remediation technologies: permeable reactive barriers, 2002
Vaughan, D.J.; Craig, J.R., Mineral Chemistry of Metal Sulfides, Cambridge, England, Cambridge University Press, 1978
Verwey, E.J.W.; Overbeek, J.T.G., Theory of the stability of lyophobic colloids, Elsevier, Amsterdam, 1948

118
Vikesland, P.J.; Klausen, J.; Zimmermann, H., Longevity of granular iron in groundwater treatment processes: changes in solute transport properties over time, Journal of Contaminant Hydrology, 2003, 64, 3-33
Virden J.W.; Berg, J.C., The use of photon correlation spectroscopy for estimating the rate constant for doublet formation in an aggregating colloidal dispersion, Journal of Colloid and Interface Science, 1992, 149, 528-535
Wang, S. Simulation of bioaugmentation involving exogenous bacteria injection, Water resources Research, 2002, 38, 1293
Ward, A.S., Filtration: Principles and Practices, Edited by Matteson, M.J. and Orr, C., New York, Marcel Dekker, INC, 1987, Chapter 2
Weber, Jr, W.J., Physicochemical Processes for Water Quality Control, John Wiley & Sons, Inc., 1972, Chapter 4. Filtration, 139-198
Weber, W. J. Jr.; DiGiano, F.A., Process Dynamics in Environmental Systems, Wiley, NY, 1996
Weerasooriya, R.; Dharmasena, B., Pyrite-assisted degradation of trichloroethane (TCE), Chemosphere, 2001, 42, 389-396
Widler, A.M.; Seward, T.M., The adsorption of gold(I) hydrosulphide complexes by iron sulphide surfaces, Geochimica et Cosmochimica Acta, 2002, 66, 383-402
Wilkin, R.T.; Barnes, H.L., Pyrite formation by reaction of iron monosulfides with dissolvied inorganic and organic sulfur species, Geochimica et Cosmochimica Acta, 1996, 60, 4167-4179
Wolthers, M.; van Der Gaast, S.J.; Rickard, D., The structure of dissordered makinawite, American Mineralogist, 2003, 88, 2007-2015
Wolthers, M.; Charlet, L.; van Der Linde, P.R.; Rickard, D.; van Der Weuden, C.H., Surface chemistry of disordered mackinawite (FeS), Geochimica et Cosmochimica Acta, 2005, 69, 3469-3481
Yao, K.M,; Habibian, M.T.; O’Melia, C.R., Water and waste water filtration: Concepts and applications, Environmental Science and Technology, 1971, 5, 1105-1112
Zeta-Meter, Inc, Staunton, VA 24402, USA, http://www.zeta-meter.com/5min.pdf
Zhang, W., Nanoscale iron particles for environmental remediation: an overview, Journal of nanoparticle Research, 2003, 5, 323-332
Zherenkova, L.V.; Mologin, D.A.; Khalatur, P.G.; Khokhlov, A.R., Interaction between small colloidal particles and polymer chains in a semidilute solution: Monte Carlo simulation, Colloid Polymer Science, 1998, 276, 753-768