Embed Size (px)
Citation preview
1
Chemical kinetics
Kinetics and food deterioration
• Objective– Prediction of change in quality as a function
of time and environmental conditions
See Labuza, T. P. 1984. Application of chemical kinetics todeterioration of food, J. Chemical Education,61, 348.
Kinetics and food deterioration
• Why is this technique needed?– Evaluation of new ingredients– Setting of “use by” dates– To insure nutritional labeling compliance
2
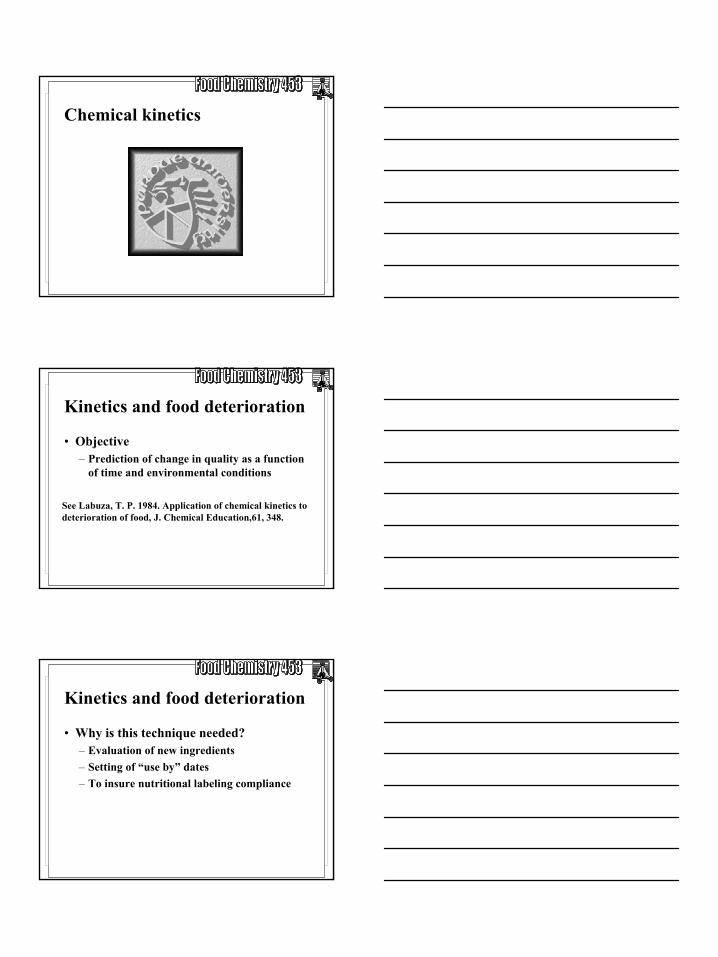
Quality change prediction
• To predict quality change you need to know– Major modes of quality loss– Factors controlling initial quality– Environmental conditions– Nature of the packaging material– Chemical kinetics
Common modes of food deterioration• Microbial decay
– pH, aw, redox potentials, etc.• Senesence
– Normal enzymatic reactions in post-harvest physiology of food stuffs
• Non-enzymatic browning– aw, pH, temperature, etc.
Common modes of food deterioration• Lipid oxidation
– Off flavor– Loss of solubility and biological value of
proteins– Bleaching of fat-soluble pigments
(carotenoids)– Loss of efficacy of fat soluble vitamins (A, D,
E, and K)
3
Common modes of food deterioration• Vitamin loss
– Hydrolysis– Light– Heat– Acid– Oxidation
• Vitamin C is most labile
Common modes of food deterioration• Color changes
– Loss of Mg from chlorophyll
• Enzymatic activity– PPO– Pectic enzymes– Lipase
Common modes of food deterioration• Sensory changes• Physical deterioration
– Decreased solubility of certain constituents– Mushiness– Freezing-thawing– Melting-recrystallization of fat– Bread staling
4
General methodology
• Select the major mode of deterioration to study
• Measure some quality factor related to this mode
• Apply mathematical models to make predictions
Selecting what to measure
• In selecting what to measure, consider– Key labile ingredients– Characteristics of the packaging material– How the product will be shipped and stored
Selecting what to measure
– Relative humidity– Temperature– Susceptibility to light– If no chemical test exists, would a sensory
test work?
5
Kinetics
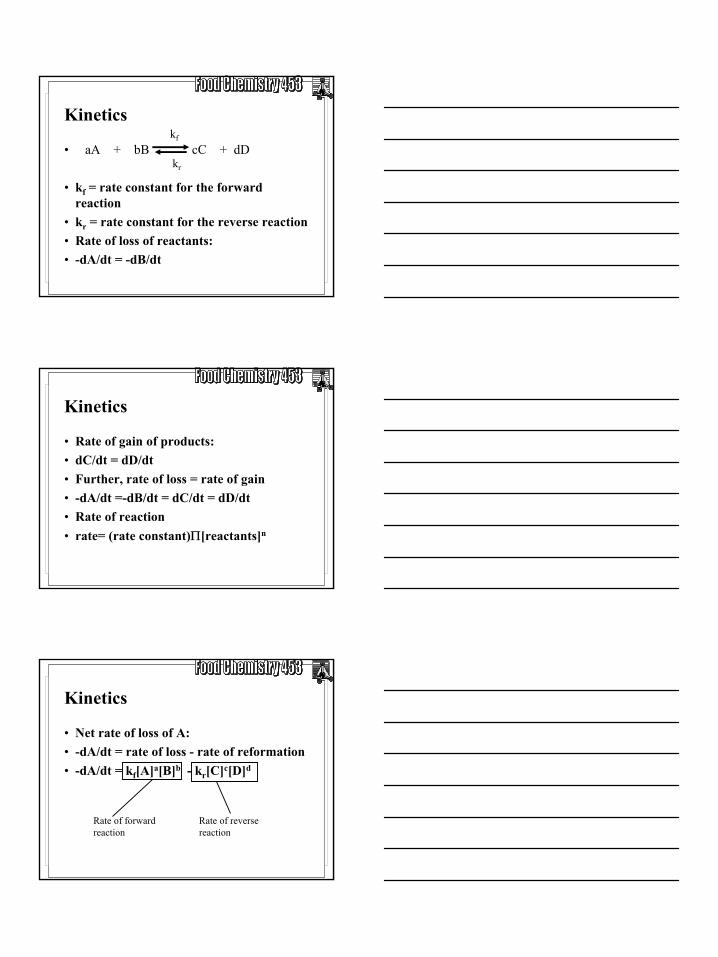
• aA + bB cC + dD
• kf = rate constant for the forward reaction
• kr = rate constant for the reverse reaction• Rate of loss of reactants:• -dA/dt = -dB/dt
kf
kr
Kinetics
• Rate of gain of products:• dC/dt = dD/dt• Further, rate of loss = rate of gain• -dA/dt =-dB/dt = dC/dt = dD/dt• Rate of reaction• rate= (rate constant)Π[reactants]n
Kinetics
• Net rate of loss of A:• -dA/dt = rate of loss - rate of reformation• -dA/dt = kf[A]a[B]b - kr[C]c[D]d
Rate of forward reaction
Rate of reverse reaction
6
Kinetics
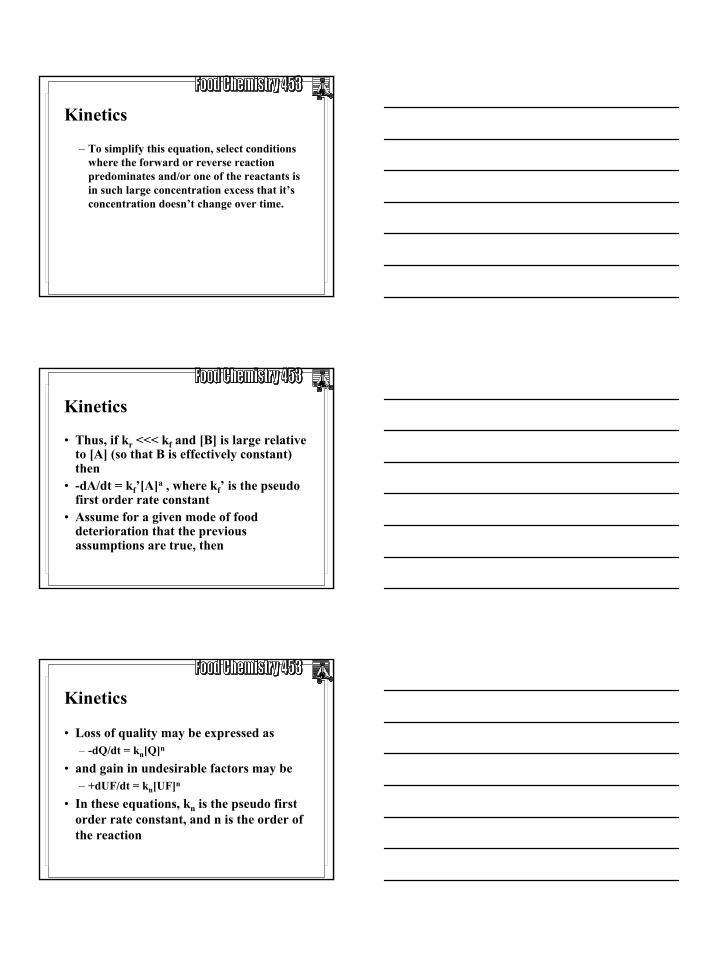
– To simplify this equation, select conditions where the forward or reverse reaction predominates and/or one of the reactants is in such large concentration excess that it’s concentration doesn’t change over time.
Kinetics
• Thus, if kr <<< kf and [B] is large relative to [A] (so that B is effectively constant) then
• -dA/dt = kf’[A]a , where kf’ is the pseudo first order rate constant
• Assume for a given mode of food deterioration that the previous assumptions are true, then
Kinetics
• Loss of quality may be expressed as– -dQ/dt = kn[Q]n
• and gain in undesirable factors may be– +dUF/dt = kn[UF]n
• In these equations, kn is the pseudo first order rate constant, and n is the order of the reaction
7
Reaction order and integration
• -dQ/dt = kn[Q]n
• For n = 0• -dQ/dt = k0[Q]0 = k0
• -d[Q] = k0dt• d[Q] = -k0dt• ∫d[Q] = -k0∫dt• [Q] - [Q0] = -k0t• [Q] = -k0t + [Q0]
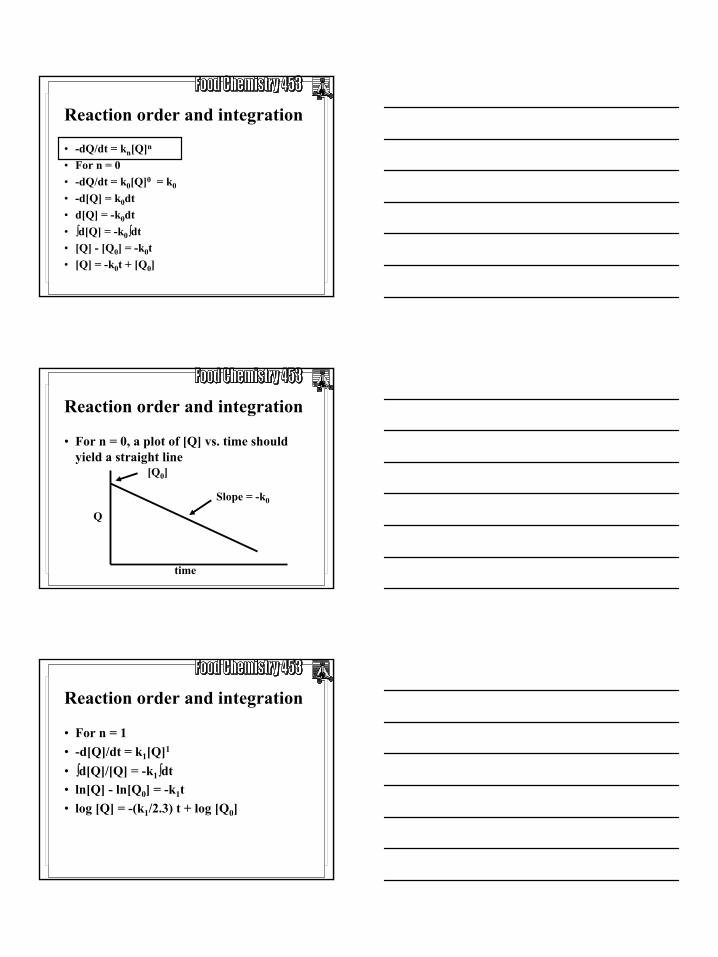
Reaction order and integration
• For n = 0, a plot of [Q] vs. time should yield a straight line
Q
time
[Q0]
Slope = -k0
Reaction order and integration
• For n = 1• -d[Q]/dt = k1[Q]1
• ∫d[Q]/[Q] = -k1∫dt• ln[Q] - ln[Q0] = -k1t• log [Q] = -(k1/2.3) t + log [Q0]
8
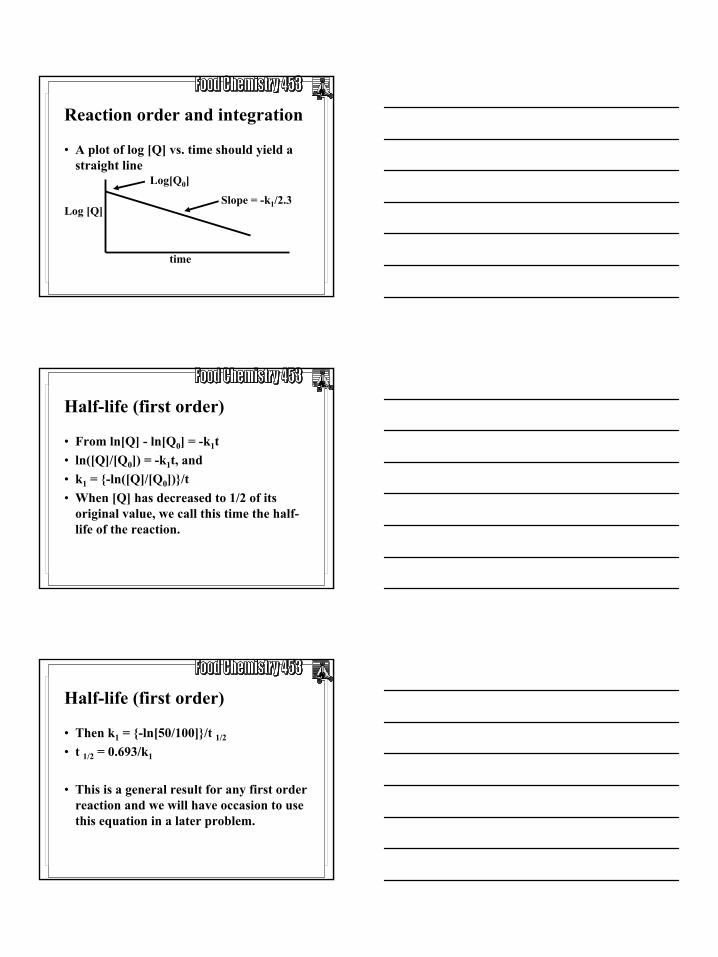
Reaction order and integration
• A plot of log [Q] vs. time should yield a straight line
Log [Q]
time
Log[Q0]
Slope = -k1/2.3
Half-life (first order)
• From ln[Q] - ln[Q0] = -k1t• ln([Q]/[Q0]) = -k1t, and• k1 = {-ln([Q]/[Q0])}/t• When [Q] has decreased to 1/2 of its
original value, we call this time the half-life of the reaction.
Half-life (first order)
• Then k1 = {-ln[50/100]}/t 1/2
• t 1/2 = 0.693/k1
• This is a general result for any first order reaction and we will have occasion to use this equation in a later problem.
9
Reaction order and integration
• We won’t do this but integration for n = 2 would indicate that plotting 1/[Q] vs. time would give a straight line.
Kinetic approach to accelerating shelf life deterioration
• Concentration acceleration
• Moisture or relative humidity acceleration
• Temperature acceleration– This is usually done
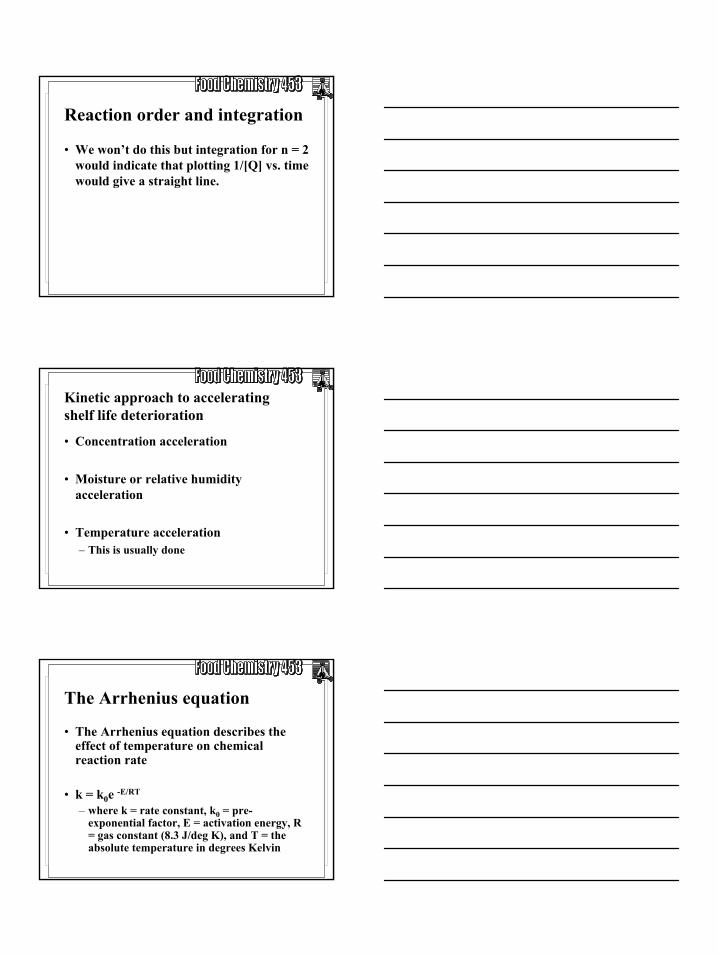
The Arrhenius equation
• The Arrhenius equation describes the effect of temperature on chemical reaction rate
• k = k0e -E/RT
– where k = rate constant, k0 = pre-exponential factor, E = activation energy, R = gas constant (8.3 J/deg K), and T = the absolute temperature in degrees Kelvin
10
The Arrhenius equation
• Take the natural logarithm of the Arrhenius equation
• ln k = -(Ea/R)(1/T) + ln0k
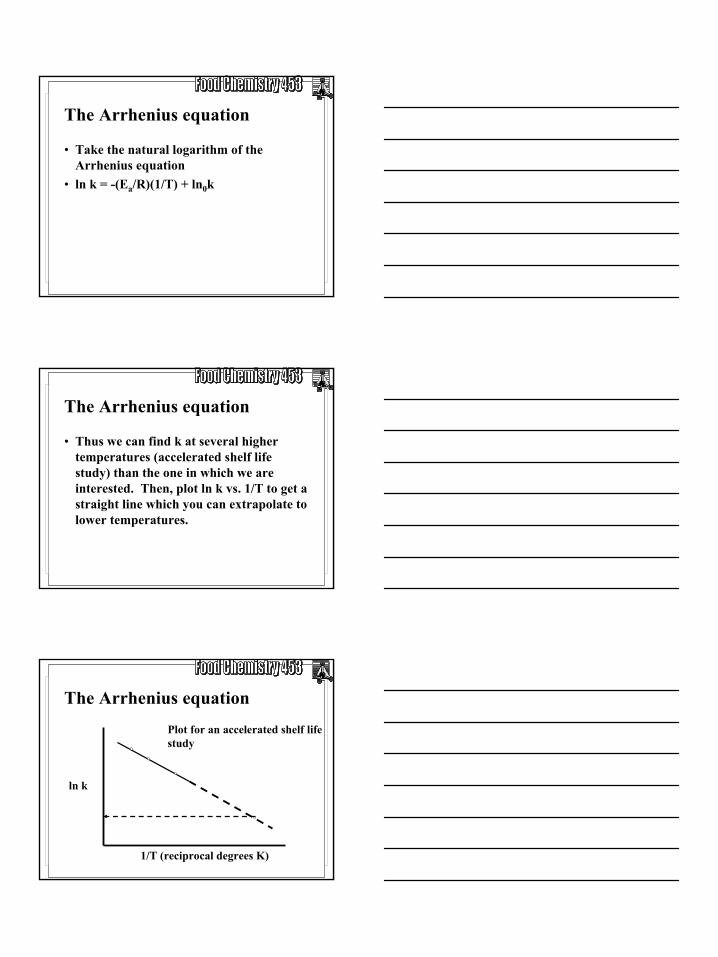
The Arrhenius equation
• Thus we can find k at several higher temperatures (accelerated shelf lifestudy) than the one in which we are interested. Then, plot ln k vs. 1/T to get a straight line which you can extrapolate to lower temperatures.
The Arrhenius equation
ln k
1/T (reciprocal degrees K)
Plot for an accelerated shelf lifestudy
11
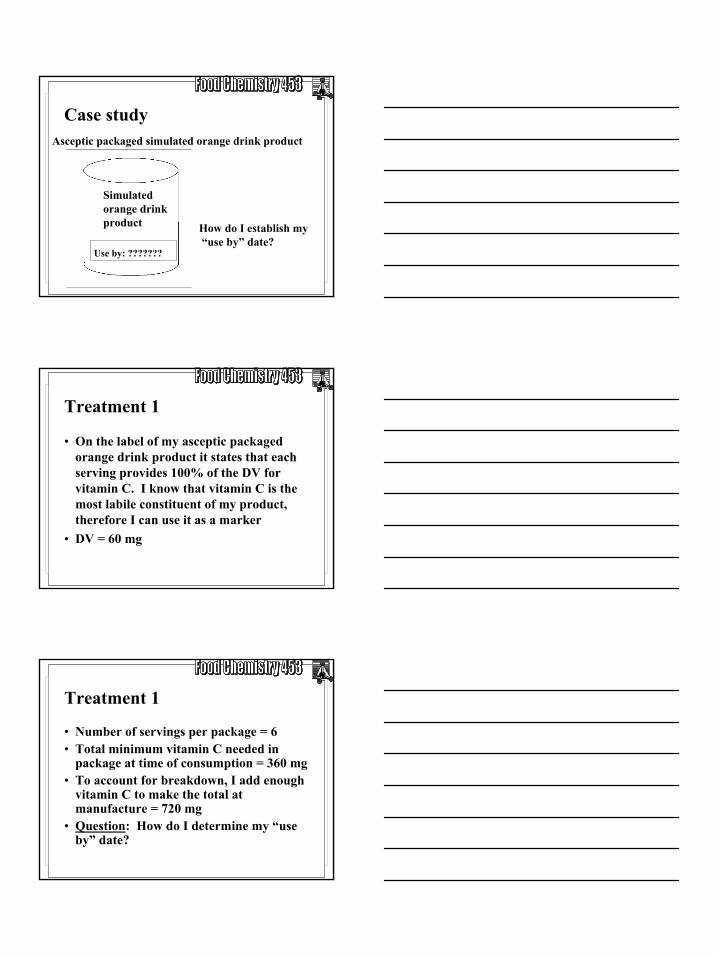
Case studyAsceptic packaged simulated orange drink product
Use by: ???????
Simulatedorange drinkproduct How do I establish my
“use by” date?
Treatment 1
• On the label of my asceptic packaged orange drink product it states that each serving provides 100% of the DV for vitamin C. I know that vitamin C is the most labile constituent of my product, therefore I can use it as a marker
• DV = 60 mg
Treatment 1
• Number of servings per package = 6• Total minimum vitamin C needed in
package at time of consumption = 360 mg• To account for breakdown, I add enough
vitamin C to make the total at manufacture = 720 mg
• Question: How do I determine my “use by” date?
12
Treatment 1
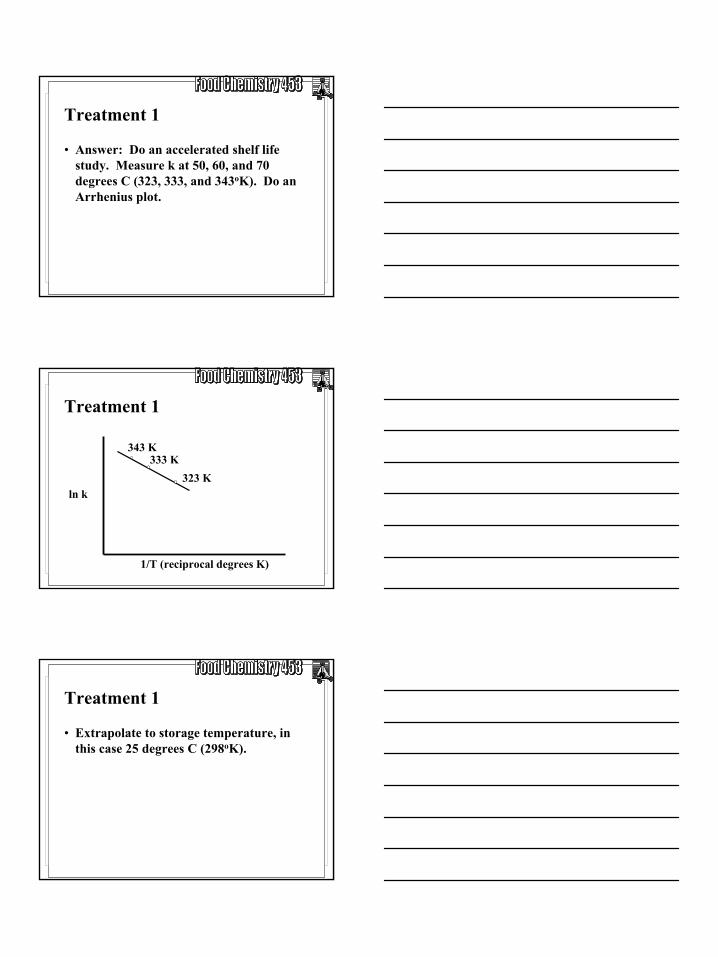
• Answer: Do an accelerated shelf life study. Measure k at 50, 60, and 70 degrees C (323, 333, and 343oK). Do an Arrhenius plot.
Treatment 1
ln k
1/T (reciprocal degrees K)
343 K333 K
323 K
Treatment 1
• Extrapolate to storage temperature, in this case 25 degrees C (298oK).
13
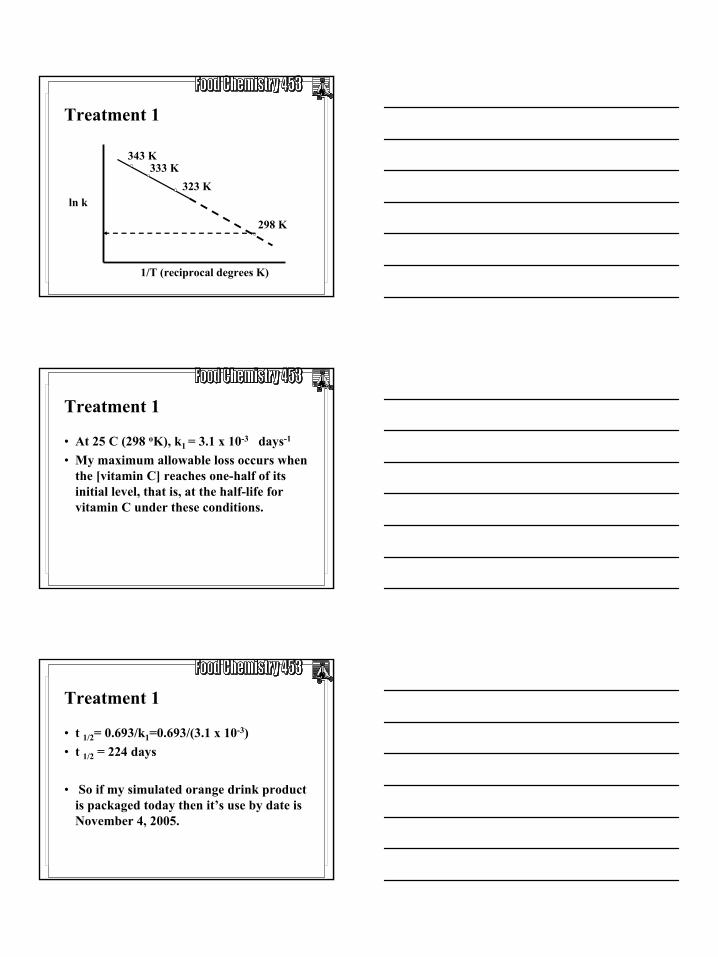
Treatment 1
ln k
1/T (reciprocal degrees K)
343 K333 K
323 K
298 K
Treatment 1
• At 25 C (298 oK), k1 = 3.1 x 10⁻³ days-1
• My maximum allowable loss occurs when the [vitamin C] reaches one-half of its initial level, that is, at the half-life for vitamin C under these conditions.
Treatment 1
• t 1/2= 0.693/k1=0.693/(3.1 x 10-3)• t 1/2 = 224 days
• So if my simulated orange drink product is packaged today then it’s use by date is November 4, 2005.
14
Treatment 1
Use by: Nov. 4, 2005
Simulatedorange drinkproduct
Treatment 2
• Same problem as treatment 1• We know from our kinetic experiments
that vitamin C degradation is a first order reaction. Thus,
Treatment 2
• ln [vitamin C] - ln [vitamin C]0 = -k1t• The vitamin C concentration at
consumption (time = t) must be 60 mg/serving.
15
Treatment 2
• My accelerated shelf life study tells me that k1 = 3.1 x 10⁻³ days-1. Thus,
• ln [60] - ln [vitamin C]0 = (3.1 x 10⁻³)t• I will specify a shelf life (or t) of 30 days.• Then, 4.1 - ln [vitamin C]0 = -0.093• ln [vitamin C]0 = 4.193
Treatment 2
• [vitamin C]0 = 66 mg/serving• So the total vitamin C needed per
package for a 30 day shelf life is 396 mg (storage at 25 degrees C/298oK)