Embed Size (px)
Citation preview
Loughborough UniversityInstitutional Repository
Chemical kinetics modellingstudy on fuel autoignition ininternal combustion engines
This item was submitted to Loughborough University's Institutional Repositoryby the/an author.
Additional Information:
• A Doctoral Thesis. Submitted in partial fulfillment of the requirementsfor the award of Doctor of Philosophy of Loughborough University.
Metadata Record: https://dspace.lboro.ac.uk/2134/6533
Publisher: c© Zhen Liu
Please cite the published version.
This item was submitted to Loughborough’s Institutional Repository (https://dspace.lboro.ac.uk/) by the author and is made available under the
following Creative Commons Licence conditions.
For the full text of this licence, please go to: http://creativecommons.org/licenses/by-nc-nd/2.5/
Chemical Kinetics Modelling Study
on Fuel Autoignition in Internal
Combustion Engines
by
Zhen Liu
A Doctoral Thesis
submitted in partial fulfilment of the requirements for the award of
Degree of Doctor of Philosophy of Loughborough University
July 2010
© by Zhen Liu 2010
Abstract
I
Abstract
Chemical kinetics has been widely acknowledged as a fundamental theory in
analysis of chemical processes and the corresponding reaction outputs and rates.
The study and application of chemical kinetics thus provide a simulation tool to
predict many characteristics a chemical process. Oxidation of hydrocarbon fuels
applied in internal combustion engines is a complex chemical process involving a
great number of a series of chained reaction steps and intermediate and
simultaneous species. Symbolic and Numerical description of such a chemical
process leads to the development and application of chemical kinetics models. The
up-to-date application of chemical kinetics models is to the simulation of autoignition
process in internal combustion engines.
Multi-zone thermodynamic combustion modelling has been regarded as a functional
simulation approach to studying combustion process in IC engines as a decent
compromise between computation accuracy and efficiency. Integration of chemical
kinetics models into multi-zone models is therefore a potential modelling method to
investigate the chemical and physical processes of autoignition in engine
combustion.
This research work has been therefore concerned with the development, validation
and application of multi-zone chemical kinetic engine models in the simulation of
autoignition driven combustion in SI and HCCI engines. The contribution of this work
is primarily made to establish a mathematical model based on the underlying
physical and chemical principles of autoignition of the fuel-air mixture in SI and HCCI
engines. Then, a computer code package has been developed to numerically solve
the model. The derived model aims at improving the understanding of autoignition
behaviour under engine-like conditions and providing an investigative tool to
autoignition characteristics. Furthermore, as part of the ongoing program in the
research of free piston engines, the results of this work will significantly aid in the
Abstract
II
investigation and simulation of the constant volume autoignition applied in free piston
engines.
Keywords: Autoignition, Knock, SI, HCCI, Chemical Kinetics, Multi-zone, Modelling,
IEGR, LUCKS, Mixing, DVODE
Figure List
III
Figure List
Figure 2-1: Comparison of normal (a) and abnormal (b and c) combustion phenomenon in SI engines [2]. .................................................................. 9
Figure 2-2: Schematic of combustion process with and without knock [6]. ............... 10
Figure 2-3: Typical SI engine envelope of end gas temperature and pressure histories leading up to the point of knock [26]. ......................................... 17
Figure 2-4: Branching pathways for hydrocarbon oxidation at low and intermediate temperatures [27]. ................................................................................... 18
Figure 2-5: Pressure history during the two-stage autoignition [30]. ......................... 20
Figure 2-6: Molecular structures of n-heptane (a) and iso-octane (b). ...................... 25
Figure 3-1: Comparison of SI, HCCI and CI combustion engines. ........................... 30
Figure 3-2: The depiction of the positive (left) and the negative valve (right) overlaps; EC: Exhaust valve closing and IO: intake valve opening. ........................ 42
Figure 3-3: Typical cylinder pressure vs. crank angle showing injecting timing windows [105]. ........................................................................................ 46
Figure 3-4: Interaction between the adiabatic core and the boundary layer [132]. ... 53
Figure 3-5: A Schematic drawing of a Multi-Zone model showing the Layout of the Different Zones [133] ............................................................................... 54
Figure 3-6: Geometric description of the multi-zone model proposed by Komninos et al [131]. ................................................................................................... 55
Figure 3-7: Distribution of EGR and mixture temperature over zones in the multi-zone model developed by Orlandini et al [136]. ............................................... 55
Figure 4-1: Major branches of n-heptane oxidation [6]. ............................................ 71
Figure 4-2: The four different sites for H abstraction in n-heptane. .......................... 72
Figure 4-3: Reaction mechanism of isomerisation of OOHC 157 . ............................. 73
Figure 4-4: Reaction mechanism of isomerisation of OOHHOOC 147
. ..................... 73
Figure 4-5: Major reaction branches of iso-octane oxidation [6]. .............................. 78
Figure 4-6: Different types of CH groups in n-heptane (left) and iso-octane (right) .. 78
Figure 4-7: Different transition rings for internal H abstraction in n-heptane and iso-octane ..................................................................................................... 79
Figure List
IV
Figure 4-8: Reduced chemistry for oxidation of n-heptane and iso-octane mixtures [154]. ....................................................................................................... 81
Figure 4-9: Structure of degenerate chain branching mechanism of a skeletal model................................................................................................................. 82
Figure 4-10: The skeletal chemical kinetics model of Li et al [178]. .......................... 84
Figure 5-1: Example of instability encountered in integrating a stiff equation (schematic). Here it is supposed that the equation has two solutions, shown as solid and dashed lines. Although the initial conditions are such as to give the solid solution, the stability of the integration (shown as the unstable dotted sequence of segments) is determined by the more rapidly varying dashed solution, even after that solution has effectively died away to zero. Implicit integration methods are the cure [183]. ........................ 104
Figure 6-1: The generic structure of the LUCKS code package. ............................ 114
Figure 6-2: The flowchart of the structure of the main program of LUCKS_HCCI and LUCKS_SI............................................................................................. 117
Figure 7-1: Three-zone combustion chamber. ....................................................... 123
Figure 7-2: Calculated knock position and peak pressure vs. Enhancing Factors in R6 and R18. .......................................................................................... 129
Figure 7-3: Calculated knock intensity and combustion duration vs. Enhancing Factors in R6 and R18. ......................................................................... 130
Figure 7-4: The structure of the LUCKS_SI program. ............................................ 132
Figure 7-5: Knock position on a typical measured pressure trace. ......................... 133
Figure 7-6: Zoom-in image from Figure 7-5 to schematically express the definition of
K ; ddPtg n / and ddPtg n /1 .............................................. 134
Figure 7-7: Comparison of the pressure traces between knocking cycles (top) and non-knocking cycles (bottom) extracted from the same set of recorded data ....................................................................................................... 135
Figure 7-8: Knock intensity .vs. knock positions of the identified knocking cycles the fitted 3rd order polynomial function curve .............................................. 136
Figure 7-9: Calculated and measured in-cylinder pressure under non-knocking conditions .............................................................................................. 136
Figure 7-10: Comparison of knock characteristics between calculated and measured data. (a): peak pressure (b): knock intensity (c): knock onset. ............... 139
Figure 7-11: Calculated in-cylinder pressure at various AFR. ................................ 139
Figure 7-12: Calculated and measured peak pressure at various AFR .................. 140
Figure 7-13: Calculated and measured knock onset position and knock intensity at various AFR .......................................................................................... 141
Figure 7-14: Comparison of calculated and measured knock onset positions in respect of RPM ..................................................................................... 141
Figure 7-15: Comparison of calculated and measured peak pressures in respect of RPM ...................................................................................................... 142
Figure 7-16: Comparison of calculated and measured knock intensity in respect of
Figure List
V
RPM ...................................................................................................... 142
Figure 7-17: MFB with and without unburned mixture autoignition. ........................ 144
Figure 7-18: Calculated knock onset positions and peak pressures in respect of intake pressure ..................................................................................... 144
Figure 7-19: Calculated knock intensity and combustion durations in respect of intake pressure ................................................................................................ 145
Figure 7-20: Calculated knock onset positions and peak pressures in respect of spark timings .................................................................................................. 146
Figure 7-21: Calculated knock intensity and combustion durations in respect of sparking timings .................................................................................... 146
Figure 8-1: Zone configuration ............................................................................... 151
Figure 8-2: Zone fraction distribution in a Gaussian-like shape .............................. 151
Figure 8-3: Influence of the additive sub-mechanism on the main combustion characters. ............................................................................................ 155
Figure 8-4: The flowchart of numerical procedures in Multi-Zone HCCI engine Simulation. ............................................................................................ 157
Figure 8-5: Calculated IEGR fraction, IEGR temperature and mixture temperature for each zone at 58% IEGR. ....................................................................... 160
Figure 8-6: The general principle of the valve timing strategy. ............................... 162
Figure 8-7: Zone volume and cylinder volume in respect of crank angle. ............... 163
Figure 8-8: Zone pressure and average cylinder pressure (Refer to Figure 8-9 for an enlarged view). ...................................................................................... 164
Figure 8-9: Zone pressure and average cylinder pressure – the enlarged image of Figure 8-8. ............................................................................................ 165
Figure 8-10: Zone temperature and average cylinder temperature. ....................... 166
Figure 8-11: Zone mass histories in respect of crank angle. .................................. 167
Figure 8-12: Comparison of the calculated pressure curve with experimental results at 58% IEGR. ........................................................................................ 167
Figure 8-13: Comparison of the calculated pressure curve with experimental results at 50% IEGR. ........................................................................................ 168
Figure 8-14: Comparison of calculated and measured peak pressure and peak pressure position at various IEGR. ........................................................ 168
Figure 8-15: CO mole fraction history for each zone against crank angle at 58 % IEGR. .................................................................................................... 169
Figure 8-16: In-cylinder CO history against crank angle at 58 % IEGR. ................. 170
Figure 8-17: Comparison of the calculated CO emission with the experimental results at various IEGR. .................................................................................... 171
Figure 8-18: HC mole fraction histories for each zone against crank angle at 58 % IEGR. .................................................................................................... 172
Figure 8-19: In-cylinder HC history against crank angle at 58 % IEGR. ................. 172
Figure 8-20: Comparison of the calculated HC emission with the experimental results
Figure List
VI
at various IEGR. .................................................................................... 173
Figure 8-21: Calculated average in-cylinder temperature at various IEGR levels ... 174
Figure 8-22: NOX mole fraction histories for each zone against crank angle at 58 % IEGR ..................................................................................................... 174
Figure 8-23: In-cylinder NOX histories against crank angle at 58 % IEGR .............. 175
Figure 8-24: Comparison of the calculated NOX emission with the experimental results at various IEGR ......................................................................... 175
Figure A-1: Pictorial comparison of CI, SI and HCCI engines. .............................. 188
Figure A-2: Working principle of a four-stroke engine [219]. .................................. 194
Figure A-3: Working principle of a two-stroke engine [220]. ................................... 195
Table List
VII
Table List
Table 4-1: Typical Composition of Gasoline [150]. ................................................... 68
Table 4-2: Categorization of chemical kinetics models [6]. ....................................... 80
Table 4-3: A proposed global kinetics model combining a low temperature sub-mechanism with a high temperature sub-mechanism [6]. ........................ 85
Table 6-1: Definitions and conversion factors of CGS units relevant to SI units ..... 120
Table 7-1: Engine specification. ............................................................................. 133
Table 8-1: Engine parameters and operating conditions ........................................ 163
Table A-1: Comparison of SI, CI and HCCI combustion processes ....................... 187
Table A-2: Classification of IC engine .................................................................... 188
Table A-3: Primary sources for hydrocarbon emissions in SI engines [217]. .......... 190
Table A-4: Classification of fuels used in IC engines [216]..................................... 194
Table A-5 Classification of methods of mixture generation .................................... 197
Dedication
VIII
Dedication
This thesis is what it is today because of a few special people, and I would like to
thank them for everything they have done in support my accomplishment of the
thesis. First and foremost, to Professor Rui Chen, my supervisor who has been the
most respectable master and friend in my life, I cannot fully express my gratitude for
his care, faith, and superb guidance.
My gratitude especially to my aunts and uncles who have supported and had faith in
me, without them, I would not have been typing this work in English.
Thank you especial to my dearest wife, Shanshan, who believed this work from the
start and gives her full heart and soul to our life.
To my colleagues and friends, Pratap Rama, Paul Osei-Owusu and Anna Liu, for
their help, kindness and trust, I am not able to be grateful enough.
I would be remiss and reproved if I did not mention the two extraordinary couples
who have been of paramount importance in my life: first, my parents who are forever
the best parents in the world for me and my parents-in-law, who treat me like a
beloved son.
Last but not the least, lots of thanks to those friends and relatives whose name are
not mentioned in this dedication, their help, understanding, and faith is considerably
important.
Nomenclature
IX
Nomenclature
Abbreviations
1D One Dimensional AFR Air-Fuel Ratio AFER Air-Fuel Equivalent Ratio ATAC Active Thermo-Atmosphere Combustion AVT Active Valve Train BDC Bottom Dead Centre BMEP Brake Mean Effective Pressures BTDC Before Top Dead Centre CA Crank Angle CAD Computer Aided Design CAI Controlled Auto-Ignition CCD Charge Coupled Device CFD Computational Fluid Dynamics CI Compression-Ignition CIDI Compression-Ignition Direct Injection CIHC Compression Ignited Homogeneous Charge CO Carbon Monoxide CO2 Carbon Dioxide CPU Central Processing Unit DI Direct Injection DME Dimethyl Ether DTBP Di-tertiary Butyl Peroxide EGR Exhaust Gas Recirculation EEGR External Exhaust Gas Recirculation EVC/EC Exhaust Valve Closing EVO Exhaust Valve Opening FVVT Fully Variable Valve Train GDI Gasoline Direct Injection GUI Graphics Users Interface HC Hydrocarbons HCCI Homogeneous Charge Compression Ignition HCDC Homogeneous Charge Diesel Combustion IAPAC Injection Assisted Process Air Compressed IC Internal Combustion ICE Internal Combustion Engine IEGR Internal Exhaust Gas Recirculation IMEP Indicate Mean Effective Pressures IVC Inlet Valve Closing
Nomenclature
X
IVO/IO Inlet Valve Opening LUCKS Loughborough University Chemical Kinetics Simulation MMT Methylcyclopentadienyl Manganese Tricarbonyl NOX Oxides of Nitrogen NTC Negative Temperature Coefficient NVO Negative Valve Overlapping NZ Total Zone Number ODE Odinary Differential Equation
Octane Number
PCCI Premixed Charged Compression Ignition PDA Particle Dynamics Analysis PM Particulate Matter PPM Parts Per Million PRF Primary Reference Fuels PVO Positive Valve Overlapping RCM Rapid Compression Machine RGF Residual Gas Fraction RON Research Octane Numbers SI Spark-Ignition SOC Start of Combustion SOI Start of Injection TDC Top Dead Centre TEL Tetraethyl Lead UHC Unburned Hydrocarbon VCR Variable Compression Ratio VVT Variable Valve Timing WOT Wide Open Throttle
Definitions
CHEMKIN Chemical Kinetics Modelling Code FLUENT Commercial CFD code KIVA Open-source CFD code for engine modelling SENKIN Closed-Volume, Gas-Phase Chemistry Code DVODE Double-precision Variable-coefficient Ordinary Differential Equation Solver LUCKS Loughborough University Chemical Kinetic Simulation
Arabic Symbols
a Stoichiometric Coefficients
b Stoichiometric Coefficients c Stoichiometric Coefficients
d Stoichiometric Coefficients
vc Specific Heat Capacity at Constant Volume [J/kg/K]
pc Specific Heat Capacity at Constant Pressure [J/kg/K]
h Specific Enthalpy [J/kg] j The step number k Reaction Rate Coefficient m Mass/Parameter [kg]
ON
Nomenclature
XI
n The time step number/Parameter/moles p
Pressure [Pa] r Reaction Rate t Time [s]
t The calculation time step [s] u Specific Internal Energy [J/kg] v Specific Volume [m3/kg]
Burned Mass Fraction
Area/Reactant/ Pre-exponential Factor/Parameter Matrix [m2]
Cylinder Bore/Reactant/Parameter Matrix [m] C Product
wshC Woschni’s Heat Transfer Rate Constant
pC Heat Capacity at Constant Pressure [J/kg]
hC Heat transfer rate constant
D Product/Character Length
E Activation Energy [J/mole]
K Pressure slope Change Rate [Pa/CA]
M Third Body Molecule/Molar Mass [kg/mole] N Total Number
uN Nusselt Number
P Products
cP Instantaneous Pressure Rise [Pa]
oP Pressure at IVC [Pa]
Q Heat Loss [J]
R Universal Gas Constant/Species [J/kg-K]
eR Reynolds Number
S Species
pS Mean Piston Speed [m/s]
T Temperature [K] U Internal Energy [J]
gU Average Gas Velocity [m/s]
V Volume [m3]
dV Displaced Volume [m3]
oV Cylinder volume at IVC [m3]
X Mole Fraction
Y Mass Fraction
oT Temperature at IVC [K]
GREEK
Stoichiometric Coefficients/Angle
x
A
B
Nomenclature
XII
Stoichiometric Coefficients/ Radiation Heat Transfer Coefficient/Angle
Molar Rate of Production Stefan-Boltzmann Constant
Gas Conductivity
Density Net Stoichiometric Coefficient
Crank Angle in degree
Specific Heat Ratio - Relationship between the Heat Capacities
Correlation of Ignition Delay
Gas Viscosity w Characteristic Speed Gradient/Difference
SUBSCRIPTS
Autoignited
Burned Gas
Blowby
Cylinder Convective
Burning/Forward/Function
Flame Propagation
Global
Heat Transfer
Reaction/Zone/Mass Flow Index
Entering
Species Index/ Step Number
Beginning Point
Reaction Index
Heat Loss/Flow Index
Existing Reverse
Radiation
Total Unburned Gas Cylinder Wall
Weibe Function
Fuels
Oxidizer
Area
Bounday Layer
High
/p vc c
auto
b
bl
cly
conv
f
flame
g
hti
inj
initial
k
loutr
rad
totaluw
weibe
Fuel
Oxidizer
ABL
H

Nomenclature
XIII
Low
Zone
LZ
Publications
XIV
Publications
The following publications have been achieved in relation to this research.
Zhen, Liu and Chen, Rui.; Multi-Zone Kinetic Model of Controlled Auto Ignition
Combustion, SAE World Congress & Exhibition, April 2009, Detroit, MI, USA. SAE
2009-01-0673
Zhen, Liu and Chen, Rui (2009) 'A Zero-Dimensional Combustion Model with
Reduced Kinetics for SI Engine Knock Simulation', Combustion Science and
Technology, 181:6, 828-852
Contents
XV
Contents
Abstract I
Figure List III
Table List VII
Dedication VIII
Nomenclature IX
Publications XIV
Contents XV
Chapter One: Introduction 1
1.1 Motivation ............................................................................................................... 1 1.2 Goals and Scope of Present Work .......................................................................... 4
Chapter Two: Literature Survey on SI Engine Knock 8
2.1 Introduction ............................................................................................................. 8 2.2 Spark Ignition Engine Combustion and Knock ...................................................... 10 2.3 Factors that Affect Engine Knock .......................................................................... 11 2.4 Knock Theories ..................................................................................................... 13
2.4.1 End-Gas Autoignition .................................................................................... 13 2.4.1.1 Autoignition Sites ..................................................................................... 14 2.4.1.2 Autoignition Modes .................................................................................. 15 2.4.1.3 Autoignition Chemistry ............................................................................. 16 2.4.1.4 Modelling of End-Gas Autoignition ........................................................... 21
2.4.2 End-Gas Detonation ...................................................................................... 23 2.4.3 Surface Ignition ............................................................................................. 23
2.5 Fuel Effect............................................................................................................. 24 2.5.1 Octane Number ............................................................................................. 24 2.5.2 Chemical Interpretation of Octane Number.................................................... 25 2.5.3 Fuel Additives ................................................................................................ 26
2.6 Knock Detection .................................................................................................... 27 2.7 Summary .............................................................................................................. 27
Chapter Three: Literature Survey on HCCI Combustion and engines 29
3.1 HCCI Combustion and Engines ............................................................................ 29 3.1.1 Definition of HCCI combustion ....................................................................... 29
3.2 Fundamental Principles of HCCI Combustion ....................................................... 30 3.3 Characteristics of HCCI combustion...................................................................... 31
3.3.1 Advantage of HCCI combustion .................................................................... 31 3.3.1.1 In Comparison to SI engines .................................................................... 31
Contents
XVI
3.3.1.2 In Comparison to CI engines ................................................................... 32 3.3.1.3 Additional advantages ............................................................................. 33 3.3.1.4 Summary ................................................................................................. 34
3.3.2 Challenges of HCCI combustion .................................................................... 35 3.3.2.1 Hydrocarbons and Carbon Monoxide (HC and CO) ................................. 35 3.3.2.2 Control of Combustion Phasing and Rate ................................................ 35 3.3.2.3 Operation Range ..................................................................................... 36 3.3.2.4 Homogeneous Mixture Preparation ......................................................... 37 3.3.2.5 Cold-Start Capability ................................................................................ 37 3.3.2.6 Summary ................................................................................................. 38
3.4 Research Work in HCCI Engines .......................................................................... 38 3.4.1 Fundamental Studies .................................................................................... 39 3.4.2 Technologies in HCCI engine ........................................................................ 41
3.4.2.1 Variable Compression Ratio (VCR).......................................................... 41 3.4.2.2 Variable Valve Timing (VVT) .................................................................... 42 3.4.2.3 Supercharging and Turbocharging ........................................................... 43 3.4.2.4 Stratified Charge ...................................................................................... 44 3.4.2.5 Direct Injection (DI) .................................................................................. 45
3.4.3 Engine-Input Parameters ............................................................................... 46 3.4.3.1 Fuel Composition ..................................................................................... 47 3.4.3.2 EGR......................................................................................................... 47 3.4.3.3 Inlet temperature...................................................................................... 48 3.4.3.4 Air-Fuel Equivalent Ratio (AFER) ............................................................ 49 3.4.3.5 Coolant Temperature ............................................................................... 49 3.4.3.6 Fuel Additives .......................................................................................... 50
3.5 Modelling Methods on HCCI combustion .............................................................. 50 3.5.1 Single-Zone Models ...................................................................................... 51 3.5.2 Multi-Zone Models ......................................................................................... 52 3.5.3 Multi-Dimensional CFD Models ..................................................................... 57
3.6 Summary .............................................................................................................. 59
Chapter Four: Chemical Kinetics 61
4.1 What is ‘Chemical Kinetics’ ................................................................................... 61 4.2 Rates, Rate laws and Rate Constants................................................................... 61
4.2.1 Global Reactions ........................................................................................... 62 4.2.2 Elementary Reactions ................................................................................... 62
4.2.2.1 Unimolecular reactions ............................................................................ 62 4.2.2.2 Bimolecular reactions .............................................................................. 63 4.2.2.3 Termolecular reactions ............................................................................ 63 4.2.2.4 Rate Constant .......................................................................................... 63
4.2.3 Chain Reactions ............................................................................................ 64 4.2.3.1 Chain Reaction Mechanisms ................................................................... 64 4.2.3.2 Reaction Rates ........................................................................................ 65 4.2.3.3 Matrix and Notation Expression ............................................................... 66
4.3 Chemical Kinetics of Hydrocarbon Autoignition ..................................................... 67 4.3.1 Gasoline Composition ................................................................................... 68 4.3.2 Gasoline Surrogates ...................................................................................... 68 4.3.3 Hydrocarbon Oxidation Chemistry ................................................................. 70 4.3.4 The Oxidation of N-Heptane .......................................................................... 70
4.3.4.1 Low Temperature Regimes ...................................................................... 71 4.3.4.2 Intermediate Temperature Regimes......................................................... 74 4.3.4.3 High Temperature Regimes ..................................................................... 75
4.3.5 The Oxidation of Iso-octane .......................................................................... 77
Contents
XVII
4.3.6 Summary ....................................................................................................... 79 4.4 Chemical Kinetics Model of Combustion ............................................................... 80
4.4.1 Detailed Chemical kinetics models ................................................................ 80 4.4.2 Lumped Chemical Kinetics Model ................................................................. 81 4.4.3 Reduced Chemical Kinetics Model ................................................................ 81 4.4.4 Skeletal Chemical Kinetics Model .................................................................. 82 4.4.5 Global Chemical Kinetics Model .................................................................... 85 4.4.6 Summary ....................................................................................................... 85
Chapter Five: Modelling of Multi-zone Chemical Kinetics 87
5.1 Introduction ........................................................................................................... 87 5.1.1 CFD Approach .............................................................................................. 87 5.1.2 Zero-Dimensional Approach .......................................................................... 88
5.2 Mathematical Description of Multi-Zone Modelling ................................................ 89 5.2.1 Governing Equations ..................................................................................... 90
5.2.1.1 Ideal Gas Law .......................................................................................... 90 5.2.2 Conservation of Mass .................................................................................... 90 5.2.3 Conservation of Species ................................................................................ 91 5.2.4 Conservation of Energy ................................................................................. 93
5.2.4.1 Internal Energy ........................................................................................ 93 5.2.4.2 Pressure .................................................................................................. 96 5.2.4.3 Volume .................................................................................................... 98 5.2.4.4 Heat Transfer ........................................................................................... 98
5.2.5 Summary ..................................................................................................... 100 5.3 Numerical Methods and Computation of Chemical kinetics ................................. 102
5.3.1 Introduction ................................................................................................. 102 5.3.2 Stiffness in Solution of ODEs of chemical kinetics ....................................... 103 5.3.3 Solution Methods......................................................................................... 104 5.3.4 Numerical Code Packages .......................................................................... 106
5.3.4.1 Livermore Solver for Ordinary Differential Equations (LSODE) .............. 106 5.3.4.2 Variable-coefficient Ordinary Differential Equation solver (VODE) ......... 107 5.3.4.3 Differential Algebraic Sensitivity Analysis Code (DASAC) ...................... 108 5.3.4.4 Summary ............................................................................................... 108
Chapter Six: Loughborough University Chemical Kinetics Simulation (LUCKS) Code 110
6.1 Introduction ......................................................................................................... 110 6.1.1 Why is FORTRAN Used? ............................................................................ 111
6.2 Code Structure .................................................................................................... 113 6.2.1 Interpreter.................................................................................................... 114
6.2.1.1 Chem.inp and therm.dat ........................................................................ 114 6.2.1.2 Chem.bin and chem.out ......................................................................... 115
6.2.2 Main Program .............................................................................................. 115 6.2.3 Module Library ............................................................................................ 118 6.2.4 Subroutine Libraries .................................................................................... 118
6.2.4.1 Variable-coefficient Ordinary Differential Equation solver ....................... 118 6.3 LUCKS Data File................................................................................................. 119
6.3.1 Input data .................................................................................................... 119 6.3.2 Output data ................................................................................................. 119
6.4 Units ................................................................................................................... 120
Chapter Seven: Chemical Kinetics Modelling of SI Engine Knock 121
7.1 Introduction ......................................................................................................... 121
Contents
XVIII
7.2 The Model ........................................................................................................... 123 7.2.1 Basic Model ................................................................................................. 124
7.2.1.1 Mass Conservation ................................................................................ 124 7.2.1.2 Energy Conservation ............................................................................. 125 7.2.1.3 Heat Transfer ......................................................................................... 125 7.2.1.4 Mass Fraction Burned ............................................................................ 127
7.2.2 Kinetic Mechanism ...................................................................................... 127 7.2.3 Equilibrium Burning Zone ............................................................................ 130 7.2.4 Numerical Solver ......................................................................................... 130
7.3 Model Validation ................................................................................................. 131 7.3.1 Tests and Knock Identification ..................................................................... 131 7.3.2 Validation .................................................................................................... 135
7.4 Model Calculations.............................................................................................. 143 7.5 Summary and Conclusions ................................................................................. 147
Chapter Eight: Multi-Zone Kinetic Modelling of HCCI Combustion 148
8.1 Introduction ......................................................................................................... 148 8.2 Model Formulation .............................................................................................. 149
8.2.1 Major Assumptions ...................................................................................... 150 8.2.2 Governing Equation ..................................................................................... 150 8.2.3 Mass Mixing ................................................................................................ 152 8.2.4 Blowby ........................................................................................................ 153 8.2.5 Chemical Kinetic Mechanism....................................................................... 154 8.2.6 Numerical Solution Strategy ........................................................................ 155 8.2.7 Thermodynamic Mixing Model ..................................................................... 156 8.2.8 Initial Calculation Conditions........................................................................ 156 8.2.9 Average In-cylinder Temperature ................................................................ 161
8.3 Results and Validation ........................................................................................ 161 8.4 Summary and Conclusions ................................................................................. 176
Chapter Nine: Concluding Remarks 177
9.1 Summary ............................................................................................................ 177 9.2 Recommendation for Future Work ...................................................................... 184
Appendix A: Introduction of Internal Combustion Engine 187
A.1. Definition and classification of Internal Combustion Engines ............................. 187 A.2. Engine Types .................................................................................................... 189
A.2.1. SI Engines ................................................................................................ 189 A.2.2. CI engine ................................................................................................... 192 A.2.3. HCCI combustion ....................................................................................... 193
A.3. Fuel ................................................................................................................... 193 A.3.1. Working cycles ........................................................................................... 194 A.3.2. Four-Stroke Engine .................................................................................... 194 A.3.3. Two-Stroke Engine .................................................................................... 195
A.4. Ignition Types .................................................................................................... 196 A.5. Mixture Generation ............................................................................................ 197
Appendix B: The CHEMKIN-Formatted Chemical Kinetic Mechanism by Tanaka, et al. 198
Appendix C: The sub-mechanism Reactions for Simulating NOX Chemistry 200
Appendix D: Flowchart of Algorithm of Initial Condition Setting 201
Bibliography 202
Chapter One: Introduction
Page 1
Chapter One: Introduction
1.1 Motivation
Autoignition phenomenon in spark ignition (SI) engines was first recognized in the
early 1900’s, which is the major cause of engine knock that is identified as a
limitation on engine output and fuel efficiency. Since then, the understanding of
autoignition is restricted to its negative impact on the new design of SI engines. Many
potential approaches for improving SI engine performance and reducing emissions
such as increasing compression ratios, boosting inlet pressure and raising EGR
temperature are limited by their undesirable contribution to engine knock
Autoignition has been regarded as the setback for gasoline engine development till
the emergence of a new combustion concept, Homogeneous Charge Compression
Ignition (HCCI). HCCI engines utilize homogeneous charge of gasoline and air as in
traditional spark ignition (SI) engines; however, the charge is compressed to
autoignite as in traditional compression ignition (CI) engines. This new combustion
concept provides the fuel efficiency as high as that in CI engines and the much lower
NOX and particulate emissions than that in SI engines. For the first time, autoignition
is applied positively as an ignition approach in gasoline engines.
In conclusion, the roles of autoignition in gasoline combustion engines have been
twofold: limitation to SI engines and solution to HCCI engines. Therefore,
tremendous research effort has been devoted to the study of autoignition.
Investigation of engine knock in SI engines aims at restraining knock either
mechanically by improving the chamber design or chemically by changing the
molecular structure of fuels. Research on HCCI combustion studies the
Chapter One: Introduction
Page 2
characteristics of autoignition and the relative influential factors so that the ignition
timings and combustion rates can be controlled for consistent application.
Autoignition is acknowledged as a phenomenon, in which a combustible mixture of
fuel and oxidizer reacts in a self-accelerating manner, and eventually spontaneously
ignite leading to combustion. This ignition process is kinetically driven by the
chemical reactions of fuel-air mixture rather than externally supplied ignition sources.
When the energy released from the oxidation of hydrocarbon fuels is larger than the
heat lost to the surroundings, the temperature of the mixture gradually increases and
accelerates at temperatures high enough to supply the activation energy for the
thermal explosion. Both of the physical and chemical properties of the mixture are
critical to the autoignition process.
In SI and HCCI engines, autoignition occurs in different combustion scenarios. In SI
engines, chemical reactions with heat release occur in the end gas ahead of the
advancing flame front as the result of the combination of compression from piston
motion and the propagating flame front. This raises the temperature of the end gas to
a thermally and chemically stressed condition triggering autoignition that produces a
rapid rise in local temperature and pressure. The autoignition process is thus
significantly influenced by the flame propagation speed and thermal properties of the
end gas. However, in HCCI engines, combustion is initiated by autoignition of the in-
cylinder charge, which is dominated by local chemical-kinetic reactions with no
requirement for flame propagation. Therefore, temperature of in-cylinder charge has
a considerable effect on the combustion process due to the sensitivity of chemical
kinetics to temperature.
Though studies of autoignition in SI and HCCI engines have involved a lot of
research effort, research progress is still limited by inadequate understanding of the
physical and chemical processes that lead to autoignition. It has been a big challenge
to characterize autoignition due to the complexity involved in the physical and
chemical process. Modelling of autoignition in SI and HCCI engine is to address both
the physical and chemical processes so that the autoignition behaviour can be
theoretically described and numerically characterized. Moreover, modelling work in
relation with autoignition chemistry provides a convenient tool in engine design and
development in terms of control of the chemical kinetic behaviour of hydrocarbon
combustion.
Chapter One: Introduction
Page 3
Combustion chemistry of gasoline used in SI and HCCI has been widely studied and
can be generally interpreted as an oxidation process of hydrocarbon fuels involving a
series of complex degenerate chain branching, carrying and terminating reactions
with stable and intermediate radical species. Chemical kinetics modeling has been
investigated and acknowledged as an important tool in the analysis of the rates of
chemical processes and the factors that affect these rates. A chemical kinetics model
contains the important elementary reactions and individual species and uses the best
available rate parameters and thermochemical data. The size of such a model is
decided by the numbers of reactions and species included in the model, which
ranges from reduced models with only a few species and reaction steps to detailed
models consisting of hundreds of chemical species and thousands of reactions.
One of the major challenges in using chemical kinetics models is the uncertainties in
the selection of species, reactions and rate parameters. Most of the available models
can only be validated over a rather limited range of conditions. When necessary and
possible, optimization of the reaction rate parameters has to be conducted to improve
the fit of modeling results against experimental data. However, it will suffer from
expensive computation resource even for the models of moderate size, for example,
containing a few hundreds of parameters, which could turn the number of algorithm
dimensions to hundreds or even thousands. Another challenge for applying chemical
kinetics modeling comes from the concern over computation cost. The computational
power of modern computers has not been developed well enough to handle in an
efficient and effective manner the chemical kinetics calculation in cooperation with
multidimensional modeling. In the simulation of combustion in SI or HCCI engines,
the integration of computational fluid dynamics (CFD) model with detailed chemical
kinetics models, theoretically, provides unparalleled simulation accuracy and details
in presenting combustion chamber geometries and combustion behaviour. However,
numerical modeling of this scale requires substantial computer resources. Though, a
few CFD codes such as FLUENT, CHEMKIN-CFD etc. have been equipped with
some kind of chemistry models, but the size of the models implemented are limited to
a much-reduced level. Moreover, the computational time of this approach is still
costly and unacceptable for both engine research and design.
To the challenges presented above, one of the solutions could be integration of the
downsized chemical kinetics models into the zero-dimensional multi-zone models
that can describe adequately the in-cylinder combustion scenarios in SI and HCCI
Chapter One: Introduction
Page 4
engines. Firstly, in contrast to the prevailing single zone models, the multi-zone
approach stands out through taking account of the inhomogeneity of the in-cylinder
mixture by dividing the combustion chamber into multiple zones and models the
zonal changes of volume and mass caused by the in-cylinder flow dynamics. When
coupled with chemical kinetics models, multi-zone modelling is capable of describing
chemically the combustion process so that the major characteristics of autoignition
such as ignition timing and heat release rate etc. can be more accurately predicted.
With chemical kinetics modelling, in addition, emissions e.g. CO and HC can be
better modelled in multi-zone models.
Secondly, the multi-zone models represent much lower computational cost in
comparison with the CFD approach. Even though Incorporation with detailed
chemical kinetics models may result in increased computation time over reduced
chemical models, it is still of time scales of tens of minutes to hours, which is more
reasonable and acceptable in contrast to the computational cost by the approach
coupling CFD and chemical kinetics.
Finally, though chemical kinetics modelling has prevailed in simulating kinetic
combustion processes since the last two decade, research work on its incorporation
into thermodynamic modeling of IC engine is lagging. The major hindrance used to
be the inadequate understanding of combustion chemistry under IC engine
combustion conditions and the underdevelopment of chemical kinetics models of the
real fuels used in IC engines. However, with advances in relevant knowledge and
computer-aided technologies in developing downsized kinetic models, it has been
achievable task for researchers to develop multi-zone chemical kinetics models.
This research work consequently puts emphasis on incorporation of chemical kinetics
models with zero-dimensional multi-zone models in the simulation of SI and HCCI
combustion so that autoignition behaviours in both types of combustion processes
can be better understood and numerically described.
1.2 Goals and Scope of Present Work
The overall purpose of this study was to establish, develop and program multi-zone
chemical kinetics models for the simulation of combustion processes in SI and HCCI
engines.
Chapter One: Introduction
Page 5
The model for SI combustion is to develop a diagnostic tool for engine knock
analysis. The incorporation of chemical kinetics with three-zone thermodynamic
model (burned, unburned and burning) provides an approach of simulating the
thermodynamic states of the three zones under knocking conditions. Through the
model, the major knock characteristics (i.e. knock tendency and knock onset timing,
etc.) can be predicted and related influential factors (i.e. spark timings and air-fuel
ratios, etc) can be analyzed and investigated.
The model for HCCI combustion is to simulate HCCI combustion process in
consideration of inhomogeneous distribution of in-cylinder temperature and mixture
compositions. The effort is mainly put on the application of chemical kinetics models
to provide chemical analysis of the autoignition-driven ignition process and the post-
ignition combustion processes, and the application of the zonal model to describe the
thermodynamic and physical behavior of the in-cylinder mixture during the
combustion. The developed model provides a numerical prediction method for
examining and studying ignition and combustion behaviors and emissions of major
products of interest. The results from the modeling work can help to improve the
understanding of HCCI combustion and provide important information on overcoming
the challenges limiting the HCCI engine as a standalone production engine and good
knowledge base for further computational studies and experimental work.
The achievements of both of the above objectives form the basis of the computer
simulation work for the ongoing project to investigate free piston engines that apply
constant volume autoignition as the ignition and combustion approaches. This new
engine type has the potential for high efficiency, low emissions, and low
manufacturing cost. Its main applications are likely to be in series hybrid vehicles and
portable power generation. The technology is based around a single-cylinder free-
piston internal combustion engine (ICE), which is run on a 4-stroke cycle, with an
integral linear electromagnetic machine and electromagnetically operated poppet
valves. By freeing the piston from crank shaft motion, it removes most of the
constraints of crankrod-slider internal combustion engines, and facilitates many
advanced combustion strategies - by enabling variable compression ratio operation,
throttle-free operation, different piston strokes during compression and expansion,
and other previously unattainable piston trajectories. Furthermore, a free-piston
engine is capable of operating on a variety of fuels. Last but not least, the HCCI
approach is adopted and applied to free-piston engines for the mixture ignition, so it
Chapter One: Introduction
Page 6
has a similar combustion scenario to HCCI engines, in which combustion is
dominated by chemical kinetic reactions.
So far, most of the available and validated computer codes for chemical kinetics
modeling of IC engine combustion apply single zone approaches such as the
SENKIN code in the CHEMKIN package. However, due to the assumption of the
homogeneous mixture properties and the ignorance of the mixture dynamics, it
suffers from its ability to predict major combustion characteristics such as heat
release rate, emissions, combustion completeness and peak cylinder pressure, etc.
Moreover, most software companies do not publish the source code of the developed
software, which disallows the end-users to get access to the core of the software.
This surely best protects the software companies’ interest, but it hinders the end-user
development to make modifications and additions to the software for more advanced
modeling. Therefore, another interest in this research work is to translate the
established model from the algorithm form into a computer program. The work is
oriented to develop a computer code of a well-designed structure so that it is easy for
end-users to read and revise. This computer code can be able to facilitate the
application, improvement and generalization of the developed multi-zone model.
The main objectives of this research work with relevant chapters in this thesis are
summarized as follows:
Review the studies of autoignition-driven combustion phenomenon in SI and
HCCI engines and the modelling and experimental work in the field. (Chapter
2 and 3)
Summarize the chemical kinetics theories and review the chemical kinetics
modelling work on hydrocarbon fuels in relation to its application in SI and
HCCI engines. (Chapter 4)
Compare and review the computation methods applied on engine combustion
modelling and develop the mathematical model of multi-zone chemical
kinetics simulation of SI and HCCI engines. (Chapter 5)
Investigate the numerical features of the system equations related with
chemical kinetics simulation. The numerical methods and codes for the
solution of the system equations are compared and discussed. (Chapter 5)
Develop and interpret the LUCKS code designed for the multi-zone chemical
kinetic simulation of SI and HCCI engine combustion. This is suggested to be
Chapter One: Introduction
Page 7
regarded as the core part of the research work. This code translates the
mathematical description of the multi-zone to the computer language and is
developed in a commercial-code-like style. (Chapter 6)
Evaluate the LUCKS_SI code in the simulation of SI engine knock and
validate the model through comparison of the simulation results against the
experimental results. (Chapter 7)
Divide the in-cylinder mixture according to their difference of
thermodynamic states and compositions.
Apply a reduced chemical kinetics model to model both post-flame
heat release and pre-flame autoignition.
Modify the reduced chemical kinetics model to improve its
prediction of autoignition characteristics under SI combustion.
Evaluate the LUCKS_HCCI code in the simulation of HCCI engine
combustion. (Chapter 8)
Model the inhomogeneity of in-cylinder mixture properties and
mass and energy transfer caused by mixture dynamics.
Validate the model against experimental results at various Internal
Exhaust Gas Re-circulation (IEGR) levels and investigate the
thermal and chemical effect of the IEGR on the HCCI combustion.
Summarize and conclude the work and make future recommendation.
(Chapter 9)
Chapter Two: Literature Survey on SI Engine Knock
Page 8
Chapter Two: Literature Survey on SI Engine Knock
2.1 Introduction
The spark ignition engines are still the main power source in the road vehicles
nowadays. However, with the increasing awareness of the dying-out of conventional
fuel supply and environmental issues, improving the efficiency of SI engines has
been the major research subject and a critical motivation in guiding engine design in
the automotive industry.
The thermal efficiency of a spark ignition engine can be improved by either
increasing compression ratio or boosting intake pressure through turbocharging or
supercharging. However, both of the approaches are limited by knocking combustion.
Compared with old-timed engines, modern engines have been designed to be more
compact with much increased compression ratios. However, further increase of
compression ratios is constrained by engine knock, which occurs when the end-gas
is over compressed at high compression ratios. Knock is also a significant barrier to
the design of high brake mean effective pressures (BMEP) engines through either
turbocharging or supercharging due to the high sensitivity of knock to intake
pressure.
Engine knock is an unacceptable combustion phenomenon causing unpleasant and
undesirable sound to the passengers in a vehicle and at a high enough intensity,
engine damage. Knock has been a long term problem for engine designers. It is
believed that occurrence of knock is associated with spontaneous ignition
(autoignition) of the unburned mixture ahead of the flame front before the arrival of
Chapter Two: Literature Survey on SI Engine Knock
Page 9
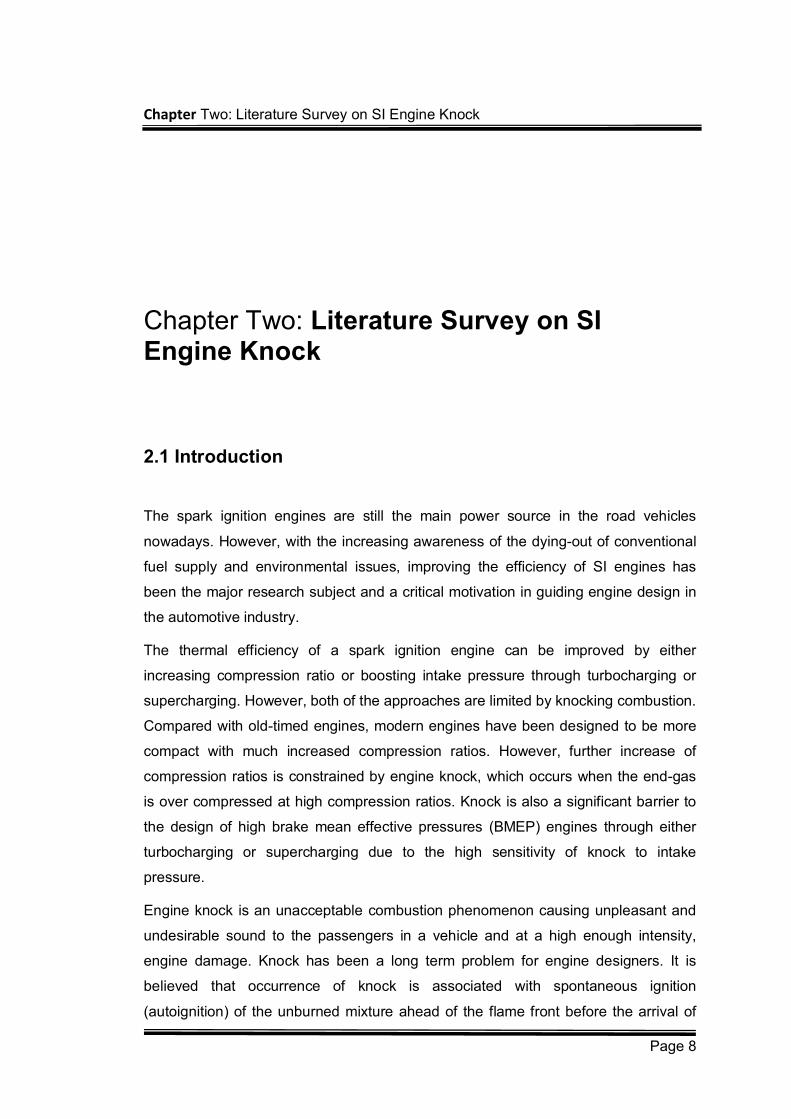
the propagating flame or preignition caused by the glowing combustion chamber
deposit [1]. Figure 2-1 compares the normal and abnormal combustion phenomenon
occurring in SI engines.
Figure 2-1: Comparison of normal (a) and abnormal (b and c) combustion phenomenon in SI engines [2].
Studies of engine knock have involved a lot of research effort in order to restrain
knock either mechanically by improving the chamber design or chemically by
changing the molecular structure of fuels. However, extension of knock limit in SI
Chapter Two: Literature Survey on SI Engine Knock
Page 10
engines is still limited by inadequate understanding of the physical and chemical
processes that lead to knock. It is also a big challenge to characterize knock further
due to the significant cyclic variation of knock characteristics. In addition, modelling
work is even farther lagged behind.
2.2 Spark Ignition Engine Combustion and Knock
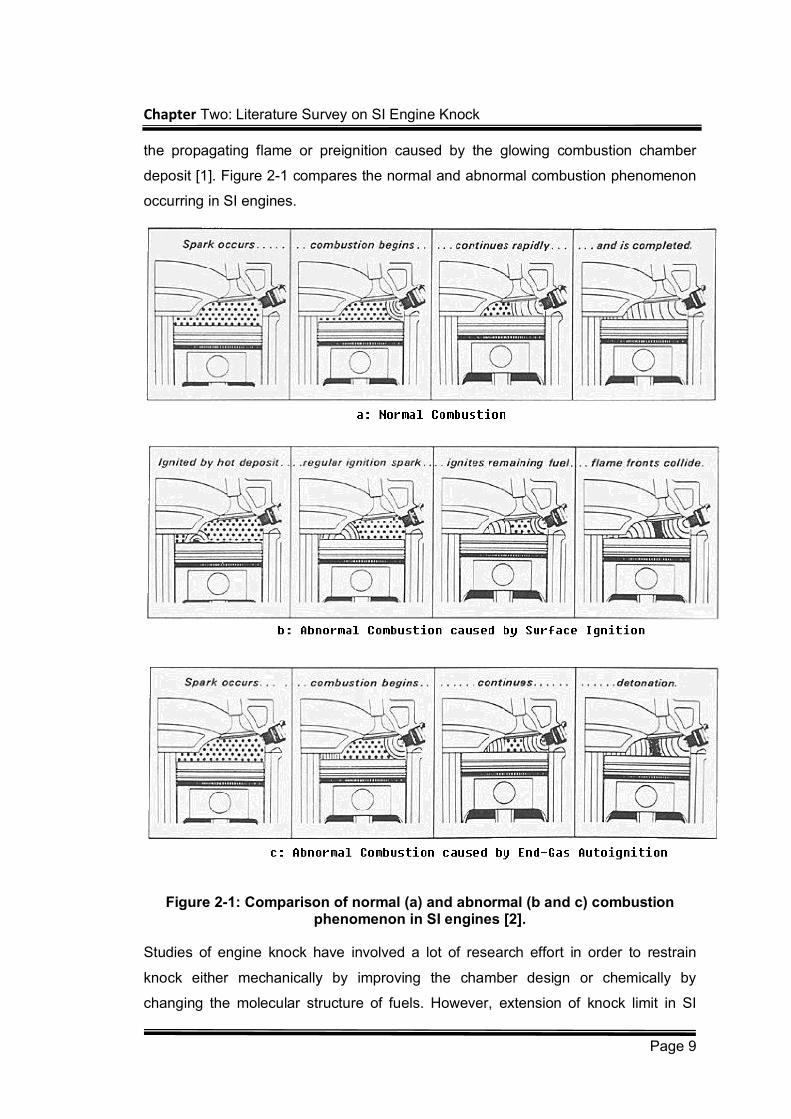
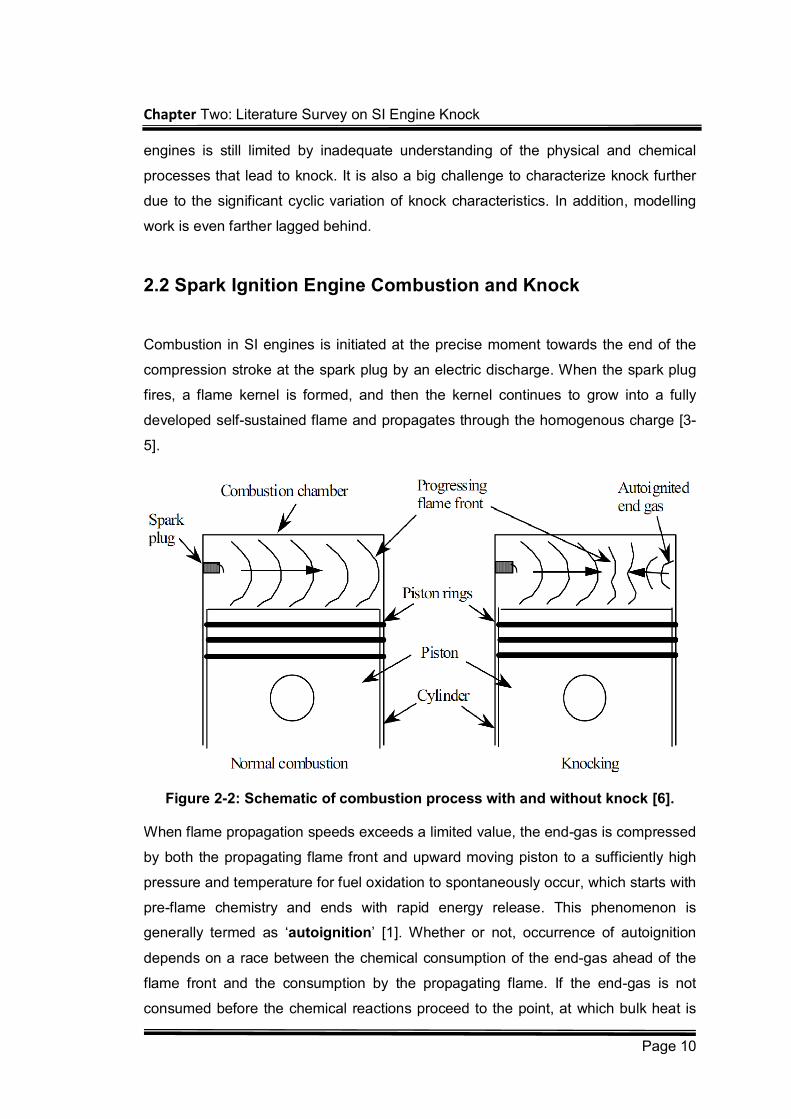
Combustion in SI engines is initiated at the precise moment towards the end of the
compression stroke at the spark plug by an electric discharge. When the spark plug
fires, a flame kernel is formed, and then the kernel continues to grow into a fully
developed self-sustained flame and propagates through the homogenous charge [3-
5].
Figure 2-2: Schematic of combustion process with and without knock [6].
When flame propagation speeds exceeds a limited value, the end-gas is compressed
by both the propagating flame front and upward moving piston to a sufficiently high
pressure and temperature for fuel oxidation to spontaneously occur, which starts with
pre-flame chemistry and ends with rapid energy release. This phenomenon is
generally termed as ‘autoignition’ [1]. Whether or not, occurrence of autoignition
depends on a race between the chemical consumption of the end-gas ahead of the
flame front and the consumption by the propagating flame. If the end-gas is not
consumed before the chemical reactions proceed to the point, at which bulk heat is
Chapter Two: Literature Survey on SI Engine Knock
Page 11
rapidly release, the resulting autoignition causes sharp increase of local
temperatures and pressures. Figure 2-2 compares the combustion processes with
and without knock.
A pressure wave then spreads outwards from the location of autoignition at a sound
speed of sound and resonates within the engine cylinder. The pressure oscillations
cause vibration of the head and block, resulting in a clanging or pinging sound.
Knock is the term used to describe such physical manifestations. Audible knock is
not acceptable, and the high local temperatures and pressures associated with heavy
knock can cause engine damage. Autoignition of the end-gas limits the compression
ratios in a position to achieve higher combustion efficiency and severe autoignition
leads to knock, deteriorates engine efficiency, and thereby increases emissions.
Since knock causes damage to engine body and bring uncomfortableness to vehicle
passengers, engine design and operating parameters have to be adjusted for its
avoidance. It has been acknowledged that severe knock is subject to occur at high
load, which creates high peak pressures, and low engine speed, which provides a
long residence time for autoignition chemistry of the end-gas. In prevention of knock,
peak in-cylinder pressure has to be reduced. For this, spark ignition delay has been
widely applied to move location of peak pressure away from TDC position. However,
over-delayed sparking ignition-timing leads to reduction of the forces from the ignited
mixture on the downward piston, so to the engine torque and efficiency, and an
increase of exhaust temperatures. To balance the avoidance of knock and
achievement of maximum engine efficiency, compression ratios and boosted intake
pressure have to be limited with sacrifice of their best benefit in improving engine
efficiency.
2.3 Factors that Affect Engine Knock
The chemical kinetic reaction rates of the end-gas are dependent on temperature;
however temperature is interactively affected by pressure. The following
thermodynamic expression describes the P-T relationship for an adiabatic
compression process.
Chapter Two: Literature Survey on SI Engine Knock
Page 12
1
initial
initialp
pTT (2-1)
Where is specific heat ratio and the subscript initial indicates the beginning point
of compression stroke. Equation 2-1 dictates that an increase of end-gas pressure
increases end-gas temperature, which in turn increases reaction rates. Any factor
having influence on temperature and pressure therefore affects the thermodynamic
and chemical kinetic states of the end-gas. Many factors are considered important in
relation to autoignition development and knock. The following is a brief description of
some of these factors [1,7-9]:
Spark Timing – Change of ignition timings affects combustion phasing.
Retarded ignition timings cause lower overall in-cylinder pressure because the
combustion phasing is shifted away from the TDC position, which leads to the main
combustion with major heat release occurs within a larger and faster expanding
volume as the piston is moving downward. As a contrast, advanced spark timings
causes earlier combustion that results in higher cylinder pressures. Knock
occurrence is more subject to earlier spark timings because of the maximum end-gas
temperature is increased.
Compression Ratio – With increased compression ratios, the volume swept
by the piston during the compression and combustion phases becomes smaller. This
leads to more intense compression on the end-gas and higher heat release from the
mixture. As a result, a higher compression ratio increases cylinder pressure and end-
gas temperatures.
Air-Fuel Ratio – At different AFRs, the in-cylinder mixture shows different
combustion strength. Change of the mixture composition and thermodynamic
properties affects combustion rates and the energy release, which in turn affects
cylinder pressure and end-gas temperatures.
Intake Pressure - A higher intake pressure forces a larger amount of air-fuel
mixture into the cylinder with higher initial pressure and volumetric efficiency cylinder,
which consequently leads to higher overall in-cylinder pressure and combustion
temperature.
EGR - Using EGR increases the total heat capacity of the end-gas and
consequently reduces the temperature rise of the gas, which thermally diminishes
Chapter Two: Literature Survey on SI Engine Knock
Page 13
knock tendency. However, the large number of reactive species present in the
exhaust gas can also promote autoignition by chemical means.
Engine Speed - The chemical reactions of the end-gas takes time to
proceed. At lower engine speeds, flame propagating speed become equivalent to or
slower than the reaction characteristic time, so autoignition reactions is more likely to
build up and advance.
Charge Preparation – The flow dynamic motion (turbulence, swirl, and
tumble) affects the homogeneity of the mixture, which has a significant effect on
combustion process. Local inhomogeneities of the mixture could lead to incomplete
combustion or regionally high combustion temperature.
Combustion Chamber Geometry - The general shape of the combustion
chamber, as well as spark plug location, affects the flame front area and the distance
the flame front travels. Longer flame travel distance results in longer combustion
duration and more time for autoignition chemistry to proceed.
Intake Temperature – It can be deduced from equation 2-1 that mixture
temperature in the compression process scales closely with initial temperature.
Higher initial temperatures lead to higher overall mixture temperatures throughout the
compression and combustion processes, which promote the rates of autoignition
reactions
2.4 Knock Theories
The cause of knock has been a research subject provoking many arguments.
However, there is no yet a general agreement on the explanation of SI engine knock.
Throughout the literatures, two major theories have been established and common
accepted to explain knock phenomenon: autoignition theory, detonation theory
and surface ignition.
2.4.1 End-Gas Autoignition
Autoignition in SI engines is the spontaneous self-ignition of the fuel-air mixture in the
combustion chamber associated with high chemical reaction rates and heat release
rates [1]. In the compression stroke, the in-cylinder mixture is compressed by the
upward moving piston and the temperature is gradually increased until the spark plug
Chapter Two: Literature Survey on SI Engine Knock
Page 14
ignites the mixture at a certain crank angle position before TDC. The burned gases
then expand in a form of propagating flame. As a result, the unburned gas in front of
the flame front is compressed by both the movement of the piston and flame
propagation. When the piston passes the TDC and moves downwards, the
compression of the flame propagation is offset a bit, but the flame propagates at a
higher speed than that of the piston in the early stage of the expansion stroke, so the
unburned gas is still under compression. During the compression of the unburned
gas, temperature and pressure gradually increases and the low temperature
chemistry for the hydrocarbon fuels is initiated to produce accumulative reactive
products that can lead to explosive autoignition when the temperature is increased to
a critical value. Once the autoignition starts, it is accompanied by rapid energy
release and sharp increase of temperature and pressure. Autoignition is a complex
chemical process that involves thousands of reaction steps at different temperature
regions [10-12]. Details of autoignition chemistry are provided in Chapter 4.
2.4.1.1 Autoignition Sites
Studies [13,14] claim that autoignition sites of the end-gas in SI engines are located
at discrete exothermic centres (exothermic centres), from which autoignition chemical
reactions proceed and propagate. Formation of autoignition centres can be caused
by both temperature and composition heterogeneity. Temperature heterogeneity
could arise from surface hot spots and inhomogeneously distributed gas residuals, or
deposit, or temperature gradients due to heat transfer with cylinder wall, or from a
combination of these. The inhomogeneity of the mixture composition may result from
imperfect mixing of the mixture of fuel, air and/or residual gases.
Later study from Hajireza and Konig [15] further confirmed the above point. They
investigated the appearance of exothermic centres caused by inhomogeneities within
the end-gas of SI engines. It is found that the gas near the exothermic centre is pre-
reacted to produce products and intermediate products from low-and high-
temperature reactions. As a result, a radical pool is formed as a reaction centre and
reaction front propagates from this centre with a velocity of several meters per
second. The velocity increases with decreasing temperature gradients in the
inhomogeneous mixture.
Sheppard and Konig [14] concluded that autoignition centres occur either close to
main flame where they engulfed by the flame, by the chamber or at random location
Chapter Two: Literature Survey on SI Engine Knock
Page 15
in the end-gas. Griffiths et al [16] showed that the sites at which autoignition occur
are related to compression temperature, gas motion and associated heat transfer
taking place in the chamber. Schrieber er al [17] found that at both low and high bulk
end-gas temperatures the autoignition centres occurred in the adiabatic core,
because the local gas temperature in this region was higher than at the chamber
wall.
In a recent study, Nobuyuki et al [221] use a high-speed video camera to visualize
flame propagation and autoignited kernels in the end-gas at knocking combustion.
They found that auto-ignited kernels appeared near a negative curvature of the flame
front, which related to low-temperature chemistry. The large amount of unburned
mixture generated a strong pressure wave caused by the auto-ignited kernels
explosion. Visualized images of a regular propagating flame front and auto-ignited
kernels
2.4.1.2 Autoignition Modes
Theoretical studies [14,19-21] have suggested that in terms of magnitude of
temperature gradients about autoignition centres, three autoignition modes can be
identified as deflagration, thermal explosion and developing detonation. The
three modes are characterized as follows;
2.4.1.2.1 Deflagration
In the deflagration mode, autoignition chemistry occurs takes places at low end-gas
temperature and results in steep temperature gradient (>100K/mm). The reaction
centre undergoes a sequent steady transition from an initial radical pool to a
deflagration site and then to a propagating flame into the surrounding regions of the
unburned gas. A weak pressure wave resulted from the temperature gradient then
propagates away from the centre, but the resultant pressure wave attenuates as it
propagates into the unburned gas. Deflagration of the end gas does not cause
influence on autoignition chemistry of the other reaction centres, and leads to little or
no knock and may actually be beneficial to combustion completion and clearance of
unburned hydrocarbon left throughout engine cycles.
2.4.1.2.2 Thermal Explosion
Thermal explosion occurs at high end-gas temperature with small temperature
gradients around the autoignition reaction centre. In this mode, the chemical
reactions proceed in a high reaction speed and leads to a simultaneous autoignition
Chapter Two: Literature Survey on SI Engine Knock
Page 16
throughout the end-gas. As a result of fast heat release, it is likely to produce strong
pressure waves and moderate or strong knock. However, there is no coalescence of
pressure and reaction fronts, so the pressure waves resulted from this autoignition
mode not intense enough to cause major engine damage.
2.4.1.2.3 Developing Detonation
The developing detonation occurs at moderate end gas temperatures with moderate
temperature gradients. As there is insufficient time or space for a detonation to fully
develop, this mode is described as a developing detonation. In this mode, the
autoignition reaction front propagates at approximately the acoustic velocity and
becomes coupled with pressure waves leading to mutual enhancement. The latter is
damaging. A developing detonation comprises supersonic combustion with very high
peak pressures, which, although short lived, may cause damage to the engine, as is
observed with severe conventional spark ignition engine knock. Of the three, it is the
mode that can lead to the most damaging form of knock.
2.4.1.3 Autoignition Chemistry
The unburned gas starts to get chemically active the moment the compression
process begins. Chemical reactions steadily proceeds, but at rather low rates. With
the ignition of the unburned mixture, a flame then begins to propagate across the
chamber and impose further compression on the unburned gas (end-gas), which
promotes the chemical reaction rates of the end-gas. Under normal operation, the
chemistry in the end-gas will stay steady and only consumes very a small fraction of
the unburned gas. However, under extreme conditions when pressure or temperature
exceeds a critical level, the chemical reactions of the end-gas will accelerate and
release significant amount of heat that is greater than what can absorbed by the
surroundings, which then leads to a full-scale autoignition of the end-gas.
It has been widely acknowledged that oxidation of hydrocarbon fuels is a complex
chemical reaction process involving a large number of simultaneous, interdependent
and intermediate species and reactions. The process is normally initiated from a
group of reactions abstracting H atoms from or decomposing the hydrocarbon
molecules to produce highly reactive intermediate species (radicals). This is then
followed by propagation reactions where the generated radicals react with the
reactant molecules to form products and other radicals. Propagation reactions are
characterised by producing more radicals than the ones they consumed, which is
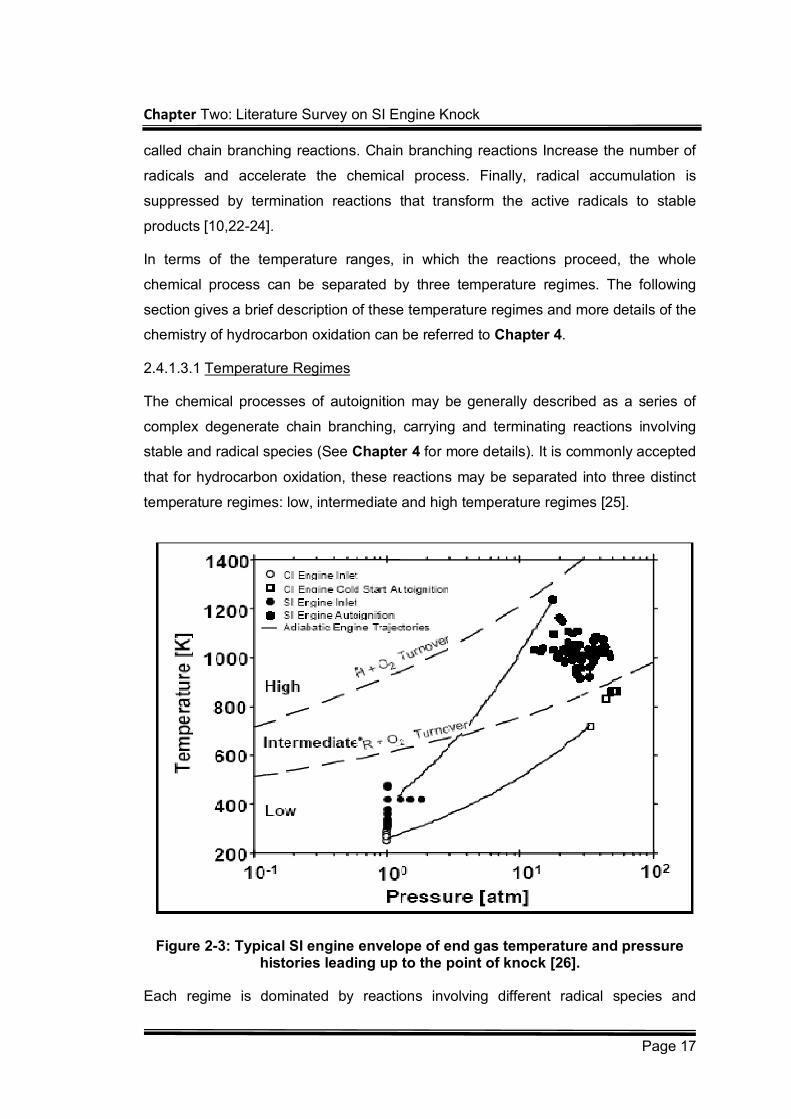
Chapter Two: Literature Survey on SI Engine Knock
Page 17
called chain branching reactions. Chain branching reactions Increase the number of
radicals and accelerate the chemical process. Finally, radical accumulation is
suppressed by termination reactions that transform the active radicals to stable
products [10,22-24].
In terms of the temperature ranges, in which the reactions proceed, the whole
chemical process can be separated by three temperature regimes. The following
section gives a brief description of these temperature regimes and more details of the
chemistry of hydrocarbon oxidation can be referred to Chapter 4.
2.4.1.3.1 Temperature Regimes
The chemical processes of autoignition may be generally described as a series of
complex degenerate chain branching, carrying and terminating reactions involving
stable and radical species (See Chapter 4 for more details). It is commonly accepted
that for hydrocarbon oxidation, these reactions may be separated into three distinct
temperature regimes: low, intermediate and high temperature regimes [25].
Figure 2-3: Typical SI engine envelope of end gas temperature and pressure histories leading up to the point of knock [26].
Each regime is dominated by reactions involving different radical species and
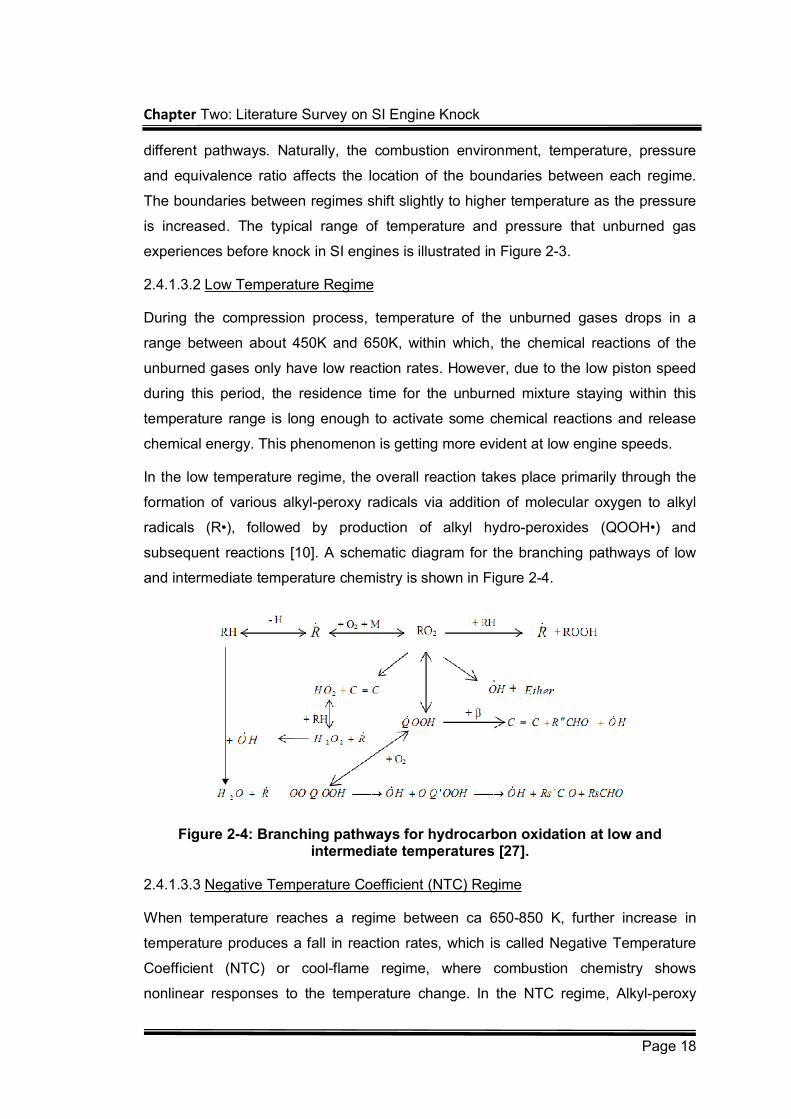
Chapter Two: Literature Survey on SI Engine Knock
Page 18
different pathways. Naturally, the combustion environment, temperature, pressure
and equivalence ratio affects the location of the boundaries between each regime.
The boundaries between regimes shift slightly to higher temperature as the pressure
is increased. The typical range of temperature and pressure that unburned gas
experiences before knock in SI engines is illustrated in Figure 2-3.
2.4.1.3.2 Low Temperature Regime
During the compression process, temperature of the unburned gases drops in a
range between about 450K and 650K, within which, the chemical reactions of the
unburned gases only have low reaction rates. However, due to the low piston speed
during this period, the residence time for the unburned mixture staying within this
temperature range is long enough to activate some chemical reactions and release
chemical energy. This phenomenon is getting more evident at low engine speeds.
In the low temperature regime, the overall reaction takes place primarily through the
formation of various alkyl-peroxy radicals via addition of molecular oxygen to alkyl
radicals (R•), followed by production of alkyl hydro-peroxides (QOOH•) and
subsequent reactions [10]. A schematic diagram for the branching pathways of low
and intermediate temperature chemistry is shown in Figure 2-4.
Figure 2-4: Branching pathways for hydrocarbon oxidation at low and intermediate temperatures [27].
2.4.1.3.3 Negative Temperature Coefficient (NTC) Regime
When temperature reaches a regime between ca 650-850 K, further increase in
temperature produces a fall in reaction rates, which is called Negative Temperature
Coefficient (NTC) or cool-flame regime, where combustion chemistry shows
nonlinear responses to the temperature change. In the NTC regime, Alkyl-peroxy
Chapter Two: Literature Survey on SI Engine Knock
Page 19
radicals (RO2•) become unstable and react reversely to the oxidation of alkyl radicals
(R•+ O2 <=> RO2•) and another reaction pathway for the consumption of alkyl
radicals (R•) become competitive, which produces more stable C=C and HO2• and
leads to consequently a retarded chain branching of the reactions [10,11,28].
Through the NTC regime, the chemistry moves from the low temperature regime to
intermediate temperature regime and then to the final ignition. Thus, NTC behaviour
is important in controlling this transition and the chemical reactions in the NTC
regime play a critical role in determining ignition induction time and ignition timing.
2.4.1.3.4 Intermediate Temperature Regime
As the temperature increases, the chemistry enters intermediate temperature regime
(ca. 800-1000K) and the NTC region eventually disappears. In this regime,
autoignition chemistry is dominated by the reactions of HO2• radicals to produce
H2O2 radicals that decompose as rapidly as they are formed and produce OH
radicals that are responsible for reaction chain branching as depicted in Figure 2-4.
Based on end-gas temperature history measured by Smith et al [29], knock occurs
within the intermediate temperature regime. Therefore, the chemical behaviour in the
low and intermediate temperature regimes plays a critical role in determining the
characteristics of autoignition.
2.4.1.3.5 High Temperature Regime
When the process reaches the high temperature region (above 1000K), the dominant
chain branching reactions in hydrocarbon ignition are dominated by OH•, O•, and H•
radicals produced by thermal decomposition of radicals such as ethyl, vinyl, formyl,
isopropyl and others.
High temperature chemistry leads to fast exothermal chain branching effect and
propagate active radicals, which consequently accelerates the overall rate of ignition
with explosively released energy.
2.4.1.3.6 Single-stage and Two-stage Autoignition
From the concise introduction of autoignition chemistry, one can learn that
autoignition is not a spontaneous process as known by intuition. The real chemical
process involves a series of complex chemical reactions. Typically autoignition of
hydrocarbon fuels can be characterized by one or two-stage ignition depending on
the fuel structure and carbon number in the fuel molecule. Figure 2-5 [30] shows the
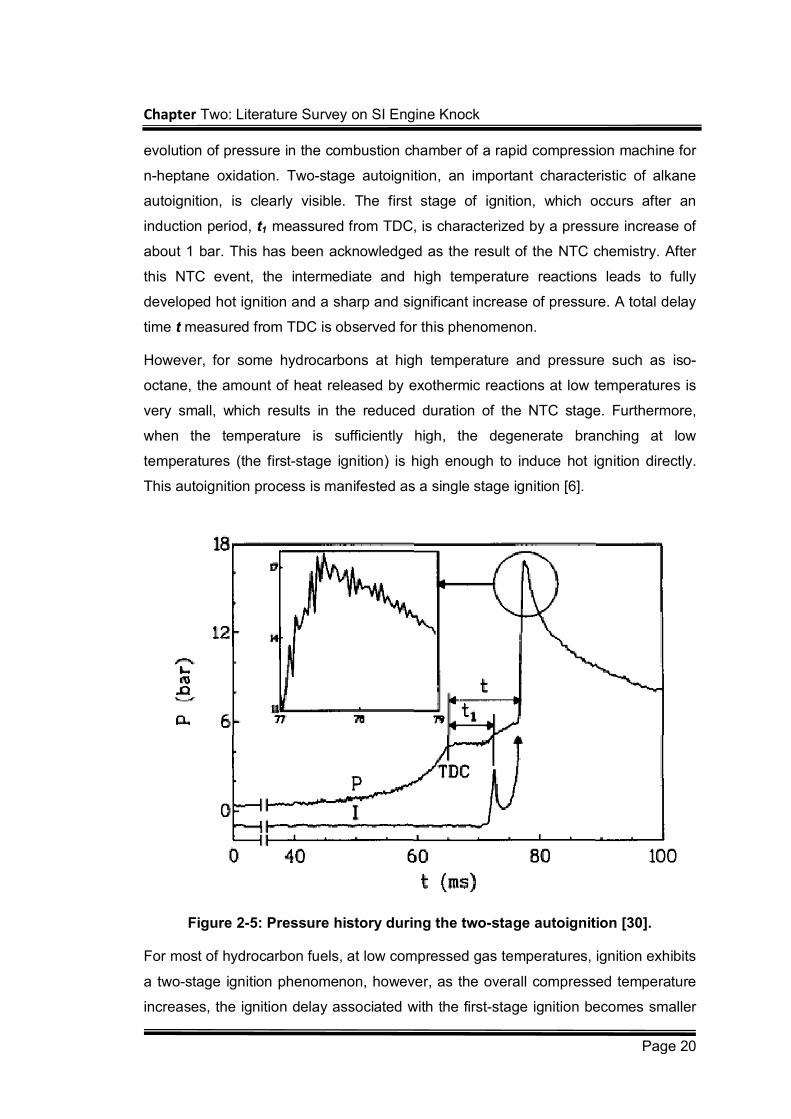
Chapter Two: Literature Survey on SI Engine Knock
Page 20
evolution of pressure in the combustion chamber of a rapid compression machine for
n-heptane oxidation. Two-stage autoignition, an important characteristic of alkane
autoignition, is clearly visible. The first stage of ignition, which occurs after an
induction period, t1 meassured from TDC, is characterized by a pressure increase of
about 1 bar. This has been acknowledged as the result of the NTC chemistry. After
this NTC event, the intermediate and high temperature reactions leads to fully
developed hot ignition and a sharp and significant increase of pressure. A total delay
time t measured from TDC is observed for this phenomenon.
However, for some hydrocarbons at high temperature and pressure such as iso-
octane, the amount of heat released by exothermic reactions at low temperatures is
very small, which results in the reduced duration of the NTC stage. Furthermore,
when the temperature is sufficiently high, the degenerate branching at low
temperatures (the first-stage ignition) is high enough to induce hot ignition directly.
This autoignition process is manifested as a single stage ignition [6].
Figure 2-5: Pressure history during the two-stage autoignition [30].
For most of hydrocarbon fuels, at low compressed gas temperatures, ignition exhibits
a two-stage ignition phenomenon, however, as the overall compressed temperature
increases, the ignition delay associated with the first-stage ignition becomes smaller
Chapter Two: Literature Survey on SI Engine Knock
Page 21
and eventually ignition becomes single stage. In general, the induction period of
ignition is dependent on the fuel octane number. Hydrocarbon of a higher octane
number exhibits an overall increase in ignition delay time
2.4.1.4 Modelling of End-Gas Autoignition
Modelling methods of end gas autoignition can be generally categorized into
empirical correlation and chemical kinetics modelling [1]. The experimental
methods and empirical correlations had been used to study the auto-ignition process
back to the time when the chemical understanding of autoignition was limited. Over
the last decade, however, numerical modelling using chemical kinetics has gained in
importance as a new approach to model auto-ignition behaviour of gas mixtures
thanks to both the improved understanding of hydrocarbon chemistry and the
advanced computer technologies, by which numerical computations can be achieved
at an acceptable cost. As a comparison to the experimental methods, numerical
modelling is cheap and time saving, and additionally is able to offer autoignition data
in regions where an experimental approach would simply fail. However, since
numerical models need to be validated with experimental data, they can never fully
replace the experimental studies.
2.4.1.4.1 Empirical Correlation
The empirical correlations were derived by matching an Arrhenius function to
measured data on ignition delay times and ignition timing. For given fuel-air mixtures,
over the relevant mixture pressure p and temperature T , the correlations have the
form
T
BpA n exp 2-2
where indicates the ignition delay time, A and B are fitted parameters dependent
on fuel types. To predict knock occurrence with time dependent temperature and
pressure histories, the Equation 2-2 is integrated. Autoignition is deemed to occur if
the value of the integral of exceeds a given threshold. A number of these empirical
relations have been developed from engine studies of autoignition [31,32] the most
extensively tested correlation is that proposed by Douaud and Eyzat [32].
Tp
ON n 3800exp
10068.17
402.3
2-3
Chapter Two: Literature Survey on SI Engine Knock
Page 22
where is the induction time in milliseconds and ON is the motor octane number of
the fuel. Models of this type have been used in conjunction with thermodynamic
models for engine combustion [31]. However, the ability of this type of models to
predict the onset of autoignition and knock with sufficient accuracy is still unclear and
empirical correlation are too simple to give any information of the reaction process
and at best only fit the data over a limited range.
2.4.1.4.2 Chemical Kinetics Modelling
The end-gas autoignition is a complex chemical kinetic process that may involve
thousands of elementary reaction steps and species [33]. Should all of the reaction
steps and rate coefficients were known and very fast computation resources were
available at low cost, the prediction of autoignition characteristics (ignition timing,
ignition delay time, location of autoignition centres, the heat release, the reaction
intermediate, and the final products of combustion etc.) can be achieved via
numerical simulation. However, this ideal numerical approach has not been achieved
and applied, as the lack of knowledge of the elementary reaction steps and rate
coefficients and expensive computation time caused by the difficulty of analyzing
thousands of equations have been playing a restrictive role in the development of
chemical kinetics modelling.
Even so, in the past two decades, chemical kinetics modelling has still been
prompted to be an important tool in the analysis of combustion systems.
Correspondingly, there are four factors that are considered to be the major driving
force contributing to the increasing application of chemical kinetics modelling [34],
which are summarised as
Availability of large amounts of elementary kinetic data
Improved techniques for estimating specific reaction rates
Development of efficient "stiff equation" solution techniques
Continual growth in the size, speed, and availability of large computers
Chemical kinetics modelling, according to the scale of the numbers of reactions and
species enclosed in the model, can be classified into detailed, lumped, reduced,
skeletal and global models. The basic characteristics of hydrocarbon chemistry
include cool flame and low and high temperature chemistry as is briefly introduced in
the earlier context. More of the information of hydrocarbon combustion chemistry and
Chapter Two: Literature Survey on SI Engine Knock
Page 23
its modelling is reported in Chapter 4.
2.4.2 End-Gas Detonation
In contrast to the autoignition theory as a major cause of engine knock, some
researchers [35,36] believed that it was the advancing flame front that accelerated to
sonic velocity and consumed the end-gas at a rate much faster than would occur with
normal flame speed, which resulted in high pressure and strong pressure wave. This
theory suggested that any autoignition observed in the end gas was only an
intermediate stage in the knocking mechanic and not the cause. However, full
detonation is unlikely to occur in spark ignition engine, this due to the lack of
unbumed gas and space available for full detonation to occur. Curry [35] claimed the
observation of abnormally accelerated flame font speeds in the range of 100 to 400
m/s. However his experimental work was conducted only with ion probes, without
photographic corroboration, and consequently his findings are considered unreliable.
In summary, detonation has led many to call knock "Detonation". But there is much
less evidence to support the detonation theory than the autoignition theory as the
initiating process. Most recent evidence indicates that knock originates with the
spontaneous or autoignition of one more local regions within the end gas. Thus the
autoignition theory is most widely accepted.
2.4.3 Surface Ignition
The other important abnormal combustion phenomenon is surface ignition. Surface
ignition originates from ignition of fuel air charge caused by overheated valves or
spark plugs or glowing combustion chamber deposits, or by any other hot spot in the
engine combustion chamber. Mostly surface ignition is due to carbon deposits.
Surface ignition may take place before the spark plug ignites the charge (preignition)
or after normal ignition (postignition). It leads to the formation of one or multiple
propagating flame fronts opposite the one originating from spark caused by spark
ignition. Surface ignition may lead to a more rapid and high rise of pressure and
temperature than in case of normal combustion, because the flame either starts
propagating sooner, or it does from more than one sources. Consequently, surface
ignition is likely to cause knock. To identify whether surface ignition causes knock or
not, the term "knocking surface ignition" and "non-knocking surface ignition" are
used. Since knocking surface ignition usually caused by glowing combustion
chamber deposits rather than spark ignited flame propagation, it can not be
Chapter Two: Literature Survey on SI Engine Knock
Page 24
controlled by retarding the spark timing. The non-knocking surface ignition occurs
late in the operating cycle [1].
2.5 Fuel Effect
Automotive fuels, which have different structure and composition, feature different
resistance to knock. In this section, the effect of fuel structure and composition on
propensity of knock occurrence and knock intensity are interpreted.
2.5.1 Octane Number
The measure of fuels resistance to knock is defined by that fuel's Octane Number
(ON). In 1927, Graham Edgar suggested using two hydrocarbons that could be
produced in sufficient purity and quantity. These were normal heptane that was
already obtainable in sufficient purity from the distillation of Jeffrey pine oil, and an
octane, named 2,4,4-trimethyl pentane that he first synthesized, which is called as
iso-octane today. Dr. Edgar devised the octane scale by testing the knocking
tendency of every compound that was similar to gasoline. He found that isooctane
would not knock in any engine under any operating conditions, while n-heptane
would always knock in any engine. By mixing isooctane and n-heptane in different
amounts, he obtained fuels of all qualities, the percentage of isooctane in the mixture
being the octane number. Commercial gasoline was compared to these mixtures in
test engines to determine their octane number. When the scale was developed,
commercial gasoline had octane ratings between 40 and 75, and the best were
brought up to a rating of 87 by the addition of tetraethyl lead, making leaded
gasoline. Today, due to environmental reasons, tetraethyl lead has been outlawed.
However, we do not really need it, because new and better processes allow oil
companies to make gasoline for our automobiles with octane ratings as high as 97
[37].
The reason for using normal heptane and iso-octane was because they both have
similar volatility properties, specifically boiling point, thus the varying ratios 0:100 to
100:0 should not exhibit large differences in volatility that could affect the rating test.
There are several octane rating methods. The two most common are the "motor"
method and the "research" method. The motor octane number (MOR) testing uses a
similar test engine to that used in RON testing, but with a preheated fuel mixture, a
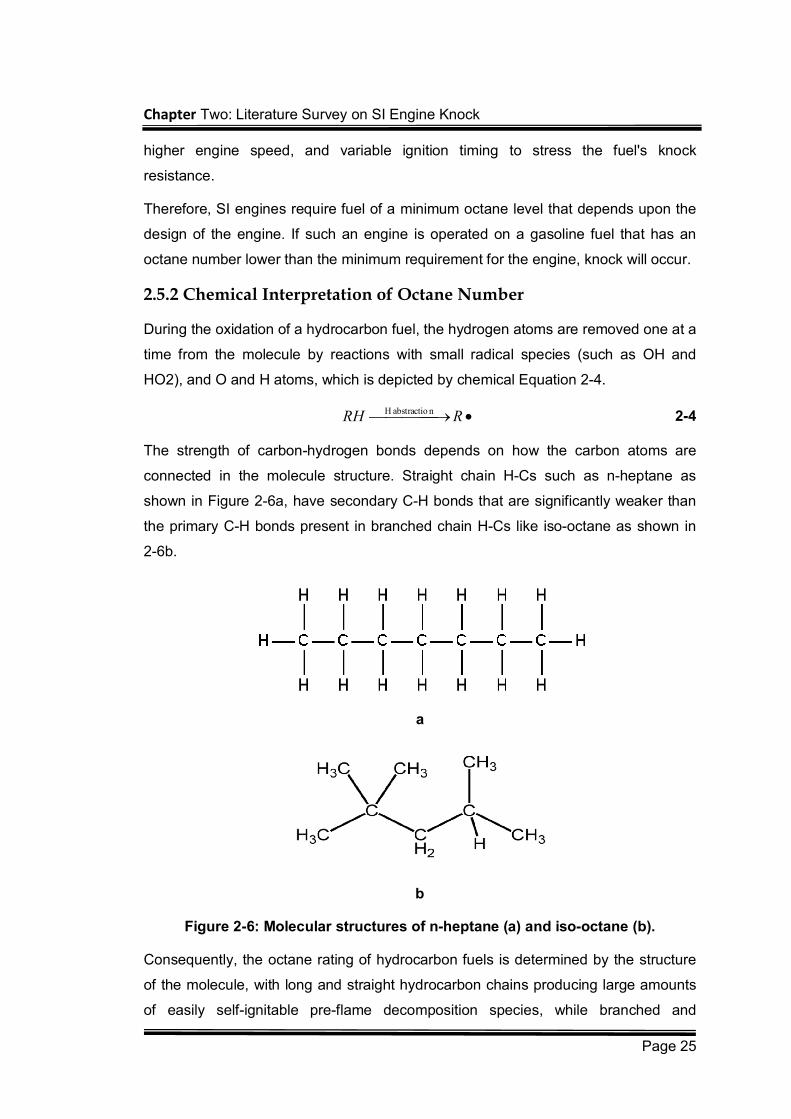
Chapter Two: Literature Survey on SI Engine Knock
Page 25
higher engine speed, and variable ignition timing to stress the fuel's knock
resistance.
Therefore, SI engines require fuel of a minimum octane level that depends upon the
design of the engine. If such an engine is operated on a gasoline fuel that has an
octane number lower than the minimum requirement for the engine, knock will occur.
2.5.2 Chemical Interpretation of Octane Number
During the oxidation of a hydrocarbon fuel, the hydrogen atoms are removed one at a
time from the molecule by reactions with small radical species (such as OH and
HO2), and O and H atoms, which is depicted by chemical Equation 2-4.
RRH nabstractio H 2-4
The strength of carbon-hydrogen bonds depends on how the carbon atoms are
connected in the molecule structure. Straight chain H-Cs such as n-heptane as
shown in Figure 2-6a, have secondary C-H bonds that are significantly weaker than
the primary C-H bonds present in branched chain H-Cs like iso-octane as shown in
2-6b.
a
b
Figure 2-6: Molecular structures of n-heptane (a) and iso-octane (b).
Consequently, the octane rating of hydrocarbon fuels is determined by the structure
of the molecule, with long and straight hydrocarbon chains producing large amounts
of easily self-ignitable pre-flame decomposition species, while branched and
Chapter Two: Literature Survey on SI Engine Knock
Page 26
aromatic hydrocarbons are more resistant. This explains why the octane rating of
paraffin decreases with carbon number [38].
Perdih et al [39] summarized the empirical rules of ON dependence on the molecular
structure of alkane and they concluded
ON decreases with the number of CH2 groups and increases with the number
of CH3 groups, the number of adjacent CH2 groups has the highest ON.
ON decreases with the separation between branches (i.e. of the number of
adjacent methylene groups)
ON increases with the more central position of the branches.
ON increases with the bulkiness of the branched structure.
Ethyl group as a branch can express apparently contradictory effects: If it
increases the number of CH2 groups, ON decreases; if not, ON increases.
2.5.3 Fuel Additives
Gasoline can be refined to have sufficiently high octane numbers to run today's high
compression engines, but such refining is expensive and energy intensive. The
addition of anti-knock additives such as alkyl lead and oxygenates can significantly
change autoignition characteristics primarily by interfering at different points in the
chemical reaction pathway. The oxygenates are capable of retarding undesirable low
temperature reactions, and the alkyl lead compounds react in the intermediate
temperature region to deactivate the major undesirable chain branching sequence. .
The problem with metallic anti-knock gasoline fuel additives, however, is the high
toxicity of their combustion products. For example, the first widely used metallic
additives were Tetraethyl Lead (TEL). They were widely adopted until the late 1960s,
their use starting phasing out with the change of legislation on automotive emission
in response to rising public concern about environmental pollution. The negative
aspects in use of TEL are
Most lead compounds in the combustion products from TEL are toxic at low
levels to human and animal life.
Most TEL additives poison the catalyst used to reduce exhaust pollution
It would therefore be desirable to identify non-metallic anti-knock agents which would
produce little toxic combustion products compared to metallic anti-knock agents, and
Chapter Two: Literature Survey on SI Engine Knock
Page 27
which would provide a needed increase in octane ratings to eliminate knock. The
most popular anti-knock oxygenate additives include isooctane, toluene, etc.
2.6 Knock Detection
To improve engine design and numerical modelling; it is important to have accurate
and reliable indicators for knock onset and intensity. A great amount of work has
been reported in literature [40-42], which varies in the degree of sophistication of the
equipment needed and the complexity of the computations to be carried out on the
acquired data. These methods can be generally classified into two categories:
Signals of accelerometers mounted on the cylinder block
Cylinder pressure cranks angle records
Both of the methods have its keen users in light of its application merits. In modern
production engine applications, the mounted accelerometers are popularly
implemented to measure structural vibrations associated with knock, which is used
as an indicator of knock. The sturdiness of the accelerometer and its low cost are the
main advantages. However, the high sensitivity to noise makes detection difficult at
high engine speeds [41].
The pressure based methods provide a much more direct and reliable way of knock
detection and the information on knock intensity. Moreover, this method is widely
used in laboratories. Its disadvantages are mainly the high cost of in-cylinder
pressure probes with high signal/noise ratio. It is likely that for this reason methods
based on pressure analysis have not yet been applied on a large scale.
Nevertheless, recent progresses in non-intrusive probes may make its use possible
on real applications in the near future [40,41].
2.7 Summary
The knock phenomenon in SI engines has constituted a major and the most serious
limitation upon increasing efficiency of SI engines by increasing the compression
ratio. The occurrence of knock is subject to the factors such as sparking timings,
AFR, intake pressure etc. that affect the thermodynamic and chemical kinetic states
Chapter Two: Literature Survey on SI Engine Knock
Page 28
of the end-gas.
Generally, "knocking" occurs when a fuel, especially gasoline, spontaneously and
prematurely ignites or detonates in an engine prior to spark plug initiated ignition.
Knock is currently believed is the result of the autoignition of a certain amount of fuel-
air mixture in the end gas before it can be consumed by a primary flame propagating
through the cylinder charge. In the view of chemists, it may be further characterized
as a non-homogeneous production of free radicals that ultimately interfere with a
flame wave front. The autoignition occurs randomly at discrete exothermic centres
(exothermic centres), from which autoignition chemical reactions proceed and
propagate. Formation of autoignition centres can be attributing to surface hot spots of
the cylinder body and/or inhomogeneous distribution of mixture properties such as
gas residuals and deposit etc.
The chemical process of autoignition is a series of complex degenerate chain
branching, carrying and terminating reactions involving stable and radical species.
These reactions may be separated into three distinct temperature regimes: low,
intermediate and high temperature regimes. Each regime is dominated by reactions
involving different radical species and different pathways.
Chemical kinetics modelling has been regarded as an ideal numerical approach in
the analysis of autoignition chemistry and in the prediction of autoignition
characteristics. A chemical kinetics model is composed of information of selected
species, elementary reactions, and reaction rate parameters that can be used to
numerically depict a chemical process. Chemical kinetics models can be classified
according to the numbers of reactions and species contained in the model.
The ability of a fuel to resist knock is scaled by octane number. Fuels with higher
octane numbers exhibit higher knock resistance. The addition of anti-knock additives
such as alkyl lead and oxygenates can be used to reduce engine knocking and
increase the fuel's octane rating. The typical antiknock agents in use include Tetra-
ethyl lead, Methylcyclopentadienyl manganese tricarbonyl (MMT),Ferrocene, Iron
pentacarbonyl, Toluene, Isooctane.
Engine knock identification methods can be classified into two categories: Signals of
accelerometers mounted on the cylinder block and Cylinder pressure cranks angle
records. Each of method has its particularity in different application fields.
Chapter Three: Literature Survey on HCCI Combustion and engines
Page 29
Chapter Three: Literature Survey on HCCI Combustion and engines
3.1 HCCI Combustion and Engines
3.1.1 Definition of HCCI combustion
Homogenous charge compression ignition (HCCI) is a sparkles and flameless
burning process of premixed fuel-air mixture, which combines homogeneous
(premixed) intake charges as in SI engines with the autoignited combustion as CI
engines [43]. Unlike a traditional S.I. or Diesel engine, HCCI combustion takes place
spontaneously and homogeneously without flame propagation, which eliminates
heterogeneous air/fuel mixture regions. In Figure 3-1, these three combustion
processes are illustrated. To achieve HCCI combustion, generally the engine run on
a lean, diluted mixture of fuel, air, and combustion products, which results in lower
peak burned gas temperature. The low combustion temperature dramatically reduces
NOX emissions [9]. As HCCI combustion is an autoignition process, compression
ratios are not limited by the occurrence of knock as in SI engines. As known, a high
compression ratio is the most critical factor to increase thermal efficiency for an
engine. As a result, with relatively higher compression ratios and less heat lose due
to low combustion temperature, the thermal efficiency of HCCI engines approaches
the levels of CI engines. Furthermore homogeneous mixture leads to no rich fuel
regions in the charges, which is essential to minimize the Particulate Matter (PM)
emission.
HCCI is first termed by Rob Thring [44] and has now been world widely recognised,
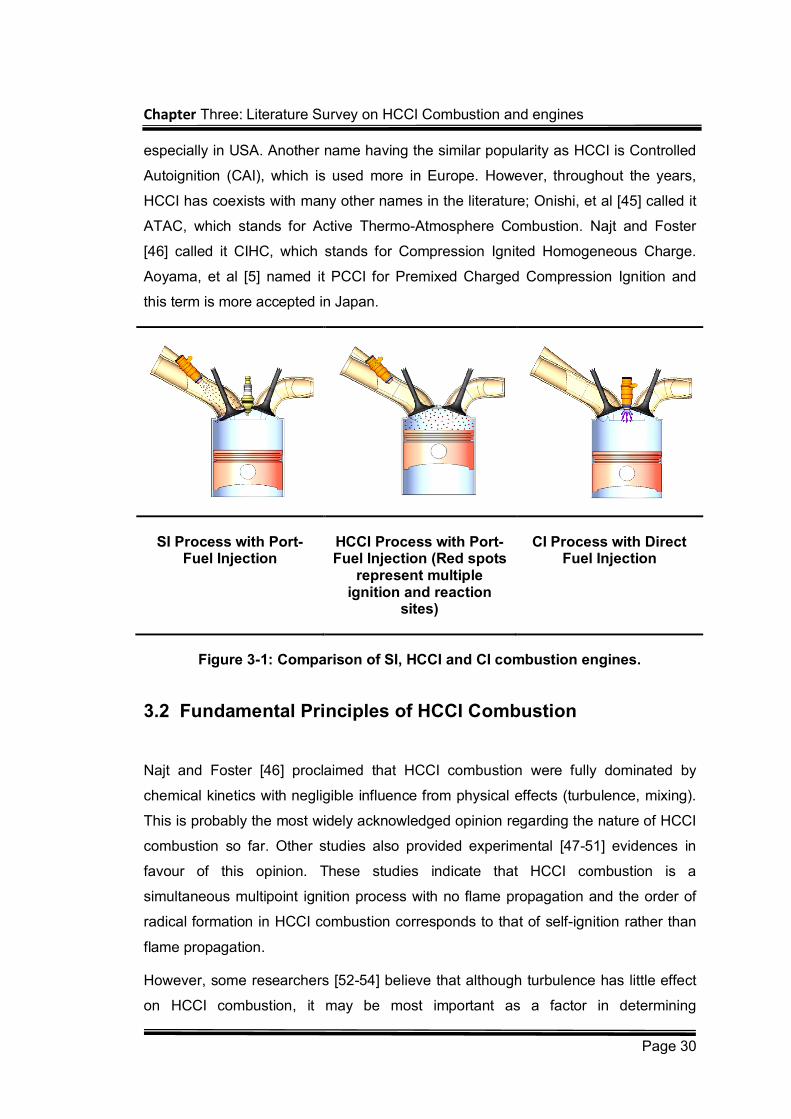
Chapter Three: Literature Survey on HCCI Combustion and engines
Page 30
especially in USA. Another name having the similar popularity as HCCI is Controlled
Autoignition (CAI), which is used more in Europe. However, throughout the years,
HCCI has coexists with many other names in the literature; Onishi, et al [45] called it
ATAC, which stands for Active Thermo-Atmosphere Combustion. Najt and Foster
[46] called it CIHC, which stands for Compression Ignited Homogeneous Charge.
Aoyama, et al [5] named it PCCI for Premixed Charged Compression Ignition and
this term is more accepted in Japan.
SI Process with Port-Fuel Injection
HCCI Process with Port-Fuel Injection (Red spots
represent multiple ignition and reaction
sites)
CI Process with Direct Fuel Injection
Figure 3-1: Comparison of SI, HCCI and CI combustion engines.
3.2 Fundamental Principles of HCCI Combustion
Najt and Foster [46] proclaimed that HCCI combustion were fully dominated by
chemical kinetics with negligible influence from physical effects (turbulence, mixing).
This is probably the most widely acknowledged opinion regarding the nature of HCCI
combustion so far. Other studies also provided experimental [47-51] evidences in
favour of this opinion. These studies indicate that HCCI combustion is a
simultaneous multipoint ignition process with no flame propagation and the order of
radical formation in HCCI combustion corresponds to that of self-ignition rather than
flame propagation.
However, some researchers [52-54] believe that although turbulence has little effect
on HCCI combustion, it may be most important as a factor in determining
Chapter Three: Literature Survey on HCCI Combustion and engines
Page 31
temperature gradients and boundary layer thickness inside the cylinder, and as a
result, influencing autoignition timing and emission formation. Furthermore, heat
transfer and mixing process are critical issue in forming the conditions of the charge
prior to ignition.
Najt and Foster also concluded in their work that HCCI combustion is a chemical
kinetic combustion process, in which HCCI autoignition is controlled by the same low
temperature (below 1000 K) chemistry as that occurring during SI engine knock and
in which most of the energy release is controlled by the high temperature (above
1000 K) chemistry. This is consistent with the results from the studies of chemical
kinetics of HCCI combustion [10,12,55], which conclude that little heat is released
prior to this main ignition event at 1050-1100 K; however, significant heat-producing
reactions begin at temperatures of about 1100 K. Although the amount of energy
liberated is too small to be considered ignition, these low-temperature reactions
quickly drive the mixture up to the 1050-1100 K temperature necessary for main
ignition.
3.3 Characteristics of HCCI combustion
HCCI engines has the advantage of the application of premixed homogeneous gas
mixture, throttle-less operation, high compression ratio, low NOX and particulate
emission, diesel-like efficiency, etc. However, HCCI engines confront a few
challenges like high UHC and CO emissions, narrow operation range, high load
limitation and uncontrolled heat release rate, etc. this section describe the main
characteristics of HCCI combustion as comparison of those in SI and CI engines
3.3.1 Advantage of HCCI combustion
As introduced in the previous section, HCCI combustion has the potential to be the
next generation combustion concept applied in IC engines thanks to its advantages
in emission reduction and combustion efficiency in comparison with SI and CI
engines. A brief overview of the advantages from HCCI engines is given below
followed by a summary
3.3.1.1 In Comparison to SI engines
3.3.1.1.1 Higher Efficiency
Chapter Three: Literature Survey on HCCI Combustion and engines
Page 32
HCCI engines are characteristic of higher combustion efficiency over SI engines and
approaching the efficiency of a CI engine. The following factors are believed to
contribute to high efficiencies in HCCI engine.
Application of High Compression Ratios – A high compression ratio is the
most critical condition to increase thermal efficiency for IC engines. Since HCCI
combustion is not limited by the knock problem as in SI engine, the compression
ratios applied in HCCI engines can be applied as high as in CI engines.
Elimination of the Throttling Losses - Operation with no throttle in HCCI
engine leads to a reduction in pumping loss, and thus a significant efficiency
improvement in comparison to SI engine operation.
Lower Overall Combustion Temperature – As HCCI engines are normally
operated with lean and diluted mixtures, they have much lower combustion
temperatures in contrast to SI engines, which reduce the energy loss due to the heat
transfer.
Shorter Combustion Duration – The Multi-point simultaneous autoignition of
mixtures eliminates the existence of flame propagation in HCCI engine, which leads
to faster combustion, and consequently shorter combustion duration. This shorter
combustion duration makes HCCI combustion more like theoretical constant volume
combustion and therefore have the advantage of higher efficiency.
3.3.1.1.2 Lower NOX emission
HCCI combustion is characteristic of lower combustion temperature due to
application of lean and dilute mixture compared to SI combustion, which leads to a
significant reduction in NOX emissions. Experimental study [56] showed that much
lower NOX was generated with HCCI combustion even compared with that from SI
engines with three-way catalyst technology.
3.3.1.2 In Comparison to CI engines
3.3.1.2.1 Lower NOX and PM emissions
HCCI engines relative to CI engines, has the advantage of significantly lower NOX
and PM emissions because of both dilute and homogeneous mixture properties and
low combustion temperature, which take the advantage of the following factors
No Fuel Rich Regions - The homogeneous distribution of fuel- air mixture in
HCCI engine eliminates the fuel rich regions as in CI engines.
Chapter Three: Literature Survey on HCCI Combustion and engines
Page 33
Lean Charge - Charge in HCCI engines can be diluted to be very lean but
capable of sustain the ignition by using Exhaust Gas Recirculation (EGR), or
stratified charge, or by both of these strategies.
High Dilution Level - Since combustion of the charge in HCCI engines is
driven by multi-point autoignition rather than one driven by flame propagation as in SI
and CI engines, the mixture employed can be significant diluted to a higher level than
that in SI or CI engines
Lower Ignition Temperature - Compression induced autoignition in HCCI
engines has a much lower threshold ignition temperature (at 800 to 1100 K and fuel-
type dependent) compared with SI and CI engines. As combustion occurs, the
temperature will rise above the ignition temperature, but the peak temperature (at
around 1800 K) is maintained below the level for significant formation of NOX, In
contrast, the combustion CI engines is high enough (above 2000K) to produce NOX
to a unacceptable level.
3.3.1.2.2 Higher Efficiency
As HCCI combustion is characteristic of a simultaneous combustion process due to
the lack of flame propagation, the combustion duration in HCCI engines is much
shorter than CI engines, which leads to a decreased heat rejection to the engine. In
addition, the low combustion temperature also contributes to lower energy loss
through the heat transfer. As a result, HCCI combustion features higher combustion
efficiencies.
3.3.1.2.3 Lower cost
With higher combustion efficiency and lower emission relative to SI and CI engines,
HCCI engines have the advantage of lower costs for pollution cleanup, engine cycle
operation and fuel.
3.3.1.3 Additional advantages
In addition to the advantages presented above, Application of HCCI engines also
benefited from the following factors.
3.3.1.3.1 Fuel Flexibility
Since HCCI combustion is not constrained by knock as in SI engines, a wide range of
fuels have been tested on HCCI combustion which include gasoline [57,58], diesel
fuel [59,60], natural gas [61-64], propane [65-67], and Primary Reference Fuel (PRF)
Chapter Three: Literature Survey on HCCI Combustion and engines
Page 34
[48,56,68-72], and most alternative fuels such as methanol [73,74], ethanol [58,70],
Dimethyl Ether (DME) [62,75-77]. The real benefit of HCCI lies in its compatibility
with current engine architectures and ability to run on everyday fuel.
3.3.1.3.2 Smooth engine cycle Operation
Test results proved that under optimised conditions, HCCI combustion can be very
repeatable, resulting in smooth engine operation [78,79]. The simultaneous multi-
point ignition in HCCI combustion eliminates the influence of flame propagation on
combustion as that in CI and SI engines. As a result, cycle-by-cycle variation is
significantly minimized in HCCI combustion.
3.3.1.3.3 High Compatibility
Further benefit of HCCI seems to be its compatibility with current engine
architectures and ability to run on everyday fuel. HCCI combustion can be applied in
internal combustion engines and electric series hybrid vehicles or fuel cell hybrid
vehicles. With the combination with other energy supply systems, engine can be
optimized for operation over a limited range of speeds and loads, at which HCCI
combustion is more suitable. This enables elimination of many of the control issues
normally associated with HCCI and creation of highly efficient hybrid vehicles.
3.3.1.4 Summary
The inherent advantages of HCCI engines are summarized as follows:
High thermal efficiency (some studies have reported over 50%) associated
with un-throttled, ultra-lean operation:
High compression ratios
Lower dissociation losses
Increased ratio of specific heats during expansion stroke
Reduced cooling losses
Decreased heat loss
Very low NOX emissions (<10ppm, some studies have suggested that less
than 1ppm may be attainable) resulting from low combustion temperature with
ultra-lean operation
Next to zero emissions of particulate matter thanks to pre-mixed
Chapter Three: Literature Survey on HCCI Combustion and engines
Page 35
homogeneous charge operation
Small cycle-by-cycle variation
High compatibility of with current engine architectures and ability to run on
everyday fuel.
3.3.2 Challenges of HCCI combustion
HCCI engine technology has received increasing attention in recent years due to its
intrinsic benefits in terms of high efficiency and low NOX and soot emissions.
However, unresolved issues include combustion phasing (i.e., the control of the start
and duration of combustion), high CO and HC emissions, limited load-speed
operating window, etc. The major challenges of HCCI are briefly overviewed and
summarised in this section.
3.3.2.1 Hydrocarbons and Carbon Monoxide (HC and CO)
Although HCCI combustion is characterised by low NOX and PM emissions because
of the distributed low-temperature reactions of the fuel-lean mixture, this low-
temperature combustion typically results in higher HC and CO emissions than
conventional CI combustion [80,81]. Two important mechanisms for HC emissions
from HCCI engines are crevices and liquid fuel effect. Fuel that is packed into the
crevices and impinged into the boundary layer close to the cylinder wall normally
escapes the major combustion. However, the lean mixture operation in HCCI engines
leads to a very low post-combustion temperature, at which any fuel that escapes
from the major combustion has very low chance of undergoing complete post-
combustion oxidation. Furthermore, significant CO emission is formed in the partial
oxidation of the unburned HC.
3.3.2.2 Control of Combustion Phasing and Rate
One of the major barriers to wide and general application of HCCI combustion is
control of combustion phasing and rate. Since HCCI combustion is an instantaneous
autoignition process of homogeneous mixture, both of the direct control methods in
SI and CI engine (spark timing control and fuel injection timing control) used in
controlling start of combustion are not applicable in HCCI engines.
Ideally, autoignition in HCCI occurs at the point where the piston reaches top dead
center to provide optimum power and efficiency; therefore, the timing of the
autoignition is critical. Without the help of an external triggering event, HCCI has a
Chapter Three: Literature Survey on HCCI Combustion and engines
Page 36
problem in controlling the ignition timing.
Autoignition is a fully reaction rate controlled process. The reaction rates of kinetic
chain branching reactions that are in control of initiation and heat release rate of
combustion are primarily determined by composition of the fuel-oxidiser mixture and
by time-temperature history to which the mixture is exposed. The following factors
have been claimed to be the major influences on the charge composition and
temperature
Mixture Homogeneity – As aforementioned, turbulence and mixing play a
important role determining stratification of charge temperature and composition
inside the cylinder, as a result, influencing autoignition timing and combustion
phasing.
Fuel Property - Each type of fuel has unique chemical and physical
properties, so the chemistry of autoignition varies from fuel to fuel.
Fuel-Air Ratio – Load control in HCCI engines is achieved by varying fuel-air
ratios of the mixture, which causes change of charge composition and temperature.
EGR Rate – While using EGR technique, a fresh air-charge is mixed with hot
trapped exhaust gases, increasing the temperature and changing the composition of
the newly formed charge mixture (Fuel/Air/EGR), and thus influencing the ignition
timing and heat release rate.
Heat Transfer – Heat loss from the charge to the surroundings also leads to
the regional inhomogeneities of the mixtures prior to ignition.
Compression Ratio – An increased compression ratio elevates the
temperature of the in-cylinder charge during the compression process, which
enhances the chemical reaction rates. As a result of this, ignition delay is shortened
and ignition timing is advanced.
Inlet Temperature – Inlet temperature has the significant influence on ignition
timing and energy release rate. An increased intake temperature enhance the
chemical reaction rates and thus advances ignition timing and vice versa.
Engine Speed – Changing engine speed changes the amount of time for the
autoignition chemistry to occur relative to the piston motion. Ignition timing retards
with increased engine speed and vice versa
3.3.2.3 Operation Range
Chapter Three: Literature Survey on HCCI Combustion and engines
Page 37
Another drawback of HCCI combustion is the operating range, which is currently
limited at low and medium loads with fuel lean mixtures. When fuel rich mixtures are
applied at high load, the combustion stability degrades, heat release rates increase,
knock-like oscillations in the cylinder pressure appear, and the emissions benefits
vanish [5,60]. Therefore, it is highly in demand to achieve controlled operation at high
load condition in HCCI engines.
One of the solutions to overcome the load range limitations of HCCI is hybrid
combustion mode, by which HCCI mode is used at part load and then transitions into
SI or CI modes at high load conditions [82]. This hybrid operation takes advantage of
benefits of HCCI combustion at low and medium loads and makes use of SI or CI
combustion as a substitution at high loads. Exploration of the fundamental nature of
the hybrid mode combustion has been limited so far and raised much research
awareness.
Another method has the potential of extending the operating range of HCCI engine to
higher loads is charge stratification, both thermal and compositional. At locally
stratified temperature and fuel-air ratios, combustion event at high load conditions
can be stretch out. Several strategies for mixture control have been devised and are
currently being considered to help overcome load range limitation in HCCI engines.
These include diverse fuel injection schemes such as port fuel injection and single or
multistage direct injection (DI or MDI), new intake and in-cylinder mixing processes to
obtain non-uniform fuel/air/residual mixtures, as well as external exhaust gas
recirculation (EGR), variable valve timing, and variable compression ratio, etc.
[27,83]
3.3.2.4 Homogeneous Mixture Preparation
Mixture preparation has a significant effect on combustion chemistry and thus is a
critical issue to achieve satisfactory control of HCCI combustion [84,69].
Homogeneous mixture preparation is most difficult for fuels with low volatility such as
diesel, which require elevated intake air temperatures to evaporate the fuel [60].
3.3.2.5 Cold-Start Capability
During engine cold start, HCCI combustion is almost impossible due to lack of
preheating to the intake charge and high heat transfer to the cold combustion
chamber. Without some compensating mechanism, the low compressed-charge
temperatures could prevent an HCCI engine from firing.
Chapter Three: Literature Survey on HCCI Combustion and engines
Page 38
Various mechanisms for cold starting in HCCI mode have been proposed such as
using glow plugs, using a different fuel or fuel additive, and increasing the
compression ratio using VCR or VVT. It has proven preferable to employ spark
ignition at cold start and then transition to HCCI mode after warm-up, though it adds
cost and complexity [43]. VCR and VVT systems are usable for cold start conditions
by changing the effective compression ratio and/or the amount of hot exhaust gases
retained in the cylinder in order to raise the inlet charge temperature.
3.3.2.6 Summary
The technical obstacles to implementing HCCI engines are summarized as follows:
Operating range is significant narrower than those for SI and CI engines with
difficulties at cold start and high load conditions.
High energy release rate and short combustion duration lead to difficulties in
control of combustion phasing
High CO and UHC emissions, resulting from low combustion temperature,
particularly at lower load conditions, and from crevices and boundary layer
Load range limitation exists under both cold start and high load conditions
High peak pressures.
The combustion of highly dilute mixtures in these engines results in relatively
low power density (unless supercharged).
In addition, lean-burn exhaust composition is incompatible with the current
state of the art NOX reduction catalyst technology. Consequently, reaching
very low levels of NOX emissions hinges on achieving stable controllable
operation at ultra-lean conditions (Φ < 0.5)
3.4 Research Work in HCCI Engines
It has been 30 years, since HCCI combustion was discovered and considered as a
alternative combustion concept to conventional SI and CI engines. Since then,
research work on the development and application of HCCI combustion has not been
stopped. A great deal researcher have dedicatedly done essential work, both
experimental and modeling, to establish fundamental understanding of HCCI
Chapter Three: Literature Survey on HCCI Combustion and engines
Page 39
combustion and developed feasible technical solutions for control of HCCI
combustion. The following section chooses to present some of the typical work done
in this field.
3.4.1 Fundamental Studies
HCCI combustion was first discovered as an alternative combustion mode in 1979 by
Onishi et al [45]. They successfully achieved stable autoignition under fuel lean and
part load conditions by throttling the exhaust to increase the amount of trapped EGR
and initial mixture temperature. The stabilized lean autoignition combustion was
proven to provide significant reduction in exhaust emissions, specifically UHC and
fuel consumption and termed ‘Active Thermo-Atmosphere Combustion’ (ATAC).
As a pioneer study in HCCI combustion, Onishi’s work established a fundamental
understanding of the characteristics of HCCI combustion and had a significant
influence on all the subsequent research. A few critical points made in Onishi’s work
are summarized below.
Peak pressure in ATAC combustion shows a very small fluctuation resulting
in little cycle-by-cycle variation, which leads to improved thermal efficiency
ATAC is initiated by a controlled autoignition; hence, the occurrence or
absence of an electric spark has no effect on the combustion pattern.
Intermediate radicals (OH, CH, and C2) were formed earlier during the
compression stroke in ATAC combustion, and had higher concentrations and
a longer life than those in normal spark ignition engine operations.
High-speed Schlieren photographs indicated no distinct flame propagation
through the chamber and small density variations during the combustion
period
ATAC combustion was initiated by a special type autoignition where chemical
combustion reactions occurred at many points and time differences regarding
the start of combustion of these points are very small,
The attainment of ATAC combustion depended on uniform mixture properties
and high in-cylinder temperature, and proper ratios of new fuel-air charge to
EGR.
Noguchi et al. [85] in the same year presented similar results with decreased fuel
Chapter Three: Literature Survey on HCCI Combustion and engines
Page 40
consumption and decreased emissions of unburned hydrocarbons and they also
confirmed the similarities of reaction chemistry between autoignition in HCCI engines
and autoignition of the end-gas in SI engines through the analysis of formation of the
radicals associated with autoignition in both the engines
Najt and Foster [46] in 1983 first applied HCCI combustion technology to a four-
stroke gasoline engine with blends of paraffinic and aromatic fuels over a range of
engine speeds and dilution levels. From simplified chemical kinetically controlled
modeling and heat release analysis, they concluded that HCCI combustion is a
chemical kinetic combustion process, in which start of autoignition is governed by low
temperature (< 950 K) hydrocarbon oxidation kinetics and energy release is
controlled by high temperature (above 1000 K) chemistry. They also concluded the
limitation of ignition control and operating range in HCCI combustion.
Thring [44] in 1989 first proposed the term of Homogeneous Compression Charge
ignition (HCCI) for this newly discovered combustion concept in internal engines. He
studied the operating parameters of a four-stroke engine running with compressed
homogeneous charge through mapping the operating regime by varying equivalence
ratios, EGR rates, engine speeds and inlet temperatures. In Thring’s work concluded
that stable HCCI combustion could only be achieved at low speed, part load
conditions in a four-stroke engine in the absence of advanced operating strategies
and mechanisms.
Aoyama et al [5] in 1996 operated a single cylinder engine with inlet port injection of
gasoline, a compression ratio of 17.4 and premixed lean mixture. They named the
combustion method Premixed Charge Compression Ignition (PCCI) and concluded
that under conditions of stable combustion, the test engine was able to achieve
equivalent fuel economy and much lower NOX emission compared with CI engines.
In their work, they also studied the effects of intake air heating and supercharging on
extending the range of stable combustion and found both of the effects are found to
be significant.
Oguma et al. [48] in 1997 and Christensen et. al. [68] in 1999 studied HCCI
performance with a variety of fuels (Iso-octane, ethanol and natural gas) operating at
various compression ratios and intake temperatures. They found that HCCI
combustion is of intrinsic fuel flexibility. Under proper operating conditions, fuels with
any octane or Cetane number are theoretically applicable for HCCI combustion.
Chapter Three: Literature Survey on HCCI Combustion and engines
Page 41
Autoignition conditions vary from fuel to fuel. However, octane number of a fuel is a
critical parameter to determine the characteristics of autoignition such as ignition
delay, combustion duration, and heat release rate, etc.
3.4.2 Technologies in HCCI engine
Though HCCI combustion was regarded as an alternative combustion concept to
conventional SI and CI, a few major obstacles limit its application. However, during
the past 30 years, technologies applied in HCCI engines aim at overcoming all these
limitations have been widely developed
3.4.2.1 Variable Compression Ratio (VCR)
Compression ratio is a critical engine design parameter for HCCI engines. A high
compression ratio elevates the charge temperature, advances the start of
combustion, and shortens the combustion duration. Therefore, variable compression
ratios (VCR) engine can be used to control combustion phasing and widen operation
range of a HCCI engine [59,68,86]. Furthermore, high compression ratios with
resultant high expansion ratios contribute to high thermal efficiencies. Christensen et
al [68] varied the compression ratio from 10:1 to 28:1 with a constant air/fuel
equivalence ratio of 3.0 using a port injection system. They concluded that gasoline
required a compression ratio of 22.5:1 for satisfactory operation without the use of
inlet air preheating. The results showed that no smoke was generated and that NOX
emissions were very low with increased compression ratio. However, compression
ratios beyond 12 are likely to produce severe knock problems for the rich mixtures
used at high load conditions. It seems that the best compromise is to select the
highest possible CR to obtain satisfactory full load performance from SI fuels [46]. it
should also be noted that VCR would add some cost and complexity to the engine.
A major technical issue for VCR is to achieve the fast response to handle rapid
transients in vehicle application. A few relative options have been developed and
examined in IC engines:
One option is to mount a plunger in the cylinder head whose position can be
varied to change the compression ratio [68].
The second option is to vary the CR using an opposed-piston engine design
having variable phase-shifting between the two crankshafts [87].
SAAB has also announced the development of another method that is based
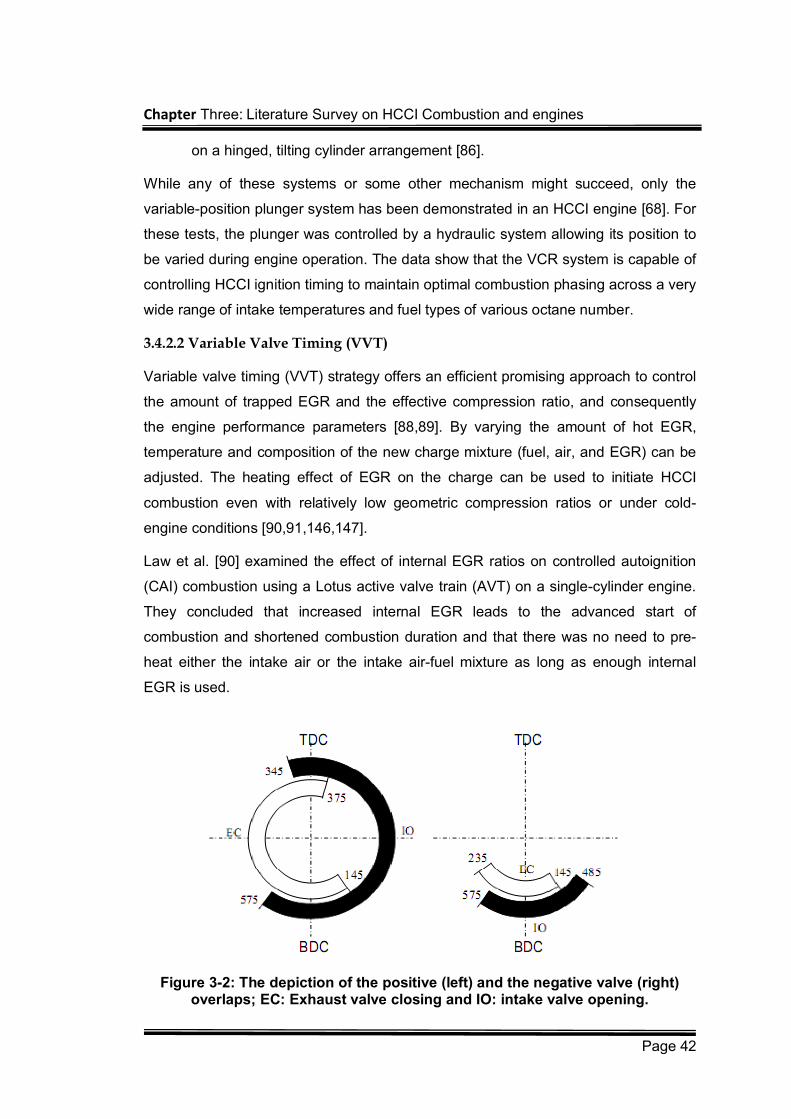
Chapter Three: Literature Survey on HCCI Combustion and engines
Page 42
on a hinged, tilting cylinder arrangement [86].
While any of these systems or some other mechanism might succeed, only the
variable-position plunger system has been demonstrated in an HCCI engine [68]. For
these tests, the plunger was controlled by a hydraulic system allowing its position to
be varied during engine operation. The data show that the VCR system is capable of
controlling HCCI ignition timing to maintain optimal combustion phasing across a very
wide range of intake temperatures and fuel types of various octane number.
3.4.2.2 Variable Valve Timing (VVT)
Variable valve timing (VVT) strategy offers an efficient promising approach to control
the amount of trapped EGR and the effective compression ratio, and consequently
the engine performance parameters [88,89]. By varying the amount of hot EGR,
temperature and composition of the new charge mixture (fuel, air, and EGR) can be
adjusted. The heating effect of EGR on the charge can be used to initiate HCCI
combustion even with relatively low geometric compression ratios or under cold-
engine conditions [90,91,146,147].
Law et al. [90] examined the effect of internal EGR ratios on controlled autoignition
(CAI) combustion using a Lotus active valve train (AVT) on a single-cylinder engine.
They concluded that increased internal EGR leads to the advanced start of
combustion and shortened combustion duration and that there was no need to pre-
heat either the intake air or the intake air-fuel mixture as long as enough internal
EGR is used.
Figure 3-2: The depiction of the positive (left) and the negative valve (right) overlaps; EC: Exhaust valve closing and IO: intake valve opening.
Chapter Three: Literature Survey on HCCI Combustion and engines
Page 43
Conventionally, the intake and exhaust valves of a typical four-stroke cycle engine
are actuated by lobes fitted on camshafts. The configuration of these lobes primarily
controls the valve events (timing, lift and duration). The standard valve strategy in SI
and CI engines involves high lift, long duration and positive valve overlapping (PVO),
while the modified valve strategy that is compatible with the HCCI combustion mode
implies low lift, short duration and negative valve overlapping (NVO) [92]. The typical
PVO and NVO overlaps are shown in Figure 3-2. The latter is used to facilitate the
autoignition by trapping a proportion of the hot exhaust gases in the engine cylinder
during the gas exchange process. The NVO is normally created by closing the
exhaust valves relatively early in the exhaust stroke and opening the intake valves
relatively late in the intake stroke.
During the course of NVO, the trapped exhaust gases are in compression throughout
the final stage of exhaust stroke, called re-compression stage, and then expand on
the early stage of intake stroke as the piston moves downwards, called re-expansion
stage. The NVO is called symmetric when the timing of exhaust-valve-closing (EVC)
is coupled with a symmetric degree of intake-valve-opening (IVO), measured with
respect to the piston top dead centre (TDC) position [92].
VVT can be implemented in an engine with mechanical, magnetic, or hydraulic valve
actuators [90,93]. Furthermore, modeling studies are being conducted to enhance
VVT operation for the control of the HCCI process [94,95]. However, Similar to VCR,
a VVT system would add cost and complexity to the engine.
3.4.2.3 Supercharging and Turbocharging
Supercharging or turbocharging technologies have been widely developed and
applied in high performance SI and CI engines to improve the engine output power.
Therefore, research effort have been put on the application of intake pressure
boosting on HCCI engines
The influence of supercharging on HCCI was first experimentally investigated by
Christensen et al [19], which concluded that supercharging dramatically, increases
the attainable IMEP for HCCI. The highest attainable IMEP obtained in the study was
up to 14 bars with ultra low NOX emissions using natural gas as fuel. This was
achieved with a 2 bar boost pressure and a compression ratio of 17:1. The
subsequent studies used EGR [71] and a pilot fuel [153] to improve the ignition
properties of the mixture in an attempt to extend the upper load limit for HCCI. The
Chapter Three: Literature Survey on HCCI Combustion and engines
Page 44
study concluded that HCCI load limit could be extended when a supercharger is
applied in combination with EGR, without increasing the maximum cylinder pressure.
Hyvönen et al [96] investigated the HCCI operation ranges with both mechanical
supercharging and simulated turbocharging, and compared the operation range with
a natural aspirated SI with gasoline as fuel. It is found that the operating range could
be more than doubled with supercharging and higher brake efficiency was achieved
at the same loads in comparison of the natural aspirated SI engine.
Canakci [97] conducted experimental studies on the effect of inlet air pressure on the
performance and exhaust emissions of a DI-HCCI gasoline engine. The experiments
were performed at three different inlet air pressures while operating the engine at the
same equivalence ratio and intake air temperature as in normally aspirated HCCI
engine condition at different engine speeds. He concluded that intake pressure
boosting leads to earlier start of ignition, increased engine torque and brake thermal
efficiency, and decreased CO and NOX emission; and an increase in boost pressure
causes the need of leaner mixture, and requires more advanced injection timing to
achieve the maximum engine torque.
Application of supercharging and turbocharging still confront technical obstacles such
as that typical low exhaust temperatures of HCCI require special care in turbocharger
design in order to achieve high load/high efficiency operation and the higher cylinder
pressures make autoignition control at high loads even more critical, which limits its
potential application.
3.4.2.4 Stratified Charge
Stratified charge is a possible solution to the control and operating range challenge of
HCCI engines. A controlled stratified charge produces a range of fuel concentrations
throughout the combustion chamber by proper fuel injection and in-cylinder mixing. In
another word, charge stratification modifies local mixture properties (temperature and
composition, equivalent ratio). As a result, mixture stratification leads to sequent
autoignition of fuel-air-EGR mixture, thus smooth combustion heat release and
extended upper load operating limit [98,99]. Stratification of the fuel/air mixture
improves emissions and combustion efficiency during part-load operation [100].
However, local high temperature regions in stratification combustion results in an
increase of NOX emissions. Therefore, one of the challenges for stratification
combustion is to meet requirements of combustion control and load range extension
Chapter Three: Literature Survey on HCCI Combustion and engines
Page 45
while keeping low NOX emissions.
Optical studies [101], with high-speed CCD camera, showed that an increase in
stratification leaded to poor combustion quality near the cylinder walls, due to leaner
mixtures near the cylinder walls, which resulted in higher HC and CO emissions. The
maximum rate of heat release depends on stratification amount - a larger amount
gives a lower rate of heat release but the main heat release is advanced.
Charge stratification results in staged combustion, and thus leads to a larger
operating range, due to its effect on combustion phasing and rate of heat release.
This is because that the upper load limits originates from high heat release rates that
leads to high-pressure oscillations and the low load limits from late combustion
phasing that leads to high cycle-to-cycle variations [101].
Several potential mechanisms exist for achieving this partial charge stratification,
including varying in-cylinder fuel injection, injecting water, varying the intake and in-
cylinder mixing processes to obtain non-uniform fuel/air/residual mixtures, and
altering cylinder flows to vary heat transfer.
3.4.2.5 Direct Injection (DI)
Direct injection (DI) has been widely investigated to control the spontaneous
combustion as well as to expand the engine-operating region [102-105].
Standing et al [104] demonstrated the possibility of utilizing HCCI combustion in a
multi-cylinder GDI engine using substantially standard production parts and also
showed that the timing of the fuel injection could be used to control engine
parameters such as ignition timing. Also the effect that the timing of the fuel injection
as well as the valve timings, has on factors such as NOX and HC emissions, as well
specific fuel consumption and combustion duration
In early in-cylinder injection, fuel is injected early during the compression stroke.
Vaporization of the injected fuel is an endothermic, so it consumes the energy
released from the early stage reaction of fuel oxidation. As a result, the heat reaction
rates are decreased by this effect and the temperature time history of the mixture is
affected significantly. However, early injection timing results in a more homogeneous
mixture, and it can lead to thermodynamically unfavourable advanced combustion
timing under high load [105].
Dual-injection [106] or multiple-injection [105] has also been investigated to improve
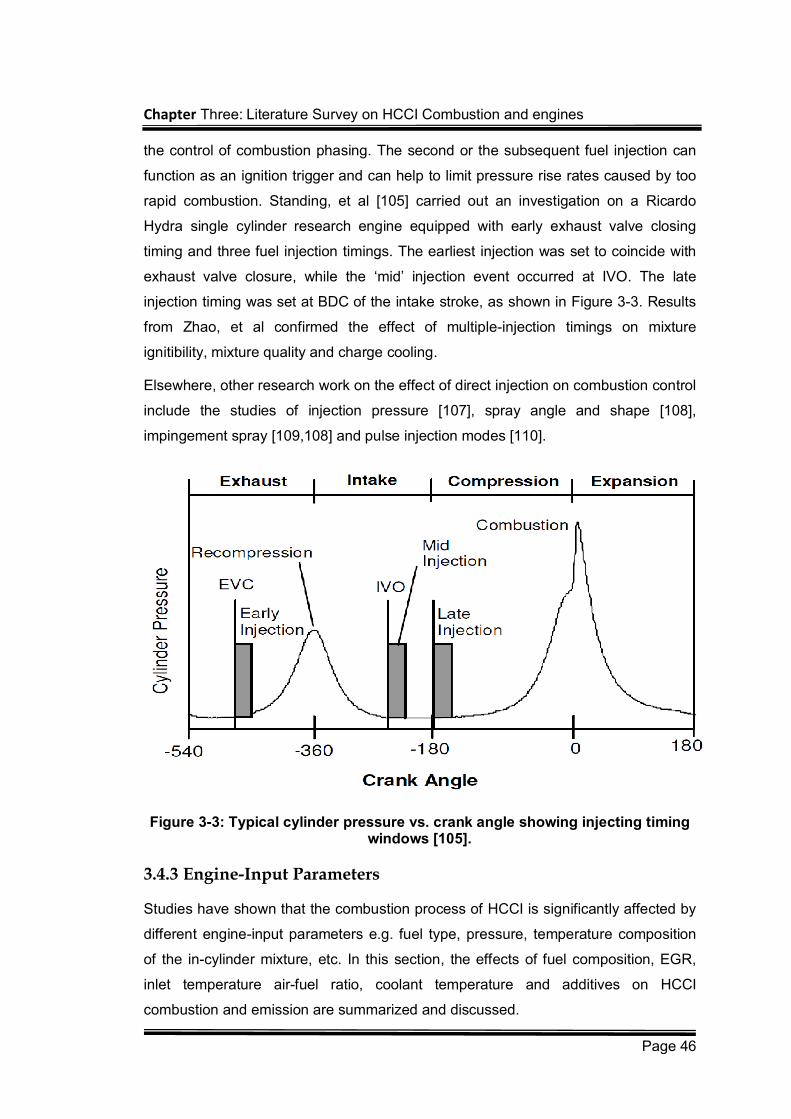
Chapter Three: Literature Survey on HCCI Combustion and engines
Page 46
the control of combustion phasing. The second or the subsequent fuel injection can
function as an ignition trigger and can help to limit pressure rise rates caused by too
rapid combustion. Standing, et al [105] carried out an investigation on a Ricardo
Hydra single cylinder research engine equipped with early exhaust valve closing
timing and three fuel injection timings. The earliest injection was set to coincide with
exhaust valve closure, while the ‘mid’ injection event occurred at IVO. The late
injection timing was set at BDC of the intake stroke, as shown in Figure 3-3. Results
from Zhao, et al confirmed the effect of multiple-injection timings on mixture
ignitibility, mixture quality and charge cooling.
Elsewhere, other research work on the effect of direct injection on combustion control
include the studies of injection pressure [107], spray angle and shape [108],
impingement spray [109,108] and pulse injection modes [110].
Figure 3-3: Typical cylinder pressure vs. crank angle showing injecting timing windows [105].
3.4.3 Engine-Input Parameters
Studies have shown that the combustion process of HCCI is significantly affected by
different engine-input parameters e.g. fuel type, pressure, temperature composition
of the in-cylinder mixture, etc. In this section, the effects of fuel composition, EGR,
inlet temperature air-fuel ratio, coolant temperature and additives on HCCI
combustion and emission are summarized and discussed.
Chapter Three: Literature Survey on HCCI Combustion and engines
Page 47
3.4.3.1 Fuel Composition
As introduced in the early section, one of the advantages of HCCI combustion is its
fuel flexibility. It is a well-accepted fact that autoignition process of HCCI combustion
is primarily controlled by a series of complex chain branching, carrying, and
terminating reactions involving stable and radical species. Thus, fuel molecular
structure plays a crucial role in determining the formation of these radical species
and affects the autoignition behaviour of the fuel.
Milovanovic [82] investigated the effects of four different types of fuels on ignition
time and heat release rate in HCCI engine. The four types of fuels are n-heptane,
iso-octane, ethanol and methane, which have different composition, molecular size
and structure and octane number (ON). They concluded that fuels with different
octane numbers exhibit various chemical reactivity. Fuels with low octane number
like n-heptane are more reactive and characterised with two-stage ignition with
Negative Temperature Coefficient (NTC) behaviour followed with main ignition. As a
contrast, fuel with high octane number like iso-octane is less reactive and featured
with single-stage ignition only. The reasoning behind the difference is the amount of
heat released prior to the main ignition event. High ON fuels release very little heat
during the early combustion stage. However, for the low ON fuels, significant heat is
released from low temperature reaction at around 800 K; although the amount of the
energy is not sufficient enough to lead to main ignition, it is capable of elevate
mixture temperature to 1050-1100 K, which is a threshold temperature for H2O2
decomposition and the start of main ignition. This is the reason that HCCI
combustion is sensitive to fuel types.
3.4.3.2 EGR
Exhaust Gas Recirculation (EGR) has been perhaps the most commonly investigated
method for the control of HCCI combustion. As aforementioned, HCCI combustion is
an autoignition process controlled by chemical kinetics, so change of composition,
temperature, thermal properties of in-cylinder mixture has a significant influence on
chemical reaction rates, which control ignition timing and energy release rate of the
combustion.
EGR offers a way to control the engine charge temperature, mixture and pressure.
Types of EGR are distinguished by location of mixing process between fuel-air
charges and exhaust gases. Hot exhaust gases trapped inside the cylinder prior to
Chapter Three: Literature Survey on HCCI Combustion and engines
Page 48
the compression stroke is commonly termed Internal EGR (IEGR) [89,90,111,112]
and can be obtained through Variable Valve Train (VVT) system. However, hot
exhaust gases recycled into intake manifold and mixed with the fresh charge mixture
before its induction into the engine cylinder is known as External EGR (EEGR)
[81,113].
Studies [56,63,81,112,114,115] claim that EGR has the effect on depleting the rate of
chemical reactions and thus delaying the ignition time, reducing the heat release rate
and lowering the peak cylinder pressure.
The effect of EGR on HCCI combustion can be divided into three aspects: a dilution
effect (inert gasses present in the EGR), a thermal effect (heat exchange, thermal
loss to the wall, EGR ratio mixture quality, EGR temperature, heat capacity), and a
chemical effect [82,115].
Thermal Effect – In the event of high load conditions, in order to control
ignition timing and combustion rate, cooled EEGR can be used to reduce the mixture
temperature during the compression stroke. However, under lean mixture conditions,
the high temperature of hot IEGR increases the temperature of the resulting charge
in the mixing process with the fresh air-fuel mixture and therefore influences the start
of ignition and further combustion. A higher temperature boosts kinetic reactivity
(chemical reactivity) with consequent advanced autoignition. The thermal effect of the
IEGR could be beneficial for HCCI combustion since it reduces the need of intake air
preheating and eliminates the dependence on the operating conditions.
Furthermore, the total heat capacity of mixture of EGR, air, and fuel will be higher
owing to the higher heat capacity of carbon dioxide and water vapour. This will lead
to a reduction of gas temperature at the end of the compression stroke
Dilution Effect – the volumetric occupation of EGR leads to a substantial
reduction of oxygen concentration in the mixture.
Chemical Effect – the introduction of EGR changes mixture composition and
species concentration and provides additional species such as UHC, CO, CO2, NO,
etc. taking part in the chemical reactions. As a result, chemical reaction rates will be
affected, which leads to the influence on ignition timing and combustion rate
3.4.3.3 Inlet temperature
HCCI combustion is predominated by chemical reaction, so the combustion event is
Chapter Three: Literature Survey on HCCI Combustion and engines
Page 49
highly sensitive to temperature. Intake charge temperature is one of the important
factors that affect ignition timing and heat release rate. Influence of intake charge
temperature on the HCCI ignition timing, burn duration, and the emissions have been
evaluated by many researchers [81,82,116]. Higher intake temperature boost kinetic
reactivity, the heat release grows and autoignition is accelerated. On the other hand,
decrease of inlet temperature delays ignition and for each fuel there exist a minimum
inlet temperature, below which ignition cannot be initiated.
However, intake temperature boost has its limitation of application due to its negative
effect on the indicated thermal efficiency, volumetric efficiency and trapped mass. An
increase in the intake temperature reduces trapped mass and volumetric efficiency,
which in turn adversely affect torque and power output [117]. Also advanced ignition
increases compression effort and combined with reduced volumetric efficiency leads
to the reduction in net indicated efficiency [82]. Furthermore, variation of intake
temperature is generally a slow process, so this method is not really practical,
especially under a transient condition.
3.4.3.4 Air-Fuel Equivalent Ratio (AFER)
Since HCCI combustion is initiated by autoignition of the air-fuel mixture by the piston
compression, no supplementary ignition source is required and therefore
considerably fuel lean mixture can be employed in HCCI engines. This refers to
AFER as lean as 2.0 [68] and wider AFER ranges over the ones applied in SI
engines. Thus, changing AFR directly influences the fuel concentration, effective
pressure, and mixture specific heats, which have significant impact on ignition timing
and fuel consumption rate and combustion rate. It has been found
[56,81,82,95,113,118,119] that decreasing AFER results in longer ignition delay and
lower combustion rate. This is because that excess air in the leaner mixture (AFER
increases) acts as a diluent absorbing heat and reducing the temperature rise from
the low temperature reaction, and the amount of compression heating is reduced due
to the lower mixture specific heat of leaner mixtures.
3.4.3.5 Coolant Temperature
Controlling the coolant temperature is another possible approach in extending the
operational range for a HCCI combustion mode [120,121]. It has been found that
coolant temperature influences the in-cylinder heat transfer process, which in turn
influences the charge mixture temperature and therefore the HCCI combustion
Chapter Three: Literature Survey on HCCI Combustion and engines
Page 50
process. With the increase of coolant temperate, the combustion phase advances
and the maximum heat release rate increases. Moreover, the maximum combustion
pressure also increases. Overall, coolant temperature has a similar but smaller
thermal effect on HCCI combustion compared with intake charge temperature.
3.4.3.6 Fuel Additives
As aforementioned, one of the critical obstacles to apply HCCI combustion is control
of ignition timing. One option for ignition control is to use small amounts of ignition-
enhancing additives to alter the ignition properties [122-125]. Most effective additives
are thermally unstable and their thermal decomposition could generate radicals
through thermal decomposition during the initiation stage of combustion, which
strongly affect the HCCI combustion of the air/fuel mixture [123]. The additives
having been investigated in the studies of HCCI combustion so far includes
formaldehyde [125], methane and DME [122], Di-tertiary Butyl Peroxide (DTBP) [27],
2-ethyl-hexyl-nitrate and di-tertiary-butyl-peroxide [123], etc.
3.5 Modelling Methods on HCCI combustion
Though HCCI was identified as a distinct combustion phenomenon about 30 years
ago, the modeling work had been somewhat late developed until 10 years ago, when
it was consistently accepted that HCCI combustion was purely controlled by chemical
kinetics with little effect of turbulence [126]. A pile of early experimental studies had
provided insight into the HCCI combustion, from which physical understanding of the
combustion process has been achieved. However, chemical understanding of the
combustion process has to be obtained through detailed chemical kinetics modeling
of the hydrocarbon oxidation process. CFD codes have the highest potential for
predicting realistic results when the geometry of the combustion chamber is resolved
in full detail. Thus, the ideal tool for HCCI analysis is a combination of a CFD code
with a detailed chemical kinetics code. However, the required computational
resources can become enormous, which is well beyond our current computational
capabilities. Reducing calculation times can be achieved by reducing CFD mesh
quality or/and downsizing the reaction mechanism implemented. Based on this point,
a variety of numerical models has been developed for different usage purposes in the
simulation of HCCI combustion and investigation of its characteristics. Major model
Chapter Three: Literature Survey on HCCI Combustion and engines
Page 51
types falls into three categories based on their physical descriptions of the
combustion processes.
Single-Zone Models
Multi-Zone Models
Multi-Dimensional CFD Models
This section is giving an overview of the models of the above types. Note that the
classification of the chemical kinetics mechanisms implemented in the simulation is
discussed with details in the following chapter.
3.5.1 Single-Zone Models
Single-zone models has been widely developed and applied to study the
characteristics of HCCI combustion [114,127,128]. This is mainly due to the simplicity
of such models and requirement of less computation time, even when they are
coupled with detailed chemical mechanisms.
In a single-zone HCCI model, the whole in-cylinder mixture is treated to be spatially
homogeneous and applies ideal gas law. Heat transfer to/from cylinder walls is
calculated by conductive heat transfer models, in general, using the Woschni’s
correlation [129]. The cylinder is considered as a closed chamber and the volume is
varied with time according to the slider-crank relationship [1]. Mass loss from the
cylinder and turbulence effect is negligible. By applying the conservation of mass,
energy and species and chemical kinetics principles, the governing equations can be
derived. Since such models have been widely investigated and are plentiful in the
literature [82,114,117,128], the governing equations are not presented here.
It has been claimed in literatures listed above that single-zone models have been a
valid approach in the studies of HCCI process. The main usability of single-zone
models are summarized as follows:
Single-zone models have shown ability in predicting the start of combustion
process (ignition timing), peak cylinder pressure, indicated power etc.
Single-zone models have been proved a useful tool for investigating certain
fundamental aspects of HCCI combustion, such as a parametric analysis of
the influence of engine parameters and fuel types. Eliminating the
complexities of walls, crevices, and mixture inhomogeneities simplifies the
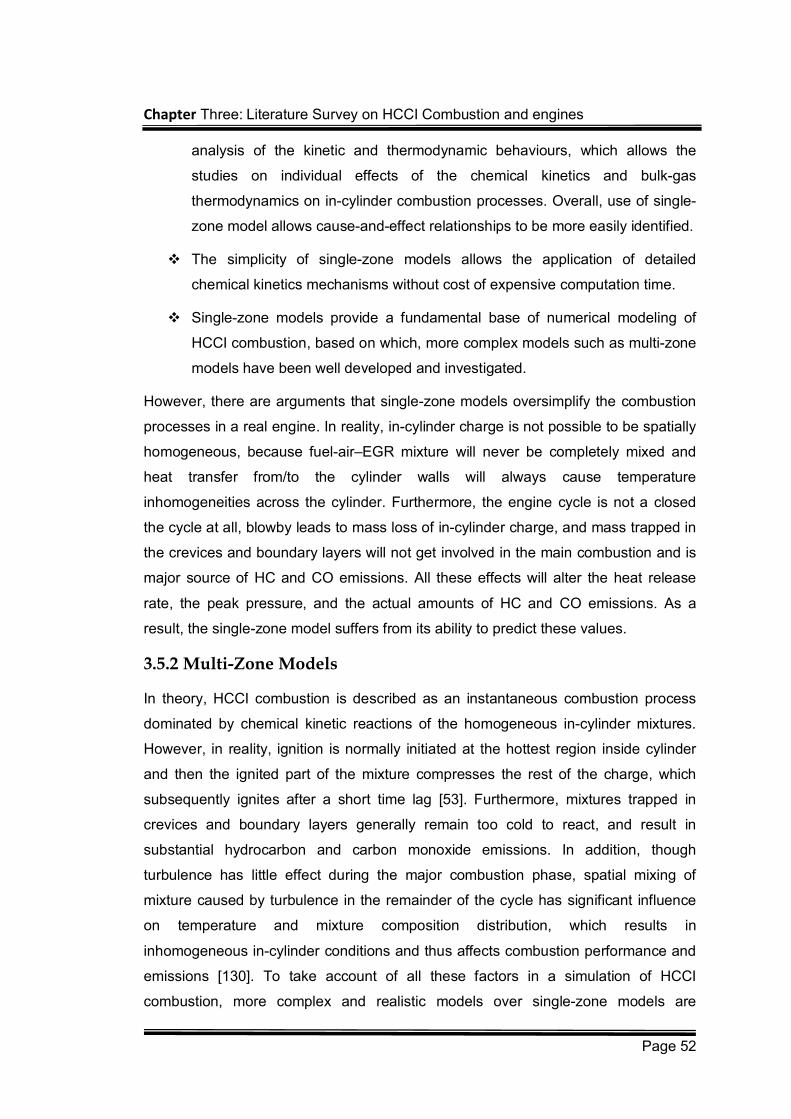
Chapter Three: Literature Survey on HCCI Combustion and engines
Page 52
analysis of the kinetic and thermodynamic behaviours, which allows the
studies on individual effects of the chemical kinetics and bulk-gas
thermodynamics on in-cylinder combustion processes. Overall, use of single-
zone model allows cause-and-effect relationships to be more easily identified.
The simplicity of single-zone models allows the application of detailed
chemical kinetics mechanisms without cost of expensive computation time.
Single-zone models provide a fundamental base of numerical modeling of
HCCI combustion, based on which, more complex models such as multi-zone
models have been well developed and investigated.
However, there are arguments that single-zone models oversimplify the combustion
processes in a real engine. In reality, in-cylinder charge is not possible to be spatially
homogeneous, because fuel-air–EGR mixture will never be completely mixed and
heat transfer from/to the cylinder walls will always cause temperature
inhomogeneities across the cylinder. Furthermore, the engine cycle is not a closed
the cycle at all, blowby leads to mass loss of in-cylinder charge, and mass trapped in
the crevices and boundary layers will not get involved in the main combustion and is
major source of HC and CO emissions. All these effects will alter the heat release
rate, the peak pressure, and the actual amounts of HC and CO emissions. As a
result, the single-zone model suffers from its ability to predict these values.
3.5.2 Multi-Zone Models
In theory, HCCI combustion is described as an instantaneous combustion process
dominated by chemical kinetic reactions of the homogeneous in-cylinder mixtures.
However, in reality, ignition is normally initiated at the hottest region inside cylinder
and then the ignited part of the mixture compresses the rest of the charge, which
subsequently ignites after a short time lag [53]. Furthermore, mixtures trapped in
crevices and boundary layers generally remain too cold to react, and result in
substantial hydrocarbon and carbon monoxide emissions. In addition, though
turbulence has little effect during the major combustion phase, spatial mixing of
mixture caused by turbulence in the remainder of the cycle has significant influence
on temperature and mixture composition distribution, which results in
inhomogeneous in-cylinder conditions and thus affects combustion performance and
emissions [130]. To take account of all these factors in a simulation of HCCI
combustion, more complex and realistic models over single-zone models are
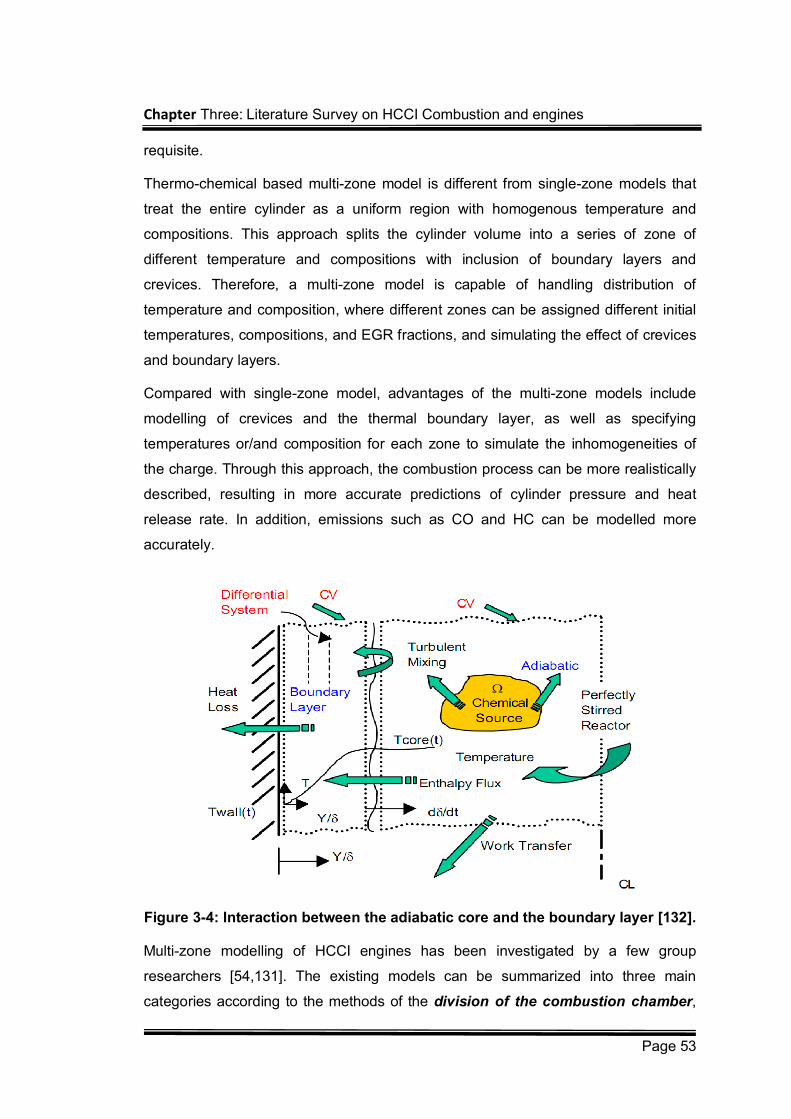
Chapter Three: Literature Survey on HCCI Combustion and engines
Page 53
requisite.
Thermo-chemical based multi-zone model is different from single-zone models that
treat the entire cylinder as a uniform region with homogenous temperature and
compositions. This approach splits the cylinder volume into a series of zone of
different temperature and compositions with inclusion of boundary layers and
crevices. Therefore, a multi-zone model is capable of handling distribution of
temperature and composition, where different zones can be assigned different initial
temperatures, compositions, and EGR fractions, and simulating the effect of crevices
and boundary layers.
Compared with single-zone model, advantages of the multi-zone models include
modelling of crevices and the thermal boundary layer, as well as specifying
temperatures or/and composition for each zone to simulate the inhomogeneities of
the charge. Through this approach, the combustion process can be more realistically
described, resulting in more accurate predictions of cylinder pressure and heat
release rate. In addition, emissions such as CO and HC can be modelled more
accurately.
Figure 3-4: Interaction between the adiabatic core and the boundary layer [132].
Multi-zone modelling of HCCI engines has been investigated by a few group
researchers [54,131]. The existing models can be summarized into three main
categories according to the methods of the division of the combustion chamber,
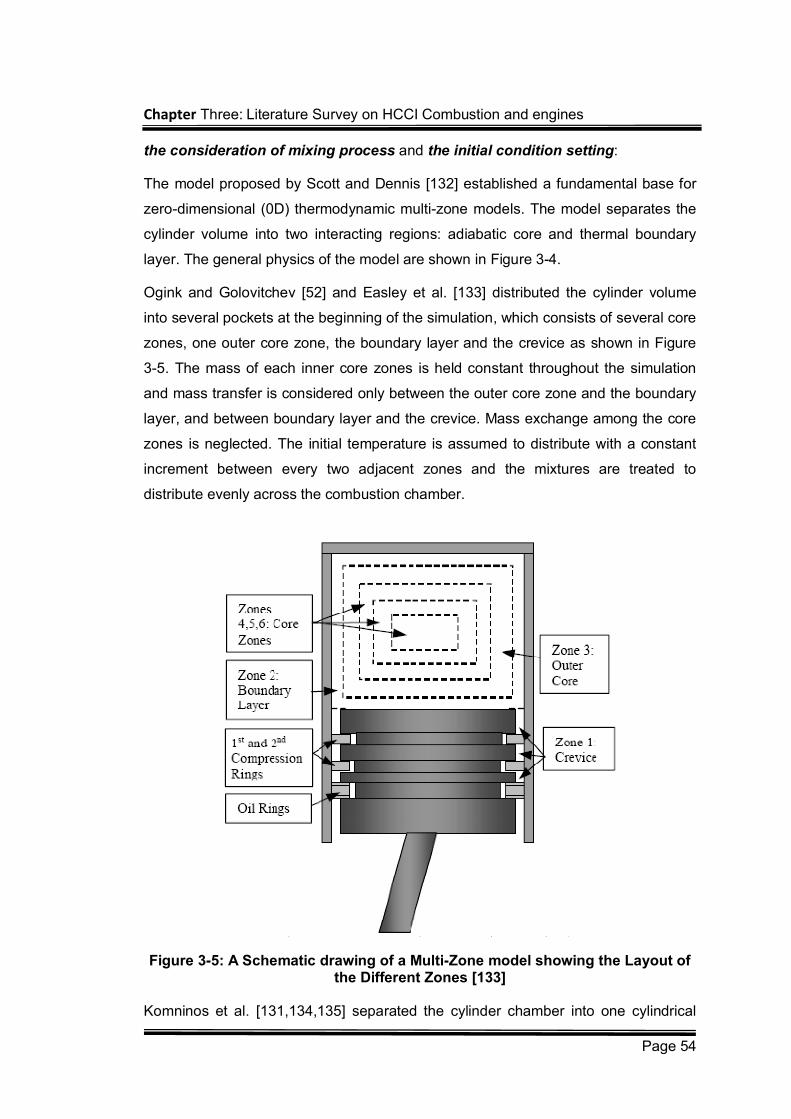
Chapter Three: Literature Survey on HCCI Combustion and engines
Page 54
the consideration of mixing process and the initial condition setting:
The model proposed by Scott and Dennis [132] established a fundamental base for
zero-dimensional (0D) thermodynamic multi-zone models. The model separates the
cylinder volume into two interacting regions: adiabatic core and thermal boundary
layer. The general physics of the model are shown in Figure 3-4.
Ogink and Golovitchev [52] and Easley et al. [133] distributed the cylinder volume
into several pockets at the beginning of the simulation, which consists of several core
zones, one outer core zone, the boundary layer and the crevice as shown in Figure
3-5. The mass of each inner core zones is held constant throughout the simulation
and mass transfer is considered only between the outer core zone and the boundary
layer, and between boundary layer and the crevice. Mass exchange among the core
zones is neglected. The initial temperature is assumed to distribute with a constant
increment between every two adjacent zones and the mixtures are treated to
distribute evenly across the combustion chamber.
Figure 3-5: A Schematic drawing of a Multi-Zone model showing the Layout of the Different Zones [133]
Komninos et al. [131,134,135] separated the cylinder chamber into one cylindrical
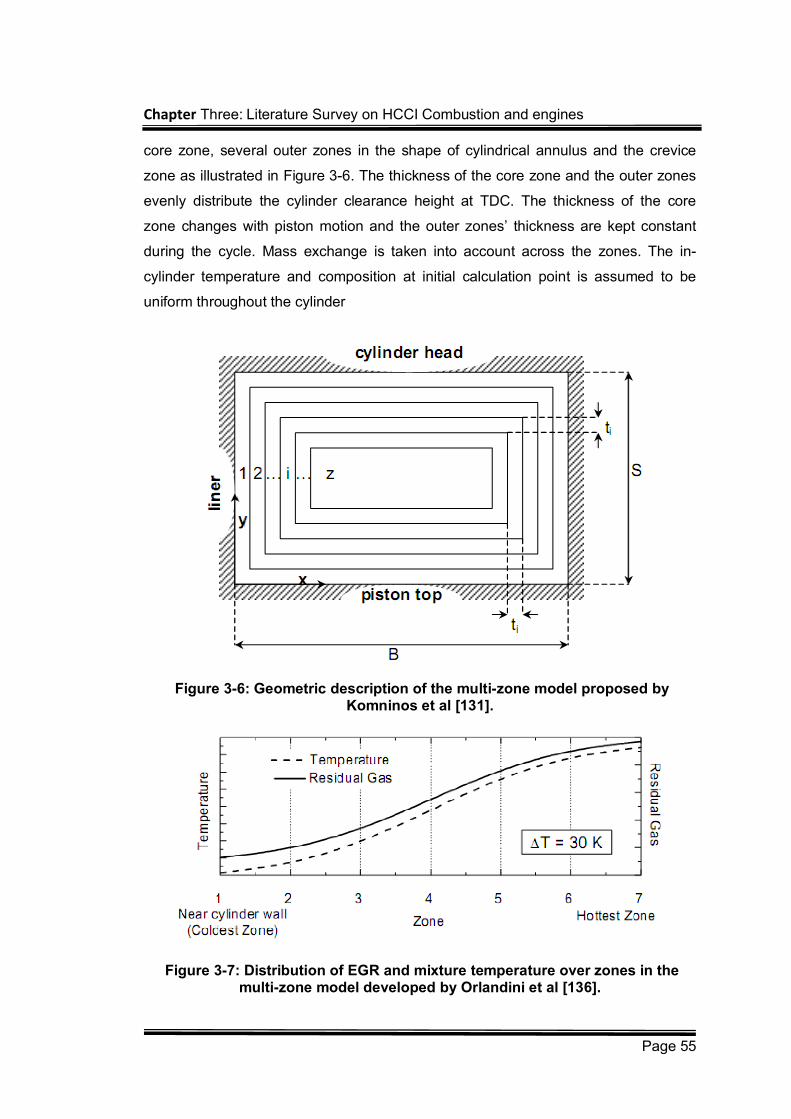
Chapter Three: Literature Survey on HCCI Combustion and engines
Page 55
core zone, several outer zones in the shape of cylindrical annulus and the crevice
zone as illustrated in Figure 3-6. The thickness of the core zone and the outer zones
evenly distribute the cylinder clearance height at TDC. The thickness of the core
zone changes with piston motion and the outer zones’ thickness are kept constant
during the cycle. Mass exchange is taken into account across the zones. The in-
cylinder temperature and composition at initial calculation point is assumed to be
uniform throughout the cylinder
Figure 3-6: Geometric description of the multi-zone model proposed by Komninos et al [131].
Figure 3-7: Distribution of EGR and mixture temperature over zones in the multi-zone model developed by Orlandini et al [136].
Chapter Three: Literature Survey on HCCI Combustion and engines
Page 56
Orlandini et al. [136] zonally divided the combustion chamber into fixed mass zones,
each zone is designated a volume percentage at beginning of the simulation. The
mass mixing process is neglected, so the zones are interacted only through work.
The inhomogeneous distribution of EGR and in-cylinder temperatures are defined by
assigning a constant temperature gradient T between the zones having the highest
and smallest temperature as shown in Figure 3-7, and then temperatures of the other
zone are arbitrarily adjusted to match the calculation results and experimental
results. The EGR densities over the zones are assigned according to the
temperature distribution, by which the zones of high temperature are assigned high
EGR densities.
Despite the beneficial aspects of a multi-zone model, there are still unsolved
technical problems of such model that hinder its extensive application. Firstly, with an
increasing number of zones, calculation time becomes significantly increased,
especially in the case of application of detailed chemical kinetics mechanisms, even
for relatively simple multi-zone models, use of detailed mechanisms is
computationally expensive.
Secondly, initial condition setting (normally at IVC) is still a major problem of HCCI
multi-zone modeling. In order to evaluate the HCCI process, initial conditions for
each zone must be defined for the multi-zone models. This means that the initial
values for mixture composition, cylinder pressure, zone temperatures and EGR
fractions etc in each individual zone have to be specified. Currently, three kinds of
approaches in literatures have been investigated and applied in determining the IVC
condition for multi-zone models.
Empirical data based adjustment [131,133,134,136] – this approach
evaluates the IVC conditions in use of average empirical data and assigns the
conditions of each zone in a experience-based manner.
Engine cycle simulation based adjustment [52] – a code for engine cycle
simulation is applied in this approach to calculate the thermodynamic properties and
mixture composition at IVC from gas exchange processes
CFD model based adjustment [53,65,137] - Computational Fluid Dynamics
(CFD) calculations are performed in this approach to simulate the gas exchange
processes and part of the compression till a computing point, from which a multi-zone
model takes over to carry on the simulation for the rest of the engine processes
Chapter Three: Literature Survey on HCCI Combustion and engines
Page 57
However, IVC conditions obtained from those approaches need to be arbitrarily
adjusted (especially temperature) to match experimental results. This limits the
confidence in such models in predicting HCCI combustion behaviour over any range
of conditions wider than available experimental data [138].
3.5.3 Multi-Dimensional CFD Models
CFD modeling has been the dominant simulation and optimisation tool used in the
modern engine design attributing to it powerful abilities in geometry representations.
Thus, a full-scale integration of CFD model with detailed chemical kinetics model,
theoretically, provides unparalleled simulation accuracy and details in presenting
combustion behaviour. However, numerical modeling of this scale requires
substantial computer resources in CPU speed, large-scale storage, and robust and
fast numerical solution algorithm. Although, to date, the speed and power of
computer resources has been significant improved, the simulation time for a CFD
model with detailed chemical kinetics is still measured in weeks to months, which
prevents the routine use of CFD models in the design process.
As a result, while CFD models have many great benefits, its implementation is
markedly hampered by the size of chemical reaction mechanisms that can be
incorporated with effectively. Typical CFD solutions are to sacrifice chemical
accuracy for accuracy in geometry and flow by applying global (single-step) reactions
or a set of severely reduced chemical reaction step [139-142]. However, this
approach not only degrades the prediction accuracy but also is still computationally
expensive. Another solution, as a contrast, is to reduce the full-scale CFD mesh to a
one- or two- dimensional CFD mesh [52,143-145]. However, the computational time
of such approach is still costly on current computers, especially when incorporated
with detailed reaction mechanisms.
One of the solutions to the application of CFD code is the hybrid approaches, which
incorporate the CFD models with multi-zone HCCI models in either sequential or
parallel manners.
Aceves et al [53] firstly presented such a hybrid approach that formed a segregated
sequential CFD Multi-zone thermo-kinetic Model. In their work, a hybrid approach
integrating a Computational Fluid Dynamic (CFD) model (KIVA) with a multi-zone
model with detailed chemical kinetics is presented. The CFD model is employed to
solve the temperature and mixture composition until a transition time point prior to the
Chapter Three: Literature Survey on HCCI Combustion and engines
Page 58
ignition, at which a multi-zone model substitutes for the CFD model to simulate the
combustion and expansion process. The multi-zone model defines the zones by
mass distribution and assumes no mixing between neighbouring zones. The initial
conditions at the transition point for the multi-zone model are determined by the CFD
model. The multi-dimensional results from the CFD model are reanalyzed and
grouped to represent the temperature and mass, RGF distributions of a one-
dimensional order. This process groups the cells of similar temperature and pressure
history into a limited number of zones at the transition point.
The model was validated against experimental results and showed that the model
predicts cylinder pressure and burn durations well, but HC and CO emissions were
not predicted very accurately. Due to the application of the CFD model and the
application of the detailed chemical kinetic mechanism in the multi-zone model, the
computational time is still of a scale of hours or days which is usually unacceptably
high for parametrical study. Moreover, this approach involves uncertainties in zone
property definition and the selection of the transition point.
Another hybrid approach was presented by Flowers et al. [130], which combined a
multi-zone model and a CFD model. In this approach, the two models are calculated
in parallel during the compression and expansion strokes. At each time step, the
CFD model carried out the computation of fluid dynamics, while the multi-zone model
performed the calculations of detailed chemical kinetics. Information transfer between
the two models took place at each time step. The advantage of this approach was
that the fluid mechanic processes were calculated on a highly resolved grid, while the
much more computationally expensive chemical kinetics processes could be solved
for a limited number of computational zones [146].
Furthermore, the prediction of HC and CO emissions was significantly improved
compared with the previous single-zone and multi-zone models. This results from the
CFD simulation of the mixing process of the in-cylinder charge across zones during
the expansion process, during which unburned or partially burned fuel and
intermediates from low temperature regions (the crevices and boundary layers)
diffused to hotter regions. Part of the released mixture is emitted as exhaust gases
and the rest may further react at high temperature to convert to final oxidation
productions.
In summary, CFD modeling allows for the provision of detailed information of initial
Chapter Three: Literature Survey on HCCI Combustion and engines
Page 59
conditions and the incorporation of a CFD model with a multi-zone model offers a
great advantage in computational time over a full integration of a CFD model with
detailed chemical kinetics. However, the incorporative employment of the CFD model
with the multi-zone chemical kinetics model is still under development and requires
further investigation.
3.6 Summary
HCCI is a new combustion concept that can be applied in IC engines. In HCCI
engines, the fuel and air are premixed to create homogeneous charge. During the
compression stroke, the charge is compressed to autoignite around TDC. HCCI
combustion is therefore an autoignition driven combustion process. As are results,
the combustion process is primarily controlled by chemical kinetics of the fuel
oxidation.
One of the major advantages of HCCI combustion is small cycle-to-cycle variations of
the combustion process. The other advantages are low NOX emissions and virtually
no soot compared to diesel engines and higher part load efficiency compared with SI
engines. However, due to the ignition occurs spontaneously at multiple points, HCCI
features uncontrolled ignition timing. As autoignition has much shorter combustion,
phase compared with flame propagation driven combustion as in SI engines, HCCI
suffers from high combustion rate and high peak in-cylinder pressure at AFRs close
to or above stoichiometric, which will cause damages to the engine body and
produce unpleasant combustion noise. Consequently, HCCI is best operated at lean
conditions. However, lean conditions leads to the relatively lower combustion
temperature compared with that in SI engines, which results in relatively lower power
density and high emissions of unburned hydrocarbon, especially at low loads.
In terms of the challenges presented with HCCI combustion, some technologies have
been developed and applied for the solutions. EGR gases can be used to limit the
rate of combustion. Adjustment of inlet temperature and EGR amount can be applied
to control ignition timing. In the recent years, VVT systems emerged as a mean of
controlling combustion rates as well. There are also many other technologies are
developed to cope with the challenges with HCCI combustion such as turbocharging,
stratified charge, direct injection, etc.
Chapter Three: Literature Survey on HCCI Combustion and engines
Page 60
A variety of numerical models has been developed in the simulation of HCCI
combustion to investigate its combustion characteristics. Major model types falls into
three categories based on the dissimilarity of their physical descriptions of the
combustion processes
Single-Zone Models
Multi-Zone Models
Multi-Dimensional CFD Models
The single-zone models treat the combustion chamber as a closed system filed with
homogeneous mixtures. It has been proven that single-zone models have been a
valid approach in the studies of HCCI process in respect of numerical prediction of
ignition timing and peak cylinder pressure, etc. and parametric analysis of the
influence of engine parameters and fuel types. However, single-zone models
oversimplify the real combustion scenario in HCCI engines, which results in
inaccuracy in modelling heat release rate, CO and HC emissions, combustion
completeness and peak cylinder pressure.
Multi-zone models stand out over single-zone models by embodying the description
of the mixture inhomogeneity and the effect of the crevices and the thermal boundary
layer and as well as in-cylinder mixture dynamics. Taking account of these aspects
enable multi-zone models to model the combustion characteristics and emissions
more accurately, but when coupled with chemical kinetics, the number of the
variables needed to describe the system increases, which results in dramatic
increase of computational time.
CFD modeling specializes detailing engine geometries and specifying mixture flow
dynamics. When incorporated with chemical kinetics models, it provides unparalleled
accuracy in the simulation of HCCI combustion. However, the major drawback of
CFD model is the requirement of unacceptable and expensive computation cost. One
of the solutions to the application of CFD code is hybrid approaches combining multi-
zone models and CFD models, which is regarded as a compromise between
simulation accuracy and computation cost.
Chapter Four: Chemical Kinetics
Page 61
Chapter Four: Chemical Kinetics
4.1 What is ‘Chemical Kinetics’
The equilibrium composition of a reactive mixture can be predicted by the application
of thermodynamic laws, In the case of that the chemical processes are much faster
compared with the other processes like diffusion, heat transfer, flow etc. the
thermodynamics alone allow the description of the system locally. In most cases,
though, chemical reactions occur on timescales comparable with those of the flow
and of the molecular transport processes. Therefore, information is needed about the
rates at which the chemical reactions proceed. For this purpose, chemical kinetics
has been investigated to study the rates of chemical processes in an effort to
understand the factors that influence these rates and to develop theories that can be
used to predict chemical processes.
In the research of internal combustion engines, chemical kinetics fulfils the needs for
compact numerical models to represent hydrocarbon combustion and enables
establish and development of numerical models for the design and prediction of
performance of practical engine systems. In general, chemical kinetics forms a link
between experimental observation and numerical interpretations of the combustion
processes in internal combustion engines.
4.2 Rates, Rate laws and Rate Constants
In this section, three types of reactions that are global, elementary and chain
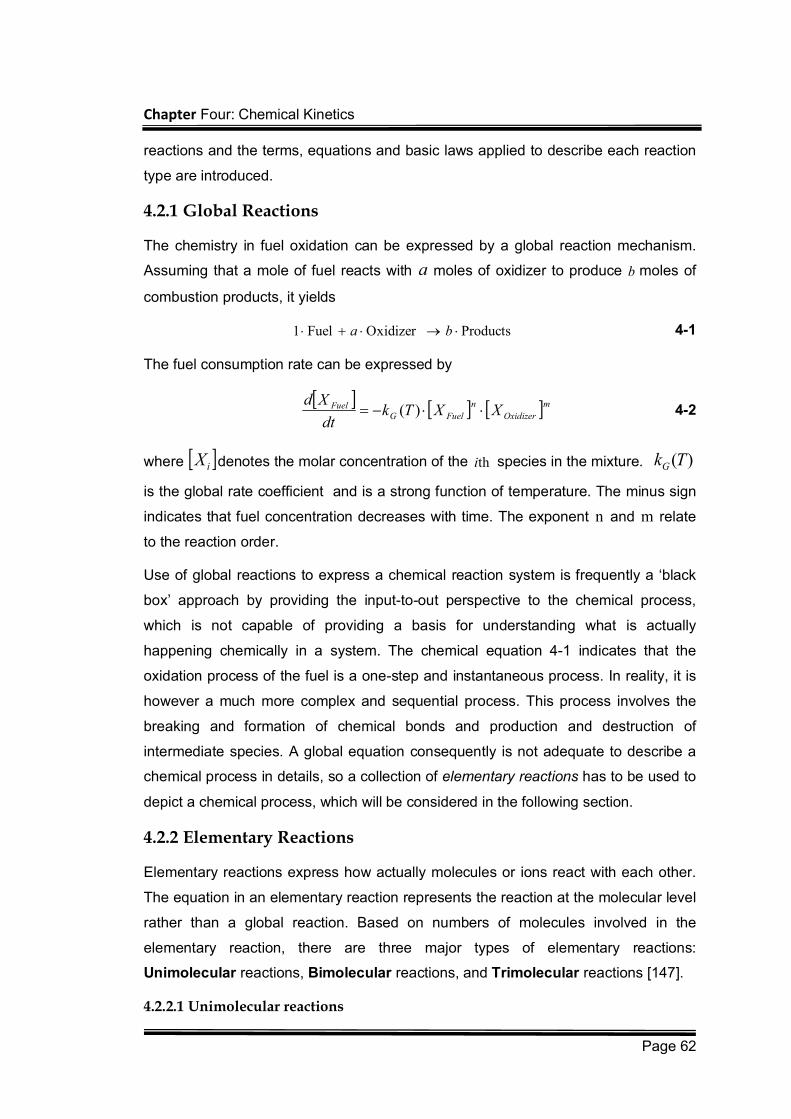
Chapter Four: Chemical Kinetics
Page 62
reactions and the terms, equations and basic laws applied to describe each reaction
type are introduced.
4.2.1 Global Reactions
The chemistry in fuel oxidation can be expressed by a global reaction mechanism.
Assuming that a mole of fuel reacts with a moles of oxidizer to produce b moles of
combustion products, it yields
ProductsOxidizerFuel1 ba 4-1
The fuel consumption rate can be expressed by
mOxidizer
n
FuelGFuel XXTk
dt
Xd )( 4-2
where iX denotes the molar concentration of the thi species in the mixture. )(TkG
is the global rate coefficient and is a strong function of temperature. The minus sign
indicates that fuel concentration decreases with time. The exponent n and m relate
to the reaction order.
Use of global reactions to express a chemical reaction system is frequently a ‘black
box’ approach by providing the input-to-out perspective to the chemical process,
which is not capable of providing a basis for understanding what is actually
happening chemically in a system. The chemical equation 4-1 indicates that the
oxidation process of the fuel is a one-step and instantaneous process. In reality, it is
however a much more complex and sequential process. This process involves the
breaking and formation of chemical bonds and production and destruction of
intermediate species. A global equation consequently is not adequate to describe a
chemical process in details, so a collection of elementary reactions has to be used to
depict a chemical process, which will be considered in the following section.
4.2.2 Elementary Reactions
Elementary reactions express how actually molecules or ions react with each other.
The equation in an elementary reaction represents the reaction at the molecular level
rather than a global reaction. Based on numbers of molecules involved in the
elementary reaction, there are three major types of elementary reactions:
Unimolecular reactions, Bimolecular reactions, and Trimolecular reactions [147].
4.2.2.1 Unimolecular reactions
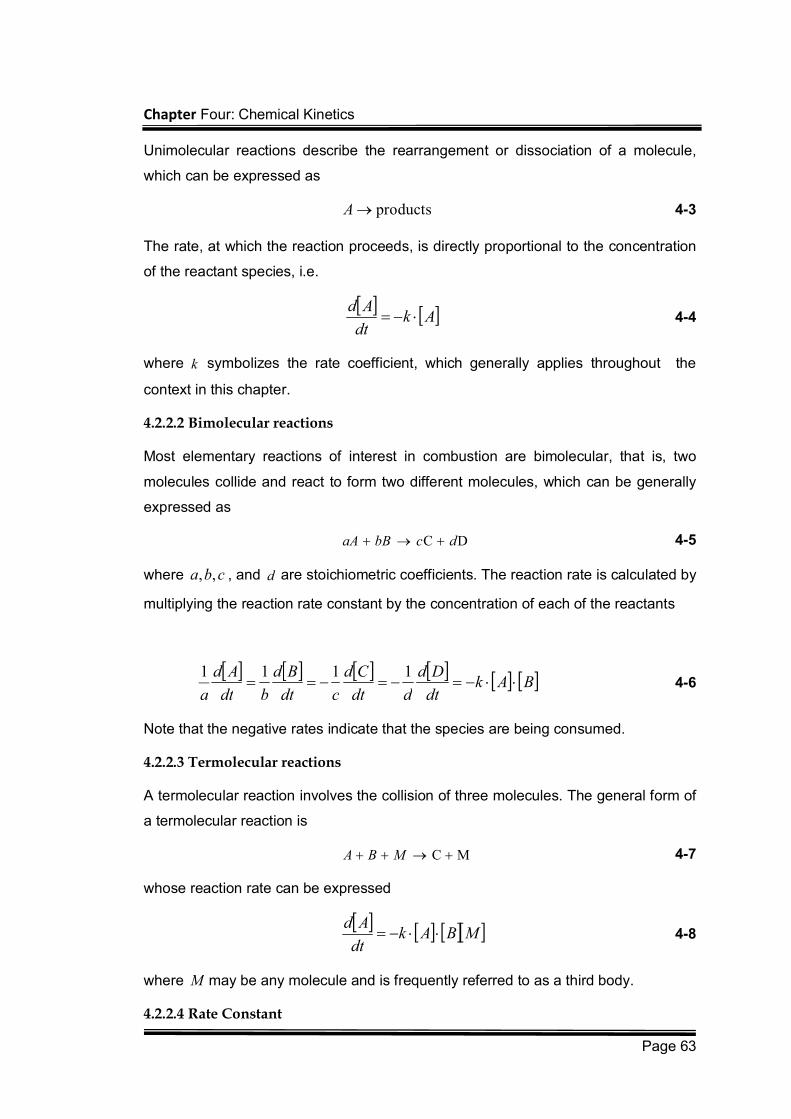
Chapter Four: Chemical Kinetics
Page 63
Unimolecular reactions describe the rearrangement or dissociation of a molecule,
which can be expressed as
productsA 4-3
The rate, at which the reaction proceeds, is directly proportional to the concentration
of the reactant species, i.e.
Akdt
Ad 4-4
where k symbolizes the rate coefficient, which generally applies throughout the
context in this chapter.
4.2.2.2 Bimolecular reactions
Most elementary reactions of interest in combustion are bimolecular, that is, two
molecules collide and react to form two different molecules, which can be generally
expressed as
DC dcbBaA 4-5
where cba ,, , and d are stoichiometric coefficients. The reaction rate is calculated by
multiplying the reaction rate constant by the concentration of each of the reactants
BAkdt
Dd
ddt
Cd
cdt
Bd
bdt
Ad
a
1111 4-6
Note that the negative rates indicate that the species are being consumed.
4.2.2.3 Termolecular reactions
A termolecular reaction involves the collision of three molecules. The general form of
a termolecular reaction is
MC MBA 4-7
whose reaction rate can be expressed
MBAkdt
Ad 4-8
where M may be any molecule and is frequently referred to as a third body.
4.2.2.4 Rate Constant
Chapter Four: Chemical Kinetics
Page 64
It has been observed from both kinetic theories of gases and experiments that the
rate constant k for an elementary reaction is an exponential function of temperature
and of the so-called Arrhenius form [148],
TRETATk uAb /exp 4-9
where A is the pre-exponential factor. E is the activation energy for the reaction
that is required to bring reactants to a reactive state such that the chemical bonds
can be rearranged to form products. Both A and E need to be determined from
experiment for most elementary reactions that occur in combustion.
4.2.3 Chain Reactions
Many gas-phase reactions are initiated by the formation, at very low concentration, of
an extremely reactive species that sets off a series of reactions leading to a self-
amplifying and self-sustaining chain of chemical events. Such a process is referred to
as a chain reaction, and typically, it occurs after a short induction period to allow the
formation of the reactive species [149]
4.2.3.1 Chain Reaction Mechanisms
The sequence of a reaction chain can be typically divided into four stages:
Initiation - in which a reactive intermediate, which may be an atom, an ion, or
a neutral molecular fragment, is formed, usually through the action of an agent such
as light, heat, or a catalyst.
Chain branching – whereby the intermediate reacts with the original
reactants, producing stable products and another intermediate, whether of the same
or different kind; the new intermediate reacts as before, so a repetitive cycle begins
and more radicals are produced than destroyed
Propagation – in which, the number of radicals does not change significantly,
but different radicals are produced
Termination – in which, radicals are destroyed either by gas-phase reactions
or by collision with surfaces.
A simple chain reaction mechanism applicable to combustion can be illustrated by
the following generic set
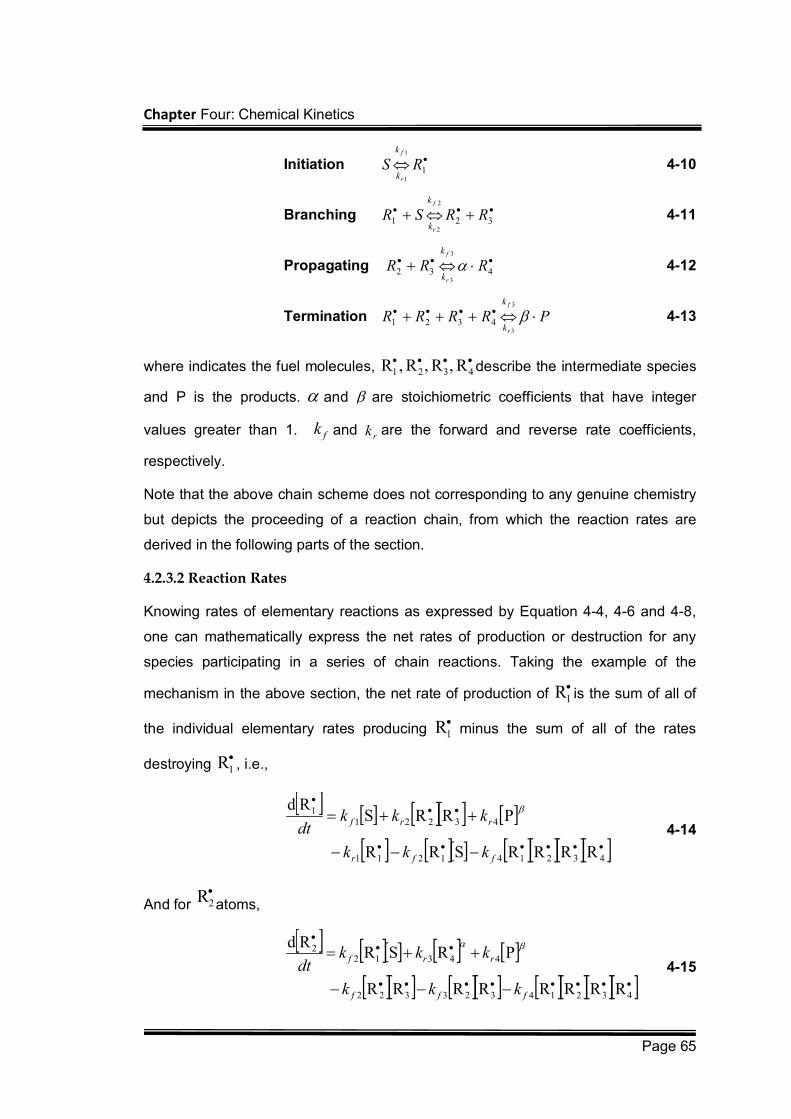
Chapter Four: Chemical Kinetics
Page 65
Initiation 1
1
1
RSf
r
k
k 4-10
Branching 321
2
2
RRSRf
r
k
k 4-11
Propagating 432
3
3
RRRf
r
k
k 4-12
Termination PRRRRf
r
k
k
3
34321 4-13
where indicates the fuel molecules, 4321 R ,R ,R ,R describe the intermediate species
and P is the products. and are stoichiometric coefficients that have integer
values greater than 1. fk and rk are the forward and reverse rate coefficients,
respectively.
Note that the above chain scheme does not corresponding to any genuine chemistry
but depicts the proceeding of a reaction chain, from which the reaction rates are
derived in the following parts of the section.
4.2.3.2 Reaction Rates
Knowing rates of elementary reactions as expressed by Equation 4-4, 4-6 and 4-8,
one can mathematically express the net rates of production or destruction for any
species participating in a series of chain reactions. Taking the example of the
mechanism in the above section, the net rate of production of 1R is the sum of all of
the individual elementary rates producing 1R minus the sum of all of the rates
destroying 1R , i.e.,
432141211
432211
RRRRSRR
PRRSRd
ffr
rrf
kkk
kkkdt
4-14
And for 2Ratoms,
43214323322
443122
RRRRRRRR
PRSRRd
fff
rrf
kkk
kkkdt
4-15
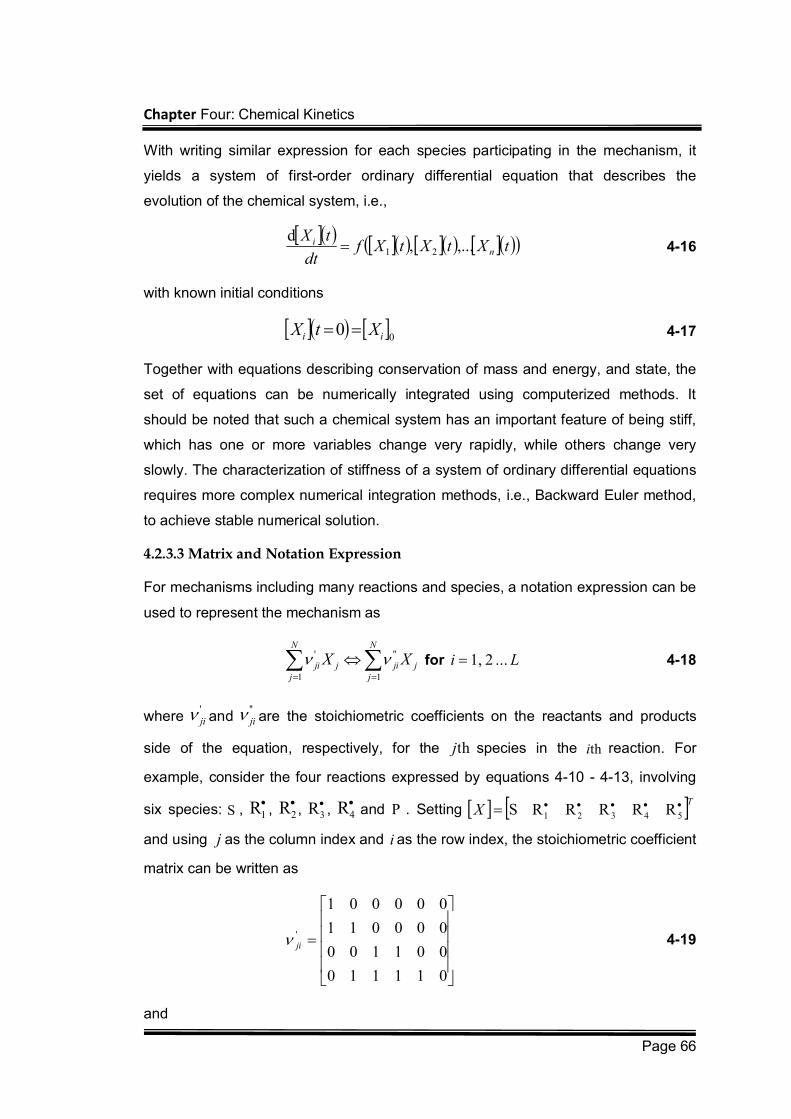
Chapter Four: Chemical Kinetics
Page 66
With writing similar expression for each species participating in the mechanism, it
yields a system of first-order ordinary differential equation that describes the
evolution of the chemical system, i.e.,
tXtXtXfdt
tXn
i ,...,d
21 4-16
with known initial conditions
0
0 ii XtX 4-17
Together with equations describing conservation of mass and energy, and state, the
set of equations can be numerically integrated using computerized methods. It
should be noted that such a chemical system has an important feature of being stiff,
which has one or more variables change very rapidly, while others change very
slowly. The characterization of stiffness of a system of ordinary differential equations
requires more complex numerical integration methods, i.e., Backward Euler method,
to achieve stable numerical solution.
4.2.3.3 Matrix and Notation Expression
For mechanisms including many reactions and species, a notation expression can be
used to represent the mechanism as
j
N
jjij
N
jji XX
1
''
1
' for Li ... 2 1, 4-18
where 'ji and
''ji are the stoichiometric coefficients on the reactants and products
side of the equation, respectively, for the thj species in the thi reaction. For
example, consider the four reactions expressed by equations 4-10 - 4-13, involving
six species: S , 1R ,
2R ,
3R ,
4R and P . Setting
and using j as the column index and i as the row index, the stoichiometric coefficient
matrix can be written as
011110
001100
000011
000001
'ji 4-19
and
TX 54321 RRRRRS
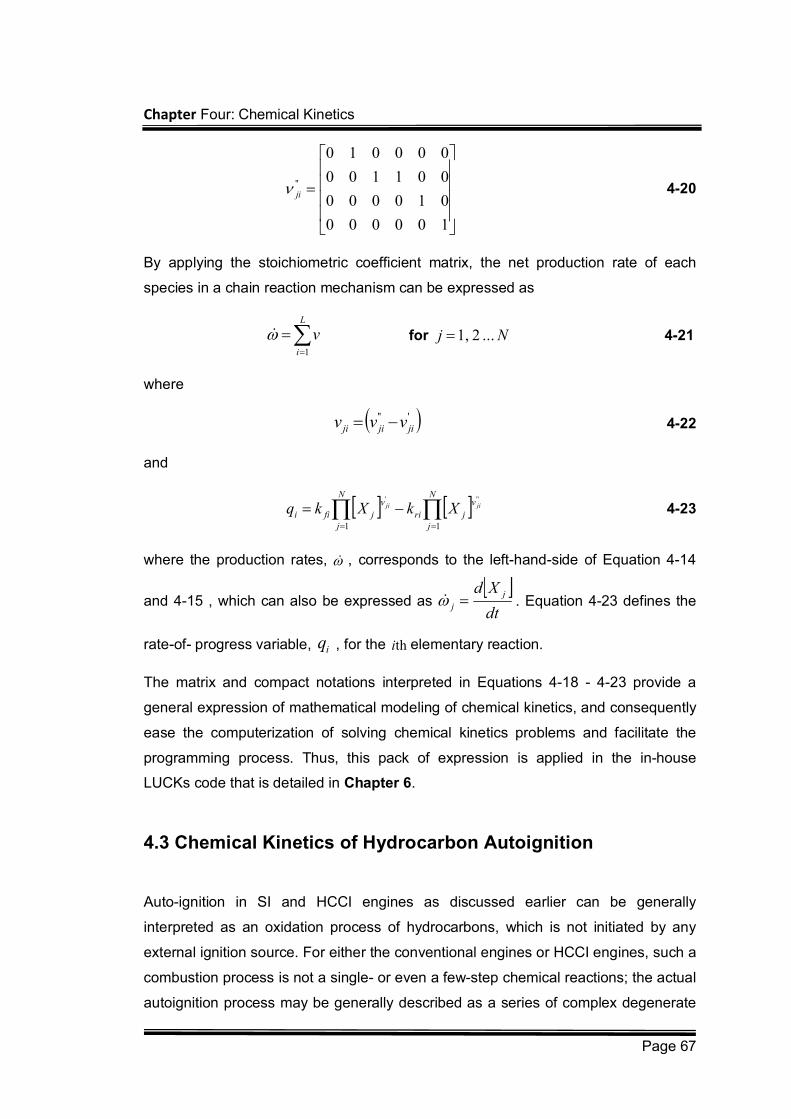
Chapter Four: Chemical Kinetics
Page 67
100000
010000
001100
000010
''ji 4-20
By applying the stoichiometric coefficient matrix, the net production rate of each
species in a chain reaction mechanism can be expressed as
L
i
v1
for Nj ... 2 1, 4-21
where
'''jijiji vvv 4-22
and
N
j
v
jri
N
j
v
jfiijiji XkXkq
11
'''
4-23
where the production rates, , corresponds to the left-hand-side of Equation 4-14
and 4-15 , which can also be expressed as dt
Xd j
j . Equation 4-23 defines the
rate-of- progress variable, iq , for the thi elementary reaction.
The matrix and compact notations interpreted in Equations 4-18 - 4-23 provide a
general expression of mathematical modeling of chemical kinetics, and consequently
ease the computerization of solving chemical kinetics problems and facilitate the
programming process. Thus, this pack of expression is applied in the in-house
LUCKs code that is detailed in Chapter 6.
4.3 Chemical Kinetics of Hydrocarbon Autoignition
Auto-ignition in SI and HCCI engines as discussed earlier can be generally
interpreted as an oxidation process of hydrocarbons, which is not initiated by any
external ignition source. For either the conventional engines or HCCI engines, such a
combustion process is not a single- or even a few-step chemical reactions; the actual
autoignition process may be generally described as a series of complex degenerate
Chapter Four: Chemical Kinetics
Page 68
chain branching, carrying and terminating reactions involving stable and radical
species.
This section is organized to discuss the gasoline composition and its surrogate first
and the chemistry of hydrocarbon oxidation is next presented followed by the
summarization of chemical kinetics models.
4.3.1 Gasoline Composition
Gasoline is a complex mixture of over 500 hydrocarbons that may have between 5 to
12 carbons. Alkanes type compounds of either straight chain or branched
compounds are present in greatest amounts. Smaller amounts of alkane cyclic and
aromatic compounds are present. Very small or trace amounts of alkenes are
present in gasoline [150]. Typical composition of gasoline is given in Table 4-1. The
data in Table 4-1 gives the volume fractions of the component groups in gasoline
Table 4-1: Typical Composition of Gasoline [150].
Typical Composition of Gasoline
General Name Examples Percentage %
Aliphatic - straight chain heptane 30-50
Aliphatic - branched isooctane
Aliphatic - cyclic Cyclo-pentane 20-30
Aromatic ethyl benzene 20-30
4.3.2 Gasoline Surrogates
Based on the above description, gasoline is a complex mixture of a large number of
hydrocarbon species, including alkanes, cyclo-alkanes, alkenes, aromatics, and
additives. For chemical kinetics modeling, all the species and corresponding
reactions will lead to terribly long calculation times, so it is unpractical to include all of
the species in the reaction mechanism, even if gasoline is analyzed thoroughly and
its composition is exactly known. Therefore, the oxidation of simple blends or
chemical surrogates has allowed a detailed examination of the combustion
processes for fuels that either have too many compounds or have variable
composition.
Based on the specific application of the surrogates to model gasoline combustion in
internal combustion engines, the following criteria are judged to be of the most
importance to form a fuel surrogate [146,151,152]
A gasoline surrogate should have similar autoignition and burn rate
Chapter Four: Chemical Kinetics
Page 69
characteristics under SI, CI or HCCI conditions as real gasoline.
The reaction mechanism for the surrogate should be of limited size to keep
computation times reasonable.
A (semi-)detailed reaction mechanism for the components of the surrogate to
be included should be available or conceivable.
Properties of the surrogate, such as the H/C ratio and the stoichiometric
air/fuel ratio, should be as similar as possible to those of the full boiling range
gasoline fuel.
A model surrogate does not necessitate having a chemical-class composition similar
to that of the real gasoline, since any attempt to fulfill the first criterion concerning
auto-ignition characteristics is expected to result in a fuel blend with a similar
chemical-class composition to that of the real fuel [146].
A mixture of the two types of paraffin are wildly accepted and used to model
gasoline; n-heptane and iso-octane (2, 2, 4-trimethyl-pentane). As well known, the
volume fractions of the two components are used to indicate the Research Octane
Number (RON). The Research Octane Number is determined by comparing the
characteristics of a gasoline to iso-octane (2, 2, 4-trimethylpentane) and n-heptane.
In many publications on combustion models [127,133,153-155], Mixtures of n-
heptane and iso-octane are stated as Primary Reference Fuels (PRFs) to represent
gasoline. Iso-octane is assigned an octane number of 100, which is used as a
reference for fuels that are very knock-resistant under SI engine conditions. In
general, it is a highly branched module that burns smoothly with little knock. On the
other hand, n-heptane, a straight chain, unbranched molecule is given an octane
rating of zero because of its bad knocking properties. Thus, RON is chosen to be a
measure of knocking resistance of fuels under standard conditions in a spark ignition
engine.
However, the H/C and A/F ratios of blends of n-heptane and iso-octane are generally
higher than those of gasoline. To improve the H/C and A/F ratios and make chemical
composition more similar to real fuel, an aromatic compound e.g. toluene [146], can
be added to the blends of n-heptane and iso-octane. However, research of
development and validity of reaction mechanisms involving aromatic have been
lagged behind, and in consequence, the blends of n-heptane and iso-octane are
more generally applied to represent gasoline in modelling gasoline combustion in SI
Chapter Four: Chemical Kinetics
Page 70
and HCCI engines.
4.3.3 Hydrocarbon Oxidation Chemistry
The gas phase oxidation of hydrocarbons has been studied since the early 1900s.
Since then, several theories have been forwarded as to the mechanism of
hydrocarbon oxidation. The foundation of today’s theory was forwarded by Semenov
(1935), which is based on the concept of free radicals [156]. A radical is an atom or
molecule with at least one unpaired electron in the outermost valence shell. Due to
the unfilled valence shell, radicals are highly reactive. Since Semenov, the theory has
been refined and enhanced, but the fundamental concept remains. Essentially, the
oxidation process is controlled by a sequence of elementary chemical reactions in
which radicals are created, propagated, or destroyed. These reactions can be
grouped into several fundamental classifications [157].
Primary Initiation: Formation of radicals from parent fuel molecule
Secondary Initiation: Radicals formed from other “stable” intermediates
Chain Branching: Reaction where the number of radicals increases
Chain Propagation: Reaction where the number of radicals remain
unchanged
Termination: Removal of radicals from the reaction
Thus, the combustion process hydrocarbon may be generally described as a series
of complex degenerate chain branching, carrying and terminating reactions involving
stable and radical species. It is commonly accepted that for hydrocarbon oxidation
these reactions may be separated into three distinct temperature regimes. Each
regime, low, intermediate, and high temperature regime, is dominated by reactions
involving different radical species and different pathways. Naturally, the combustion
environment, temperature, pressure and equivalence ratio affect the location of the
boundaries between each regime. For example, at one atmosphere, the hydrocarbon
oxidation process can be divided along the following boundaries [6]:
Low temperature regime: < 650 K
Intermediate temperature regime: 650 – 1000 K
High temperature regime: > 1000 K
4.3.4 The Oxidation of N-Heptane
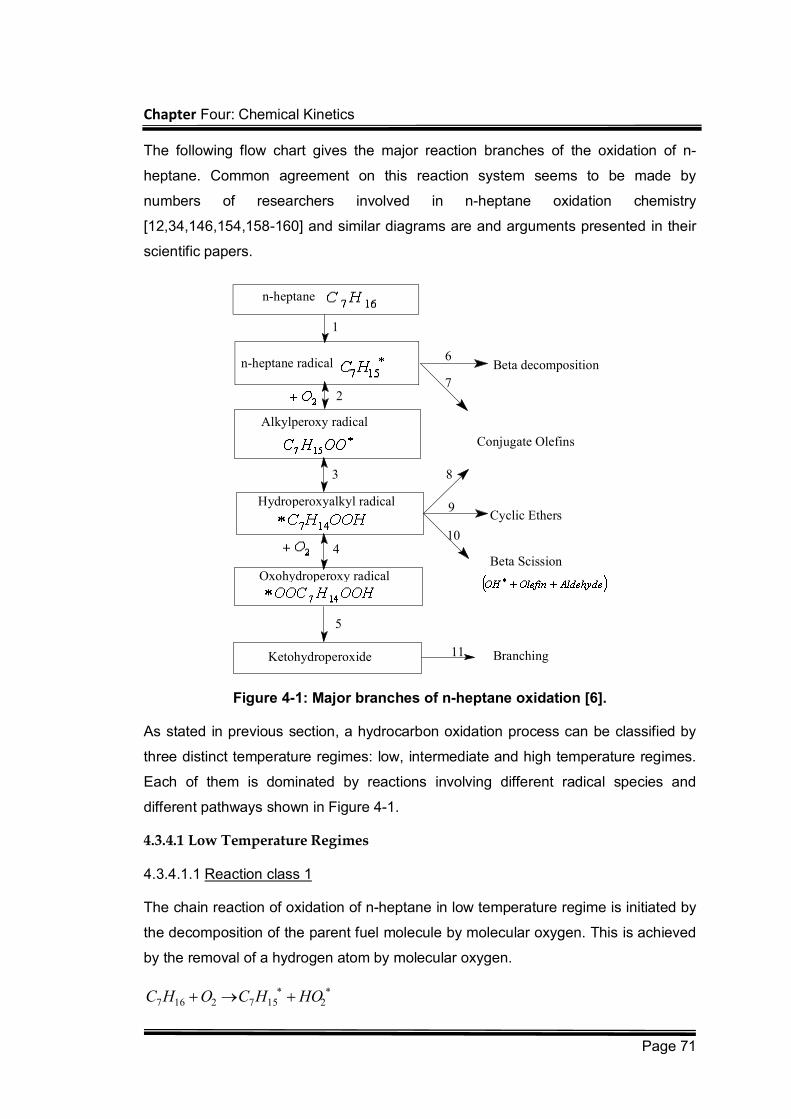
Chapter Four: Chemical Kinetics
Page 71
The following flow chart gives the major reaction branches of the oxidation of n-
heptane. Common agreement on this reaction system seems to be made by
numbers of researchers involved in n-heptane oxidation chemistry
[12,34,146,154,158-160] and similar diagrams are and arguments presented in their
scientific papers.
Figure 4-1: Major branches of n-heptane oxidation [6].
As stated in previous section, a hydrocarbon oxidation process can be classified by
three distinct temperature regimes: low, intermediate and high temperature regimes.
Each of them is dominated by reactions involving different radical species and
different pathways shown in Figure 4-1.
4.3.4.1 Low Temperature Regimes
4.3.4.1.1 Reaction class 1
The chain reaction of oxidation of n-heptane in low temperature regime is initiated by
the decomposition of the parent fuel molecule by molecular oxygen. This is achieved
by the removal of a hydrogen atom by molecular oxygen.
21572167 HOHCOHC
n-heptane
n-heptane radical
Alkylperoxy radical
Hydroperoxyalkyl radical
Oxohydroperoxy radical
Ketohydroperoxide
Beta decomposition
Conjugate Olefins
Cyclic Ethers
Beta Scission
Branching
1
2
3
4
5
6
7
8
9
10
11
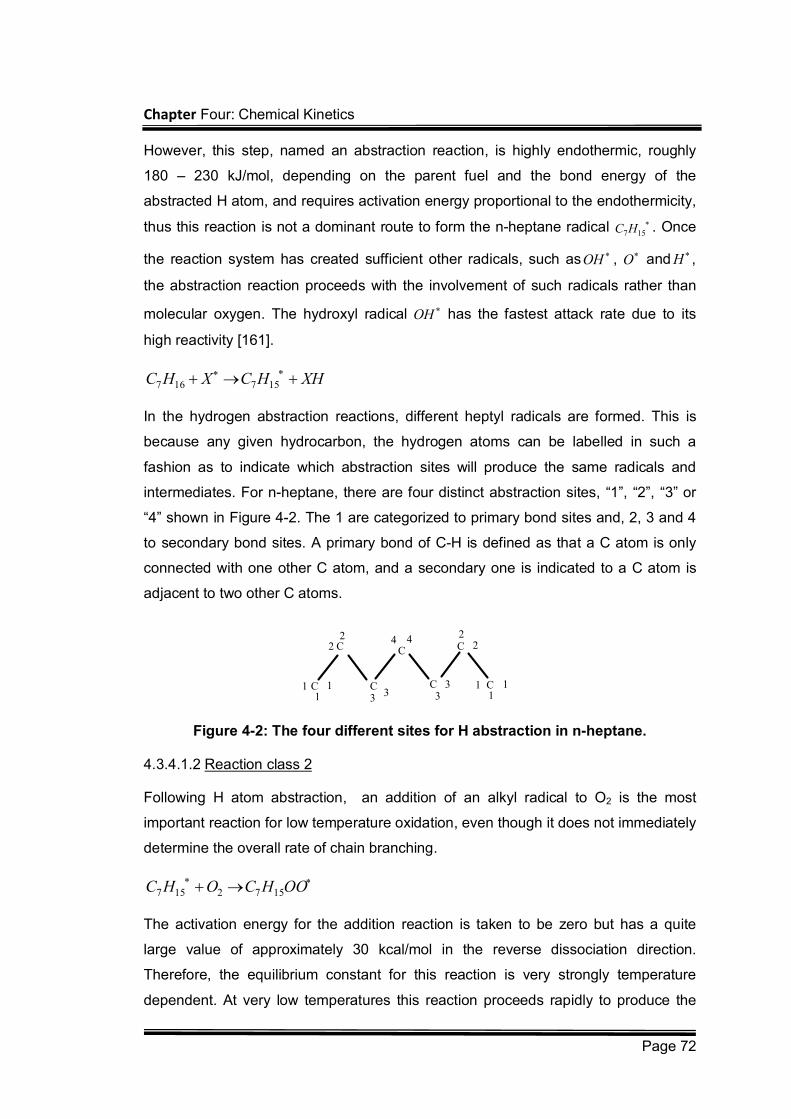
Chapter Four: Chemical Kinetics
Page 72
However, this step, named an abstraction reaction, is highly endothermic, roughly
180 – 230 kJ/mol, depending on the parent fuel and the bond energy of the
abstracted H atom, and requires activation energy proportional to the endothermicity,
thus this reaction is not a dominant route to form the n-heptane radical 157HC . Once
the reaction system has created sufficient other radicals, such as OH , O and H ,
the abstraction reaction proceeds with the involvement of such radicals rather than
molecular oxygen. The hydroxyl radical OH has the fastest attack rate due to its
high reactivity [161].
XHHCXHC
157167
In the hydrogen abstraction reactions, different heptyl radicals are formed. This is
because any given hydrocarbon, the hydrogen atoms can be labelled in such a
fashion as to indicate which abstraction sites will produce the same radicals and
intermediates. For n-heptane, there are four distinct abstraction sites, “1”, “2”, “3” or
“4” shown in Figure 4-2. The 1 are categorized to primary bond sites and, 2, 3 and 4
to secondary bond sites. A primary bond of C-H is defined as that a C atom is only
connected with one other C atom, and a secondary one is indicated to a C atom is
adjacent to two other C atoms.
C
C
CC
C C
C11
1
22
33
44
33
22
11
1
Figure 4-2: The four different sites for H abstraction in n-heptane.
4.3.4.1.2 Reaction class 2
Following H atom abstraction, an addition of an alkyl radical to O2 is the most
important reaction for low temperature oxidation, even though it does not immediately
determine the overall rate of chain branching.
OOHCOHC 1572157
The activation energy for the addition reaction is taken to be zero but has a quite
large value of approximately 30 kcal/mol in the reverse dissociation direction.
Therefore, the equilibrium constant for this reaction is very strongly temperature
dependent. At very low temperatures this reaction proceeds rapidly to produce the
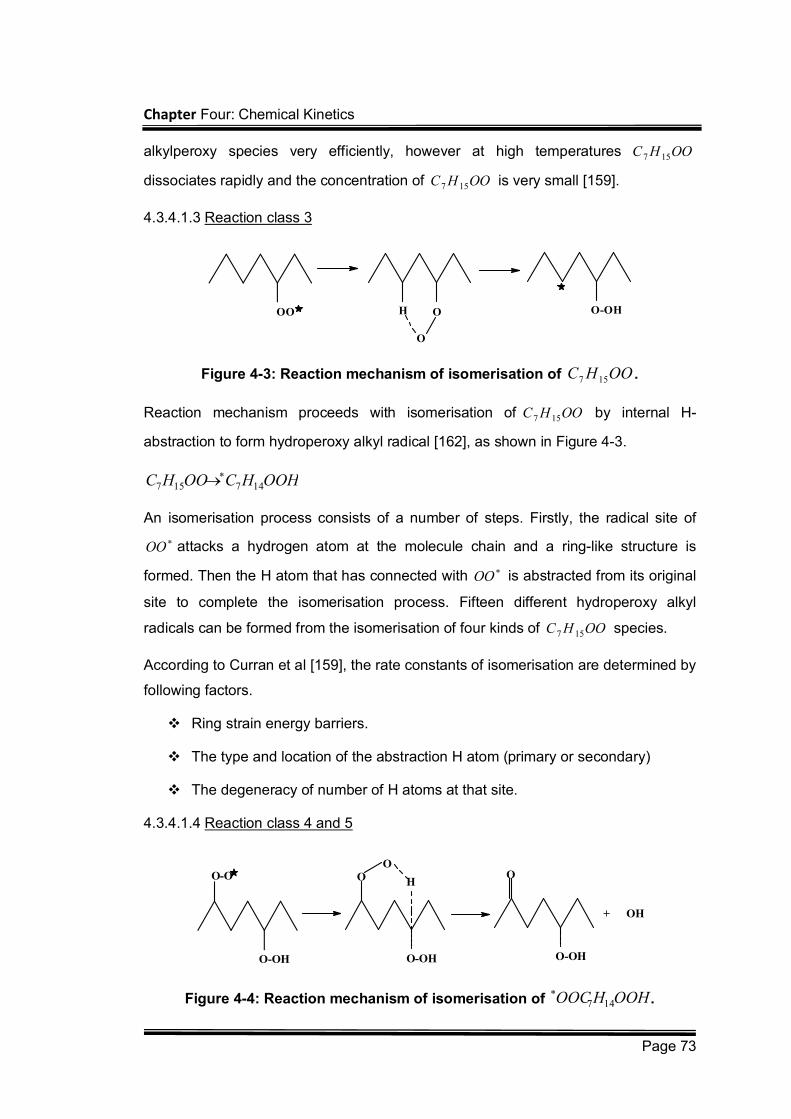
Chapter Four: Chemical Kinetics
Page 73
alkylperoxy species very efficiently, however at high temperatures OOHC 157
dissociates rapidly and the concentration of OOHC 157 is very small [159].
4.3.4.1.3 Reaction class 3
OO O-OHH O
O
Figure 4-3: Reaction mechanism of isomerisation of OOHC 157 .
Reaction mechanism proceeds with isomerisation of OOHC 157 by internal H-
abstraction to form hydroperoxy alkyl radical [162], as shown in Figure 4-3.
OOHHCOOHC 147157
An isomerisation process consists of a number of steps. Firstly, the radical site of
OO attacks a hydrogen atom at the molecule chain and a ring-like structure is
formed. Then the H atom that has connected with OO is abstracted from its original
site to complete the isomerisation process. Fifteen different hydroperoxy alkyl
radicals can be formed from the isomerisation of four kinds of OOHC 157 species.
According to Curran et al [159], the rate constants of isomerisation are determined by
following factors.
Ring strain energy barriers.
The type and location of the abstraction H atom (primary or secondary)
The degeneracy of number of H atoms at that site.
4.3.4.1.4 Reaction class 4 and 5
O-OH
O-O
O-OH
O H
OO
O-OH
+ OH
Figure 4-4: Reaction mechanism of isomerisation of OOHHOOC 147
.
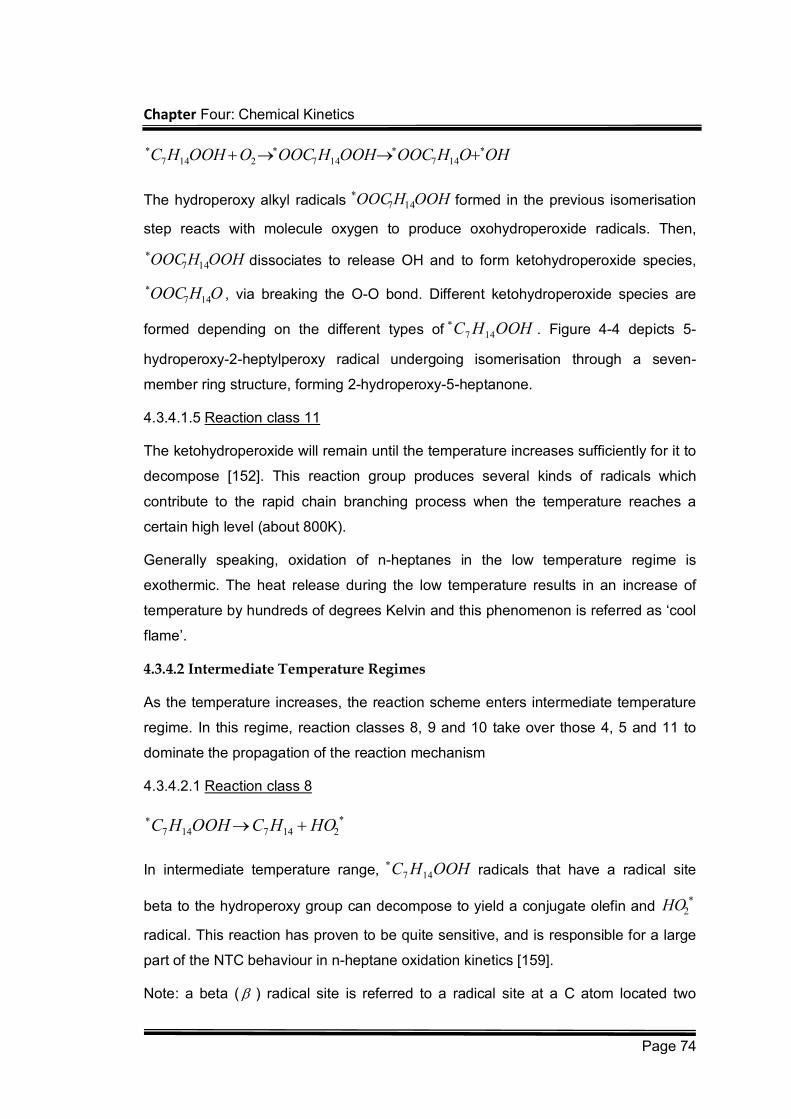
Chapter Four: Chemical Kinetics
Page 74
OHOHOOCOOHHOOCOOOHHC 1471472147
The hydroperoxy alkyl radicals OOHHOOC 147
formed in the previous isomerisation
step reacts with molecule oxygen to produce oxohydroperoxide radicals. Then,
OOHHOOC 147
dissociates to release OH and to form ketohydroperoxide species,
OHOOC 147
, via breaking the O-O bond. Different ketohydroperoxide species are
formed depending on the different types of OOHHC 147
. Figure 4-4 depicts 5-
hydroperoxy-2-heptylperoxy radical undergoing isomerisation through a seven-
member ring structure, forming 2-hydroperoxy-5-heptanone.
4.3.4.1.5 Reaction class 11
The ketohydroperoxide will remain until the temperature increases sufficiently for it to
decompose [152]. This reaction group produces several kinds of radicals which
contribute to the rapid chain branching process when the temperature reaches a
certain high level (about 800K).
Generally speaking, oxidation of n-heptanes in the low temperature regime is
exothermic. The heat release during the low temperature results in an increase of
temperature by hundreds of degrees Kelvin and this phenomenon is referred as ‘cool
flame’.
4.3.4.2 Intermediate Temperature Regimes
As the temperature increases, the reaction scheme enters intermediate temperature
regime. In this regime, reaction classes 8, 9 and 10 take over those 4, 5 and 11 to
dominate the propagation of the reaction mechanism
4.3.4.2.1 Reaction class 8
2147147 HOHCOOHHC
In intermediate temperature range, OOHHC 147
radicals that have a radical site
beta to the hydroperoxy group can decompose to yield a conjugate olefin and
2HO
radical. This reaction has proven to be quite sensitive, and is responsible for a large
part of the NTC behaviour in n-heptane oxidation kinetics [159].
Note: a beta ( ) radical site is referred to a radical site at a C atom located two
Chapter Four: Chemical Kinetics
Page 75
carbon atoms away from the O-O site; and NTC is an abbreviation for Negative
Temperature Coefficient and refers to the temperature interval during which system
reactivity decreases despite a rise in temperature. The reason that the chemistry
slows down is that the low-temperature chain branching reactions are replaced by
propagation reactions at intermediate temperatures, which does not lead to
increasing numbers of reactive radicals [146].
4.3.4.2.2 Reaction class 9
OHOHCOOHHC 147147
This reaction sequence involves the breaking of the O-O bond, coupled with the
formation of a cyclic compound including the remaining O atom and a hydroxyl
radical.
4.3.4.2.3 Reaction class 10
OHcarbonylolefinOOHHC 147
Another channel shown above yields an olefin and an aldehyde, together with OH,
and this is visualized as occurring by a scission process, which will have somewhat
higher activation energy due to the necessity of breaking a C-C bond in
OOHHC 147
radicals [30,159]. The OOHHC 147
radicals, produced by OOHC 157
isomerisation with an intermediate ring structure of six atoms can undergo -
scission and scission products are chosen considering the weakest inner atomic
bonds in the molecule.
In a conclusion, the main decomposition reactions of alkylhydroperoxy radicals are
considered to proceed by the breaking of O-O bond, the scission of C-O bond and
scission of C-C bond. Normally the C-C bond in OOHHC 147
is less probable to
break than the O-O; however attention has to be paid to the C-C bond, which is
weakened by the present of O atom on carbon.
4.3.4.3 High Temperature Regimes
When temperature increases further, the reaction mechanism enters high
temperature range. First of all, the role of 22OH played in the second ignition stage
should be noticed. Hydrogen peroxide 22OH is formed as a major product of cool
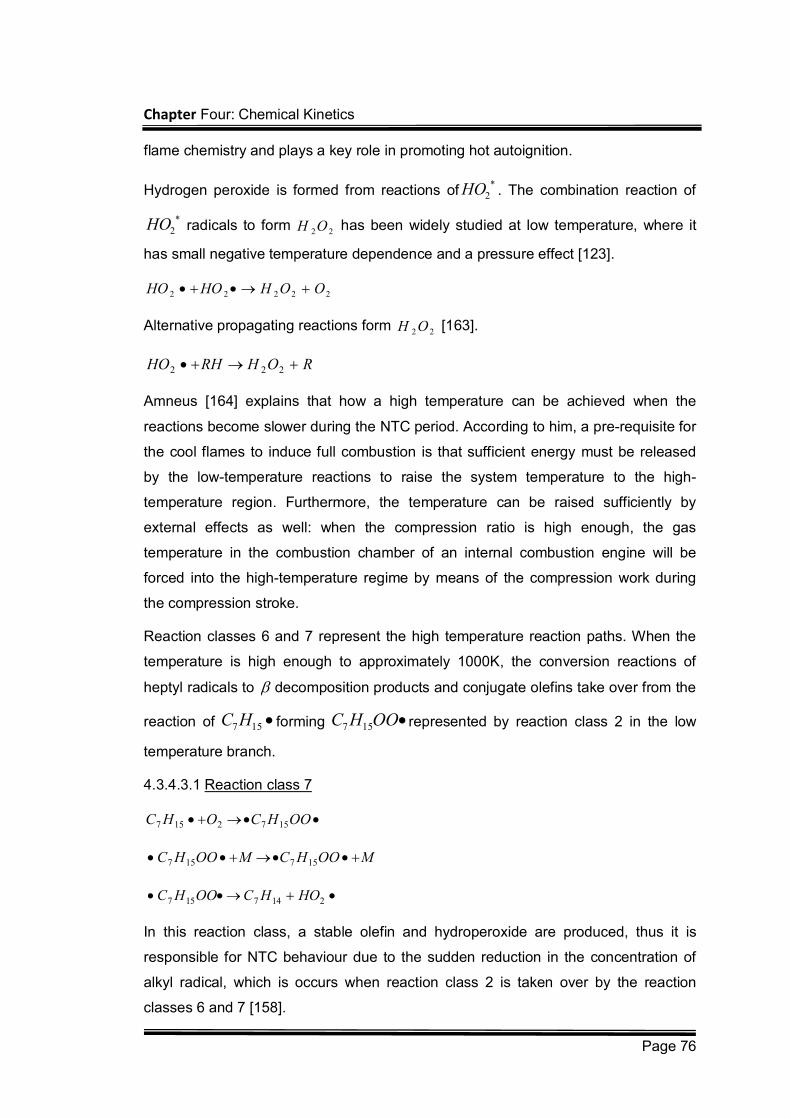
Chapter Four: Chemical Kinetics
Page 76
flame chemistry and plays a key role in promoting hot autoignition.
Hydrogen peroxide is formed from reactions of
2HO . The combination reaction of
2HO radicals to form 22OH has been widely studied at low temperature, where it
has small negative temperature dependence and a pressure effect [123].
22222 OOHHOHO
Alternative propagating reactions form 22OH [163].
Amneus [164] explains that how a high temperature can be achieved when the
reactions become slower during the NTC period. According to him, a pre-requisite for
the cool flames to induce full combustion is that sufficient energy must be released
by the low-temperature reactions to raise the system temperature to the high-
temperature region. Furthermore, the temperature can be raised sufficiently by
external effects as well: when the compression ratio is high enough, the gas
temperature in the combustion chamber of an internal combustion engine will be
forced into the high-temperature regime by means of the compression work during
the compression stroke.
Reaction classes 6 and 7 represent the high temperature reaction paths. When the
temperature is high enough to approximately 1000K, the conversion reactions of
heptyl radicals to decomposition products and conjugate olefins take over from the
reaction of 157HC forming OOHC 157 represented by reaction class 2 in the low
temperature branch.
4.3.4.3.1 Reaction class 7
In this reaction class, a stable olefin and hydroperoxide are produced, thus it is
responsible for NTC behaviour due to the sudden reduction in the concentration of
alkyl radical, which is occurs when reaction class 2 is taken over by the reaction
classes 6 and 7 [158].
ROHRHHO 222
OOHCOHC 1572157
MOOHCMOOHC 157157
2147157 HOHCOOHC
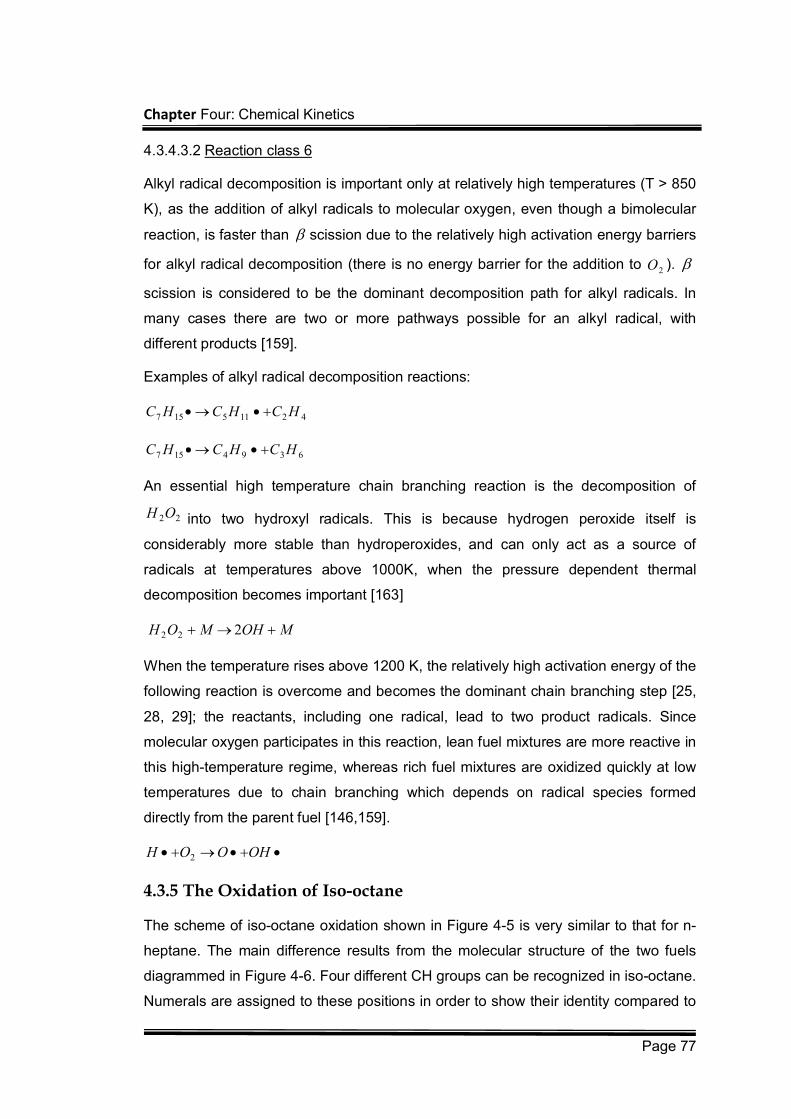
Chapter Four: Chemical Kinetics
Page 77
4.3.4.3.2 Reaction class 6
Alkyl radical decomposition is important only at relatively high temperatures (T > 850
K), as the addition of alkyl radicals to molecular oxygen, even though a bimolecular
reaction, is faster than scission due to the relatively high activation energy barriers
for alkyl radical decomposition (there is no energy barrier for the addition to 2O ).
scission is considered to be the dominant decomposition path for alkyl radicals. In
many cases there are two or more pathways possible for an alkyl radical, with
different products [159].
Examples of alkyl radical decomposition reactions:
An essential high temperature chain branching reaction is the decomposition of
into two hydroxyl radicals. This is because hydrogen peroxide itself is
considerably more stable than hydroperoxides, and can only act as a source of
radicals at temperatures above 1000K, when the pressure dependent thermal
decomposition becomes important [163]
When the temperature rises above 1200 K, the relatively high activation energy of the
following reaction is overcome and becomes the dominant chain branching step [25,
28, 29]; the reactants, including one radical, lead to two product radicals. Since
molecular oxygen participates in this reaction, lean fuel mixtures are more reactive in
this high-temperature regime, whereas rich fuel mixtures are oxidized quickly at low
temperatures due to chain branching which depends on radical species formed
directly from the parent fuel [146,159].
4.3.5 The Oxidation of Iso-octane
The scheme of iso-octane oxidation shown in Figure 4-5 is very similar to that for n-
heptane. The main difference results from the molecular structure of the two fuels
diagrammed in Figure 4-6. Four different CH groups can be recognized in iso-octane.
Numerals are assigned to these positions in order to show their identity compared to
42115157 HCHCHC
6394157 HCHCHC
22OH
MOHMOH 222
OHOOH 2
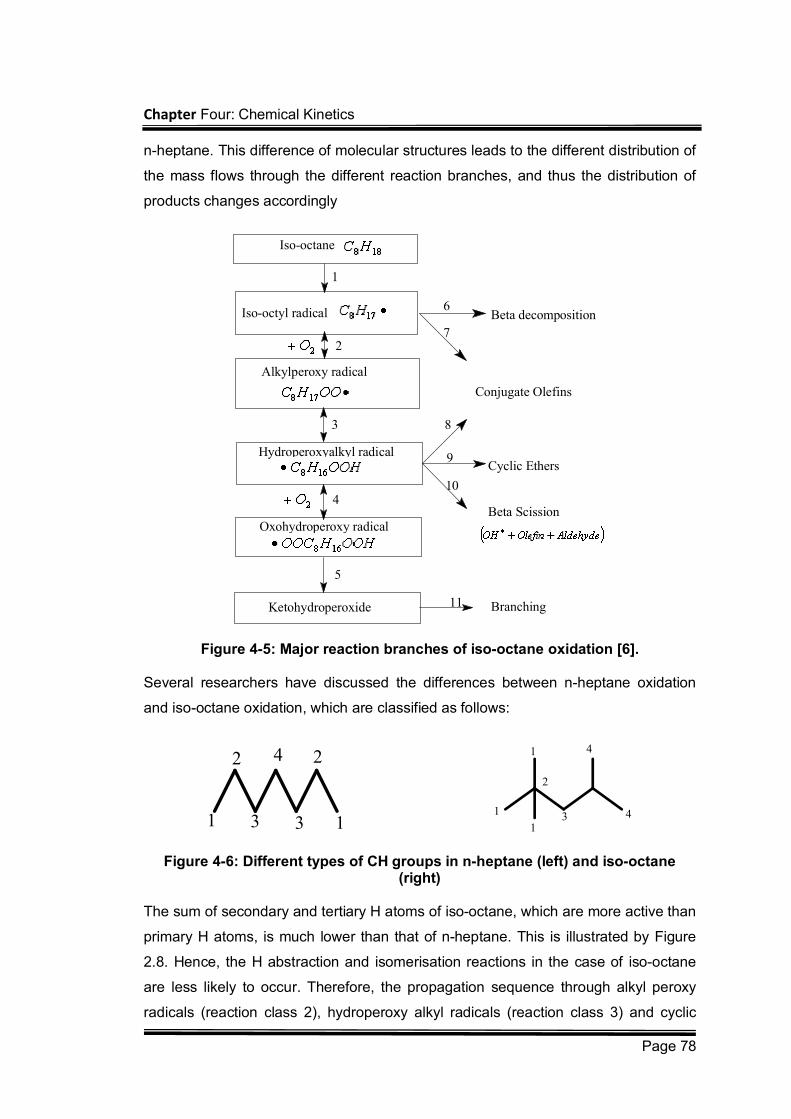
Chapter Four: Chemical Kinetics
Page 78
n-heptane. This difference of molecular structures leads to the different distribution of
the mass flows through the different reaction branches, and thus the distribution of
products changes accordingly
11
10
9
8
7
6
5
4
3
2
1
Branching
Beta Scission
Cyclic Ethers
Conjugate Olefins
Beta decomposition
Ketohydroperoxide
Oxohydroperoxy radical
Hydroperoxyalkyl radical
Alkylperoxy radical
Iso-octyl radical
Iso-octane
Figure 4-5: Major reaction branches of iso-octane oxidation [6].
Several researchers have discussed the differences between n-heptane oxidation
and iso-octane oxidation, which are classified as follows:
1
2
3
4
3
2
1
1
1
1
2
3 4
4
Figure 4-6: Different types of CH groups in n-heptane (left) and iso-octane (right)
The sum of secondary and tertiary H atoms of iso-octane, which are more active than
primary H atoms, is much lower than that of n-heptane. This is illustrated by Figure
2.8. Hence, the H abstraction and isomerisation reactions in the case of iso-octane
are less likely to occur. Therefore, the propagation sequence through alkyl peroxy
radicals (reaction class 2), hydroperoxy alkyl radicals (reaction class 3) and cyclic
Chapter Four: Chemical Kinetics
Page 79
ethers (reaction class 9) is favoured more for n-heptane than it is for iso-octane [165].
The difference in internal H abstraction rates between n-heptane and iso-octane is
related to the different sizes of the transition ring with varied ring strain energy barrier
shown in Figure 4-7
H O
O
O
OH
Figure 4-7: Different transition rings for internal H abstraction in n-heptane and iso-octane
4.3.6 Summary
As noted previously, the oxidation of hydrocarbons can be separated into three
temperature regimes, the low, intermediate, and high temperature regimes. In the low
temperature regime, the oxidation process is dominated by the alkylperoxy radical
2OR , where R is the hydrocarbon molecule minus one hydrogen atom. The low
temperature oxidation reactions are exothermic and can raise the temperature of the
system, which forms ‘cool flame’, and can form an initial radical pool, which can
promote branching decomposition and radical-initiated reactions at higher
temperatures.
The intermediate temperature regime is dominated by the hydroperoxy radical. In the
intermediate temperature regimes, the hydroperoxy alkyl radicals ROOH are
converted into conjugate olefins, cyclic ethers and -scission products, instead of
ketohydroperoxide, which is responsible for a large part of the NTC behaviour, and in
the meantime accumulation of 22OH takes place. The high temperature regime is
dominated by several radicals, namely hydroxyl HO , oxygen O and hydrogen H .
These radicals can rapidly consume fuel and increase temperature, then results the
ignition finally. In general, flames are considered high temperature phenomena;
however, combustion related phenomena such as cool flames, the negative
temperature coefficient (NTC) behaviour, and autoignition/knock are low and
intermediate temperature phenomena [146].
Chapter Four: Chemical Kinetics
Page 80
4.4 Chemical Kinetics Model of Combustion
As has been stated in early sections, a chemical kinetics model that is capable of
simulating fuel oxidation is a very useful tool to predict the characteristics of
autoignition at SI or HCCI engine operation, e.g. autoignition timing, the heat release,
the reaction intermediate, and the final products of combustion. There are five
categories of chemical kinetics models: detailed, lumped, reduced, skeletal and
global, and these have the general characteristics shown in Table 4-2.
Table 4-2: Categorization of chemical kinetics models [6].
Category Description Species Reactions
Detailed The latest ’comprehensive’ reaction set 100’s 1000’s
Lumped Uses a lumped description for larger species 100’s 1000’s
Reduced A subset of the detailed model 10’s 10’s-100’s
Skeletal Employs class chemistry and lumping concepts 10’s 10’s
Global Utilizes global reactions to minimize reaction set <10 <10
4.4.1 Detailed Chemical kinetics models
In 1984, Westbrook and Dryer [34] introduced a detailed chemical kinetic mechanism
for oxidation and pyrolysis of propane and propene. This model was later extended to
lower temperatures and to much more complex fuels by Pitz et al [166]. Since then,
there have been efforts from Curran et al [159,167-170] to develop detailed models
for butane, pentane, up to n-heptane and iso-octane. Detailed models try to include
all of the important elementary reactions and individual species using the best
available rate parameters and thermochemical data. However, there are
uncertainties in the selection of reactions and rate parameters, and detailed models
are often developed for a single hydrocarbon and only validated over a rather limited
range of conditions. Detailed models of hydrocarbon fuel oxidation, consisting of
hundreds of chemical species and thousands of reactions, for an engine simulation
require tremendous computational resources if coupled with engine CFD models.
Several modeling studies simulating HCCI conditions using detailed chemical
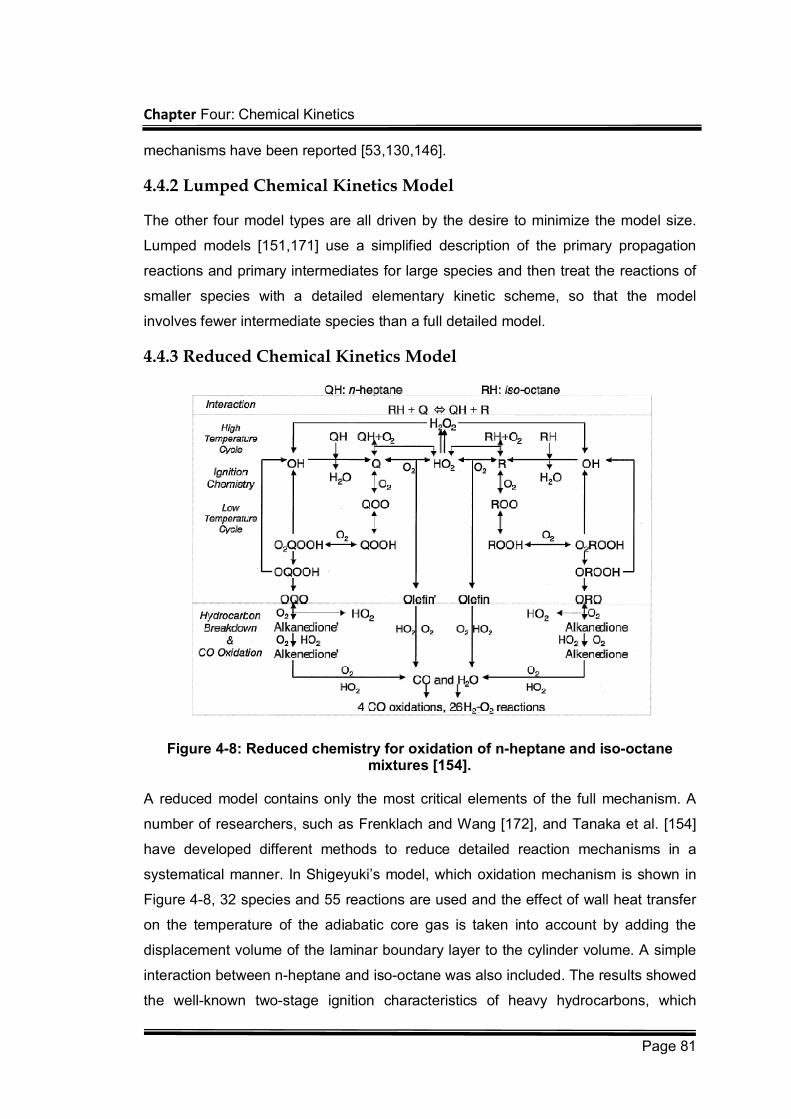
Chapter Four: Chemical Kinetics
Page 81
mechanisms have been reported [53,130,146].
4.4.2 Lumped Chemical Kinetics Model
The other four model types are all driven by the desire to minimize the model size.
Lumped models [151,171] use a simplified description of the primary propagation
reactions and primary intermediates for large species and then treat the reactions of
smaller species with a detailed elementary kinetic scheme, so that the model
involves fewer intermediate species than a full detailed model.
4.4.3 Reduced Chemical Kinetics Model
Figure 4-8: Reduced chemistry for oxidation of n-heptane and iso-octane mixtures [154].
A reduced model contains only the most critical elements of the full mechanism. A
number of researchers, such as Frenklach and Wang [172], and Tanaka et al. [154]
have developed different methods to reduce detailed reaction mechanisms in a
systematical manner. In Shigeyuki’s model, which oxidation mechanism is shown in
Figure 4-8, 32 species and 55 reactions are used and the effect of wall heat transfer
on the temperature of the adiabatic core gas is taken into account by adding the
displacement volume of the laminar boundary layer to the cylinder volume. A simple
interaction between n-heptane and iso-octane was also included. The results showed
the well-known two-stage ignition characteristics of heavy hydrocarbons, which
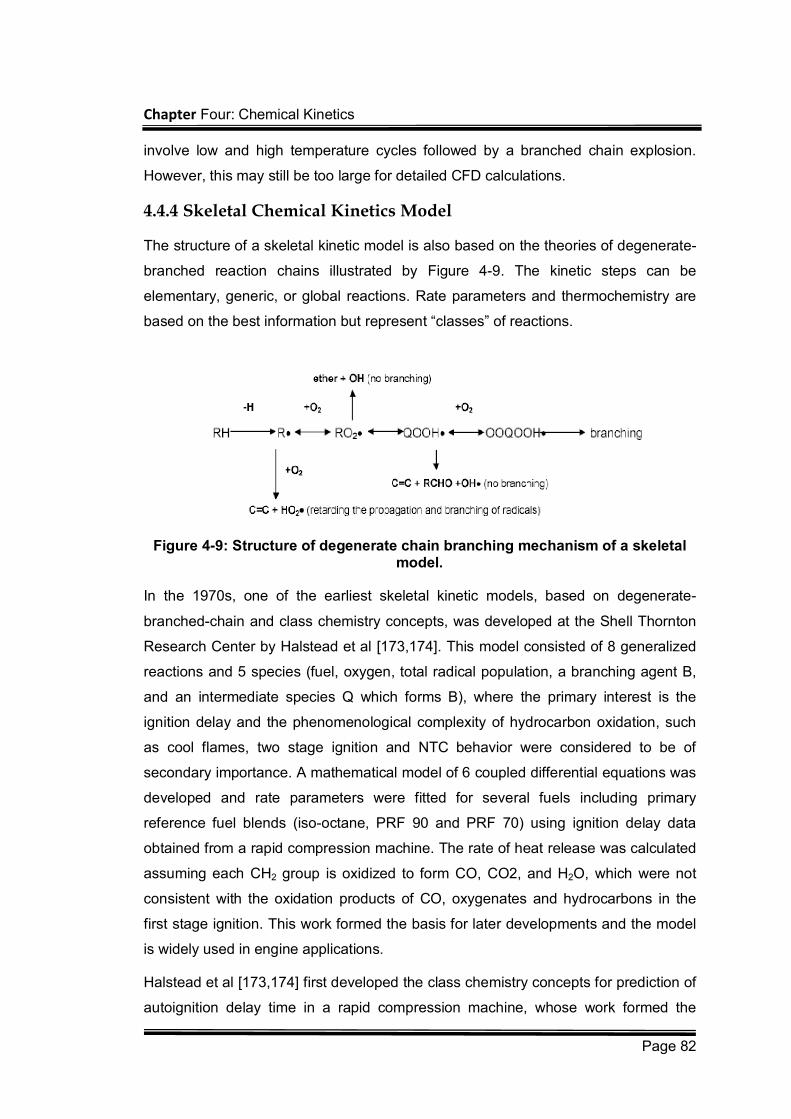
Chapter Four: Chemical Kinetics
Page 82
involve low and high temperature cycles followed by a branched chain explosion.
However, this may still be too large for detailed CFD calculations.
4.4.4 Skeletal Chemical Kinetics Model
The structure of a skeletal kinetic model is also based on the theories of degenerate-
branched reaction chains illustrated by Figure 4-9. The kinetic steps can be
elementary, generic, or global reactions. Rate parameters and thermochemistry are
based on the best information but represent “classes” of reactions.
Figure 4-9: Structure of degenerate chain branching mechanism of a skeletal model.
In the 1970s, one of the earliest skeletal kinetic models, based on degenerate-
branched-chain and class chemistry concepts, was developed at the Shell Thornton
Research Center by Halstead et al [173,174]. This model consisted of 8 generalized
reactions and 5 species (fuel, oxygen, total radical population, a branching agent B,
and an intermediate species Q which forms B), where the primary interest is the
ignition delay and the phenomenological complexity of hydrocarbon oxidation, such
as cool flames, two stage ignition and NTC behavior were considered to be of
secondary importance. A mathematical model of 6 coupled differential equations was
developed and rate parameters were fitted for several fuels including primary
reference fuel blends (iso-octane, PRF 90 and PRF 70) using ignition delay data
obtained from a rapid compression machine. The rate of heat release was calculated
assuming each CH2 group is oxidized to form CO, CO2, and H2O, which were not
consistent with the oxidation products of CO, oxygenates and hydrocarbons in the
first stage ignition. This work formed the basis for later developments and the model
is widely used in engine applications.
Halstead et al [173,174] first developed the class chemistry concepts for prediction of
autoignition delay time in a rapid compression machine, whose work formed the
Chapter Four: Chemical Kinetics
Page 83
basis for later development. Griffiths [175] has made a comprehensive review of
skeletal kinetic models and their applications. A brief description of the models is
given below.
Based on the existed knowledge of the alkane oxidation, Cox and Cole [160] formed
a skeletal chemical kinetics model, which consists of 15 reactions and 10 active
species and the rate of heat release was calculated in the same way as in the Shell
model. The model was tested against the ignition data using iso-octane and PRF 90
in the Thornton rapid compression machine. The advantages of this model are a
better representation of the chemical reactions and the reasonable rate parameters
compatible with the existing kinetic information on the type of elementary processes
involved. Hu and Keck [176] further developed a skeletal chemical kinetics model of
18 reactions and 13 active species. Keeping a better representation of the chemical
reactions similar to Cox and Cole model, Hu and Keck treated exothermicity as
enthalpy change in each of the elementary reactions. The rate parameters were
calibrated using measured explosion limits in a combustion bomb. The fuels studied
were C4-C8 straight chain paraffin and iso-octane. The effects of fuel structure are
reflected in the rate parameter of the RO2 isomerization reaction. The model was
applied to predict selected data of ignition delay measured in the Thornton rapid
compression machine.
The early work on skeletal chemical kinetics models showed that a relatively small
number of rate limiting reactions can simulate two stage ignition processes and that
models can generally reproduce the ignition delay for a specific hydrocarbon of
interest based on simple adjustments of a fuel specific equilibrium constant.
However, significant physical features such as pre-ignition fuel consumption,
cumulative heat release, and key species concentrations were not modeled very well.
To resolve these issues, an extended skeletal kinetic model, consisting of 13 active
species and 29 reactions as shown in Figure , was developed by Li et al. [177,178]
for application to PRF 87 (87% iso-octane and 13% n-heptane) and PRF 63 at
selected engine conditions. In this model, oxidation of small species was considered
and a formation path for CO was provided. The model was tested and validated in
predicting the ignition delay and the pre-ignition heat release for these fuels within
accuracy of up to 15%.
Zheng et al [127,179] further developed and extended Li’s model to incorporate low,
intermediate, and high temperature chemistry and successfully applied the model to
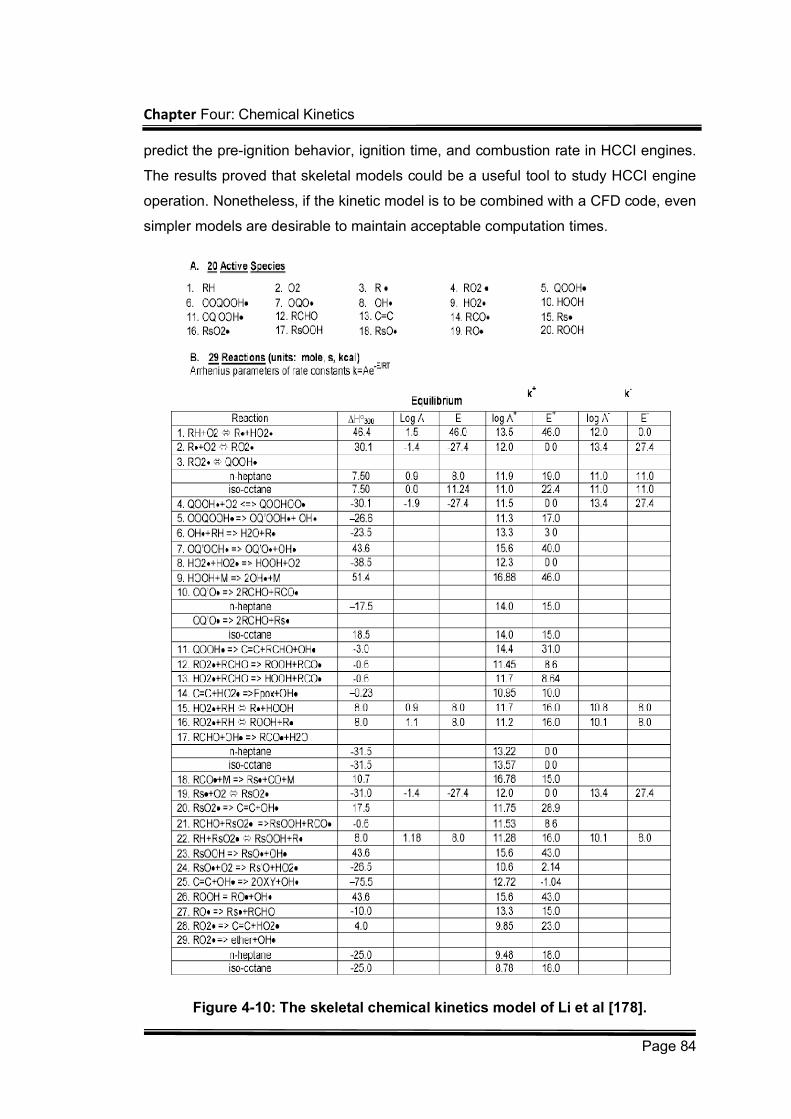
Chapter Four: Chemical Kinetics
Page 84
predict the pre-ignition behavior, ignition time, and combustion rate in HCCI engines.
The results proved that skeletal models could be a useful tool to study HCCI engine
operation. Nonetheless, if the kinetic model is to be combined with a CFD code, even
simpler models are desirable to maintain acceptable computation times.
Figure 4-10: The skeletal chemical kinetics model of Li et al [178].
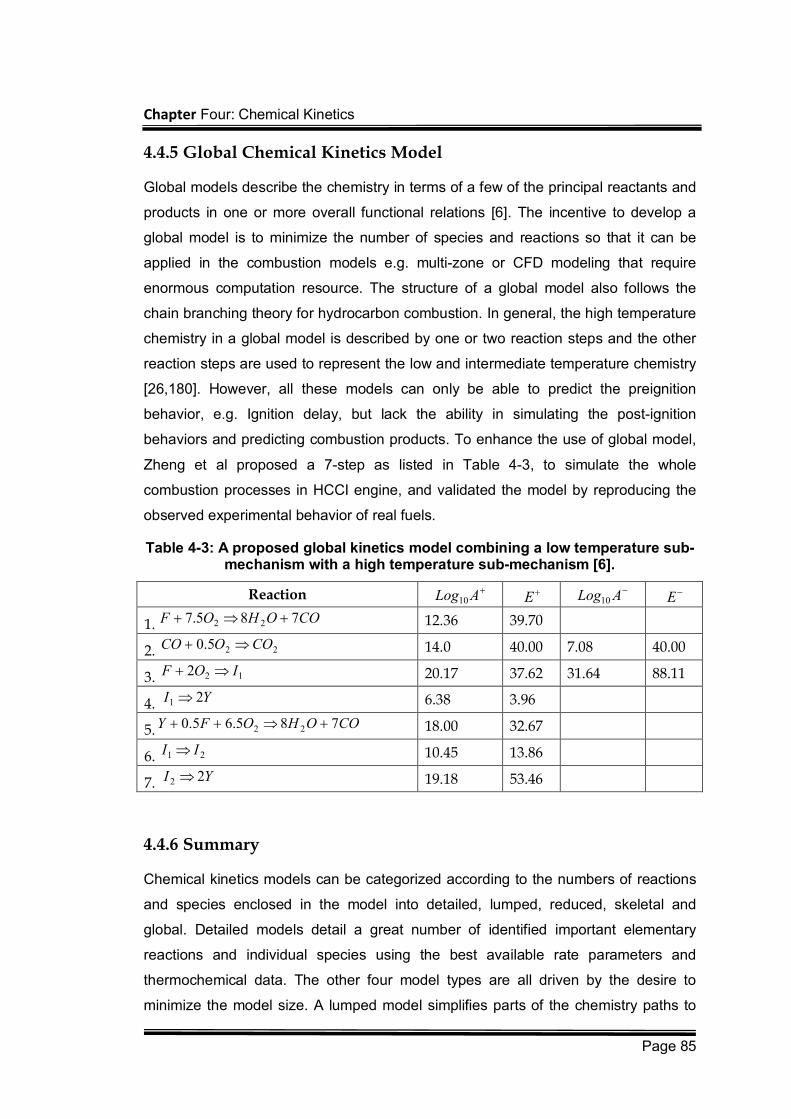
Chapter Four: Chemical Kinetics
Page 85
4.4.5 Global Chemical Kinetics Model
Global models describe the chemistry in terms of a few of the principal reactants and
products in one or more overall functional relations [6]. The incentive to develop a
global model is to minimize the number of species and reactions so that it can be
applied in the combustion models e.g. multi-zone or CFD modeling that require
enormous computation resource. The structure of a global model also follows the
chain branching theory for hydrocarbon combustion. In general, the high temperature
chemistry in a global model is described by one or two reaction steps and the other
reaction steps are used to represent the low and intermediate temperature chemistry
[26,180]. However, all these models can only be able to predict the preignition
behavior, e.g. Ignition delay, but lack the ability in simulating the post-ignition
behaviors and predicting combustion products. To enhance the use of global model,
Zheng et al proposed a 7-step as listed in Table 4-3, to simulate the whole
combustion processes in HCCI engine, and validated the model by reproducing the
observed experimental behavior of real fuels.
Table 4-3: A proposed global kinetics model combining a low temperature sub-mechanism with a high temperature sub-mechanism [6].
Reaction
1. 12.36 39.70
2. 14.0 40.00 7.08 40.00
3. 20.17 37.62 31.64 88.11
4. 6.38 3.96
5. 18.00 32.67
6. 10.45 13.86
7. 19.18 53.46
4.4.6 Summary
Chemical kinetics models can be categorized according to the numbers of reactions
and species enclosed in the model into detailed, lumped, reduced, skeletal and
global. Detailed models detail a great number of identified important elementary
reactions and individual species using the best available rate parameters and
thermochemical data. The other four model types are all driven by the desire to
minimize the model size. A lumped model simplifies parts of the chemistry paths to
ALog10E
ALog10E
COOHOF 785.7 22
225.0 COOCO
122 IOF
YI 21
COOHOFY 785.65.0 22
21 II
YI 22
Chapter Four: Chemical Kinetics
Page 86
exclude some unimportant intermediate species and reactions from the detailed
model. A reduced model contains the most critical elements of the full mechanism
and has a smaller size compared with lumped models. A skeletal model consists of
a sequence of composite kinetic steps representing the chemistry path. A global
model describes the chemistry in terms of a few of the principal reactants and
products in one or more overall functional relations.
Selection of a chemical kinetics model should be a compromise of model sizes,
model accuracy and model availability. For sample, in the application of CFD code,
the size of the kinetic model has to be minimized in the consideration of computation
cost; however, the model reduction sometimes is accommodated with degradation of
model accuracy. Moreover, the chemical kinetics model have not been widely
developed for all varieties of fuels, so availability check of the fuel of interest should
always be conducted before modelling.
Chapter Five: Modelling of Multi-zone Chemical Kinetics
Page 87
Chapter Five: Modelling of Multi-zone Chemical Kinetics
5.1 Introduction
Mathematical modelling of the systems involving chemical kinetics needs to integrate
a kinetic solver to solve the mass and energy equations of the system. The levels of
complexity of modelling processes are determined by the aspects related to the
system properties and the computation methods applied. It could be a very simple
model in describing the combustion chemistry of a homogeneous gas mixture in a
constant volume reactor e.g. perfectly stirred reactor (PSR) or rapid compression
machine (RCM), or complicated ones in simulating temperature and composition
inhomogeneity of gas mixture in volume varying systems e.g. SI and HCCI engines.
The computation methods applied in modelling a combustion system can be
categorized into the multi-dimensional CFD calculation and the zero-dimensional
thermodynamic calculation. Both of the approaches can be incorporated with
chemical kinetics models to simulate kinetic-controlled combustion events. The
precision of the simulation depends on the accuracy of the representation of the
chemical kinetics and more reliable numerical results can be obtained with more
detailed reaction mechanisms.
5.1.1 CFD Approach
CFD model has been the dominant simulation and optimisation tool used in the
modern engine design attributing to it powerful abilities in geometry representations.
Thus, a full-scale integration of CFD model with detailed chemical kinetics model,
Chapter Five: Modelling of Multi-zone Chemical Kinetics
Page 88
theoretically, provides unparalleled simulation accuracy and details in presenting
combustion behaviour. However, numerical modeling of this scale requires
substantial computer resources in CPU speed, large-scale storage, and robust and
fast numerical solution algorithm. Although, to date, the speed and power of
computer resources have been significant improved, the simulation time for a CFD
model with detailed chemical kinetics is still measured in weeks to months, which
prevents the routine use of CFD models in the design process.
As a result, although CFD models have many great benefits, its implementation is
markedly hampered by the size of chemical reaction mechanisms that can be
incorporated with effectively. Typical CFD solutions are to sacrifice chemical
accuracy for accuracy in geometry and flow by applying global (single-step) reactions
or a set of severely reduced chemical reaction step. However, this approach not only
degrades the prediction accuracy but also is still computationally expensive. Another
solution, as a contrast, is to reduce the calculation to a one- or two- dimensional CFD
application. However, the computational time of this approach with the detailed
reaction mechanism is still costly on current computers.
5.1.2 Zero-Dimensional Approach
As alternative to multi-dimensional approaches, a zero-dimensional thermodynamic
model coupled with either detailed or reduced kinetic gains many researches
interests due to its simplicity and relatively shorter computation time compared with
CFD modelling.
For SI engine Combustion, the propagating flame front separates the in-cylinder
mixture into two regimes: unburned and burned, in each of which the gas mixture are
of different properties and the zone volume varies with the piston motion and mass
entrained by flame front is transferred across the flame front from unburned zone to
the burned zone. This two-zone model is the most simplified physical presentation of
the combustion process in SI engines taking account of the flame propagation, mass
transfer and volume change. An extension of the two-zone model could entail
blowby, boundary layer, and local temperature and mixture composition
inhomogeneity etc, which make it more requisite to apply multi-zone modeling.
Modelling of combustion in HCCI engine needs to take account of the temperature
and mixture distribution across the combustion chamber, which is believed caused by
heat transfer, boundary layer, crevice and spatial mixing as detailed in Section 3.5.2.
Chapter Five: Modelling of Multi-zone Chemical Kinetics
Page 89
Simulation of combustion in HCCI engines necessitates the division of the
combustion into multiple zones to represent these realistic circumstances.
In consequence, advantages of the multi-zone models include specifying the
temperatures and compositions for each zone, which reflects the inhomogeneous
prosperities of the in-cylinder mixture, modelling the volume and mass change
caused by the in-cylinder flow dynamics, and as well as taking account of crevices
and the thermal boundary layer. When coupled with chemical kinetics modelling of
the local reacting gases, multi-zone modelling is capable of describing chemically the
combustion process and predicting the autoignition timing and the energy release
rate. In addition, emissions e.g. CO and HC can also be modelled with good
accuracy. The drawback of multi-zone model is the increase in computational time
when detailed chemical kinetics is applied, but compared with CFD approach, the
CPU times is more reasonable by time scale of between tens of minutes and a few
hours.
This research work consequently puts emphasis on the incorporation of chemical
kinetics modelling with zero-dimensional multi-zone modelling of SI and HCCI
combustion.
5.2 Mathematical Description of Multi-Zone Modelling
In multi-zone engine modeling, the cylinder volume is split into a series of zones of
different thermal and composition properties. Each of zones is treated as
homogeneous regions where kinetic chemistry can be applied. The multi-zone
engine model handles distribution of temperature and composition, where different
zones can have different starting temperatures and compositions. In this way, the
inhomogeneity of the gas mixture in the combustion chamber can be simulated
through a number of variable volume reactors, e.g. burned and unburned zone in Si
engines and boundary layer, inner and outer core zones in HCCI engines. Pressure
is assumed spatially uniform throughout the cylinder. The zones interact with each
other through compression work e.g. the expansion of hotter zones compresses the
colder zones in HCCI engine combustion and expansion of burned zone compresses
the unburned zone in SI engine combustion. Zone interaction can also be induced
through mass transfer, e.g. mass transfer from high-pressure zones to low-pressure
Chapter Five: Modelling of Multi-zone Chemical Kinetics
Page 90
zones in HCCI combustion and mass entrainment from unburned zone to burned
zone by propagating flame front in SI engines. Heat transfer between zones is
considered in the type of convection in HCCI engine combustion and convection an
radiation in SI engine combustion.
The manner, in which the multi-zone modeling of IC engine combustion is formed,
has been discussed above. In general, a multi-zone model treats the cylinder as a
combination of independent gas mixture zones. Each zone is treated as a variable
volume combustion reactor, filled with homogeneous mixtures that act as a perfect
gas, to which conservation of mass and energy are applied. Uniform pressure across
the combustion chamber is also assumed.
5.2.1 Governing Equations
By applying law of conservation of mass and energy to each zone, a general zero-
dimensional thermodynamic model for each zone is derived.
5.2.1.1 Ideal Gas Law
The gas mixture of each zone is supposed to conform to the ideal gas law,
iiii RTnVp 5-1
Where
p pressure;
n the number of total moles of gas;
R universal gas constant
T temperature
V volume
i zone index
5.2.2 Conservation of Mass
The total mass inside the cylinder is presented by
ZN
iimm
1
5-2
where
Chapter Five: Modelling of Multi-zone Chemical Kinetics
Page 91
im mass of th-i zone
ZN total number of the zones in the cylinder.
The mass change of the mixture in each open zone is affected by the mass flow
entering and leaving the zone. Thus, the mass change rate of a single zone has the
form
out
out
out
in
in
in
N
l
il
N
l
ili mm
dt
dm
1
,
1
, 5-3
where
il ,in index of the flow of mass entering the th-i zone
i,lout index of the flow of mass existing the th-i zone
The total mass change rate in the cylinder is given by
outmdt
dm 5-4
where
outm mass exiting the cylinder such as the blowby flow
5.2.3 Conservation of Species
The mass of an individual chemical species inside each zone is determined by the
mass flux entering and exiting the zone and the formation and consumption by
chemical reactions. Therefore, the mass change rate of a single species inside each
zone is represented by
ijij
N
lilj
N
lilj
ij VMmmdt
dm out
out
out
in
in
in ,,,,,
, 5-5
where
j index of the species in the chemical reaction mechanism
i,j molar production rate of the th-j species in th-i zone by the chemical
reactions
jM molar mass of the th-j species
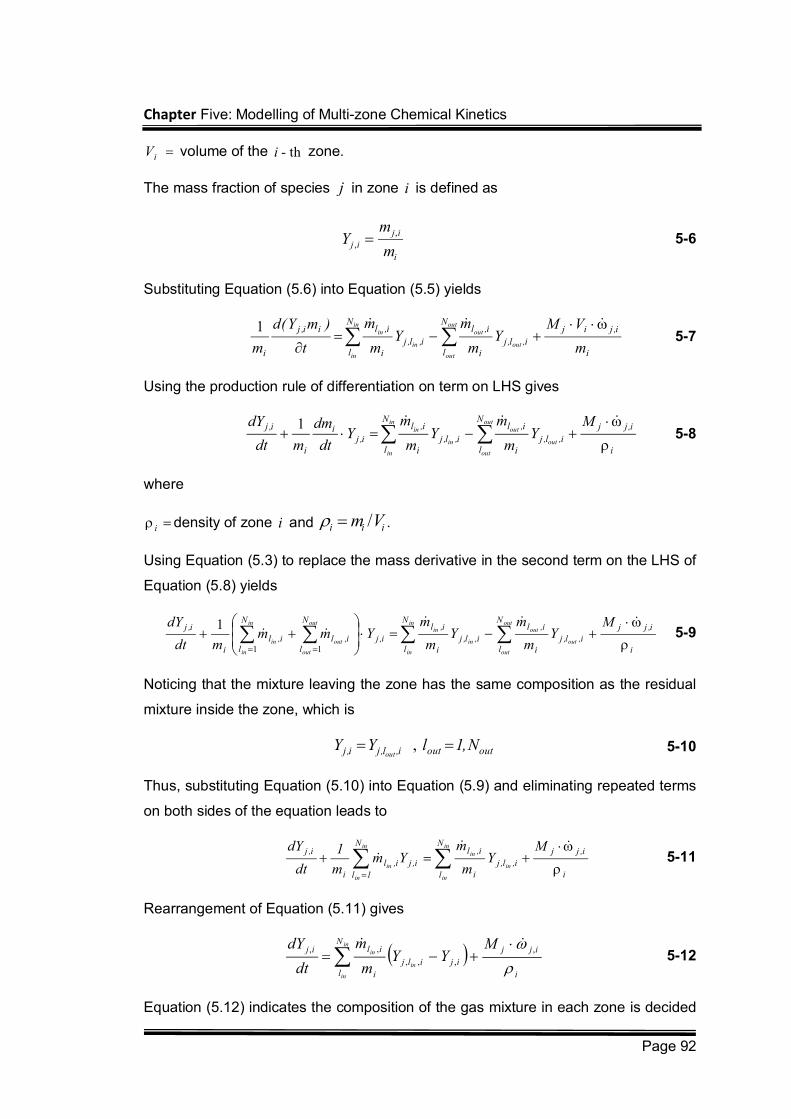
Chapter Five: Modelling of Multi-zone Chemical Kinetics
Page 92
iV volume of the th-i zone.
The mass fraction of species j in zone i is defined as
i
ij
ijm
mY
,
, 5-6
Substituting Equation (5.6) into Equation (5.5) yields
i
i,jijN
li,l,j
i
i,lN
li,l,j
i
i,lii,j
i m
VMY
m
mY
m
m
t
)mY(d
m
out
out
out
outin
in
in
in
1
5-7
Using the production rule of differentiation on term on LHS gives
i
i,jjN
li,l,j
i
i,lN
li,l,j
i
i,l
i,ji
i
i,j MY
m
mY
m
mY
dt
dm
mdt
dY out
out
out
outin
in
in
in
1 5-8
where
i density of zone i and iii Vm / .
Using Equation (5.3) to replace the mass derivative in the second term on the LHS of
Equation (5.8) yields
i
i,jjN
li,l,j
i
i,lN
li,l,j
i
i,l
i,j
N
li,l
N
li,l
i
i,j MY
m
mY
m
mYmm
mdt
dY out
out
out
outin
in
in
inout
out
out
in
in
in
11
1 5-9
Noticing that the mixture leaving the zone has the same composition as the residual
mixture inside the zone, which is
outouti,l,ji,j N,1lYYout
, 5-10
Thus, substituting Equation (5.10) into Equation (5.9) and eliminating repeated terms
on both sides of the equation leads to
i
i,jjN
l
i,l,j
i
i,l
i,j
N
1l
i,l
i
i,j MY
m
mYm
m
1
dt
dY in
in
in
inin
in
in
5-11
Rearrangement of Equation (5.11) gives
i
ijjN
lijilj
i
ilij MYY
m
m
dt
dY in
in
in
in
,
,,,
,,
5-12
Equation (5.12) indicates the composition of the gas mixture in each zone is decided
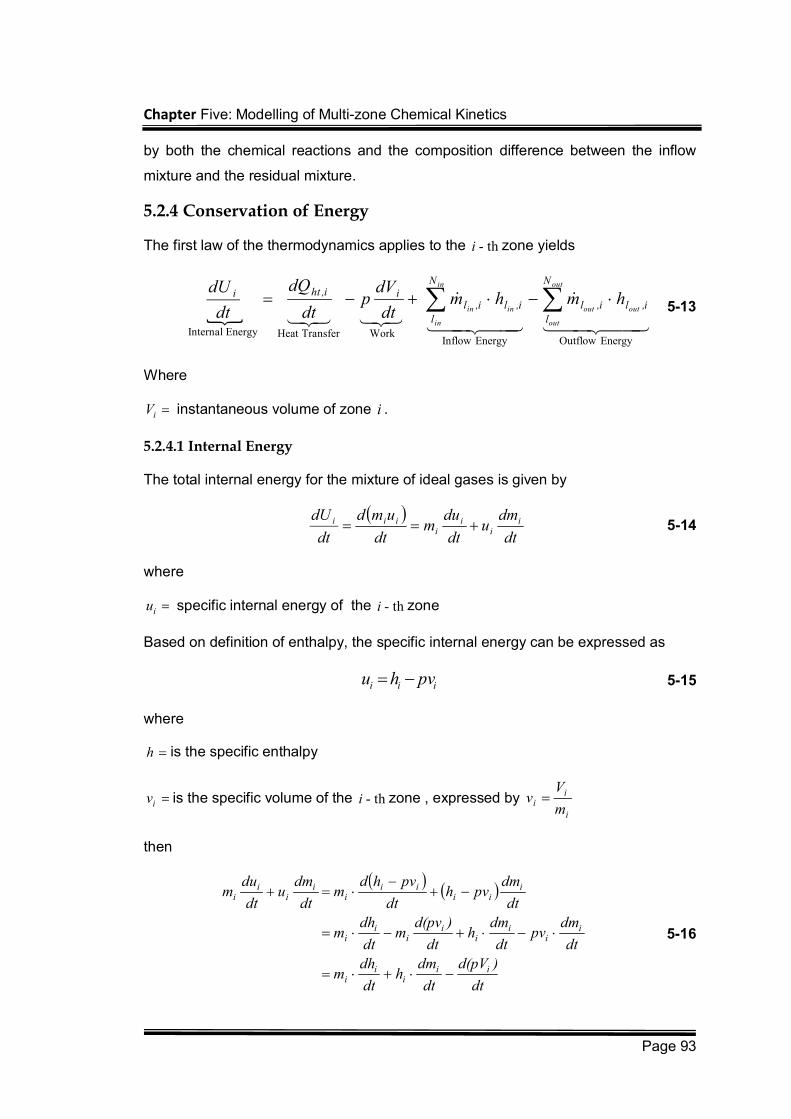
Chapter Five: Modelling of Multi-zone Chemical Kinetics
Page 93
by both the chemical reactions and the composition difference between the inflow
mixture and the residual mixture.
5.2.4 Conservation of Energy
The first law of the thermodynamics applies to the th-i zone yields
Energy OutflowEnergy Inflow WorkTransferHeat Energy Internal
out
out
outout
in
in
inin
N
l
i,li,l
N
l
i,li,lii,hti hmhm
dt
dVp
dt
dQ
dt
dU 5-13
Where
iV instantaneous volume of zone i .
5.2.4.1 Internal Energy
The total internal energy for the mixture of ideal gases is given by
dt
dmu
dt
dum
dt
umd
dt
dU ii
ii
iii 5-14
where
iu specific internal energy of the th-i zone
Based on definition of enthalpy, the specific internal energy can be expressed as
iii pvhu 5-15
where
h is the specific enthalpy
iv is the specific volume of the th-i zone , expressed by i
ii
m
Vv
then
dt
)d(pV
dt
dmh
dt
dhm
dt
dmpv
dt
dmh
dt
)d(pvm
dt
dhm
dt
dmpvh
dt
pvhdm
dt
dmu
dt
dum
iii
ii
ii
ii
ii
ii
iii
iii
ii
ii
5-16
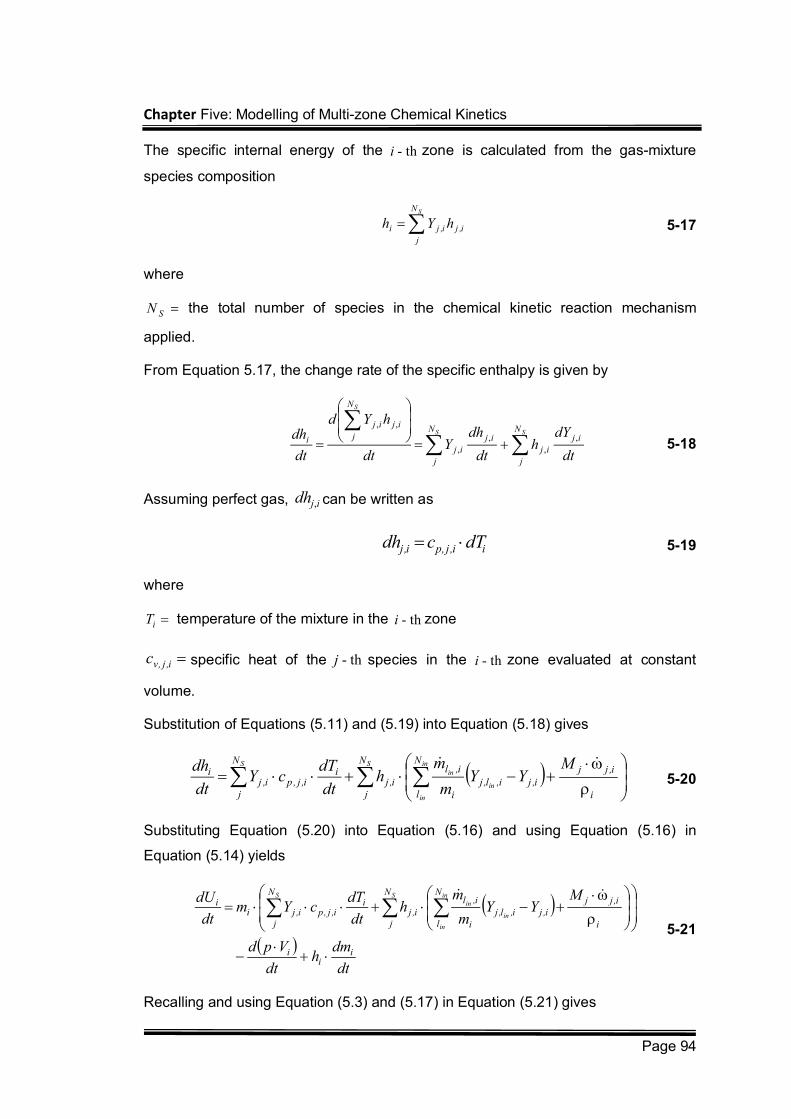
Chapter Five: Modelling of Multi-zone Chemical Kinetics
Page 94
The specific internal energy of the th-i zone is calculated from the gas-mixture
species composition
SN
j
i,ji,ji hYh
5-17
where
SN the total number of species in the chemical kinetic reaction mechanism
applied.
From Equation 5.17, the change rate of the specific enthalpy is given by
SS
S
N
j
ij
ij
N
j
ij
ij
N
j
ijij
i
dt
dYh
dt
dhY
dt
hYd
dt
dh ,
,
,
,
,,
5-18
Assuming perfect gas, ijdh , can be written as
ii,j,pi,j dTcdh 5-19
where
iT temperature of the mixture in the th-i zone
i,j,vc specific heat of the th-j species in the th-i zone evaluated at constant
volume.
Substitution of Equations (5.11) and (5.19) into Equation (5.18) gives
S in
in
in
inS N
j i
i,jjN
li,ji,l,j
i
i,l
i,j
N
j
ii,j,pi,j
iM
YYm
mh
dt
dTcY
dt
dh 5-20
Substituting Equation (5.20) into Equation (5.16) and using Equation (5.16) in
Equation (5.14) yields
dt
dmh
dt
Vpd
MYY
m
mh
dt
dTcYm
dt
dU
ii
i
N
j i
i,jjN
li,ji,l,j
i
i,li,j
N
j
ii,j,pi,ji
iS in
in
in
inS
5-21
Recalling and using Equation (5.3) and (5.17) in Equation (5.21) gives
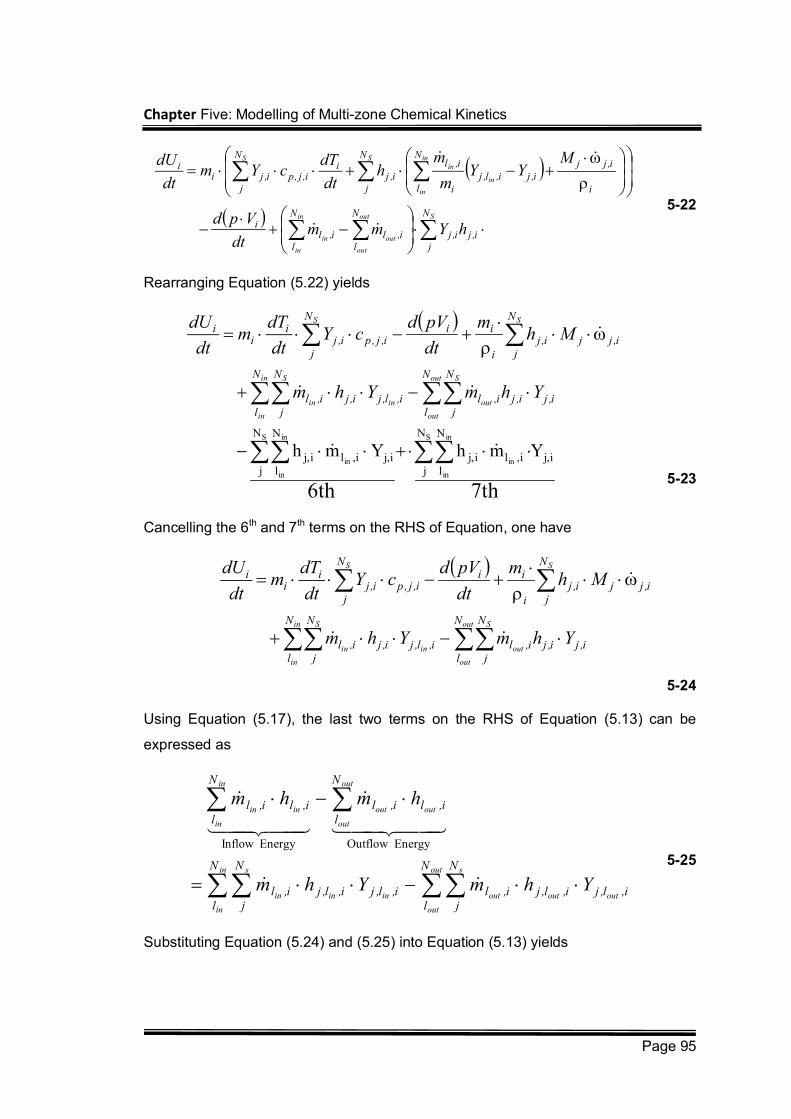
Chapter Five: Modelling of Multi-zone Chemical Kinetics
Page 95
Sout
out
out
in
in
in
S in
in
in
inS
N
ji,ji,j
N
li,l
N
li,l
i
N
j i
i,jjN
li,ji,l,j
i
i,l
i,j
N
j
ii,j,pi,ji
i
hYmmdt
Vpd
MYY
m
mh
dt
dTcYm
dt
dU
5-22
Rearranging Equation (5.22) yields
7th6th
S in
in
in
S in
in
in
N
jij,
N
li,lij,
N
j
N
lij,i,lij, YmhYmh
out
out
S
out
in
in
S
inin
SS
N
l
N
ji,ji,ji,l
N
l
N
ji,l,ji,ji,l
N
ji,jji,j
i
iiN
ji,j,pi,j
ii
i
YhmYhm
Mhm
dt
pVdcY
dt
dTm
dt
dU
5-23
Cancelling the 6th and 7th terms on the RHS of Equation, one have
out
out
S
out
in
in
S
inin
SS
N
l
N
ji,ji,ji,l
N
l
N
ji,l,ji,ji,l
N
ji,jji,j
i
iiN
ji,j,pi,j
ii
i
YhmYhm
Mhm
dt
pVdcY
dt
dTm
dt
dU
5-24
Using Equation (5.17), the last two terms on the RHS of Equation (5.13) can be
expressed as
out
out
s
outoutoutin
in
in
s
inin
out
out
outout
in
in
inin
N
l
N
ji,l,ji,l,ji,li,l,j
N
l
N
ji,l,ji,l
N
li,li,l
N
li,li,l
YhmYhm
hmhm
Energy OutflowEnergy Inflow
5-25
Substituting Equation (5.24) and (5.25) into Equation (5.13) yields
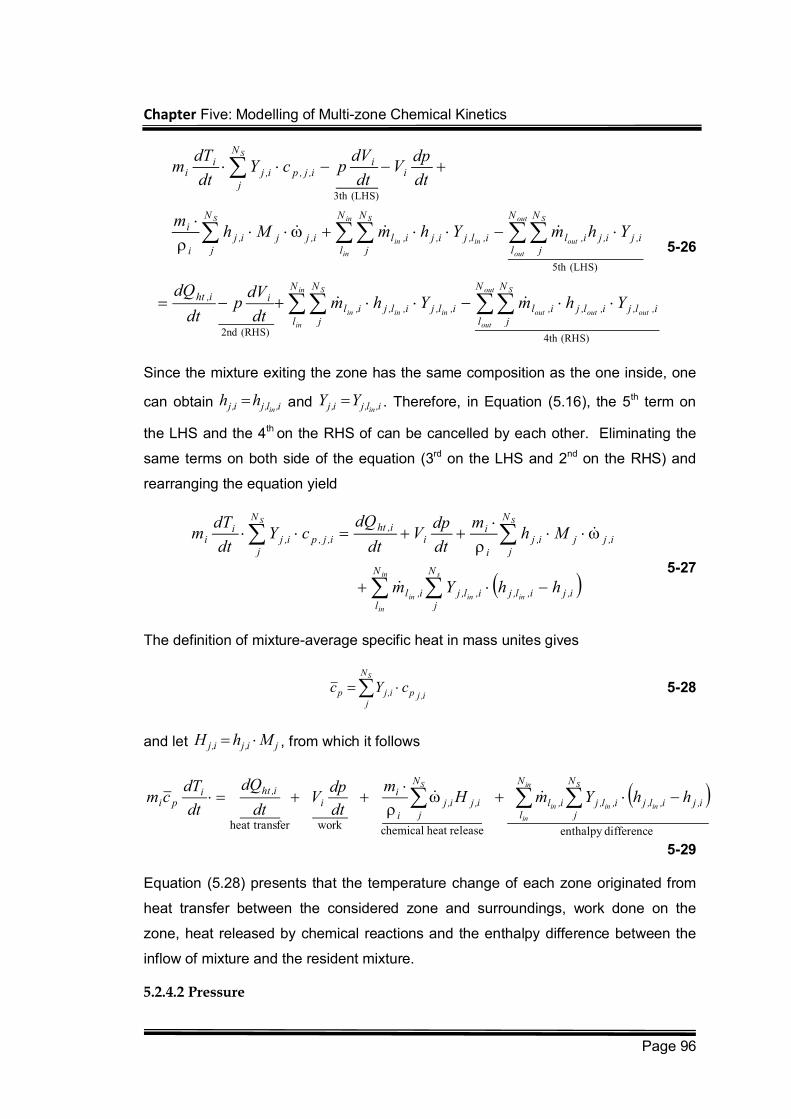
Chapter Five: Modelling of Multi-zone Chemical Kinetics
Page 96
(RHS)4th (RHS) 2nd
(LHS)5th
(LHS)3th
out
out
S
outoutoutin
in
in
S
inin
out
out
S
out
in
in
S
inin
S
S
N
l
N
ji,l,ji,l,ji,li,l,j
N
l
N
ji,l,ji,l
ii,ht
N
l
N
ji,ji,ji,l
N
l
N
ji,l,ji,ji,l
N
ji,jji,j
i
i
ii
N
ji,j,pi,j
ii
YhmYhmdt
dVp
dt
dQ
YhmYhmMhm
dt
dpV
dt
dVpcY
dt
dTm
5-26
Since the mixture exiting the zone has the same composition as the one inside, one
can obtain i,l,ji,j inhh and i,l,ji,j in
YY . Therefore, in Equation (5.16), the 5th term on
the LHS and the 4th on the RHS of can be cancelled by each other. Eliminating the
same terms on both side of the equation (3rd on the LHS and 2nd on the RHS) and
rearranging the equation yield
in
in
s
ininin
SS
N
l
N
ji,ji,l,ji,l,ji,l
N
ji,jji,j
i
ii
i,htN
ji,j,pi,j
ii
hhYm
Mhm
dt
dpV
dt
dQcY
dt
dTm
5-27
The definition of mixture-average specific heat in mass unites gives
SN
ji,jpi,jp cYc 5-28
and let ji,ji,j MhH , from which it follows
differenceenthalpy releaseheat chemicalworkferheat trans
in
in
S
ininin
S N
l
N
ji,ji,l,ji,l,ji,l
N
ji,ji,j
i
ii
i,htipi hhYmH
m
dt
dpV
dt
dQ
dt
dTcm
5-29
Equation (5.28) presents that the temperature change of each zone originated from
heat transfer between the considered zone and surroundings, work done on the
zone, heat released by chemical reactions and the enthalpy difference between the
inflow of mixture and the resident mixture.
5.2.4.2 Pressure
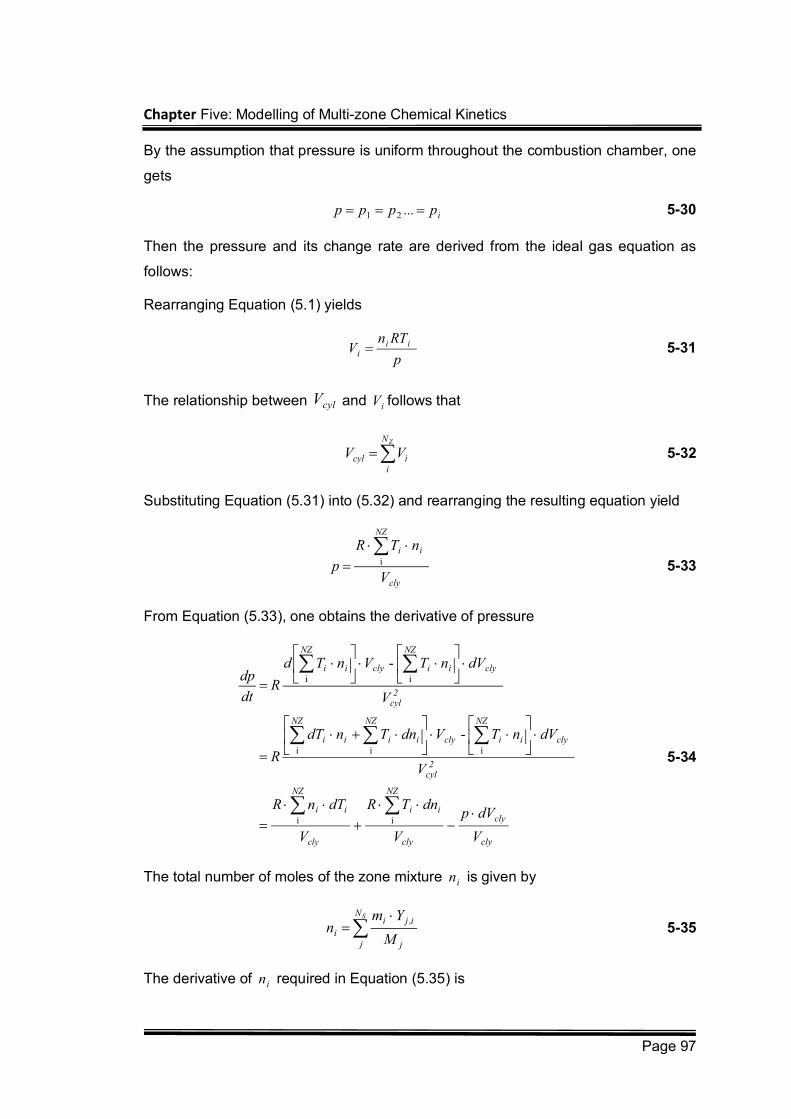
Chapter Five: Modelling of Multi-zone Chemical Kinetics
Page 97
By the assumption that pressure is uniform throughout the combustion chamber, one
gets
ip...ppp 21 5-30
Then the pressure and its change rate are derived from the ideal gas equation as
follows:
Rearranging Equation (5.1) yields
p
RTnV ii
i 5-31
The relationship between cylV and iV follows that
ZN
iicyl VV 5-32
Substituting Equation (5.31) into (5.32) and rearranging the resulting equation yield
cly
NZ
ii
V
nTR
p
i
5-33
From Equation (5.33), one obtains the derivative of pressure
cly
cly
cly
NZ
ii
cly
NZ
ii
2cyl
cly
NZ
iicly
NZ
ii
NZ
ii
2cyl
cly
NZ
iicly
NZ
ii
V
dVp
V
dnTR
V
dTnR
V
dVnTVdnTndT
R
V
dVnTVnTd
Rdt
dp
ii
iii
ii
-
-
5-34
The total number of moles of the zone mixture in is given by
SN
j j
i,ji
iM
Ymn 5-35
The derivative of in required in Equation (5.35) is
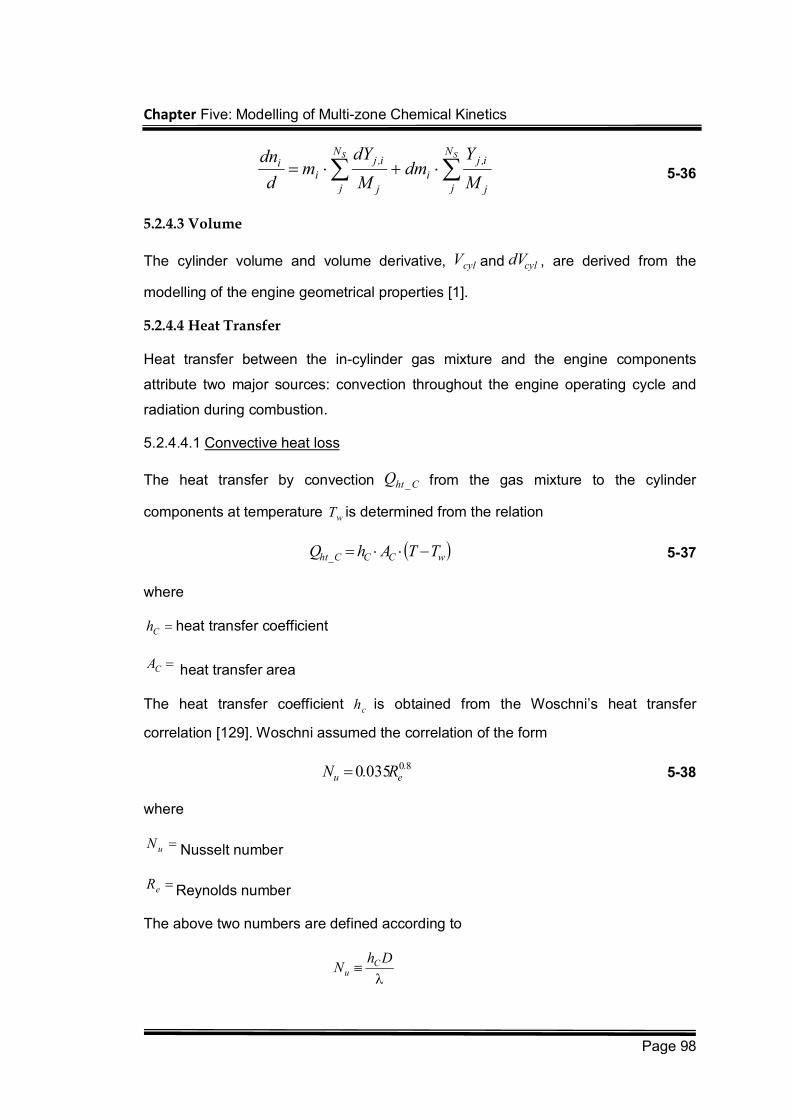
Chapter Five: Modelling of Multi-zone Chemical Kinetics
Page 98
SS N
j j
i,j
i
N
j j
i,j
ii
M
Ydm
M
dYm
d
dn 5-36
5.2.4.3 Volume
The cylinder volume and volume derivative, cylV and cyldV , are derived from the
modelling of the engine geometrical properties [1].
5.2.4.4 Heat Transfer
Heat transfer between the in-cylinder gas mixture and the engine components
attribute two major sources: convection throughout the engine operating cycle and
radiation during combustion.
5.2.4.4.1 Convective heat loss
The heat transfer by convection C_htQ from the gas mixture to the cylinder
components at temperature wT is determined from the relation
wCCC_ht TTAhQ 5-37
where
Ch heat transfer coefficient
CA heat transfer area
The heat transfer coefficient ch is obtained from the Woschni’s heat transfer
correlation [129]. Woschni assumed the correlation of the form
800350 .eu R.N 5-38
where
uN Nusselt number
eR Reynolds number
The above two numbers are defined according to
Dh
N Cu
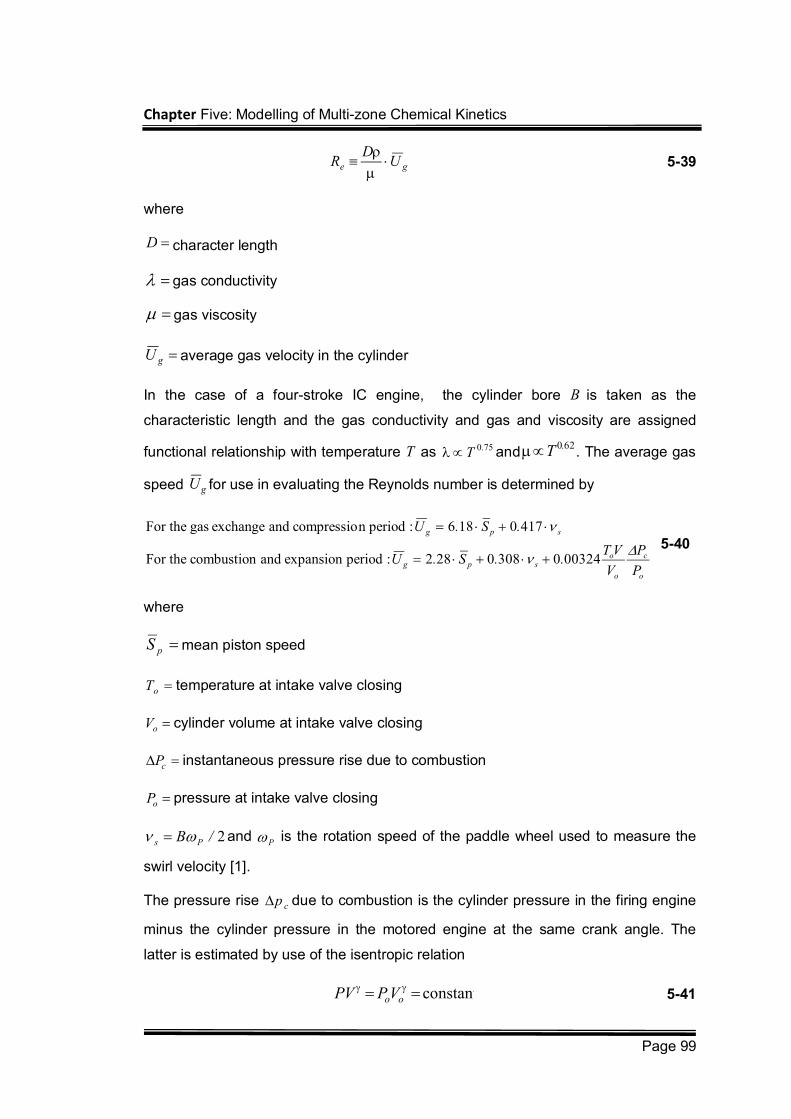
Chapter Five: Modelling of Multi-zone Chemical Kinetics
Page 99
ge UD
R
5-39
where
D character length
gas conductivity
gas viscosity
gU average gas velocity in the cylinder
In the case of a four-stroke IC engine, the cylinder bore B is taken as the
characteristic length and the gas conductivity and gas and viscosity are assigned
functional relationship with temperature T as 750.T and620.T . The average gas
speed gU for use in evaluating the Reynolds number is determined by
o
c
o
ospg
spg
P
P
V
VT..S.U
.S.U
0032403080282 :periodexpansion and combustion For the
4170186 :periodn compressio and exchange gas For the
5-40
where
pS mean piston speed
oT temperature at intake valve closing
oV cylinder volume at intake valve closing
cP instantaneous pressure rise due to combustion
oP pressure at intake valve closing
2/B Ps and P is the rotation speed of the paddle wheel used to measure the
swirl velocity [1].
The pressure rise cp due to combustion is the cylinder pressure in the firing engine
minus the cylinder pressure in the motored engine at the same crank angle. The
latter is estimated by use of the isentropic relation
constant ooVPPV 5-41
Chapter Five: Modelling of Multi-zone Chemical Kinetics
Page 100
Substituting Equation (5.39) into (5.38) and introducing RT
p leads to
530808020 ..g
..wchC TUpBCh 5-42
where
wshC heat transfer rate constant
The exponential parameters in Woschni’s correlation were determined by matching
experimental results obtained using a particular diesel engine. When applied to any
other engine with different combustion scenario, the constants should be adjusted to
better suit the engine.
5.2.4.4.2 Radiation heat transfer
The heat transfer by radiation is predicted using the formula proposed by Annand
[181], which is proportional to the fourth power of the absolute material temperature
and is of the form
44wRR_ht TTAQ 5-43
where
RA Boundary surface area
Stefan-Boltzmann constant equal to 42810675 Km/W.
Radiation heat transfer coefficient between 0.6 and 1.6 suggested by Heywood
[1]
5.2.5 Summary
Examination of all the terms of Equation (5.12) and (5.13) just discussed reveals the
following derivatives in those equations formulated for each single zone.
i,ji,liii,j
,m,m,dt
dT,
dt
dYin
5-44
And the following variables
, V , V , AA
, ρ m , m , , h , hc
, Y , Y T
icylRC
ii,ij,lj,ij,ip
,ij.lj,ii
in
in
5-45
Chapter Five: Modelling of Multi-zone Chemical Kinetics
Page 101
Where ininSZ , NlN,jN,i 1 , 1 , 1
The thermodynamic variables j,ij,ip ,hc and ,ij,linh are calculated based on the
assumption that the gas mixture in each zone has ‘perfect’ standard-state
thermodynamic properties, by which these variables are functions of iT . More details
of the calculation are introduced in the next section.
The mass change rate of each zone is differently dealt with according to the engine
type. For a SI engine, the mass transferred between zones can be known from an
empirical burning law (Weibe Function) and for a HCCI engine, it is calculated by a
mass mixing model in assumption of uniform pressure across the combustion
chamber. All in all
The cylinder volume cylV is a known function of crank angle [1]. The zone volumes
iV and heat transfer related areas CA and RA are obtained from user-specified
functions according to the engine type and operating characteristics, a discussion of
which is deferred to Chapter 7 and Chapter 8
The mass fraction and energy equations (5.12) and (5.29) are thus seen to be a
relationship among the derivatives, dt
dY i,jand
dt
dTi , their integrals, i,jY and iT , and
parameters iA and iB , dependent upon the integrals, which can be expressed as
i
N
i,N
i,
i,
i
i
N
i,N
i,
i,
i
B
Y
Y
Y
T
A
dt
dY
dt
dYdt
dYdt
dT
S
S
S
S
11
2
1
11
2
1
5-46
where the notes under the variable matrices indicates the matrix dimension. The iA is
the coefficient matrix and iB is the parameter matrix, and they are expressed as
Chapter Five: Modelling of Multi-zone Chemical Kinetics
Page 102
i,N,Ni,,Ni,,N
i,N,i,.i,,
i,N,i,,i,,
i
SsSS
S
S
AAA
AAA
AAA
A
112111
122212
112111
and
i,N
i,
i,
SB
B
B
B
1
2
1
When Equation (5.46) is extended for a system with ZN zones, the matrix expression
of the governing equations is
B
Z
Z
Z
A
Z
Z
Z
SZ
Z
SZ
Z
NN
N
NN
N
11
2
1
11
2
1
5-47
where
11
1
S
S
N
i,N
i,
i
i
Y
Y
T
Z
, 11
2
1
SZ
Z
NN
NA
A
A
A
and 11
2
1
SZ
Z
NN
NB
B
B
B
5.3 Numerical Methods and Computation of Chemical kinetics
5.3.1 Introduction
In the previous chapter, a set of differential equations are summarized to express a
multi-zone combustion system based on the conservation equations for mass and
energy. This set of equations is treated as a time dependent initial value problem.
Equation 5-47 can also be expressed in a standard form as:
0T,y,dt
dT,
dt
dy,tf ii,j
ii,j
nn yty )( 5-48
Where y is the vector of the system’s unknowns, i.e. mass fraction and temperature
and f is the vector containing the system‘s set of conservation equations, which are
functions of the unknowns y and of time t . The following equation states an initial
condition at a certain time nt , in which n is the temporal discretization index.
Chapter Five: Modelling of Multi-zone Chemical Kinetics
Page 103
The mathematical model of a combustion system with chemical kinetics is highly
non-linear due to its Arrhenius expression exponential dependence and it is stiff. In a
chemical kinetics model, reaction rates can differ by orders of magnitude from one
reaction to another. The same is true for species concentrations, going from orders of
210 for fuel and oxidants, to 1010 or 1510 for many radicals. For such a system,
even if the solution is slowly changing, very small calculation time steps are required
just to maintain stability.
To computationally solve this kind of differential equations, several production-level
soft ware is readily available, these software packages implement variable-order,
variable-time step algorithms that compute efficiently and deliver high-accuracy
solutions some of the widely used and well documented package are LSODE,VODE
and DASSL.
5.3.2 Stiffness in Solution of ODEs of chemical kinetics
Chemical kinetics, especially for systems like combustion, is characterized by
enormous disparities in the characteristic time scales for the response of different
species. For some reactions, the rate constant k can be very large, resulting
potentially in very rapid transient change in the concentrations of some species. On
the contrary, the other species may be involved in some reactions that have relative
low rates. In a flame, for example, the characteristic time scales for free-radical
species (e.g., H atoms) are extremely short, while the characteristic time scales for
other species (e.g., NO ) are quite long. This huge time-scale disparity leads to a
numerical property called stiffness [182].
Thus, stiffness occurs in problems where there are two or more very different scales
of the independent variable, on which the dependent variables are changing. For
example, consider the following set of equations derived from a chemical kinetic
mechanism [183]:
vuu 1998998' 5-49
vuv 1999999' 5-50
With boundary conditions
0)0(,1)0( vu
The solutions are found as
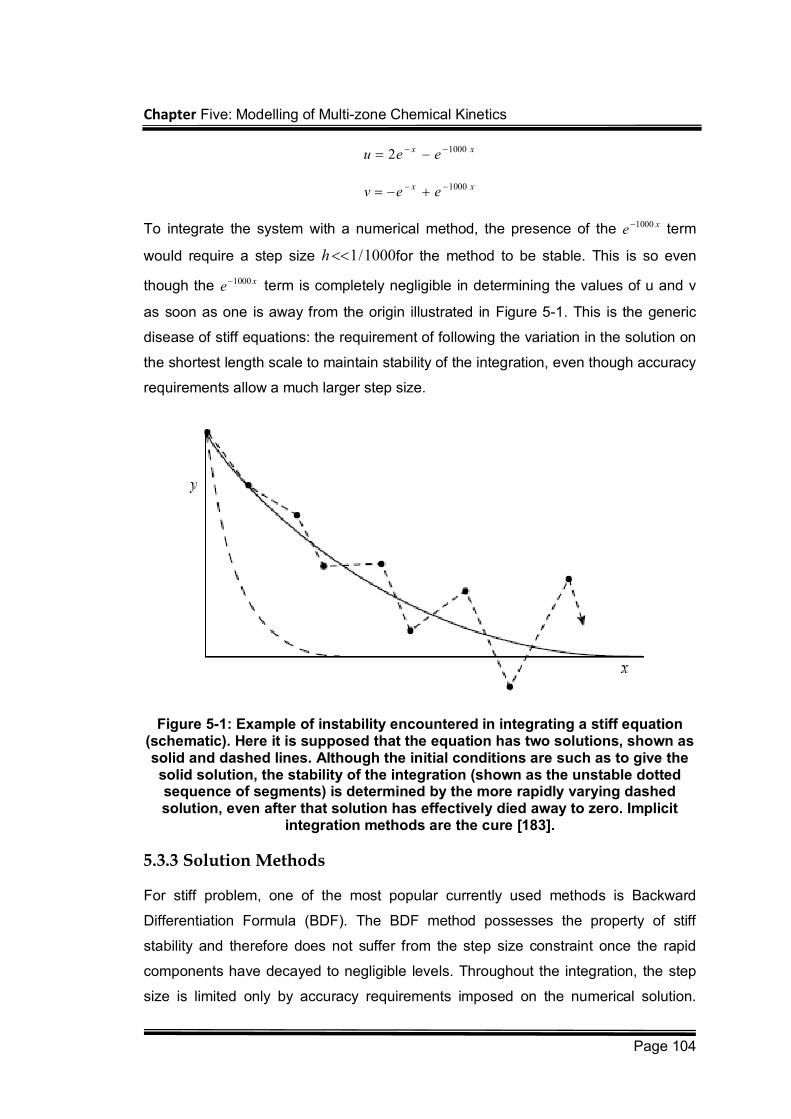
Chapter Five: Modelling of Multi-zone Chemical Kinetics
Page 104
xx eeu 10002
xx eev 1000
To integrate the system with a numerical method, the presence of the xe 1000 term
would require a step size 1000/1h for the method to be stable. This is so even
though the xe 1000 term is completely negligible in determining the values of u and v
as soon as one is away from the origin illustrated in Figure 5-1. This is the generic
disease of stiff equations: the requirement of following the variation in the solution on
the shortest length scale to maintain stability of the integration, even though accuracy
requirements allow a much larger step size.
Figure 5-1: Example of instability encountered in integrating a stiff equation (schematic). Here it is supposed that the equation has two solutions, shown as solid and dashed lines. Although the initial conditions are such as to give the solid solution, the stability of the integration (shown as the unstable dotted sequence of segments) is determined by the more rapidly varying dashed solution, even after that solution has effectively died away to zero. Implicit
integration methods are the cure [183].
5.3.3 Solution Methods
For stiff problem, one of the most popular currently used methods is Backward
Differentiation Formula (BDF). The BDF method possesses the property of stiff
stability and therefore does not suffer from the step size constraint once the rapid
components have decayed to negligible levels. Throughout the integration, the step
size is limited only by accuracy requirements imposed on the numerical solution.
Chapter Five: Modelling of Multi-zone Chemical Kinetics
Page 105
(FYI: accuracy of a numerical method refers to the magnitude of the error introduced
in a single step or, more precisely, the local truncation or discretization error.)
When a first-order ordinary differential equation is expressed as:
tgydt
dy 5-51
Where the ‘prime’ indicates a time derivative, is a constant, and tg is some
function of time
An example of BDF method can be stated as follows:
11'
11
nnn
n
nn tgyyh
yy 5-52
where the time step is nnn tth 1 and the right-hand side function is evaluated at
the advanced time level 1nt and indicates the time level.
Then
nnnnnnnn ytgyhyyhy 11'
11 5-53
The nomenclature 1nty is used to mean the exact analytic solution evaluated at
some time 1nt and 1ny to represent the numerical solution at 1nt . It is clear that the
true analytic solution must satisfy the differential equation 5-51 everywhere.
nnn tgtyty ' 5-54
By adding the backward approximation to each side of this equation, both the
backward algorithm and an expression for the local truncation error can be identified.
n
nnnn
n
nnn
h
tytytgty
h
tytyty
1
111
1' 5-55
An algebraic rearrangement yields:
1
'1
111
nnnn
nnnnn
tyhtyty
tgtyhtyty 5-56
The first three terms represent the backward algorithm and the remaining term
Chapter Five: Modelling of Multi-zone Chemical Kinetics
Page 106
represents the local truncation error. A Taylor series expansion about 1nt (in the
negative t direction) yields an expression for nty
31
''2
1'
12
nnn
nnnn hOtyh
tyhtyty 5-57
It can be seen that the local truncation error for the interval nnn tth 1 is
1'
13
1''
2
2 nnnnnn
nn tyhtytyhOty
hd 5-58
The global error is defined as nnn tyye . A recursion relationship for the global
error can be found by using equations 5-53 and 5-56
nnnn dehe 11 5-59
For the method to be stable, the error 1ne must be less than ne , which leads to the
stability criterion as
11
1
nh 5-60
It is obvious from this expression that the method is unconditionally stable for all
and all time steps nh (for linear problem). A consequence of the strong stability is
that the time step can be chosen primarily to maintain accuracy. In slowly varying
regions of stiff problems, the time steps can be very large compared those required
to maintain stability for an explicit algorithm.
5.3.4 Numerical Code Packages
Various computer programs have been developed to solve the chemical kinetics
model that consists of a set of stiff ordinary differential equations as described in the
previous section. The first algorithm that is capable of handling stiff ODE systems
was proposed by William Gear in the 1970’s [184]. The state-of-the-art numerical
codes that are now available and well regarded for solving large stiff ODE systems
are VODE, LSODE, and DASAC.
5.3.4.1 Livermore Solver for Ordinary Differential Equations (LSODE)
For stiff problems, the LSODE (Livermore Solver for Ordinary Differential Equations)
Chapter Five: Modelling of Multi-zone Chemical Kinetics
Page 107
package uses the Backward Differentiation Formula (BDF) method. To satisfy
accuracy requirements, the BDF method may have to use small step sizes of order
)max(/1 in regions where the most rapid exponentials are active. However, for the
regions, which have relative small change rates of the solutions, larger step sizes
may be used. The LSODE package also includes the implicit Adams method, which
is well suited for non-stiff problems. Both integration methods belong to the family of
linear multi-step methods. As implemented in LSODE these methods allow both the
step size and the method order to vary (between the Adams method and the BDF
method) throughout the problem. The capability of dynamically varying the step size
and the method order is very important to the efficient use of linear multi-step
methods. The LSODE package consists of 21 subprograms and a BLOCK DATA
module. The package has been integrated into a single FORTRAN 77 code, and in
normal circumstances, the user needs to communicate with the code by calling only
a single subroutine, also named LSODE for convenience, into the user-supplied
program. Communication between different subroutines in the package is
accomplished by means of both call sequences and the two common blocks.
5.3.4.2 Variable-coefficient Ordinary Differential Equation solver (VODE)
VODE (Variable-coefficient Ordinary Differential Equation solver) is an initial value
ODE solver for stiff and non-stiff systems. It uses variable-coefficient Adams-Moulton
and BDF methods in Nordsieck form, treating the Jacobian as full or banded. Unlike
the older codes, VODE has a highly flexible user interface that is nearly identical to
that of the LSODE package. As a comparison with LSODE, several algorithmic
improvements have been made in VODE [185]:
First, a change in step-size and/or order that is decided upon at the end of
one successful step is not implemented until the start of the next step, so that
interpolations performed between steps use the more correct data.
Secondly, a new algorithm for setting the initial step size has been included,
which uses somewhat more data and makes a more genuine attempt to
approximate the initial second derivative vector, whose availability is the
difficulty with the initial step selection
Efficiency is greatly enhanced by an added algorithm for saving and reusing
the Jacobian matrix J as it, under certain conditions, occurs in the Newton
matrix. As an option, this Jacobian-saving feature can be suppressed if the
Chapter Five: Modelling of Multi-zone Chemical Kinetics
Page 108
required extra storage is prohibitive.
VODE offers a choice between functional iteration (where no matrices are
involved) and a modified Newton iteration in which the Jacobian matrix J is
treated as full or banded, and as either supplied by the user or approximated
internally by difference quotients.
VODE demonstrates that multi-step methods with fully variable step-sizes and
coefficients can outperform fixed-step interpolatory methods on problems with widely
different active time scales. In one comparison test, on a 1-D diurnal kinetics-
transport problem with a banded internal Jacobian, the run time for VODE was 36%
lower than that of LSODE without the J-saving algorithm and 49% lower with it. The
fixed-leading-coefficient version ran slightly faster, by another 12% without J-saving
and 5% with it [185].
5.3.4.3 Differential Algebraic Sensitivity Analysis Code (DASAC)
DASAC (Differential Algebraic Sensitivity Analysis Code) solves nonlinear initial-
value problems involving stiff implicit systems of ordinary differential and algebraic
equations. Purely algebraic nonlinear systems can also be solved, given an initial
guess within the region of attraction of a solution. Options include automatic
reconciliation of inconsistent initial states and derivatives, automatic initial step
selection, direct concurrent parametric sensitivity analysis, and stopping at a
prescribed value of any user-defined functional of the current solution vector. Local
error control (in the max-norm or the 2-norm) is provided for the state vector and can
include the sensitivities on requires
5.3.4.4 Summary
In the old version of CHEMKIN II package, The LSODE code is employed, to solve
the initial value problem for stiff or non-stiff systems of first order ordinary differential
equations. The updated version of CHEMKJN II package and all the later versions
handle the chemical kinetic systems using the VODE code to calculate the
temperature and species concentrations at various residence times. In the SENKIN
program, the DASAC code is implemented to solve the nonlinear ODE that describes
the temperature and species concentrations and reaction sensitivities.
All the solver packages discussed above are widely used and have been proved to
produce efficient computation and high computation accuracy as dealing with stiff
Chapter Five: Modelling of Multi-zone Chemical Kinetics
Page 109
differential equations related to chemical kinetics. Upon closer examination of results,
no method is found always superior to the others, the VODE code exhibits slightly
better performance in calculation speed, but for zero-dimensional models, this benefit
should not be highlighted since the overall computation time is only of time scale in
minutes. As for calculation accuracy, no significant difference has been reported.
Selection of the solvers might also be of users’ personal preference in consideration
of their familiarity to the code. In this work, the VODE code is applied as the
numerical solver to the system equations.
Chapter Six: Loughborough University Chemical Kinetics Simulation (LUCKS) Code
Page 110
Chapter Six: Loughborough University Chemical Kinetics Simulation (LUCKS) Code
6.1 Introduction
This chapter describes the packaged code - LUCKS (Loughborough University
Chemical Kinetics Simulation) designed for the numerical solution of the set of first
order ODEs describing the chemical and physical processes of gas-phase
hydrocarbon combustion in SI and HCCI engines. The LUCKS code offers a flexible
approach of incorporating chemical kinetics modelling with thermodynamic modelling
in the simulation of SI and HCCI engine combustion. The mathematical background
that the code employed is presented in Chapter 5.
The purpose-driven development of the LUCKS code is to overcome the limitation of
the commercial codes that are developed to solve chemical kinetics in the simulation
of IC engine combustion. So far, the typical commercial codes have been well
packaged to predict the time-dependent chemical kinetics behaviour of a
homogeneous gas mixture in a closed system. However, combustion in a real engine
is a more complex scenario. Firstly, the in-cylinder mixtures are not spatially
homogenous due to heat transfer and gas mixture motion. Secondly, a combustion
chamber could not be a closed system owing to engine blowby. Thus, the LUCKS
code has been designed for the following features on IC engine modelling
Combustion system with the volume being a specified function of time
parameters (e.g. IC engines)
Chapter Six: Loughborough University Chemical Kinetics Simulation (LUCKS) Code
Page 111
Simulation of open combustion systems via modelling of blowby
Multi-zone modelling of inhomogeneity of in-cylinder gas mixture (burned,
burning and unburned zones for SI engines and crevice zone, boundary layer
and core zones for the HCCI engines)
Modelling the effects of EGR on combustion and pollutant formation in HCCI
engines
Simulation of locally homogeneous gas-phase chemical kinetics
Compatible with either detailed or reduced chemical kinetic mechanisms
The LUCKS code has been so far developed for the simulation of SI and HCCI
engine combustion, each of which is represented by one of the two subordinate
packages: LUCKS_SI and LUCKS_HCCI, respectively. Some design goals are kept
in the developers’ mind while writing the LUCKS code. They include:
The code is well-structured and object-oriented, which make it easy to
maintain and build upon for the subsequent users and developers, and written
using open source FORTRAN77/99 to make code transportable between
computers s
Where possible, the code is programmed to have modular structures so that
increasing functionalities can be easily added and /or replaced with.
The code is commented on the code usage and the references that indicate
the methodologies used.
The code is designed to be applied across platforms so that it can be
compiled and executed under both Windows and UNIX systems.
The well-established DVODE code is applied to solve the initial value
problems in both stiff and non-stiff ODEs systems.
This chapter are presented in two parts. The first part is to present in detail the
modeling structure of the LUCKS code and the second part states the use of the
computer code. Various aspects of this computer code are discussed.
6.1.1 Why is FORTRAN Used?
FORTRAN computer language is used in coding LUCKS, but the choice may not
whet some users’ appetite, especially for some of the new numerical programmers.
FORTRAN is seemingly losing the ground to be the programmers’ primary option
Chapter Six: Loughborough University Chemical Kinetics Simulation (LUCKS) Code
Page 112
over the alternatives, say, C or C++. However, in the real numerical computing world,
FORTRAN still dominates. The following points summarized may explain how
FORTRAN surpasses its counterparts in the scientific and engineering community,
especially when high performance is required.
FORTRAN is easier for new programmers to learn than C and C++, because
it requires much simpler process of thought of knowing and understanding the
language and hence much less time required to learn FORTRAN than either
C or C++.
Modern language features as in C and C++ are embedded and improved in
FORTRAN 90, such as useful features of C (column independent code,
pointers, dynamic memory allocation, etc) and C++ (operator overloading,
primitive objects). FORTRAN 90 helps users write tighter and faster code
than either the original FORTRNA 77 or the C and C++. The more important
point is that it is easier for existing FORTRNA 77 programmers to change to
90 rather than to C or C++.
A great deal of FORTRAN codes exist already (CHEMKIN Library, DVODE,
etc), much of which is publicly available and of high quality. Learning and
rewriting existent programs into another language requires huge cost in
programming time and causes difficulties in portability. The use of FORTRAN
in LUCKS is consistent with its application in CHEMKIN Library and DVODE,
which avoid the rewriting and transition of these existing programs into other
languages. The compatibility between user-supplied code and the existing
codes should always be regarded as a prerequisite in the selection of
programming language.
Parallel computers have been more and more applied in modern scientific
computing. For example, application of a fully detailed chemical mechanism
in a multi-zone combustion model or a CFD model may require the use of
parallel computers. However, all the programming languages except
FORTRAN 90 have the inherent limitation of the linear memory model in
achieving parallelism. A linear memory model is one that assumes that
consecutive elements of an array are consecutive in memory. This was a
reasonable assumption on traditional computers, but it is completely incorrect
on a parallel computer. Only Fortran 90 has addressed this problem and
Chapter Six: Loughborough University Chemical Kinetics Simulation (LUCKS) Code
Page 113
providing standardized language support for parallelism [186].
6.2 Code Structure
Either LUCKS_SI or LUCKS_HCCI code in the LUCKS package is composed of six
blocks of FORTRAN code and five input data files:
Interpreter (code)
User-Supplied Engine Simulation Subroutine Library (code)
DVODE Solver (code)
Simulation Main Program (code)
Module Library (code)
The Gas-Phase Subroutine Library (code)
Input of Initial Conditions (Data File)
Input of Engine Geometries and Operating Conditions (Data Files)
The LUCKS code has a modular structure composing of multiple blocks of
FORTRAN code and input files enabling the users to communicate with the program.
The general structure of the LUCKS code is shown in Figure 6-1, wherein a line
connecting two routines indicates that the lower routine is called by the upper one.
The three blocks on the upper left part of the structure indicates the three input files
that interface the users with the code and needs to be supplied by the users, which
respectively define the initial mixture conditions (input_#1), and engine geometries
and operation conditions (input_#2), and solution method parameters (input_#3).
The upper right corner of the structure illustrates the use of the CHEMKIN interpreter
to generate the binary file containing chemical and thermodynamic information of the
reaction mechanism applied in the simulation. The input files and the generated
binary file are input into the main program. The main program interfaces with our
blocks on the right, which, from the top, are the user-supplied subroutine library and
CHEMKIN subroutine library, and the module block and DVODE solver. The lower
part depicts the modelling outputs.
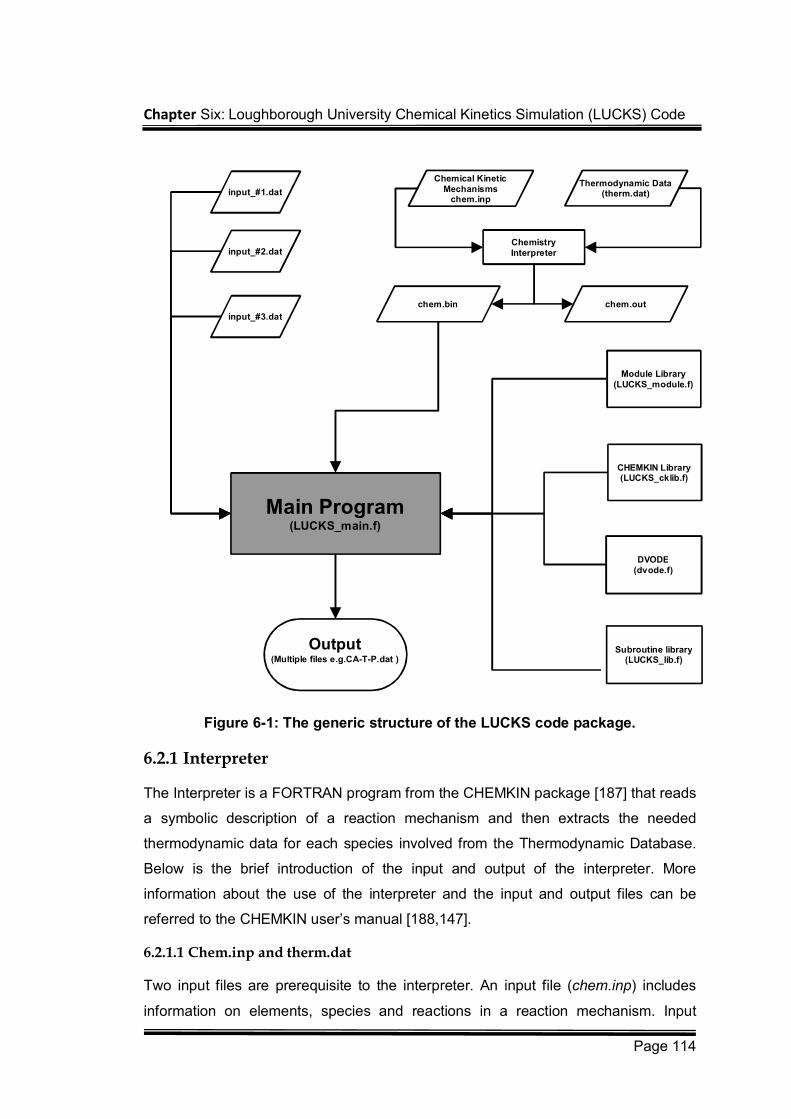
Chapter Six: Loughborough University Chemical Kinetics Simulation (LUCKS) Code
Page 114
Figure 6-1: The generic structure of the LUCKS code package.
6.2.1 Interpreter
The Interpreter is a FORTRAN program from the CHEMKIN package [187] that reads
a symbolic description of a reaction mechanism and then extracts the needed
thermodynamic data for each species involved from the Thermodynamic Database.
Below is the brief introduction of the input and output of the interpreter. More
information about the use of the interpreter and the input and output files can be
referred to the CHEMKIN user’s manual [188,147].
6.2.1.1 Chem.inp and therm.dat
Two input files are prerequisite to the interpreter. An input file (chem.inp) includes
information on elements, species and reactions in a reaction mechanism. Input
Module Library(LUCKS_module.f)
Main Program(LUCKS_main.f)
Subroutine library(LUCKS_lib.f)
CHEMKIN Library(LUCKS_cklib.f)
DVODE(dvode.f)
Output(Multiple files e.g.CA-T-P.dat )
Chemistry Interpreter
Chemical Kinetic Mechanisms
chem.inp
Thermodynamic Data(therm.dat)
chem.bin chem.out
input_#1.dat
input_#2.dat
input_#3.dat
Chapter Six: Loughborough University Chemical Kinetics Simulation (LUCKS) Code
Page 115
information in this file is given in 80-column FORTRAN format. Element data are read
first, followed by species data and with reactions and reaction rate parameters last.
Another input file to the interpreter is the thermodynamic data file containing the
thermodynamic properties for the species in the user’s reaction mechanism. The
format of therm.dat uses the one applied in the CHEMKIN package, which is a minor
modification of that used for the Thermodynamic Database in the NASA Chemical
Equilibrium code. Consequently, the formatting enables the interpreter to use the
NASA database directly without any modification.
6.2.1.2 Chem.bin and chem.out
The primary output from the Interpreter is a binary file called the Linking File
(chem.bin). This file contains information that contains all required information about
the elements, species, and reactions in the user's mechanism, and can be opened
and read by the initialization subroutine in the LUCKS code. Hence, the chem.bin
must be placed in the same directory where the main LUCKS code is put.
In addition to the linking file, another data file (chem.out) of FORTRAN’s standard
output format is produced by the interpreter, which contains a listing of the elements,
species, and reactions in the mechanism. The printed output file, though, is not used
by the subsequent programs; it is, in contrast to the binary Linking file, of an easily
readable file type for the users to recheck the mechanism information and examine
the program execution status by providing diagnostic error messages.
Once the Interpreter has been successfully executed to create the linking file, the
initialization subroutines in the main program is called to import the information of the
reaction mechanism stored in the chem.bin into the work arrays in the main program.
Then, the work arrays will be used by both the main program and the relevant
subroutines.
6.2.2 Main Program
The main program sets up a command procedure to load the subroutines and pass
variables and parameters from one process to another. Since the main programs in
LUCKS_SI and LUCKS_HCCI has an analogous structure except the difference in
the BLANCE subroutine, in which the mass transfer across flame front in SI engines
are modelled by Weibe function and chemical kinetic consumption of unburned
gases, which is explained in details in Section 7.2.1.4. The structure of the main
Chapter Six: Loughborough University Chemical Kinetics Simulation (LUCKS) Code
Page 116
programs of LUCKS_SI and LUCKS_HCCI is generally illustrated in Figure 6-2,
wherein a line connecting two subroutines indicates that the lower routine is called by
the upper one. The structure is divided into three sequential levels that are described
in the following paragraphs.
The first level marked in light pink first call for the modules used in the main program,
which list the defined arguments that will be referenced. Then, all the variables are
defined by an implicit type, by which, the variables whose names start with I, J, K, L,
M or N is defined as INTEGER and all the others are DOUBLE PRECISION. Next,
the user-supplied subroutine LUCKS_WRK_ARRAY is executed to extract into the
work arrays the information of the chemical mechanism about the species and
chemical reactions for the chosen mechanism from the file chem.bin and the
subroutine CKINDX is next called from the CHEMKIN subroutine library to return a
group of indices defining the size of the reaction mechanism. The input file defining
the reactor and operating conditions and the parameters for the solver are then
loaded and stored in the working space (Subroutines: LUCKS_INIT_CND,
LUCKS_ENG_OPT, and LUCKS_MDL_PAMR) and the input data are also used to
derive the relevant parameters and variables needed by the subsequent subroutines
and functions (Subroutines: VOLUME_FRACTION, VOLUME and MASS).
The next level (marked in light green) describes the integration loop of the system
equations. It starts with the update of the beginning and ending points of the
integration and the corresponding crank angles. The subroutine VOLUME is called to
calculate the geometry properties of both the combustion chamber and each
combustion zone. Then, the properties of the gas mixture are updated by the
subroutine STATE_UPDATE and mass change due to blowby is calculated in
BLOWBY. Next, the pressure is balanced across all the zones with mass transfer
(subroutine: BALANCE) and heat transfer coefficients are derived in
HEAT_TRANSFER. The concentrations of emissions for each zone and the
combustion chamber are calculated in the subroutine EMISSION. Finally, the
subroutine OUTPUT is used to writes the calculated results into the output files.
The third level (marked in light yellow) of the structure depicts the execution of the
packaged solver code DVODE designed for the numerical solution of the system of
the first-order ordinary differential equations (ODE’S) given the initial values. The
solver code DVODE controls the integration and serves as an interface between the
calling subroutines and the rest of the package. The solver argument STATE is then
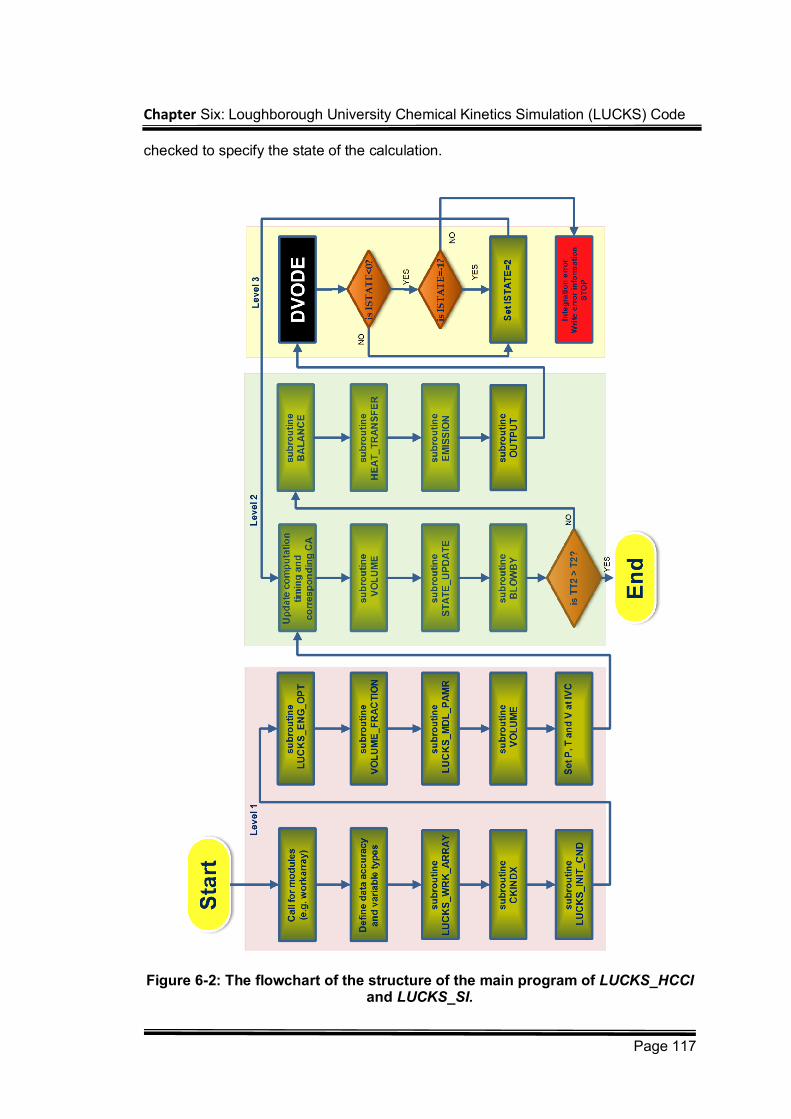
Chapter Six: Loughborough University Chemical Kinetics Simulation (LUCKS) Code
Page 117
checked to specify the state of the calculation.
Figure 6-2: The flowchart of the structure of the main program of LUCKS_HCCI and LUCKS_SI.
Chapter Six: Loughborough University Chemical Kinetics Simulation (LUCKS) Code
Page 118
6.2.3 Module Library
A new kind of program unit specifically embedded in Fortran 90, module, is used in
the LUCKS code package. Unlike the main program and the subroutines, modules
are not themselves executable program units. Rather, they contain definitions that
can be conveniently accessed and used by executable program units. In LUCKS,
The parameters and variables are grouped and assigned into different modules
according to their use in the related program units, which is a neat and structured
way of packaging and categorizing data objects. The data declared in a module can
be accessed and used by program, subroutines and functions using the USE
statements.
6.2.4 Subroutine Libraries
The LUCKS code includes two subroutine libraries: the user-supplied subroutine
library and the CHEMKIN subroutine library. All the subroutines programmed and
supplied by the users are packed in the user-supplied subroutine library. To enhance
the user’s understanding of the code, each subroutine contains comment statements
on the subroutine’s task and the input and output variables into /from the subroutine.
In accordance with the general acceptance of CHEMKIN format in describing the
information of chemical kinetic mechanisms, the CHEMKIN format is thus applied in
LUCKS to return information on elements, species, and reactions and calculates
equations of state, thermodynamic properties, and chemical production rates.
The CHEMKIN Library (LUCKS_cklib.f) is a gas phase subroutine Library, which is a
collection of about 100 highly modular FORTRAN subroutines. Generally, the input to
these routines will be the state of the gas including pressure or density,
temperature(s), and species composition.
Subroutines from this library are called from the main program and user-supplied
subroutines. The user's first step must be to dimension three storage arrays: IWORK,
RWORK, and CWORK in LUCKS, which are for three data types: integer, floating
point and character. Then the initialization subroutine CKINIT must be called to
create the storage arrays from the Linking File chem.bin. One or more of these
arrays is required input to nearly every other subroutine in the CHEMKIN Package.
Detailed descriptions of the library are included in the CHEMKIN user’s menu [188].
6.2.4.1 Variable-coefficient Ordinary Differential Equation solver
Chapter Six: Loughborough University Chemical Kinetics Simulation (LUCKS) Code
Page 119
DVODE (Variable-coefficient Ordinary Differential Equation solver) is a double
precision version of the VODE package, solving the initial value problem for stiff or
non-stiff systems of first order ordinary differentials equations in the forms of,
NEQyyytifdt
idy,...,2,1,, 6-1
Where NEQ,...,i 1
Communication between the user and the DVODE package is made through calling
subroutine DVODE (the same name to the package) to the LUCKS main program at
each calculation time step where solutions are desired. Full description of the use of
DVODE code is given in [189].
6.3 LUCKS Data File
6.3.1 Input data
To use the LUCKs code, three input files (input_#1.dat, input_#2.dat, and input_
#3.dat) need to be provided by the user, which define the initial mixture conditions,
and engine geometries and operation conditions, and solution method parameters,
respectively. The input in the files is in a data-comment-keyword format. On each
input line, a numerical number is given first and the description of the number follows
the number starting with an exclamation mark. Following the description, an
identifying keyword of the argument in the LUCKS code appears after a dash mark (-
). The numerical data are read by the code and the data description and keywords
are provided for user’s information only. All the data in each input files are of fixed
orders and any change of the orders or addition of other data have to come with the
revise of the genuine code.
6.3.2 Output data
The output from the LUCKS code is printed out into a number of data files: *.dat. As a
general rule of the output format, the data in the first column represents the
independent variable – crank angle degree (CAo) and the solutions of the dependent
variables are written at each integration step in the following columns. The naming
conventions follow the rules that all output files’ names starts with letters CA that
indicates the crank angle degree as the independent variable in the files and the
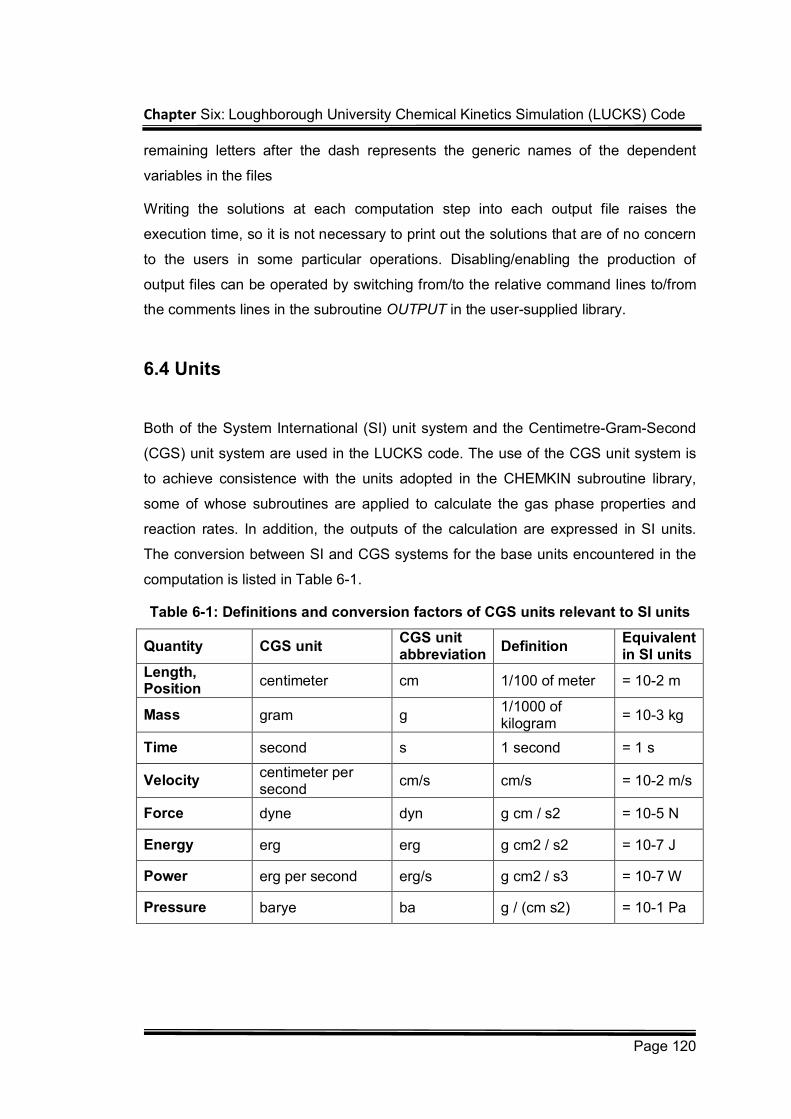
Chapter Six: Loughborough University Chemical Kinetics Simulation (LUCKS) Code
Page 120
remaining letters after the dash represents the generic names of the dependent
variables in the files
Writing the solutions at each computation step into each output file raises the
execution time, so it is not necessary to print out the solutions that are of no concern
to the users in some particular operations. Disabling/enabling the production of
output files can be operated by switching from/to the relative command lines to/from
the comments lines in the subroutine OUTPUT in the user-supplied library.
6.4 Units
Both of the System International (SI) unit system and the Centimetre-Gram-Second
(CGS) unit system are used in the LUCKS code. The use of the CGS unit system is
to achieve consistence with the units adopted in the CHEMKIN subroutine library,
some of whose subroutines are applied to calculate the gas phase properties and
reaction rates. In addition, the outputs of the calculation are expressed in SI units.
The conversion between SI and CGS systems for the base units encountered in the
computation is listed in Table 6-1.
Table 6-1: Definitions and conversion factors of CGS units relevant to SI units
Quantity CGS unit CGS unit abbreviation
Definition Equivalent in SI units
Length, Position
centimeter cm 1/100 of meter = 10-2 m
Mass gram g 1/1000 of kilogram
= 10-3 kg
Time second s 1 second = 1 s
Velocity centimeter per second
cm/s cm/s = 10-2 m/s
Force dyne dyn g cm / s2 = 10-5 N
Energy erg erg g cm2 / s2 = 10-7 J
Power erg per second erg/s g cm2 / s3 = 10-7 W
Pressure barye ba g / (cm s2) = 10-1 Pa
Chapter Seven: Chemical Kinetics Modelling of SI Engine Knock
Page 121
Chapter Seven: Chemical Kinetics Modelling of SI Engine Knock
7.1 Introduction
Modern spark ignition (SI) engines are being designed to operate close to its limits
caused by knock to achieve high brake mean effective pressure (BMEP), optimum
brake specific fuel consumption (BSFC) and low emissions. It is generally
acknowledged that knock in SI engines is caused mainly by the autoignition of the
unburned air and fuel mixture ahead of the flame front. It results in steep pressure
gradients that spread in the form of pressure waves in the combustion chamber.
These pressure waves then lead to undesirable knocking and ringing noise to the
vehicle driver and can cause damages to engine components at sufficiently high
intensities.
Chemical kinetic mechanisms play an important role in modelling spontaneous
autoignition. These are generally categorized into detailed [159,167], lumped [171],
reduced [123,154,177], and global models [174,190] according to the numbers of the
reactions and the species [6]. The detailed chemical kinetic mechanisms were
developed mostly by adjusting reaction rate parameters and thermal chemical data to
fit experimental data. The other types of mechanisms were either extracted from the
detailed mechanisms by taking computerized reaction sensitivity analysis like the
lumped models, or derived by simplifying the chemical reaction processes into a few
generalized chain branching reactions and fitting the reaction parameters for the
experimental results like the reduced and global models. The experimental facilities
in the study of chemical kinetic mechanisms are mainly engine-like devices such as
Chapter Seven: Chemical Kinetics Modelling of SI Engine Knock
Page 122
closed vessels, flow reactors, shock tubes or rapid compression machines that are
operated under homogeneous charge compression ignition (HCCI) conditions.
Autoignition behaviour of the unburned mixture under SI engine combustion is
different from that under HCCI condition, but mechanisms directly derived from SI
engines were scarce due to the complex combustion process. If these HCCI
mechanisms are applied to model the autoignition of the unburned mixture under SI
engine combustion, certain reaction rate parameters at various operation conditions
will have to be tuned to agree with the experimental data.
There are various levels of engine models having the potential to couple chemical
kinetics models to simulate SI engine combustion and autoignition, but each comes
with inherited advantages and disadvantages. Computational fluid dynamics (CFD)
modelling coupled with detailed combustion chemical kinetic mechanisms showed a
potential to mimic the engine knock by considering temporal and spatial variance of
the properties of the unburned gas mixtures, but requires massive computation
resources [25]. Single-step [191,192] and highly simplified multi-step kinetic
mechanisms [193-195] have been linked into the CFD simulations to simplify the
calculations, but still computationally expensive. Zero-dimensional modelling
technique provides much higher computational efficiency and a handy engine design
tool that has been extensively developed. However, most conventional zone models
incorporate thermodynamic models and chemical equilibrium combustion models
[9,196]. They are functionally unable to describe the knock phenomenon. Various
combustion chemical kinetic mechanisms, such as Shell autoignition model [197],
reduced chemical kinetic mechanism [198], and semi-detailed chemical kinetics
[199], have been introduced into zero-dimensional thermodynamic engine models to
simulate the knock phenomenon. These zero-dimensional knock models have shown
the potential to model and analyze the engine knock behaviour. However, the
chemical kinetic mechanism employed was generally based on iso-octane, which is
different from the fuel in the real world.
Tanaka mechanism [123,154] uses identical hydrocarbon oxidation schemes for both
iso-octane and n-heptane with 12 reactions in each scheme and includes an
interaction reaction between n-heptane and iso-octane. By introducing further non-
hydrocarbon mechanisms, the Tanaka mechanism consists of 55 reactions with 32
species. It is capable of simulating the combustion and autoignition behaviour of
primary reference fuels. The mechanism has been tested in a wide range of HCCI
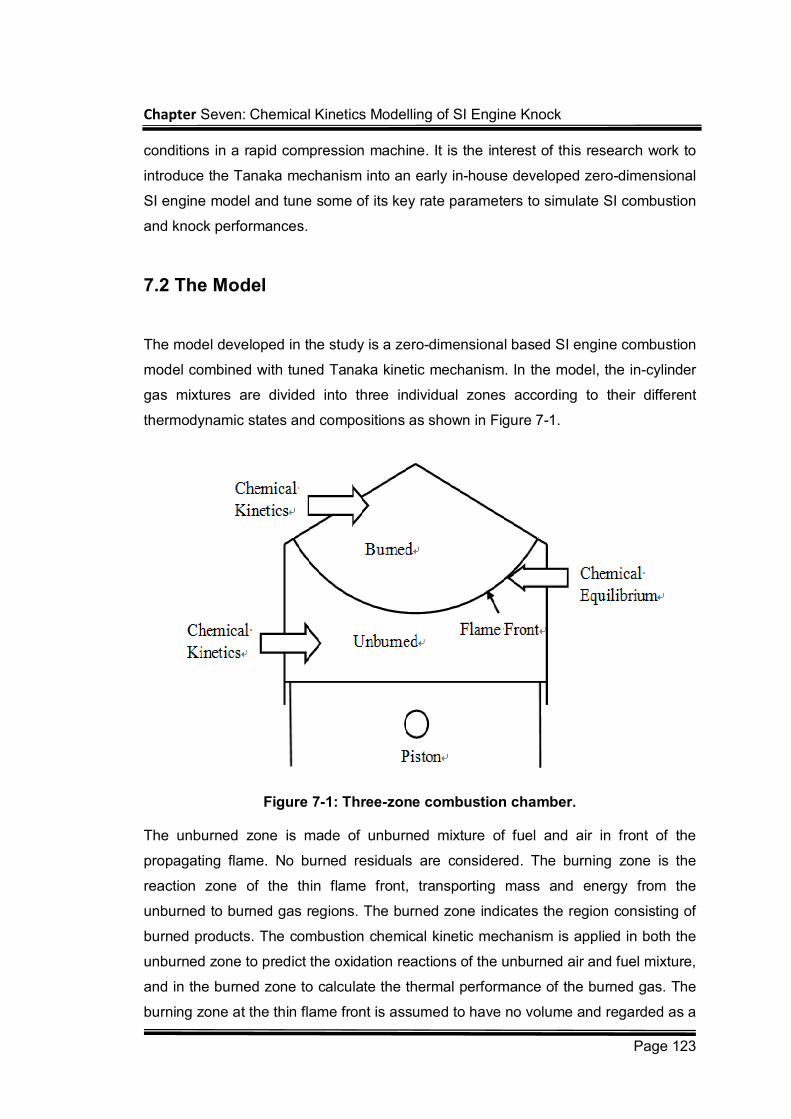
Chapter Seven: Chemical Kinetics Modelling of SI Engine Knock
Page 123
conditions in a rapid compression machine. It is the interest of this research work to
introduce the Tanaka mechanism into an early in-house developed zero-dimensional
SI engine model and tune some of its key rate parameters to simulate SI combustion
and knock performances.
7.2 The Model
The model developed in the study is a zero-dimensional based SI engine combustion
model combined with tuned Tanaka kinetic mechanism. In the model, the in-cylinder
gas mixtures are divided into three individual zones according to their different
thermodynamic states and compositions as shown in Figure 7-1.
Figure 7-1: Three-zone combustion chamber.
The unburned zone is made of unburned mixture of fuel and air in front of the
propagating flame. No burned residuals are considered. The burning zone is the
reaction zone of the thin flame front, transporting mass and energy from the
unburned to burned gas regions. The burned zone indicates the region consisting of
burned products. The combustion chemical kinetic mechanism is applied in both the
unburned zone to predict the oxidation reactions of the unburned air and fuel mixture,
and in the burned zone to calculate the thermal performance of the burned gas. The
burning zone at the thin flame front is assumed to have no volume and regarded as a
Chapter Seven: Chemical Kinetics Modelling of SI Engine Knock
Page 124
transporting process [200,201], which is modelled by chemical equilibrium
calculations [202]
7.2.1 Basic Model
The foundation of the zonal model is based on applying the mass and energy
conservation principles on both unburned and burned zones. The major assumptions
of the basic model are ideal gas engine charge, perfect homogeneous fuel-air
mixture, and uniform in-cylinder pressure.
7.2.1.1 Mass Conservation
In the unburned zone, when pressure and temperature are sufficiently high, the air
and fuel mixture is no longer stable and cool flame reactions starts. The reactions
may further lead to autoignition if the temperature further increases. This is analyzed
in the model by introducing chemical kinetics to the unburned zone. Applying the
mass conservation principle to the unburned zone, the change rate of the mass
fraction of a species i in the unburned zone, uiX , , is then expressed as
u
iiui M
dt
dX
,
7-1
where, iM is the molecular mass, i is the volume specific molar production rate,
and u is the density of the unburned zone. The subscript i denotes a species in the
mixture.
In the burned zone, the mass fraction change of each species is affected by two
factors, the formation by the flame reactions, and the formation and consumption by
the post flame kinetic reactions. The total mass in the burned zone, bm , after taking
the transferred mass from the burning zone m is
mmm bb 7-2
where bm is the burned zone mass before taking the transferred mass.
The mass fraction of a species i after mixing with the mass transferred from the
burning zone is therefore expressed as
Chapter Seven: Chemical Kinetics Modelling of SI Engine Knock
Page 125
b
bibfi
bim
XmXmX
,,
, 7-3
where the fiX , is mass fraction of a species i in the transferred mass from the
burning zone which is equal to that in the flame front, and biX , is the existing fraction
before the transfer, the subscript b indicates unburned and burned zone.
Substituting Equation 7-2 into Equation.7-3 yields the mass fraction change of a
species i due to formation by the flame reactions. Adding the formation and
consumption by the post flame reactions, the mass fraction change of a species i in
the burned zone is then obtained
b
iibifi
b
bi MXX
dt
dm
mdt
dX
,,
, 1 b 7-4
7.2.1.2 Energy Conservation
The energy conservation equation is applied to represent the energy change in the
unburned and burned zone. For the unburned zone, it relates the temperature
change to the heat transfer ulQ , , the work due to the volume change, and the energy
change due to the chemical kinetic reactions
, , ,,1
nu
u p u u u i u i i ul ui
dT dpm c Q V V M h
dt dt
7-5
where h is the specific enthalpy, pc is the specific heat capacity at constant
pressure, V is the zone volume, p is the cylinder pressure, and T is the zone
temperature.
For the burned zone, the effect of the energy transferred from the burning zone,
bfb hhm , on the temperature change needs to be taken into account which gives
sN
ibibibibbfbbbl
bbpb hMVhhm
dt
dpVQ
dt
dTcm
1,,,,, 7-6
7.2.1.3 Heat Transfer
The heat transfer of the unburned zone in the model consists of two parts, the heat
convection between the unburned gas and the cylinder wall wconvQ _ and the heat
Chapter Seven: Chemical Kinetics Modelling of SI Engine Knock
Page 126
convection between the unburned gas and the flame front.
)()( __
__,
fuffconvwuuwconv
fconvwconvul
TTAhTTAh
QQQ
7-7
where uA and fA are the contact area between the end gas and the cylinder wall and
between the end gas and the flame front. the real front surface area The flame front
surface area fA is estimated by
bAf ACA 7-8
Where
Where bA is the area of burned gases in contact with the cylinder wall, which is
calculated by the empirical functions proposed by Fugerson [9],
2
12
)4
2( flameb x
B
VBA
7-9
where flamex is the mass fraction burned by flame propagation and B is the cylinder
bore.
AC in Equation 7.8 is an adjustable constant. As real flame propagates in a turbulent
form, the flame front is wrinkles, which lead to a surface area greater than a simple
spherical ball of flame. Thus, AC usually has a value over one. In the work in this
chapter, the surface area of flame front is assumed to be twice of the area of burned
gases to obtain the best fit to the experimental results.
The heat transfer coefficients wconvh _ and fconvh _ have been simulated using the
Woschni correlation 53.08.08.02.0 TwpBCh h
, where hC is the heat transfer rate
constant and w is a characteristic speed [129]. Woschni’s correlation was originally
determined for a four-stroke, water-cooled, four-valve direct-injection CI without swirl.
However, the subsequent upgrade of the formula (Equitation 5.40) for calculation of
the characteristic speed with inclusion of swirl effect provided the correlation the
ability in predicting the heat transfer at normal and knocking combustion in SI
engines at an acceptable accuracy level. This has been proved by the test results by
Woschni, et al [222] and recommended by Heywood [1]. Though this correlation has
Chapter Seven: Chemical Kinetics Modelling of SI Engine Knock
Page 127
been widely applied to simulate the heat transfer in SI engines, it was only validated
against a certain range of conditions in the test engine. Therefore, when evaluation of
heat transfer in any other engine with different specification under various operation
conditions, parameters in the correlation need to be adjusted or a more advanced
model can be applied. However, the latter is limited by its availability by the current
research on heat transfer in SI engines.
The thermal radiation from the burned zone to the cylinder wall is modelled by the
Stefan-Boltzmann law4
rad wQ A T , where is the Stefan-Boltzmann constant
4281067.5 KW/m [1].
7.2.1.4 Mass Fraction Burned
The burned mass in the cylinder consists of two parts, the mass transported from the
burning zone due to the flame propagation, and the mass burned in the unburned
zone due to the chemical kinetic reactions of the unburned gas autoignition. Thus,
the Mass Fraction Burned (MFB), bx , is expressed as:
b flame auto ignitionx x x 7-10
The mass burned by flame propagation in the model is calculated by the Weibe
function [1]. The burned mass in the unburned zone is due to autoignition only, and is
therefore equal to the mass that have been consumed by the chemical kinetic
reactions. Note that the mass burned due to chemical kinetic reactions will only play
a significant part when autoignition starts. This is expressed as
3
1 1,,
i
n
jjuiuignitionauto tXmx 7-11
where t is the calculation time step, subscript j is the step number, i is species
number where 1 denotes fuel, 2 denotes O2 and 3 denotes N2.
7.2.2 Kinetic Mechanism
Tanaka combustion chemical kinetic mechanism, as listed in Appendix B, has been
employed in this study to model the oxidation of primary reference fuels. It needs to
note that the autoignition of the unburned mixture in the SI combustion is different
from that of the HCCI combustion. In the HCCI case, the compression, the main
driving force of the autoignition, is from the piston only. However, in the SI
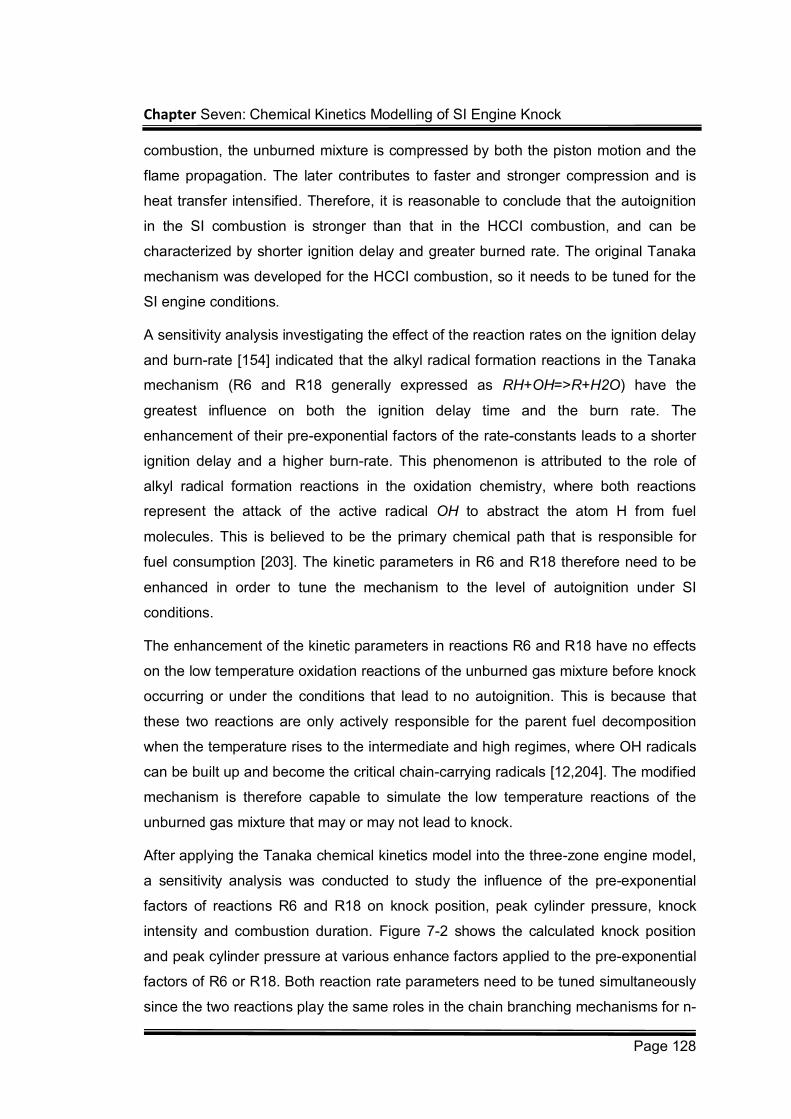
Chapter Seven: Chemical Kinetics Modelling of SI Engine Knock
Page 128
combustion, the unburned mixture is compressed by both the piston motion and the
flame propagation. The later contributes to faster and stronger compression and is
heat transfer intensified. Therefore, it is reasonable to conclude that the autoignition
in the SI combustion is stronger than that in the HCCI combustion, and can be
characterized by shorter ignition delay and greater burned rate. The original Tanaka
mechanism was developed for the HCCI combustion, so it needs to be tuned for the
SI engine conditions.
A sensitivity analysis investigating the effect of the reaction rates on the ignition delay
and burn-rate [154] indicated that the alkyl radical formation reactions in the Tanaka
mechanism (R6 and R18 generally expressed as RH+OH=>R+H2O) have the
greatest influence on both the ignition delay time and the burn rate. The
enhancement of their pre-exponential factors of the rate-constants leads to a shorter
ignition delay and a higher burn-rate. This phenomenon is attributed to the role of
alkyl radical formation reactions in the oxidation chemistry, where both reactions
represent the attack of the active radical OH to abstract the atom H from fuel
molecules. This is believed to be the primary chemical path that is responsible for
fuel consumption [203]. The kinetic parameters in R6 and R18 therefore need to be
enhanced in order to tune the mechanism to the level of autoignition under SI
conditions.
The enhancement of the kinetic parameters in reactions R6 and R18 have no effects
on the low temperature oxidation reactions of the unburned gas mixture before knock
occurring or under the conditions that lead to no autoignition. This is because that
these two reactions are only actively responsible for the parent fuel decomposition
when the temperature rises to the intermediate and high regimes, where OH radicals
can be built up and become the critical chain-carrying radicals [12,204]. The modified
mechanism is therefore capable to simulate the low temperature reactions of the
unburned gas mixture that may or may not lead to knock.
After applying the Tanaka chemical kinetics model into the three-zone engine model,
a sensitivity analysis was conducted to study the influence of the pre-exponential
factors of reactions R6 and R18 on knock position, peak cylinder pressure, knock
intensity and combustion duration. Figure 7-2 shows the calculated knock position
and peak cylinder pressure at various enhance factors applied to the pre-exponential
factors of R6 or R18. Both reaction rate parameters need to be tuned simultaneously
since the two reactions play the same roles in the chain branching mechanisms for n-
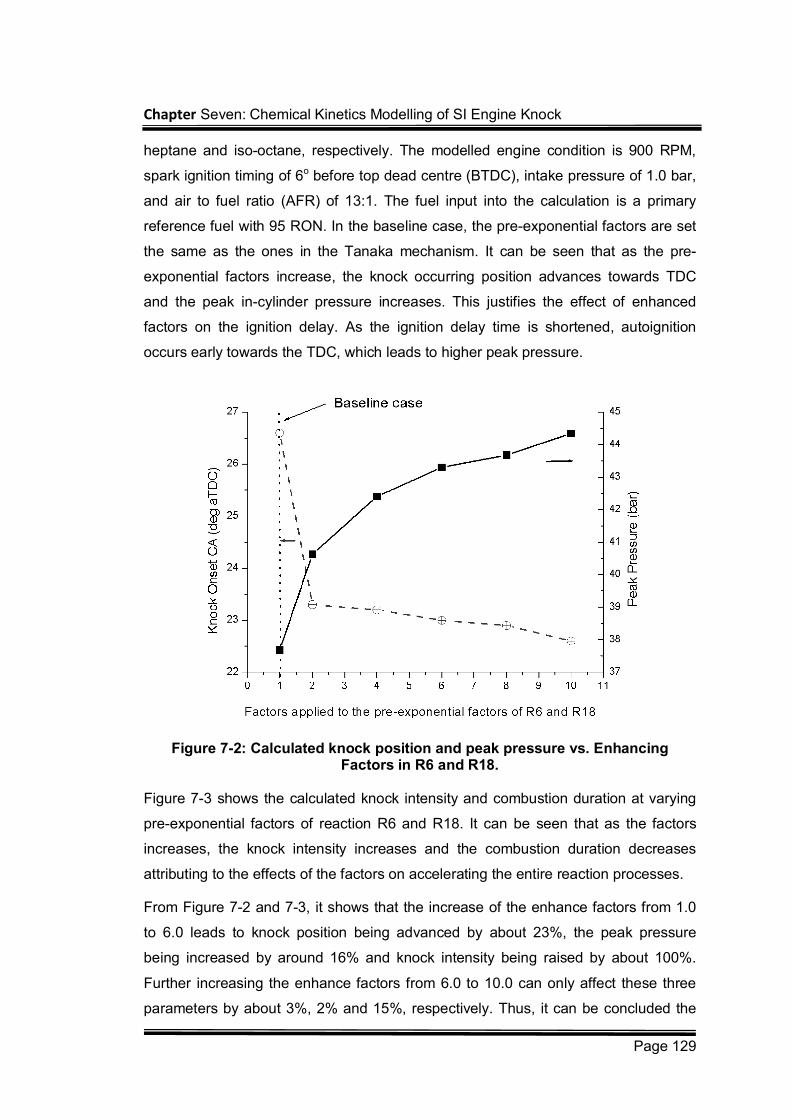
Chapter Seven: Chemical Kinetics Modelling of SI Engine Knock
Page 129
heptane and iso-octane, respectively. The modelled engine condition is 900 RPM,
spark ignition timing of 6o before top dead centre (BTDC), intake pressure of 1.0 bar,
and air to fuel ratio (AFR) of 13:1. The fuel input into the calculation is a primary
reference fuel with 95 RON. In the baseline case, the pre-exponential factors are set
the same as the ones in the Tanaka mechanism. It can be seen that as the pre-
exponential factors increase, the knock occurring position advances towards TDC
and the peak in-cylinder pressure increases. This justifies the effect of enhanced
factors on the ignition delay. As the ignition delay time is shortened, autoignition
occurs early towards the TDC, which leads to higher peak pressure.
Figure 7-2: Calculated knock position and peak pressure vs. Enhancing Factors in R6 and R18.
Figure 7-3 shows the calculated knock intensity and combustion duration at varying
pre-exponential factors of reaction R6 and R18. It can be seen that as the factors
increases, the knock intensity increases and the combustion duration decreases
attributing to the effects of the factors on accelerating the entire reaction processes.
From Figure 7-2 and 7-3, it shows that the increase of the enhance factors from 1.0
to 6.0 leads to knock position being advanced by about 23%, the peak pressure
being increased by around 16% and knock intensity being raised by about 100%.
Further increasing the enhance factors from 6.0 to 10.0 can only affect these three
parameters by about 3%, 2% and 15%, respectively. Thus, it can be concluded the
Chapter Seven: Chemical Kinetics Modelling of SI Engine Knock
Page 130
enhance factor of the value of 6.0 is the turning point and has been employed in this
work.
Figure 7-3: Calculated knock intensity and combustion duration vs. Enhancing Factors in R6 and R18.
7.2.3 Equilibrium Burning Zone
The burning zone is the flamelet reaction zone transporting mass and energy from
unburned to burned gas regions. In this study, the burning zone is assumed as an
adiabatic region at chemical equilibrium. During each calculation step, the mass
entrained into the flame front is assumed to be burned and transferred into the
burned gases instantaneously.
The same thermodynamic data and chemical species in Tanaka mechanism are
selected to be included in the equilibrium chemistry. The equilibrium state of the gas
mixture in the burning zone is determined by minimizing the Gibbs free energy
0G , which serves as a criterion of chemical equilibrium. The thermal properties
and the equilibrium chemical composition of the burning zone are calculated using
the STANJAN equilibrium program [205].
7.2.4 Numerical Solver
The combination of the basic engine model, the mass fraction burned model and the
Chapter Seven: Chemical Kinetics Modelling of SI Engine Knock
Page 131
kinetic combustion model forms a set of coupled Ordinary Differential Equations
(ODEs). This includes 66 simultaneous variables for temperatures and species mass
fractions as a function of crank angle. Due to the incorporation of chemical kinetics
into the combustion system, the set of equations involves enormous disparities in the
characteristic time scales for the response of different species during the occurrence
of autoignition. These kinetics equations were solved in the model using a Double-
precision Variable-coefficient Ordinary Differential Equation (DVODE) solver
developed for the solution of both stiff and non-stiff systems.
The previously described in-house FORTRAN code, LUCKS_SI in the LUCKS
package integrating the DVODE solver for the ODEs, has been developed to
simulate combustion systems with chemical kinetics. Figure 7-4 shows the model
flowchart. The simulation is executed from Intake Valve Closing (IVC). A link file with
the information of the kinetic mechanism, the thermal data, and an input data file
consisting of the initial operating conditions and the engine specifications are input to
the function block to calculated the parameters used in the governing equations. The
function block includes the subroutines for the calculation of cylinder volume, mass
fraction burned, and the zone mixture properties. The governing equations are solved
by the DVODE solver and the outputs (zone temperatures and zone species mass
fractions) are used to update the in-cylinder pressure and routed back to the function
block for the next calculation step. Next, the calculated pressure is also routed back
to the function block for the next calculation step. The calculation stops at the timing
of Exhaust Valve Opening (EVO). The governing equations are integrated
simultaneously at a calculation time step of 0.1 crank angle degrees in the model.
7.3 Model Validation
7.3.1 Tests and Knock Identification
The engine used for the model validation in this work is a single cylinder, 4-stroke
Ricardo E6 research SI engine. The engine specifications are detailed in Table 7-1.
The engine was equipped with a pressure transducer and the data was recorded at
an interval of one-tenth crank angle degree. A LabVIEW based engine data
acquisition system was used to record 50 consecutive engine cycles data at each
test condition.
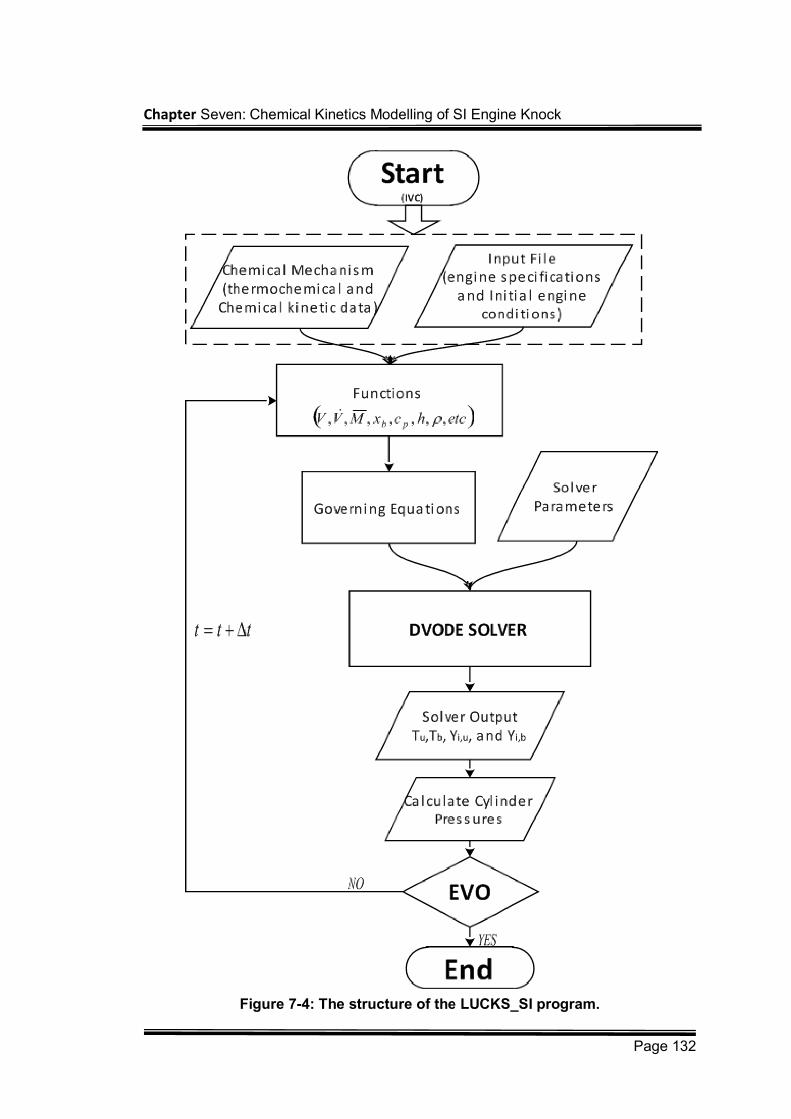
Chapter Seven: Chemical Kinetics Modelling of SI Engine Knock
Page 132
Figure 7-4: The structure of the LUCKS_SI program.
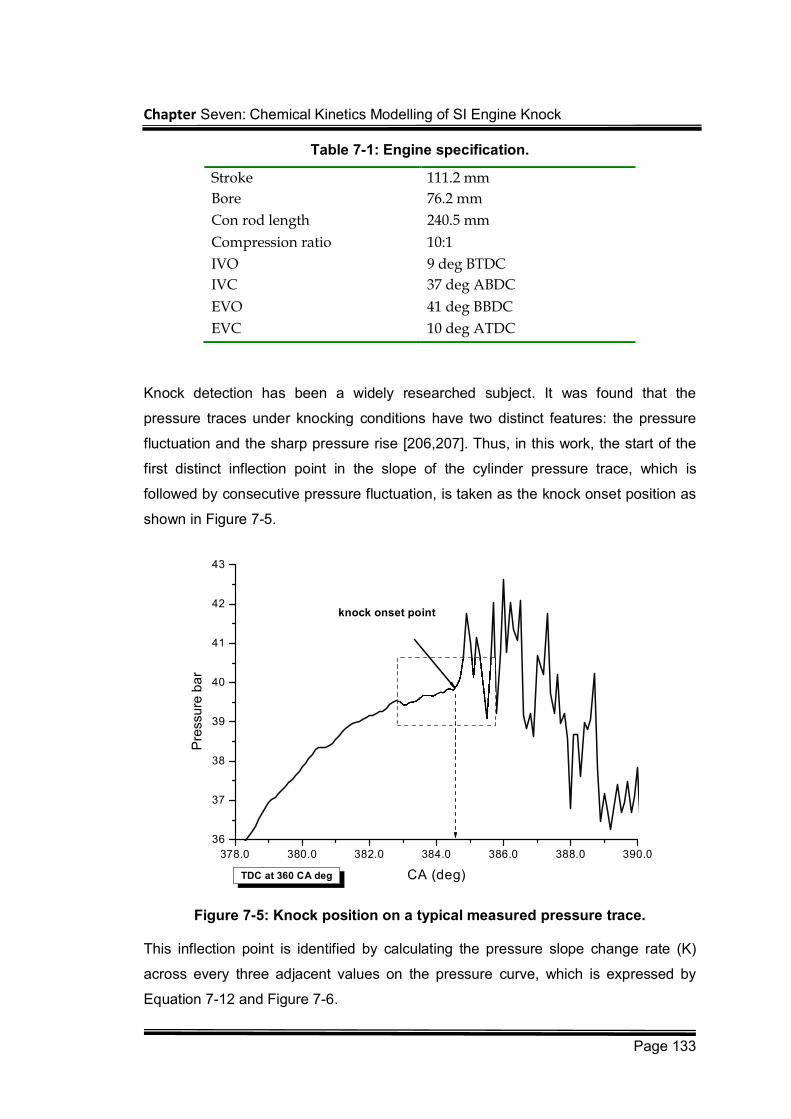
Chapter Seven: Chemical Kinetics Modelling of SI Engine Knock
Page 133
Table 7-1: Engine specification.
Stroke 111.2 mm
Bore 76.2 mm
Con rod length 240.5 mm
Compression ratio 10:1
IVO 9 deg BTDC
IVC 37 deg ABDC
EVO 41 deg BBDC
EVC 10 deg ATDC
Knock detection has been a widely researched subject. It was found that the
pressure traces under knocking conditions have two distinct features: the pressure
fluctuation and the sharp pressure rise [206,207]. Thus, in this work, the start of the
first distinct inflection point in the slope of the cylinder pressure trace, which is
followed by consecutive pressure fluctuation, is taken as the knock onset position as
shown in Figure 7-5.
378.0 380.0 382.0 384.0 386.0 388.0 390.0
36
37
38
39
40
41
42
43
TDC at 360 CA deg
knock onset point
Pre
ssure
ba
r
CA (deg)
Figure 7-5: Knock position on a typical measured pressure trace.
This inflection point is identified by calculating the pressure slope change rate (K)
across every three adjacent values on the pressure curve, which is expressed by
Equation 7-12 and Figure 7-6.
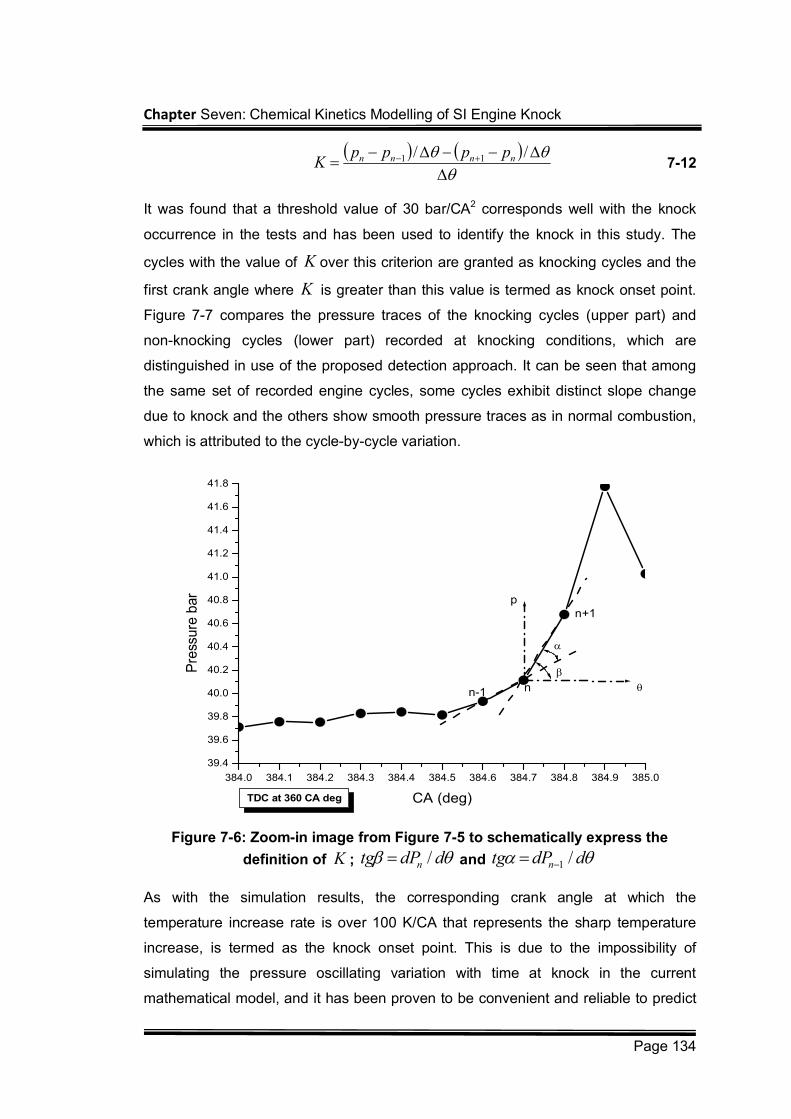
Chapter Seven: Chemical Kinetics Modelling of SI Engine Knock
Page 134
// 11 nnnn pppp
K 7-12
It was found that a threshold value of 30 bar/CA2 corresponds well with the knock
occurrence in the tests and has been used to identify the knock in this study. The
cycles with the value of K over this criterion are granted as knocking cycles and the
first crank angle where K is greater than this value is termed as knock onset point.
Figure 7-7 compares the pressure traces of the knocking cycles (upper part) and
non-knocking cycles (lower part) recorded at knocking conditions, which are
distinguished in use of the proposed detection approach. It can be seen that among
the same set of recorded engine cycles, some cycles exhibit distinct slope change
due to knock and the others show smooth pressure traces as in normal combustion,
which is attributed to the cycle-by-cycle variation.
Figure 7-6: Zoom-in image from Figure 7-5 to schematically express the
definition of K ; ddPtg n / and ddPtg n /1
As with the simulation results, the corresponding crank angle at which the
temperature increase rate is over 100 K/CA that represents the sharp temperature
increase, is termed as the knock onset point. This is due to the impossibility of
simulating the pressure oscillating variation with time at knock in the current
mathematical model, and it has been proven to be convenient and reliable to predict
384.0 384.1 384.2 384.3 384.4 384.5 384.6 384.7 384.8 384.9 385.0
39.4
39.6
39.8
40.0
40.2
40.4
40.6
40.8
41.0
41.2
41.4
41.6
41.8
n+1
n-1 n
p
TDC at 360 CA deg
Pre
ssure
bar
CA (deg)
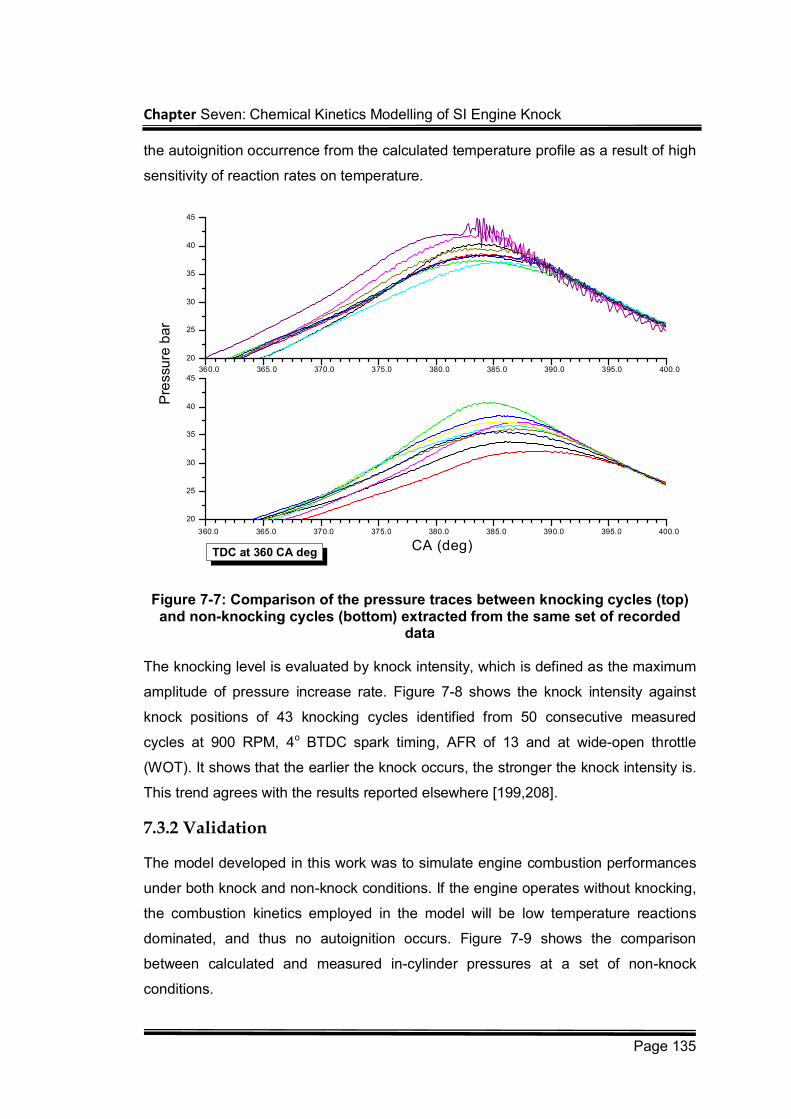
Chapter Seven: Chemical Kinetics Modelling of SI Engine Knock
Page 135
the autoignition occurrence from the calculated temperature profile as a result of high
sensitivity of reaction rates on temperature.
Figure 7-7: Comparison of the pressure traces between knocking cycles (top) and non-knocking cycles (bottom) extracted from the same set of recorded
data
The knocking level is evaluated by knock intensity, which is defined as the maximum
amplitude of pressure increase rate. Figure 7-8 shows the knock intensity against
knock positions of 43 knocking cycles identified from 50 consecutive measured
cycles at 900 RPM, 4o BTDC spark timing, AFR of 13 and at wide-open throttle
(WOT). It shows that the earlier the knock occurs, the stronger the knock intensity is.
This trend agrees with the results reported elsewhere [199,208].
7.3.2 Validation
The model developed in this work was to simulate engine combustion performances
under both knock and non-knock conditions. If the engine operates without knocking,
the combustion kinetics employed in the model will be low temperature reactions
dominated, and thus no autoignition occurs. Figure 7-9 shows the comparison
between calculated and measured in-cylinder pressures at a set of non-knock
conditions.
360.0 365.0 370.0 375.0 380.0 385.0 390.0 395.0 400.0
20
25
30
35
40
45360.0 365.0 370.0 375.0 380.0 385.0 390.0 395.0 400.0
20
25
30
35
40
45
TDC at 360 CA deg
Pre
ssu
re b
ar
CA (deg)
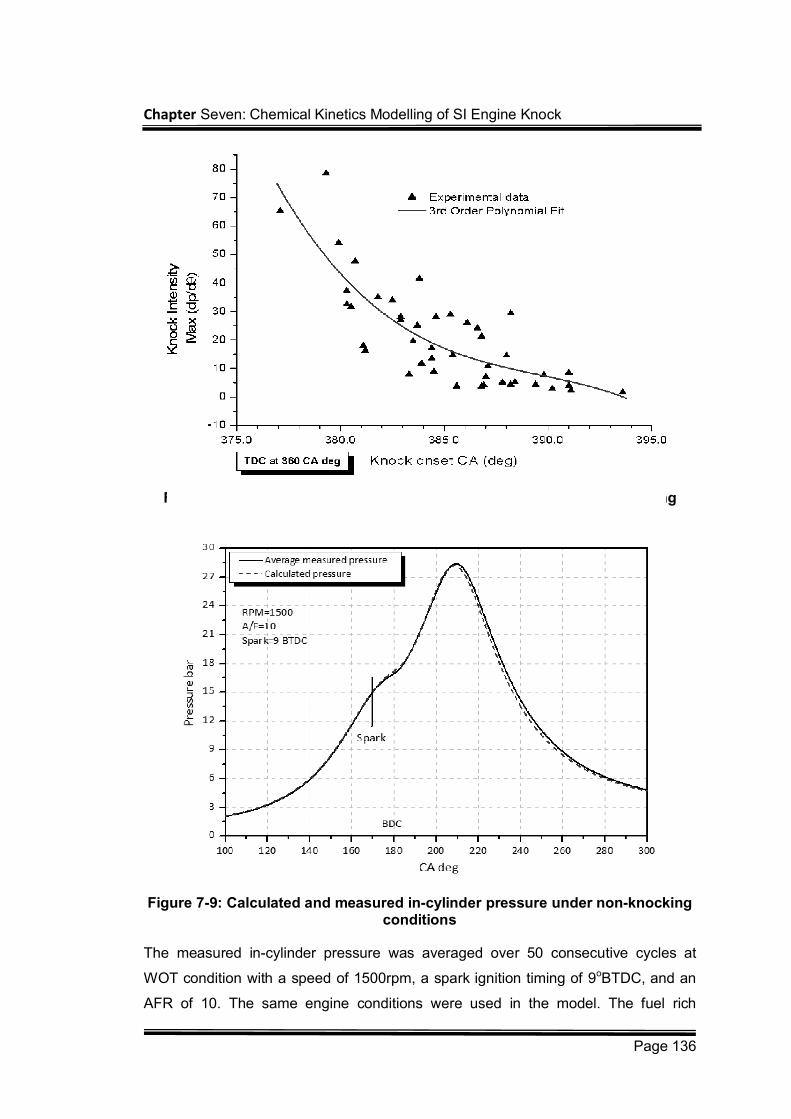
Chapter Seven: Chemical Kinetics Modelling of SI Engine Knock
Page 136
Figure 7-8: Knock intensity .vs. knock positions of the identified knocking cycles the fitted 3rd order polynomial function curve
Figure 7-9: Calculated and measured in-cylinder pressure under non-knocking conditions
The measured in-cylinder pressure was averaged over 50 consecutive cycles at
WOT condition with a speed of 1500rpm, a spark ignition timing of 9oBTDC, and an
AFR of 10. The same engine conditions were used in the model. The fuel rich
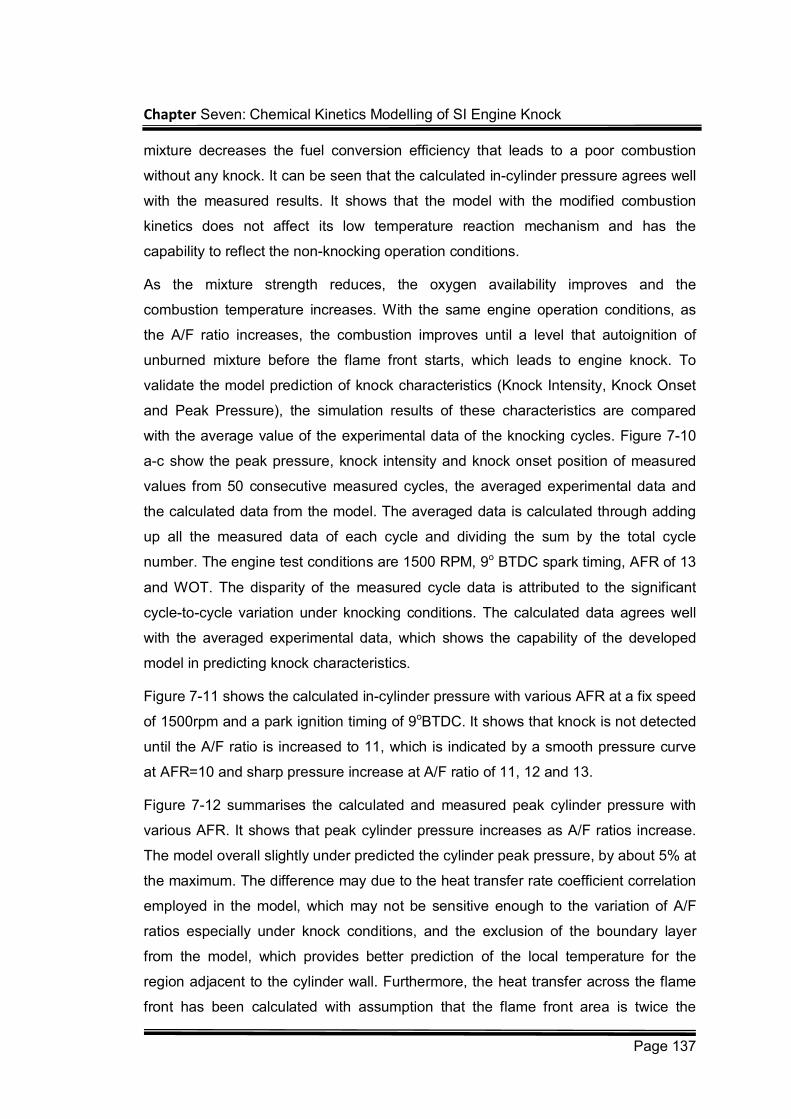
Chapter Seven: Chemical Kinetics Modelling of SI Engine Knock
Page 137
mixture decreases the fuel conversion efficiency that leads to a poor combustion
without any knock. It can be seen that the calculated in-cylinder pressure agrees well
with the measured results. It shows that the model with the modified combustion
kinetics does not affect its low temperature reaction mechanism and has the
capability to reflect the non-knocking operation conditions.
As the mixture strength reduces, the oxygen availability improves and the
combustion temperature increases. With the same engine operation conditions, as
the A/F ratio increases, the combustion improves until a level that autoignition of
unburned mixture before the flame front starts, which leads to engine knock. To
validate the model prediction of knock characteristics (Knock Intensity, Knock Onset
and Peak Pressure), the simulation results of these characteristics are compared
with the average value of the experimental data of the knocking cycles. Figure 7-10
a-c show the peak pressure, knock intensity and knock onset position of measured
values from 50 consecutive measured cycles, the averaged experimental data and
the calculated data from the model. The averaged data is calculated through adding
up all the measured data of each cycle and dividing the sum by the total cycle
number. The engine test conditions are 1500 RPM, 9o BTDC spark timing, AFR of 13
and WOT. The disparity of the measured cycle data is attributed to the significant
cycle-to-cycle variation under knocking conditions. The calculated data agrees well
with the averaged experimental data, which shows the capability of the developed
model in predicting knock characteristics.
Figure 7-11 shows the calculated in-cylinder pressure with various AFR at a fix speed
of 1500rpm and a park ignition timing of 9oBTDC. It shows that knock is not detected
until the A/F ratio is increased to 11, which is indicated by a smooth pressure curve
at AFR=10 and sharp pressure increase at A/F ratio of 11, 12 and 13.
Figure 7-12 summarises the calculated and measured peak cylinder pressure with
various AFR. It shows that peak cylinder pressure increases as A/F ratios increase.
The model overall slightly under predicted the cylinder peak pressure, by about 5% at
the maximum. The difference may due to the heat transfer rate coefficient correlation
employed in the model, which may not be sensitive enough to the variation of A/F
ratios especially under knock conditions, and the exclusion of the boundary layer
from the model, which provides better prediction of the local temperature for the
region adjacent to the cylinder wall. Furthermore, the heat transfer across the flame
front has been calculated with assumption that the flame front area is twice the
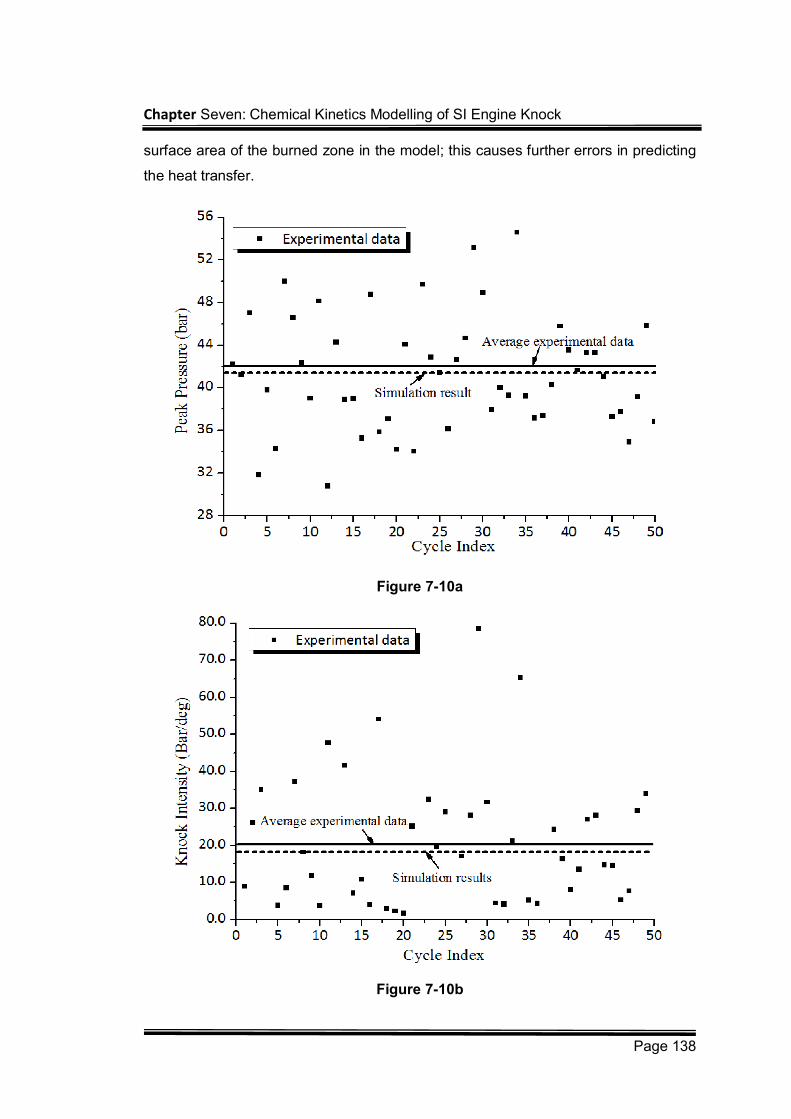
Chapter Seven: Chemical Kinetics Modelling of SI Engine Knock
Page 138
surface area of the burned zone in the model; this causes further errors in predicting
the heat transfer.
Figure 7-10a
Figure 7-10b
Chapter Seven: Chemical Kinetics Modelling of SI Engine Knock
Page 139
Figure 7-10c
Figure 7-10: Comparison of knock characteristics between calculated and measured data. (a): peak pressure (b): knock intensity (c): knock onset.
Figure 7-11: Calculated in-cylinder pressure at various AFR.
Engine speed determines the time availability of the combustion cycle. Knock is an
autoignition related phenomenon that is dominated by the time dependent chemical
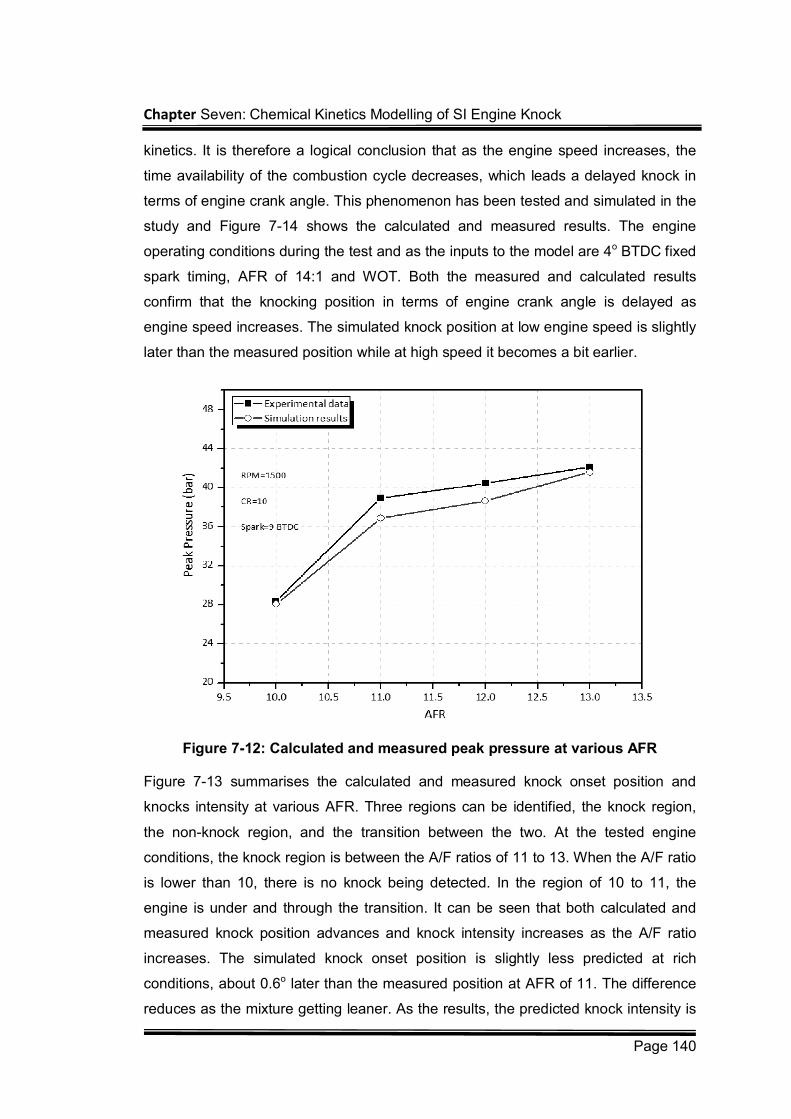
Chapter Seven: Chemical Kinetics Modelling of SI Engine Knock
Page 140
kinetics. It is therefore a logical conclusion that as the engine speed increases, the
time availability of the combustion cycle decreases, which leads a delayed knock in
terms of engine crank angle. This phenomenon has been tested and simulated in the
study and Figure 7-14 shows the calculated and measured results. The engine
operating conditions during the test and as the inputs to the model are 4o BTDC fixed
spark timing, AFR of 14:1 and WOT. Both the measured and calculated results
confirm that the knocking position in terms of engine crank angle is delayed as
engine speed increases. The simulated knock position at low engine speed is slightly
later than the measured position while at high speed it becomes a bit earlier.
Figure 7-12: Calculated and measured peak pressure at various AFR
Figure 7-13 summarises the calculated and measured knock onset position and
knocks intensity at various AFR. Three regions can be identified, the knock region,
the non-knock region, and the transition between the two. At the tested engine
conditions, the knock region is between the A/F ratios of 11 to 13. When the A/F ratio
is lower than 10, there is no knock being detected. In the region of 10 to 11, the
engine is under and through the transition. It can be seen that both calculated and
measured knock position advances and knock intensity increases as the A/F ratio
increases. The simulated knock onset position is slightly less predicted at rich
conditions, about 0.6o later than the measured position at AFR of 11. The difference
reduces as the mixture getting leaner. As the results, the predicted knock intensity is
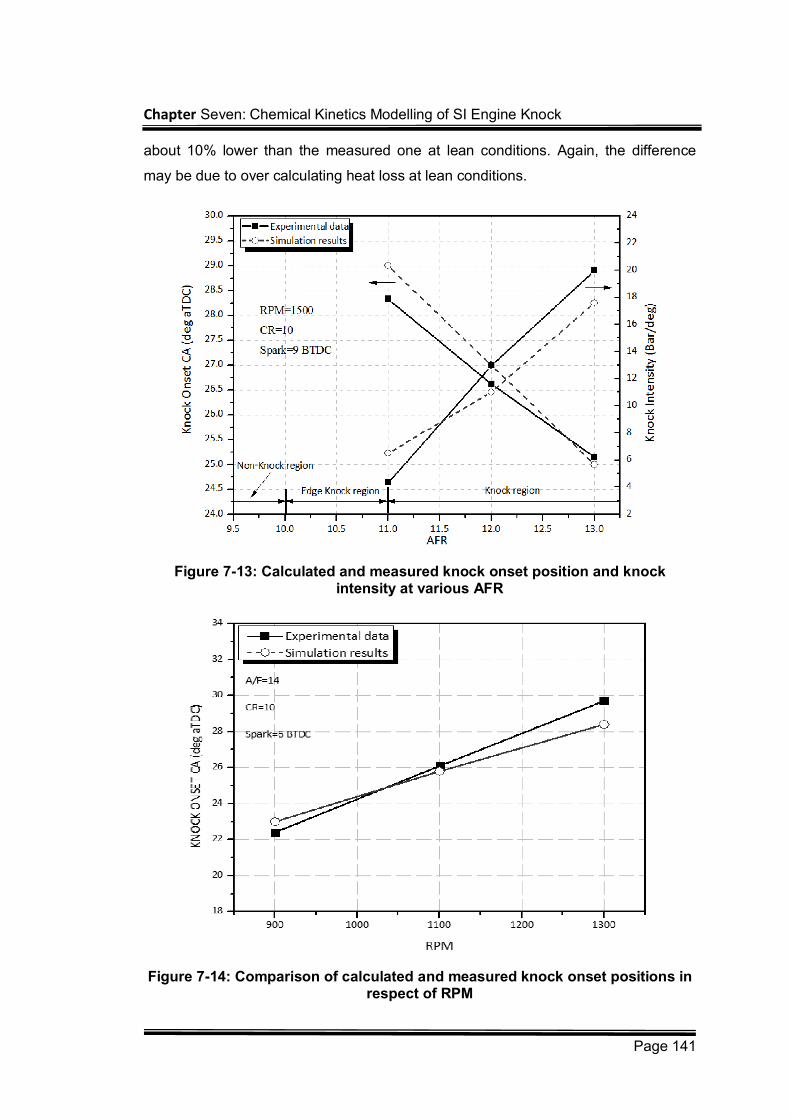
Chapter Seven: Chemical Kinetics Modelling of SI Engine Knock
Page 141
about 10% lower than the measured one at lean conditions. Again, the difference
may be due to over calculating heat loss at lean conditions.
Figure 7-13: Calculated and measured knock onset position and knock intensity at various AFR
Figure 7-14: Comparison of calculated and measured knock onset positions in respect of RPM
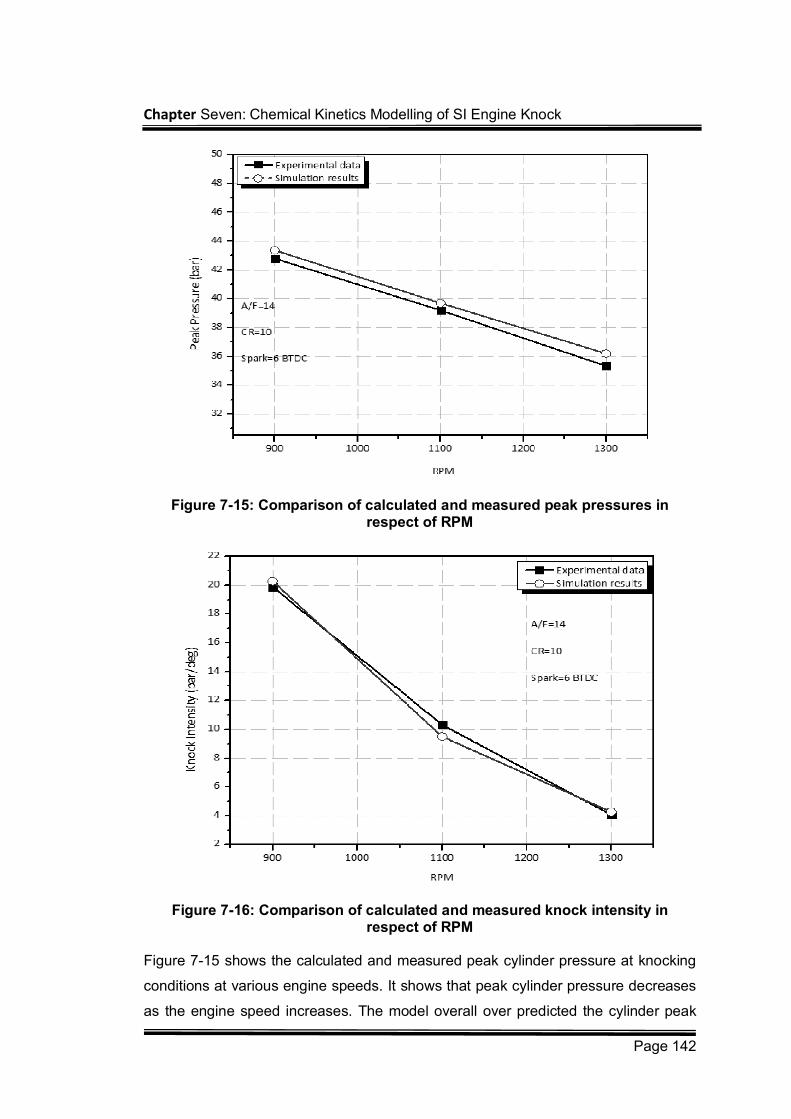
Chapter Seven: Chemical Kinetics Modelling of SI Engine Knock
Page 142
Figure 7-15: Comparison of calculated and measured peak pressures in respect of RPM
Figure 7-16: Comparison of calculated and measured knock intensity in respect of RPM
Figure 7-15 shows the calculated and measured peak cylinder pressure at knocking
conditions at various engine speeds. It shows that peak cylinder pressure decreases
as the engine speed increases. The model overall over predicted the cylinder peak
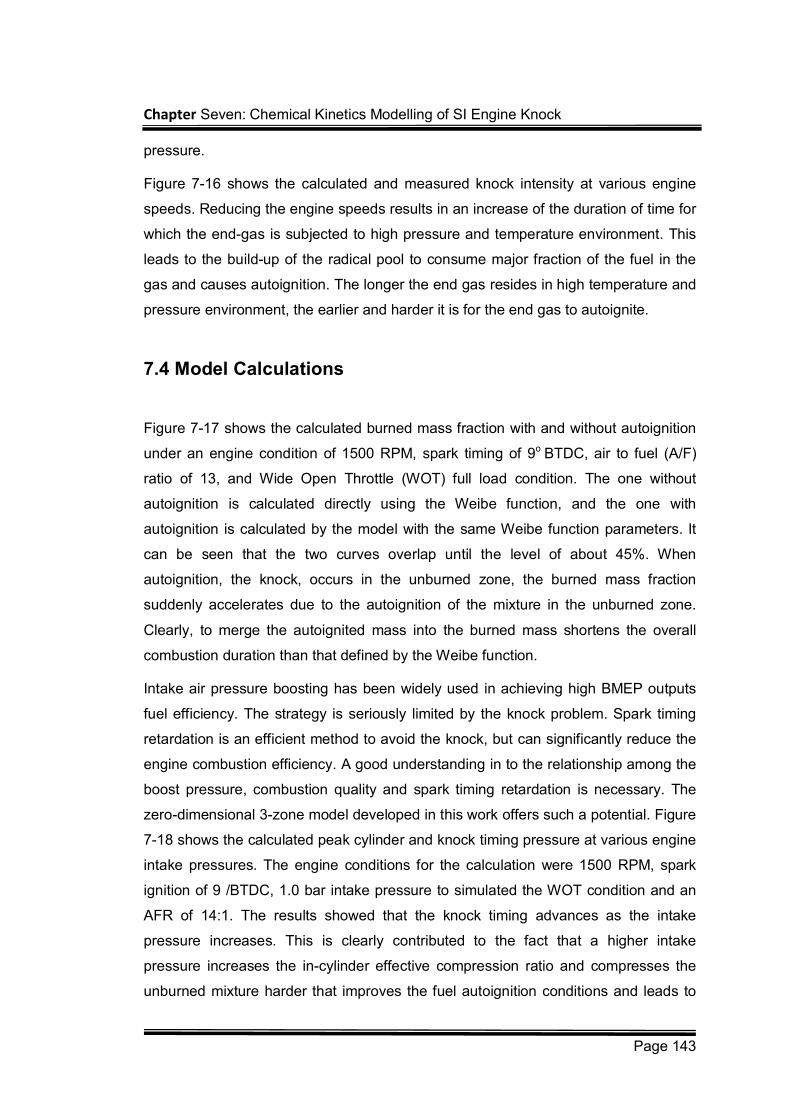
Chapter Seven: Chemical Kinetics Modelling of SI Engine Knock
Page 143
pressure.
Figure 7-16 shows the calculated and measured knock intensity at various engine
speeds. Reducing the engine speeds results in an increase of the duration of time for
which the end-gas is subjected to high pressure and temperature environment. This
leads to the build-up of the radical pool to consume major fraction of the fuel in the
gas and causes autoignition. The longer the end gas resides in high temperature and
pressure environment, the earlier and harder it is for the end gas to autoignite.
7.4 Model Calculations
Figure 7-17 shows the calculated burned mass fraction with and without autoignition
under an engine condition of 1500 RPM, spark timing of 9o BTDC, air to fuel (A/F)
ratio of 13, and Wide Open Throttle (WOT) full load condition. The one without
autoignition is calculated directly using the Weibe function, and the one with
autoignition is calculated by the model with the same Weibe function parameters. It
can be seen that the two curves overlap until the level of about 45%. When
autoignition, the knock, occurs in the unburned zone, the burned mass fraction
suddenly accelerates due to the autoignition of the mixture in the unburned zone.
Clearly, to merge the autoignited mass into the burned mass shortens the overall
combustion duration than that defined by the Weibe function.
Intake air pressure boosting has been widely used in achieving high BMEP outputs
fuel efficiency. The strategy is seriously limited by the knock problem. Spark timing
retardation is an efficient method to avoid the knock, but can significantly reduce the
engine combustion efficiency. A good understanding in to the relationship among the
boost pressure, combustion quality and spark timing retardation is necessary. The
zero-dimensional 3-zone model developed in this work offers such a potential. Figure
7-18 shows the calculated peak cylinder and knock timing pressure at various engine
intake pressures. The engine conditions for the calculation were 1500 RPM, spark
ignition of 9 /BTDC, 1.0 bar intake pressure to simulated the WOT condition and an
AFR of 14:1. The results showed that the knock timing advances as the intake
pressure increases. This is clearly contributed to the fact that a higher intake
pressure increases the in-cylinder effective compression ratio and compresses the
unburned mixture harder that improves the fuel autoignition conditions and leads to
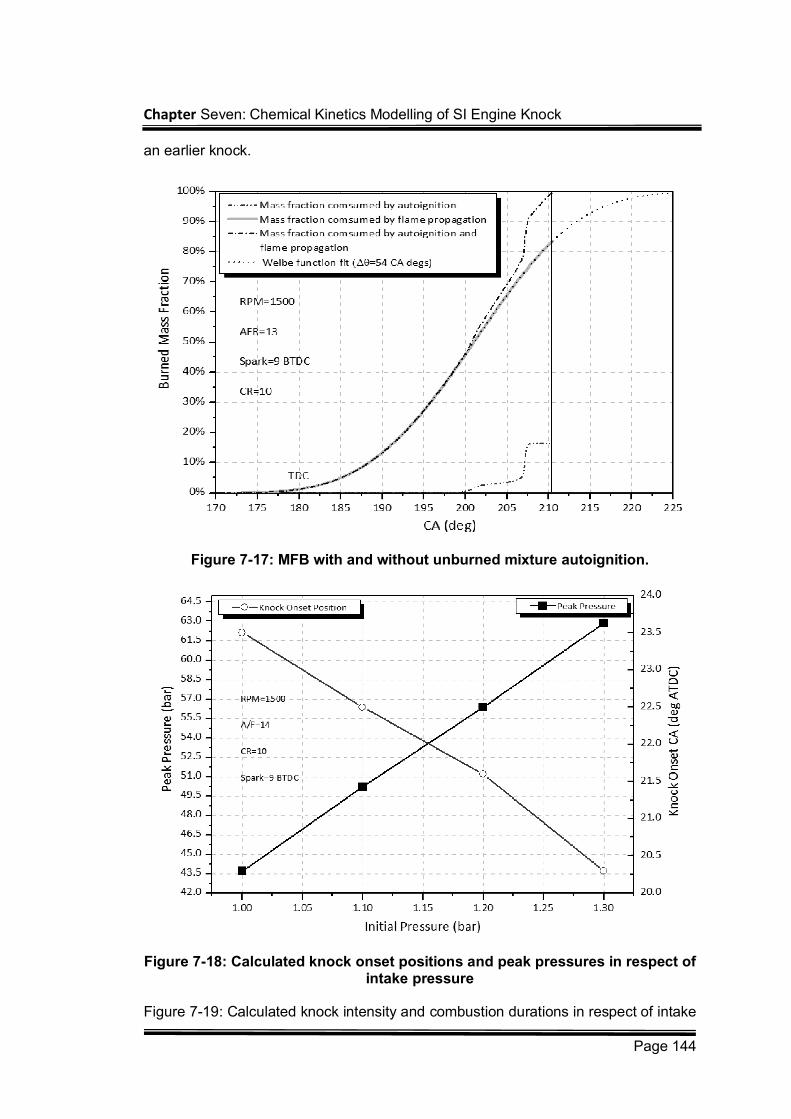
Chapter Seven: Chemical Kinetics Modelling of SI Engine Knock
Page 144
an earlier knock.
Figure 7-17: MFB with and without unburned mixture autoignition.
Figure 7-18: Calculated knock onset positions and peak pressures in respect of intake pressure
Figure 7-19: Calculated knock intensity and combustion durations in respect of intake
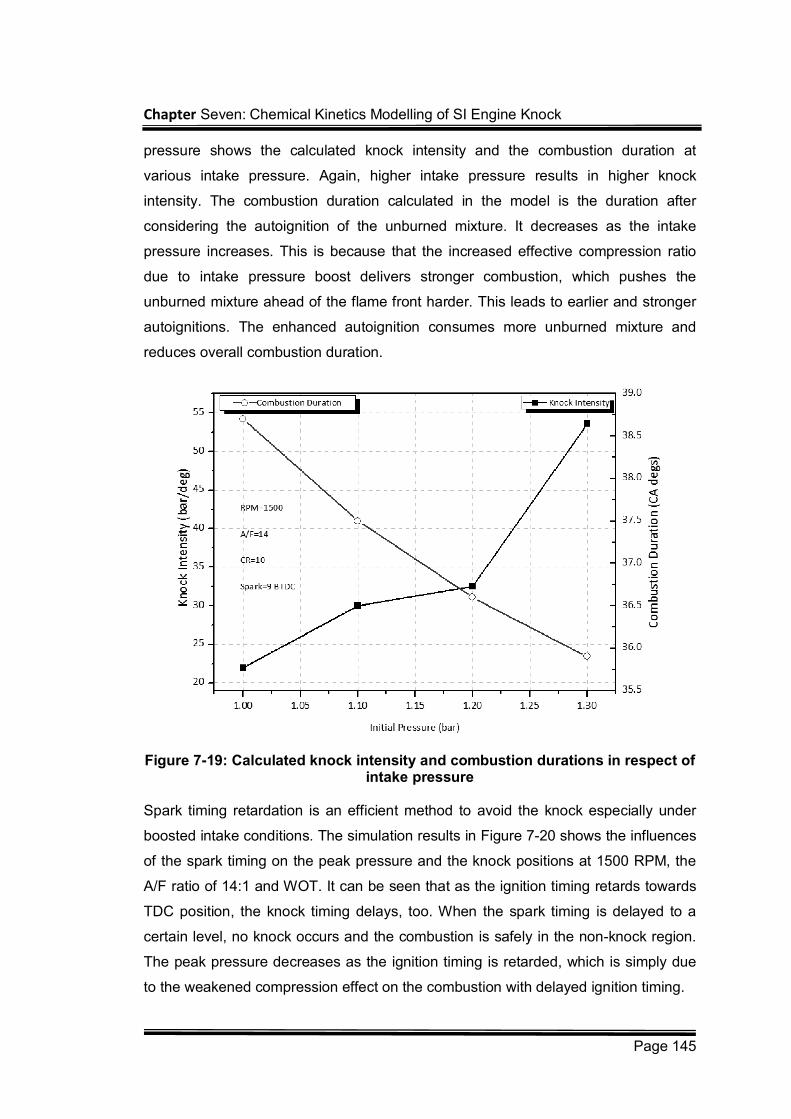
Chapter Seven: Chemical Kinetics Modelling of SI Engine Knock
Page 145
pressure shows the calculated knock intensity and the combustion duration at
various intake pressure. Again, higher intake pressure results in higher knock
intensity. The combustion duration calculated in the model is the duration after
considering the autoignition of the unburned mixture. It decreases as the intake
pressure increases. This is because that the increased effective compression ratio
due to intake pressure boost delivers stronger combustion, which pushes the
unburned mixture ahead of the flame front harder. This leads to earlier and stronger
autoignitions. The enhanced autoignition consumes more unburned mixture and
reduces overall combustion duration.
Figure 7-19: Calculated knock intensity and combustion durations in respect of intake pressure
Spark timing retardation is an efficient method to avoid the knock especially under
boosted intake conditions. The simulation results in Figure 7-20 shows the influences
of the spark timing on the peak pressure and the knock positions at 1500 RPM, the
A/F ratio of 14:1 and WOT. It can be seen that as the ignition timing retards towards
TDC position, the knock timing delays, too. When the spark timing is delayed to a
certain level, no knock occurs and the combustion is safely in the non-knock region.
The peak pressure decreases as the ignition timing is retarded, which is simply due
to the weakened compression effect on the combustion with delayed ignition timing.
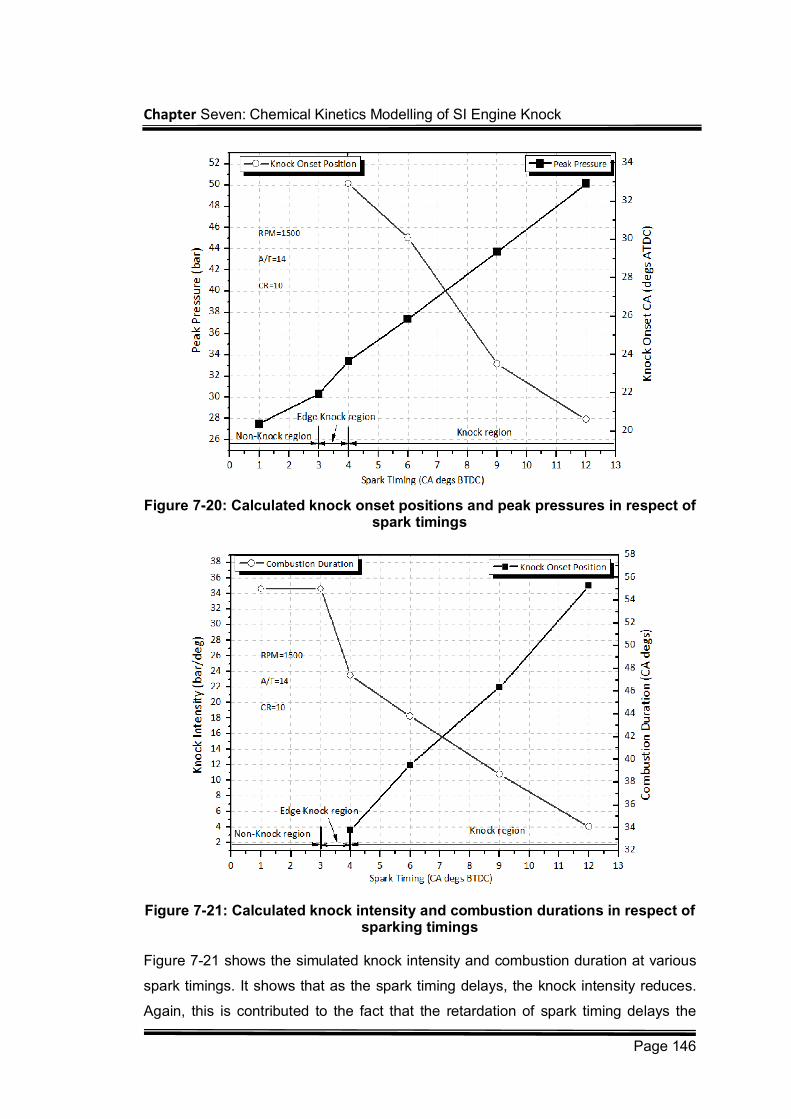
Chapter Seven: Chemical Kinetics Modelling of SI Engine Knock
Page 146
Figure 7-20: Calculated knock onset positions and peak pressures in respect of spark timings
Figure 7-21: Calculated knock intensity and combustion durations in respect of sparking timings
Figure 7-21 shows the simulated knock intensity and combustion duration at various
spark timings. It shows that as the spark timing delays, the knock intensity reduces.
Again, this is contributed to the fact that the retardation of spark timing delays the
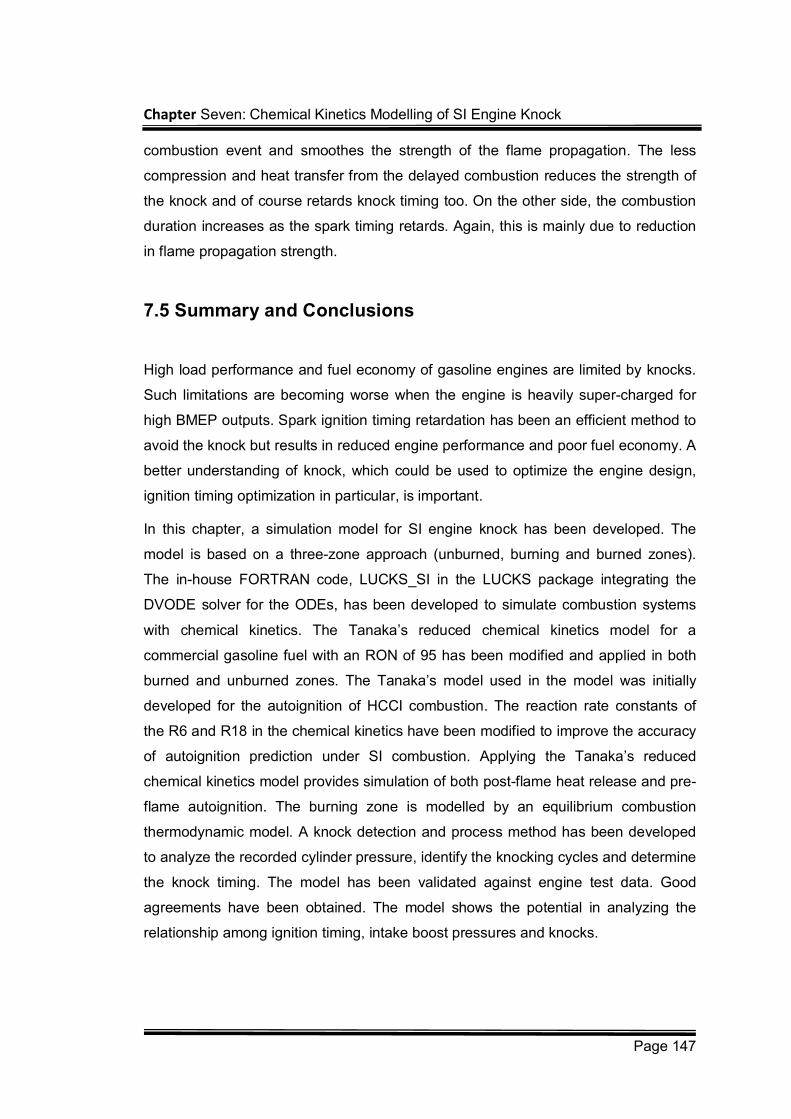
Chapter Seven: Chemical Kinetics Modelling of SI Engine Knock
Page 147
combustion event and smoothes the strength of the flame propagation. The less
compression and heat transfer from the delayed combustion reduces the strength of
the knock and of course retards knock timing too. On the other side, the combustion
duration increases as the spark timing retards. Again, this is mainly due to reduction
in flame propagation strength.
7.5 Summary and Conclusions
High load performance and fuel economy of gasoline engines are limited by knocks.
Such limitations are becoming worse when the engine is heavily super-charged for
high BMEP outputs. Spark ignition timing retardation has been an efficient method to
avoid the knock but results in reduced engine performance and poor fuel economy. A
better understanding of knock, which could be used to optimize the engine design,
ignition timing optimization in particular, is important.
In this chapter, a simulation model for SI engine knock has been developed. The
model is based on a three-zone approach (unburned, burning and burned zones).
The in-house FORTRAN code, LUCKS_SI in the LUCKS package integrating the
DVODE solver for the ODEs, has been developed to simulate combustion systems
with chemical kinetics. The Tanaka’s reduced chemical kinetics model for a
commercial gasoline fuel with an RON of 95 has been modified and applied in both
burned and unburned zones. The Tanaka’s model used in the model was initially
developed for the autoignition of HCCI combustion. The reaction rate constants of
the R6 and R18 in the chemical kinetics have been modified to improve the accuracy
of autoignition prediction under SI combustion. Applying the Tanaka’s reduced
chemical kinetics model provides simulation of both post-flame heat release and pre-
flame autoignition. The burning zone is modelled by an equilibrium combustion
thermodynamic model. A knock detection and process method has been developed
to analyze the recorded cylinder pressure, identify the knocking cycles and determine
the knock timing. The model has been validated against engine test data. Good
agreements have been obtained. The model shows the potential in analyzing the
relationship among ignition timing, intake boost pressures and knocks.
Chapter Eight: Multi-Zone Kinetic Modelling of HCCI Combustion
Page 148
Chapter Eight: Multi-Zone Kinetic Modelling of HCCI Combustion
8.1 Introduction
The autoignition combustion with homogeneous air and fuel mixture in a Internal
Combustion Engine (ICE) offers the potential of high efficiency, low NOX and low
particulate matter emissions. The combustion concept suits to various fuels, but each
fuel has a different autoignition behavior, which requires a unique engine control
strategy. For fuels with high cetane number, the thermal threshold of the autoignition
is low. The high compression ratio of the diesel engine design leads to an
undesirable early autoignition. Cooled external Exhaust Gas Re-circulation (EGR) is
often needed to dilute the engine charge and delay the autoignition to an acceptable
level. The technology is often referred as the Homogeneous Charge Compression
Ignition (HCCI) combustion. For fuels with high octane number, the thermal threshold
of the autoignition is high. They need extra thermal energy to promote the
autoignition. The hot Internal Exhaust Gas Re-circulation (IEGR) achieved using
various valve control strategies is a feasible technology to initiate such a combustion.
It is often named as Homogeneous Charge compression Ignition (HCCI) combustion,
and is the centre of this modeling study.
The autoignition combustion is a chemical-controlled combustion process and is
influenced by the in-cylinder turbulence and engine charge mixing. The in-
homogeneous in-cylinder conditions affect combustion performance and emissions
[53]. In addition, the unburned and partial burned gas mixture transported into or out
of the boundary layer and crevice have significant impact on CO and HC emissions.
Chapter Eight: Multi-Zone Kinetic Modelling of HCCI Combustion
Page 149
Modeling study is a valuable tool in understanding the combustion mechanism.
Aceves et al. [53] developed a sequential hybrid approach integrating a
Computational Fluid Dynamic (CFD) model (KIVA) with a multi-zone model coupled
with detailed chemical kinetics. The CFD model was employed to solve the
temperature and mixture composition until a transition angle prior to ignition and
Babajimopoulos et al. [209] developed a parallel hybrid approach communicating a
CFD model (KIVA) with a multi-zone model solving detailed chemical kinetics at each
computational time step, during which the thermodynamic states and composition in
both of the models are updated by each other. Orlandini et al. [136] divided the
combustion chamber into zones by assuming a constant temperature gradient
between the hottest zone and the coldest zone. The methodology simplified the
calculation but has limited power in simulating the in-homogeneity of the engine
charge. Ogink and Golovitchev [52] and Easley et al [133] divided the cylinder
volume into inner core zones, one outer core zone, a boundary layer and a crevice
zone at the beginning of the simulation. Mass transfer was considered only between
the outer core zone and the boundary layer, and between the boundary layer and the
crevice. The in-cylinder mixture was assumed uniform across the combustion
chamber. Komninos et al. [131,134] assumed that all zones have an equal thickness
at TDC. The in-cylinder temperature and composition at initial calculation point were
assumed uniform throughout the cylinder. These previous studies showed that the
multi-zone modeling requires less computational resources and has the capability of
describing the chemical and physical phenomenon in HCCI engines, making it
efficient methodology to study these issues.
In order to describe the chemical and physical processes of the HCCI combustion
and to investigate the effect of IEGR on combustion performance and emissions
efficiently, the multi-zone modeling technique has been employed in this work. In the
model, the combustion chamber is divided in to a number of apportioned volume
elements at Inlet Valve Opening (IVO) position. This is to take account of the
inhomogeneity of in-cylinder mixture and the IEGR. The apportionment is kept
constant throughout the simulation cycle with the exception of the crevice volume.
Chemical kinetic mechanism is applied in each zone to simulate the combustion and
the heat release. Model results are validated against the experimental observations.
8.2 Model Formulation
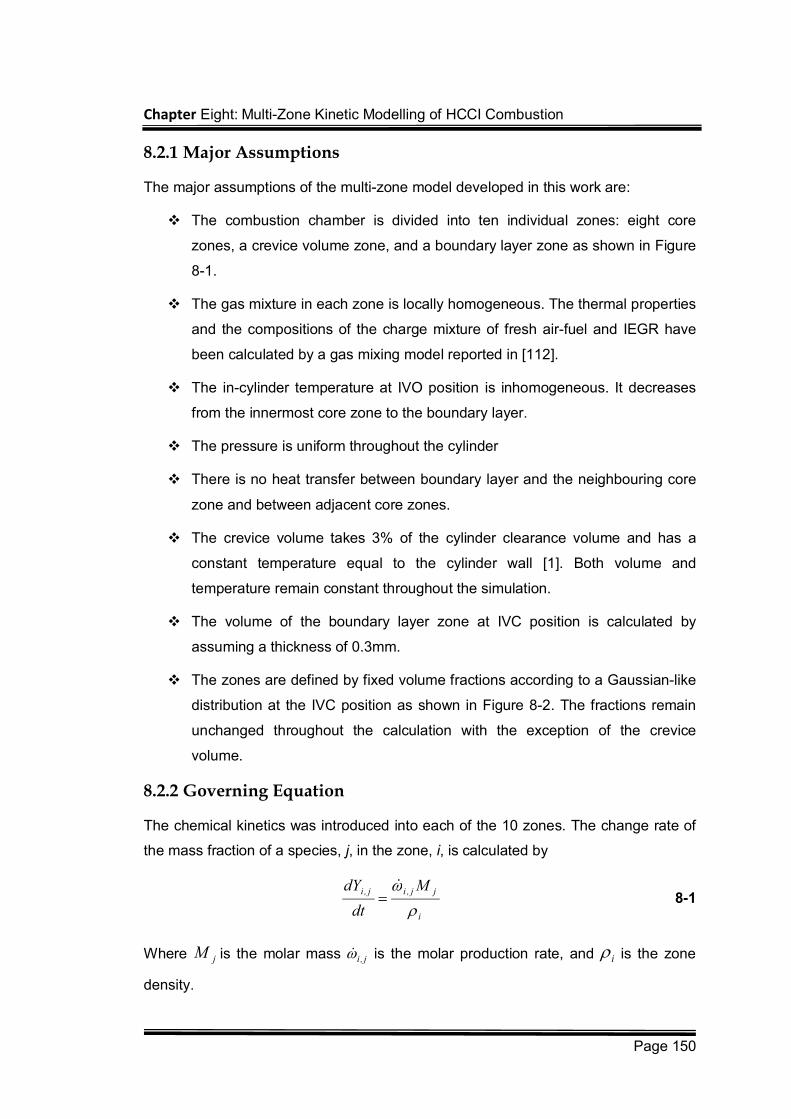
Chapter Eight: Multi-Zone Kinetic Modelling of HCCI Combustion
Page 150
8.2.1 Major Assumptions
The major assumptions of the multi-zone model developed in this work are:
The combustion chamber is divided into ten individual zones: eight core
zones, a crevice volume zone, and a boundary layer zone as shown in Figure
8-1.
The gas mixture in each zone is locally homogeneous. The thermal properties
and the compositions of the charge mixture of fresh air-fuel and IEGR have
been calculated by a gas mixing model reported in [112].
The in-cylinder temperature at IVO position is inhomogeneous. It decreases
from the innermost core zone to the boundary layer.
The pressure is uniform throughout the cylinder
There is no heat transfer between boundary layer and the neighbouring core
zone and between adjacent core zones.
The crevice volume takes 3% of the cylinder clearance volume and has a
constant temperature equal to the cylinder wall [1]. Both volume and
temperature remain constant throughout the simulation.
The volume of the boundary layer zone at IVC position is calculated by
assuming a thickness of 0.3mm.
The zones are defined by fixed volume fractions according to a Gaussian-like
distribution at the IVC position as shown in Figure 8-2. The fractions remain
unchanged throughout the calculation with the exception of the crevice
volume.
8.2.2 Governing Equation
The chemical kinetics was introduced into each of the 10 zones. The change rate of
the mass fraction of a species, j, in the zone, i, is calculated by
i
jj,ij,i M
dt
dY
8-1
Where jM is the molar mass is the molar production rate, and i is the zone
density.
j,i
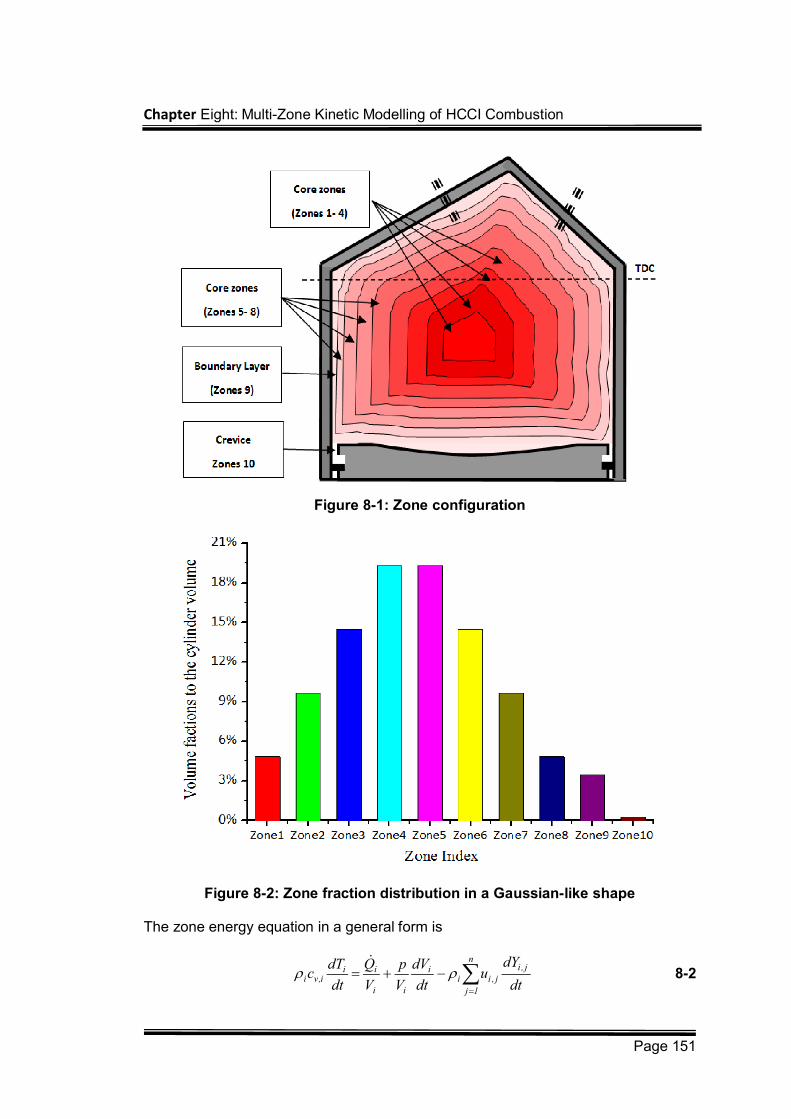
Chapter Eight: Multi-Zone Kinetic Modelling of HCCI Combustion
Page 151
Figure 8-1: Zone configuration
Figure 8-2: Zone fraction distribution in a Gaussian-like shape
The zone energy equation in a general form is
8-2
n
1j
j,ij,ii
i
ii
iii,vi
dt
dYu
dt
dV
V
p
V
Q
dt
dTc
Chapter Eight: Multi-Zone Kinetic Modelling of HCCI Combustion
Page 152
where u is the specific internal energy, c, is the specific heat capacity at constant
volume, V is the zone volume, p is the cylinder pressure, T is the zone temperature,
Q is the heat transfer. Note that for the core zones Q , is assumed to be zero. The
heat transfer between the boundary layer zone and the cylinder wall is modelled
using the Woschni heat transfer correlation modified by Chang et al. [210].
8.2.3 Mass Mixing
Since the zone apportionment is kept constant, different zone ends with a different
volume change rate after each calculation step. This results in different zone thermal
properties and zone pressure. In order to keep the pressure uniform across the
cylinder, mass has to transfer from higher-pressure zones to the lower-pressure
ones. Associating with the mass transfer, energy is transported across zones as well.
In this work, the modelling of the mass transportation is carried out at the end of each
calculation step. For the zones exporting mass, the thermal properties and gas
composition of the zone mixture remain unchanged before and after the mass
transportation. The formula of ideal gas law is employed as:
H
HH
'H
'H
M
RTmmVP 8-3
where subscript denotes the zones with higher pressure, m is the mass
transportation between the two neighbouring zones, HM is the zone molecular mass,
are the zone pressure and volume before the pressure balancing.
For the importing zones, the intake mass mixes with the original mixture and
therefore changes the gas properties. The formula of ideal gas law is employed as:
L
HL
'L'
L'L RT
M
m
M
mVP
8-4
where subscript L denotes the zones with lower pressure
For any given two adjacent zones, Thermodynamic and energy equations are applied.
HH,pLL,PLLL,pL TcmTcmTcm 8-5
The mixture-averaged specific heats are
H
V,P
Chapter Eight: Multi-Zone Kinetic Modelling of HCCI Combustion
Page 153
L
'H,p
'L,pL
L,pm
cmcmc
8-6
Then a system of four equations (8-3-8-6) with four unknowns: Δm and T ,c ,m LLp,L ,
is obtained. With substitution and rearrangement, a quadratic equation of m is
derived as
02 cmBmA 8-7
Where the coefficients of A, B and C are
H
L
H
HHH,p
V
V
M
TPcA 1
HH
LHLL,pL
HL
LHHH,pH
VM
VVTcm
VM
VVTcmB
HH
HL,pLHL
L
LL,pH
MV
TcmmV
M
TcmC
2
The solutions to Equation 8-7 are
A
ACBBm
2
42
Since m indicates the mass transfer from the higher-pressure zones to the lower-
pressure zones, its value should not be negative. Thus, the positive root should be
taken as the solution of m . With the obtaining of m , the thermal conditions and
mixture compositions of every two adjacent zones can be calculated to keep the
pressure uniform. A sequential calculation is then applied to balance the pressure
between every two neighbouring zones till the difference of pressure in each zone is
within the preset tolerance (0.00001 bars in this work), by which the in-cylinder
pressure is regarded as uniform
8-8
8.2.4 Blowby
The blow-by mass flow rate is determined from the isentropic compressible flow
relationships [211,212], which is expressed by
PPP LH
Chapter Eight: Multi-Zone Kinetic Modelling of HCCI Combustion
Page 154
8-9
where when
and when
where subscript indicates the engine blowby, is the area of the piston-cylinder
gap calculated from measured redial ring clearance, is the specific gas constant.
is the model constant, is the atmosphere pressure and is the heat specific
ratio.
8.2.5 Chemical Kinetic Mechanism
The chemical kinetic mechanism applied in this work is a reduced model for primary
reference fuels (PRF) developed by Tanaka et al. [123,154]. The mechanism
consists of only 52 reactions with 32 species. It has been tested to reproduce the
main features of HCCI combustion under a wide range of conditions but contains no
NOX mechanism. In order to simulate NOx emissions, a sub-mechanism of NOx
formation, derived from Golovithcev’s iso-octane mechanism [213], has been added
to the Tanaka model. The sub-mechanism includes 4 species and 12 reactions as
shown in Appendix C. The addition of the NOX mechanism should not affect the
original model’s capability of simulating the main HCCI features.
To verify the new combined model, both the modified and original mechanisms were
tested in a single-zone HCCI combustion model at various inlet temperatures. Four
calculated combustion performance parameters, ignition timing, peak pressure,
maximum pressure increase rate and temperatures at EVO were compared as
pfTR
pACm
pcblbl
1
1
2
p
po
2
1
11
11
2
o
o
p
p
p
ppf
1
1
2
p
po
12
1
2
1
1
2
pf
bl pcA
R
blC op
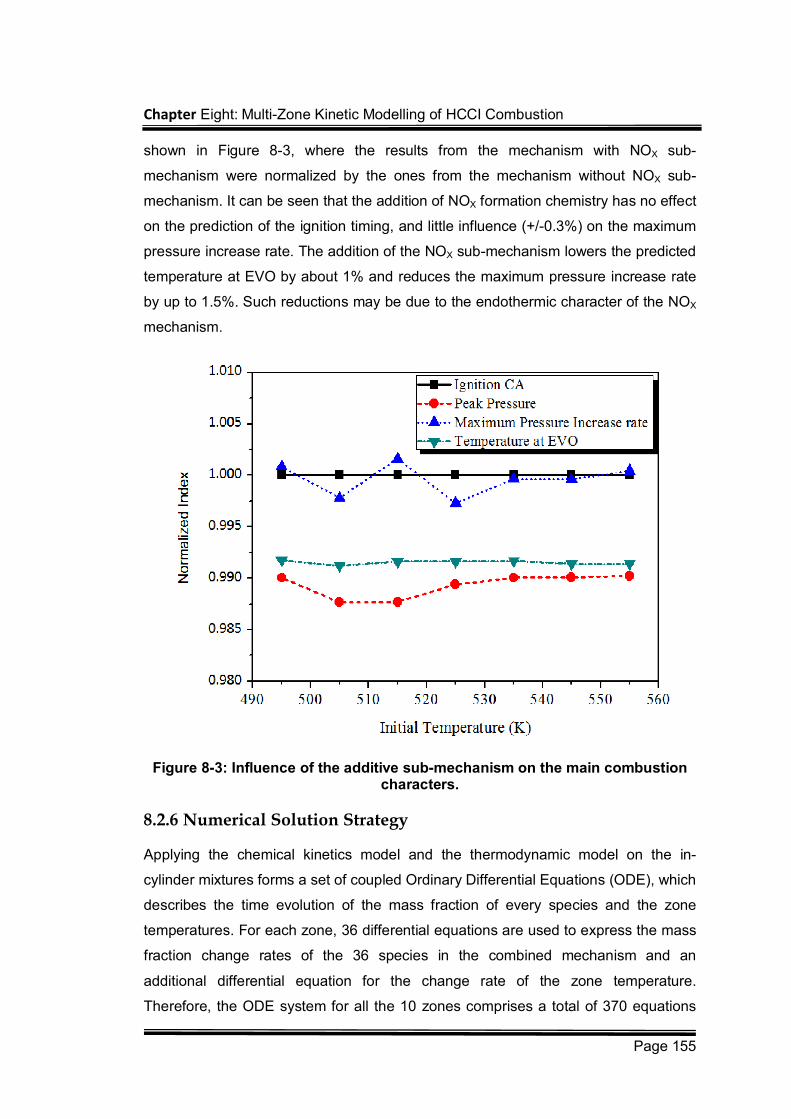
Chapter Eight: Multi-Zone Kinetic Modelling of HCCI Combustion
Page 155
shown in Figure 8-3, where the results from the mechanism with NOX sub-
mechanism were normalized by the ones from the mechanism without NOX sub-
mechanism. It can be seen that the addition of NOX formation chemistry has no effect
on the prediction of the ignition timing, and little influence (+/-0.3%) on the maximum
pressure increase rate. The addition of the NOX sub-mechanism lowers the predicted
temperature at EVO by about 1% and reduces the maximum pressure increase rate
by up to 1.5%. Such reductions may be due to the endothermic character of the NOX
mechanism.
Figure 8-3: Influence of the additive sub-mechanism on the main combustion characters.
8.2.6 Numerical Solution Strategy
Applying the chemical kinetics model and the thermodynamic model on the in-
cylinder mixtures forms a set of coupled Ordinary Differential Equations (ODE), which
describes the time evolution of the mass fraction of every species and the zone
temperatures. For each zone, 36 differential equations are used to express the mass
fraction change rates of the 36 species in the combined mechanism and an
additional differential equation for the change rate of the zone temperature.
Therefore, the ODE system for all the 10 zones comprises a total of 370 equations
Chapter Eight: Multi-Zone Kinetic Modelling of HCCI Combustion
Page 156
with 370 variables.
The previously described in-house FORTRAN code, LUCKS (Loughborough
University Chemical Kinetics Simulation), integrating a Double-precision Variable-
coefficient Ordinary Differential Equation (DVODE) code has been applied to the
model. The numerical procedure the code follows is briefly described in Figure 8-4.
The outputs are used to update the pressure of each zone. Then a pressure balance
model is applied to simulate the mass exchange among the zones in order to keep
the in-cylinder pressure uniform across the zones. The thermal properties and
mixture compositions are recalculated and updated after the pressure balance. The
simulation is executed from the timing of Intake Valve Closing (IVC) to the timing of
Exhaust Valve Opening (EVO), which requires approximately 5-minute CPU
calculation time on a Pentium 4 2.4 GHz PC operating on Window XP OS.
8.2.7 Thermodynamic Mixing Model
When Internal Exhaust Gas Recirculation (IEGR) is simulated, the thermodynamic
mixing model presented in [112] is used. Given the compositions and temperatures
of the fuel-air charge and the IEGR before mixing, the model calculates the thermal
properties and compositions of the mixture, and vice versa. In the model, the IEGR
gases trapped inside the engine cylinder is assumed to consist of combustion
products that are in thermodynamic equilibrium.
8.2.8 Initial Calculation Conditions
The multi-zone model starts the calculation at Intake Valve Closing (IVC) position
and ends at EVO. The gas mixture properties and engine conditions at the beginning
of the calculation have to be quantified as the initial input conditions.
The heat loss from in-cylinder gas to engine components has a direct impact on the
in-cylinder temperature distribution. Due to temperature difference between the in-
cylinder gases and the engine components (e.g. the cylinder wall, the piston head
and the cylinder head, etc.), heat is transferred out of the in-cylinder gases through
the thermal boundary layer and the crevice. As a result, this causes lower
temperatures in the outer regions that are close to the cylinder body and higher
temperature in the inner regions close to the cylinder centre. This is true to both the
IEGR gases trapped inside the cylinder before mixing with fresh engine charge and
the mixture of the IEGR, fresh air, and fuel at the IVC position.
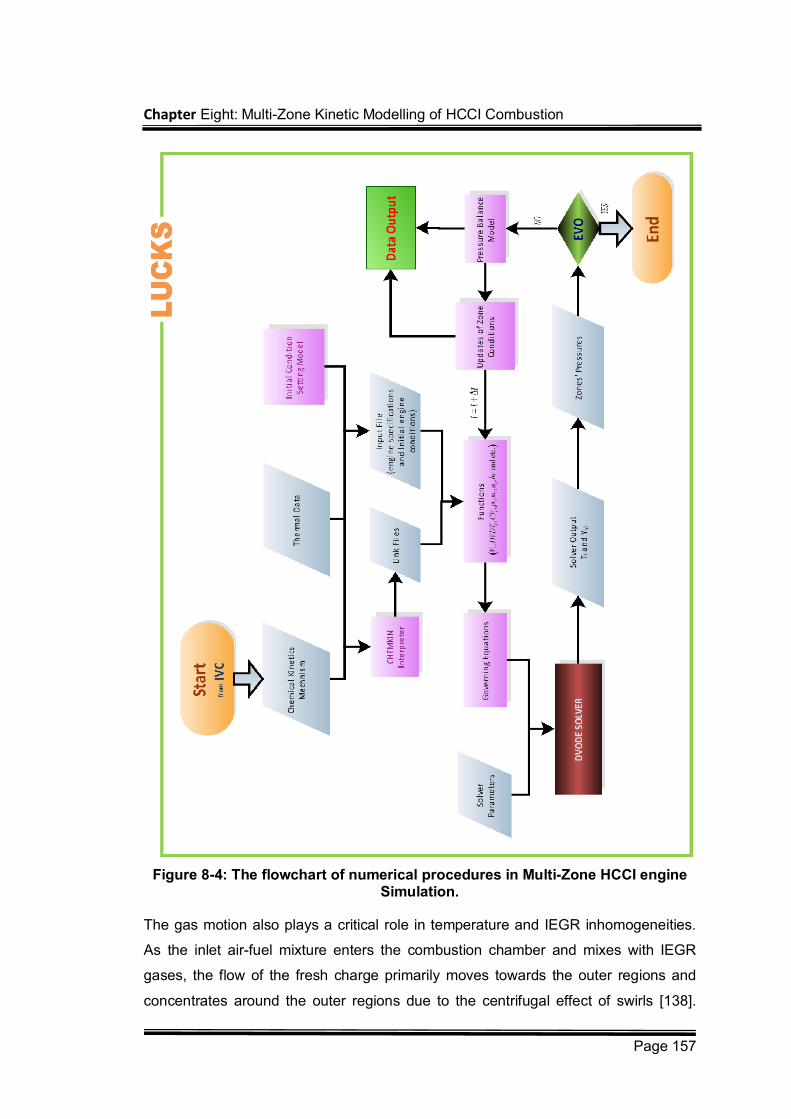
Chapter Eight: Multi-Zone Kinetic Modelling of HCCI Combustion
Page 157
Figure 8-4: The flowchart of numerical procedures in Multi-Zone HCCI engine Simulation.
The gas motion also plays a critical role in temperature and IEGR inhomogeneities.
As the inlet air-fuel mixture enters the combustion chamber and mixes with IEGR
gases, the flow of the fresh charge primarily moves towards the outer regions and
concentrates around the outer regions due to the centrifugal effect of swirls [138].
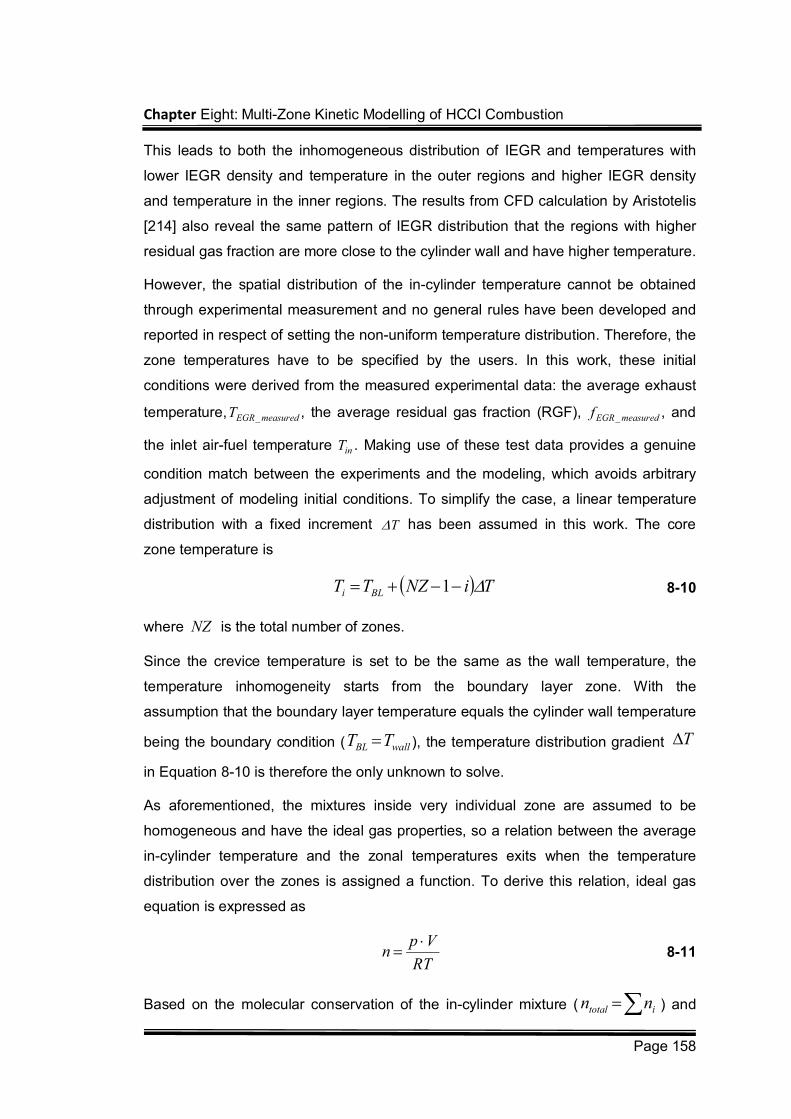
Chapter Eight: Multi-Zone Kinetic Modelling of HCCI Combustion
Page 158
This leads to both the inhomogeneous distribution of IEGR and temperatures with
lower IEGR density and temperature in the outer regions and higher IEGR density
and temperature in the inner regions. The results from CFD calculation by Aristotelis
[214] also reveal the same pattern of IEGR distribution that the regions with higher
residual gas fraction are more close to the cylinder wall and have higher temperature.
However, the spatial distribution of the in-cylinder temperature cannot be obtained
through experimental measurement and no general rules have been developed and
reported in respect of setting the non-uniform temperature distribution. Therefore, the
zone temperatures have to be specified by the users. In this work, these initial
conditions were derived from the measured experimental data: the average exhaust
temperature, , the average residual gas fraction (RGF), , and
the inlet air-fuel temperature . Making use of these test data provides a genuine
condition match between the experiments and the modeling, which avoids arbitrary
adjustment of modeling initial conditions. To simplify the case, a linear temperature
distribution with a fixed increment has been assumed in this work. The core
zone temperature is
TiNZTT BLi 1 8-10
where NZ is the total number of zones.
Since the crevice temperature is set to be the same as the wall temperature, the
temperature inhomogeneity starts from the boundary layer zone. With the
assumption that the boundary layer temperature equals the cylinder wall temperature
being the boundary condition ( wallBL TT ), the temperature distribution gradient
in Equation 8-10 is therefore the only unknown to solve.
As aforementioned, the mixtures inside very individual zone are assumed to be
homogeneous and have the ideal gas properties, so a relation between the average
in-cylinder temperature and the zonal temperatures exits when the temperature
distribution over the zones is assigned a function. To derive this relation, ideal gas
equation is expressed as
RT
Vpn
8-11
Based on the molecular conservation of the in-cylinder mixture ( itotal nn ) and
measured_EGRT measured_EGRf
inT
T
T
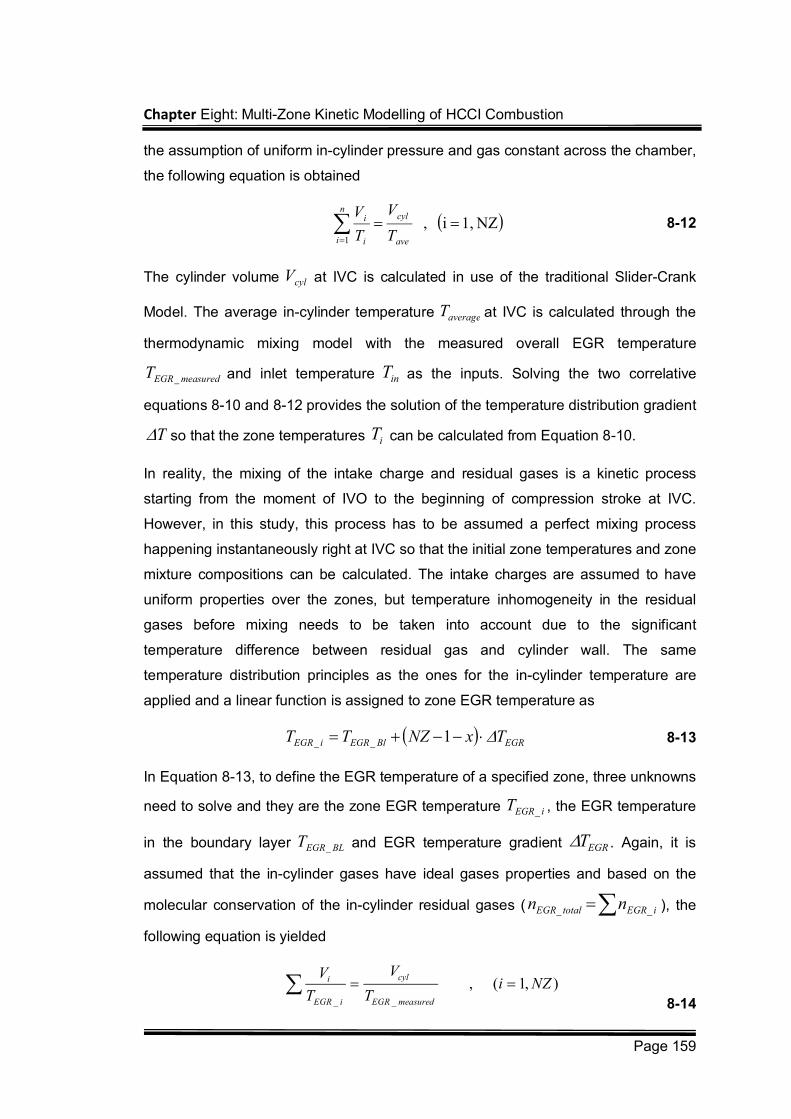
Chapter Eight: Multi-Zone Kinetic Modelling of HCCI Combustion
Page 159
the assumption of uniform in-cylinder pressure and gas constant across the chamber,
the following equation is obtained
NZ1,i , 1
ave
cyln
i i
i
T
V
T
V 8-12
The cylinder volume cylV at IVC is calculated in use of the traditional Slider-Crank
Model. The average in-cylinder temperature averageT at IVC is calculated through the
thermodynamic mixing model with the measured overall EGR temperature
measured_EGRT and inlet temperature inT as the inputs. Solving the two correlative
equations 8-10 and 8-12 provides the solution of the temperature distribution gradient
T so that the zone temperatures iT can be calculated from Equation 8-10.
In reality, the mixing of the intake charge and residual gases is a kinetic process
starting from the moment of IVO to the beginning of compression stroke at IVC.
However, in this study, this process has to be assumed a perfect mixing process
happening instantaneously right at IVC so that the initial zone temperatures and zone
mixture compositions can be calculated. The intake charges are assumed to have
uniform properties over the zones, but temperature inhomogeneity in the residual
gases before mixing needs to be taken into account due to the significant
temperature difference between residual gas and cylinder wall. The same
temperature distribution principles as the ones for the in-cylinder temperature are
applied and a linear function is assigned to zone EGR temperature as
EGRBl_EGRi_EGR TxNZTT 1 8-13
In Equation 8-13, to define the EGR temperature of a specified zone, three unknowns
need to solve and they are the zone EGR temperature i_EGRT , the EGR temperature
in the boundary layer BL_EGRT and EGR temperature gradient EGRT . Again, it is
assumed that the in-cylinder gases have ideal gases properties and based on the
molecular conservation of the in-cylinder residual gases ( i_EGRtotal_EGR nn ), the
following equation is yielded
8-14 _ _
, ( 1, ) cyli
EGR i EGR measured
VVi NZ
T T
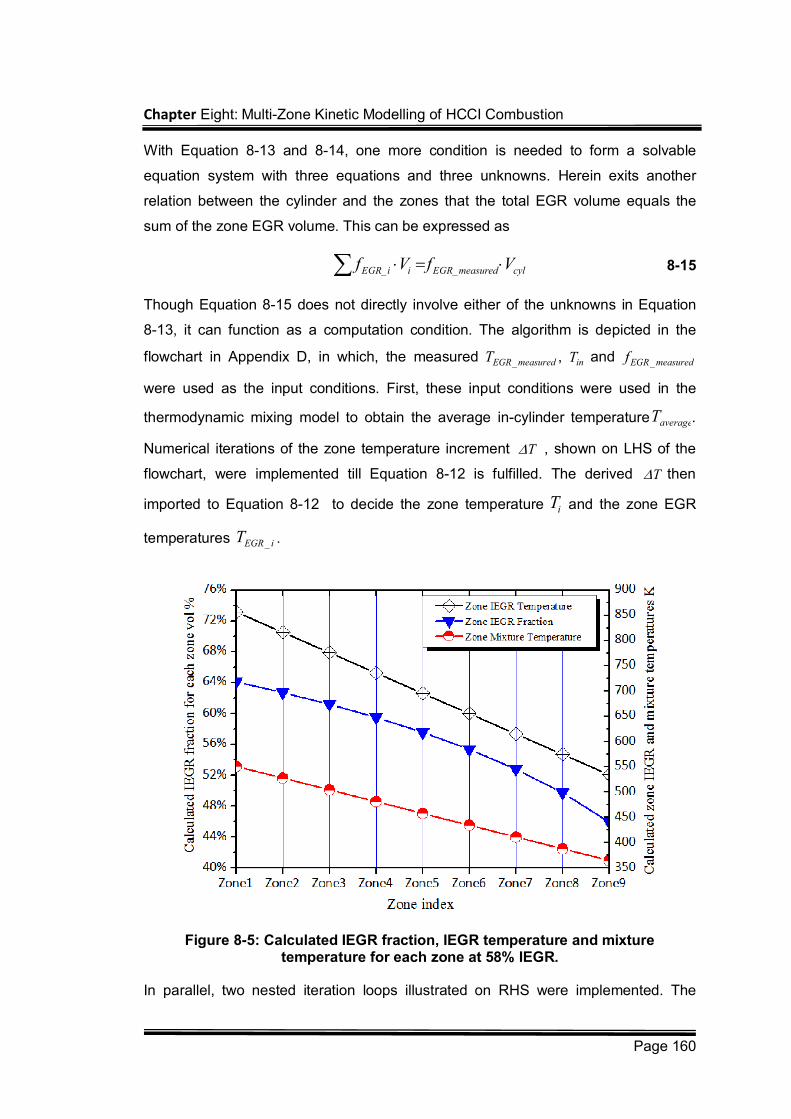
Chapter Eight: Multi-Zone Kinetic Modelling of HCCI Combustion
Page 160
With Equation 8-13 and 8-14, one more condition is needed to form a solvable
equation system with three equations and three unknowns. Herein exits another
relation between the cylinder and the zones that the total EGR volume equals the
sum of the zone EGR volume. This can be expressed as
cylmeasured_EGRii_EGR VfVf 8-15
Though Equation 8-15 does not directly involve either of the unknowns in Equation
8-13, it can function as a computation condition. The algorithm is depicted in the
flowchart in Appendix D, in which, the measured , and
were used as the input conditions. First, these input conditions were used in the
thermodynamic mixing model to obtain the average in-cylinder temperature averageT .
Numerical iterations of the zone temperature increment , shown on LHS of the
flowchart, were implemented till Equation 8-12 is fulfilled. The derived then
imported to Equation 8-12 to decide the zone temperature iT and the zone EGR
temperatures i_EGRT .
Figure 8-5: Calculated IEGR fraction, IEGR temperature and mixture temperature for each zone at 58% IEGR.
In parallel, two nested iteration loops illustrated on RHS were implemented. The
measured_EGRT inT measured_EGRf
T
T
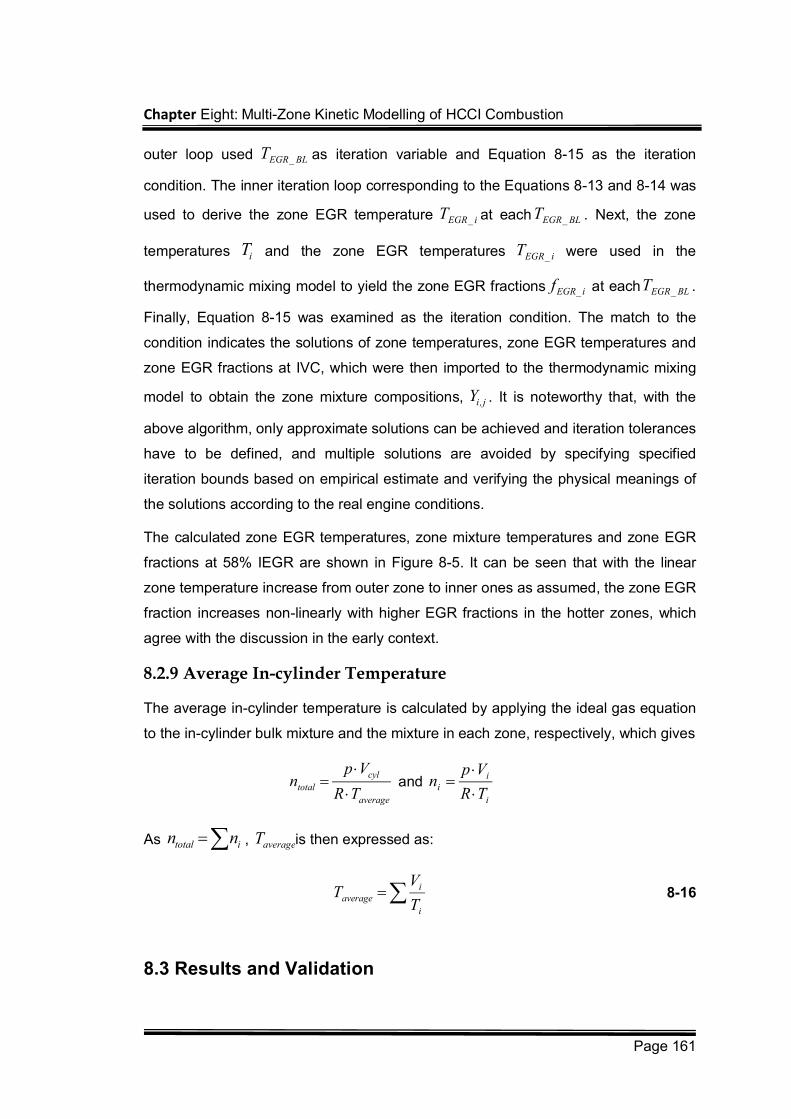
Chapter Eight: Multi-Zone Kinetic Modelling of HCCI Combustion
Page 161
outer loop used BL_EGRT as iteration variable and Equation 8-15 as the iteration
condition. The inner iteration loop corresponding to the Equations 8-13 and 8-14 was
used to derive the zone EGR temperature i_EGRT at each BL_EGRT . Next, the zone
temperatures iT and the zone EGR temperatures i_EGRT were used in the
thermodynamic mixing model to yield the zone EGR fractions i_EGRf at each BL_EGRT .
Finally, Equation 8-15 was examined as the iteration condition. The match to the
condition indicates the solutions of zone temperatures, zone EGR temperatures and
zone EGR fractions at IVC, which were then imported to the thermodynamic mixing
model to obtain the zone mixture compositions, j,iY . It is noteworthy that, with the
above algorithm, only approximate solutions can be achieved and iteration tolerances
have to be defined, and multiple solutions are avoided by specifying specified
iteration bounds based on empirical estimate and verifying the physical meanings of
the solutions according to the real engine conditions.
The calculated zone EGR temperatures, zone mixture temperatures and zone EGR
fractions at 58% IEGR are shown in Figure 8-5. It can be seen that with the linear
zone temperature increase from outer zone to inner ones as assumed, the zone EGR
fraction increases non-linearly with higher EGR fractions in the hotter zones, which
agree with the discussion in the early context.
8.2.9 Average In-cylinder Temperature
The average in-cylinder temperature is calculated by applying the ideal gas equation
to the in-cylinder bulk mixture and the mixture in each zone, respectively, which gives
average
cyl
totalTR
Vpn
and
i
ii
TR
Vpn
As itotal nn , averageT is then expressed as:
i
iaverage
T
VT 8-16
8.3 Results and Validation
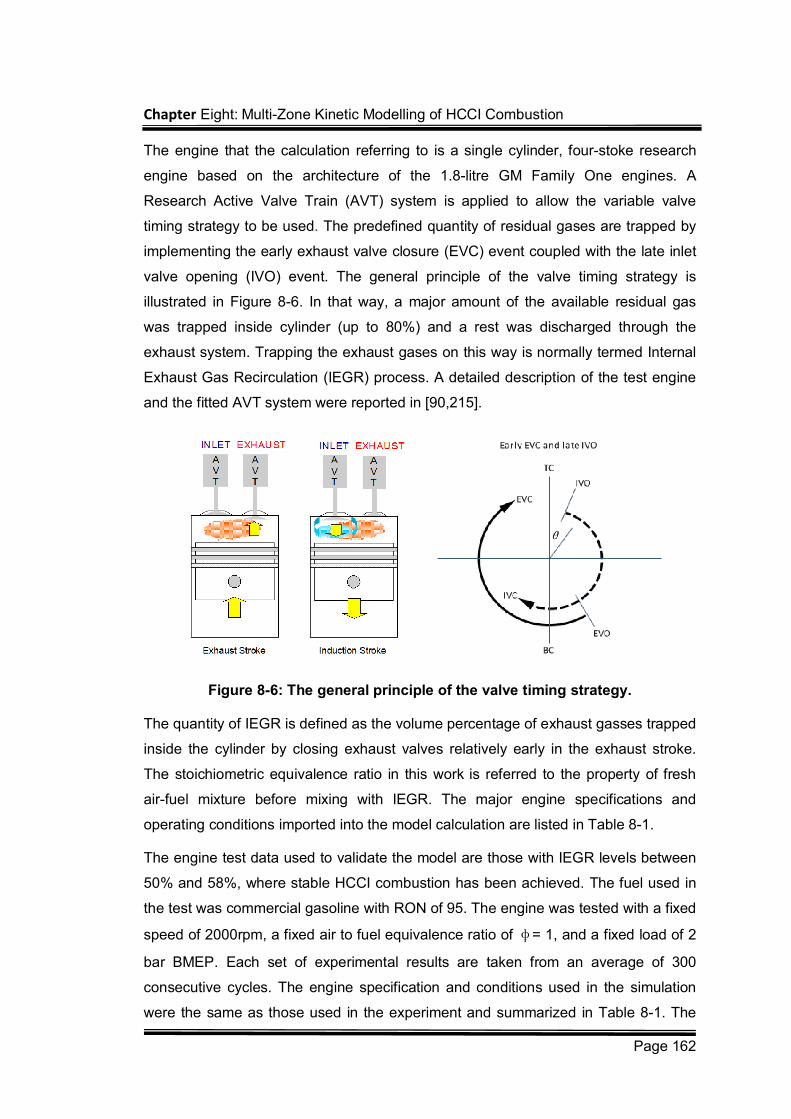
Chapter Eight: Multi-Zone Kinetic Modelling of HCCI Combustion
Page 162
The engine that the calculation referring to is a single cylinder, four-stoke research
engine based on the architecture of the 1.8-litre GM Family One engines. A
Research Active Valve Train (AVT) system is applied to allow the variable valve
timing strategy to be used. The predefined quantity of residual gases are trapped by
implementing the early exhaust valve closure (EVC) event coupled with the late inlet
valve opening (IVO) event. The general principle of the valve timing strategy is
illustrated in Figure 8-6. In that way, a major amount of the available residual gas
was trapped inside cylinder (up to 80%) and a rest was discharged through the
exhaust system. Trapping the exhaust gases on this way is normally termed Internal
Exhaust Gas Recirculation (IEGR) process. A detailed description of the test engine
and the fitted AVT system were reported in [90,215].
Figure 8-6: The general principle of the valve timing strategy.
The quantity of IEGR is defined as the volume percentage of exhaust gasses trapped
inside the cylinder by closing exhaust valves relatively early in the exhaust stroke.
The stoichiometric equivalence ratio in this work is referred to the property of fresh
air-fuel mixture before mixing with IEGR. The major engine specifications and
operating conditions imported into the model calculation are listed in Table 8-1.
The engine test data used to validate the model are those with IEGR levels between
50% and 58%, where stable HCCI combustion has been achieved. The fuel used in
the test was commercial gasoline with RON of 95. The engine was tested with a fixed
speed of 2000rpm, a fixed air to fuel equivalence ratio of φ= 1, and a fixed load of 2
bar BMEP. Each set of experimental results are taken from an average of 300
consecutive cycles. The engine specification and conditions used in the simulation
were the same as those used in the experiment and summarized in Table 8-1. The
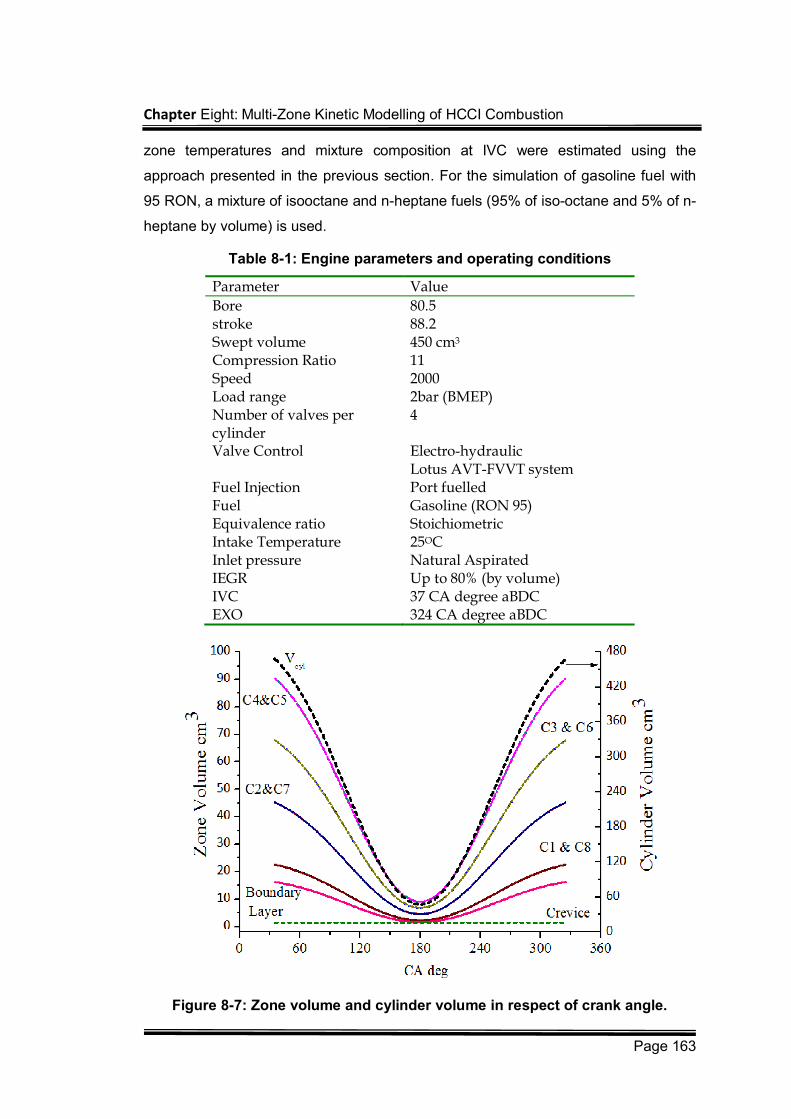
Chapter Eight: Multi-Zone Kinetic Modelling of HCCI Combustion
Page 163
zone temperatures and mixture composition at IVC were estimated using the
approach presented in the previous section. For the simulation of gasoline fuel with
95 RON, a mixture of isooctane and n-heptane fuels (95% of iso-octane and 5% of n-
heptane by volume) is used.
Table 8-1: Engine parameters and operating conditions
Parameter Value
Bore 80.5 stroke 88.2 Swept volume 450 cm3 Compression Ratio 11 Speed 2000 Load range 2bar (BMEP) Number of valves per cylinder
4
Valve Control Electro-hydraulic Lotus AVT-FVVT system
Fuel Injection Port fuelled Fuel Gasoline (RON 95) Equivalence ratio Stoichiometric Intake Temperature 25OC Inlet pressure Natural Aspirated IEGR Up to 80% (by volume) IVC 37 CA degree aBDC EXO 324 CA degree aBDC
Figure 8-7: Zone volume and cylinder volume in respect of crank angle.
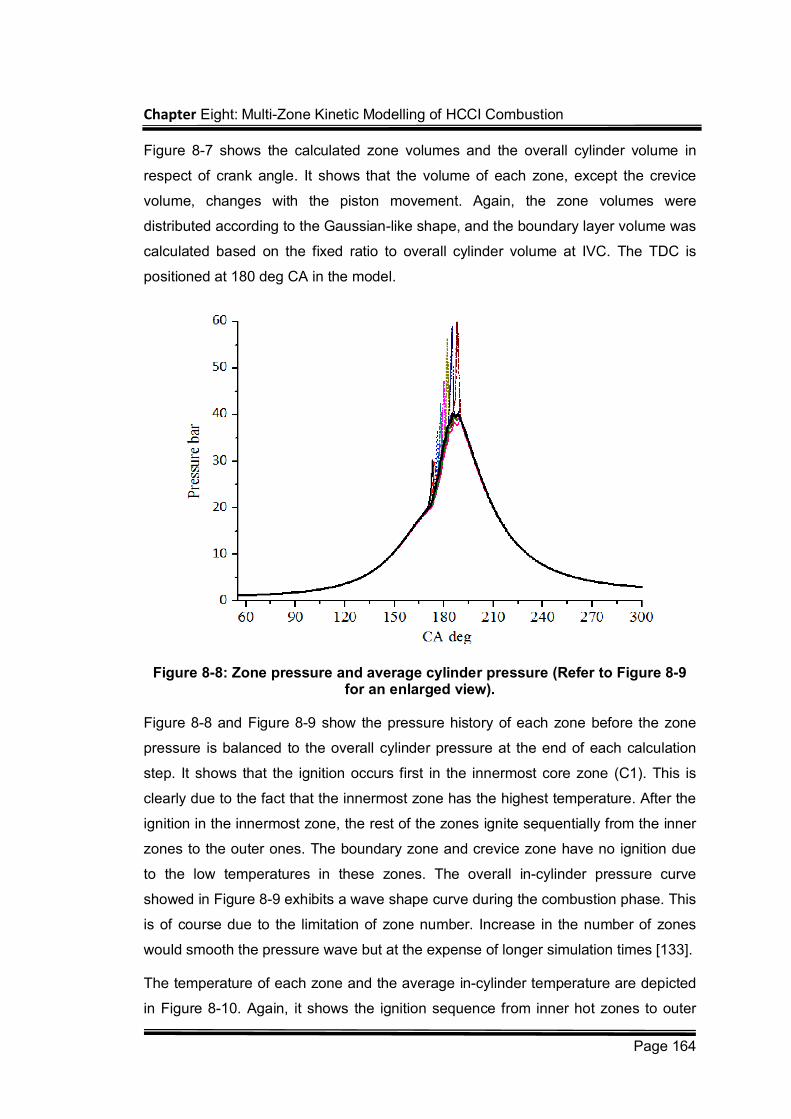
Chapter Eight: Multi-Zone Kinetic Modelling of HCCI Combustion
Page 164
Figure 8-7 shows the calculated zone volumes and the overall cylinder volume in
respect of crank angle. It shows that the volume of each zone, except the crevice
volume, changes with the piston movement. Again, the zone volumes were
distributed according to the Gaussian-like shape, and the boundary layer volume was
calculated based on the fixed ratio to overall cylinder volume at IVC. The TDC is
positioned at 180 deg CA in the model.
Figure 8-8: Zone pressure and average cylinder pressure (Refer to Figure 8-9 for an enlarged view).
Figure 8-8 and Figure 8-9 show the pressure history of each zone before the zone
pressure is balanced to the overall cylinder pressure at the end of each calculation
step. It shows that the ignition occurs first in the innermost core zone (C1). This is
clearly due to the fact that the innermost zone has the highest temperature. After the
ignition in the innermost zone, the rest of the zones ignite sequentially from the inner
zones to the outer ones. The boundary zone and crevice zone have no ignition due
to the low temperatures in these zones. The overall in-cylinder pressure curve
showed in Figure 8-9 exhibits a wave shape curve during the combustion phase. This
is of course due to the limitation of zone number. Increase in the number of zones
would smooth the pressure wave but at the expense of longer simulation times [133].
The temperature of each zone and the average in-cylinder temperature are depicted
in Figure 8-10. Again, it shows the ignition sequence from inner hot zones to outer
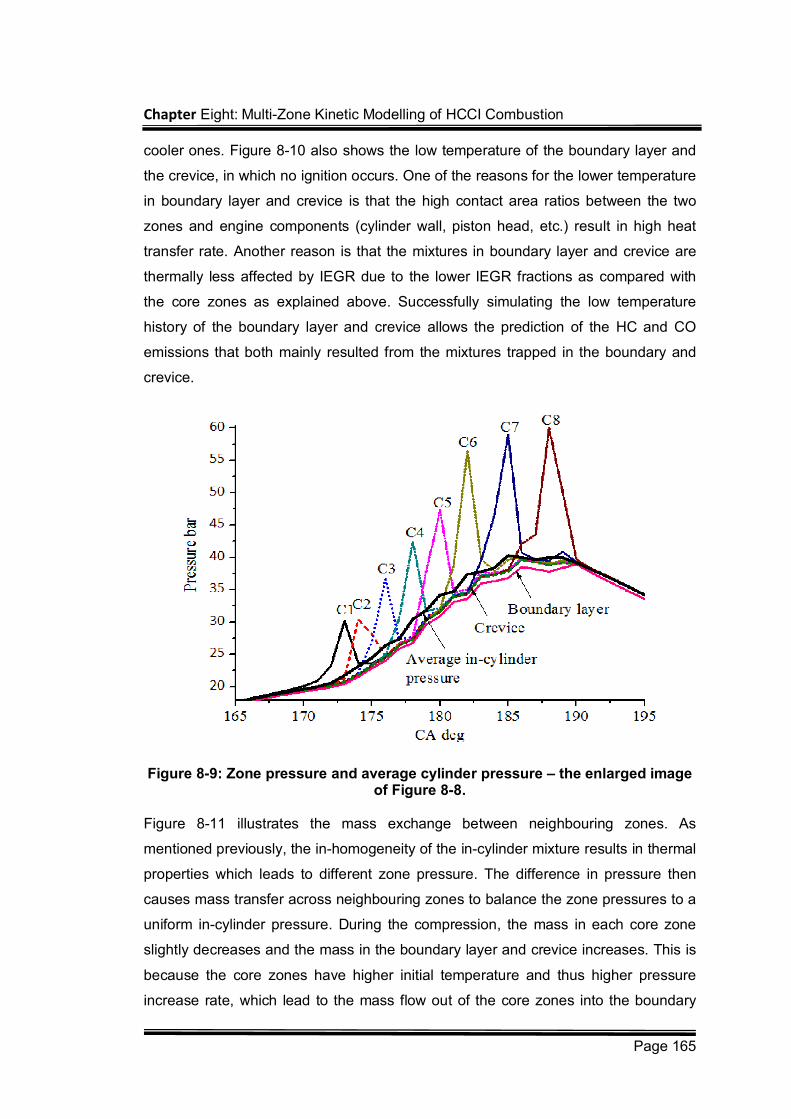
Chapter Eight: Multi-Zone Kinetic Modelling of HCCI Combustion
Page 165
cooler ones. Figure 8-10 also shows the low temperature of the boundary layer and
the crevice, in which no ignition occurs. One of the reasons for the lower temperature
in boundary layer and crevice is that the high contact area ratios between the two
zones and engine components (cylinder wall, piston head, etc.) result in high heat
transfer rate. Another reason is that the mixtures in boundary layer and crevice are
thermally less affected by IEGR due to the lower IEGR fractions as compared with
the core zones as explained above. Successfully simulating the low temperature
history of the boundary layer and crevice allows the prediction of the HC and CO
emissions that both mainly resulted from the mixtures trapped in the boundary and
crevice.
Figure 8-9: Zone pressure and average cylinder pressure – the enlarged image of Figure 8-8.
Figure 8-11 illustrates the mass exchange between neighbouring zones. As
mentioned previously, the in-homogeneity of the in-cylinder mixture results in thermal
properties which leads to different zone pressure. The difference in pressure then
causes mass transfer across neighbouring zones to balance the zone pressures to a
uniform in-cylinder pressure. During the compression, the mass in each core zone
slightly decreases and the mass in the boundary layer and crevice increases. This is
because the core zones have higher initial temperature and thus higher pressure
increase rate, which lead to the mass flow out of the core zones into the boundary
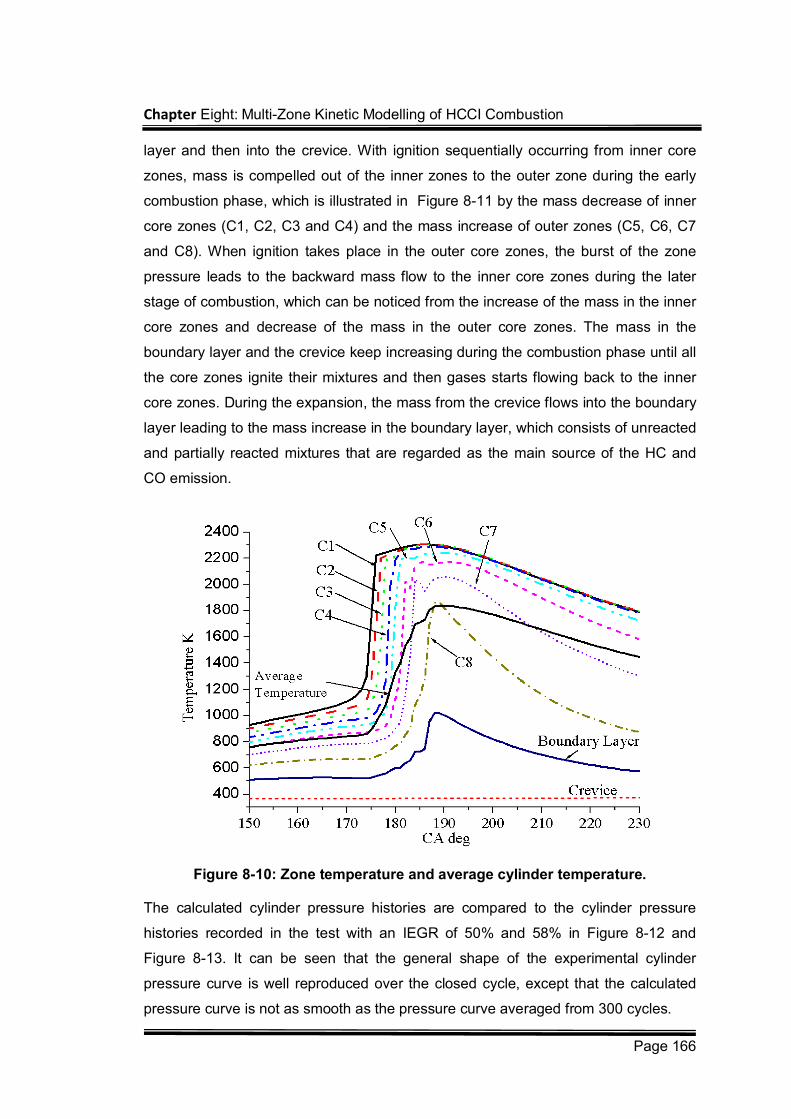
Chapter Eight: Multi-Zone Kinetic Modelling of HCCI Combustion
Page 166
layer and then into the crevice. With ignition sequentially occurring from inner core
zones, mass is compelled out of the inner zones to the outer zone during the early
combustion phase, which is illustrated in Figure 8-11 by the mass decrease of inner
core zones (C1, C2, C3 and C4) and the mass increase of outer zones (C5, C6, C7
and C8). When ignition takes place in the outer core zones, the burst of the zone
pressure leads to the backward mass flow to the inner core zones during the later
stage of combustion, which can be noticed from the increase of the mass in the inner
core zones and decrease of the mass in the outer core zones. The mass in the
boundary layer and the crevice keep increasing during the combustion phase until all
the core zones ignite their mixtures and then gases starts flowing back to the inner
core zones. During the expansion, the mass from the crevice flows into the boundary
layer leading to the mass increase in the boundary layer, which consists of unreacted
and partially reacted mixtures that are regarded as the main source of the HC and
CO emission.
Figure 8-10: Zone temperature and average cylinder temperature.
The calculated cylinder pressure histories are compared to the cylinder pressure
histories recorded in the test with an IEGR of 50% and 58% in Figure 8-12 and
Figure 8-13. It can be seen that the general shape of the experimental cylinder
pressure curve is well reproduced over the closed cycle, except that the calculated
pressure curve is not as smooth as the pressure curve averaged from 300 cycles.
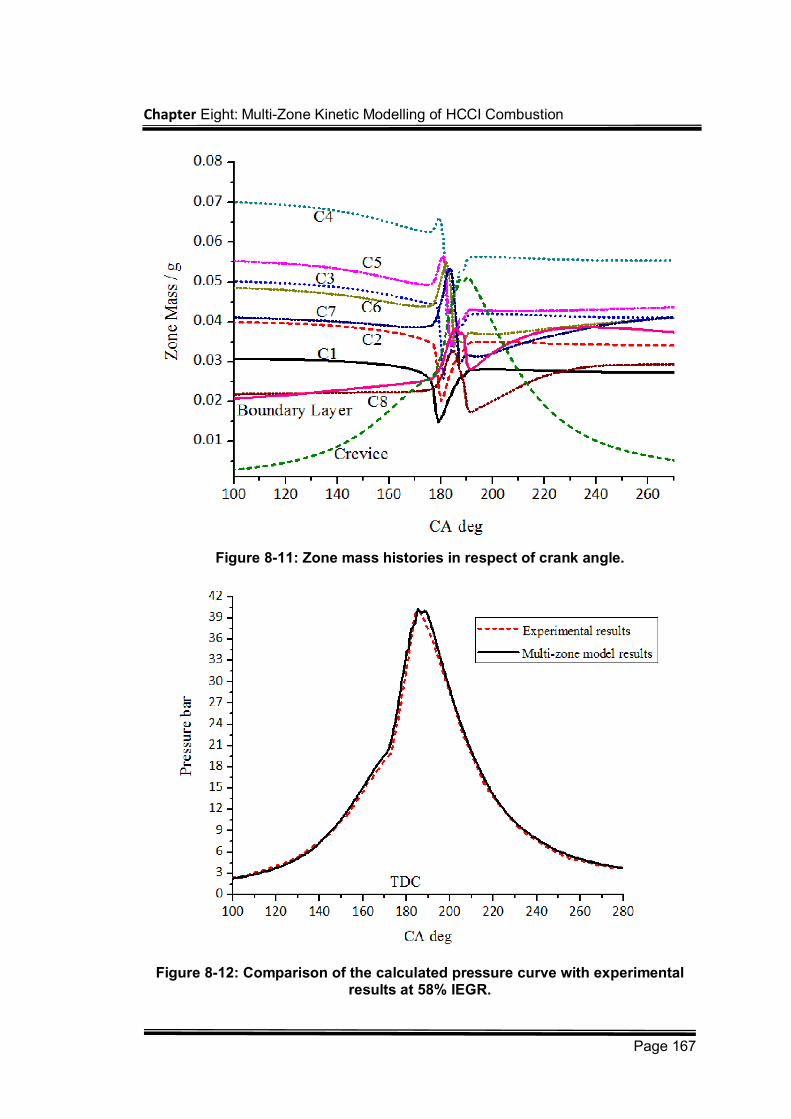
Chapter Eight: Multi-Zone Kinetic Modelling of HCCI Combustion
Page 167
Figure 8-11: Zone mass histories in respect of crank angle.
Figure 8-12: Comparison of the calculated pressure curve with experimental results at 58% IEGR.
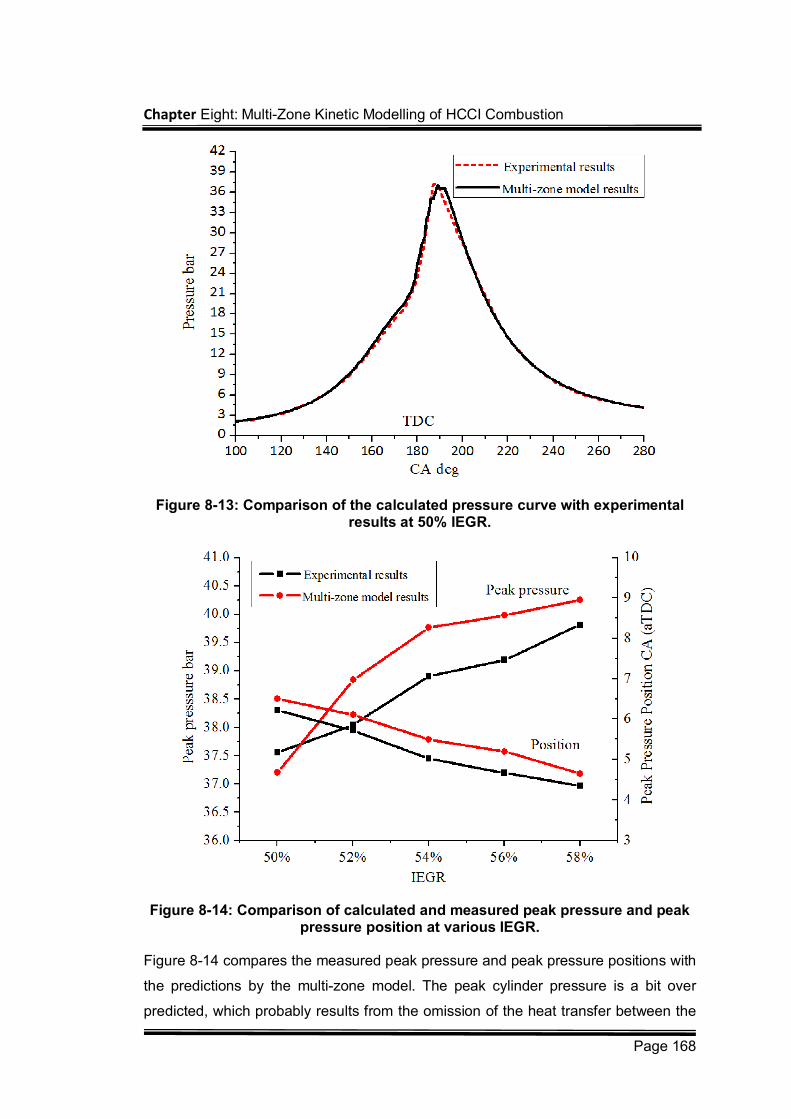
Chapter Eight: Multi-Zone Kinetic Modelling of HCCI Combustion
Page 168
Figure 8-13: Comparison of the calculated pressure curve with experimental results at 50% IEGR.
Figure 8-14: Comparison of calculated and measured peak pressure and peak pressure position at various IEGR.
Figure 8-14 compares the measured peak pressure and peak pressure positions with
the predictions by the multi-zone model. The peak cylinder pressure is a bit over
predicted, which probably results from the omission of the heat transfer between the
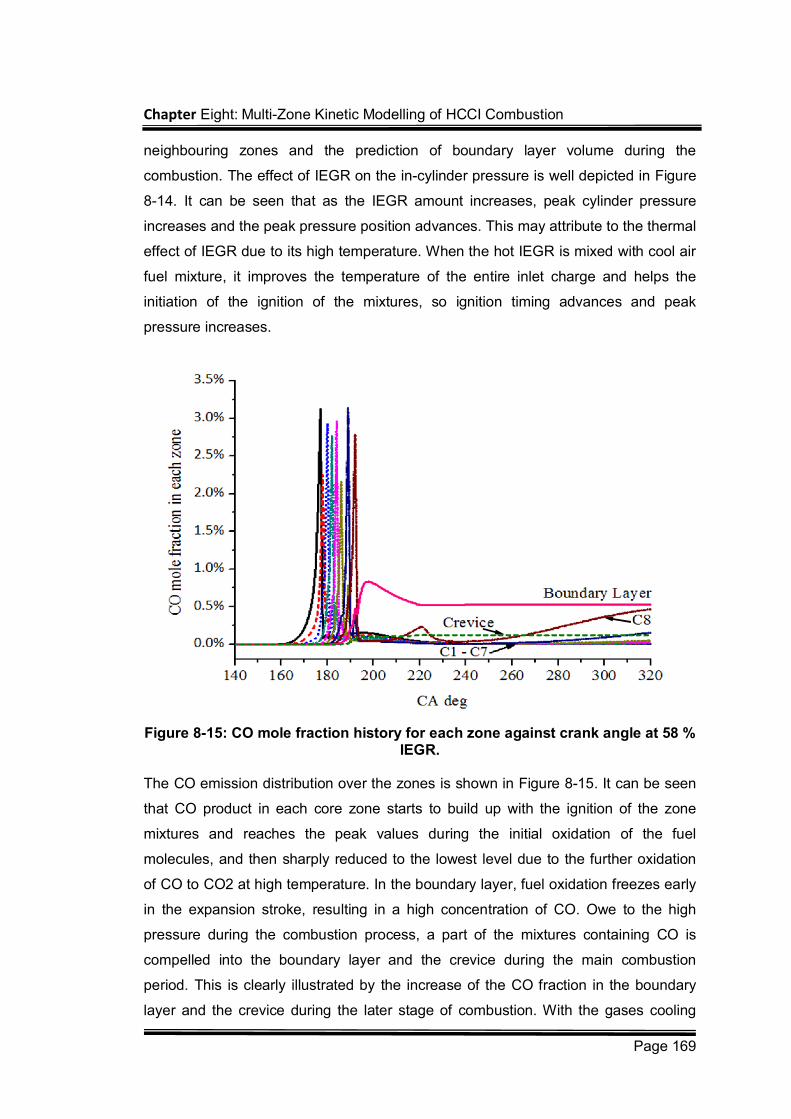
Chapter Eight: Multi-Zone Kinetic Modelling of HCCI Combustion
Page 169
neighbouring zones and the prediction of boundary layer volume during the
combustion. The effect of IEGR on the in-cylinder pressure is well depicted in Figure
8-14. It can be seen that as the IEGR amount increases, peak cylinder pressure
increases and the peak pressure position advances. This may attribute to the thermal
effect of IEGR due to its high temperature. When the hot IEGR is mixed with cool air
fuel mixture, it improves the temperature of the entire inlet charge and helps the
initiation of the ignition of the mixtures, so ignition timing advances and peak
pressure increases.
Figure 8-15: CO mole fraction history for each zone against crank angle at 58 % IEGR.
The CO emission distribution over the zones is shown in Figure 8-15. It can be seen
that CO product in each core zone starts to build up with the ignition of the zone
mixtures and reaches the peak values during the initial oxidation of the fuel
molecules, and then sharply reduced to the lowest level due to the further oxidation
of CO to CO2 at high temperature. In the boundary layer, fuel oxidation freezes early
in the expansion stroke, resulting in a high concentration of CO. Owe to the high
pressure during the combustion process, a part of the mixtures containing CO is
compelled into the boundary layer and the crevice during the main combustion
period. This is clearly illustrated by the increase of the CO fraction in the boundary
layer and the crevice during the later stage of combustion. With the gases cooling
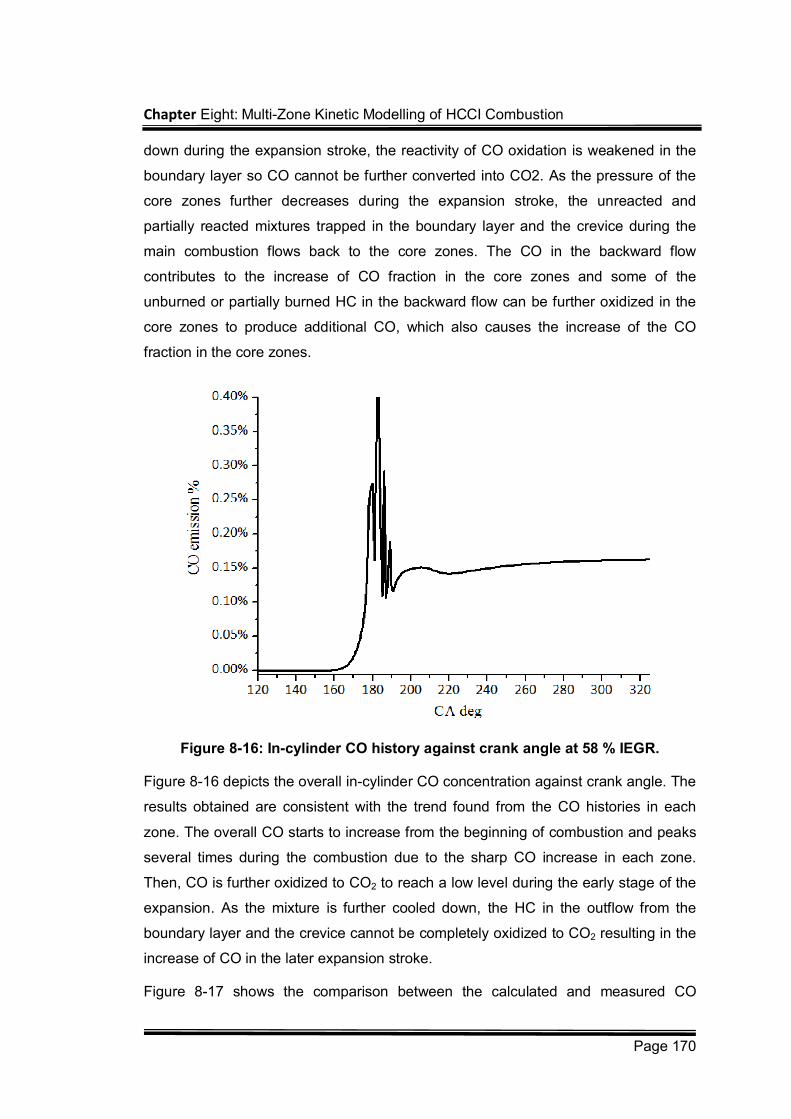
Chapter Eight: Multi-Zone Kinetic Modelling of HCCI Combustion
Page 170
down during the expansion stroke, the reactivity of CO oxidation is weakened in the
boundary layer so CO cannot be further converted into CO2. As the pressure of the
core zones further decreases during the expansion stroke, the unreacted and
partially reacted mixtures trapped in the boundary layer and the crevice during the
main combustion flows back to the core zones. The CO in the backward flow
contributes to the increase of CO fraction in the core zones and some of the
unburned or partially burned HC in the backward flow can be further oxidized in the
core zones to produce additional CO, which also causes the increase of the CO
fraction in the core zones.
Figure 8-16: In-cylinder CO history against crank angle at 58 % IEGR.
Figure 8-16 depicts the overall in-cylinder CO concentration against crank angle. The
results obtained are consistent with the trend found from the CO histories in each
zone. The overall CO starts to increase from the beginning of combustion and peaks
several times during the combustion due to the sharp CO increase in each zone.
Then, CO is further oxidized to CO2 to reach a low level during the early stage of the
expansion. As the mixture is further cooled down, the HC in the outflow from the
boundary layer and the crevice cannot be completely oxidized to CO2 resulting in the
increase of CO in the later expansion stroke.
Figure 8-17 shows the comparison between the calculated and measured CO
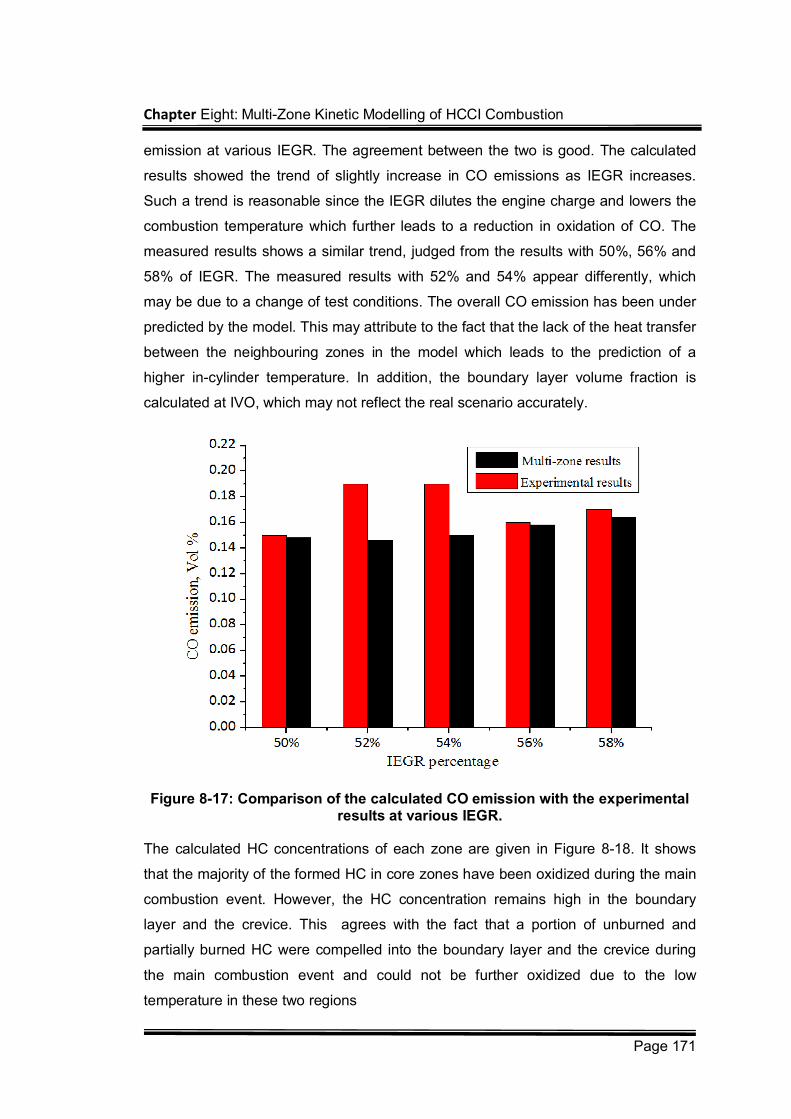
Chapter Eight: Multi-Zone Kinetic Modelling of HCCI Combustion
Page 171
emission at various IEGR. The agreement between the two is good. The calculated
results showed the trend of slightly increase in CO emissions as IEGR increases.
Such a trend is reasonable since the IEGR dilutes the engine charge and lowers the
combustion temperature which further leads to a reduction in oxidation of CO. The
measured results shows a similar trend, judged from the results with 50%, 56% and
58% of IEGR. The measured results with 52% and 54% appear differently, which
may be due to a change of test conditions. The overall CO emission has been under
predicted by the model. This may attribute to the fact that the lack of the heat transfer
between the neighbouring zones in the model which leads to the prediction of a
higher in-cylinder temperature. In addition, the boundary layer volume fraction is
calculated at IVO, which may not reflect the real scenario accurately.
Figure 8-17: Comparison of the calculated CO emission with the experimental results at various IEGR.
The calculated HC concentrations of each zone are given in Figure 8-18. It shows
that the majority of the formed HC in core zones have been oxidized during the main
combustion event. However, the HC concentration remains high in the boundary
layer and the crevice. This agrees with the fact that a portion of unburned and
partially burned HC were compelled into the boundary layer and the crevice during
the main combustion event and could not be further oxidized due to the low
temperature in these two regions
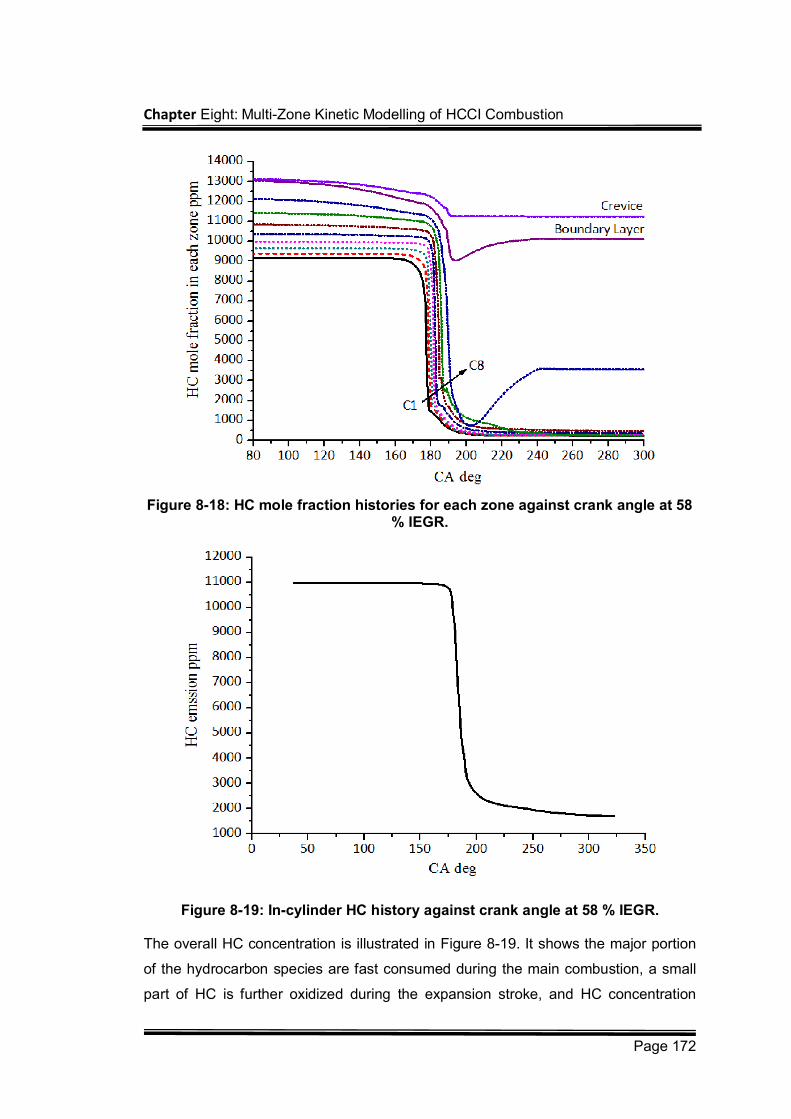
Chapter Eight: Multi-Zone Kinetic Modelling of HCCI Combustion
Page 172
Figure 8-18: HC mole fraction histories for each zone against crank angle at 58 % IEGR.
Figure 8-19: In-cylinder HC history against crank angle at 58 % IEGR.
The overall HC concentration is illustrated in Figure 8-19. It shows the major portion
of the hydrocarbon species are fast consumed during the main combustion, a small
part of HC is further oxidized during the expansion stroke, and HC concentration
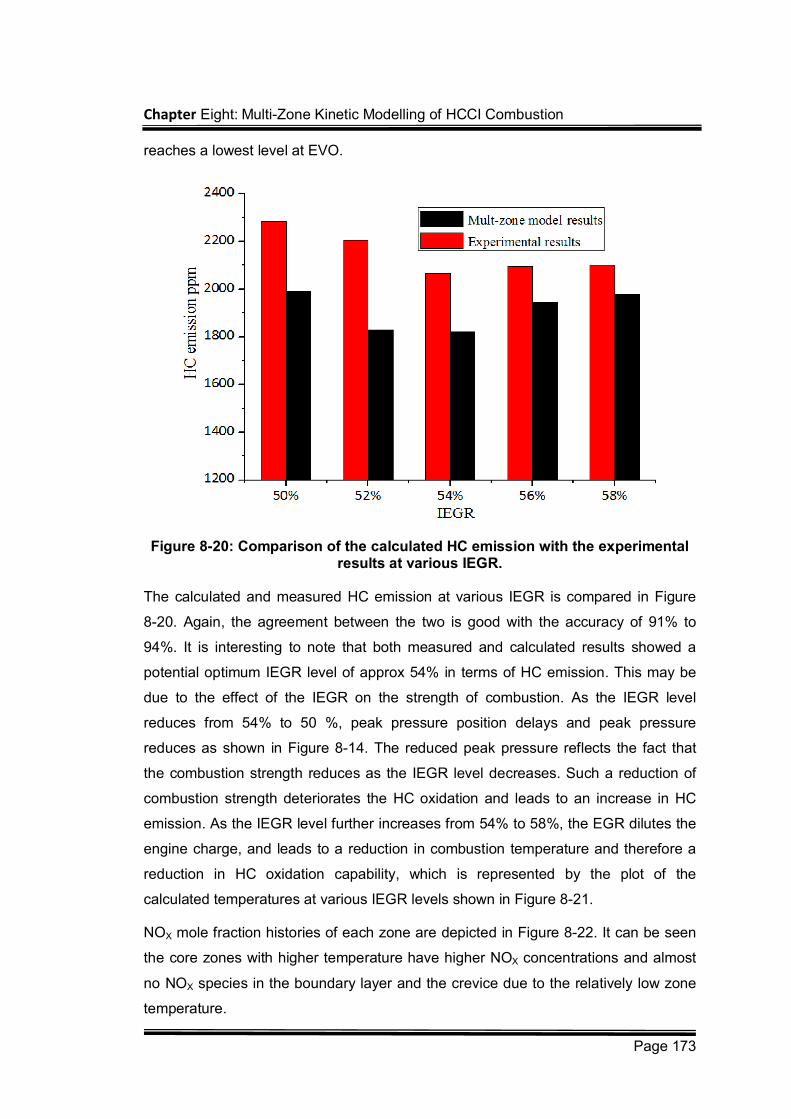
Chapter Eight: Multi-Zone Kinetic Modelling of HCCI Combustion
Page 173
reaches a lowest level at EVO.
Figure 8-20: Comparison of the calculated HC emission with the experimental results at various IEGR.
The calculated and measured HC emission at various IEGR is compared in Figure
8-20. Again, the agreement between the two is good with the accuracy of 91% to
94%. It is interesting to note that both measured and calculated results showed a
potential optimum IEGR level of approx 54% in terms of HC emission. This may be
due to the effect of the IEGR on the strength of combustion. As the IEGR level
reduces from 54% to 50 %, peak pressure position delays and peak pressure
reduces as shown in Figure 8-14. The reduced peak pressure reflects the fact that
the combustion strength reduces as the IEGR level decreases. Such a reduction of
combustion strength deteriorates the HC oxidation and leads to an increase in HC
emission. As the IEGR level further increases from 54% to 58%, the EGR dilutes the
engine charge, and leads to a reduction in combustion temperature and therefore a
reduction in HC oxidation capability, which is represented by the plot of the
calculated temperatures at various IEGR levels shown in Figure 8-21.
NOX mole fraction histories of each zone are depicted in Figure 8-22. It can be seen
the core zones with higher temperature have higher NOX concentrations and almost
no NOX species in the boundary layer and the crevice due to the relatively low zone
temperature.
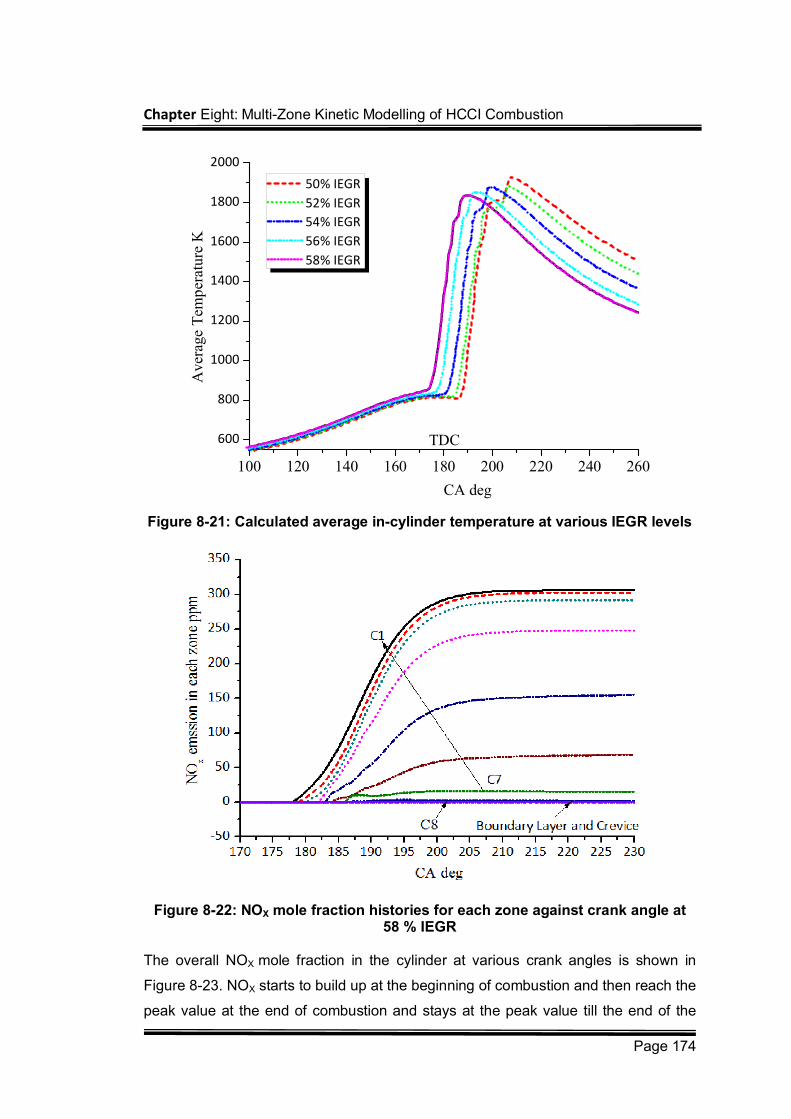
Chapter Eight: Multi-Zone Kinetic Modelling of HCCI Combustion
Page 174
Figure 8-21: Calculated average in-cylinder temperature at various IEGR levels
Figure 8-22: NOX mole fraction histories for each zone against crank angle at 58 % IEGR
The overall NOX mole fraction in the cylinder at various crank angles is shown in
Figure 8-23. NOX starts to build up at the beginning of combustion and then reach the
peak value at the end of combustion and stays at the peak value till the end of the
100 120 140 160 180 200 220 240 260
600
800
1000
1200
1400
1600
1800
2000
Aver
age
Tem
per
ature
K
CA deg
50% IEGR
52% IEGR
54% IEGR
56% IEGR
58% IEGR
TDC
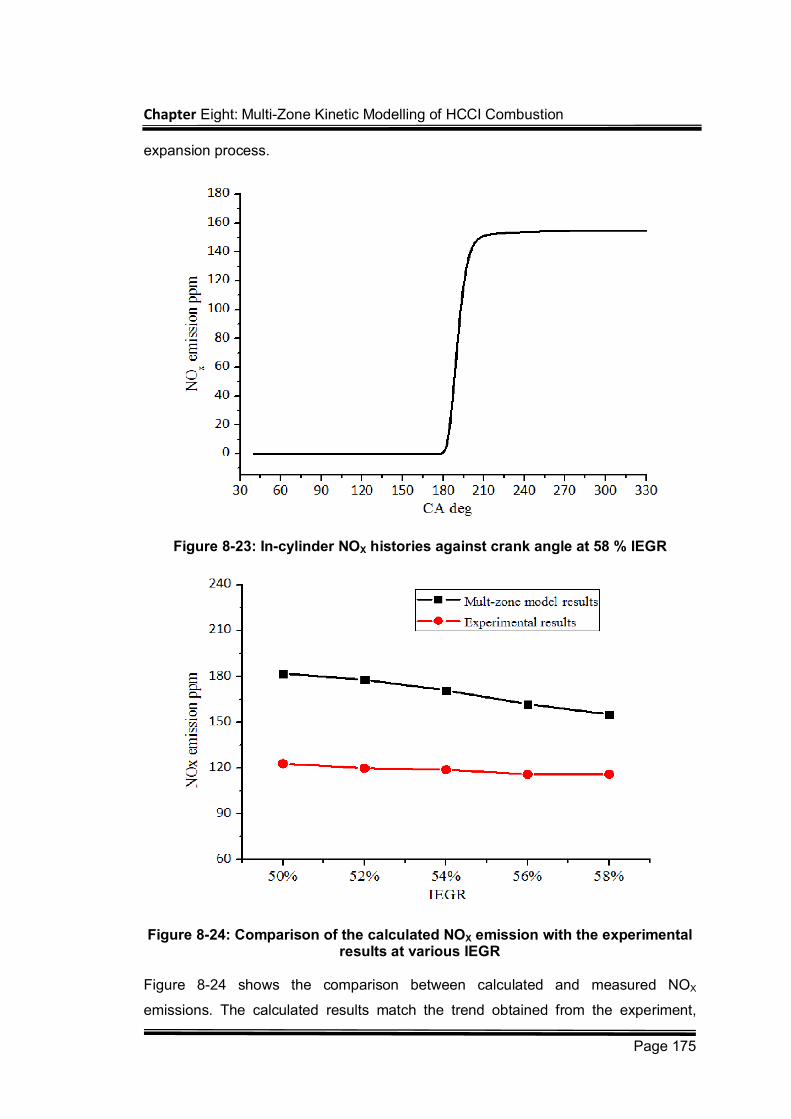
Chapter Eight: Multi-Zone Kinetic Modelling of HCCI Combustion
Page 175
expansion process.
Figure 8-23: In-cylinder NOX histories against crank angle at 58 % IEGR
Figure 8-24: Comparison of the calculated NOX emission with the experimental results at various IEGR
Figure 8-24 shows the comparison between calculated and measured NOX
emissions. The calculated results match the trend obtained from the experiment,
Chapter Eight: Multi-Zone Kinetic Modelling of HCCI Combustion
Page 176
which is that NOx emission reduces as more IEGR is applied. Again, this attributes to
the fact that the more IEGR is applied, the peak average in-cylinder temperature
reduces as shown in Figure 8-21. The predicted NOX emission at various IEGR level
is overall higher than the measured results. The disagreement ought to attribute to
the overpredicted in-cylinder temperature, which may be because that heat transfer
across the zones is not included in the simulation, which will be addressed in the
future work.
8.4 Summary and Conclusions
A thermodynamic-based multi-zone model coupled with reduced chemical kinetics for
the simulation of HCCI combustion has been developed and reported in this chapter.
The model takes into account the effects of the boundary layer, crevice volume, and
blowby. In order to investigate the influences of in-cylinder inhomogeneity, the main
cylinder chamber has been divided into multiple core zones with various temperature
and composition. The mass and energy transfer across the zones is simulated by
balancing the calculated zone pressure. A reduced chemical kinetic mechanism was
implemented in each zone to simulate the HCCI combustion chemistry and emission
formation. An in-house code, the LUCKS_HCCI code in the LUCKS package was
employed to solve the coupled differential equations of the system. Measured IEGR
fraction, IEGR temperature, and inlet temperature of fresh engine charge are used in
a thermodynamic mixing model to calculate the initial gas mixture condition of the
simulation. The model was validated against experimental results at various Internal
Exhaust Gas Re-circulation (IEGR) levels and then used to analyze the thermal and
chemical effect of the IEGR on the HCCI combustion. The calculated results from the
developed model were compared with some experimental data at various IEGR level
in terms of in-cylinder pressure histories and emissions (HC, CO and NOX). Good
agreements have been obtained for pressure, and HC and CO emissions, and a
similar tendency has been identified for NOX emission.
Chapter Nine: Concluding Remarks
Page 177
Chapter Nine: Concluding Remarks
9.1 Summary
This research work has been concerned with the development, validation and
application of multi-zone chemical kinetic engine models in the simulation of
autoignition driven combustion in SI and HCCI engines. The contribution of this work
is primarily made to establish a mathematical model based on the underlying
physical and chemical principles of autoignition of the fuel-air mixture in SI and HCCI
engines. Then, a computer code package has been developed to numerically solve
the model. The developed model aims at improving the understanding of autoignition
behaviour under engine-like conditions and providing an investigative tool to
autoignition characteristics. Furthermore, as part of the ongoing program in the
research of free piston engines, the results of this work will significant aid in the
investigation and simulation of the constant volume autoignition applied in free piston
engines.
Autoignition has been closely related with gasoline engine combustion. Its role is
played either as a limitation to SI engines or a solution to HCCI engines. Autoignition
is a self-ignited combustion phenomenon that is kinetically driven by the chemical
reactions of fuel-air mixture. Autoignition occurs in different scenarios In SI and HCCI
engines. In SI engines, autoignition chemistry is initiated by chemical reactions with
heat release as the result of compression work from both piston upward motion and
flame front propagation. However, in HCCI engines, autoignition is applied as the
ignition approach, which is dominated by local chemical-kinetic reactions with no
requirement of flame propagation.
Chapter Nine: Concluding Remarks
Page 178
Therefore, chemical kinetics modelling has been implemented to study the kinetic
chemistry of autoignition that can be interpreted as a process of hydrocarbon
oxidation involving a series of chemical paths in chains. Chemical kinetics modeling
is a numerical tool to calculate the rate of this chemical process.
Multi-zone thermodynamic combustion modelling has been regarded as a functional
simulation approach to study the combustion process in IC engines and a decent
compromise between computation accuracy and efficiency. Integration of chemical
kinetics models into multi-zone models is therefore a potential modelling method to
investigate the chemical and physical processes of autoignition in SI and HCCI
engines. The benefits of multi-zone chemical kinetics modeling can be summarized
as
In contrast to the single zone models, the multi-zone approach takes account
of inhomogeneity of the in-cylinder mixture such as temperature, composition
etc.
By adopting a model for blowby, the multi-zone approach can capture the
effect of blowby on the combustion process.
Zone division of the cylinders includes the crevice and boundary layer so that
the effect of these regions on combustion can be captured and investigated.
Multi-zone modelling is capable to describe the processes of heat transfer
and mass transfer across in-cylinder regions with different properties.
Multi-zone modelling represents much lower computational cost in
comparison with the CFD approach.
When coupled with chemical kinetics models, multi-zone modelling is
competent to depict the chemical process of autoignition so that the major
characteristics of autoignition such as ignition timing and heat release rate
etc. can be predicted. With chemical kinetics modelling, in addition, emissions
e.g. CO and HC can be better modelled in multi-zone models.
The major assumptions made and principles applied to establish the mathematical
model for multi-zone chemical kinetics modeling are summarized as:
The cylinder volume is split into a series of zones of different thermal and
composition properties.
Each zone is treated as a variable volume combustion reactor, filled with
Chapter Nine: Concluding Remarks
Page 179
homogeneous mixtures that act as a perfect gas, to which kinetic chemistry
and mass and energy conservation are applied
The multi-zone engine model handles distribution of temperature and
composition through setting different initial temperatures and compositions in
each zone.
Pressure is assumed spatially uniform throughout the cylinder.
The zones can interact with each other through compression work, heat and
mass transfer.
In HCCI combustion, compression work is caused by the
expansion work of hotter zones on the colder zones. However, in
SI engine combustion, compression work originates from both
upward piston motion and flame propagation.
In HCCI combustion, mass is transferred from high-pressure
zones to low-pressure zones to balance the zone pressure and in
SI engines, mass is entrained by the flame front and transferred
from unburned zone to burned zone
Heat transfer between in-cylinder mixtures and the cylinder wall is
considered in the type of convection in HCCI engine combustion
and convection and radiation in SI engine combustion.
The code package of LUCKS (Loughborough University Chemical Kinetics
simulation) has been developed for the numerical solution of the system equations.
The LUCKS code has been designed with inclusion of the following modeling
features:
Combustion system with the volume being a specified function of time
parameters (e.g. IC engines)
Simulation of open combustion systems via modelling of blowby
Multi-zone modelling of inhomogeneity of in-cylinder gas mixture (burned,
burning and unburned zones for SI engines and crevice zone, boundary layer
and core zones for the HCCI engines)
Modelling the effects of IEGR on combustion and pollutant formation in HCCI
engines
Chapter Nine: Concluding Remarks
Page 180
Simulation of locally homogeneous gas-phase chemical kinetics
Compatible with either detailed or reduced chemical kinetic mechanisms
In the development of the LUCKS code, the following design principles are applied to
make the code efficient and easy-to-use.
The code is well-structured and object-oriented, which make it easy to
maintain and build upon for the subsequent users and developers, and written
using open source FORTRAN77/99 to make code transportable between
computers s
Where possible, the code is programmed to have modular structures so that
increasing functionalities can be easily added and /or replaced with.
The code is commented on the code usage and the references that indicate
the methodologies used.
The code is designed to be applied across platforms so that it can be
compiled and executed under both Windows and UNIX systems.
The well-established DVODE code is applied to solve the initial value
problems in both stiff and non-stiff ODEs systems.
The LUCKS code is first applied to investigate knock phenomenon in SI engines. The
model is based on a three-zone approach (unburned, burning and burned zones).
Wherein, chemical kinetics models are applied in both burned and unburned zones.
The burning zone is modelled by an equilibrium combustion thermodynamic model.
Major contributions and findings from the study include:
The Tanaka’s reduced chemical kinetics model for a commercial gasoline fuel
with an RON of 95 has been modified and applied. Enhancement of the
reaction rate constants of R6 and R18 has been justified to enable the model
to simulate autoignition under SI combustion. Analysis results showed that
the enhance factor of 6.0 has most obvious effect on the major autoignition
characteristics.
Applying the chemical kinetics model provides simulation of both pre-flame
chemistry and post-flame heat release
The burning zone is modelled by an equilibrium combustion thermodynamic
model using the STANJAN code.
Chapter Nine: Concluding Remarks
Page 181
A novel knock detection and process method has been developed to analyze
the recorded cylinder pressure to identify the knocking cycles and determine
the knock timings.
The simulated results at various AFRs and compression ratios have been
validated against experimental results with good agreements being achieved
and the following facts revealed
For the engine used in the research at a fixed engine speed (1500
rpm) and spark timing (9o BTDC), the A/F ratio of 11 is found to be the
critical point for autoignition occurrence and the A/F ratios of 11 to 13
is indentified as the engine knock region.
At knock conditions (fuel rich conditions in this work), as A/F ratios
increase, the peak pressure and intensity rise and knock position
advances.
Both the experimental and simulation results verify the delayed knock
position, abated peak pressure and reduced knock intensity as engine
speed increase.
The calculation results quantitatively describe the effect of the autoignition of
the end gas on accelerating the burned mass fraction and shortening the
overall combustion duration.
The model shows the potential in analyzing the relationship among ignition
timing, intake boost pressures and knocks, which reveals the followings
Intake pressure boost leads to advanced knocking timing, shortened
combustion duration and boosted knock intensity.
As spark timing retards, the knock timing delays and knock is avoided
at a critical point. Spark ignition retardation also results in delayed
knocking timing, extended combustion duration and depressed knock
intensity.
The LUCKS code is also applied to simulate the combustion process in HCCI
engines. Major contributions and findings from the study include:
The model takes into account the effects of the boundary layer, crevice
volume and blowby.
Chapter Nine: Concluding Remarks
Page 182
In order to investigate the influence of in-cylinder inhomogeneity, the main
cylinder chamber has been divided into multiple core zones with various
temperature and composition.
The mass and energy transfer across the zones is simulated by balancing the
calculated zone pressure.
A reduced chemical kinetic mechanism was implemented in each zone to
simulate the HCCI combustion chemistry and emission formation. A
submechanism for the NOX simulation is added to the reduced model, which
is verified that has little effect on major autoignition characteristics.
Measured IEGR fraction, IEGR temperature and inlet temperature of fresh
engine charge are used with a thermodynamic mixing model to calculate the
initial gas mixture conditions of the simulation.
In description of the physical behaviour of the in-cylinder mixture, the model
reveals the followings
Autoignition occurs first in the innermost and hotter core zone and
propagate subsequently to the outer and colder zones. No autoignition
occurs in both the boundary layer and the crevice zone as a result of
locally low temperatures.
The locally low temperature in the boundary layer and crevice zone
attribute to the high heat loss rate to the cylinder wall due to the high
contact area ratios between the two zones and the cylinder wall, and
less thermal effect from the IEGR owing to the lower IEGR fraction in
these two zones.
The modelling results quantitatively illustrate the mass transfer
process inside the combustion chamber. During the combustion, the
mass in the core zones flow in to the boundary layer and the crevice
zone owing to the local pressure difference. With ignition subsequently
occurring, mass is compelled out of the inner core zones to the outer
core zone during the early combustion phase. As autoignition
proceeds into the outer core zones, the burst of the zone pressure
leads to the backward mass flow to the inner core zones. The mass in
the boundary layer and the crevice keep increasing during the
combustion phase until all the core zones ignite their mixtures and
Chapter Nine: Concluding Remarks
Page 183
then gases starts flowing back to the inner core zones. During the
expansion, the mass from the crevice flows into the boundary layer
leading to the mass increase in the boundary layer, which consists of
unreacted and partially reacted mixtures that are regarded as the main
source of the HC and CO emission.
The model was validated against experimental results at various Internal
Exhaust Gas Re-circulation (IEGR) levels and then used to analyze the
thermal and chemical effect of the IEGR on the HCCI combustion and
emissions, which reveals the followings
As the IEGR amount increases, peak cylinder pressure rises and the
peak pressure position advances as result of the thermal effect of
IEGR on the in-cylinder mixture
The CO emission distribution over the zones is simulated. The CO
fraction in each core zone peaks with autoignition occurrence and
then reaches a low level due to further oxidation to CO2 at high
temperature. In the expansion stroke, fuel oxidation freezes in the
boundary layer and the crevice zone resulting in a high concentration
of CO and the unreacted and partially reacted mixtures trapped in the
boundary layer and the crevice during the main combustion flowing
back to the core zones cause the late increase of CO in the outer core
zones.
The overall CO fraction reaches the peak value during the major
combustion and levels off during the expansion stroke. As the mixture
is cooled down further, the HC in the outflow from the boundary layer
contributes to the further formation of CO in the later expansion
stroke.
The CO concentration increases at higher IEGR owing to the dilution
effect of IEGR on the engine charge, which leading to the decrease of
the overall combustion temperature and therefore a reduction of
oxidation of CO.
The majority of the formed HC in core zones have been oxidized
during the main combustion event. However, the HC concentration
remains high in the boundary layer and the crevice.
Chapter Nine: Concluding Remarks
Page 184
The calculation results of the overall HC concentration indicate that
the major portion of the hydrocarbon species are fast consumed
during the main combustion, then a small part of HC is further oxidized
during the expansion stroke, and HC concentration reaches a lowest
level at EVO.
A potential optimum IEGR level of approx 54% between 50% and 58%
is observed for the lowest HC emission, at which the thermal and
diluting effects of IEGR that play contrary roles in affecting the
combustion reaches a balance in determining HC formation.
Higher NOX concentration exists in the core zones with higher
temperature and almost no NOX species in the boundary layer and the
crevice due to the low local temperatures.
The overall NOX starts to build up at the beginning of combustion and
then reach the peak value at the end of combustion and stays at the
peak value till the end of the expansion process.
NOX emission reduces as more IEGR is applied owing to the fact that
the more IEGR is applied, the peak average in-cylinder temperature
reduces.
Good agreements between modelling results and experimental data
have been obtained for pressure, and HC and CO emissions, and a
similar tendency has been identified for NOX emission.
9.2 Recommendation for Future Work
The work in this research has though provided the practicability and feasibility of
incorporation of chemical kinetics model into thermodynamic engine models.
However, it is still at the early stage of its evolution to develop the research work into
a successful and enduring product in respect of its integrity, validation and efficiency.
Based on the experience gained from doing this work, I would like to make the
following recommendations to the future work in view of both the establishment of the
numerical model and the development of the LUCKS code.
As for mathematical model, the following aspects may be considered in the future
Chapter Nine: Concluding Remarks
Page 185
work to expand and strengthen the results
First, in the SI model, the burned mass fraction model currently applied is of
an empirical form, which is originally developed at normal engine operation
conditions and specified engine specification. However, when applied for
knocking conditions, the flame front accelerates in a much higher speed in
comparison with normal. It thus necessitates a flame propagation model that
has the engine specification and operating conditions involved, e.g. laminar
flamelet models and turbulent flame propagation models.
Second, the heat transfer across the flame front in the SI model is estimated
using a heat convective model whose correlation was not originally developed
for such scenario, which leads to the lack of confidence in the use of such a
model for the prediction. Research on heat transfer across the flame front is
thus is essential and should be carried out by the subsequent researchers.
Third, addition of a boundary layer model should be able to improve the
modelling accuracy, especially when the emissions are studied. This is
because the modelling of temperature distribution adjacent to the cylinder wall
has strong effect on heat transfer. In the HCCI model, a constant boundary
layer thickness is assumed, which diverges from real scenario, in which the
thickness varies as the engine operates. Since the boundary layer has a big
influence on the formation of HC and CO and thermally affects the heat
conductivity of in-cylinder charge to the cylinder wall, a more advanced model
for layer thickness is requisite for improving modelling accuracy.
Fourth, a crevice model involving the simulation of piston ring pack can also
be considered a part of future work. In the current HCCI model, the volume of
crevice zone is modelled as a fixed portion of cylinder clearance volume,
which is a generally empirical evaluation with oversimplification by ignoring
the existence of the piston ring pack in the crevice structure.
Fifth, a reduced chemical kinetics model was applied in for both SI and HCCI
engine simulation for the sake of saving of computation time and source.
However, a chemical kinetics model involving more reactions and species
may better reflect the nature chemical process in terms of reaction rates.
Furthermore, it is of interest to investigate the relations of mechanism sizes
with computation time scales and simulation accuracy.
Chapter Nine: Concluding Remarks
Page 186
In general, the current models need further validation across a wider range of
engine operation conditions and on a variety of engines with different
specifications, before it can be considered a reliable and effective tool that
can be applied to the real engine design.
As for development of the LUCKS code, I would like to suggest:
First, at some point, the code is better off being openly released and
distributed to the researchers and organizations that will have their practical
use of the code. This will surely help maturing the code though gathering the
advices and suggestions, which can be called collaborative source
development
Second, Graphical User Interface (GUI) allows quick and easy
implementation of the models, which facilitates the establishment of modelling
cases and increases the productivity for both non-expert and expert users.
This work may involve the transformation of language of the code to GUI
scripting languages like C++.
In general, the LUCKS code should be of a goal to evolve into commercial
publication, as only with commercial support, the work of developing the code
can gain its requisite manpower and resource and have its value
acknowledged through its practical application in the industry.
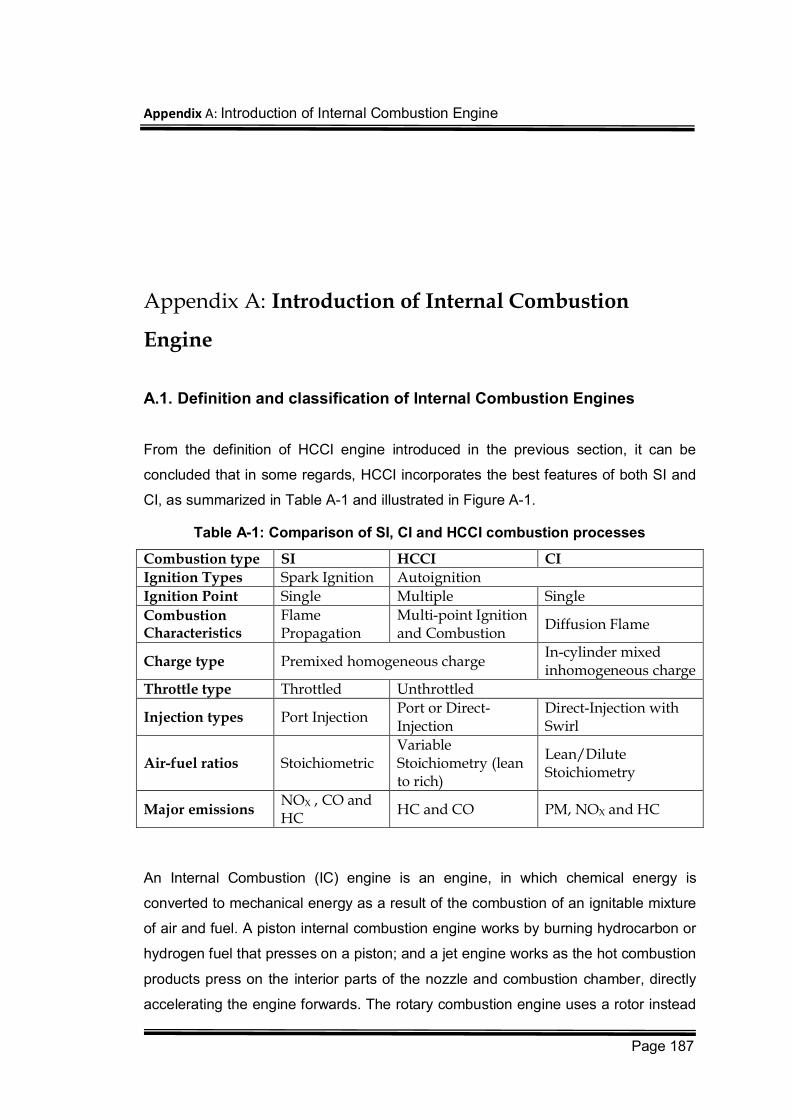
Appendix A: Introduction of Internal Combustion Engine
Page 187
Appendix A: Introduction of Internal Combustion
Engine
A.1. Definition and classification of Internal Combustion Engines
From the definition of HCCI engine introduced in the previous section, it can be
concluded that in some regards, HCCI incorporates the best features of both SI and
CI, as summarized in Table A-1 and illustrated in Figure A-1.
Table A-1: Comparison of SI, CI and HCCI combustion processes
Combustion type SI HCCI CI
Ignition Types Spark Ignition Autoignition
Ignition Point Single Multiple Single
Combustion Characteristics
Flame Propagation
Multi-point Ignition and Combustion
Diffusion Flame
Charge type Premixed homogeneous charge In-cylinder mixed inhomogeneous charge
Throttle type Throttled Unthrottled
Injection types Port Injection Port or Direct-Injection
Direct-Injection with Swirl
Air-fuel ratios Stoichiometric Variable Stoichiometry (lean to rich)
Lean/Dilute Stoichiometry
Major emissions NOX , CO and HC
HC and CO PM, NOX and HC
An Internal Combustion (IC) engine is an engine, in which chemical energy is
converted to mechanical energy as a result of the combustion of an ignitable mixture
of air and fuel. A piston internal combustion engine works by burning hydrocarbon or
hydrogen fuel that presses on a piston; and a jet engine works as the hot combustion
products press on the interior parts of the nozzle and combustion chamber, directly
accelerating the engine forwards. The rotary combustion engine uses a rotor instead
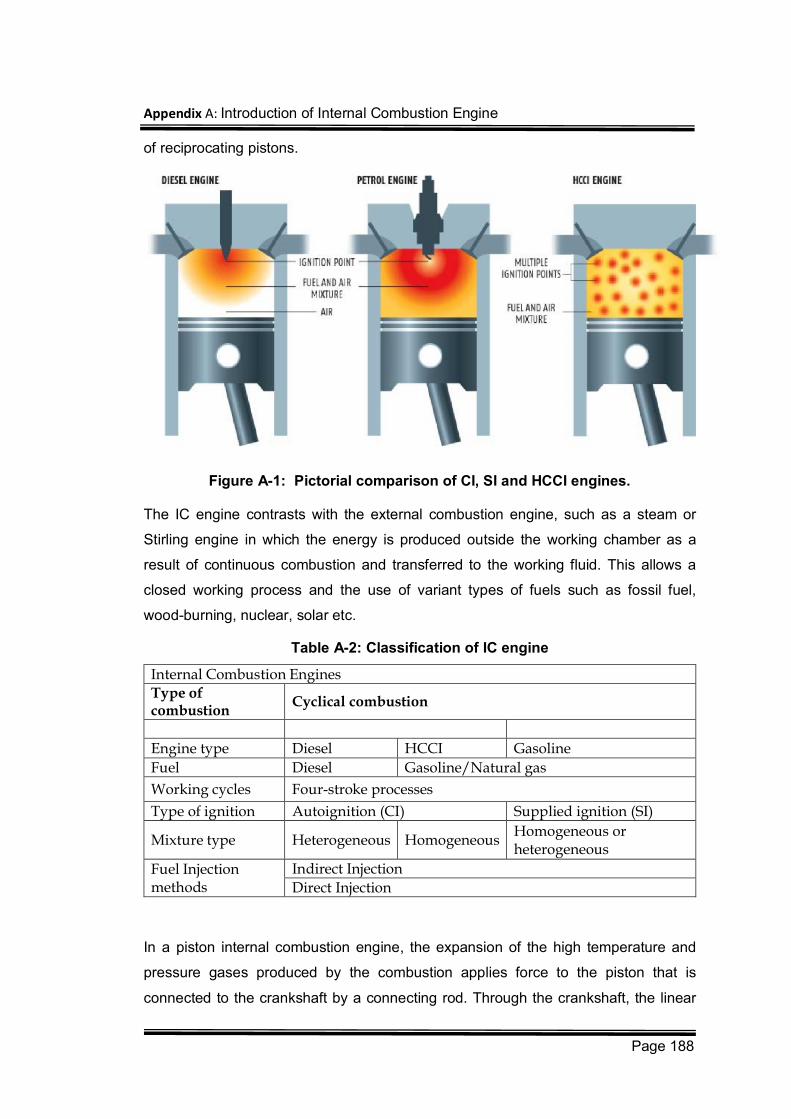
Appendix A: Introduction of Internal Combustion Engine
Page 188
of reciprocating pistons.
Figure A-1: Pictorial comparison of CI, SI and HCCI engines.
The IC engine contrasts with the external combustion engine, such as a steam or
Stirling engine in which the energy is produced outside the working chamber as a
result of continuous combustion and transferred to the working fluid. This allows a
closed working process and the use of variant types of fuels such as fossil fuel,
wood-burning, nuclear, solar etc.
Table A-2: Classification of IC engine
Internal Combustion Engines
Type of combustion
Cyclical combustion
Engine type Diesel HCCI Gasoline
Fuel Diesel Gasoline/Natural gas
Working cycles Four-stroke processes
Type of ignition Autoignition (CI) Supplied ignition (SI)
Mixture type Heterogeneous Homogeneous Homogeneous or heterogeneous
Fuel Injection methods
Indirect Injection
Direct Injection
In a piston internal combustion engine, the expansion of the high temperature and
pressure gases produced by the combustion applies force to the piston that is
connected to the crankshaft by a connecting rod. Through the crankshaft, the linear
Appendix A: Introduction of Internal Combustion Engine
Page 189
motion of the piston is converted into rotational motion. The crankshaft in turn, turns
the car's gears, which turns the car's wheels.
There is a wide range of internal combustion engines corresponding to their many
varied applications. Likewise there is a wide range of ways to classify internal-
combustion engines, some of which are listed below.
IC Engines can and are classified in wide range of ways, by combustion process, by
the working cycles, by the source of energy, mixture generation system, or by
charging system and etc. Some of them are listed in Table A-2
A.2. Engine Types
Among the combustion processes, classification is made primarily between Spark
Ignition (SI) for gasoline engines and Compression Ignition (CI) for both diesel engine
and HCCI engines. The term SI engine is used to refer to a combustion engine in
which combustion of the compressed fuel and air mixture is ignited by means of
synchronized extraneous ignition. In the diesel engine, on the other hand, the liquid
fuel injected into combustion chamber mixes with the air charge previously heated by
means of compression and auto-ignites at a sufficiently high temperature.
Homogenous Charge Compression Ignition (HCCI) process is a promising alternative
to combustion in SI and CI and considered as the third definitive class of the IC
engine. To achieve HCCI combustion, the engine generally needs to run on a lean,
diluted mixture of fuel, air, and combustion products. The mixture is compressed by
upward moving piston to a temperature sufficiently to support the production of
chemical species, which follows the self-ignition processes [45,46,59]
A.2.1. SI Engines
In a conventional four-stroke SI engine, the fuel is mixed with air in the intake system
to form a premixed homogeneous charge with equivalence ratio around stoichiometry
and then compressed by the piston. Under normal operating conditions, the fuel and
air mixtures are initiated in the combustion chamber at the precise moment towards
the end of the compression stroke at the spark plug by an electric discharge. When
the spark plug fires, a flame kernel is formed, and then the kernel continues to grow
into a fully developed self-sustained flame and propagates through the homogenous
charge. As flame propagates, the flame front, a thin flamelet involving intense
chemical reaction, is a high temperature region, which leads to significant NOX
Appendix A: Introduction of Internal Combustion Engine
Page 190
formation in the post -flame [3,4,5].
When flame propagation speeds exceeds a limited value, the end-gas is compressed
by both the propagating flame front and upward moving piston to a sufficiently high
pressure and temperature for fuel oxidation to spontaneously occur, which starts with
pre-flame chemistry and ends with rapid energy release. This phenomenon is
generally termed as ‘autoignition’ [1]. Autoignition of the end-gas limits the
compression ratios in a position to achieve higher combustion efficiency and severe
autoignition leads to knock, deteriorates engine efficiency, and thereby increases
emissions.
Due to the homogenous mixture, SI engines have no PM emissions. However, as
introduced early, the high temperature of the propagating flame leads to the
formation of NOX emissions in both the flame front and the post-flame gases.
Usually, the term ‘NOX’ indicates the nitric oxide (NO) and nitrogen dioxide (NO2),
between which the former one is the predominant component of NOX. It has been. It
has been generally accepted that the extended Zeldovich mechanism presents the
principal reactions governing the formation of NO [1].
CO emission in the SI engines is controlled by the fuel-air equivalence ratios. In the
exhaust of rich-running engines at full load, CO appears because there is insufficient
oxygen to convert all the carbon in the fuel to CO2. CO formation is unavoidable and
in the untreated exhaust CO, concentration is the highest of all emissions.
Table A-3: Primary sources for hydrocarbon emissions in SI engines [217].
Source Unburned Fuel from normal combustion (%)
Unburned fuel leaving with the exhaust (%)
Crevice 5.2 0.76
Liquid Fuel 1.2 0.40
Oil Layer 1.0 0.32
Deposits 1.0 0.32
Exhaust Valve Leakage 0.1 0.10
Flame Quench 0.5 0.10
Total 9.0 2.0
Unburned Hydrocarbon (UHC) emission representing the unburned fuel in the
exhaust gases are the consequence of incomplete combustion of hydrocarbon fuel.
In SI engines, nearly 9% of the fuel supplied to an engine is not burned during the
major combustion phase. Most of this unburned fuel is consumed by the post
Appendix A: Introduction of Internal Combustion Engine
Page 191
combustion oxidation during the power expansion stroke, including oxidation in the
exhaust port during the blow down process. However, approximately 2% of total fuel
still exists with the exhaust, including partial reaction products, such as acetaldehyde,
formaldehyde, 1, 3 butadiene, and benzene, etc. [217].
Hydrocarbon emissions represent a decrease in engine thermal efficiency and main
air pollutions. Six main sources of UHC emissions are summarized in Table A-3
Combustion chamber crevices – the narrow regions in the combustion chamber
into which the flame cannot propagate because they are smaller than the quenching
distance. Crevices represent about 1 to 3% of the clearance volume. Combustion
chamber crevices are major sources of UHC emissions, responsible for about 40% of
the UHC. Of the combustion chamber crevices, the piston upper crevice volume is
the main contributor to engine-out HC emissions. In general, the sensitivity of the
UHC emissions to the combustion-chamber crevices is influenced strongly by the in-
cylinder flow field and combustion, which influence the concentration of burned gases
in the crevice gases. UHC can further be oxidized during the exhaust stroke when
the UHC emit from the crevices and through 3-way catalyst after treatment [6].
Liquid fuel – For some fuel injection systems there is a possibility that liquid fuel is
introduced into the cylinder past an open intake valve. The less volatile constituents
in the fuel may not vaporize (especially during engine warm-up) and be trapped in
the crevices and carbon deposits.
Oil layers - Since the piston rings cannot absolutely seal against the cylinder to
preventing oil migration into the cylinder above the piston, the lubricating oil layer
exists on the cylinder liner and cyclically absorbs and desorbs the fuel, which is
suggested as a significant source of unburned hydrocarbon emissions from spark
ignition engines.
Deposits – Carbon deposits build up on the valves, cylinder, and piston crown.
These deposits are porous with pore sizes smaller than the quenching distance, with
in which trapped fuel cannot burn.
Exhaust valve leakage- Exhaust valves that are normally closed may leak UHC
directly into the exhaust port.
Quenching – Most of the hydrocarbon contained in the wall quench layer diffuse into
the hot combustion products outside the layer and are consumed during the post
combustion oxidation processed. However, bulk gas quenching can occur during the
Appendix A: Introduction of Internal Combustion Engine
Page 192
decompression and blow down processes when the temperature drops to a low
enough level.
A.2.2. CI engine
Combustion in CI engines is characterized by the following features. The liquid fuel is
injected under high pressure towards the end of the compression stroke, normally
shortly before Top Dead Center (TDC), directly into the main (Direct Injection)
combustion chamber, or, on older engines, into a pre-chamber (indirect injection).
The spray formation, droplet evaporation, and the mixing of fuel vapour with highly
compressed air to create ignitable mixture all occurs in a high temperature and high-
pressure environment [216]. Due to the high compression ratios (14 -22) applied in
CI engine, the gases mixture near the end of compression reaches a temperature
high enough so that the fuel autoignites very soon after injection starts. The period
between the start of injection and autoignition is called the ignition delay [9]. As the
CI engine applies inner mixture formation, the load control of CI engine is achieved
via the supplied fuel quantity with the unthrottled and inducted air [216]. The
employment of high compression ratios in CI engine leads to the combustion
efficiency of CI is up to 40% larger than SI engines [6]
Because of the inhomogeneity of the mixture from charge stratification, there are
zones inside the combustion chamber with air-fuel ratios that are less than one. In
these areas, high concentrations of CO arise during the main combustion reaction
and usually largely re-oxidized later in the combustion process using the excess air
[216]. In contrast to SI engines, CI engines, except being operated fuel rich, benefit
from substantially lower specific carbon monoxide emissions
A few factors are believed to be primary sources for UHC emission in CI engines.
Firstly, the fuel trapped in the injector at the end of injection that incompletely mixes
with the air. Then, the mixing of fuel and air occurs outside the main burning area,
which leads to the regions with too low air-fuel ratios to be burned. Some of this fuel
makes its way out the exhaust. Finally, some fuel is trapped along the walls by
crevices, deposits, or oil due to impingement by the spray. Owe to the combustion
efficiency and high in-cylinder temperature in CI engines, the UHC emissions are
usually much lower compared with SI engines.
While the operational advantages of CI engines are clear regarding combustion
efficiency, CO, and UHC emissions, CI engines are a major contributor to NOX and
Appendix A: Introduction of Internal Combustion Engine
Page 193
PM emissions. NOX formation is very susceptive to high temperature, so the high
temperature regions in CI engines provide the circumstance for the reaction of O-N-
NOX to occur. NOX is usually formed in the high temperature regions at the diffusion
flame interface where both oxygen and nitrogen are available and in the post-
combustion hot gas regions while fuel rich oxidation in some regions produces
elevated particulate concentrations. As temperature is proportional to load in a CI
engine, more NOX is formed as the load increases. [218]. The most part of PM
emissions from CI engines consists of the unburned hydrocarbon, hydrocarbon
compound and sulphites particles resulting from the inhomogeneous fuel rich
regions.
A.2.3. HCCI combustion
The homogenous charge is used in SI engines where a pre-mixed (homogenous)
charge is inducted into the cylinder and that mixture is then ignited using a spark.
Inside of a CI engine, only fresh air is brought into the cylinder and then fuel is
directly injected into the hot compressed air when the piston is near its top position.
The fuel injected initially mixes with the hot air and auto-ignites; then the
subsequently injected fuel is sprayed into the hot charge and burns as a diffusion
flame. HCCI combines those two ideas and creates a third combustion system. The
main difference between the three systems is the control of the combustion. In both
SI and CI engines, there is an event, which triggers the combustion (spark timing in
SI and injection timing in CI). Such a definitive triggering event is lacking in HCCI,
which is controlled by combustion chemical kinetics and the charge thermal
environment.
A.3. Fuel
IC engines generally uses fossil in the form of gas, liquid or solid. The classification
of major fuels that can be combusted in the IC engine is shown Table A-4. The fuels
applied in the SI and CI engine.
Gasoline and diesel are primarily used as fuels in IC engines. Gasoline engines are
used in most other road vehicles including most cars, motorcycles, and mopeds.
Diesel engines are generally heavier, noisier, and more powerful at lower speeds
than gasoline engines. They are also more fuel-efficient in most circumstances and
are used in heavy road vehicles, some automobiles (increasingly so for their
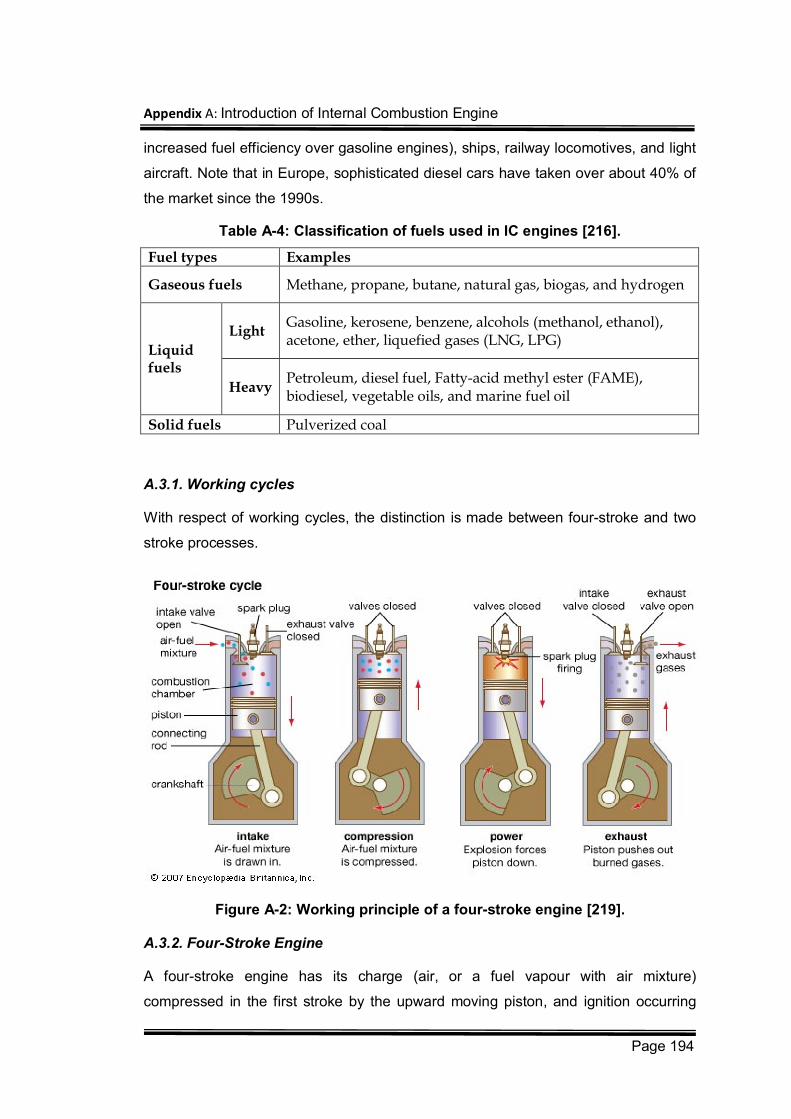
Appendix A: Introduction of Internal Combustion Engine
Page 194
increased fuel efficiency over gasoline engines), ships, railway locomotives, and light
aircraft. Note that in Europe, sophisticated diesel cars have taken over about 40% of
the market since the 1990s.
Table A-4: Classification of fuels used in IC engines [216].
Fuel types Examples
Gaseous fuels Methane, propane, butane, natural gas, biogas, and hydrogen
Liquid fuels
Light Gasoline, kerosene, benzene, alcohols (methanol, ethanol), acetone, ether, liquefied gases (LNG, LPG)
Heavy Petroleum, diesel fuel, Fatty-acid methyl ester (FAME), biodiesel, vegetable oils, and marine fuel oil
Solid fuels Pulverized coal
A.3.1. Working cycles
With respect of working cycles, the distinction is made between four-stroke and two
stroke processes.
Figure A-2: Working principle of a four-stroke engine [219].
A.3.2. Four-Stroke Engine
A four-stroke engine has its charge (air, or a fuel vapour with air mixture)
compressed in the first stroke by the upward moving piston, and ignition occurring
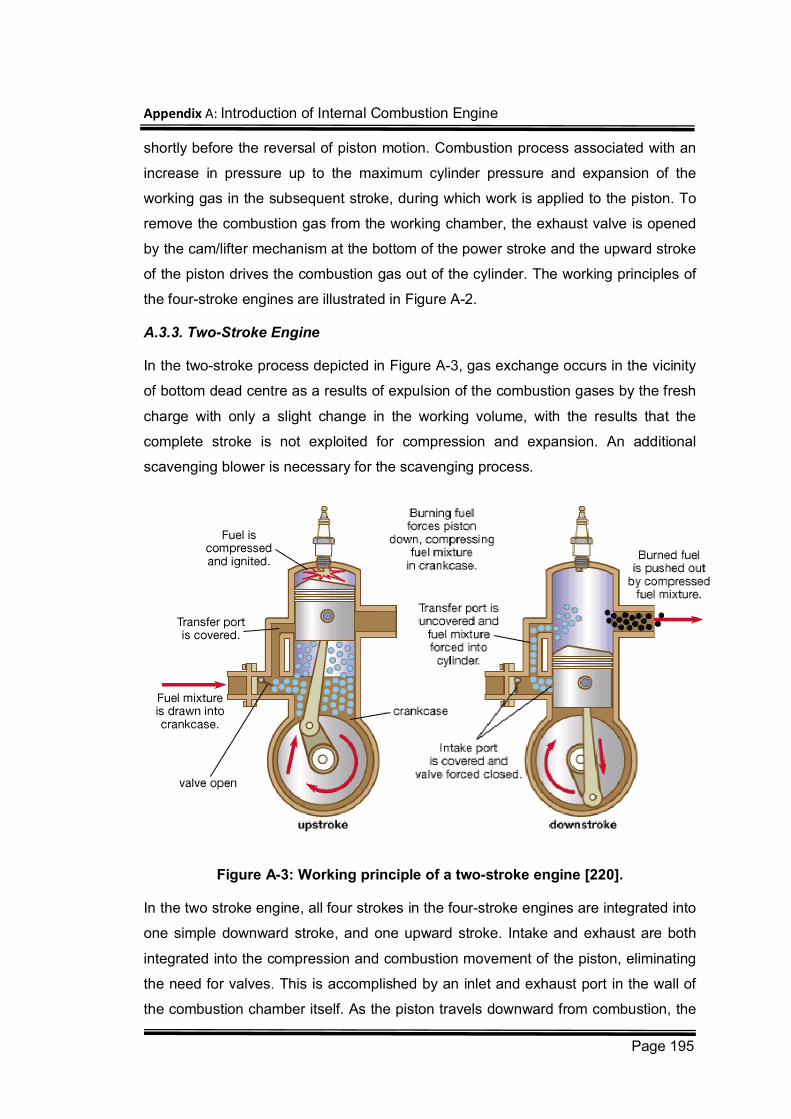
Appendix A: Introduction of Internal Combustion Engine
Page 195
shortly before the reversal of piston motion. Combustion process associated with an
increase in pressure up to the maximum cylinder pressure and expansion of the
working gas in the subsequent stroke, during which work is applied to the piston. To
remove the combustion gas from the working chamber, the exhaust valve is opened
by the cam/lifter mechanism at the bottom of the power stroke and the upward stroke
of the piston drives the combustion gas out of the cylinder. The working principles of
the four-stroke engines are illustrated in Figure A-2.
A.3.3. Two-Stroke Engine
In the two-stroke process depicted in Figure A-3, gas exchange occurs in the vicinity
of bottom dead centre as a results of expulsion of the combustion gases by the fresh
charge with only a slight change in the working volume, with the results that the
complete stroke is not exploited for compression and expansion. An additional
scavenging blower is necessary for the scavenging process.
Figure A-3: Working principle of a two-stroke engine [220].
In the two stroke engine, all four strokes in the four-stroke engines are integrated into
one simple downward stroke, and one upward stroke. Intake and exhaust are both
integrated into the compression and combustion movement of the piston, eliminating
the need for valves. This is accomplished by an inlet and exhaust port in the wall of
the combustion chamber itself. As the piston travels downward from combustion, the
Appendix A: Introduction of Internal Combustion Engine
Page 196
exhaust port is exposed allowing the spent gasses to rush out of the chamber. The
downward stroke also creates suction that draws in new air/fuel through an inlet
located lower in the chamber. As the piston rises again, it blocks off the inlet and
port, compressing the gasses at the top of the chamber. The spark plug fires and the
process start over. Significantly, the engine fires on every revolution, giving the two
stroke its power advantage
Since the two stroke engine fires on every revolution of the crankshaft, a two stroke
engine is usually more powerful than a four stroke engine of equivalent size. This,
coupled with their lighter, simpler construction, makes the two stroke engine popular
in chainsaws, line trimmers, outboard motors, snowmobiles, jet-skis, light
motorcycles, and model airplanes.
Unfortunately, most two stroke engines are inefficient and are terrible polluters due to
the amount of unspent fuel that escapes through the exhaust port. The principle of
the operation of working cycle of two-stroke engines is illustrated in Figure A-3.
A.4. Ignition Types
The fuel-gas mixture in IC engines may be ignited by means of supplied ignition or
compression ignition. The supplied ignition is generally applied in gasoline engine,
which uses an electrical spark ignites the mixture in the cylinder, which thus is thus
termed as Spark Ignition (SI). By nature, petrol is a highly volatile liquid, but its self-
ignition temperature is high. Hence, for the combustion of this fuel a spark is
necessary to initiate its burning process. To generate this spark in SI engines, the
spark plug is placed in the cylinder head of the engine. The voltage is provided to the
spark plug either from the battery or from the magneto.
Compression Ignition (CI) is an autoignition-initiated combustion process, in which
the fuel injected ignites spontaneously in the air preheated by the piston
compression. The most prominent difference between spark ignition and
compression ignition engines is the type of fuel used in each. In SI engines, gasoline
is used as fuel; hence, these engines are also called gasoline engines. In CI engines,
diesel is used as fuel; hence, they are also called diesel engines. The self-ignition
temperature of diesel is comparatively lower. When diesel fuel is compressed to high
pressures,. its temperature also increases beyond the self-ignition temperature of the
fuel. Hence, in the case of CI engines, the ignition of fuel occurs due to compression
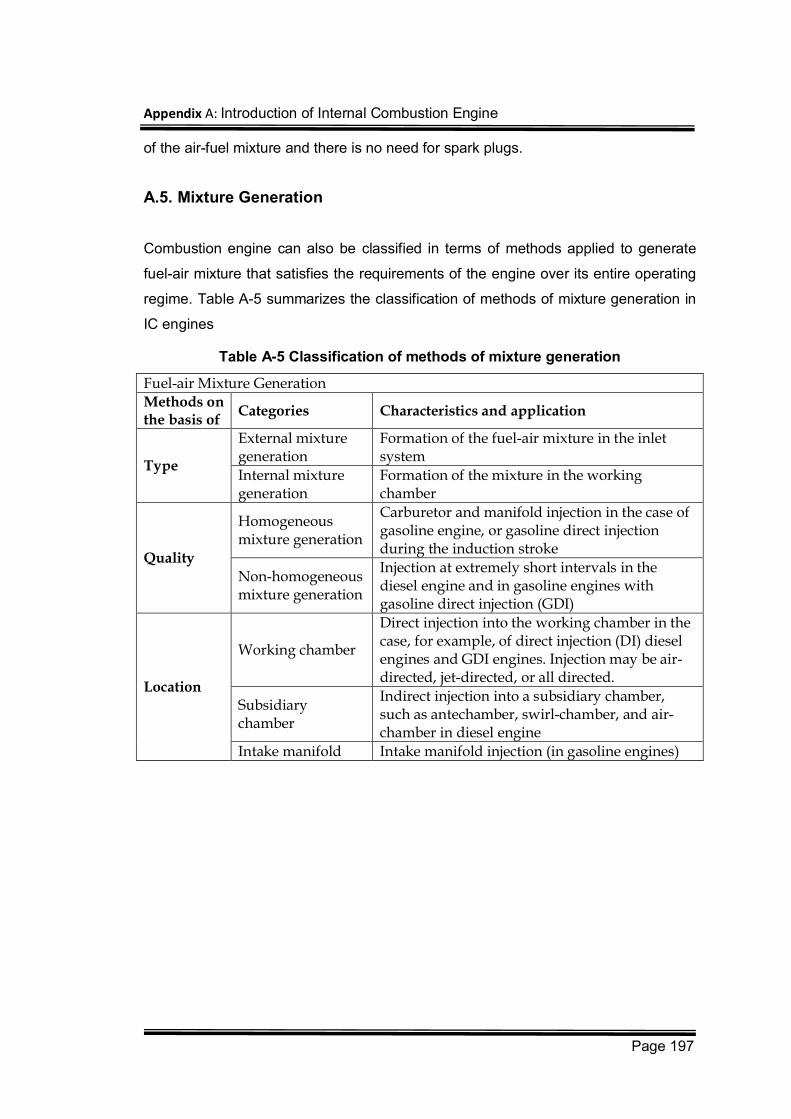
Appendix A: Introduction of Internal Combustion Engine
Page 197
of the air-fuel mixture and there is no need for spark plugs.
A.5. Mixture Generation
Combustion engine can also be classified in terms of methods applied to generate
fuel-air mixture that satisfies the requirements of the engine over its entire operating
regime. Table A-5 summarizes the classification of methods of mixture generation in
IC engines
Table A-5 Classification of methods of mixture generation
Fuel-air Mixture Generation
Methods on the basis of
Categories Characteristics and application
Type
External mixture generation
Formation of the fuel-air mixture in the inlet system
Internal mixture generation
Formation of the mixture in the working chamber
Quality
Homogeneous mixture generation
Carburetor and manifold injection in the case of gasoline engine, or gasoline direct injection during the induction stroke
Non-homogeneous mixture generation
Injection at extremely short intervals in the diesel engine and in gasoline engines with gasoline direct injection (GDI)
Location
Working chamber
Direct injection into the working chamber in the case, for example, of direct injection (DI) diesel engines and GDI engines. Injection may be air-directed, jet-directed, or all directed.
Subsidiary chamber
Indirect injection into a subsidiary chamber, such as antechamber, swirl-chamber, and air-chamber in diesel engine
Intake manifold Intake manifold injection (in gasoline engines)
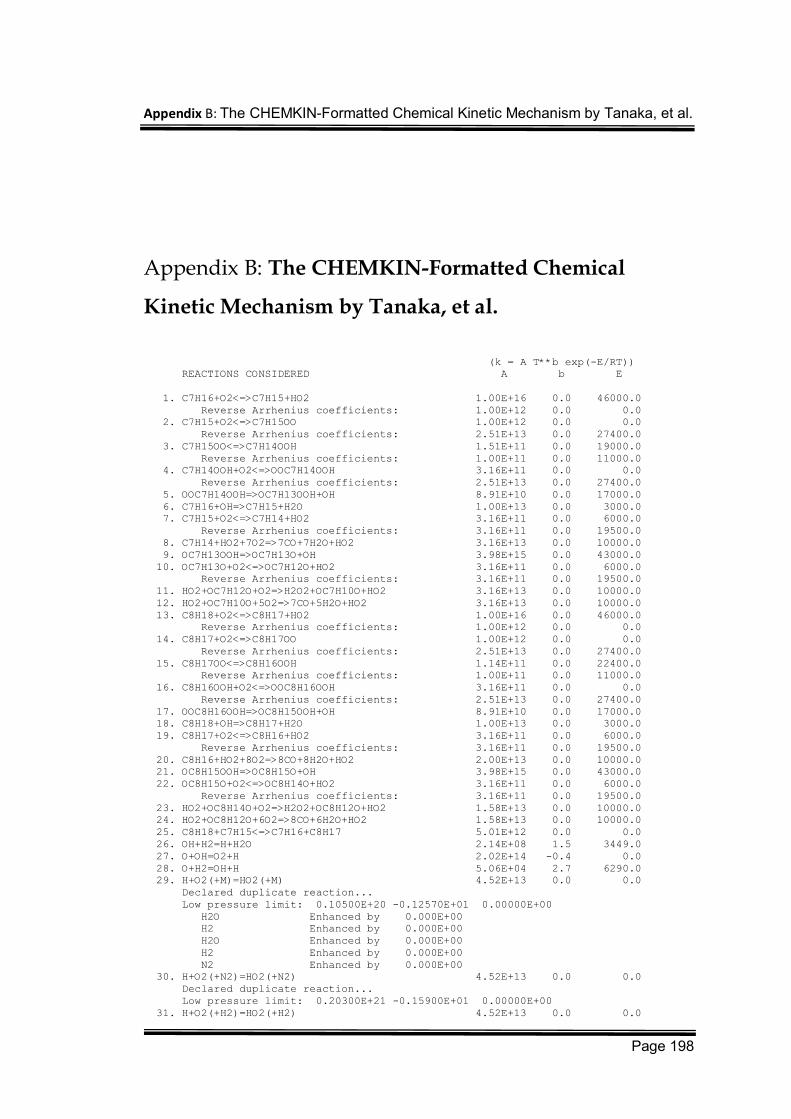
Appendix B: The CHEMKIN-Formatted Chemical Kinetic Mechanism by Tanaka, et al.
Page 198
Appendix B: The CHEMKIN-Formatted Chemical
Kinetic Mechanism by Tanaka, et al.
(k = A T**b exp(-E/RT)) REACTIONS CONSIDERED A b E 1. C7H16+O2<=>C7H15+HO2 1.00E+16 0.0 46000.0 Reverse Arrhenius coefficients: 1.00E+12 0.0 0.0 2. C7H15+O2<=>C7H15OO 1.00E+12 0.0 0.0 Reverse Arrhenius coefficients: 2.51E+13 0.0 27400.0 3. C7H15OO<=>C7H14OOH 1.51E+11 0.0 19000.0 Reverse Arrhenius coefficients: 1.00E+11 0.0 11000.0 4. C7H14OOH+O2<=>OOC7H14OOH 3.16E+11 0.0 0.0 Reverse Arrhenius coefficients: 2.51E+13 0.0 27400.0 5. OOC7H14OOH=>OC7H13OOH+OH 8.91E+10 0.0 17000.0 6. C7H16+OH=>C7H15+H2O 1.00E+13 0.0 3000.0 7. C7H15+O2<=>C7H14+HO2 3.16E+11 0.0 6000.0 Reverse Arrhenius coefficients: 3.16E+11 0.0 19500.0 8. C7H14+HO2+7O2=>7CO+7H2O+HO2 3.16E+13 0.0 10000.0 9. OC7H13OOH=>OC7H13O+OH 3.98E+15 0.0 43000.0 10. OC7H13O+O2<=>OC7H12O+HO2 3.16E+11 0.0 6000.0 Reverse Arrhenius coefficients: 3.16E+11 0.0 19500.0 11. HO2+OC7H12O+O2=>H2O2+OC7H10O+HO2 3.16E+13 0.0 10000.0 12. HO2+OC7H10O+5O2=>7CO+5H2O+HO2 3.16E+13 0.0 10000.0 13. C8H18+O2<=>C8H17+HO2 1.00E+16 0.0 46000.0 Reverse Arrhenius coefficients: 1.00E+12 0.0 0.0 14. C8H17+O2<=>C8H17OO 1.00E+12 0.0 0.0 Reverse Arrhenius coefficients: 2.51E+13 0.0 27400.0 15. C8H17OO<=>C8H16OOH 1.14E+11 0.0 22400.0 Reverse Arrhenius coefficients: 1.00E+11 0.0 11000.0 16. C8H16OOH+O2<=>OOC8H16OOH 3.16E+11 0.0 0.0 Reverse Arrhenius coefficients: 2.51E+13 0.0 27400.0 17. OOC8H16OOH=>OC8H15OOH+OH 8.91E+10 0.0 17000.0 18. C8H18+OH=>C8H17+H2O 1.00E+13 0.0 3000.0 19. C8H17+O2<=>C8H16+HO2 3.16E+11 0.0 6000.0 Reverse Arrhenius coefficients: 3.16E+11 0.0 19500.0 20. C8H16+HO2+8O2=>8CO+8H2O+HO2 2.00E+13 0.0 10000.0 21. OC8H15OOH=>OC8H15O+OH 3.98E+15 0.0 43000.0 22. OC8H15O+O2<=>OC8H14O+HO2 3.16E+11 0.0 6000.0 Reverse Arrhenius coefficients: 3.16E+11 0.0 19500.0 23. HO2+OC8H14O+O2=>H2O2+OC8H12O+HO2 1.58E+13 0.0 10000.0 24. HO2+OC8H12O+6O2=>8CO+6H2O+HO2 1.58E+13 0.0 10000.0 25. C8H18+C7H15<=>C7H16+C8H17 5.01E+12 0.0 0.0 26. OH+H2=H+H2O 2.14E+08 1.5 3449.0 27. O+OH=O2+H 2.02E+14 -0.4 0.0 28. O+H2=OH+H 5.06E+04 2.7 6290.0 29. H+O2(+M)=HO2(+M) 4.52E+13 0.0 0.0 Declared duplicate reaction... Low pressure limit: 0.10500E+20 -0.12570E+01 0.00000E+00 H2O Enhanced by 0.000E+00 H2 Enhanced by 0.000E+00 H2O Enhanced by 0.000E+00 H2 Enhanced by 0.000E+00 N2 Enhanced by 0.000E+00 30. H+O2(+N2)=HO2(+N2) 4.52E+13 0.0 0.0 Declared duplicate reaction... Low pressure limit: 0.20300E+21 -0.15900E+01 0.00000E+00 31. H+O2(+H2)=HO2(+H2) 4.52E+13 0.0 0.0
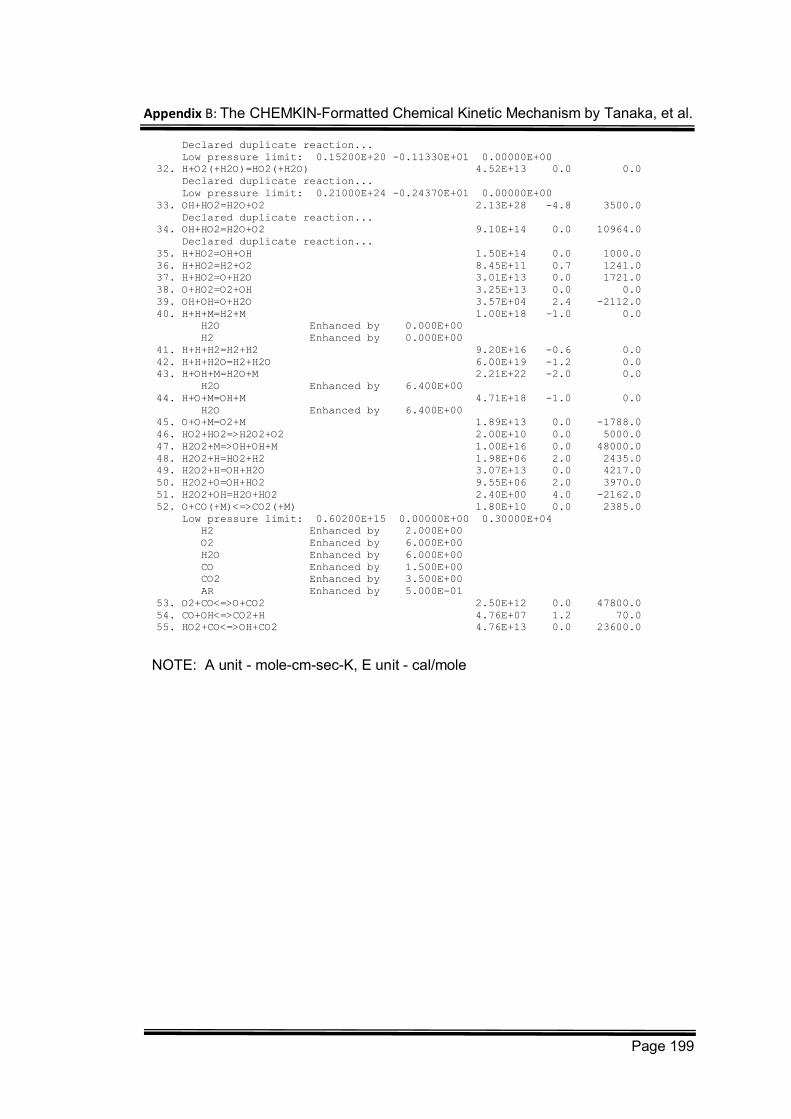
Appendix B: The CHEMKIN-Formatted Chemical Kinetic Mechanism by Tanaka, et al.
Page 199
Declared duplicate reaction... Low pressure limit: 0.15200E+20 -0.11330E+01 0.00000E+00 32. H+O2(+H2O)=HO2(+H2O) 4.52E+13 0.0 0.0 Declared duplicate reaction... Low pressure limit: 0.21000E+24 -0.24370E+01 0.00000E+00 33. OH+HO2=H2O+O2 2.13E+28 -4.8 3500.0 Declared duplicate reaction... 34. OH+HO2=H2O+O2 9.10E+14 0.0 10964.0 Declared duplicate reaction... 35. H+HO2=OH+OH 1.50E+14 0.0 1000.0 36. H+HO2=H2+O2 8.45E+11 0.7 1241.0 37. H+HO2=O+H2O 3.01E+13 0.0 1721.0 38. O+HO2=O2+OH 3.25E+13 0.0 0.0 39. OH+OH=O+H2O 3.57E+04 2.4 -2112.0 40. H+H+M=H2+M 1.00E+18 -1.0 0.0 H2O Enhanced by 0.000E+00 H2 Enhanced by 0.000E+00 41. H+H+H2=H2+H2 9.20E+16 -0.6 0.0 42. H+H+H2O=H2+H2O 6.00E+19 -1.2 0.0 43. H+OH+M=H2O+M 2.21E+22 -2.0 0.0 H2O Enhanced by 6.400E+00 44. H+O+M=OH+M 4.71E+18 -1.0 0.0 H2O Enhanced by 6.400E+00 45. O+O+M=O2+M 1.89E+13 0.0 -1788.0 46. HO2+HO2=>H2O2+O2 2.00E+10 0.0 5000.0 47. H2O2+M=>OH+OH+M 1.00E+16 0.0 48000.0 48. H2O2+H=HO2+H2 1.98E+06 2.0 2435.0 49. H2O2+H=OH+H2O 3.07E+13 0.0 4217.0 50. H2O2+O=OH+HO2 9.55E+06 2.0 3970.0 51. H2O2+OH=H2O+HO2 2.40E+00 4.0 -2162.0 52. O+CO(+M)<=>CO2(+M) 1.80E+10 0.0 2385.0 Low pressure limit: 0.60200E+15 0.00000E+00 0.30000E+04 H2 Enhanced by 2.000E+00 O2 Enhanced by 6.000E+00 H2O Enhanced by 6.000E+00 CO Enhanced by 1.500E+00 CO2 Enhanced by 3.500E+00 AR Enhanced by 5.000E-01 53. O2+CO<=>O+CO2 2.50E+12 0.0 47800.0 54. CO+OH<=>CO2+H 4.76E+07 1.2 70.0 55. HO2+CO<=>OH+CO2 4.76E+13 0.0 23600.0
NOTE: A unit - mole-cm-sec-K, E unit - cal/mole
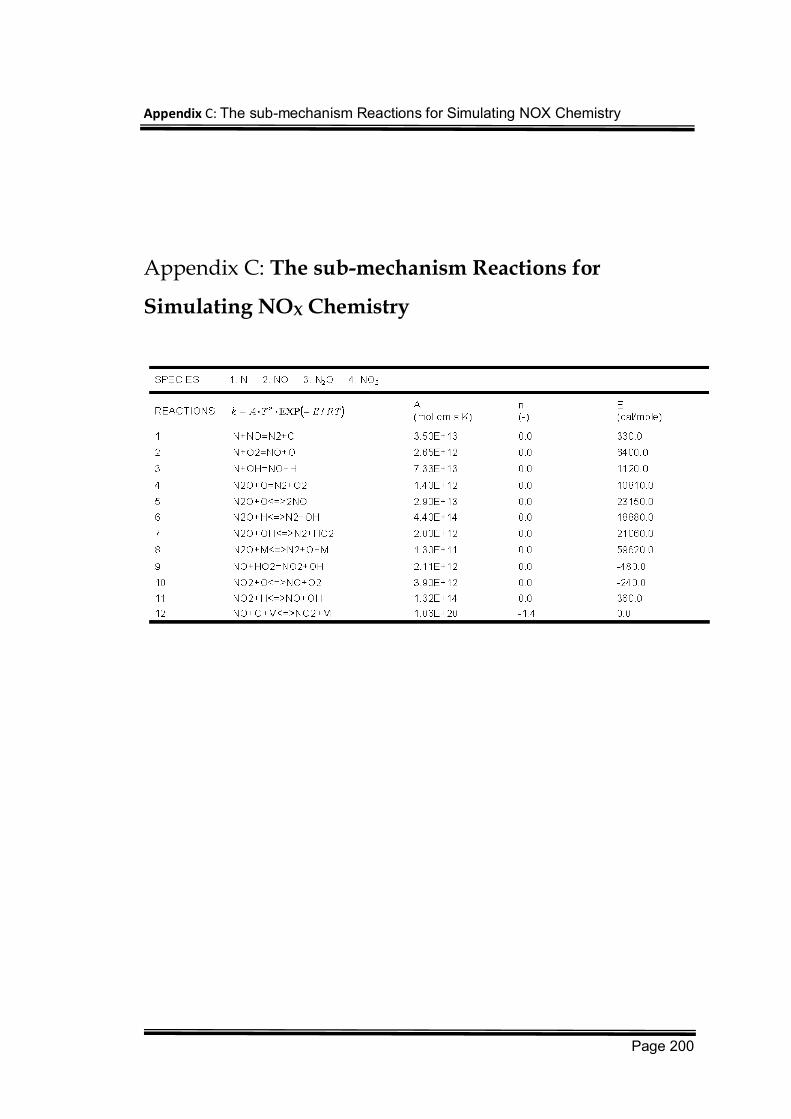
Appendix C: The sub-mechanism Reactions for Simulating NOX Chemistry
Page 200
Appendix C: The sub-mechanism Reactions for
Simulating NOX Chemistry
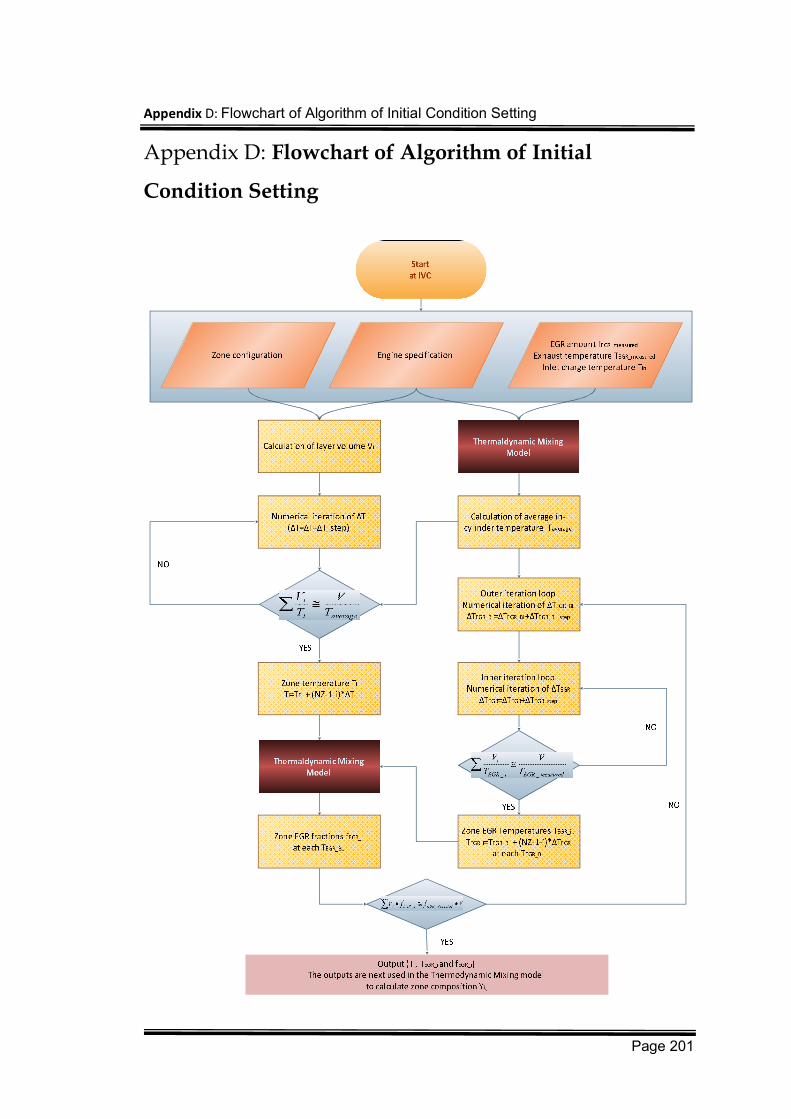
Appendix D: Flowchart of Algorithm of Initial Condition Setting
Page 201
Appendix D: Flowchart of Algorithm of Initial
Condition Setting
Bibliography
Page 202
Bibliography
[1] Heywood,J.B., ''Internal Combustion Engine Fundamentals''. McGraw-Hill International Editions. 1988.
[2] ''Engine Detonation or Knock''. Available at: http://www.thor-racing.co.uk/Detonation_or_Knock-36.asp. Accessed on: 06/04, 2009.
[3] Gatowski,J.A., Heywood,J.B. and Deleplace,C., ''Flame photographs in a spark-ignition engine''. Combustion and Flame. Vol. 56. Issue: 1. 1984. pp: 71-81.
[4] Kalghatgi,G.T., ''Early flame development in a spark-ignition engine''. Combustion and Flame. Vol. 60. Issue: 3. 1985. pp: 299-308.
[5] Aoyama,T., Hattori,Y., Mizuta,J. and Sato,Y., ''An Experimental Study on Premixed-Charge Compression Ignition Gasoline Engine''. Society of Automotive Engineers. SAE 960081. 1996.
[6] Zheng,J., ''A study of homogeneous ignition and combustion processes in CI, SI, and HCCI engine systems''. Degree Type: PhD, Philadelphia, Pa. USA. Drexel University. 2005.
[7] Gerty,M.D., ''Effects of operating conditions, compression ratio, and gasoline reformate on SI engine knock limits''. USA. Massachusetts Institute of Technology. 2005.
[8] Revier,B.M., ''Phenomena that determine knock onset in spark-ignited engines''. Massachusetts Institute of Technology. 2006.
[9] Ferguson,C.R., ''Internal combustion engines: applied thermosciences''. New York ; Chichester. Wiley. 1986.
[10] Cernansky,N.P., Green,R.M., Pitz,W.J. and Westbrook,C.K., ''Chemistry of Oxidation Preceding End-Gas Auto-ignition''. Combustion Science and Technology. Vol. 50. 1986. pp: 3-25.
[11] Green,R.M., Cernansky,N.P., Pitz,W.J. and Westbrook,C.K., ''The Role of Low Temperature Chemistry in the Auto-Ignition of n-Butane''. Society of Automotive Engineers. SAE 872109. 1987. pp: 575-591.
Bibliography
Page 203
[12] Westbrook,C.K., ''Chemical Kinetics of Hydrocarbon Ignition in Practical Combustion Systems''. July 30 - August 4. 2000. 28th International Symposium Combustion, Edinburgh, Scotland.
[13] Pan,J. and Sheppard,C.G., ''A Theoretical and Experimental Study of the Modes of End Gas Autoignition Leading to Knock in S.I. Engines''. Society of Automotive Engineers. SAE942060. 1994.
[14] Sheppard,C.G. and Konig,G., ''End Gas Autoignition and Knock in a Spark Ignition Engine''. Society of Automotive Engineers. SAE 902135. 1990.
[15] Hajireza,S., Mauss,F. and Sundén,B., ''Hot-spot autoignition in spark ignition engines''. Symp.Int.Combust. Vol. 28. Issue: 1. 2000. pp: 1169-1175.
[16] Griffiths,J.F., Jiao,Q., Schreiber,M., Meyer,J. and Knoche,K.F., ''Development of thermokinetic models for autoignition in a CFD code: Experimental validation and application of the results to rapid compression studies''. 24th Symposium (International) On Combustion: The Combustion Institute. 1992.
[17] Schreiber,M., Sadat,S.A., Poppe,C., Griffiths,J.F., Halford-Maw,P. and Rose,D.J., ''Spatial Structure in End-Gas Autoignition''. Society of Automotive Engineers. SAE 932758. 1993.
[18] Kawahara,N., Tomita,E. and Sakata,Y., ''Auto-ignited kernels during knocking combustion in a spark-ignition engine''. Proceedings of the Combustion Institute. Vol. 31. Issue: 2. 2007. pp: 2999-3006.
[19] Christensen,M., Bradley,D., Gu,X.J. and Emerson,D.R., ''Amplified Pressure Waves During Autoignition: Relevance to Cai Engines''. Society of Automotive Engineers. SAE 2002-01-2868. 2002.
[20] Pan,J., Sheppard,C.G.W., Tindall,A., Berzins,M., Pennington,S.V. and Ware,J.M., ''End Gas Inhomogeneity, Autoignition and Knock''. Society of Automotive Engineers. SAE 982616. 1998.
[21] Zeldovich,Y.B., ''Regime classification of an exothermic reaction with nonuniform initial conditions''. Combust.Flame. Vol. 39. 2. 1980. pp: 211-214.
[22] Leppard,W.R., ''The Auto-Ignition Chemistry of Iso-Butane: A Motored Engine Study''. Society of Automotive Engineers. SAE 881606. 1988. pp: 658-680.
[23] Leppard,W.R., ''The Auto-Ignition Chemistry of Primary Reference Fuels, Olefin/Paraffin Binary Mixtures, and Non-Linear Octane Blending''. Society of Automotive Engineers. SAE 922325. 1992. pp: 1683-1705.
[24] Li,H., ''Auto-Ignition Chemistry Studies of Primary Reference Fuels and Their Mixtures with Oxygenates in a Research Engine''. Degree Type: Ph.D. Thesis, Drexel University. 1995.
[25] Oran,E.S. and Boris,J.P., ''Numerical approaches to combustion modeling''. First Edition. Washington, DC. USA. American Institute of Aeronautics and Astronautics.
Bibliography
Page 204
1991.
[26] Dryer,F.L., The Phenomenology of Modelling Combustion Chemistry. New York Fossil Fuel Combustion-A Source Book - (Bartok, W and Sarofim, A.F. eds.), Wiley Inter-Science. 1991. pp: 121-213.
[27] Gong,X.H., ''The Effects of DTBP on the Oxidation of SI Primary Reference Fuels - A Study in an HCCI Engine and in a Pressurized Flow Reactor ''. Degree Type: Ph.D. Thesis, Drexel University. 2005.
[28] Walker,R.W. and Morley,C., Chapter 1 Basic chemistry of combustion. In: M.J. Pilling, editor. '' Comprehensive Chemical Kinetics''. Elsevier. 1997. pp: 1-124.
[29] Smith,J.R., Green,R.M., Westbrook,C.K. and Pitz,W.J., ''Experimental and Modelling Studies of Engine Knock''. Proceedings of Combustion Institute. Vol. 20. 1984. pp: 91-100.
[30] Minetti,R., Carlier,M., Ribaucour,M., Therssen,E. and Sochet,L.R., ''A rapid compression machine investigation of oxidation and auto-ignition of n-Heptane: Measurements and modeling''. Combust.Flame. Vol. 102. Issue: 3. 1995. pp: 298-309.
[31] By,A., Kempinski,B. and Rife,J.M., ''Knock in Spark Ignition Engines''. Society of Automotive Engineers. SAE 810147. 1981.
[32] Douaud,A.M. and Eyzat,P., ''Four-Octane-Number Method for Predicting the Anti-Knock Behavior of Fuels and Engines''. Society of Automotive Engineers. SAE 780080. 1978.
[33] Warnatz,J., Mass U. and Dibble R.W., , ''Combustion''. Third Edition. Springer Verlag. 2001. pp:299.
[34] Westbrook,C.K. and Dryer,F.L., ''Chemical kinetic modeling of hydrocarbon combustion''. Progress in Energy and Combustion Science. Vol. 10. Issue: 1. 1984. pp: 1-57.
[35] Curry,S., ''A Three-Dimensional Study of Flame Propagation in a SparkIgnition Engine''. Vol. 71. SAE Transaction. 1963. pp: 628.
[36] Wheeler,R.W., Abnormal Combustion Effects on Economy. Plenum Press, J.C Hilliard and G.S. Springer Edition. 1984. pp: 225-276.
[37] Howard,F.A. and Wood,L.A., ''The Birth of an Industry''. New York. D. van Nostrand Company, Inc., 1947.
[38] Hamilton,B. ''What fuel property does the Octane Rating measure?''. 2009. Available at: http://stason.org/TULARC/vehicles/gasoline-faq/index.html. Accessed on: 06/04, 2009.
[39] Perdih,A. and Perdih,F., ''Chemical Interpretation of Octane Number''. Vol. 53. Acta Chimica Slovenica. 2006. pp: 306-315.
Bibliography
Page 205
[40] Puzinauskas,P.V., ''Examination of Methods Used to Characterize Engine Knock''. Society of Automotive Engineers. SAE 920808. 1992.
[41] Brecq,G., Ramesh,a., Tazerout,M. and Le Corre,O., ''An Experimental Study of Knock in a Natural Gas-Fuelled Spark Ignition Engine''. Society of Automotive Engineers. SAE 2001-01-3562. 2001.
[42] Karim,G.A., ''A Dimensionless Criterion for Predicting the Onset of Knock in Spark Ignition Engines''. Society of Automotive Engineers. SAE 2004-01-1992. 2004.
[43] U.S. Department of Energy. ''Homogeneous Charge Compression Ignition (HCCI) Technology. A Report to the U.S. Congress''. April 2001.
[44] Thring,R.H., ''Homogeneous-Charge Compression-Ignition (HCCI) Engines''. Society of Automotive Engineers. SAE 892068. 1989.
[45] Onishi,S., Jo,S.H., Shoda,K., Jo,P.D. and Kato,S., ''Active Thermo-Atmosphere Combustion (ATAC) - A New Combustion Process for Internal Combustion Engines''. Society of Automotive Engineers. SAE 790501. 1979. pp: 1851-1860.
[46] Najt,P.M. and Foster,D.E., ''Compression-Ignited Homogeneous Charge Combustion''. Society of Automotive Engineers. SAE 830264. 1983. pp: 1.964-1.979.
[47] Iida,N., ''Alternative Fuels and Homogeneous Charge Compression Ignition Combustion Technology''. Society of Automotive Engineers. SAE 972071/JSAE 9734043. 1997. pp: 5-14.
[48] Oguma,H., Ichikura,T. and lida,N., ''A Study on Adaptability of Alternative Fuels for Lean Burn Two-Stroke ATAC Engine''. Society of Automotive Engineers. SAE 972097/JSAE 9734304. 1997. pp: 173-180.
[49] Hultqvist,A., Christensen,M., Johansson,B., Franke,A., Richter,M. and Alden,M., ''A Study of the Homogeneous Charge Compression Ignition Combustion Process by Chemiluminescence Imaging''. Society of Automotive Engineers. SAE 1999-01-3680. 1999.
[50] Richter,M., Franke,A., Alden,M., Hultqvist,A. and Johansson,B., ''Optical Diagnostics Applied to a Naturally Aspirated Homogeneous Charge Compression Ignition Engine''. Society of Automotive Engineers. SAE 1999-01-3649. 1999.
[51] Hultqvist,A., Christensen,M., Johansson,B., Richter,M., Nygren,J., Hult,J. and Alden,M., ''The HCCI Combustion Process in a Single Cycle – Speed Fuel Tracer LIF and Chemiluminescence Imaging''. Society of Automotive Engineers. SAE 2002-01-0424. 2002.
[52] Ogink,R. and Golovitchev,V., ''Gasoline HCCI Modelling: An Engine Cycle Simulation Code with a Multi-Zone Combustion Model''. Society of Automotive Engineers. SAE 2002-01-1745. 2002.
[53] Aceves,S.M., Flowers,D.L., Westbrook,C.K., Smith,J.R., Pitz,W., Dibble,R., Christensen,M. and Johansson,B., ''A Multi-Zone Model for Prediction of HCCI
Bibliography
Page 206
Combustion and Emissions''. Society of Automotive Engineers. SAE 2000-01-0327. 2000.
[54] Aceves,S., Flowers,D., Martinez,J., Espinosa,F. and Dibble,R., ''Homogeneous Charge Compression Ignition (HCCI) R&D''. August 28. 2002. DEER Meeting.
[55] Kelly-Zion,P.L. and Dec,J.E., ''A computational study of the effect of fuel type on ignition time in homogenous charge compression ignition engines''. Symposium (International) on Combustion. Vol. 28. Issue: 1. 2000. pp: 1187-1194.
[56] Christensen,M., Johansson,B. and Einewall,P., ''Homogeneous Charge Compression Ignition (HCCI) Using Isooctane, Ethanol and Natural Gas - A Comparison with Spark Ignition Operation''. Society of Automotive Engineers. SAE 972874. 1997.
[57] Kontarakis,G. and Collings,N., ''Demonstration of HCCI Using a Single Cylinder Four-stroke SI Engine with Modified Valve Timing''. Society of Automotive Engineers. SAE 2000-01-2870. 2000.
[58] Oakley,A., Zhao,H. and Ladommatos,M., T., ''Dilution Effects on the Controlled Auto-Ignition (CAI) Combustion of Hydrocarbon and Alcohol Fuels''. Society of Automotive Engineers. SAE 2001-01-3606. 2001.
[59] Ryan III,T.W. and Callahan,T.J., ''Homogeneous Charge Compression Ignition of Diesel Fuel''. Society of Automotive Engineers. SAE 961160. 1996. pp: 157-166.
[60] Gray III,A.W. and Ryan III,T.W., ''Homogeneous Charge Compression Ignition (HCCI) of Diesel Fuel''. Society of Automotive Engineers. SAE 971676. 1997.
[61] Fiveland,S.B., Agama,R., Christensen,M., Johansson,B., Hiltner,J., Mauss,F. and Assanis,D.N., ''Experimental and Simulated Results Detailing the Sensitivity of Natural Gas HCCI Engines to Fuel Composition''. Society of Automotive Engineers. SAE 2001-01-3609. 2001.
[62] Chen,Z., Konno,M., OGUMA,m. and yANAI,t., ''Experimental Study of CI Natural Gas/DME Homogeneous Charge Engine''. Society of Automotive Engineers. SAE 2000-01-0329. 2000.
[63] Morimoto,S.S., Kawabata,Y., Sakurai,T. and Amano,T., ''Operating Characteristics of a Natural Gas-Fired Homogeneous Charge Compression Ignition Engine (Performance Improvement Using EGR)''. Society of Automotive Engineers. SAE 2001-01-1034. 2001.
[64] Satot,S., Yamasakit,Y., Kawamura,H. and lidatl,N., ''Research on the Influence on Natural Gas HCCI Combustion of Hydrogen and Carbon Monoxide''. Proceedings of the sixth international symposium on diagnostics and modelling of combustion in internal combustion engines; COMODIA 2004, August 2-5, Yokohama, Japan August 10. : COMODIA. 2004. The Sixth International Symposium on Diagnostics and Modeling of Combustion in Internal Combustion Engines.
[65] Aceves,S.M., Flowers,D.L., Martinez-Frias,J., Smith,J.R., Westbrook,C.K.,
Bibliography
Page 207
Pitz,W.J., Dibble,R., Wright,J.F., Akinyemi,W.C. and Hessel,R.P., ''A Sequential Fluid-Mechanic Chemical-Kinetic Model of Propane HCCI Combustion''. Society of Automotive Engineers. SAE 2001-01-1027. 2001.
[66] Flowers,D., Aceves,S., Smith,R., Torres,J., Girard,J. and Dibble,R., ''HCCI in a CFR Engine: Experiments and Detailed Kinetic Modelling''. Society of Automotive Engineers. SAE 2000-01-0328. 2000.
[67] Flowers,D., Aceves,S.M., Martinez-Frias,J., Smith,J.R., Au,M., Girard,J. and Dibble,R., ''Operation of a Four-Cylinder 1.9L Propane Fuelled Homogeneous Charge Compression Ignition Engine: Basic Operating Characteristics and Cylinder-to-Cylinder Effects''. Society of Automotive Engineers. SAE 2001-01-1895. 2001.
[68] Christensen,M., Hultqvist,A. and Johansson,B., ''Demonstrating the Multi-Fuel Capability of a Homogeneous Charge Compression Ignition Engine with Variable Compression Ratio''. Society of Automotive Engineers. SAE 1999-01-3679. 1999.
[69] Christensen,M. and Johansson,B., ''Homogeneous Charge Compression Ignition with Water Injection''. Society of Automotive Engineers. SAE 1999-01-0182. 1999.
[70] Olsson,J.O., Tunestal,P., Haraldsson,G. and Johansson,B., ''A Turbo Charged Dual Fuel HCCI Engine''. Society of Automotive Engineers. SAE 2001-01-1896. 2001.
[71] Christensen,M. and Johansson,B., ''Supercharged Homogeneous Charge Compression Ignition (HCCI) with Exhaust Gas Recirculation and Pilot Fuel''. Society of Automotive Engineers. SAE 2000-01-1835. 2000.
[72] Stanglmaier,R.H., Ryan III,T.W. and Souder,J.S., ''HCCI Operation of a Dual-Fuel Natural Gas Engine for Improved Fuel Efficiency and Ultra-Low NOx Emissions at Low to Moderate Engine Loads''. Society of Automotive Engineers. SAE 2001-01-1897. 2001.
[73] Blank,D.A., Pouring,A.A. and Lu,J., ''Methanol Combustion in Low Compression Ratio D.I. Engines Enabled by Sonex Piston Design''. Society of Automotive Engineers. SAE 2001-01-1197. 2001.
[74] Hultqvist,A., Engdar,U., Johansson,B. and Klingmann,J., ''Reacting Boundary Layers in a Homogeneous Charge Compression Ignition (HCCI) Engine''. Society of Automotive Engineers. SAE 2001-01-1032. 2001.
[75] Kaimai,T., Tsunemoto,H. and Ishitani,H., ''Effects of a Hybrid Fuel System with Diesel and Premixed DME/Methane Charge on Exhaust Emissions in a Small DI Diesel Engine''. Society of Automotive Engineers. SAE 1999-01-1509. 1999.
[76] Lida,N. and Igarashi,T., ''Auto-Ignition and Combustion of n Butane and DME/Air Mixtures in a Homogeneous Charge Compression Ignition Engine''. Society of Automotive Engineers. SAE 2000-01-1832. 2000.
[77] Ogawa,H., Miyamoto,N., Kaneko,N. and Ando,H., ''Combustion Control and Operating Range Expansion With Direct Injection of Reaction Suppressors in a
Bibliography
Page 208
Premixed DME HCCI Engine''. Society of Automotive Engineers. SAE 2003-01-0746. 2003.
[78] Lida,N., ''Combustion Analysis of Methanol-Fuelled Active Thermo-Atmosphere Combustion (ATAC) Engine Using a Spectroscopic Observation''. Society of Automotive Engineers. SAE 940684. 1994.
[79] Ishibashi,Y. and Asai,M., ''Improving the Exhaust Emissions of Two-Stroke Engines by Applying the Activated Radical Combustion''. Society of Automotive Engineers. SAE 960742. 1996. pp: 113-123.
[80] Suzuki,H., Koike,N., Ishii,H. and Odaka,M., ''Exhaust Purification of Diesel Engines by Homogeneous Charge with Compression Ignition Part 1: Experimental Investigation of Combustion and Exhaust Emission Behaviour Under Pre-Mixed Homogeneous Charge Compression Ignition Method''. Society of Automotive Engineers. SAE 970313. 1997.
[81] Christensen,M. and Johansson,B., ''Influence of Mixture Quality on Homogeneous Charge Compression Ignition''. Society of Automotive Engineers. SAE 9824541. 1998.
[82] Milovanovic,N., ''A study of controlled autoignition (CAI) combustion in internal combustion engines''. Degree Type: PhD, Loughborough University. 2003.
[83] Bisetti,F., Chen,J., Hawkes,E.R. and Chen,J.H., ''Probability density function treatment of turbulence/chemistry interactions during the ignition of a temperature-stratified mixture for application to HCCI engine modeling''. Combust.Flame. Vol. 155. Issue: 4. 2008. pp: 571-584.
[84] Harada,A., Shimazaki,N., Sasaki,S., Miyamoto,T., Akagawa,H. and Tsujimura,K., ''The Effects of Mixture Formation on Premixed Lean Diesel Combustion Engine''. Society of Automotive Engineers. SAE 980533. 1998.
[85] Noguchi,M., Tanaka,Y., Tanaka,T. and Takeuchi,Y., ''Study on Gasoline Engine Combustion by Observation of Intermediate Reactive Products during Combustion''. Society of Automotive Engineers. SAE 790840.
[86] Sharke P. ''Otto or Not, Here it Comes''.Mechanical Engineers . June 2000;Vol: 122. pp: 62-69.
[87] Zur Loye AO, Akinyemi OC, Durrett RP, Flynn PF, Hunter GL, Moore GA, et al, inventors. AnonymousPremixed Charge Compression Ignition Engine with Optimal Combustion Control . 6286482. 3 June 2004 .
[88] Law,D., Kemp,D., Allen,J., Kirkpatrick,G. and Copland,T., ''Controlled combustion in an IC-engine with a fully variable valve train''. Society of Automotive Engineers. SAE 2001-01-0251. 2001.
[89] Milovanovic,N., Chen,R. and Turner,J., ''Influence of variable valve timings on the gas exchange process in a controlled auto-ignition engine''. Professional Engineering Publishing. Proceedings of the Institution of Mechanical Engineers --
Bibliography
Page 209
Part D -- Journal of Automobile Engineering. Vol. 218. Issue: 5. 2004. pp: 567-583.
[90] Law,D., Kemp,D., Allen,J., Kirkpatrick,G. and Copland,T., ''Controlled Combustion in an IC Engine with a Fully Variable Valve Train''. Society of Automotive Engineers. SAE 2000-01-0251. 2000.
[91] Allen,J. and Law,D., ''Variable Valve Actuated Controlled Auto-Ignition: Speed Load Maps and Strategic Regimes of Operation''. Society of Automotive Engineers. SAE 2002-01-0422. 2002.
[92] Mahrous,A.M., Potrzebowski,A., Wyszynski,M.L., Xu,H.M., Tsolakis,A. and Luszcz,P., ''A modelling study into the effects of variable valve timing on the gas exchange process and performance of a 4-valve DI homogeneous charge compression ignition (HCCI) engine''. Energy Conversion and Management. Vol. 50. Issue: 2. 2009. pp: 393-398.
[93] Lavy,J., Dabadie,J.C., Angelberger,C., Duret,P., Willand,J., Juretzka,A., Schaflein,J., Ma,T., Lendresse,Y., Satre,A., Schulz,C., Kramer,H., Zhao,H. and Damiano,L., ''Innovative Ultra-low NOx Controlled Auto-Ignition Combustion Process for Gasoline Engines: The 4-SPACE Project''. Society of Automotive Engineers. SAE 2000-01-1837. 2001.
[94] Shaver,G.M., Roelle,M.J. and Christian Gerdes,J., ''Modeling cycle-to-cycle dynamics and mode transition in HCCI engines with variable valve actuation''. Control Eng.Pract. Vol. 14. Issue: 3. 2006. pp: 213-222.
[95] Ohyama,Y., ''Simultaneous Control of Air/fuel Ratio and Intake, Exhaust Valve Timing for HCCI Operation''. Society of Automotive Engineers. SAE 2003-01-1084. 2003.
[96] Hyvönen,J., Haraldsson,G. and Johansson,B., ''Supercharging HCCI to Extend the Operating Range in a Multi-Cylinder VCR-HCCI Engine''. Society of Automotive Engineers. SAE 2003-01-3214. 2003.
[97] Canakci,M., ''An experimental study for the effects of boost pressure on the performance and exhaust emissions of a DI-HCCI gasoline engine''. Fuel. Vol. 87. Issue: 8-9. 2008. pp: 1503-1514.
[98] Richter,M., Engstrom,J., Franke,A., Alden,M., Hultqvist,A. and Johansson,B., ''The Influence of Charge Inhomogeneity on the HCCI Combustion Process''. Society of Automotive Engineers. SAE 2000-01-2868. 2000.
[99] ''Fuel mixture stratification as a method for improving homogeneous charge compression ignition engine operation''. Available at: http://www.patentstorm.us/patents/7128046/fulltext.html. Accessed on: 03/02, 2009.
[100] Zheng,Z. and Yao,M., ''Charge stratification to control HCCI: Experiments and CFD modeling with n-heptane as fuel''. Fuel. Vol. 88. Issue: 2. 2009. pp: 354-365.
[101] Berntsson,A.W. and Denbratt,I., ''HCCI Combustion Using Charge Stratification for Combustion Control''. SAE Paper 2007-01-0210. 2007.
Bibliography
Page 210
[102] Mase,Y., Kawashima,J., Sato,T. and Eguchi,M., ''Nissan’s New Multivalve DI Diesel Engine Series''. Society of Automotive Engineers. SAE 981039. 1998.
[103] Su,H., Vikhansky,A., Mosbach,S., Kraft,M., Bhave,A., Kim,K., Kobayashi,T. and Mauss,F., ''A computational study of an HCCI engine with direct injection during gas exchange''. Combust.Flame. Vol. 147. Issue:1-2. 2006. pp: 118-132.
[104] Standing,R., Kalian,N., Ma,T., Zhao,H. and Wirth,M., ''Effects of Injection Timing and Valve Timings on CAI Operation in a Multi-Cylinder DI Gasoline Engine''. Society of Automotive Engineers. SAE 2005-01-0132. 2005.
[105] Leach,B., Zhao,H., Li,Y. and Ma,T., ''Control of CAI Combustion Through Injection Timing in a GDI Engine With an Air- Assisted Injector''. Society of Automotive Engineers. SAE 2005-01-0134. 2005.
[106] Hasegawa,R. and Yanagihara,H., ''HCCI Combustion in DI Diesel Engine''. Society of Automotive Engineers. SAE 2003-01-0745. 2003.
[107] Tao,F., Liu,Y., RempelEwert,B.H., Foster,D., Reitz,R.D., Choi,D. and Miles,P.C., ''Modelling the Effects of EGR and Injection Pressure on Soot Formation in a High-Speed Direct-Injection (HSDI) Diesel Engine Using a Multi-Step Phenomenological Soot Model''. Society of Automotive Engineers. SAE 2005-01-0121. 2005.
[108] Ra,Y. and Reitz,R.D., ''The Use of Variable Geometry Sprays With Low Pressure Injection for Optimization of Diesel HCCI Engine Combustion''. 2005-01-0148. 2005.
[109] Nishijima,Y., Asaumi,Y. and Aoyagi,Y., ''Impingement spray system with direct water injection for premixed lean diesel combustion control''. Society of Automotive Engineers. SAE 2002-01-0109. 2002.
[110] Su,W., Wang,H. and Liu,B., ''Injection Mode Modulation for HCCI Diesel Combustion''. Society of Automotive Engineers. SAE 2005-01-0117. 2005.
[111] Koopmans,L. and Denbratt,I., ''A Four Stroke Camless Engine, Operated in Homogeneous Charge Compression Ignition Mode with Commercial Gasoline''. Society of Automotive Engineers. SAE 2001-01-3610. 2001.
[112] Chen,R., Milovanovic,N., Turner,J. and Blundell,D., ''The Thermal Effect of Internal Exhaust Gas Recirculation on Controlled Auto Ignition''. Society of Automotive Engineers. SAE 2003-01-0751. 2003.
[113] Christensen,M., Johansson,B., Amneus,P. and Mauss,F., ''Supercharged Homogeneous Charge Compression Ignition''. Society of Automotive Engineers. SAE 980787. 1998. pp: 1-16.
[114] Dec,J.E., ''A Computational Study of the Effects of Low Fuel Loading and EGR on Heat Release Rates and Combustion Limits in HCCI Engines''. Society of Automotive Engineers. SAE 2002-01-1309. 2002.
Bibliography
Page 211
[115] Chen,R. and Milovanovic,N., ''A computational study into the effect of exhaust gas recycling on homogeneous charge compression ignition combustion in internal combustion engines fuelled with methane''. Elsevier. International Journal of Thermal Sciences 41. 11 October 2002. pp: 805-813.
[116] Aroonsrisopon,T., Hayashi,M., Foster,D. and Martin,J., ''The Effect of Intake Air Temperature, Compression Ratio and Coolant Temperature on the Start of Heat Release in an HCCI (Homogeneous Charge Compression Ignition) Engine''. Society of Automotive Engineers. SAE 2001-01-1880. 2001.
[117] Fiveland,S.B. and Assanis,D.N., ''A Four-Stroke Homogeneous Charge Compression Ignition Engine Simulation for Combustion and Performance Studies''. Society of Automotive Engineers. SAE 2000-01-0332. 2000.
[118] Peng,Z., Zhao,H. and Ladommatos,N., ''Effects of Air/Fuel Ratios and EGR Rates on HCCI Combustion of n-Heptane, a Diesel Type Fuel''. Society of Automotive Engineers. SAE 2003-01-0747. 2003.
[119] Amano,T., Morimoto,S. and Kawabata,Y., ''Modelling of the Effect of Air/Fuel Ratio and Temperature Distribution on HCCI Engines''. Society of Automotive Engineers. SAE 2001-01-1024. 2001.
[120] Milovanovic,N., Blundell,D., Pearson,R. and Turner,J.;.C., R., ''Enlarging the Operational Range of a Gasoline HCCI Engine By Controlling the Coolant Temperature''. Society of Automotive Engineers. SAE 2005-01-0157. 2005.
[121] Lü,X., Chen,W. and Huang,Z., ''A fundamental study on the control of the HCCI combustion and emissions by fuel design concept combined with controllable EGR. Part 2. Effect of operating conditions and EGR on HCCI combustion''. Fuel. Vol. 84. Issue: 9. 2005. pp: 1084-1092.
[122] Aceves,S.M., Flowers,D., Martinez-Frias,J., Espinosa-Loza,F., Fitz,W.J. and Dibble,R., ''Fuel and Additive Characterization for HCCI Combustion''. Society of Automotive Engineers. SAE 2003-01-1814. 2003.
[123] Tanaka,S., Ayala,F., Keck,J.C. and Heywood,J.B., ''Two-stage ignition in HCCI combustion and HCCI control by fuels and additives''. Combust.Flame. Vol. 132. 1-2. 2003. pp: 219-239.
[124] Agarwal,A. and Assanis,D.N., ''Multi-Dimensional Modelling of Natural Gas Ignition Under Compression Ignition Conditions Using Detailed Chemistry''. Society of Automotive Engineers. SAE 980136. 1998.
[125] Yarnaya,Y., Furutani,M. and Ohta,Y., ''Advanced/Retarded Criterion on Ignition of Fuel/Air Mixtures with Formaldehyde Doping''. Proceedings of the sixth international symposium on diagnostics and modelling of combustion in internal combustion engines; COMODIA 2004, August 2-5, Yokohama, Japan August 2 - 5. : COMODIA. 2004. 6th International Symposium on Diagnostics and Modeling of Combustion in Internal Combustion Engines.
[126] Flowers,D.L., Aceves,S.M., Westbrook,C.K., Smith,J.R. and and Dibble,R.W.,
Bibliography
Page 212
''Sensitivity of Natural Gas HCCI Combustion to Fuel and Operating Parameters Using Detailed Kinetic Modeling''. : American Society of Mechanical Engineers. 1999. Proceedings of the ASME Advanced Energy Systems Division, Edited by Aceves, S.M.; Garimella, S.; and Peterson, R.
[127] Zheng,J., Yang,W., Miller,D.L. and Cernansky,N.P., ''A Skeletal Chemical Kinetic Model for the HCCI Combustion Process''. Society of Automotive Engineers. SAE 2002-01-0423. 2002.
[128] Zhao,H., Peng,Z., Williams,J. and Ladommatos,N., ''Understanding the Effects of Recycled Burnt Gases on the Controlled Auto-ignition (CAI) Combustion in Four-Stroke Gasoline Engines''. Society of Automotive Engineers. SAE 2001-01-3607. 2001.
[129] Woschni,G., ''A Universally Applicable Equation for the Instantaneous Heat Transfer Coefficient in the Internal Combustion Engine''. Society of Automotive Engineers. SAE 670931. 1967. pp: 3065-3083.
[130] Flowers,D., Aceves,S., Martinez-Frias,J., Hessel,R. and Dibble,R., ''Effect of Mixing on Hydrocarbon and Carbon Monoxide Emissions Prediction for Isooctane HCCI Engine Combustion Using a Multi-zone Detailed Kinetics Solver''. Society of Automotive Engineers. SAE 2003-01-1821/JSAE 20030127. 2003.
[131] Komninos,N.P., Hountalas,D.T. and Kouremenos,D.A., ''Development of a New Multi-Zone Model for the Description of Physical Processes in Hcci Engines''. Society of Automotive Engineers. SAE 2004-01-0562. 2004.
[132] Fiveland,S.B. and Assanis,D.N., ''Development of a Two-Zone HCCI Combustion Model Accounting for Boundary Layer Effects''. Society of Automotive Engineers. SAE 2001-01-1028. 2001.
[133] Easley,W.L., Agarwal,A. and Lavoie,G.A., ''Modelling of HCCI Combustion and Emissions Using Detailed Chemistry''. Society of Automotive Engineers. SAE 2001-01-1029. 2001.
[134] Komninos,N.P., Hountalas,D.T. and Kouremenos,D.A., ''Description of In-Cylinder Combustion Processes in HCCI Engines Using a Multi-Zone Model''. Society of Automotive Engineers. SAE 2005-01-0171. 2005.
[135] Komninos,N.P. and Hountalas,D.T., ''Improvement and validation of a multi-zone model for HCCI engine combustion concerning performance and emissions''. Energy Conversion and Management,. Vol. 49. Issue: 10. 2008. pp: 2530-2537.
[136] Orlandini,I., Kulzer,A., Weberbauer,F. and Rauscher,M., ''Simulation of Self Ignition in HCCI and Partial HCCI Engines Using a Reduced Order Model''. Society of Automotive Engineers. SAE 2005-01-0159. 2005.
[137] Aceves,S.M., Martinez-Frias,J., Flowers,D.L., Smith,J.R., Dibble,R.W., Wright,J.F. and Hessel,R.P., ''A Decoupled Model of Detailed Fluid Mechanics Followed by Detailed Chemical Kinetics for Prediction of Iso-Octane HCCI Combustion''. Society of Automotive Engineers. SAE 2001-01-3612. 2001.
Bibliography
Page 213
[138] Kongsereeparp,P. and Checkel,M.D., ''Novel Method of Setting Initial Conditions for Multi-Zone HCCI Combustion Modeling ''. Society of Automotive Engineers. SAE 2007-01-0674. 2007.
[139] Li,G., Bo,T., Chen,C. and Johns,R.J.R., ''CFD Simulation of HCCI Combustion in a 2-Stroke DI Gasoline Engine''. Society of Automotive Engineers. SAE 2003-01-1855. 2003.
[140] Kong,S.C. and Reitz,R.D., ''Multidimensional Modeling of Diesel Ignition and Combustion Using a Multistep Kinetics Model''. Journal of Engineering for Gas Turbine and Power, ASME Transactions. Vol. 115. 1993. pp: 781-789.
[141] Ali,A., Cazzoli,G., Kong,S.C. and Reitz,R.D., ''Improvement in Computational Efficiency for HCCI Engine Modeling by Using Reduced Mechanisms and Parallel Computing''. 2003. Central State Section Meeting.
[142] Aceves,S., Martinez-Frias,J., Flowers,D., Smith,J.R., Dibble,R. and Chen,J.Y., ''A Computer Generated Reduced Iso Octane Chemical Kinetic Mechanism Applied to Simulation of HCCI Combustion''. Society of Automotive Engineers. SAE 2002-01-2870. 2002.
[143] Iwashiro,Y., Tsurushima,T., Nishijima,Y., Asaumi,Y. and Aoyagi,Y., ''Fuel Consumption Improvement and Operation Range Expansion in HCCI by Direct Water Injection''. Society of Automotive Engineers. SAE 2002-01-0105. 2002.
[144] lida,S., Kusaka,J. and Daisho,Y., ''Numerical Study on Iso-Octane Homogeneous Charge Compression Ignition''. Society of Automotive Engineers. SAE 2003-01-1820. 2003. pp: 1-6.
[145] Kusaka,J. and Daisho,Y., ''Multi-Dimensional Modelling Combined with a Detailed Kinetics (Application for HCCI of Natural Gas)''. July 1-4. : COMODIA. 2001. The Fifth International Symposium on Diagnostics and Modelling of Combustion in Internal Combustion Engines.
[146] Ogink,R., ''Computer Modeling of HCCI Combustion''. Division of Thermo and Fluid Dynamics, CHALMERS UNIVERSITY OF TECHNOLOGY. 2004.
[147] ''Reaction Mechanism - elementary process '' 2000. Available at: http://www.science.uwaterloo.ca/~cchieh/cact/c123/elmntary.html. Accessed on: 19/05, 2009.
[148] Laidler,K.J., ''Chemical Kinetics''. Third Edition. UK. Benjamin-Cummings. 1997.
[149] Borman,G.L. and Ragland K.W., ''Combustion engineering''. First. New York. McGraw-Hill. 1998.
[150] Ophardt,C.E. ''What is Gasoline?’’ 2003. Available at: http://www.elmhurst.edu/~chm/vchembook/514gasoline.html. Accessed on:06/26, 2006.
Bibliography
Page 214
[151] Violi,A., Yan,S., Eddings,E.G., Sarofim,A.F., Granata,S., Faravelli,T. and Ranzi,E., ''EXPERIMENTAL FORMULATION AND KINETIC MODEL FOR JP-8 SURROGATE MIXTURES''. Taylor & Francis. Combustion Sci.Technol. Vol. 174. Issue: 11. 2002. pp: 399.
[152] Lenhert DB, Khan AR, Cernansky NP, Miller DL, Owens KG. ''The Oxidation of an Isf Surrogate and Its Components in the Negative Temperature Coefficient Region''. 2003;Volume: RIC Engines III.
[153] Eng,J.A., Leppard,W.R. and Sloane,T.M., ''The Effect of Di-Tertiary Butyl Peroxide (DTBP) Addition to Gasoline on HCCI Combustion''. Society of Automotive Engineers. SAE 2003-01-3170. 2003.
[154] Tanaka,S., Ayala,F. and Keck,J.C., ''A reduced chemical kinetic model for HCCI combustion of primary reference fuels in a rapid compression machine''. Combustion and Flame. Vol. 133. 2003. pp: 467-481.
[155] Yelvington,P.E. and Green,W.E., ''Prediction of the Knock Limit and Viable Operating Range for a Homogeneous-Charge Compression-Ignition (HCCI) Engine''. Society of Automotive Engineers. SAE 2003-01-1092. 2003.
[156] Steacie,E.W.R., , ''Atomic and Free Radical Reactions''. 2nd Edition. Reinhold, New York. 1954.
[157] Robertson,S.H., Seakins,P.W. and Pilling,M.J., Chapter 2 Elementary reactions. In: M.J. Pilling, editor. '' Comprehensive Chemical Kinetics''. Elsevier. 1997. pp: 125-234.
[158] Ranzi,E., Gaffuri,P., Faravelli,T. and Dagaut,P., ''A wide-range modeling study of n-heptane oxidation''. Combust.Flame. Vol. 103. Issue: 1-2. 1995. pp: 91-106.
[159] Curran,H.J., Gaffuri,P., Pitz,W.J. and Westbrook,C.K., ''A Comprehensive Modeling Study of n-Heptane Oxidation''. Combust.Flame. Vol. 114. Issue: 1-2. 1998. pp: 149-177.
[160] Cox,R.A. and Cole,J.A., ''Chemical Aspects of the Autoignition of Hydrocarbon-Air Mixtures''. Combustion and Flame. Vol. 60. 1985. pp: 109-123.
[161] Westbrook,C.K., Pitz,W.J., Boercker,J.E., Curran,H.J., Griffiths,J.F., Mohamed,C. and Ribaucour,M., ''Detailed chemical kinetic reaction mechanisms for autoignition of isomers of heptane under rapid compression''. Proceedings of the Combustion Institute. Vol. 29. Issue: 1. 2002. pp: 1311-1318.
[162] Bozzelli, J.W. and Sheng, C., ’’Thermochemistry, Reaction Paths, and Kinetics on the Hydroperoxy-Ethyl Radical Reaction with O2: New Chain Branching Reactions in Hydrocarbon Oxidation’’, The Journal of Physical Chemistry A 2002 106 (7), 1113-1121
[163] Westbrook,C., Warnatz,J. and Pitz,W., ''A Detailed Chemical Kinetic Reaction Mechanism for the Oxidation of Iso-Octane and n-Heptane over an Extended Temperature Range and its Application to Analysis of Engine Knock''. 22th
Bibliography
Page 215
Symposium (International) on Combustion: The Combustion Institute. 1988. 22th Symposium (International) on Combustion.
[164] Amneus,P., Nilsson,D., Mauss,F., Christensen,M. and Johansson,B., ''Homogeneous Charge Compression Ignition Engine: Experiments and Detailed Kinetic Calculations''. : COMODIA. 1998. The fourth International Symposium COMODIA.
[165] Dagaut,P., Reuillon,M. and Cathonnet,M., ''High Pressure Oxidation of Liquid Fuels From Low to High Temperature. 1. n-Heptane and iso-Octane.''. Taylor & Francis. Combustion Sci.Technol. Vol. 95. Issue: 1. 1994. pp: 233.
[166] Pitz,W.J., Westbrook,C.K. and Leppard,W.R., ''Auto-Ignition Chemistry of n-Butane in a Motored Engine: A Comparison of Experimental and Modelling Results''. Society of Automotive Engineers. SAE 881605. 1988. pp: 648-657.
[167] Curran,H.J., Gaffuri,P., Pitz,W.J. and Westbrook,C.K., ''A comprehensive modeling study of iso-octane oxidation''. Combust.Flame. Vol. 129. Issue: 3. 2002. pp: 253-280.
[168] Yamasaki,Y. and Lida,N., ''Numerical Analysis of Auto Ignition and Combustion of n-Butane and Air Mixture in the Homogeneous Charge Compression Ignition Engine by Using Elementary Reactions''. Society of Automotive Engineers. SAE 2003-01-1090. 2003. pp: 1-12.
[169] Yamasaki,Y. and Lida,N., ''Numerical Simulation of Auto-Ignition and Combustion of n-Butane and Air Mixtures in a 4 Stroke HCCI Engine by Using Elementary Reactions''. Society of Automotive Engineers. SAE 2000-01-1834. 2000. pp: 1-14.
[170] Westbrook,C.K., Pitz,W.J., Thornton,M.M. and Malte,P.C., ''A kinetic modeling study of n-pentane oxidation in a well-stirred reactor''. Combust.Flame. Vol. 72. Issue:1. 1988. pp: 45-62.
[171] Agosta,A., Cernansky,N.P., Miller,D.L., Faravelli,T. and Ranzi,E., ''Reference Components of Jet Fuel: Kinetic Modeling and Experimental Results''. Exp. Therm. Fluid. Sci. Vol. 28. 2004. pp: 701-708.
[172] Wang,H. and Frenklach,M., ''Detailed reduction of reaction mechanisms for flame modeling''. Combust.Flame. Vol. 87. Issue: 3-4. 1991. pp: 365-370.
[173] Halstead,M.P., Kirsch,L.J. and Quinn,C.P., ''The Autoignition of Hydrocarbon Fuels at High Temperatures and Pressures-Fitting of a Mathematical Model''. Combustion and Flame. Vol. 30. 1977. pp: 45-60.
[174] Halstead,M.P., Kirsch,L.J., Prothero,A. and Quinn,C.P., ''A Mathematical Model for Hydrocarbon Autoignition At High Pressures''. Proceedings of the Royal Society of London. Vol. A.346. 1975. pp: 515-538.
[175] Griffiths,J.F., ''Reduced Kinetic Models and Their Application to Practical Combustion Systems Progress in Energy and Combustion Science''. Progress in
Bibliography
Page 216
Energy and Combustion Science. Vol. 21. 1995. pp: 25-107.
[176] Hu,H. and Keck,J., ''Autoignition of Adiabatically Compressed Combustible Gas Mixtures''. Society of Automotive Engineers. SAE 872110. 1987.
[177] Li,H., Miller,D.L. and Cernansky,N.P., ''A Study on the Application of a Reduced Chemical Reaction Model to Motored Engines for Heat Release Prediction''. Society of Automotive Engineers. SAE 922328. 1992.
[178] Li,H., Miller,D.L. and Cernansky,N.P., ''Development of a Reduced Chemical Kinetic Model For Prediction of Preignition Reactivity and Autoignition of Primary Reference Fuels''. Society of Automotive Engineers. SAE 960498. 1996.
[179] Zheng,J., Yang,W., Miller,D.L. and Cernansky,N.P., ''Prediction of Pre-ignition Reactivity and Ignition Delay for HCCI Using a Reduced Chemical Kinetic Model''. Society of Automotive Engineers. SAE 2001-01-1025. 2001.
[180] Müller,C.U., Peters,N. and Liňán,A., ''Global Kinetics for n-Heptane Ignition at High Pressures''. Proceedings of the Combustion Institute. Vol. 24. 1992. pp: 777-784.
[181] Annand,W.J.D., ''Heat transfer in the cylinder of reciprocating internal combustion engines''. Proceedings of the IMechE, Part D: Journal of Automobile Engineering. Vol. 177. 1963. pp: 973-990.
[182] Petzold,L.R., , ''Computer Methods for Ordinary Differential Equations and Differential-Algebraic Equations''. SIAM: Society for Industrial and Applied Mathematics. 1998.
[183] Press,W., Flannery B., Teukolsky S. and Vetterling W., ''Numerical Recipes in C : The Art of Scientific Computing''. Cambridge University Press. 1992.
[184] Gear,C.W., ''Numerical Initial Value Problems in Ordinary Differential Equations''. Upper Saddle River, NJ, USA. Prentice Hall PTR. 1971.
[185] Brown,P.N., Byrne,G.D. and Hindmarsh,A.C., ''VODE: A Variable-Coefficient ODE Solver''. SIAM. SIAM J.Sci.and Stat.Comput. Vol. 10. Issue: 5. 1989. pp: 1038-1051.
[186] John Prentice. ''Fortran 90 for Science Students''. 1995. Available at: http://www.lahey.com/PRENTICE.HTM. Accessed on: 09/09, 2009.
[187] Kee RJ, Rupley FM, Meeks E. ''CHEMKIN-III: A FORTRAN CHEMICAL KINETICS PACKAGE FOR THE ANALYSIS OF GAS-PHASE CHEMICAL AND PLASMA KINETICS''. 1996;Volume: SAND96-8216.
[188] Kee RJ, Rupley FM, Meeks E, Miller JA. ''CHEMKIN-III: A Fortran Chemical Kinetics Package For The Analysis of Gas-Phase Chemical and Plasma Kinetics''. May 1996;
[189] Brown,P.N. and Hindmarsh,A.C. ''Variable-coefficient Ordinary Differential
Bibliography
Page 217
Equation solver (VODE) FORTRAN code''. Available at: http://www.netlib.org/ode/vode.f. Accessed on: 09/01, 2009.
[190] Zheng,J., Miller,D.L. and Cernansky,N.P., ''A Global Reaction Model for the HCCI Combustion Process''. Society of Automotive Engineers. SAE 2004-01-2950. 2004.
[191] Kaario,O., Larmi,M. and Tanner,F., ''Comparing single-step and multi-step chemistry using the laminar and turbulent characteristic time combustion model in two diesel engines''. Society of Automotive Engineers. SAE 2002-01-1749. 2002.
[192] Liu,J., Gong,J. and Cai,L., ''Multi-dimensional simulation of air=fuel premixing and stratified combustion in a gasoline direct injection engine with combustion chamber bowl offset''. Society of Automotive Engineers. SAE 2006-32-0006. 2006.
[193] Blunsdon,C.A. and and Dent,J.C., ''The Simulation of Autoignition and Knock in a Spark Ignition Engine with Disk Geometry''. Society of Automotive Engineers. SAE 940524. 1994.
[194] Eckert,P., Kong,S.C. and Reitz,R.D., ''Modeling Autoignition and Engine Knock Under Spark Ignition Conditions''. Society of Automotive Engineers. SAE 2003-01-0011. 2003.
[195] Kong,S.C., Han,Z. and Reitz,R.D., ''The Development and Application of a Diesel Ignition and Combustion Model for Multidimensional Engine Simulation''. Society of Automotive Engineers. SAE 950278. 1995.
[196] Ferguson,C.R. and Kirkpatrick A.T., , ''Internal combustion engines : applied thermosciences''. 2nd. New York ; Chichester. Wiley. 2001.
[197] Najt,P.M., ''Evaluating threshold knock with a semi-empirical model-initial results''. Society of Automotive Engineers. SAE 872149. 1987.
[198] Moses,E., Yarin,A.L. and Bar-Yoseph,P., ''On knocking prediction in spark ignition engines''. Combust.Flame. Vol. 101. Issue: 3. 1995. pp: 239-261.
[199] Noda,T. and Kazuya,H., ''Development of transient knock prediction technique by using a zero-dimensional knocking simulation with chemical kinetics''. Society of Automotive Engineers. SAE 2004-01-0618. 2004.
[200] Hajireza,S., Mauss,F. and Sunden,B.A., ''Investigation of end-gas temperature and pressure increases in gasoline engines and relevance for knock occurrence''. Society of Automotive Engineers. SAE 971671. 1997.
[201] Hajireza,S., Sunden,B. and Mauss,F., ''A Three-Zone Model for Investigation of Gas Behaviour in the Combustion Chamber of SI Engines in Relation to Knock''. Society of Automotive Engineers. SAE 1999-01-0219. 1999.
[202] Gordon S, McBride BJ. ''Computer Program for Calculation of Complex Chemical Equilibrium Compositions and Applications I. Analysis''. 1994; Vol. E-8017.
Bibliography
Page 218
[203] Li,H., Prabhu,S.K., Miller,D.L. and Cernansky,N.P., ''Auto-Ignition Chemistry Studies on Primary Reference Fuels in a Motored Engine''. Society of Automotive Engineers. SAE 942062. 1994.
[204] Callahan,C.V., Curran,H.J., Dryer,F.L., Pitz,W.J. and Westbrook,C.K., ''Oxidation of automotive primary reference fuels at elevated pressures''. Conference: Twenty-Seventh International Conference on Combustion Mar 01. : Boulder, Co. 1999.
[205] Reynolds WC. ''The element potential method for chemical equilibrium analysis: Implementation in the interactive program STANJAN-III''. 1986.
[206] Arrigoni,V. and Cornetti,G.M., ''High speed knock in SI engines''. Society of Automotive Engineers. SAE 741056. 1974.
[207] Swarts,A., Yates,A. and Viljoen,C., ''Standard knock intensity revisited: Atypical burn rate characteristics identified in the CFR octane rating engine''. Society of Automotive Engineers. SAE 2004-01-1850. 2004.
[208] Takagi,Y. and Itoh,T., ''An analytical study on knocking heat release and its control in a spark ignition engine''. Society of Automotive Engineers. SAE 880196. 1988.
[209] Babajimopoulos,A., Assanis,D., Flowers,D., Aceves,S. and Hessel,R., ''A fully coupled computational fluid dynamics and multi-zone model with detailed chemical kinetics for the simulation of premixed charge compression ignition engines''. International Journal of Engine Research. Vol. 6. Issue: 5. 2005. pp: 497-512.
[210] Chang,J., Guralp,O., Filipi,Z. and Assanis,D., ''New Heat Transfer Correlation for an HCCI Engine Derived from Measurements of Instantaneous Surface Heat Flux''. Society of Automotive Engineers. SAE 2004-01-2996. 2004.
[211] Kouremenos,D., Rakopoulos,C., Hountalas,D. and Yfantis,E., ''A model Calibration and Constants Determination Procedure Based on the Elaboration of the Measured Pressure Crank Angle Diagram in a Divided Chamber Diesel Engine''. Proc. ASME-WA Meeting. Vol. 21. 1990. pp: 21-31.
[212] Kouremenos,D., Rakopoulos,C., Hountalas,D. and Yfantis,E., ''Evaluation Results of the Application of an Engine Diagnosis Simulation Model on Different Types of Diesel Engines''. 3rd Int. Conf. on Innovation and Reliability in Automotive Design and Testing. Vol. Issue: 1. 1992. pp: 615-627.
[213] Golovitchev,V. ''N-heptane Mechanism''. Available at: http://www.tfd.chalmers.se/~valeri/MECH.html. Accessed on: 11/11, 2006.
[214] Babajimopoulos,A., Assanis,D.N. and Fiveland,S.B., ''An Approach for Modelling the Effects of Gas Exchange Processes on HCCI Combustion and Its Application in Evaluating Variable Valve Timing Control Strategies''. Society of Automotive Engineers. SAE 2002-01-2829. 2002.
[215] Chen,R. and Milovanovic,N., ''A computational study into the effect of exhaust
Bibliography
Page 219
gas recycling on homogeneous charge compression ignition combustion in internal combustion engines fuelled with methane''. International Journal of Thermal Sciences. Vol. 41. Issue: 9. 2002. pp: 805-813.
[216] Van Basshuysen,R. and Schf̃er, F., ''Internal combustion engine handbook : basics, components, systems and perspectives''. Warrendale, PA. SAE International. 2004.
[217] Cheng,W., Hamrin,D., Heywood,J., Hochgreb,S., Min,K. and Norris,M., ''An Overview of Hydrocarbon Emissions Mechanisms in Spark Ignition Engine''. SAE Internaltional. 1993.
[218] Miller,J.A. and Bowman,C.T., ''Mechanism and modeling of nitrogen chemistry in combustion''. Progress in Energy and Combustion Science. Vol. 15. Issue: 4. 1989. pp: 287-338.
[219] Encyclopædia Britannica Online. . ''Working principle of four-stroke engines''. Available at: http://cache-media.britannica.com.cdnetworks.net/eb-media/72/93572-034-26C16785.jpg. Accessed on: 03/02, 2009.
[220] Encyclopædia Britannica Online. ''Working principle of two-stroke cycle engines''. Available at: http://cache-media.britannica.com.cdnetworks.net/eb-media/10/310-004-58E43DBF.gif. Accessed on: 03/02, 2009.
[221] Nobuyuki,K., Eiji,T., Yoshitomo,S., ‘’Auto-ignited kernels during knocking combustion in a spark-ignition engine’’. Proceedings of the Combustion Institute, Vol. 31, Issue 2, January 2007, pp: 2999-3006,
[222] Woshni,G., and Fieger,J., ‘’Experimental investigation of the heat transfer at normal and knocking combustion in Spark Ignition engines’’. MTZ. vol.43, pp.63-67, 1982.